Author Archives: author

Ultrahigh-Pressure and -Temperature Mineral Inclusions in More Crustal Mineralizations: The Role of Supercritical Fluids

DOI: 10.31038/GEMS.2023543

Abstract

Supercritical fluids or melts create an essential connection between the lower mantle and upper crust. Examples demonstrate these interactions.

Examples

Sensitized by the finding of stishovite and coesite as inclusions in the Waldheim granulite in Saxony, the author found, in cooperation with his coauthors [1,2] in evolved granites and related tin-mineralizations, a couple of ultrahigh-pressure and -temperature minerals, like diamond, moissanite, stishovite, coesite, and cristobalite-XI [3]. These minerals are mostly spherical crystals with a very smooth surface. They are, as a rule, minerals entirely out of place. That means these trapped crystals have no equilibrium faces. Thomas and coauthors have interpreted these in growing crystals trapped phases as transported via fast-rising supercritical melt or fluid from the Earth’s mantle region into the crust, here granites and related mineralizations [1-3]. The crystallization velocity of the host must be very high to prevent equilibrium forms of the trapped spheres.

A careful study of the beryl-quartz veins related to the cassiterite mineralization revealed that the ordinarily tetragonal cassiterite contains a high portion of orthorhombic cassiterite [4,5]. There are isometric crystals of orthorhombic cassiterite in muscovite, water-pure topaz, or more significant remnants (cores) of orthorhombic cassiterite in the tetragonal cassiterite crystals. Also, this topaz, as well as the orthorhombic cassiterite, are of high-pressure and high-temperature origin. Supported is this statement by sub-spherical inclusion in the OH-rich topaz composed of carbonic material (graphite, moissanite, and nanodiamond), as well as spherical kumdykolite crystals [NaAlSi3O8] with carbonic material. Kumdykolite is the orthorhombic polymorph of albite formed at high temperatures followed by rapid cooling [6].

The next surprise was the finding of moissanite whiskers with nanodiamonds grown in beryl and quartz in a small hydrothermal beryl-quartz vein in the Sauberg mine of the Ehrenfriedersdorf tin district of the Erzgebirge, Germany [7]. Here the crystallization of the whiskers happens directly at the place of vein crystallization at about 720°C and pressures ≤2 kbar. Thomas [4,5] tried an explanation for this remarkable beryl-quartz-moissanite-nanodiamond paragenesis by a natural supercritical vapor-liquid-solid (VLS) mechanism and a low-pressure heteroepitaxial chemical vapor deposition process (CVD). In each case, the crystallization of moissanite at such low PT conditions is unusual and should be a challenge for further experimental studies. Supercritical phases like spherical beryl-II-moissanite intergrowing in these parageneses’ quartz show the supercritical phases’ participation in this crystallization process.

Another important point for further sophisticated studies in relationship to the unusual mineral inclusions is the chemical and physical character of the supercritical phases. Thomas [8] shows a new type of fluid inclusion that probably transported stishovite (and other mineral phases) from the lower mantle to the crust. Methane (CH4) and water are miscible at ultrahigh pressure and temperature. The transport properties of such fluid and the solubility for different elements are of particular interest because, in the crustal region, we observe a lot of extreme element enrichments in relationship to the melt-water solvus [1,2,9,10]. If we look at the whole story, we see a continuous evolution of the system of thought. Conventional physicochemical processes cannot explain this Gaussian or Lorentzian element enrichment in melt inclusions related to such solvus curves. Further studies are necessary to illuminate these complex processes in more detail.

References

  1. Thomas R, Davidson P, Rericha A, Recknagel U (2022) Discovery of stishovite in the prismatine-bearing granulite from Waldheim, Germany: A possible role of supercritical fluids of ultrahigh-pressure origin. Geosciences 12 : 1-13.
  2. Thomas R, Davidson P, Rericha A, Voznyak DK (2022) Water-Rich Melt Inclusion as “frozen” samples of the supercritical state in granites and pegmatites reveal extreme element enrichment resulting under non-equilibrium conditions. Mineralogical Journal (Ukraine), 44 : 3-15.
  3. Thomas R, Davidson P, Rericha A, Recknagel U (2023) Ultrahigh-pressure mineral inclusions in a crustal granite: Evidence for a novel transcrustal transport mechanism. Geosciences 13 : 1-13.
  4. Thomas R (2023a) Unusual cassiterite mineralization, related to the Variscan tin-mineralization of the Ehrenfriedersdorf deposit, Germany. Aspects in Mining & Mineral Science 11 : 1233-1236.
  5. Thomas R, Recknagel U, Rericha A (2023a) A moissanite-diamond-graphite paragenesis in a small beryl-quartz vein related to the Variscan tin-mineralization of the Ehrenfriedersdorf deposit, Germany (under review).
  6. Hwang SLS, Chu HTY, Sobolev NV (2010) Kumdykolite, an orthorhombic polymorph of albite, from the Kokchetav ultrahigh-pressure massif, Kazakhstan. European Journal of Mineralogy 21 : 1325-1334.
  7. Thomas R (2023b) Growth of SiC whiskers in beryl by a natural supercritical VLS process. Aspects in Mining & Mineral Science 11 : 1292-1297.
  8. Thomas R (2023c) A new fluid inclusion type in the hydrothermal-grown beryl. Geology, Earth and Marine Sciences (GEMS) accepted.
  9. Thomas R, Webster JD, Heinrich W (1999) Melt inclusions in pegmatite quartz: Complete miscibility between silicate melts and hydrous fluids. ECROFI Abstracts, Terra Nostra 99/6, 305-307.
  10. Thomas R, Davidson P, Appel, K. (2019) The enhanced element enrichment in the supercritical states of granite-pegmatite systems. Acta Geochim. 38 : 335-349.

A New Fluid Inclusion Type in Hydrothermal-Grown Beryl

DOI: 10.31038/GEMS.2023542

Abstract

The formation of a new fluid inclusion type in beryl is shown. Primarily the inclusion was composed of water-rich stishovite, which was transported from the lower mantle into the upper crust crystallization level via a supercritical fluid or melt. After trapping and phase change, the primary homogeneous inclusion split due to drastic density changes into two parts by the high beryl solubility under such conditions.

Keywords

New inclusion type, Beryl, Supercritical fluid, Stishovite, Cristobalite, Raman spectroscopy

Method

All microscopic and Raman spectrometric studies are performed with a petrographic polarization microscope with a rotating stage coupled with the RamMics R532 Raman spectrometer working in the spectral range of 0-4000 cm-1 using a 50 mW single mode 532nm laser. Details are given in Thomas et al. 2022 [1,2]. Note here that the low-frequency portion of the Raman spectrum is, according to Tuschel (2019) [3], the most efficacious for characterizing, differentiating, and screening polymorphs (here SiC) by Raman spectroscopy. Furthermore, the polarization/orientation (P/O) micro-Raman spectroscopy is complementary to micro-X-ray diffraction. According to Tuschel (2012) [4], this method should be used when X-ray analysis is not practical or possible (micro-needles and mineral globules depth in the sample volume).

Sample

The beryl-quartz sample material comes from the Sauberg mine near Ehrenfriedersdorf in the Erzgebirge region/Germany. Details are given in Thomas (2023) [5]. Noteworthy is that the synchronously grown moissanite whiskers in beryl characterize the beryl-quartz paragenesis.

Results

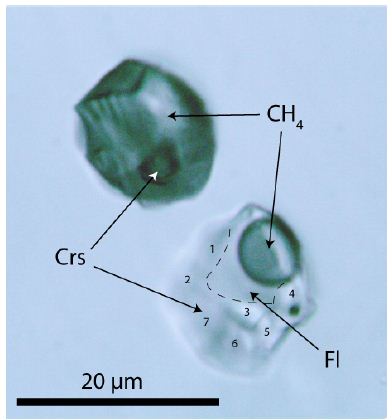
During the study of moissanite [SiC] whiskers simultaneously grown in a small beryl-quartz vein related to the Variscan tin deposit, Ehrenfriedersdorf/Erzgebirge, Germany, the author Thomas [5] found a new fluid inclusion type in beryl formed by a necking-of process [6]. That means both inclusions shown in Figure 1 formed from a primarily homogeneous phase, probably stishovite, trapped during the crystal growth of beryl. The density of both minerals, stishovite and cristobalite, is 4.35 vs. 2.20 g/cm3, respectively [7]. It is well known that stishovite formed at the lower crust would never be preserved over geological time at low pressure and temperature [8]. From earlier studies, Thomas and Klemm, 1997 [9] and Thomas et al. 2022 [1,2] follow a trapping temperature of 720°C at a pressure of ≤2 kbar. During cooling, the initially homogeneous inclusion separated itself into two parts by strong density contrast as a result of cooling. The upper inclusion consists of pure methane with a small cristobalite (Crs) crystal, and the lower inclusion is composed of about 65% cristobalite, 17.4% CH4, and 17.6% H2O. The solubility of beryl is at or near supercritical conditions extremely high [1,2].

FIG 1

Figure 1: Two supercritical inclusions in beryl (Brl). CH4 – methane, Fl – aqueous liquids phase. Cristobalite (Crs) in both inclusions gives in the Raman spectrum strong lines at 112.6, 229.8. 418.6, and 1072.1 cm-1, respectively. The numbers 1 to 7 in the lower inclusions show the points at which cristobalite was determined with Raman spectrometry.

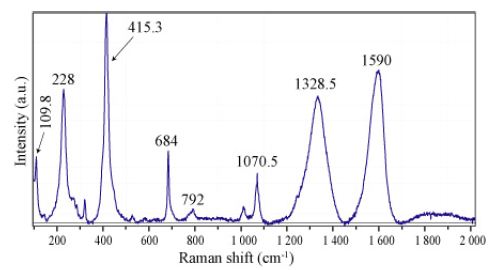
The vapor phase consists exclusively of methane (CH4), and cristobalite (Crs) forms the solid phase of both inclusions. Cristobalite in the methane inclusion is stable under laser light and is metastable in the water-bearing fluid inclusion (creating quartz). With the used Raman spectrometer, in no case hydrogen using the pure rotational lines S0 (354.8 cm-1), S1 (587.4 cm-1), S2 (815.0 cm-1), and S3 (1024.9 cm-1) could be determined – see Petrov et al. 2018 [10]. Also, CO2 could not be determined. The fluid phase is almost pure water. Alkali carbonates are missing. The cristobalite was primarily water-rich stishovite or coesite, giving the supercritical fluid a minimum pressure of 7 GPa. However, if we accept the water content in the lower inclusion primary solved in the primary stishovite, according to Lin et al. (2022) [11], a pressure of about 30 GPa or more is possible (see also Thomas et al. 2022) [1,2]. Figure 2 shows a Raman spectrum of the cristobalite in the CH4-rich inclusion of Figure 1.

FIG 2

Figure 2: Raman spectrum of cristobalite, nanodiamond, and carbon in the CH4-rich inclusion of Figure 1. The Raman bands at 109.8, 228, 414.3,792, and 1070.5 cm-1 correspond to cristobalite. The 1328.5 and 1590 cm-1 bands correspond to nanodiamonds and carbon, respectively.

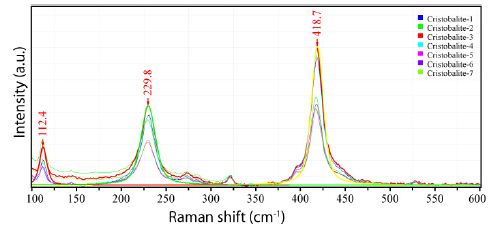
The strong and stable nanodiamond band at 1328 cm-1 and the strong carbon band at 1590 cm-1 are conspicuous and demonstrate that at the origin of the supercritical fluid, its pressure is significantly higher than the pressure at the place of beryl crystallization. Figure 3 shows the Raman spectra of cristobalite (points 1-7) in the lower inclusion part. Here both bands corresponding to nanodiamond and carbon are entirely missing.

FIG 3

Figure 3: Raman spectra of the cristobalite at different measuring points 1-7 in Figure 1

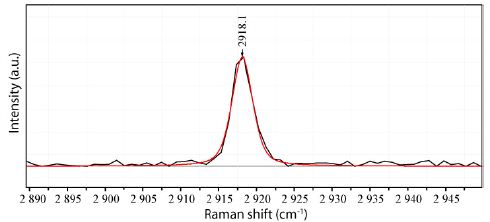
Figure 4 shows the Raman band of pure methane in both inclusion parts. According to Vitkin et al. (2020) [12], methane is 12CH4 rich. Pruteanu et al. (2017) [13] have shown that methane and water are entirely miscible at high pressure and temperature. This condensed state at high pressure and temperature and at least the phase separation at lower PT-data dramatically influence the properties of the supercritical fluid or melt.

FIG 4

Figure 4: Both inclusion parts’ Raman methane spectrum (CH4)

Conclusion

The here-described supercritical fluid inclusion in beryl is a new type resulting from the interaction of a beryllium-bearing supercritical melt or fluid with the already present Variscan tin mineralization. The solubility of Be as bromelite [BeO] in a supercritical melt or fluid at temperatures higher than 700°C is extreme, as Thomas and Davidson (2010) [14] and Thomas et al. (2022) [1,2] demonstrated. The extreme physicochemical conditions (at a highly activated state) during the beryl crystallization from a supercritical melt or solution favored the simultaneous crystallization of moissanite [SiC] with beryl [5]. The formation of the new inclusion type shows different scenarios for the origin of beryl and simultaneously grown moissanite: ultrahigh-pressure and high-temperature conditions (1000°C and ~30 GPa) generated in the lower mantle region and low-pressure and low-temperature conditions in the upper crust (720°C, ≤2 kbar). Furthermore, the short study shows that supercritical fluids or melts are highly complex in composition and change permanently on the path between the lower mantle and upper crust. Therefore many reactions are far away from any equilibrium. Further studies are necessary to illuminate these complex processes in more detail. One point is essential: which mechanism is responsible for the extreme enrichment of, for example, beryllium? Are near beryl’s crystallization at supercritical conditions a quantum physical entanglement of Be atoms?

References

  1. Thomas R, Davidson P, Rericha A, Recknagel U (2022) Discovery of stishovite in the prismatine-bearing granulite from Waldheim, Germany: A possible role of supercritical fluids of ultrahigh-pressure origin. Geosciences 12: 1-13.
  2. Thomas R, Davidson P, Rericha A, Voznyak DK (2022) Water-rich melt inclusions as “frozen” samples of the supercritical state in granites and pegmatites reveal extreme element enrichment resulting under non-equilibrium conditions. Min. J. (Ukraine), 44, 3-15.
  3. Tuschel D (2019) Raman spectroscopy and polymorphism. Spectroscopy 34: 10-21.
  4. Tuschel D (2012) Raman crystallography, in theorie and in practice. Spectroscopy 27: 2-6.
  5. Thomas R (2023) Growth of SiC whiskers in Beryl by a natural supercritical VLS process. Aspects in Mining & Mineral Science 11: 1292-1297.
  6. Roedder E (1984) Fluid inclusions. Reviews in mineralogy. In: Ribbe PH (ed): Mineralogical Society of America 12: 644.
  7. Frondel C (1962) The System of Mineralogy. John Wiley and Sons, INC, New York and London, Vol. III Silicate Minerals, 7th Edition, 334 p.
  8. Hemley RJ, Prewitt CT, Kingma KJ (1994) High-pressure behavior of silica. Reviews in mineralogy 29: 41-81.
  9. Thomas R, Klemm W (1997) Microthermometric study of silicate melt inclusion in Variscan granites from SE Germany: Volatile contents and entrapment conditions. Journal of Petrology 38: 1753-1765.
  10. Petrov DV, Matrosov II, Sedinkin DO, Zaripov AR (2018) Raman spectra of nitrogen, carbon dioxide, and hydrogen in a methane environment. Optics and Spectroscopy 124: 8-12.
  11. Lin Y, Hu Q, Meng Y, Walter M, Mao HK (2020) Evidence for the stability of ultrahydros stishovite in Earth’s lower mantle. PNAS 117: 184-189. [crossref]
  12. Vitkin V, Polishchuk A, Chubchenko I, Popov E, Grigorenko K, at al. (2020) Raman laser spectrometer: Application to 12C/13C isotope identification in CH4 and CO2 greenhouse gases. Applied Sciences 10: 1-12.
  13. Pruteanu CG, Ackland GJ, Poon WCK, Loveday JS (2017) When immiscible become miscible -Methane in water at high pressures. Science Advances 3: 1-5.
  14. Thomas R, Davidson P (2010) Hambergite-rich melt inclusions in morganite crystals from the Muiane pegmatite, Mozambique and some remarks on the paragenesis of hambergite. Miner Petrol 100: 227-239.

Groundwater Potential Zone Mapping of Lower Omo- Gibe Watershed, Omo-Gibe Basin, Ethiopia

DOI: 10.31038/GEMS.2023541

Abstract

The demand and investigation of groundwater are occasionally increased by the ever-increasing population and abrupt climatic changes. Groundwater is currently the most important source of fresh water, and many researchers are attempting to cover all aspects of this resource in order to achieve sustainable development. This scientific and academic research and studies are attempting to present a multi-range of techniques and methods focusing on groundwater pollution, potentials, assessment, and prediction. To delineate groundwater potential (GWP) zones in the Lower Omo-Gibe Watershed, Omo-Gibe Basin, Ethiopia, an integrated strategy of remote sensing (RS), geographic information systems (GIS), and multi-criteria decision analysis (MCDA) using analytical hierarchical process (AHP) was used. For this purpose, seven GWP influencing thematic layers comprising lineament density, slope, soil, drainage density, landuse landcover, geology, elevation and rainfall map were used. Scale values for the classes and thematic layers within them were determined using Satty’s AHP and based on expert and literary judgment. The thematic layers have been integrated via their rates using weighted overlay spatial function tool of ArcGIS to provide GWP map. The distribution and extents of different potential groundwater zone are 158.05 km2 (21.59%), 35.92 km2 (4.91%), 214.77 km2 (29.34%), 220.59 km2 (30.13%), and 102.72 km2 (14.03%) for very good, good, moderate and fair zone respectively. The study’s conclusions can be used to develop a groundwater action plan that will effectively protect the study area’s considerable groundwater resources. With regard to the long-term availability of groundwater, this research will be very beneficial to water management.

Keywords

Lower Omo-Gibe watershed, Omo-Gibe Basin, AHP, GIS, GWP, MCDA

Introduction

Groundwater is a valuable natural resource, and finding the best locations for groundwater recharge, monitoring wells, water supplies, and groundwater quality depends on exploration and wise management of this resource [1]. Given the constantly rising demand for freshwater, groundwater is a crucial freshwater resource for maintaining daily life in urban and suburban areas [2]. The importance of studying groundwater potential zones is based on the quantity, quality, and contamination of groundwater. The main causes of the consistent rise in freshwater demand are population expansion, the need for irrigation in agriculture, and climate change [3]. Groundwater as a substitute supply of fresh water has received serious attention due to the dangers of surface water pollution, rapid climate change, and the likelihood of droughts [4]. In order to keep the ecological balance of the earth system, groundwater is an essential part of the hydrological cycle. By providing freshwater for drinking, agriculture, and industry, it maintains life [5]. Because it is less polluted than surface water sources, which are easily contaminated by human activities like industrial and agricultural operations, groundwater becomes a significant alternative supply of freshwater in areas with a semi-arid temperature and environment [6]. Groundwater potential maps are available in many nations of the world, assisting planners and decision-makers in the development, distribution, and management of groundwater resources [1]. Groundwater accounts for one-third of all freshwater abstractions globally [7]. In many regions of the world where water supplies are limited, groundwater is a crucial natural resource for any economic and social growth [8]. Groundwater supplies are a necessity for all economic activity, both internally and outside. However, a study that combines remote sensing and GIS data can offer a good platform for the converging analysis of massive amounts of data using very advanced cognitive process techniques for groundwater exploration. Nations like Ethiopia are seeing a rise in groundwater demand as a result of the nation’s fast urbanization, population growth, and economic development. In the area under examination, groundwater is the most often used resource for agriculture, animal husbandry, and the provision of drinking water. The Lower Omo-Gibe watershed groundwater potential zone mapping will have a significant impact on the sub-basin. Since the Lower Omo-Gibe watershed is the main source of the Omo River, mapping the underground water would improve the nation’s groundwater resources’ sustainable management. Because of this, the current study is interested in delineating the groundwater potential zones within the study area using remote sensing and GIS technology. Seven determining elements were taken into consideration for the study: slope, landuse landcover, Lineament density, Geology, Elevation, Soil texture, and Drainage density. In order to ensure sustainable management and growth of the resource, groundwater exploration has recently seen a rise in the usage of remote sensing and geographic information systems (GIS). With the development of technology, more scientists are employing remote sensing (RS) and geographic information systems (GIS) to evaluate a basin’s groundwater supplies [5]. Geophysical technology-based groundwater exploration methods are expensive and time-consuming [9]. Due of these problems, humans have been forced to use a variety of technologies that can help them research vast areas in a brief amount of time while using few resources. These techniques, which include remote sensing and GIS, have been applied to find groundwater potential zones. Exploring the groundwater potential zone in varied geological settings is made simple and rapid with this method [10-13] Several scholars have employed the RS and GIS procedures to designate groundwater potential zones all over the world [14-17]. Utilizing RS and GIS, groundwater resources can be found and explored. Geology, geomorphology, slope, soil type, rainfall, land use/land cover, lineament structures, and drainage criteria are all important factors [18,19]. Geospatial technologies offer quick and affordable ways to evaluate spatial data across a range of geoscience disciplines [20]. For long-term resource management, it is essential to be able to locate the groundwater potential zone. It aids policymakers, decision-makers, and planners in making sure the groundwater resource is safeguarded from influences on both quantity and quality. The analytical hierarchy process (AHP) is one of the approaches to multi-criteria decision-making that is most frequently used [11]. AHP can be used to demarcate groundwater potential zones since it is an easy, quick, dependable, and efficient procedure [12]. When it comes to creating sustainable groundwater policies in this district, planners and policymakers will find this research to be a useful resource.

Materials and Methods

Study Area

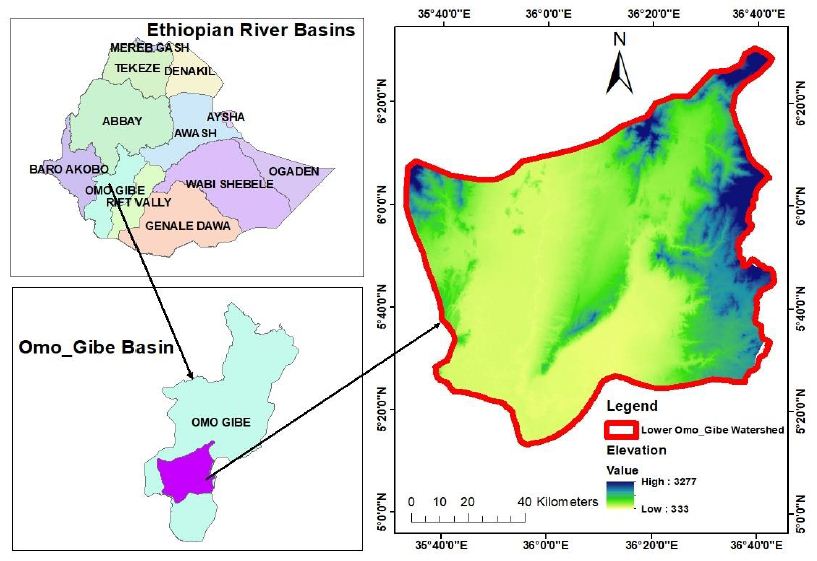
The Lower Omo-Gibe River Watershed is about 2345.5 km² in area and is situated in the Omo-Gibe Basin, south Ethiopia. Lower Omo-Gibe Watershed (Figure 1) mainly covers South nation and nationality region and south-west Ethiopia region. Mirab Omo, South Omo and Basketo Zones are included in this watershed. Woredas such as Maji, Salamago, South Ari, Jinka town, Boko Dawula, Hamera, Nyngatom, North Ari and Mele koza. It has a southern boundary that is formed by the contained river basin that empties into Kenya’s Lake Turkana. The Lower Omo-Gibe watershed plain is distinguished by the fact that, although being rather flat, it has various beach ridges and depressions. It was formed very recently by the subsequent movements of Lake Turkana. The Omo delta, in the south of the Basin and at the northern end of Lake Turkana has aggraded to such an extent in recent years only some 25 km2 of the lake is in Ethiopia.

fig 1

Figure 1: Location map of the study area

Methods and Data Analysis

The groundwater potential in this study was assessed using seven criteria including soil, lineament density, landuse landcover, slope, drainage density, rainfall, geology, For each criteria, thematic maps were created and utilized to assess the groundwater potential of the study area. In this study, the relationship between the variables that were utilized to forecast groundwater potential during weight calculation and the actual groundwater potential was analyzed.

Slope

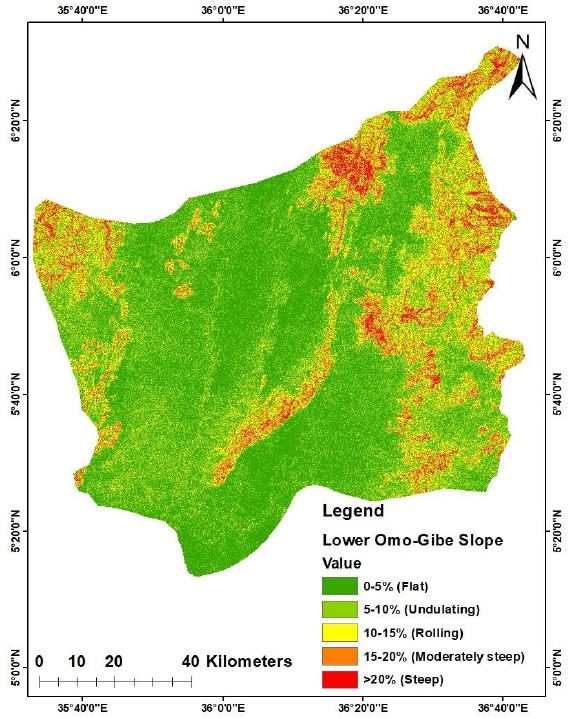
In mapping groundwater potential, slope is a key factor [21]. It determines surface runoff and vertical percolation of water; hence, it affects groundwater recharge processes [22]. Slope was inversely related to infiltration [23]. Shuttle Radar Topography Missions (SRTM) 30 m resolution digital elevation model (DEM) was used to generate slope map. The slope map was classified into five classes (Figure 2) based on FAO classification standard (Sheng, 1990).

fig 2

Figure 2: Slope map

Drainage Density

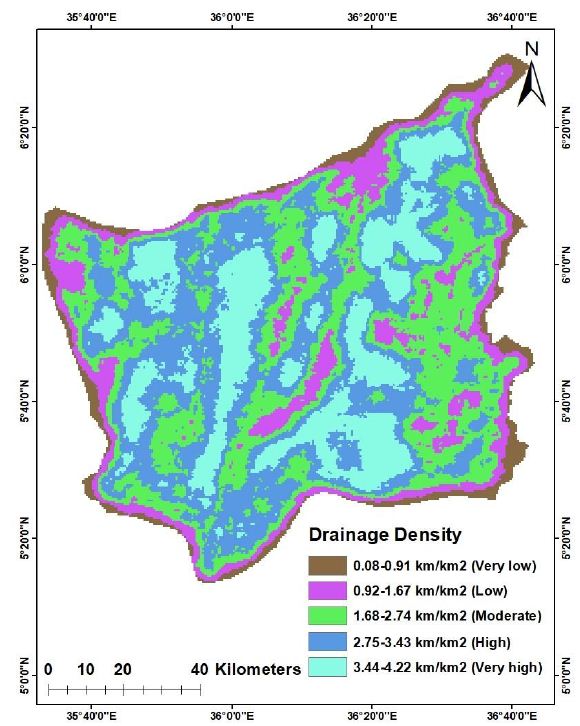
Drainage density has an impact on both the availability and pollution of groundwater. Lithology has an impact on the drainage system, which is a crucial gauge of infiltration rate. Drainage density has an inverse relationship with permeability [3]. As a result, it is a crucial component in determining the groundwater potential zone obtained from DEM data.  Finding the length of the stream and dividing on to the total area of the basin as shown in the equation of Drainage Density DD=L (length/A (area) and using Archydro program [24]. The drainage-density map (Figure 3) was created by dividing themed river maps produced from a basin-wide flow accumulation (Fac) and stream definition operation [25].

fig 3

Figure 3: Drainage density map

Geology

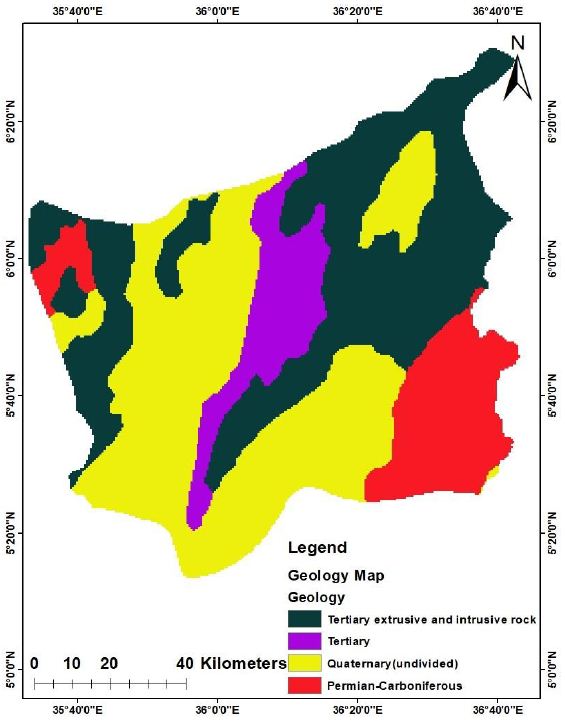
The geologic environment has a significant influence on the existence and distribution of groundwater in any terrain [26]. One of the most crucial factors in evaluating groundwater potential zones is geomorphology, which relates to an area’s landform and terrain. It gives information on how different landform traits are distributed as well as information on numerous processes, including temperature changes, geochemical reactions, water flow, freezing and thawing, and more [27]. Geologic and Geomorphological maps created by translating length and measurement into kilometers (km), digitizing with the Arc GIS spatial analyzer application, and then saving the data as shape files. The geological structures were modified to raster file format with the corresponding presentation, and the region’s geological state was assessed. The following formula was used to compute the lineament (fault) density (LL) [28]. The geology of Lower-Omo Gibe watershed (Figure 4) characterized by tertiary extrusive and intrusive rock, tertiary, quaternary and Permian-Carboniferous.

fig 4

Figure 4: Geology map

Elevation

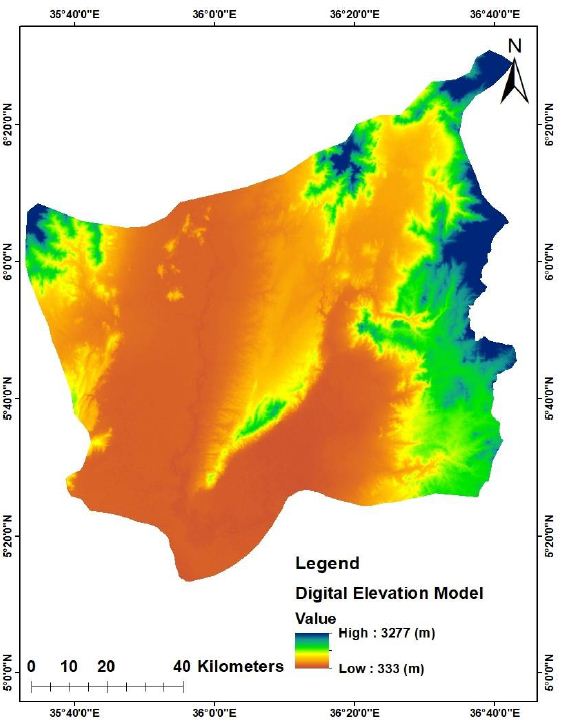
Elevation of the catchment ranges from 333 to 3277 m above sea level (Figure 5). High elevation was found in west and north edge of the study area and decrease toward east and south of the study area except topographically irregular and hilly areas. A higher weight is given for lower elevated zones and lower weight was assigned for highly elevated areas.

fig 5

Figure 5: Elevation map

Landuse Landcover

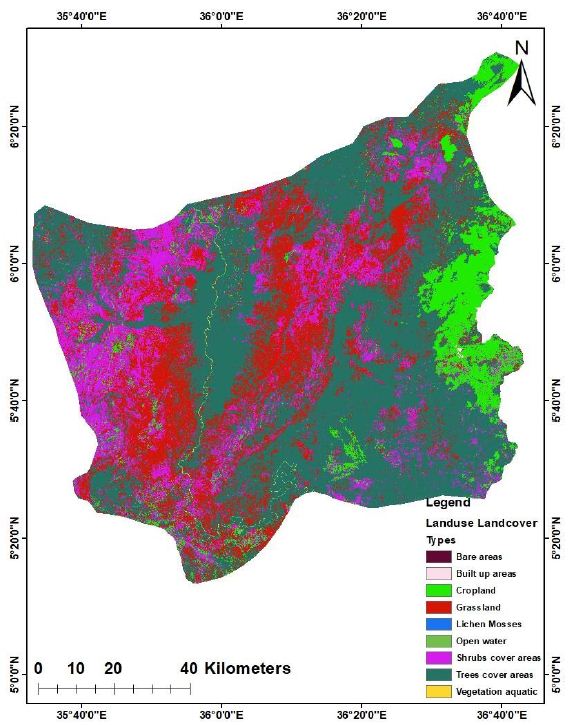
One of the key determining criteria to pinpoint areas with potential for groundwater recharge is the landuse and landcover map [29]. Landuse and landcover have an impact on hydrological processes such evapotranspiration, surface runoff, and infiltration. Areas with vegetation cover have high groundwater potential than built-up areas that inhibits the infiltration of water into the subsurface [30]. From land use classes, built-up area has the lowest weight compared to other classes and crop land has the highest weight [31]. Landuse landcover offers essential details on infiltration, moisture, groundwater, and surface water in addition to suggestions on groundwater requirements.  The primary coverings of the land surface by human activity or vegetation are referred to as landuse and landcover, respectively (natural or planted). The land-use type in the study area in accordance with the order of infiltration includes barren land, built up land, crop land, grass land, lichen mosses, open water, shrubs cover area, tress cover area and vegetation aquatic (Figure 6). The landuse landcover layer was obtained from the Ethiopia Sentinel2 LULC 2022. The boundaries in the layer were then visually evaluated using Landsat8 satellite images. Next, the land-use classes changed to the USGS standard classifications. Finally, the layer was entered into the GIS model after the necessary edits.

fig 6

Figure 6: Landuse landcover

Lineament Density

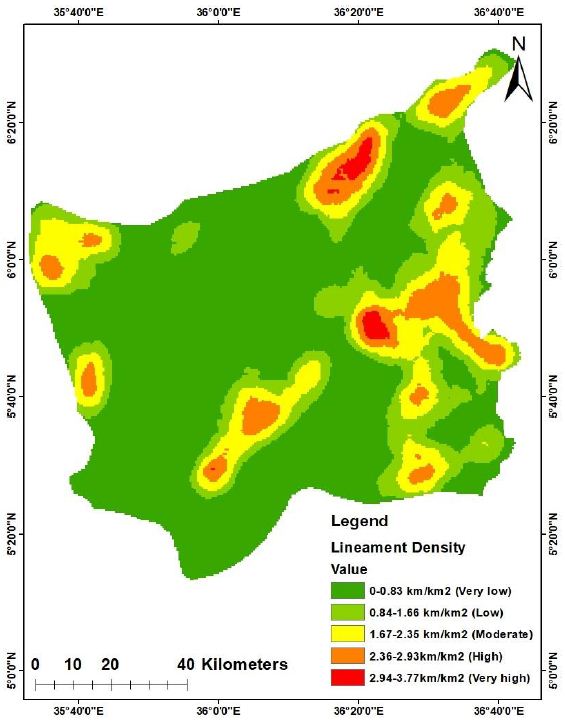
Lineaments are tectonic-derived linear, rectilinear, and curvilinear features that are visible in satellite photography. These lineaments typically display linearity and curvilinerities in vegetation, drainage, drainage patterns, soil tonality, relief, and tonality in soil in satellite data [32]. In particular, in the lineaments that are not filled by soil, the lineaments may operate as a channel for water to seep into the earth and migrate through the aquifer system due to linear features including fault, fractures, and geological connections between various lithologies. Since it is assumed that the rate of water infiltration increases with increasing lineament density, the lineament density (Figure 7) of a region might indirectly indicate the groundwater potential [33]. These lineaments are mapped with the help of satellite data and can be correlated with faults, fractures, joints, bedding planes and geological contacts which are useful for the groundwater potential study [34].

fig 7

Figure 7: Lineament density map

Soil

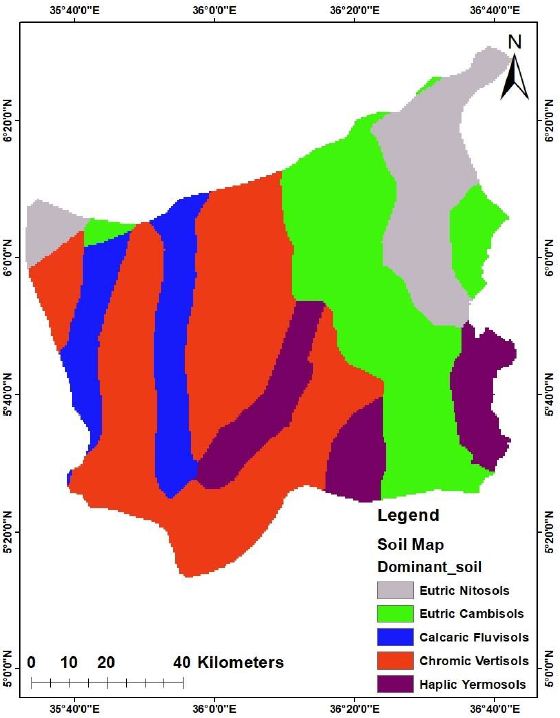
The type of soil texture present in an area has a great impact on the availability of groundwater. Highly porous soils allow easy percolation and infiltration of surface water into the subsurface, and this is ideal for a favourable groundwater potential. Soil properties influence the relationship between runoff and infiltration rates, which in turn control the degree of permeability [35]. Soil texture raster data of the Lower Omo-Gibe Watershed was obtained by HWSD (harmonized world soil database) Version 1.2 at 900 m resolution. Lower Omo-Gibe Watershed consists of five major soil textural groups (Figure 8), such as Eutric Nitosols, Eutric Cambisols, Calcaric Fluvisols, Chromic Vertisols and Haplic Yermosols. Due to their difference in infiltration and porosity, weight of soil texture is assigned on the basis of their infiltration rate.

fig 8

Figure 8: Soil map

Rainfall

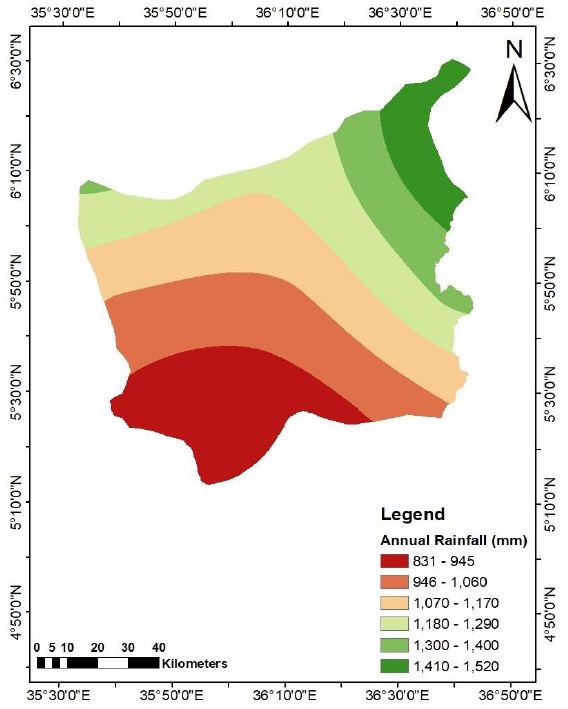
The slope gradient and rainfall distribution have a direct impact on the infiltration rate and the potential for groundwater potential zones [22]. As indicated in Figure 9, the annual rainfall was categorized into five classes: very high (1410-1520 mm), high (1300-1400 mm), moderate (1180-1290 mm), low (1070-1170 mm), very low (946-1060 mm) and extremely very low (831-945 mm). Rainfall generally decreases from east to west and similar to elevation, with annual rainfall varying between 831 mm and 1520 mm.

fig 9

Figure 9: Annual rainfall map

GIS Based AHP Method

GIS Geographic Information System

A software and hardware combination is a created instrument that has been extensively employed in groundwater potential zones and assessment. A method for limiting the number of target regions for hydrogeo-physical study is provided by the combined RS and GIS analysis [36]. Following site appraisal and selection for sustainable groundwater management, site-specific ground geophysical methods like vertical electrical sounding (VES) and very low frequency electromagnetic (VLF-EM) profiling may be used. In the GIS and RS spatial analysis and modeling, thematic layers for soil, lineament density, drainage density, geomorphology, slope, and LULC are integrated. In terms of groundwater prospect, weights ranging from 1 to 4 were allocated to the classes in order of increasing.

AHP Analytical Hierarchy Process

Developing an Analytical Hierarchy Process (AHP) Model

Making a decision hierarchy is the first step in an AHP analysis. AHP divides the issue into a hierarchy. As adopted by [37] first level of the hierarchy is the goal of groundwater potential zone identification. The second level in the hierarchy indicates the parameters that used to decide the potential zone and the third level is about an alternative to select groundwater potential zone as very good, good, moderate and fair. The benefit of AHP is that it simplifies issue solving by better understanding how to break down challenges. To make sure that all requirements and potential alternatives were followed, it is also feasible to request the participation of specialists [37,38].

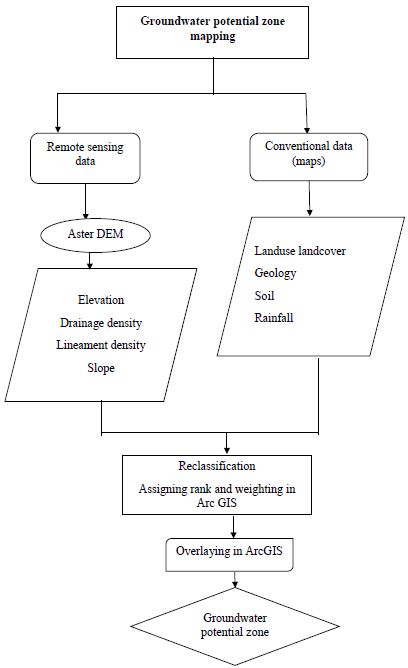
It’s one of the techniques employed the most in MCDA approaches, as was indicated in the introduction, this concept has been developed by [39]. The AHP evaluates a collection of evaluation criteria as well as a set of alternate options before selecting the best one with the most weight [40]. It is a strategy for assessing the relative weights of the criteria, different optimization strategies for each parameter, and generating an average rating of the variations that were generated using the predetermined criteria (selection criteria identification) at a certain stage [2]. The AHP is frequently used to establish priorities utilizing expert recommendations and evaluations, reduce issue confusion and complexity, and facilitate decision-making. There should be at least two criteria and two substitutes in every study that has been examined by AHP in order to determine each factor’s weight [41]. Since these criteria were given varying degrees of importance, education and expertise are particularly important for thorough evaluation and analysis. It’s possible to employ both qualitative and quantitative criteria [42]. After using AHP within the MCDA, a decision matrix was produced in each study that was reviewed. Field experiences and literature reviews were used to weigh several parameters on a flexible scale from 1 to 5. Then using a few formulae to get the system’s normalized weight and consistency ratio (CR) (Figure 10) [38].

fig 10

Figure 10: Methodology flow chart for the present study

fig 11

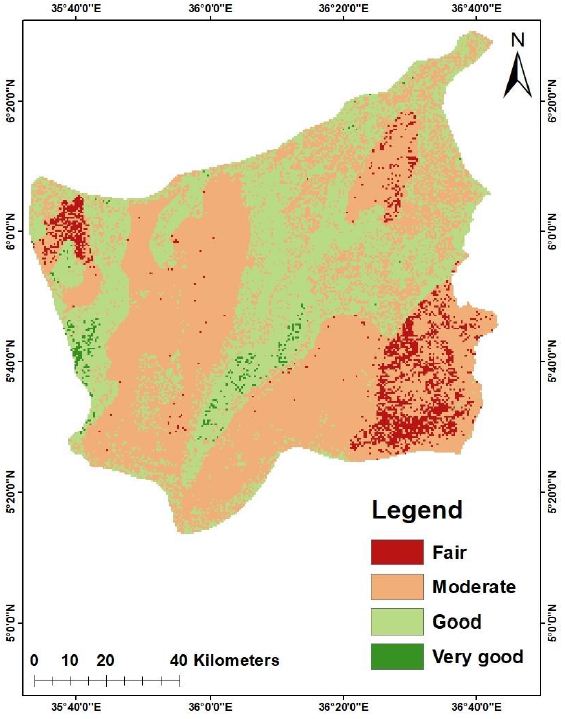
Figure 11: Groundwater potential map

Result and Discussion

Landuse Landcover

Land use map of the study area (Figure 6) consists of several classes, viz., Bare area 112 km2, Built up area 143 km2, Cropland 435 km2, Grassland 268.5 km2, Lichen mosses 112 km2, Open water 97 km2, Shrubs cover areas 289 km2, Tree cover areas 667 km2 and Vegetation aquatic 222 km2 as shown in Figure 6 and Table 1. Land use is one of the important criteria for identifying groundwater potential zones. Suitable weights were given to each class and their areal extents were calculated using “Zonal Statistics” in GIS (Table 1).

Table 1: Area covered under different range of parameter of Landuse landcover

Land use class

Categories

Area (km2)

Area (%)

Bare area Poor

112

4.78

Built up area Very poor

143

6.10

Cropland Moderate

435

18.55

Grassland Good

268.5

11.45

Lichen mosses Good

112

4.78

Open water Very good

97

4.14

Shrubs cover areas Poor

289

12.32

Tree cover areas Very good

667

28.44

Vegetation aquatic Very good

222

9.46

Geology

Geology is also one of the input parameter factors in delineating the groundwater potential zones. Four different lithologies have been observed in the study area (Figure 4). Their areal extent has been determined using “Zonal Statistics” in geographic information system domain (Table 2). Geology of Lower Omo-Gibe watershed is dominated by tertiary extrusive and intrusive rock 758 (32.32%), tertiary (397 km2, 16.93%), quaternary (845 km2, 36.03%) and Permian-Carboniferous (345.5 km2, 14.73%).

Table 2: Area covered under different range of parameter of Geology

Geology class

Categories

Area km2

Area%

Tertiary extrusive and intrusive rock Very good

758

32.32

Tertiary Good

397

16.93

Quaternary Moderate

845

36.03

Permian-Carboniferous Poor

345.5

14.73

Slope

The slope of the study area has been estimated from Digital Elevation Model (DEM) data as shown in Figure 2 and Table 3. Flat or gentle slope is suitable for increasing the infiltration amount from rainfall. Otherwise, in steep slope area where the infiltration capacity is very minimum whereas runoff is maximum. From the analysis, slope ranges from 0-5 percent rise covers high area coverage which is 31.29% (734 km2), 5-10 slope categories covers 17.67% (414.5 km2), 10-15 slope  categories covers 13.69% (321 km2), 15-20 slope categories covers 9.46% (222 km2) and >20 slope categories covers 27.88% (654 km2).

Table 3: Area covered under different range of parameter of Slope

Slope categories

Categories

Area (km2)

Area (%)

0-5

Very good

734

31.29

5-10

Good

414.5

17.67

10-15

Moderate

321

13.69

15-20

Poor

222

9.46

>20

Very poor

654

27.88

Soil Type

Soil type is also one of the most determinant factors in estimating the groundwater. Ten different soil types have been observed in the study area (Figure 8). Their areal extent has been determined using “Zonal Statistics” in geographic information system domain (Table 4). Soil type of Bahir dar zuria is dominated by vertisoil with an aerial extent of 1045.19 km2 (67.78%), followed by luvisoil (284.31 km2, 18.08%), and other units together cover in the study area as indicated in Figure 8 and Table 4. Based on the hydraulic properties of the soil, the soil classes were accordingly ranked using AHP.

Table 4: Area covered under different range of parameter of soil type

Soil class

Categories

Area km2

Area%

Eutric Nitosols Moderate

450

19.19

Eutric cambisols Good

498

21.23

Calcaric fluvisols Very good

356

15.18

Chromic vertisols Very poor

782

33.34

Hapric hermosols Poor

259.5

11.06

Lineament Density

Lineaments are the natural linear feature like faults, joints and fractures, which can visualize and interpreted directly from remotely sensed data. As shown in the Table 5, lineament density class ranked as very low, low, medium, high and very high with the areal extent of 0-0.83 Km/km2, 0.84-1.66 Km/km2, 1.67-2.35 Km/km2, 2.36-2.93 Km/km2 and 2.94-3.77 Km/km2 respectively. The total area falling in different range of lineament density is given in Figure 7 and Table 5 which show that most part of the study area have very low lineament density. So very low lineament density indicates very low infiltration rate, whereas the high lineament density areas indicate high infiltration (Table 5) thus a potential zone for groundwater development.

Table 5: Area covered under different range of parameter of Lineament

Lineament density class

Categories

Area (km2)

Area (%)

0-0.83

Very low

1411

60.16

0.84-1.66

Low

322

13.73

1.67-2.35

Moderate

198

8.44

2.36-2.93

High

201.5

8.59

2.94-3.77

Very high

213

9.08

Drainage Density

Drainage density is a significant parameter for evaluating the groundwater potential zones. The areas having high drainage density have less potential for groundwater recharge, and the areas with low drainage density have a high potential for groundwater recharge. Hence, the areas having low drainage density are favorable for high groundwater potentiality. So, higher weights were assigned to the areas having low drainage density. The drainage density was classified into five categories viz. very low (0.08-091 km/km2), low (0.92-1.67 km/km2), moderate (1.68-2.74 km/km2), high (2.75-3.43 km/km2) and very high (3.44-4.22 km/km2). The highest area was under low density with 225.5 km2, followed by very low with 388 km2, moderate 510 km2, high 589 km2, and very high 633 km2 as shown in Figure 3 and Table 6.

Table 6: Area covered under different range of parameter of Slope

Drainage density class

Categories

Area (km2)

Area (%)

0.08-0.91

Very low

225.5

9.61

0.92-1.67

Low

388

16.54

1.68-2.74

Moderate

510

21.74

2.75-3.43

High

589

25.11

3.44-4.22

Very high

633

26.99

Rainfall

Rainfall is one of the most important sources of groundwater recharge through percolation in the groundwater system. The average annual rainfall in the study area is grouped into six classes namely extremely very low (831-945 mm), very low (946-1060 mm), low (1070-1170 mm), moderate (1180-1290 mm), high (1300-1400 mm) and very high (1410-1520 mm), covering the area of about 410 km2 (17.48%), 370 km2 (15.77%), 366 km2 (15.60%), 433 km2 (18.46%), 376.5 km2 (16.05%) and 390 km2 (16.63%), respectively as shown in Figure 9 and Table 7. Rainfall distribution along with the slope gradient directly affects the infiltration rate of runoff water hence, increases the possibility of groundwater potential zones.

Table 7: Area covered under different range of parameter of Rainfall

Rainfall class

Categories

Area (km2)

Area (%)

831-945

Extremely very low

410

17.48

946-1060

Very low

370

15.77

1070-1170

Low

366

15.60

1180-1290

Moderate

433

18.46

1300-1400

High

376.5

16.05

1410-1520

Very high

390

16.63

Derived Priorities (Weights) for the Parameters

The AHP method was applied in the current work to determine the weight for each data layer. One of the most widely used techniques for determining the weights of criterion in the Multi-Criteria Decision Making is AHP (MCDM) [38]. To identify the purpose, criteria, and relationship between them, the hierarchical structure of the subject being studied is created as the first stage in the AHP approach. Initially, the AHP approach involved conducting a pairwise comparison of the alternatives using specially created questions that followed the format of the standard AHP questionnaires. In this study, opinions from a range of experts were gathered regarding the potential for groundwater, including hydrologists, hydrogeologists, environmentalists, and GIS experts. The overall method is as described in the following Figure 9. The result of AHP shows that geology has the highest weight (38.39%) followed by slope, which accounts for 23.27%, drainage density 14.54%,  landuse landcover 11.40%, lineament density 7.04% and soil 5.35% of the weight given to each parameter (Tables 1 and 2). When the judgements matrix is consistent and the computed weight has been normalized by multiplying the derived weight of all parameters by 100%, it is then possible to rank the features of each parameter for the purpose of a weighted overlay. Features of each thematic layer were ranked on the basis of influence of groundwater potential within each parameter (Table 8) [38,43].

Table 8: Comparison matrix and significance weightage value of the influential factors

Factors

Geology

Lineament density

Slope

Rainfall

Soil

LULC

Drainage density

Weight

Geology

7

6

5

4

3

2

1

38%

Lineament density

7/2

6/2

5/2

4/2

3/2

2/2

1/2

19%

Slope

7/3

6/3

5/3

4/3

3/3

2/3

1/3

12%

Rainfall

7/4

6/4

5/4

4/4

3/4

2/4

1/4

10%

Soil

7/5

6/5

5/5

4/5

3/5

2/5

1/5

8%

LULC

7/6

6/6

5/6

4/6

3/6

2/6

1/6

6.6%

Drainage density

7/7

6/7 5/7

4/7

3/7

2/7

1/7

6.4%

Groundwater Potential Zone of the Watershed

To choose the best location for future groundwater development and management, it is crucial to integrate several groundwater regulating variables for discovering possible potential groundwater resources. Using the WLC of the GIS spatial analysis tool, all created thematic maps were integrated based on their weights and rates. The calculations of all the layers went into creating the GWP map. A prospective groundwater zone map was created by weighing the various theme layers and their specific features see Figure 10. The potential groundwater zone of the study area revealed five distinct zones, namely very good, good, moderate and fair. The distribution and extents of different potential groundwater zone are 158.05 km2 (21.59%), 35.92 km2 (4.91%), 214.77 km2 (29.34%), 220.59 km2 (30.13%), and 102.72 km2 (14.03%) for very good, good, moderate and fair zone respectively see Table 3. Study area have very high to high potential zone in southern, south west and central portion, while the west and eastern portion exhibits medium to low groundwater potentials. The distribution is more or less a reflection of drainage density, lineament, slope, and soil patterns in addition to geomorphic and geological elements, according to analysis of the groundwater potential map (Table 9).

Table 9: Groundwater potential zone

Groundwater Potential Zone Class

Area (sq. km)

Area in percent

Fair

432.9

18.45

Moderate

634.8

27.06

Good

954.3

40.68

Very good

323.5

13.79

Total

2345.5

100

The region appears to have a great potential for irrigation because there are large expanses of irrigable land with fertile soil available. The watershed lower areas get volcanic sediments that are moved from the watershed upper portions due to its geographic location. The area is seen as one where food security is a worry, despite having a lot of potential for irrigation agriculture due to its good soil, irrigable acreage, and high capacity for groundwater. I consequently suggest that concerted activities by the district and regional governments are required to improve the living conditions of persons who reside in the catchment. I have found in my study that the watershed may be abundant in water resources, particularly groundwater. Groundwater was found to have a high potential in nearly half of the basin. Despite the aforementioned limitation, I am confident that the results can be used to identify solutions for utilizing the local water resources and resolving the issue that the residents have been experiencing. I advise that a thorough investigation be done to determine the quantity and quality of water that is available in order to determine whether it can be used for the intended purpose. Due to the availability of substantial tracts of irrigable land with fertile soil, the area appears to have a high potential for irrigation. Due to its geographical location, the watershed lower portions receive volcanic sediments that are transferred from the watershed top portions. Despite having a lot of potential for irrigation agriculture due to its good soil, irrigable land, and high capacity for groundwater, the region is considered one of the locations where food security is a concern. In order to better the living conditions of those living in the watershed, I therefore propose that coordinated actions by the district and regional governments are needed.

Conclusion

In this study, groundwater potential zone evaluation using remote sensing, GIS, and MCDM methodologies has been successfully used and proven. The generation of thematic layers, the application of AHP to get the weights, and overlay analysis to determine the groundwater potential zone are the three steps of the process. Thematic layers were created by digitizing existing maps using a GIS and remotely sensed satellite image data. Utilizing the AHP, utility weights for the substitutes were provided. The identification of the groundwater potential zone uses an overlay analysis of multiple thematic maps and weighting. Based on remote sensing, GIS, and MCDA methodologies, four categories of groundwater potential zones have been identified in this study region. This particular study deals with the assessment of groundwater potential zones (GWPZs) using geographical information systems and remote sensing techniques in the Lower Omo-Gibe watershed, Omo-Gibe Basin, Ethiopia. The thematic layers influencing GWPZs such as geology, landuse landcover, slope, lineament density, drainage density, soil properties (soil texture, soil type), and elevation maps were getting prepared with the available data, i.e., conventional data, satellite image, and assigned individual weights along with their subclass divisions depending on literature and expertise decision. The distribution and extents of different potential groundwater zone are 158.05 km2 (21.59%), 35.92 km2 (4.91%), 214.77 km2 (29.34%), 220.59 km2 (30.13%), and 102.72 km2 (14.03%) for very good, good, moderate and fair zone respectively.

Data Availability

Data used in this research are available upon request.

Conflicts of Interest

The author declares that they have no conflicts of interest or personal relationships that could have influenced the work reported in this paper.

Acknowledgments

The authors acknowledge the Ethiopian Ministry of Water, Irrigation and Energy, and the National Metrological Agency for providing the necessary data which is helpful to accomplish this research work.

References

  1. Verma N, Pate RK (2021) Delineation of groundwater potential zones in lower Rihand River Basin, India using geospatial techniques and AHP, Egypt J Remote Sens Sp Sci 24: 559-570.
  2. Sulaiman WH, Karimi H, Mustafa YT (2021) A GIS-based AHP Method for Groundwater Potential Zone Assessment : A Review. 2: 86-92.
  3. Mahato R, Bushi D, Nimasow G, Nimasow OD, Joshi RC (2022) AHP and GIS-based Delineation of Groundwater Potential of Papum Pare District of Arunachal Pradesh, India. J Geol Soc India 98: 102-112.
  4. Shabani M, Masoumi Z, Rezaei A (2022) Assessment of groundwater potential using multi-criteria decision analysis and geoelectrical surveying. Geo-Spatial Inf Sci.
  5. Barua S, Mukhopadhyay BP, Bera A (2021) Integrated assessment of groundwater potential zone under agricultural dominated areas in the western part of Dakshin Dinajpur district, West Bengal, India. Arab J Geosci 14.
  6. Ifediegwu SL (2022) Assessment of groundwater potential zones using GIS and AHP techniques: a case study of the Lafia district, Nasarawa State, Nigeria. Appl Water Sci 12: 1-17.
  7. Abirami C, Annadurai (2016) Identification of Groundwater Potential Zones on GIS based Multi-Criteria Technique – A Case Study Erode District. Int J Eng Res Technol 4: 1-6.
  8. Said S, Anees M (2020) Remote sensing and gis based assessment of groundwater potential zones in amu campus using ahp approach. Ecol Environ Conserv 26: S6-S11.
  9. Arefayne Shishaye H, Abdi S (2015) Groundwater Exploration for Water Well Site Locations Using Geophysical Survey Methods. J Waste Water Treat Anal 07.
  10. Mengistu TD, Chang SW, Kim IH, Kim MG, Chung IM (2022) Determination of Potential Aquifer Recharge Zones Using Geospatial Techniques for Proxy Data of Gilgel Gibe Catchment, Ethiopia. Water (Switzerland) 14.
  11. Legesse Kura A, Abrar H, Esayas Dube E, Likisa Beyene D (2021) AHP based analysis of groundwater potential in the western escarpment of the Ethiopian rift valley. Geol Ecol Landscapes.
  12. Sajil Kumar PJ, Elango L, Schneider M (2022) GIS and AHP Based Groundwater Potential Zones Delineation in Chennai River Basin (CRB), India. Sustain14.
  13. Hussein AA, Govindu V, Nigusse AGM (2017) Evaluation of groundwater potential using geospatial techniques. Appl Water Sci 7: 2447-2461.
  14. Ouchar Mahamat Hijazi AD, MorabitiK, Rahimi A, Amellah O, Fadil O (2021) Delineating of groundwater potential zones based on remote sensing, GIS and analytical hierarchical process: a case of Waddai, eastern Chad. GeoJournal 86.
  15. Doke A (2019) Delineation of the Groundwater Potential Using Remote Sensing and GIS: A Case Study of Ulhas Basin, Maharashtra, India. Arch Photogramm Cartogr Remote Sens 31: 49-64.
  16. Arulbalaji P, Padmalal D, Sreelash K (2019) GIS and AHP Techniques Based Delineation of Groundwater Potential Zones: a case study from Southern Western Ghats, India. Sci Rep 9: 1-17.
  17. Castillo JLU, Cruz DAM, Leal JAR, Vargas JT, Tapia SAR, et al. (2022) Delineation of Groundwater Potential Zones (GWPZs) in a Semi-Arid Basin through Remote Sensing, GIS, and AHP Approaches. Water (Switzerland) 14.
  18. Kaewdum N, Chotpantarat S (2021) Mapping Potential Zones for Groundwater Recharge Using a GIS Technique in the Lower Khwae Hanuman Sub-Basin Area, Prachin Buri Province, Thailand. Front Earth Sci 9: 1-16.
  19. Jothimani M, Abebe A, Duraisamy R (2021) Groundwater potential zones identification in Arba Minch town, Rift Valley, Ethiopia, using geospatial and AHP tools. IOP Conf Ser Earth Environ Sci 822.
  20. Biswas S, Mukhopadhyay BP, Bera A (2020) Delineating groundwater potential zones of agriculture dominated landscapes using GIS based AHP techniques: a case study from Uttar Dinajpur district, West Bengal. Environ Earth Sci 79.
  21. Biswas A, et al. (2012) Hydrogeochemical contrast between brown and grey sand aquifers in shallow depth of Bengal Basin: Consequences for sustainable drinking water supply. Sci Total Environ 431: 402-412.
  22. Kumar T, Gautam AK, Kumar T (2014) Appraising the accuracy of GIS-based Multi-criteria decision making technique for delineation of Groundwater potential zones. Water Resour Manag 28: 4449-4466.
  23. Rahmati O, Nazari Samani A, Mahdavi M, Pourghasemi HR, Zeinivand H (2015) Groundwater potential mapping at Kurdistan region of Iran using analytic hierarchy process and GIS. Arab J Geosci 8: 7059-7071.
  24. Yihunie D, Halefom A (2020) Investigation of groundwater potential zone using Geospatial Technology in Bahir Dar Zuria District, Amhara, Ethiopia. An Int Sci J 146: 274-289.
  25. Çelik R (2019) Evaluation of Groundwater Potential by GIS-Based Multicriteria Decision Making as a Spatial Prediction Tool: Case Study in the Tigris River Batman-Hasankeyf Sub-Basin, Turkey. Water 11.
  26. Yeh HF, Cheng YS, Lin HL, Lee CH (2016) Mapping groundwater recharge potential zone using a GIS approach in Hualian River, Taiwan. Sustain Environ Res 26: 33-43.
  27. Thapa R, Gupta S, Guin S, Kaur H (2017) Assessment of groundwater potential zones using multi-influencing factor (MIF) and GIS: a case study from Birbhum district, West Bengal. Appl Water Sci 7: 4117-4131.
  28. Mandal U, et al. (2016) Delineation of Groundwater Potential Zones of Coastal Groundwater Basin Using Multi-Criteria Decision Making Technique. Water Resour Manag 30: 4293-4310.
  29. Gadrani L, Lominadze G, Tsitsagi M (2018) F assessment of landuse/landcover (LULC) change of Tbilisi and surrounding area using remote sensing (RS) and GIS. Ann Agrar Sci 16: 163-169.
  30. Adewumi AJ, Anifowose YB (2017) Hydrogeologic characterization of Owo and its environs using remote sensing and GIS. Appl Water Sci 7: 2987-3000.
  31. Dahiphale P, Kasal y, Madane D (2020) European Journal of Molecular & Clinical Medicine Groundwater Potential Zones Identification Using Geographical Information System. 07.
  32. Selvam S, Magesh NS, Sivasubramanian P, Soundranayagam JP, Manimaran G, et al. (2014) Deciphering of groundwater potential zones in Tuticorin, Tamil Nadu, using remote sensing and GIS techniques. J Geol Soc India 84: 597-608.
  33. Magesh NS, Chandrasekar N, Soundranayagam JP (2012) Delineation of groundwater potential zones in Theni district, Tamil Nadu, using remote sensing, GIS and MIF techniques. Geosci Front 3: 189-196.
  34. Jhariya DC, Kumar T, Gobinath M, Diwan P, Kishore N (2016) Assessment of groundwater potential zone using remote sensing, GIS and multi criteria decision analysis techniques. J Geol Soc India 88: 481-492.
  35. Kudamnya E, Andongma W (2017) Predictive Mapping for Groundwater within Sokoto Basin, North Western Nigeria. J Geogr Environ Earth Sci Int 10: 1-14.
  36. Ndatuwong LG, Yadav GS (2014) Integration of Hydrogeological Factors for Identification of Groundwater Potential Zones Using Remote Sensing and GIS Techniques. J Geosci Geomatics 2: 11-16.
  37. Mu E, Pereyra-Rojas M (2017) Group Decision-Making in AHP.
  38. Patidar N, Mohseni U, Pathan AI, Agnihotri PG (2022) Groundwater Potential Zone Mapping Using an Integrated Approach of GIS-Based AHP-TOPSIS in Ujjain District, Madhya Pradesh, India. Water Conserv Sci Eng 7: 267-282.
  39. Saaty TL (1984) 285 R. Avenhaus et al. (eds.), pg: 285-286.
  40. Leake C, Malczewski J (2000) GIS and Multicriteria Decision Analysis. J Oper Res Soc 51.
  41. Greene R, Devillers R, Luther JE, Eddy BG (2011) GIS-Based Multiple-Criteria Decision Analysis. 6: 412-432.
  42. Triantaphyllou E, Sánchez A (1997) A Sensitivity Analysis Approach for Some Deterministic Multi‐Criteria Decision‐Making Methods. Decis Sci 28: 151-194.
  43. Doke AB, Zolekar RB, Patel H, Das S (2021) Geospatial mapping of groundwater potential zones using multi-criteria decision-making AHP approach in a hardrock basaltic terrain in India. Ecol Indic 127.

Improving Traumatic Brain Injury Outcomes: Early Identification and Management of Paroxysmal Sympathetic Hyperactivity

DOI: 10.31038/IJNM.2023433

Introduction

There is a high incidence of excessive sympathetic outflow activity in many traumatic brain injury (TBI) patients [1]. Symptoms consist of hyperthermia, sweating, arterial hypertension, tachycardia, tachypnea, and extremity motor dystonic posturing, often in response to stimuli [1-3]. The lack of clear definition or terminology of the symptomatology of this syndrome has caused under diagnosis despite its high incidence in severe traumatic brain injury, morbidity and mortality and the increased healthcare and societal costs associated with traumatic brain injured patients [1]. The absence of a unified diagnostic criterion has severely hindered the ability to advance medical treatments. Finally, in 2014, a consensus expert group came together, 60 years after the first described written case, to establish a rigorous conceptual definition and diagnostic criteria [1-3]. The term Paroxysmal Sympathetic Hyperactivity (PSH) was introduced by a consensus group in 2014 and has become the unified term or acknowledged definition of these abnormal symptoms in TBI patients. The identified criteria and assessment tool, known as the Paroxysmal Sympathetic Hyperactivity Assessment Measure (PSH-AM) was developed and can be useful in assisting healthcare professionals in the diagnosis and medical management of TBI patients [3]. The PSH-AM is broken into two components the Diagnostic Likelihood Tool (DLT) and Clinical Feature Scale (CFS).

Currently, within a large teaching community level one trauma center, in the south side of Chicago, there is a perceived lack of implementation of evidence into practice in the surgical trauma intensive care unit. Most nurses working in the surgical trauma intensive care unit (STICU) admit that TBI patients are difficult to take care of given the complex pathophysiological nature of their injury or injuries. The trauma multidisciplinary team’s data has also seen an increase in TBI readmission to the intensive care unit related to PSH symptoms and medication administration. It was identified that an educational quality improvement project was needed to improve care provided to our TBI patients, specifically, patients showing signs and symptoms of PSH, in the STICU. By providing education to healthcare professionals about the current literature, pathophysiology, pharmacological management, and newly acknowledged PSH-AM tool, healthcare professionals can deliver evidence-based care. The belief is that PSH will be recognized and treated earlier to prevent worsening brain injury and unfavorable outcomes in this patient population.

Literature Review

Literature was reviewed and obtained after using the search engines of CINHAL, MEDLINE, and PubMed. The search strategy and keywords that were used consisted of full-text, English, an adult population (>18 years of age), paroxysmal sympathetic hyperactivity (PSH), autonomic dysregulation, sympathetic storm, dysautonomia, traumatic brain injury (TBI), and acquired or acute brain injury ABI). Four main research articles were evaluated and synthesized for evidence about PSH in TBI patients. Mathew et al. [4] have acknowledged in the literature that most studies have a wide range of incidental findings of PSH in TBI patients ranging from 8% to 33%. All articles identified the most common symptoms of PSH as tachycardia, tachypnea, hypertension, hyperthermia, diaphoresis, and extremity motor posturing. The studies recognized that symptoms could occur within the first five days of admission and may last more than two months. Symptom management is vital throughout all transitional phases in the acute care setting of these patients. All studies evaluated for evidence identified the significance of clinical symptomatology of PSH and that the PSH-AM tool had clinical usage in assisting healthcare providers in identifying symptoms of PSH for adequate diagnosis and prompt treatment management. Most literature notes that greater than 80% of the paroxysmal episodes in TBI or acquired brain injury patients are related to allodynic responses to noxious and non-noxious stimuli like suctioning, pressure sensations, and noise to name a few [5]. Identifying patient triggers or stimuli is beneficial in the overall care management of PSH patients. The studies also addressed the impact PSH had on length of hospital stay and worsening outcomes. Samuel el al. [2] in their study, assumed clinical assessment as the gold standard, while utilizing the PSH-AM tool yielded a sensitivity of 94% (identifying who has PSH) and specificity of 35% (ruling out who does not have PSH). The other studies discussed how the PSH-AM tool correlated with adequate diagnosis when used appropriately. The literature reviewed on PSH in TBI patients will provide imperative information regarding best practice management of the syndrome and allow for the development of a unit-specific educational seminar for quality improvement on TBI care and outcomes.

Project Methods

The project’s purpose is to improve the bedside care of TBI injury patients in the STICU by preventing secondary brain injury through early identification and management of PSH. The STICU setting was selected for this quality initiative because of the amount of TBIs this unit acquires, the high acuity this patient population poses, and the increased awareness of the identified educational needs of the healthcare professionals working in this unit. The internal review board for the institution was consulted, but no further approval was needed from the review board since this was deemed a quality improvement project. Key stakeholders were identified early and included the trauma director, attending physician leadership, nursing management, nursing educator, and the STICU’s pharmacist. The gatekeeper and overseer of the project was the trauma director and another surgical trauma attending colleague who assisted with creating urgency of PSH knowledge amongst residents and other physician colleagues. The nursing unit management and the unit nurse educator helped with sending out emails regarding the educational project presentation, empowering nurses, and obtained presentation equipment technologies. Lastly, the STICU’s pharmacist assisted with the pharmacological knowledge of the medications associated with the syndrome. Project objectives and outcomes were discussed in detail with all key members prior to the project’s roll-out to healthcare providers working in the STICU setting.

Evaluation of Outcomes and Limitations

The evaluation process consisted post-tests scores after a provided education seminar. One of these seminars was particularly for the eight attending surgical intensivists, who are also trauma surgeons on the unit. Their educational needs centered around the symptoms of PSH and the evidenced based pharmacological management therapies. The rest of the seminars were geared towards nursing staff, residents, and nurse practitioners working in the unit. These population educational needs centered more in depth with the history, pathophysiology, interventions and management. A total of 36 nurses, three NPs, and four attending physicians completed the seminar, the pre-post-tests, and evaluation process. This quality improvement project did have a few limitations. A required calculated sample size of 62 participants was not achieved. This was due to several factors, including high acuity of the patients in the intensive care setting, work and staffing schedules, timing of seminar sessions, a physician lacking the perceived need of the education and the presenter being sick with COVID-19 for 10 days (about 1 and a half weeks). During the implementation of education, there were technological issues with signing online to obtain the PowerPoint presentation and the connection capabilities of computer and monitoring screens in some seminar sessions. At times, the PowerPoint was viewed via laptop computer with a few nurses huddled around. Lastly, the evaluation process and chart review were completed by the project content expert who also created the educational presentation. The pre and post-test evaluation’s goal was to obtain an improvement in test scores. The goal was an increase in scores by more than twenty percent for knowledge attainment through statistical measures. Pre-test score average was 3.9 out of 6 questions with an overall score of 65% and the post-test average was 5.5 out of 6 questions with an overall score of 92% of all participants. The outcome for knowledge attainment was achieved statistically post-test with an overall score of greater than 85%. Eight patients were chart reviewed for PSH, after sustaining a TBI, utilizing the two constructs of the Paroxysmal Sympathetic Hyperactivity Assessment Measure (PSH-AM). Five patients were identified early, and treatment started at the time of symptom onset, while three patients were noted to have missed symptoms with treatment started one to three days post spike in temperature and documented symptoms. Propranolol was still noted as the attending physician’s first preference in patient management; however, oxycodone was more widely being applied early and utilized with post weaning of Fentanyl drips for PSH patients experiencing prominent symptoms identified by the PSH-AM and clinical presentation. Prior to this educational presentation, little was known regarding the current literature on the topic of PSH by many of the healthcare providers involved in the seminar sessions. Post-presentation, there were small improvements noted after chart review of the first 6 months of project implementation within the surgical trauma ICU. Most patient symptomatology only lasted, on average, two to three weeks, and by the time of discharge, some of the PSH medications were able to be weaned off. Key takeaways were noted with the post presentation presenter evaluation form. The acknowledged significances of this project included the following: the information presented was important for bedside practice, the presentation was concise, objectives noted, the pathophysiology of the syndrome and the rationale to early identification and management was presented clearly, the overall outcomes were summarized, and the continuous need for increased monitoring and bedside care for TBI patients who may develop PSH was identified by all healthcare providers. This continuous quality improvement project will continue onward in the surgical trauma ICU with the medical management and care of TBI patients, specifically patients at considerable risk of acquiring PSH. The PowerPoint presentation and three evidence-based articles on the topic will be posted on the surgical trauma ICU nursing and resident websites for educational review. Secondary brain injury in TBI patients will continue to decline as health care providers realize the importance of early identification and management of this syndrome.

Impact on Practice

There was an immediate impact with the healthcare team’s early recognition of the signs and symptoms of PSH in our TBI patient population. The t-test scores identified greater than 20% increase in average scores. The earlier identification of symptoms allowed for appropriate medication management of this syndrome and prevented worsening outcomes. Nursing care was further adjusted to prevent provocation of PSH symptoms and to meet patient and family care needs. The predicted long-term impact will include utilizing the information provided in this educational quality improvement project to identify PSH symptomatology, earlier pharmacological management, meeting quality outcomes for this population within the acute care setting and limiting and preventing secondary brain injury in the healthcare system’s TBI population. Ongoing educational implementation will be impactful in the long term. The STICU nursing website will provide a resource for nursing staff. The website will include the project’s educational PowerPoint and three main articles reviewed on PSH. Continued excitement and reinforcement measures at the bedside from the surgical trauma healthcare team regarding TBI management will be key in meeting quality outcomes for this highly unique patient population [6-13].

Conclusion

In conclusion, the data gathered from this quality improvement project indicates that knowledge attainment can be achieved by presenting new evidence on TBI care management and engaging educational seminars in the ICU setting. The most current evidence was disseminated and transitioned into practice, immediately. Further educational seminars should be provided to nurses and new healthcare professionals caring for traumatic brain injury patients by the surgical trauma team. The Likert evaluation tool allowed for suggestions and improvements in the visual presentation and the delivery method of key information in the presenter’s PowerPoint. Key stakeholders and leadership partners need to continue to maintain urgency in early identification and management of PSH in TBI patients to prevent worsening outcomes in this population. Further research and evidence are needed with the utilization of the PSH-AM tool in acute care practice. A TBI management protocol would be beneficial in acute care settings including the management of PSH and prevention of secondary brain injury in the TBI patient population.

References

  1. Meyfroidt G, Baguley I, Menon D (2017) Paroxysmal sympathetic hyperactivity: the storm after acute brain injury. The Lancet Neurology 16: 721-729. [crossref]
  2. Samuel S, Lee M, Brown RJ, Choi HA, Baguley IJ (2018) Incidence of paroxysmal sympathetic hyperactivity following traumatic brain injury using assessment tools. Brain Injury 32: 1115-1121. [crossref]
  3. Zheng R, Lei Z, Yang R, Huang G, Zhang G (2020) Identification and management of paroxysmal sympathetic hyperactivity after traumatic brain injury. Frontiers in Neurology 11: 1-14. [crossref]
  4. Mathew MJ, Deepika A, Shukla D, Devi BI, Ramesh VJ (2016) Paroxysmal sympathetic hyperactivity in severe traumatic brain injury. Acta Neurochirurgica, 158: 2047-2052. [crossref]
  5. Thomas A, Greenwald B (2019) Paroxysmal sympathetic hyperactivity and clinical considerations for patient with acquired brain injury. American Journal of Physical Medicine & Rehabilitation 98: 65-72. [crossref]
  6. Abdelmalik AP, Draghic N, Ling FS, Geoffrey (2018) Management of moderate to severe traumatic brain injury. Transfusion 59: 1529-1538. [crossref]
  7. Dang D, Dearholt, S, Bissett K, Ascenzi J, Whalen M (2022) Johns Hopkins evidence-based practice for nurses and healthcare professionals: model and guidelines. 4th ed. Indianapolis, IN: Sigma Theta Tau International.
  8. Ding H, Liao L, Zheng X, Wang Q, Liu Z, et al. (2021) B-Blockers in traumatic brain injury: A systematic review and meta-analysis. Journal of Trauma and Acute Care Surgery 90: 1077-1085. [crossref]
  9. Jafari AA, Shah M, Mirmoeeni S, Hassani SM, Nazari S, et al. (2021). Paroxysmal sympathetic hyperactivity during traumatic brain injury. Clinical Neurology and Neurosurgery 212: 1-6. [crossref]
  10. Khalid SM, Yang LG, Mcguire LJ, Robinson JM, Foreman B, et al. (2019) Autonomic dysfunction following traumatic brain injury: translational insights. Neurosurgical Focus 47: E8 1-8. [crossref]
  11. Nguembu SMM, Endalle G, Dokponou H, Dada EO, et al. (2021) Paroxysmal sympathetic hyperactivity in moderate-to-severe traumatic brain injury and the role of beta-blockers: A scoping review. Emergency Medicine International 1-6.[crossref]
  12. Shald AE, Reeder J, Finnick M, Patel I, Evans K, et al. (2020) Pharmacological treatment for paroxysmal sympathetic hyperactivity. Critical Care Nurse 40: e9-e16. [crossref]
  13. van Eijck M, Sprenger M, Oldenbeuving A, de Vries J, Schoonman G, et al. (2019) The use of PSH-AM in patients with diffuse axonal injury and autonomic dysregulation: A cohort study and review. Journal of Critical Care 49: 110-117. [crossref]

Exploring New Strategies Towards Cost-Efficient Anti- Soiling Coatings for CSP Plants

DOI: 10.31038/NAMS.2023641

Abstract

Power output of concentrated solar power systems (CSP) is strongly dependent on mirror reflectivity, which in turn, is affected by soiling and atmospheric conditions. Anti-soiling coatings can enhance efficiency of CSP plants while reducing operating and maintenance costs. Most of them however, suffer from poor endurance and performance. Transparent smooth coatings based on quaternarized silanes may be a viable approach in order to minimize energy losses attributed to soiling.

Introduction

Concentrated solar power (CSP) systems generate solar power by using mirrors or lenses to concentrate a large area of sunlight into a receiver [1]. Electricity is generated when the concentrated light is converted to heat. Solar thermal energy generation is a promising technology that can successfully address future energy needs in a renewable and sustainable way. Worldwide, the installed capacity in 2016 was reported to be 4.8 GW [2]. Despite this level of penetration of the technology, the levelized cost of electricity (LCOE) still remains high as compared to conventional power plants. Apparently, the mirror’s efficiency is critical to the system performance. Mirror reflectivity is one of several factors affecting the energy delivered by the solar field to the receiver, but varies significantly, due to soiling and atmospheric conditions. A 1% loss in reflectivity directly leads to a 1% increase in the levelized cost of electricity (LCOE). It is self-evident that soiling presents a significant problem which degrades performance and increases operational and maintenance (O&M) costs for plant operators. Plant O&M costs contribute about 11-15% to the LCOE, and mirror washing and water costs are a significant contributor to these costs [3].

Anti-soiling coatings may be an efficient solution to the above problem, since they can result in the reduction of O&M costs and water consumption while increasing the efficiency of a CSP solar collector field [4-9]. However, since the installed capacity is already enormous, anti-soiling coatings should be equally effective regardless if these are applied at the manufacturing stage or at an existing installation.

A New Approach towards Cost Efficient Anti-soiling Technologies

Various reports all over the world have revealed large decrements in the efficiency of existing solar power plants due to heavy soiling (including dust, dirt and pollen), exceeding 25% within a 6-month period especially at areas of high industrial pollution, at seaside locales with abundant salt mist, in deserts and at areas with volcanic activities and mining. Soiling on solar power systems, such as CSP and PV modules, is a complex phenomenon [4]. Scientific research has proven that surface soiling develops in two adjacent layers: one top layer which can be relatively easily removed by wind, rain or cleaning action and one sub-layer, which adheres strongly to the mirror/glass surface and forms a hard crust that reduces the amount of light reaching the solar collector. Besides energy losses, environmental conditions can also give rise to degradation or “corrosion” of the receiving surface.

Protective anti-soiling coatings provide a viable solution to the above problems [4-10]. The application of a non-stick barrier renders cohesion forces among same particles larger than adhesion forces among different particles and self-cleaning of dirty surfaces is facilitated. Although soiling rate, climate and types of soil vary by location the application of an anti-soiling coating improves efficiency by a non-negligible fraction. Coated surfaces accumulate dirt at a slower rate, exhibit in rainy conditions an enhanced self-cleaning effect, need less frequent cleanings and are easier to clean. Just like an improper surface structure however, some coatings may turn non effective and depending on environmental conditions transmittance may decrease below the threshold of uncoated surfaces.

Anti-soiling coatings can be either hydrophilic or hydrophobic [10]. Although hydrophilic coatings have a photocatalytic functionality being able to decompose organic matter by sun irradiation, they work well only on laboratory conditions. Furthermore, most of the environmental pollution is of inorganic nature, so it is rather pointless to apply a coating, which will work properly for destroying only a small portion of the existent organic dirt, especially in arid climates. On the other hand, hydrophobic anti-soiling coatings present more favorable characteristics [11,12]. At least 60% of liquid pollution can be self-cleaned by common hydrophobic coatings, while non-stick properties further aid in reducing soiling, thus significantly reducing cleaning costs. At the same time, the need of abrasive cleaning during regular maintenance is minimized, thus preserving the original optical properties of the receiver. However, most of the hydrophobic coatings in the market today are based on polydimethylsiloxanes or fluoro-polymers [13,14] and suffer more or less by some of the following drawbacks: a) poor endurance, especially with regards to abrasion, cleaning chemicals and adverse environmental conditions such as sandstorms, sea mist, humidity, etc., b) inadeqaute homogeneity and lower overall mechanical strength, c) poor translucency and d) low water sliding angles. More efficient technologies and coatings are therefore urgently needed.

Towards this end, an interesting perspective is the use of acidic aqueous solutions containing quaternarized silanes. The latter can hydrolyze and co-condense to provide non-stick surfaces with high lubricity and pronounced antisoiling attributes [15,16]. Although the resulting layers may lack oleophobic properties, they might be possible candidates of sustainable implementation within larger power plants, such as CSP plants and large PV plants, since repetitive applications (for example, every six months) can provide periodic surface revitalizing of coated surfaces. The opportunity behind this prospect lies in the fact that a permanent coating no matter how effective it is, it will ultimately stain and/or degrade. So, perhaps a temporary coating that performs well even for shorter periods but that can be economically re-applied at regular intervals may be a better alternative. Results obtained after extensive testing of our patented coating systems in real field conditions have shown that such coatings can exhibit pronounced antistatic properties, too.

More specifically, the deposition of a silane-based aqueous solution containing trimethoxysily-propyl dimethyloleyl-ammonium chloride on CSP samples can yield an extremely thin (30-50 nm) and smooth coating with acceptable mechanical strength and with WCAs lying in the range of 95-105°. Moreover, since the surface of CSP mirrors in anionic in nature the addition of quaternarized copolymers at low actives’ levels in the coating solution may further enhance electrostatic attractions and thus, adhesion of the coating to the substrate. Synthesis of such formulations is quite straightforward. In addition, the coating thickness can be tuned in a way to match specific CSP requirements or even specifications of tempered glass sheets used in PV modules. For example, the wave length of the incoming light and the refractive index of the glass can be effectively combined, thus minimizing reflection losses. Even more importantly, this coating may be industrially produced by low concentrated raw materials, thus enabling a low-cost material. If one considers that this material can be applied during routine cleaning of CSP plants, the cost per square meter of coating can be extremely low, i.e., below 0.30 Euros/m2.

Application of the coating at large surfaces can be preferably realized by spraying techniques, such as the HVLP technique. The latter allows fast application of the coating in a reproducible manner. Spray guns with nozzles of up to 1.4 mm and working pressures between 20 and 30 psi are preferable in terms of coating uniformity and hydrophobicity. Subsequently after application, fine polishing of the coating with the aid of a motorized felt pad or rinsing with water is necessary to remove coating residues and reveal a functional easy-to-clean/self-cleaning surface, since coating remnants are usually randomly-oriented self-condensed silica species which cannot consistently adhere to the surface, thus blocking its anti-soiling attributes.

Our company has developed a series of permanent and temporary anti-soiling coatings under the umbrella brand SolarSkin™ [17]. Although permanent coatings constitute the flagship of our SolarSkin™ product series, temporary coating variations have their own distinct features and advantages. Below some of their characteristics and specs:

  1. Initial water contact angles of 95+ degrees, i.e., above the hydrophobic threshold of 90°. Maintenance of hydrophobic attributes after 3 months exposure in outdoor conditions with the recorded WCAs being constantly above the widely accepted easy-to-clean threshold of 80°, thus indicating long-term cleanability of mirrors.
  2. Linear wear with less than 20% water contact angle reduction within a 6-month operational period.
  3. Optically free-no transmission losses after aging.
  4. Acceptable abrasion and UV resistance (assessed by preliminary evaluation of WCA reduction after 1 month of continuous exposure to environmental conditions).
  5. Resistance to cleaners, organic solvents (e.g., alcohols), washing detergents and chemicals, up to pH values of 10.
  6. Temperature stability of at least 120°
  7. Resistance to temperature fluctuations. Minimal degradation after repeating heating cycles at 100°C.
  8. Curing at ambient temperature.
  9. Surface roughness of less than 10 nm.
  10. Useful life-cycle of at least 6 months (meaning that the coating can be renovated during periodic cleaning of CSP plants without losing its functionality).

Considering especially techno-economical aspects of the existing anti-soiling coatings, it should be noted that, among the various factors affecting their performance, UV radiation has perhaps the most adverse impact [18]. Therefore, even the most enduring nano-coatings will inevitably degrade, no matter how they resist to abrasion or chemicals. In other words, the commonly employed industrial standards of wet scrub abrasion and chemical resistance are meaningless if they are not coupled with results from WCA degradation after real-field exposure.

Consequently, a “permanent” coating perhaps will not manage to perform optimally after a given time and, perhaps most importantly, more efficiently than a temporary coating, which may be periodically re-applied without additional labor costs, which usually account for more than 50% of the total application cost of a coating. BFP’s modest calculations through the successful implementation of such an approach to current power plants predict power increment between 2 and 4.5%, depending on atmospheric conditions and type/rate of soiling, up to 7% increment in energy generation and up to 70% reduced soiling, all of which translate to lower LCOE and reduced O&M costs.

Of course, long term real-field testing vs. actual performance over time of coated mirrors and coated tempered glass samples will prove the validity of this reasoning. Our company is currently conducting a long-term real-field study at the PROTEAS CSP facility in Cyprus to evaluate effectiveness of the above approach. Analysis of large data sets such as minute-resolution meteorological conditions and daily reflectivity measurements are continuously monitored. The information is analysed and compared to industrial standards in order to identify the optimal solutions sought in terms of cleaning schedule. The analysis also includes a comparative study with coatings that define the technological level in the field, taking into account international standards and specifications, required infrastructure-application equipment, as well as energy benefits driven by the reduction of cleaning frequency. The aim is to quantify the impact of the proposed surface coatings on the annual energy yield and overall cost of the technology. The potential use of alternative washing techniques is explored, too. Finally, further gains that the plant operator can harvest are investigated and quantified. A thorough report on the findings obtained is underway.

Conclusions

Efficient anti-soiling coatings for CSP plants based on quaternarized silane hybrid oligomers can be produced in a facile way. They present interesting features, such as low surface energy, transparency, acceptable mechanical resistance and smoothness. They can be also periodically revitalized, thus maintaining long-term functionality without severe fluctuations in performance, which offers a distinct advantage over traditional permanent coatings. Long-term real field analysis is required to prove the effectiveness of this approach.

Acknowledgments

This research has been supported under the umbrella of SOLAR-ERA.NET Cofund 2 by GSRT – General Secretariat for Research and Development (Greece), RIF – Research and Innovation Foundation (Cyprus) and FFG – Austrian Research Promotion Agency. SOLAR-ERA.NET is supported by the European Commission within the EU Framework Programme for Research and Innovation HORIZON 2020 (Cofund ERA-NET Action, No 786483).

Conflicts of Interest

All authors declare no conflicts of interest in this paper

References

  1. Ju X, Xu C, Hu Y, Han X, Wei G, et al. (2017) A review on the development of photovoltaic/concentrated solar power (PV-CSP) hybrid systems. Solar Energy Materials and Solar Cells 161: 305-327.
  2. REN21 (2017) Renewables 2017 Global Status Report.
  3. IRENA (2016) The Power to Change: Solar and Wind Cost Reduction Potential to 2025.
  4. Polizos G, Sharma JK, Smith DB, Tuncer E, Park J, et al. (2018) Anti-soiling and highly transparent coatings with multi-scale features. Solar Energy Materials and Solar Cells 188: 255-262.
  5. Wette J, Fernández-García A, Sutter F, Buendía-Martínez F, Argüelles-Arízcun D, et al. (2019) Water Saving in CSP Plants by a Novel Hydrophilic Anti-Soiling Coating for Solar Reflectors. Coatings 9: 739.
  6. Aranzabe E, Azpitarte I, Fernández-García A, Argüelles-Arízcun D, Pérez G, et al. (2018) Hydrophilic anti-soiling coating for improved efficiency of solar reflectors, in: Santiago, Chile.
  7. Jang GG, Smith DB, Polizos G, Collins L, Keum JK, et al. (2019) Transparent superhydrophilic and superhydrophobic nanoparticle textured coatings: comparative study of anti-soiling performance. Nanoscale Adv 1: 1249-1260.
  8. Dahlioui D, Wette J, Fernández-García A, Bouzekri H, Azpitarte I. (2022) Performance assessment of the anti-soiling coating on solar mirrors soiling in the arid climate of Ouarzazate-Morocco, Solar Energy 241: 13-23.
  9. Lorenz R, O’Sullivan M, Fian A, Sprenger D, Lang B.et al. (2018) , Effects of bias pulse frequencies on reactively sputter deposited NbOx films. Thin Solid Films 660: 335-342.
  10. Kim D, Kim JG, Kim T, Chu CN. (2021) Long-Lasting Superhydrophilic and Instant Hydrophobic Micropatterned Stainless Steel Surface by Thermally-Induced Surface Layers. Int J of Precis Eng and Manuf-Green Tech 8: 435-444.
  11. Liang Z, Zhou Z, Zhao L, Dong B, Wang S. (2020) Fabrication of transparent, durable and self-cleaning superhydrophobic coatings for solar cells. New J Chem 44 (2020) 14481-14489.
  12. Akustia Widati A, Nuryono N, Kartini I (2019) 1 Department of Chemistry, Faculty of Mathematics and Natural Sciences, Universitas Gadjah Mada, Sekip Utara, Yogyakarta 55281, Indonesia, 2 Departement of Chemistry, Faculty of Science and Technology, Universitas Airlangga, Surabaya 60115, Indonesia, Water-repellent glass coated with SiO2-TiO2-metyhltrimethoxysilane through sol-gel coating. AIMS Materials Science 6: 10-24.
  13. Syafiq A, Vengadaesvaran B, Abd N. Rahim AK, Pandey AR, et al. (2019) Transparent self-cleaning coating of modified polydimethylsiloxane (PDMS) for real outdoor application, Progress in Organic Coatings 131: 232-239.
  14. Bouvet-Marchand A, Graillot A, Abel M, Koudia M, Boutevin G, et al. (2018) Distribution of fluoroalkylsilanes in hydrophobic hybrid sol-gel coatings obtained by co-condensation. J Mater Chem A 6: 24899-24910.
  15. Papadopoulos ND, Falara PP, Vourna P (2023) A versatile approach towards development of easy-to-clean transparent nanocoating systems with pronounced anti-static properties for various substrates. AIMSMATES 10: 139-163.
  16. Nikolaos PD, Polyxeni V (2022) Proposing a sustainable strategy for the fabrication of robust anti-soiling coatings with enhanced antibacterial attributes for non-absorbent substrates. Int J Nanomater Nanotechnol Nanomed 8: 001-004.
  17. https: //bfp-tech.com/site/solarskin/ (n.d.)
  18. Lisco F, Bukhari F, Uličná S, Isbilir K, Barth KL, et al. (2020) Degradation of Hydrophobic, Anti-Soiling Coatings for Solar Module Cover Glass. Energies 13: 3811.

Preoperative Evaluation and Delirium Management of Older Adults in Hospital Settings

DOI: 10.31038/IJOT.2023613


A preoperative evaluation typically includes laboratory testing, imaging studies such as X-ray, computed tomography (CT) scan, electrocardiogram, or echocardiogram to appropriately evaluate the extent of injury, and risk stratification tools such as the Revised Cardiac Risk Index; however, older adults, particularly those with chronic cardiac, pulmonary, or renal multimorbidities may require a more thorough assessment to improve their surgical outcomes [1]. Below is a summary of the different areas of interest in the age-friendly approach to preoperative evaluation organized using the 5M’s Geriatrics Framework, developed by specialists in 2017, to help optimize the care of older adults [1,2].

Mind

It is paramount to accurately establish a patient’s baseline mentation during the preoperative evaluation. By collecting collateral information from caregivers, concerns for underlying cognitive impairment can be more easily identified, which can help define the level of involvement of family members and caregivers needed in the medical decision-making process [3]. It is also important to recognize if a patient is experiencing delirium while conducting the initial interview. Knowing and evaluating a patient’s baseline cognition and screening for delirium informs the patient’s medical decision-making capacity at that point in time, which is vital for obtaining informed consent for surgical procedures [3]. Delirium is an acute and fluctuating state typified by inattention, disorganized thinking, and altered mental status that is classified as hyper- or hypoactive, or mixed [4]. Increased age and cognitive impairment are pre-existing risk factors for delirium. Hospital admission also increases the incidence of delirium, as does acute medical or metabolic issues, being in an unfamiliar environment, lack of sleep or familiar routine, exposure to procedures, diagnostic testing, and anesthesia, prolonged nothing by mouth (NPO) status, and tethering with foley catheters, sequential sleeves, and telemetry (Table 1). Delirium can also prolong hospital stays, increase the likelihood of discharge to nursing homes, and increase morbidity and mortality [1,4,5].

Table 1: List of predisposing and precipitating risk factors for delirium in older adults

Predisposing Risk Factors for Delirium Precipitating Risk Factors for Delirium
•  Age 65 or older

• Male sex

• History of delirium

• History of cognitive impairment or dementia

• Depression

• Functional dependence

• Immobility

• Sedentary lifestyle

• History of falls

• Sensory impairment

• Decreased oral intake

• Dehydration

• Malnutrition

• Medications

• Alcohol use

• Multiple comorbidities

• Chronic renal disease

• Chronic hepatic disease

• History of stroke

• Neurologic disease

• Metabolic derangements

• Severe or terminal illness

• Infection with human immunodeficiency virus

• Sedative hypnotics

• Narcotics

• Anticholinergic drugs

• Polypharmacy

• Alcohol withdrawal

• Drug withdrawal

• Stroke

• Intracranial bleeding

• Meningitis/encephalitis

• Infection

• Hypoxia

• Shock

• Fever or hypothermia

• Anemia

• Metabolic derangements

• Surgery

• ICU admission

• Physical restraints

• Foley catheter

• Pain or stress

• Sleep deprivation

Source: Inouye, S.K. Delirium in Older Persons. March 16, 2006. N Engl J Med 2006; 354:1157-1165. DOI: 10.1056/NEJMra052321

The Confusion Assessment Method (CAM) Test is an effective screening tool for delirium. The CAM test evaluates attention using exercises such as reciting the days of the week backward, months of the year backward, or a series of numbers backward, known as the digit span. The UB- 2 Ultra-brief Delirium Screen (Figure 1) is sensitive and specific for diagnosing delirium and takes one minute to perform. If identified, steps should be taken to mitigate delirium, including a thorough review of home medications to identify commonly deliriogenic drugs, regulation and promotion of patient sleep/wake cycles and the implementation of supportive care measures that reiterate frequent reorientation and reassurance.

fig 1

Figure 1: The UB-2 Ultra-Brief Delirium Screen with detailed instructions. The UB-2 Ultra-Brief Delirium Screen is a sensitive and specific screening tool for diagnosing delirium that takes one minute to perform. If the screen is positive, it should be followed by the remaining items of the Ultra-Brief Confusion Assessment Method (UB-CAM).

Because delirium is typically multifactorial in etiology, a multimodal strategy is most effective to mitigate the severity and shorten the duration of the course. Once recognized, patients should be medically optimized (evaluation for metabolic disturbances, infectious causes, and cardiopulmonary distress). Review current medications for not only those that are commonly deliriogenic, as mentioned above, but also for medications that cause withdrawal with abrupt discontinuation, such as gabapentin and benzodiazepines, and attempt to reduce medications when able. A bedside examination is vital to assess for potential stressors (i.e., peripheral intravenous lines, telemetry) and screen for urinary retention and constipation. While hyperactive delirium tends to receive more attention in the hospital, patients with hypoactive delirium tend to have poorer outcomes, and it is estimated that hypoactive delirium is three times more common [4,6]. Therefore, when delirium is identified, a multifaceted non-pharmacological approach should be implemented (Figure 2). Antipsychotic usage to manage the resulting symptoms of delirium, such as agitation, may still occur despite a non-pharmacological approach. Though the literature does not identify one specific antipsychotic that provides optimal treatment for delirium, the brief use of antipsychotics in older patients with delirium may markedly reduce the length of hospital stay and associated healthcare costs [4,6]. However, antipsychotics should be used only if the patient presents a risk of harm to themselves or others.

fig 2

Figure 2: Infographic detailing the multifaceted non-pharmacological approach to older adults identified as having delirium during their hospital course.

Mobility

Describing a patient’s functional capacity with an inventory of the Activities of Daily Living (ADLs) and instrumental Activities of Daily Living (iADLs) (Table 2) is a foundational component of the preoperative assessment. In general, iADLs require more cognitive reserve as they require a degree of future planning, safety awareness, executive thinking, and a level of independence. Deficits in iADLs are typically seen before deficits in ADLs in normal aging. However, the rate of loss of function can exponentially increase when a patient has underlying progressive cognitive impairment. In addition to an ADL/iADL inventory, knowing the patient’s dependence on assistive devices (i.e., cane, walkers) and how their home environment is structured (stairs, safety devices such as chair lifts, modifications to bathrooms) help inform successful disposition planning and set realistic expectations with patients and family members regarding the trajectory of one’s recovery that may ultimately require more help or supervision in the home.

Table 2: List of the six (6) Activities of Daily Living (ADLs) and the eight (8) instrumental Activities of Daily Living (iADLs).

tab 2

Medications and Medical Complexity

As adults age, changes in normal physiology cause the body and brain to be more susceptible to medication’s adverse side effects. Changes in liver and kidney function (Figure 3), specifically, affect the metabolism of medications that can cause reduced clearance, increasing the time a medication lingers in circulation [7,8]. For example, a patient may have poorly controlled hypertension for which they were prescribed two to three antihypertensives for decades – but with aging-driven changes – these dosages may become more potent and lead to hypotension or dizziness. An accurate and comprehensive medication reconciliation, including a list of all current and recently discontinued medications (both prescribed and over-the-counter) with dosing and frequency, when they were started and their indications, how they are taken, and a review of supplements, is integral to every pre-operative evaluation. Similarly, alcohol use and tobacco smoking history should be elicited to prevent alcohol withdrawal and contextualize concern for poor wound healing.

fig 3

Figure 3: Infographics describing the natural aging of the renal and gastrointestinal systems and how the aging physiology predisposes older adults to medication side effects and drug-drug interactions.

Matters Most

Goals of care fall under the domain of Matters Most, and it encompasses much more than “Code status.” Still, engaging in a meaningful discussion about priorities can be challenging when the patient has suffered a sentinel event or is presented with the stressor of deciding to undergo surgery. Therefore, it is important to document conversations regarding goals of care to share with the care team, such as postoperative expectations and ideal living situation, and complete the necessary paperwork, such as Health Care Proxy forms and orders for life-sustaining treatments [9]. Many older adults may already have pre-existing Do Not Resuscitate (DNR) and/or Do Not Intubate (DNI) advanced directives. In these cases, the Code Status can be suspended perioperatively to ensure adequate support during surgery and acute postoperative care. It is also possible to reverse the Code Status to “Full Code” but avoid cardiac chest compressions, which some older adults and families prefer. SUMMARY A formulaic approach using the 5M’s Geriatric Framework when evaluating the biomedical, functional, mobility, cognitive, and psychosocial domains affecting our older adults can be incredibly useful in capturing all the elements necessary for a comprehensive preoperative assessment. When applied through the lens of aging physiology with the patient and their family’s goals of care in mind, this information can help increase patient safety during the hospital stay, improve surgical outcomes, and reduce the incidence of complications [10-12].

Keywords

Preoperative assessment, Preoperative management, Delirium, Geriatrics, 5M’s, Older adults, aging

References

  1. McDonald SR.(2022) Perioperative Care: Evaluation and Management. Hazzard’s Geriatric Medicine and Gerontology, 8e. McGraw Hill.
  2. Tinetti M, Huang A, Molnar F.(2017). The geriatrics 5M’s: a new way of communicating what we do. J Am Geriatr Soc. 65::2115.
  3. Drickamer MA, Stoneking S.(2022). Assessment of Decisional Capacity and Competencies. Hazzard’s Geriatric Medicine and Gerontology, 8e. McGraw Hill.
  4. Growdon ME, Mailhot T, Saczynski JS, Fong TG, Inouye SK.(2022). Delirium. Hazzard’s Geriatric Medicine and Gerontology, 8e. McGraw Hill.
  5. Singler K, Thomas C.(2017). HELP – Hospital Elder Life Program – multimodal delirium prevention in elderly patients. Internist (Berl). 58:125-131.
  6. Javedan H,Tulabaev S. (2014). Management of Common Postoperative Complications Delirium. Clinics in Geriatric Medicine, 30:271–278.
  7. Wiggins J, Naik AS, Patel SR.(2022). Aging of the Kidney. Hazzard’s Geriatric Medicine and Gerontology, 8e. McGraw Hill.
  8. Stanfield D, Benson M, Lucey MR.(2022). Hepatic, Pancreatic, and Biliary Diseases. Hazzard’s Geriatric Medicine and Gerontology, 8e. McGraw Hill.
  9. Matlock DD, Lum HD.(2022) Decision Making and Advance Care Planning: What Matters Most. Hazzard’s Geriatric Medicine and Gerontology, 8e. McGraw Hill.
  10. Braithewaite R S, Col NF, Wong JB.(2003). Estimating Hip Fracture Morbidity, Mortality and Costs. J Am Geriatr Soc. 2003;51:364-370.[crossref]
  11. Grigoryan KV, Javedan H, Rudolph J L.(2014) Orthogeriatric Care Models and Outcomes in Hip Fracture Patients: A Systemic Review and Meta-analysis. J Orthop Trauma. 28: e49-e55.
  12. Marcantonio E R, Flacker J M, Wright R J, Resnick N M.(2001). Reducing Delirium After Hip Fracture: A Randomized Trial. JAGS. 49:516-522.

The Creativity Level of High School Teachers in the Northern Region of Israel from the Perspective of Principals and Teachers

DOI: 10.31038/PSYJ.2023561

Abstract

The study sought to determine the amount of originality of secondary school instructors in Israel’s northern region, as seen by principals and teachers. The descriptive approach was employed, and data was collected using a tool after establishing its validity and reliability. The tool was a questionnaire designed to assess the level of creativity of secondary school teachers in Israel’s northern region, and it included three domains: (originality, flexibility, and fluency). After (400) electronic questionnaires were disseminated to the study population in a basic random manner, the available sample for the study consisted of (266) principals and teachers. The study’s findings revealed that the level of creativity among secondary school teachers in Israel’s northern region was average, and there were statistically significant differences in the study sample’s estimates of the level of creativity among teachers due to the effect of the gender variable in favour of females, and there were no statistically significant differences. Because of the influence of the factors qualification and experience. The study recommended that principals be encouraged to create a safe school environment free of conflict because it has a positive effect on increasing teacher creativity, giving principals more freedom in running their schools, and easing the burdens on teachers to increase their creativity.

Keywords

Creativity, School principals, Teachers, The Northern Region in Israel

Introduction

Institutions today are characterized by an unstable state, as they are open social activities that interact with the environment in which they live, with characteristics such as: growth, expansion, and diminishing spatial and temporal boundaries and boundaries, in light of rapid technical changes, and the rapid diversity and complexity of operations, and the intensity of competition over resources. Educational institutions at various levels are considered part of society, in which individuals are an essential component, and the presence of humanity in any institution dictates a number of complex internal and external relations to achieve its goals, as well as the exchange of experiences in it, and from these relations cases of differences and contradictions that must be managed arise. It is prudent to resolve and terminate it so that it does not interfere with the running of the institution and so impede its attainment of its objectives. In educational institutions that seek competition and change, the importance of creativity has increased in recent years, as it is reflected in the creation of new ideas in the educational process, as well as the creation of original ideas that are far from the traditional context in thinking, as well as the development of teaching methods, methods, and means that enable the transformation of these ideas into reality. Students, teachers, school administration, and society benefit from practical, productive, and beneficial value [1]. Creativity results from igniting instructors’ desire to work and motivating them to exert effort, effective engagement in work and performance, and shouldering responsibilities in order to realize the educational institution’s goals. As a result, job creativity benefits both the teacher and the school community.

Ciltas [2] confirms that the teacher’s creativity is closely related to the ability to imagine, because the teacher with the highest level of creativity successfully participates with his students physically and mentally in the various activities, and he can move away from the familiar or usual methods of teaching, and he also uses modern tools. new ways and ideas. Abd al-Rahman and al-Khatib [3] agree that the teacher is an important component of the educational system. The teacher with creative abilities is charged with growing students’ creative abilities since he is the one who increases creative thinking skills with his questions and is also capable of arousing students’ curiosity, and he is the teacher. The adaptable one who turns educational content into activities that encourage student creativity and is in charge of establishing an incubation atmosphere for creativity.

The success of the teaching-learning process is heavily dependent on successful management, as represented by the school principal, and the skills and capabilities he possesses that assist him in managing the school as an educational leader who influences all of its employees, and has the ability to neutralize conflicts and transform them into positive opportunities that support the educational process, and works to draw the way for individuals, and the coordination of their efforts. Furthermore, one of the most essential educational inputs in the success of the educational process is the teacher. Tafvlin [4] emphasized its significance to individuals interested in education by emphasizing that the success of the educational process and attainment of its goals are heavily reliant on the creative teacher who believes in his vocation. The Arab education system in Israel is facing unique political, economic, and social challenges, which are reflected in the performance of all components of the educational process in Arab schools. School principals, like the rest of those components, are impacted by the policies that are imposed on them, and the vast majority of them have not received any kind of training in diagnosing organizational conflict in their schools or how to effectively manage it, and all of their skills are the result of their experience, efforts, and personal characteristics [5]. Furthermore, the impact of the tough conditions that the Arab school system faces extends beyond principals to instructors. Teachers are dissatisfied with these plans, according to Arar and Al-Hajj [6], because of the psychological demands they put on them, which may influence their levels of creativity.

Statement of the Problem and Questions of the Study

For educational institutions to attain their targeted educational goals—which should be in step with contemporary and accelerated changes—teaching staff innovation is essential. The researcher came up with the idea for this study, which examined the degree of teachers’ creativity, as a result of working in secondary schools in Israel’s northern region and responding to the questions below:

  1. From the perspectives of administrators and teachers, what is the level of originality of secondary school instructors in secondary schools in the northern region of Israel?
  2. Are there statistically significant differences between the responses of the study sample regarding the degree of creativity of secondary school teachers in the northern region of Israel as a result of the influence of the variables (sex, educational attainment, experience, and job title) at the significance level (α=0.05)?

Purpose of the Study

The study aimed to accomplish the following goals:

  • Exposing the degree of creativity of secondary school teachers in the northern region of Israel in order to enhance their role in the interest of the school and boost the level of creativity.
  • -Outlining the variations in the study sample’s responses regarding the creativity of secondary school teachers in Israel’s northern region in accordance with the variables of the intermediate study in order to determine the reasons for these variations and address them in a way that enhances teachers’ levels of creativity.
  • -Making the creativity of secondary school instructors in Israel’s northern region public in order to raise standards, build on areas of strength, and address areas of weakness.

Significance of the Study

The theoretical significance of the current study stems from its expansion of earlier research that examined the creative variable. It represents a fresh addition to the Arab library in terms of enhancing it with new theoretical material from its perspective, which deals with the variable in secondary schools in the northern part of Israel.

The outcomes of the current study, the methods utilized to get the data, and the suggestions that will be made in light of those conclusions have all given it practical significance. The researcher anticipates that the following individuals will gain from its findings and suggestions:

  • The Ministry of Education’s decision-makers and educational policy-makers to determine the level of creativity among instructors.
  • Supervisors of education at the Ministry of Education.
  • Secondary school teachers.
  • Researchers, graduate students, and those with an interest in societal variables.

Review of the Related Literature

In order to keep up with change, speed, and openness to different cultures, it is crucial to use one’s mind and invest it wisely. This calls for attention to creative minds who are able to find solutions to many problems that arise. The current era is characterized by an information and technological revolution, rapid changes, and multiple developments in all areas of life. It endangers both individuals and society and hinders society’s ability to stay up with changes and apply knowledge to a variety of occupations, making the need to foster creativity imperative [7]. There is a direct connection between instruction and the growth of creativity. It is the responsibility of the teacher to foster creativity in the students, and it is the responsibility of the creators to advance society. As a result, it is impossible to distinguish between the desire to promote holistic social development and the interest in teaching and nurturing creativity. Thus, the teacher’s responsibility for the growth, instruction, and development of creativity. No matter how excellent and well-rounded the school curriculum is, if it is being applied by a teacher who is unqualified for the job, it will not work. The educator drives change and directs the educational process towards the growth of creativity. The employment of contemporary teaching approaches that facilitate dialogue and interaction, stimulate initiative and uniqueness, and welcome student viewpoints and ideas is what fosters creativity in the classroom [8].

In his definition of creativity, Ayoub [9] said that creativity is “the individual’s ability to produce, characterized by the greatest amount of intellectual fluency, spontaneous flexibility, originality, and far-reaching repercussions, in response to a problem or an exciting situation.” It is also known as “the ability to generate innovative and useful ideas, and to provide solutions to everyday problems and challenges,” according to Phillip [10].

The Elements that Make Creativity

The researchers disagreed on the exact number of components that make up creativity, but they did agree on the following, which is what is presented here [11,12]:

A Feeling of the Problem

This is regarded as the most crucial component of creative thinking, and it entails properly articulating the issue, as well as appreciating its scope, dimensions, and effects.

Fluency

Fluency is the capacity to generate the greatest amount of solutions to an issue with the greatest speed and ease.

Flexibility

This refers to the capacity to alter one’s mental state in response to a change in circumstance. Flexibility is the variety or distinction of ideas that the creative person generates. Spontaneous or automatic flexibility is regarded as a manifestation of flexibility and is defined as the person’s capacity to respond to a certain stimulus or stimuli with the greatest number of ideas.

Originality

This refers to a person’s departure from conventional modes of thought and exploration of novel concepts. The desire to create something new or different as a result of being dissatisfied with the current quo is what leads to originality. The process of being original can be broken down into the following steps: defining the idea, concept, or problem, referring to it in more detail or for clarification, coming up with new ideas that are based on the concept and describing them verbally or using educational tools, developing newly acquired intellectual processes, and evaluating the effectiveness of those processes.

Expansion and Elaboration

This refers to expanding the current primary forms, adding new elements and components, and providing as many results as is conceivable for any given person.

Analysis and Linking

Analysis is the capacity to break down a thing or matter into its constituent parts or primary parts and then isolate these parts from one another in order to comprehend and realize the significance and function of each part as well as the relationship between the parts. The ability to recombine these pieces in a way that makes it easier to analyses them and derive conclusions based on the structure of the links between them is what is meant by the term “connection.”

Risk

It entails taking the initiative to adopt novel concepts and procedures and look for solutions.

Creativity

Creativity was explained through a group of theories, which varied according to different schools and trends. The researcher presents some of these theories as follows:

First: The Theory of Research and Excellence

  • This theory is attributed to Peters & Waterman [13], who indicated in their book, In search of Excellence, that the common values and principles of creativity are the following:
  • Desire and motivation for achievement, always giving precedence to action, and initiating performance more than just spending a lot of time thinking and analyzing.
  • Developing relationships and links with the beneficiaries of the service from the institution, with the aim of getting to know them and benefiting from their suggestions.
  • Promoting and achieving the concept of productivity, by developing the capabilities of all employees in the organization, with dignity and humanity, and encouraging their spirit of adventure and creativity.
  • Simplifying procedures and administrative levels by relying on a few of them, and tending permanently to reduce leadership positions.

Second: Creative Thinking Theory

This theory is attributed to Edward De Bono [14], and it is named after the six hats. It relies on mental attitudes called parallel thinking, where everyone thinks about them in one way or one approach. De Bono divided the colors of the six hats as follows:

  • The white hat: It is responsible for collecting information, knowing the current situation and the surrounding problems and circumstances, and it represents the objective view of things.
  • The red hat: It is related to feelings, meaning that the person who wears it only says what he feels about a suggestion without giving reasons, as it is related to emotion, intuition, and instinctive thinking.
  • The green hat: It represents providing creative ideas, alternatives, options and possibilities, and it is often responsible for suggestions and creative thinking.
  • The blue hat: Its main task is to assist in controlling, determining capabilities, and anticipating results, in other words, controlling the thinking process.
  • The yellow hat: It is responsible for logic, benefits, and showing the value of things, that is, it represents positive logic.
  • The black hat: It is the hat of pessimism and caution, in which problems and weaknesses are assumed in the subject being researched, and it represents negative thinking.

The Six Hats method has been widely accepted, due to its ease of application, as it changes the prevailing way of thinking in meetings, and it takes a pattern (with or against), so that it becomes possible for the participants to establish a constructive dialogue among themselves.

  • Al-Enezi [15] classified levels of creativity as follows:

a. Creativity at the Individual Level

It is the creativity achieved by individuals who have creative abilities and attributes, and they are usually characterized by innate creative features, such as: knowledge, education, and intelligence, which is represented in the ability to form flexible relationships between things, and personality, where the creative person is characterized by a spirit of risk, independence, perseverance, motivation, and openness. And childhood, which is usually characterized by diversification, and social habits that are characterized by interaction and exchange of opinions with others.

b. Creativity at the Community Level

It is the creativity that is presented or reached by the group, and the creativity of the group is usually greater than the individual sum of the creativity of its members, and this type of creativity is characterized by the following characteristics:

  • A mixed-sex group produces better solutions than a single-sex group.
  • A highly diverse group produces better solutions, and a creative team solution requires that it be made up of people with different personalities.
  • A cohesive group is more willing or motivated to work than a group that is less cohesive.
  • The members of a harmonious group are more inclined to creativity than the group whose members are not in harmony.
  • The newly formed group tends to be more creative than the old group.
  • Creativity increases with the increase in the number of members of the group, as capabilities, knowledge and skills expand.

c. Creativity at the Enterprise Level

It is the comprehensive and integrated creativity at the level of the organization so that it dyes it and makes it a distinct distinguishing mark in itself from others, as they are distinguished organizations in the level of their performance and work, and the work of these organizations is often typical and ideal for other organizations, and this level of creativity is carried out according to the following conditions:

  • The need to realize that creativity and leadership need people with deep thinking, which requires that the institution provide individuals with learning and training opportunities.
  • The need to learn to solve problems in a creative way, and this means adapting thinking to be more flexible.
  • The need to develop and enhance creative skills and capabilities related to finding problems, getting used to absolute and comprehensive thinking, and exploring the dimensions of any situation.
  • The need to develop creative skills in creating problems or building problems.

d. Creativity in Educational Institutions

The school plays a major role in developing creativity among students, as it is the second environment – after the family – in which students spend a long period of time. Creative, which reflects positively on his performance by providing a climatic environment capable of showing creative people, as well as paying attention to various activities related to the development of their creative thought.

The creative teacher, with the culture and positive attitudes he carries towards his profession, works to nurture creativity among students, relying on his understanding of creativity, his awareness of its dimensions, and his ability to discover creative people and follow them in the creative process. And because teaching methods have a great role in nurturing creativity, it is necessary that these methods meet the development of students’ desire for self-learning, the development of their thinking abilities, the development of communication and leadership skills, the promotion of teamwork spirit, and the development of an emotional social classroom climate..

The researcher concludes that the school in the modern era requires an additional effort from the school principal, in order for the school administration to take creative paths, through planning and setting goals, or defining appropriate procedures for implementation and follow-up, and this is through participation, discussion and various and different meetings inside and outside the school, with the aim of achieving The goals of the educational institution that he heads, as well as delegating powers to those working with him in the school to share with him the responsibility, and to carry out the school’s burdens and supervise it, so that there is a commitment to implementing these goals.

Empirical Literature

Nasser’s study [16] aimed to identify the level of creative behavior among teachers in public schools in Israel. The sample of the study consisted of (502) male and female teachers, who were chosen by a simple random method. The study used the descriptive survey method, and the questionnaire as a tool for the study. The results showed that the level of creative behavior among teachers was high, and there were statistically significant differences due to the effect of the gender variable in favor of males, and the effect of the educational qualification variable in favor of bachelor’s holders, and the effect of the variable years of experience in favor of the “ten years or less” category.

Al-Qahtani’s study [17] aimed to identify the level of Islamic education teachers’ practice of creative thinking skills from the point of view of their students and its relationship to the variables of gender and the type of department (scientific, literary). The study used the descriptive survey method, and the questionnaire was used as a tool for the study. The study sample consisted of (365) male and female students who were randomly selected from Kuwaiti schools. The results showed that the level of Islamic education teachers’ practice of creative thinking skills in secondary schools in Kuwait was high, and there were no statistically significant differences due to the effect of the gender variable, and there were statistically significant differences due to the effect of the type of department variable, in favor of science students.

Marzuki & Lampuasa [18] conducted a study aimed at identifying the role of school principals in developing the motivation of English language teachers. The study used a descriptive approach based on a case study, as the study was applied in Azhar-Palu High School in Indonesia. The results showed that the most effective methods for developing teachers’ creativity are, in order: involving teachers in designing school programs and educational activities, adopting a fair policy in evaluation and providing incentives, and activating the supervisory role of course coordinators.

The study of Al-Issa [19] aimed to identify the role of basic school principals in the upbringing of Mafraq in developing the creative energies of teachers from the teachers’ point of view, and the impact of the variables of gender, experience, and educational qualification on the estimates of the study sample. The descriptive survey method was used, and the questionnaire was a tool for data collection, and the study sample consisted of (199) male and female teachers, who were selected using a simple random method. The results of the study showed that the role of principals of basic schools in Mafraq Education in developing the creative energies of teachers from the teachers’ point of view was high, and that the level of creativity among teachers was high, and there were no statistically significant differences about the level of creativity of teachers due to the variables of gender, experience and qualification.

The study of Adigüzel & Okçu [20] investigated the relationship between the school organizational climate and the level of teachers’ creativity. The study used the correlative descriptive method, and the study sample consisted of (756) male and female teachers who were chosen by the random cluster method from secondary schools in Turkey, and the questionnaires were used as data collection tools. The results showed that the level of the organizational climate was average, and that the level of teachers’ creativity was average, and that there was a correlation between the organizational climate and teachers’ creativity. The results also showed that there were statistically significant differences due to the effect of the gender variable in favor of males, and to the effect of the experience variable in favor of the “more than ten years” category.

The study of Ziada [21] aimed to identify the role of secondary school principals in Zarqa Al-Awwal Education in providing the requirements of a culture of creativity from the teachers’ point of view and its relationship to the variables of gender, years of experience, and academic qualification. The descriptive survey method was used, and the questionnaire was used as a data collection tool. The study sample consisted of (342) male and female teachers, who were selected using a simple random method. The results showed that the role of secondary school principals in the first Zarqa Education in providing the requirements of the culture of creativity from the point of view of teachers came to a medium degree, and there were no statistically significant differences due to the effect of gender and academic qualification, and there were statistically significant differences due to the effect of years of experience in favor of less than 5 years.

Method and Procedures

The descriptive correlational approach was used to identify the degree of practice of secondary school principals in the northern region in Israel strategies for managing organizational conflict and the level of creativity of teachers in those schools from the point of view of principals and teachers, as well as the correlation between them, due to the suitability of this approach to achieve the objectives of the current study. He is interested in studying the reality or phenomenon as it exists in reality, and as an accurate description that expresses it qualitatively or quantitatively, so that it gives a numerical description that shows the amount or size of this phenomenon.

Participants and Variables of the Study

The study population consisted of all the principals and teachers of secondary schools in the northern region inside Israel, which numbered (750) male and female teachers, working in (25) secondary schools, according to the human resources statistics of the Ministry of Education for the academic year 2022-23.

In order to select the study sample, (400) electronic questionnaires were distributed to the entire community of principals, and (375) teachers were chosen by the simple random method. Teachers, and accordingly the study sample consisted of (266) principals and teachers, who were chosen by the available method, with a rate of approximately (35.4%) of the study population. Table 1 shows the distribution of the study sample according to the intermediate variables (sex, educational qualification, experience, and job title).

Table 1 shows that 33.1% (number=88) of the study sample were males, and 66.9% (number=178) were females. 17.3% (number=46) of bachelor’s degree holders or less, and 82.7% (number=220) of graduate students. 33.5% (n=89) had experience of less than 10 years, and 66.5% (n=177) had experience of 10 years or more. 90.6% (n=241) were teachers, and 9.4% (n=25) were principals.

Table 1: The sample was distributed according to the intermediate variables
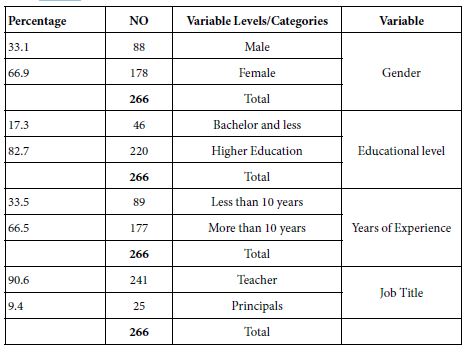
tab 1

Results of the Study

This chapter deals with a presentation of the findings of the study, which aimed to reveal the level of creativity of secondary school teachers in the northern region inside Israel, as follows:

The results related to the answer to the first question, which states: “What is the level of creativity of secondary school teachers in the northern region inside Israel from the point of view of principals and teachers?”

To answer this question, the arithmetic means and standard deviations of the study sample’s estimates of the creativity level of secondary school teachers in the northern region in Israel were calculated from the point of view of principals and teachers, and Table (15) shows this (Table 2).

The results related to table (15) show that the arithmetic mean of the estimates of the study sample for the fields of creativity combined is (3.38) and the standard deviation is (0.83) at an average level, and the arithmetic means for the fields of creativity ranged between (3.26) and (3.46) at an average level, where the estimates of the field of flexibility came in the first rank With an arithmetic mean (3.46) and a standard deviation (0.93) at an average level, the estimates for the field of fluency came in the second rank with an arithmetic mean (3.43) and a standard deviation (0.89) and at an average level. The arithmetic means and standard deviations of the study sample’s estimates on the areas of creativity were calculated separately, and tables 16 to 18 show this.

Table 2: The arithmetic means and standard deviations of the study sample’s estimates for the fields of creativity
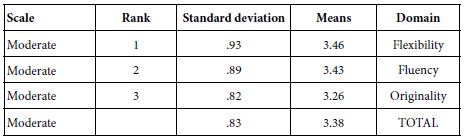
tab 2

Table (16) shows the arithmetic means and standard deviations of the study sample’s estimates in the field of resilience (Table 3).

The results related to table (16) showed that the total arithmetic mean of the estimates of the study sample for the field of flexibility was (3.46) and the standard deviation was (0.93) at an average level, and the arithmetic means for the field of flexibility ranged between (3.39) and (3.53) at an average level, as paragraph (13) came Its text “takes the initiative to adopt new ideas” ranked first, with an arithmetic mean (3.53) and a standard deviation (1.08), at an average level, while paragraph (12) and its text “accepts unfamiliar job tasks” came in the last rank, with an arithmetic mean (3.39) and a standard deviation (1.10). , and at an average level.

Table 3: Arithmetic means and standard deviations of the study sample estimates in the field of flexibility
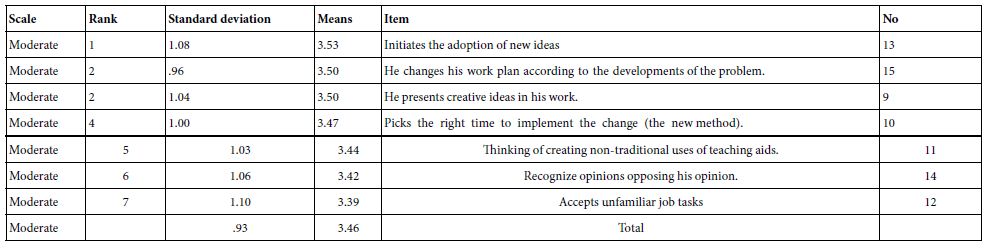
tab 3

Domain of Fluency

Table (17) shows the arithmetic means and standard deviations of the study sample’s estimates in the field of fluency (Table 4).

The results related to table (17) showed that the total arithmetic mean of the study sample’s estimates for the field of fluency was (3.43) and the standard deviation was (0.89) at an average level. “Innovates solutions to deal with problems” ranked first, with an arithmetic mean (3.56) and a standard deviation (0.96), and an average level, while paragraph (19) and its text “avoids routine teaching methods” came in the last rank with an arithmetic mean (3.28) and a standard deviation (1.04), And at an average level.

Table 4: Arithmetic means and standard deviations of the study sample estimates in the field of fluency
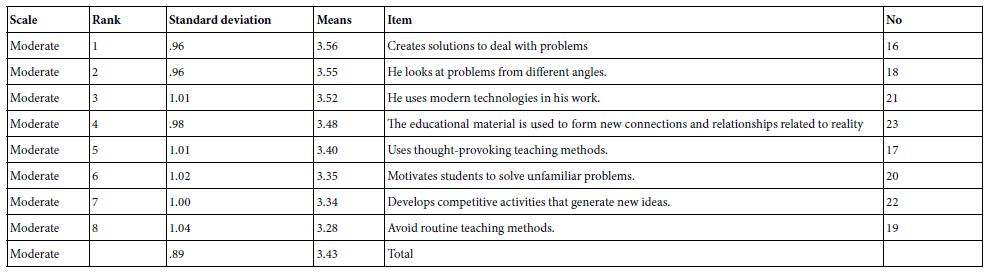
tab 4

Domain of Originality

Table (18) shows the arithmetic means and standard deviations of the study sample’s estimates in the field of originality (Table 5).

Table 5: Arithmetic means and standard deviations of the study sample estimates in the domain of originality
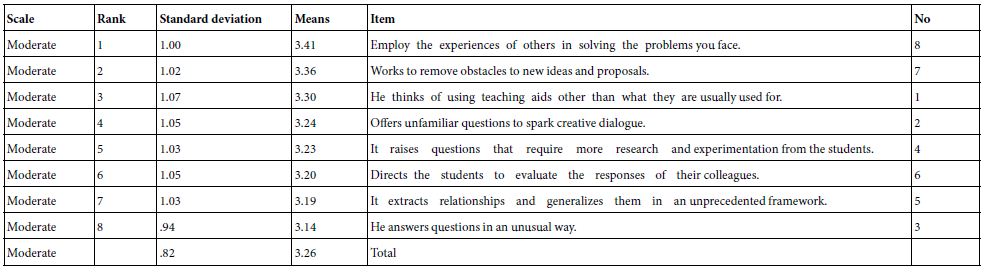
tab 5

The results related to table (18) showed that the total arithmetic mean of the study sample’s estimates for the field of originality was (3.26) and the standard deviation was (0.82) at an average level. Its text “employs the experiences of others in solving the problems it faces” ranked first, with an arithmetic mean (3.41) and a standard deviation (1.00), at an average level, while paragraph (3) and its text “answers questions in an unfamiliar way” came in the last rank with an arithmetic mean (3.14). And a standard deviation (0.94), at an average level.

The results related to the answer to the second question, which stated: “Are there statistically significant differences at the level of significance (α=0.05) in the responses of the study sample about the creativity level of secondary school teachers in the northern region inside Israel due to the effect of the variables (Gender, educational qualification, experience, and job title)?”

To answer this question, the arithmetic means and standard deviations of the study sample’s estimates about the creativity level of secondary school teachers in the northern region in Israel were calculated, according to the intermediate variables, and Table (19) shows that (Table 6).

Table 6: The arithmetic means and standard deviations of the study sample’s estimates about the creativity level of secondary school teachers, according to the intermediate variables.
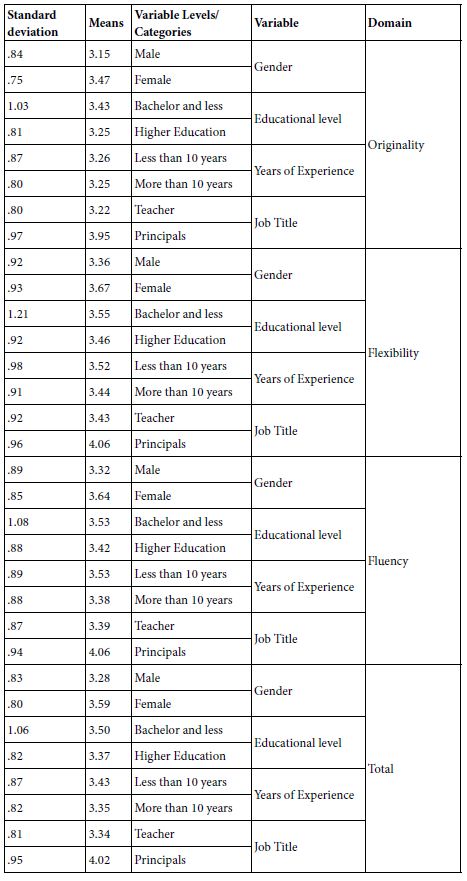
tab 6

The results related to table (19) showed that there are apparent differences between the arithmetic means of the study sample’s estimates about the level of creativity of secondary school teachers in the three domains and the totality, according to the intermediate variables.

To determine the statistical significance of the differences between the arithmetic averages of the study sample’s estimates about the level of creativity of secondary school teachers in the three domains (linear combination), according to the intermediate variables, four-way MANOVA was used, using the Hotelling’s Trace test, and the table (20) shows that (Table 7).

Table 7: The results of the (Hotelling’s Trace) test for the effect of the intermediate variables on the study sample’s estimates on the level of creativity of secondary school teachers in the three domains (linear structure).

tab 7

The results related to table (20) showed that there is a statistically significant effect of the variables of gender and job title in the estimates of the study sample about the level of creativity of secondary school teachers in the three domains (linear combination), and it explained 3.3%, 4.8% of the variance in estimates. While there is no statistically significant effect of the educational qualification and experience variables in the estimates of the study sample about the level of creativity of secondary school teachers in the three domains (linear combination).

To determine the statistical significance of the differences between the averages of the study sample’s estimates for the areas of institutional excellence (individually), according to the intermediate variables, the quadruple analysis of variance was used, and Table (21) shows this (Table 8).

Table 8: The results of the quaternary analysis of variance for the comparison between the arithmetic means of the study sample’s estimates about the level of creativity of secondary school teachers in the three domains individually, according to the intermediate variables.
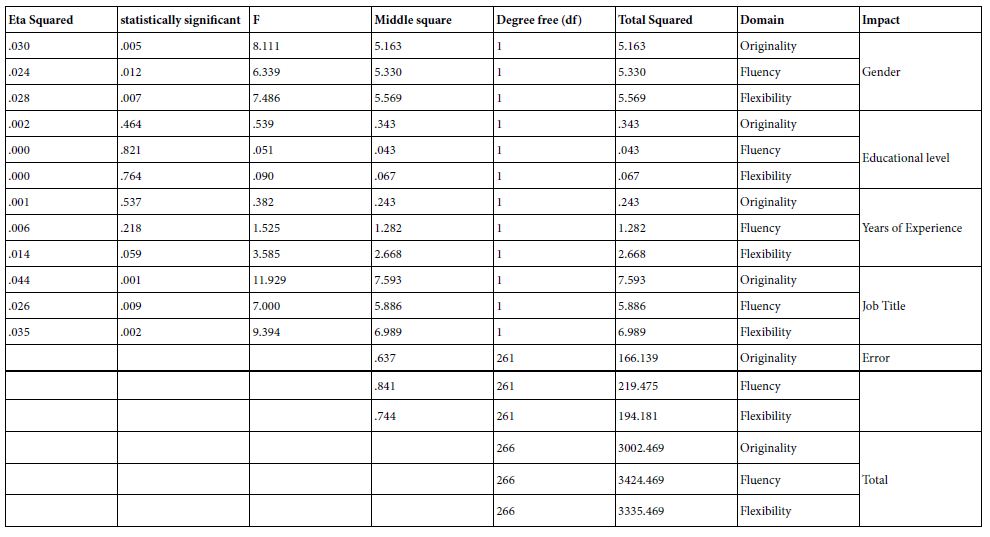
tab 8

The results related to table (21) showed that there are statistically significant differences between the arithmetic means of the study sample’s estimates about the level of creativity of secondary school teachers in the three domains individually, due to the gender variable and in favor of females. Accordingly, the sex variable has a statistically significant effect that explains 3%, 2.4%, and 2.8% of the variation in the estimates of originality, fluency, and flexibility, respectively. And there are statistically significant differences between the arithmetic means of the study sample’s estimates about the creativity level of secondary school teachers in the three domains individually; Attributable to the job title variable, in favor of managers. Accordingly, the job title variable had a statistically significant effect that explained 4.4%, 2.6%, and 3.5% of the variation in the estimates of originality, fluency, and flexibility, respectively. While there are no statistically significant differences between the arithmetic means of the study sample’s estimates of the study sample’s estimates about the level of creativity of secondary school teachers in the three domains individually, due to the variables of educational qualification and experience.

To determine the statistical significance of the differences between the arithmetic averages of the study sample’s estimates about the level of creativity of secondary school teachers in the three domains combined (total), according to the intermediate variables, Four-way ANOVA was used, and Table (22) shows that (Table 9).

Table 9: The results of the quaternary analysis of variance for the comparison between the arithmetic means of the study sample’s estimates about the level of creativity of secondary school teachers in the three domains combined (total), according to the intermediate variables.
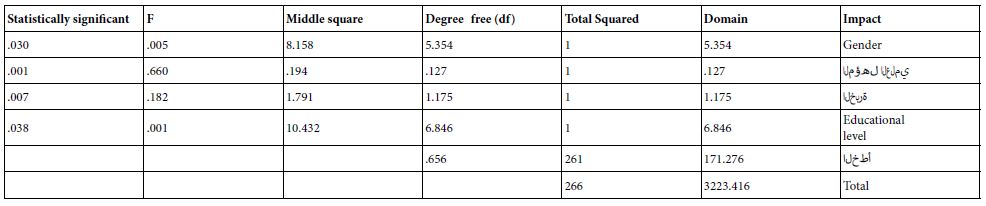
tab 9

The results related to table (22) showed that there is a statistically significant difference between the two arithmetic averages of the study sample’s estimates about the level of creativity of secondary school teachers in the three fields combined (total), according to the gender variable, in favor of females, and explains 3% of the variance in estimates.

The results also showed that there was a statistically significant difference between the two arithmetic averages of the study sample’s estimates about the creativity level of secondary school teachers in the three domains combined (total), according to the job title variable, and in favor of principals, and explains 3.8% of the variation in the study sample’s estimates about the creativity level of teachers. Secondary schools in the three fields combined (total).

The results also showed that there were no statistically significant differences in the estimates of the study sample about the level of creativity of secondary school teachers due to the impact of the educational qualification and experience variables.

Discussion of the Results and Recommendations

This chapter deals with a discussion of the findings of the study, which aimed to reveal the degree to which secondary school principals in the northern region within Israel practice organizational conflict management strategies and their relationship to the level of creativity among teachers. It was organized in the light of its questions as follows:

Discussing the results related to answering the first question: “What is the level of creativity of secondary school teachers in the northern region inside Israel from the point of view of principals and teachers?”

To answer this question, arithmetic means, standard deviations, and rankings were calculated for the study sample’s estimates of the level of creativity of secondary school teachers in the northern region in Israel from the point of view of principals and teachers. The results showed that all domains came with an average degree, where the estimates for the field of flexibility came in the first place with a medium degree, and the estimates for the field of fluency came in the second place with a medium degree, and the estimates for the field of originality came in the third place with a medium degree, and the arithmetic average of the estimates of the study sample for the fields of creativity combined was a degree Medium.

The researcher attributes this result to the fact that flexibility, which means the ability to change the state of mind by changing the situation, and includes the diversity or difference of ideas that the creative individual brings, may have become an acquired skill for many teachers by virtue of technological progress, the spread of informatics, and the ease of obtaining information through the Internet. And others, which made it easier for teachers to diversify in using new creative methods, and move away from traditional methods, which were based on indoctrination, and follow inherited patterns in presenting information and presenting study materials, but the presence of some old teachers in particular, who still apply traditional methods, especially Which they experienced themselves, in addition to their lack of interest in modern technological means, make the estimates about the field of resilience come in an average degree. As for the arrival of the field of originality in the last rank, the researcher attributes it to the tasks that teachers have to accomplish at certain times, such as finishing courses and exam dates, which may lead teachers to rely on successful traditional methods and avoid applying new ideas.

This result agreed with the result of the study of Mazhar & Akhtar, 2018, which showed that the level of creativity of secondary school teachers in Lahore, Pakistan was average, and the result of the study of Adigüzel & Okçu, 2021, which showed that the level of creativity of teachers in secondary schools in Turkey was average. The result differed with the result of the study, whose results showed that the level of creative behavior among public school teachers in Israel was high, and the result of the study [22], which showed that the level of creativity among Indonesian secondary school teachers was high, and the result of the Qaddumi study [23], which showed that the level of creativity among teachers of outstanding students in public schools in Jordan was high, and the result of Al-Qahtani’s study, which showed that the level of Islamic education teachers’ practice of creative thinking skills in secondary schools in Kuwait was high, and the result of Al-Issa study, which It showed that the level of creativity among teachers in basic schools in Mafraq Education was high. The researcher discussed the areas of the creativity level of the teachers separately, as follows:

Domain of Flexibility

The results related to this field showed that the estimates of the study sample for the field of flexibility came in a medium degree, as paragraph No. (13) and its text “takes the initiative to adopt new ideas” came in the first place with a medium degree, while paragraph No. (12) came and its text “accepts unfamiliar job tasks” Ranked last, with a moderate degree. The researcher attributes this result to an awareness of the importance of flexibility in terms of acceptance of new ideas. Relying on old ideas may generate failure in managing the situation, or stereotypes in managing it, which may not produce acceptable results, given the changes in our contemporary world. What was previously acceptable may It is not acceptable at the present time, and what was strange in the past may seem familiar at the present time, and since the managers are often from the old generation, there are those who realize that there are new ideas that they may not have tested, so they accept and adopt those ideas, and there are those who insist On the old ideas that they lived and tested, a time here the estimates were average. While the researcher attributes the advent of Paragraph No. (12) in the last place to the great burdens and the many tasks borne by the principals and the school staff, which may be an obstacle in front of them in accepting unfamiliar tasks, which take them time and effort, and may not be feasible, and fraught with failure.

Domain of Fluency

The results related to this field showed that the estimates of the study sample for the field of fluency came in a medium degree, as Paragraph No. (16) and its text “Innovate solutions to deal with problems” came in the first place with a medium degree, while Paragraph No. (19) and its text “Avoids routine teaching methods Ranked last, with a moderate degree.

The researcher attributes this result to the commitment of teachers to the curricula prescribed by the Ministry, and setting tasks at specific times, which may constitute an obstacle for many in trying to devise solutions or new methods, whether in solving problems, or presenting the study material, and here the teachers resort to using methods that have been tested and tried, They avoid inventing new solutions, as their innovation in finding new solutions to deal with problems may be limited to what they have no previous experience in dealing with. As for the advent of Paragraph No. (19) in the last place, it can be attributed to the introduction of modern technological tools such as computers and the Internet, which made it easier for teachers to learn about new ways and methods of teaching that were not known to them before, and it can also be attributed to what the technologies provided. Modern materials such as films and interactive programs, which are easily accessible, and contribute to facilitating the work of the teacher.

Domain of Originality

The results related to this field showed that the estimates of the study sample for the field of originality came in a medium degree, as paragraph No. He answers questions in an unusual way” in the last rank and to a medium degree. The researcher attributes this result to the fact that originality, with what it means in terms of moving away from traditional ideas, and trying to find new creative ideas, a person must try to learn about the experiences of others first; This is so that he can get acquainted with their ideas and experiences, because the idea that comes to a person’s mind may have occurred to others before him, and they applied it, and they have sufficient information about the extent of its success or failure, and from here, if a person wants to implement a creative idea, he must first benefit from The experiences and experiences of others, and this is what is done through cooperation, advice and exchange of ideas between teachers, and since this matter may not always be possible; Because there is a difference in the nature of each subject, whether at the level of teaching, or to solve a problem or conflict within the institution due to the different personalities, circumstances and environment of each school, we find that the estimates were average. As for paragraph No. (3) coming last, the researcher attributes it to the ability of some to quickly find alternatives, which requires great intelligence and expertise.

Discussing the results related to the answer to the second question: Are there statistically significant differences at the level of significance (α=0.05) in the responses of the study sample about the creativity level of secondary school teachers in the northern region inside Israel due to the effect of the variables (Gender, educational qualification, experience, job title)?

The results related to this question showed that there was a statistically significant difference between the two arithmetic averages of the study sample’s estimates about the level of creativity of secondary school teachers in the three areas combined (total), according to the gender variable, in favor of females. The researcher attributes this result to the interest of female teachers in the fields of creativity more than that of male teachers. This is because male teachers have more preoccupations due to family, social and material pressures, which push many of them to search for jobs in addition to their work in school to provide material income that helps them bear the burdens of life, which reduces their time devoted to creativity in their profession as teachers. The reason can also be attributed to the fact that females have a greater ability to persevere and seek creativity than males who prefer to complete their tasks in haste, which reduces the degree of proficiency. The result differed with the result of Nasser’s study, which showed that there were statistically significant differences in the level of creative behavior among public school teachers in Israel due to the effect of the gender variable in favor of males, and the result of the Mazhar and Akhtar study [24], which showed that there was no Statistically significant differences in the level of creativity of secondary school teachers in Lahore, Pakistan, due to the effect of the gender variable, and the result of the Qaddumi study , which showed that there were no statistically significant differences in the level of creativity among teachers of outstanding students in public schools in Jordan due to the effect of the gender variable, and the result of Al-Qahtani’s study which showed that there were no statistically significant differences about the level of Islamic education teachers’ practice of creative thinking skills in secondary schools in Kuwait due to the effect of the gender variable, and the result of Al-Issa’s study, which showed that there were no statistically significant differences about the level of creativity of teachers in basic schools In Mafraq education, it is attributed to the effect of the gender variable, and as a result of the study of Adigüzel & Okçu , which showed that there are statistically significant differences in the level of creativity of teachers in secondary schools in Turkey due to the effect of the gender variable in favor of males [25-63].

The results also showed that there was no statistically significant difference between the two arithmetic averages of the study sample’s estimates about the level of creativity of secondary school teachers in the three areas combined (total), according to the variables of educational qualification and experience.

The researcher attributes this result to the fact that teachers of different academic levels and experiences seek creativity, and try to overcome the difficulties that impede the performance of their tasks, and therefore they try to use technological tools, discuss and exchange experiences, and try to apply all that is new in order to achieve creativity. The result agreed with the result of the Mazhar & Akhtar study=, which showed that there were no statistically significant differences in the level of creativity of secondary school teachers in Lahore, Pakistan, due to the effect of the educational qualification variable, and the result of Al-Issa  study, which showed that there were no statistically significant differences. On the level of creativity of teachers in basic schools in Mafraq Education due to the effect of the educational qualification variable.

The result differed with the result of Nasser’s study, which showed that there were statistically significant differences in the level of creative behavior among public school teachers in Israel due to the impact of the educational qualification variable in favor of bachelor’s holders, and the result of the Qaddumi study, which showed that there were statistically significant differences. The level of creativity among teachers of outstanding students in public schools in Jordan is attributed to the effect of the educational qualification variable in favor of the “Bachelor” category.

The result also agreed with the result of the Mazhar & Akhtar study, which showed that there were no statistically significant differences in the level of creativity of secondary school teachers in Lahore, Pakistan, due to the effect of the variable years of experience, and the result of the Qaddumi study, which showed that there were no significant differences. Statistically, the level of creativity among teachers of outstanding students in public schools in Jordan is due to the effect of the variable of years of experience, and the result of Al-Issa’s study (2020), which showed that there were no statistically significant differences about the level of creativity of teachers in basic schools in Mafraq Education due to the effect of the variable of experience.

The result also differed with the result of Nasser’s study, which showed that there were statistically significant differences in the level of creative behavior among public school teachers in Israel due to the effect of the variable years of experience in favor of the “ten years and less” category, and the result of Adigüzel & Okçu’s study. , which showed that there are statistically significant differences in the level of creativity of teachers in secondary schools in Turkey due to the effect of the experience variable in favor of the category “more than ten years”. The results also showed that there was a statistically significant difference between the two arithmetic averages of the study sample’s estimates about the level of creativity of secondary school teachers in the three domains combined (total), according to the job title variable, and in favor of principals. The researcher attributes the presence of differences due to the job title variable in favor of the managers, perhaps because the managers have an interest in evaluating their workers, and therefore they care about the points of distinction and creativity and follow the teachers in this aspect; To be able to evaluate their subordinates fairly.

Recommendations

In light of the results, the study recommends the following:

  • Encouraging principals to create a sound school environment free of conflict, due to its positive effects in increasing creativity among teachers, and holding training courses for principals and teachers within the school.
  • Giving principals greater freedom in running the affairs of their schools, easing the burdens on teachers to increase their creativity, encouraging principals to exercise justice and shouldering responsibilities, and providing means of comfort for teachers so that they can devote more time to their work and school, and creativity in that.
  • Providing technological tools in schools because of their impact on facilitating tasks, increasing creativity among teachers, improving their performance, and conducting more studies that look at creativity in other societies.

References

  1. Hamadneh B (2016) Level of Job Creativity among Learning Disabilities Teachers from Their Perspective in Kingdom of Saudi Arabia. Journal of Education and Practice 7: 40-46.
  2. Ciltas A (2012) The effect of the mathematical modeling method on the level of creative thinking. The New Educational Review 30: 103- 113.
  3. Abd al-Rahman, Abd al-Salam, al-Khatib B (2013) The extent to which teachers of the first three grades practice creative thinking skills from their point of view in UNRWA schools in Jordan. Journal of the Islamic University for Educational and Psychological Studies 21: 249-283.
  4. Tafvlin S (2013) The transformational leadership process antecedents Mechanisms, and outcomes in the social services. Sweden: Print & media.
  5. Arar K, Abu-Asbe K (2013) Not just location: attitudes and perception of education system administration in local Arab governments in Israel. International Journal of Educational Management 27: 54-73.
  6. Arar, Khaled, Al-Hajj, Qusai (2016) Palestinian Arab Education in Israel: Data, Dimensions and Prospects. Beit Berl: Publications of the Arab Academic Institute for Education, Academic College.
  7. Al-Omyan, Mahmoud Salman (2018) Organizational behavior in business organizations. Amman, Dar Wael for publication and distribution.
  8. Khairy, Osama (2012) Creativity and innovation management. Amman: Dar Al-Raya for publication and distribution.
  9. Ayoub, Nadia (2010) Factors affecting the innovative managerial behavior of managers in the Saudi commercial banking sector. Journal of Public Administration 1: 3-51.
  10. Philip H (2010) Using faculty evaluation to improve teaching quality: A longitudinal case study of higher education in Southeast Asia. Educational Assessment Evaluation and Accountability 22: 253-274.
  11. Al-Titi M, Abdah R, Jaradat M (2016) The role of principals of basic schools in developing creativity among teachers from the point of view of assistant principals. Journal of Al-Quds Open University for Educational and Psychological Research and Studies 4: 311-344.
  12. Majali M (2017) The role of school administration in developing creativity among computer teachers in Mafraq schools in Jordan from their point of view. Journal of Educational and Psychological Sciences 1: 226-241.
  13. Peters T, Waterman R (1982) In search of excellence: Lessons from America’s best-run companies. New York: Harper & Row.
  14. De Bono E (1970) Lateral thinking: A textbook of creativity. London: Ward Lock Educational.
  15. Al-Anazi, Saad (2014) Business Creations. Amman: Dar Al-Warraq for publication and distribution.
  16. Naser, R (2016) Level of Creative Behavior among Teachers of Public Schools within the Green Line from their Perspective. Journal of Education and Practice 7: 109-119.
  17. Al-Qahtani S (2019) The Level Of Islamic Education Teachers’ Practice Of Creative Thinking Skills Among Secondary School Students From Their Students’ Point Of View. Unpublished master’s thesis, Al al-Bayt University, Mafraq, Jordan.
  18. Marzuki A, Lampuasa S (2019) The Roles of School Principal Leadership in Developing English Teachers’ Creativities in Palu. Al-Ta’lim Journal 26: 267-279.
  19. Al-Issa I (2020) The Role Of Basic School Principals In The Upbringing Of Kasbah Mafraq In Developing The Creative Energies Of Teachers. Unpublished master’s thesis, Al al-Bayt University, Mafraq, Jordan.
  20. Adigüzel Z, Okçu V (2021) Investigation of the Relationship Between Perceived Organizational Climate and Teachers’ Levels of Organizational Creativity and Organizational Cynicism. European Journal of Education Studies 8: 25-41.
  21. Ziada, Huda (2021) The role of secondary school principals in the first Zarqa Education in providing the requirements of a culture of creativity from the teachers’ point of view. Unpublished master’s thesis, Al al-Bayt University, Mafraq, Jordan.
  22. Fitriah F (2018) The Role of Technology in Teachers’ Creativity Development in English Teaching Practices. TEFLIN Journal 29: 177-193.
  23. Qaddumi Faten (2019) Creativity among teachers of outstanding students in regular public schools and its relationship to some variables. Palestine University Journal for Research and Studies 9: 56-93.
  24. Mazhar S, Akhtar M (2018) Relationship between Knowledge Management and Creativity among Teachers of Public and Private Secondary Schools at Lahore. Bulletin of Education and Research 40: 91-104.
  25. Abu Osbeh I (2019) Principals’ management of work teams and its relationship to organizational conflict management from teachers’ point of view in Amman Unpublished master’s thesis, Middle East University, Amman, Jordan.
  26. Al-Abed M.(2019) The role of Islamic values in alleviating organizational conflict in Algerian health institutions. Journal of Studies and Research 11: 150-163.
  27. Al-Abyadh A, Al-Ruwaili S (2017) A study of some modern educational supervision patterns as perceived by teachers and their relationship to their self-motivation. Journal of Educational Sciences 9: 103-168.
  28. Al-Awameh O,Abdel-Nabi R (2019) Methods of managing organizational conflict and its impact on the administrative creativity of secondary school principals by applying it to secondary education schools in Zawiya, the center city – Libya. Journal of Colleges of Education 13: 379-411.
  29. Al-Dairi Z (2018) organizational behavior. Amman: Dar Al Masirah for publication and distribution.
  30. Al-Hait A, Abdel-Al S (2017) The impact of organizational conflict management strategies and the culture of empowerment on the elements of administrative creativity. Al-Balqa Journal for Research and Studies 20: 63-84.
  31. Al-Khudairi M (2010) Conflict Management: How to have full vitality and the necessities to stay active in today’s world. Cairo: Engineering House, Egypt.
  32. Al-Melady, Abdel M (2014) Gifted child and the development of intelligence and creativity. Alexandria: University Youth Foundation, Egypt.
  33. Al-Qahtani A,Al-Shahrani, F (2020) Conflict management and its relationship to organizational commitment among secondary school teachers in Khamis Mushait Governorate. Journal of Educational Sciences 5: 17-54.
  34. Al-Quraishi, Abdul Karim (2015) Five Strategies for Managing Organizational Conflict. Journal of Psychological and Educational Studies 14: 84-102.
  35. Andersen P, Guerrero L,Afifi W (2013) Close Encounters: Communication in Relationships. Los Angeles, Calif: Sage.
  36. Ayoub N.(2010) Factors affecting the innovative managerial behavior of managers in the Saudi commercial banking sector. Journal of Public Administration 1: 3-51.
  37. Bano H, Ashraf S,Zia S (2013) Conflict: Factors and Resolution Strategies Adopted by Administrators of Schools for Visually Impaired Students. Mediterranean Journal of Social Sciences 4: 405-408.
  38. Brown F (1983) Principles of educational and psychological testing. 3rd ed. New York, NY: Holt, Rinehart & Winston.
  39. Bryman A, Cramer D (1997) Quantitative data analysis with SPSS for Windows: A guide for social scientists. London, UK: Routledge.
  40. Cossin D,Caballero J (2013) Transformational leadership background literature review. IMD global board center.
  41. Cronbach, L (1951) Coefficient alpha and the internal structure of tests. Psychometrika 16: 297-334.
  42. Ferrer J (2020) Conflict management styles of secondary school principals and the relationship of organizational climate of the selected schools in Quezon City. European Academic Research 1: 5483-5503.
  43. Ghaffar A (2019) Conflict in schools: Its causes & management Journal of Managerial and Sciences 3: 212-227.
  44. Hadi S,Jawad H.(2019) Conflict Management According to the Thomas Model: An Exploratory Study in the Department of the Medical City in Baghdad. Journal of Arts, Literature, Humanities and Sociology 34: 247-266.
  45. Hammad Z (2019) The degree of effectiveness of organizational conflict management and its relationship to administrative empowerment among secondary school principals in Irbid governorate from the point of view of teachers, supervisors and principals themselves. Journal of the Islamic University for Educational and Psychological Studies 27: 603-631.
  46. Hareem H (2013) Behavior of individuals and groups business enterprises. Amman: Dar Al-Hamid for publication and distribution.
  47. Hussein S (2020) Management of organizational conflict in secondary schools from the point of view of faculty members. Iraqi University Journal 47: 446-460.
  48. Ibrahim T, Akbari S, Suaidah S (2022) Principal’s Behavior in Strengthening Teacher Innovation and Creativity During The Covid-19 Pandemic. Journal of Islamic Education Management 7: 116-124.
  49. Ilgan A (2020) Examining principals’ conflict management styles: a study of Turkish administrators. Bulletin of Education and Research 42: 1-16.
  50. Isik U, Sunay H,Cengiz R (2018) The Relationship between School Administrators’ In-House Communication and Conflict Management Strategies According to Physical Education Teachers’ Perceptions. Asian Journal of Education and Training 4: 266-271.
  51. Jaafara S (2013) Methods of managing organizational conflict and its relationship to administrative creativity among principals of public schools in Karak Governorate from their point of view. Studies, Educational Sciences 2: 1663-1687.
  52. Karimi A, Yektayar M, Nazari R, Mohammadai S (2013) Conflict Management Strategies of Sport Teacher and its Influence on Athletic Motivation of Schools in Gorgan City. European Journal of Experiment Biology 3: 420-424.
  53. Mahamid N.(2019) The degree of practicing organizational conflict management methods by middle school principals in the Northern Triangle region and its relationship to school performance from the teachers’ point of view. Journal of the Islamic University for Educational and Psychological Studies 27: 776-799.
  54. Mahasneh A,Al-Azmat O (2019) Conflict management strategies for school teachers in Qasaba Al-Mafraq district and its relationship to communication efficiency. The Jordanian Journal of Educational Sciences 15: 17-32.
  55. Mahasneh I (2013) Management and evaluation of job performance between theory and practice. Amman: Dar Jarir for publication and distribution.
  56. Momani, Wasel (2011) Organizational climate and conflict management in educational institutions. Amman: Dar Hamid for publication and distribution.
  57. Mthethwa J, Kutame A, Buthelezi A (2019) Female Principals And Conflict Management At Female-dominated Primary Schools In The Rural Areas Of Gingindlovu Circuit: The Perspectives Of Teachers. Gender and Behavior 17: 13585-13594
  58. Özyildirim G, Kayikçi K (2017) The Conflict Management Strategies of School Administrators While Conflicting with their Supervisors. European Journal of Education Studies 3: 1-20.
  59. Rahim M (2002) Towards a theory of organizational conflict. The International Journal of Conflict Management 13: 206-235.
  60. Saiti A (2015) Conflicts in schools, conflict management styles and the role of the school leader: a study of Greek primary school educators. Educational Management Administration & Leadership 43: 582-609.
  61. Shuwaihat S (2019) Methods of managing organizational conflict among principals of UNRWA schools in Jordan in the light of some variables. Studies Journal of Educational Sciences 46: 35-52.
  62. Tafvlin S (2013) The transformational leadership process antecedents Mechanisms, and outcomes in the social services. Sweden: Print & media.
  63. Yamane T (1967) Statistics, An Introductory Analysis. 2nd, New York: Harper and Row.
A Case Report of Dicephalus Parapagus Conjoint Twins: Declined Caesarean Section for Obstructed Labour; Fetal Death in Utero and Successful Vaginal Delivery

DOI: 10.31038/AWHC.2023632

Conjoint Twins

Conjoint twins result from monozygotic twins incompletely separated and born physically connected, and this occurs when an early embryo only partially separate to form two developing foetuses.

The Types of conjoint twin depends on when and where non-separation occurred. They are called Thoracopagus if non-separation occurred at the chest; Omphalopagus if it occurred in the abdomen, Pyopagus if it occurred at the base of the spine: Rachipagus if it occurred at the whole length of the spine; Ischiopagus if it occurred at the pelvis; Parapagus if it occurred at the spine and Craniopagus if occurred at the head [1]. Conjoint twins are rare, occurring in 1: 50,000-60,000 births and approximately 70 percent are females and mostly born stillbirths.

Case Report

We present a case of Dicephalus parapagus; conjoint twins with two separate heads. PA, is a 27 years old gravida 3, para 1+1 admitted in labour at a village health center after several hours of labour in a traditional birth attendant’s home. She is a housewife, moslem, educated to first school leaving certificate and she registered late for ante natal care with an unknown LMP as she couldn’t remember her last menstrual period nor could she afford a booking ultra-sound scan, so her gestational age was unknown.

On examination, her fundal height was term size; multiple fetal parts were felt and the babies were in cephalic presentation but no fetal heart activity was heard. Vaginal examination revealed a fully dilated cervix and the presenting part of the baby was at the pelvic spines without moulding but the obstruction was at the level of the pelvic brim, due to the second fetal head.

She was resuscitated with intravenous fluid. Blood investigations were arranged including group and save serum and she was prepared for an emergency caesarean section. She declined the operation of emergency caesarean section in spite of detailed explanation and persuasion involving the elderly relatives invited to speak with her including counselling from ourselves. She was weepy and said she will not have an ‘operation’ for a baby no longer alive.

It was concluded by the staffs to assist her as much as possible in her decision. A telephone consultation was made with an experienced Obstetrician who was able to guide the staffs to achieve a vaginal delivery without traumatic injury to her genital tract.

The Manouvre to Deliver the Dicephalus Parapagus Conjoint Twins

She was placed in the lithotomy position and the bladder was emptied. The Pelvic examination was repeated. The presenting head was in occipito-anterior position in a roomy pelvis. There was no caput or moulding and as the parturient was contracting about 3: 10 with involuntary pushing, the fetal head was becoming visible but disappears after every uterine contraction and bearing down. It was also observed that the second twin head descended simultaneously with the head of twin one, so conjoint twins or interlocking twins were suspected.

At the following contractions, she was asked to bear down with uterine activity. When the presenting head was in +2 position, an assistant was requested to put pressure on the second head in a downward and forward direction.

On the third attempt, the second head slipped into the pelvic cavity and the head of twin 1 crowned and it was delivered from a meconium-stained liquor after a medio-lateral episiotomy. The diagnosis of a conjoint twin was confirmed. It was a fresh stillbirth. The cord was clamped and the placenta delivered by controlled cord traction.

The blood loss was minimal with prompt suturing of the episiotomy. The lower genital tract was examined and found to be intact. The urine was clear of blood.

The twin had two heads joined at the neck, one trunk, two upper limbs one on either side and two lower limbs with meconium staining of the vernix caseosa covering her skin Figure 1.

fig 1

Figure 1: Vernix Caseosa

Discussions

Dicephalus parapagus is a rare form of conjoint twins with two separate heads and accounts for about 11% of all conjoint twins which was some time ago referred to as Siamese twins named after conjoint twin that survived to adulthood in Siam in Thailand with two heads and one body.

This parturient has no twining family history or use of medications with teratogenic side effects in early pregnancy. The gestational age at presentation was unknown because the LMP was unknown and no early scan was done.

Her first pregnancy was uneventful and she had a spontaneous vaginal delivery of a normal male child. The following pregnancy was a miscarriage at about 13 week’s gestation with no known cause.

On presentation there was no fetal heart activity detected using the Pinnard’s stethoscope so it was possible to deliver the baby as it was done so this method is not recommended for a viable baby.

The bladder was continuously emptied to prevent injury to it and to increase the pelvic capacity as a full bladder will be obstructive.

The size of the babies contributed to the successful outcome of the delivery as clinically the babies were preterm at about 32-34 weeks gestational size. Most conjoint twins are delivered by caesarean section except they are miscarriage as reported in literature of a 20 years old who delivered a conjoint triplet spontaneously in early pregnancy [2,3]. The normal vaginal delivery without surgical insult to the integrity of the uterus will prevent the risk of rupture of the uterus in subsequent pregnancy if she declines hospital delivery.

Conjoint twins warrant doing basic investigation like ultrasound scan in utero, total body x-ray or preferably a magnetic resonance imaging scan to determine the nature of the bony spine. These investigations were not done in this case as this happened in a rural setting.

References

  1. Conjoint Twins in Diseases & Conditions; Mayo Clinic Family Health Book; 5th Edition Dec. 16 2021.
  2. Ido Solt, Lowenstein L, Okopnik M, Sheinin O, Drugan A (2005) Malformed pygopagus conjoined twins in a spontaneous triplet pregnancy. Harefuah 144: 590-592. [crossref]
  3. Karn M, Mahato B, Sah P, Basnet A, Yonghang S, et al. (2021) Dicephalus parapagus conjoint twins. Clinical case reports 9: e04663. [crossref]

Efficacy and Safety of Low-Level Long-Wave Ultrasonic Stimulator for Dementia with Lewy Bodies and Parkinson’s Disease (Is the Dolphin Wave Effective for Neurodegenerative Diseases in the Brain!)

DOI: 10.31038/JCRM.2023622

Introduction

In 2004, we started research and development of a head ultrasonic stimulator and confirmed the safety in a non-clinical test. After that, we confirmed an increase in cerebral blood flow in humans, and proceeded to Phase 2 clinical trials. It will be planned to move to Phase 3 clinical trials. Kamiyama, Ltd. focused on the 30,000 Hz frequency band emitted by the dolphin and developed a head ultrasonic stimulator. It was developed based on the concept of vibrating capillaries and nerve cells with weak long-wave ultrasound.

The acoustic action frequency of medical equipment shall comply with JIS (Japanese Industrial Standards) T0601-2-5 (IEC 61689). “IEC 61689:1996, Ultrasonics-Physiotherapy requirements and methods of measurement in the frequency range 0.5 MHz to 5 MHz”. The ultrasonic frequency of the device is 30 KHz (0.03 MHz), which is non-standard ultrasonic. The wavelength in the body (simulated in water) is about 5 cm, and when stimulated from the forehead, it passes through the skull in 4-5 waves. The ultrasonic wave of 30 KHz have a low attenuation rate and is characterized by good penetration into the body. For capillaries and nerve cells of several micrometers, it is considered possible to vibrate with an energy of several microwatts/cm2. The ultrasonic intensity is approximately 1/100,000 or less of the intensity at which cavitation occurs.

It seems possible to transmit weak ultrasonic waves to capillaries and nerve cells in the brain without generating bubbles. It was confirmed that the device increases the cerebral blood flow with minute vibrations caused by approximately 7.2 million waves (pressure change) in 20 minutes of pulse stimulation.

The below are five papers on the efficacy and safety of non-clinical and clinical studies:

1) Sound Field Measurement in the Skull Model

The intensity of the sound generated in water by the 30 kHz ultrasonic transducer was 1/1,875 when compared with the maximum standard of JIS ultrasonic therapy equipment. In addition, the acoustic intensity in the skull model was 22 μW/cm2 or less, and the safety was confirmed.

2) Cerebral Blood Flow Promotion Effect

In clinical trial in healthy adults, the cerebral blood flow increased by approximately 10% to 15% after stimulation compared to before stimulation.

3) Clinical Trial for Patients with the Dementia with Lewy Body

In 12 patients, there was significant improvement in severity (NPI-Q) and Parkinsonian symptoms on the real device compared to the sham device.

4) Clinical Trial for Dementia Patients

Four patients with dementia with Lewy body and two patients with dementia of the Alzheimer’s type used the device for 12 weeks in combination with drugs. Improvements were shown on the NPI-Q and MMSE.

5) Report of one Case of Parkinson’s Disease Symptoms

The patient used the device in combination with medication. Improvements were observed in cognitive impairment and Parkinson’s symptoms, and the burden on caregivers was greatly reduced.

The Below are the Abstracts of Each Paper

1. The vibrator has a bimorph disk structure made of piezoelectric ceramics, and the vibrating energy is taken out from the center while the vibrator is held at the periphery [1]. The vibrating surface is made of ABS resin with a diameter of 28 mm (Figure 1), and is built into a hair band (Figure 2) and used in close contact with the head. Ultrasonic properties in medical devices are to be measured in water. The absorption of sound in water (in the body) is proportional to the square of the frequency, indicating that low frequencies propagate farther. The speed of sound propagating in the human body is approximately 1,500 m/s, which is equivalent to the propagation speed in water. The ultrasound frequency was set to 30 kHz, and the internal wavelength was 1,500 m/30 kHz=5 cm. The distribution of the sound intensity generated from the vibrating surface in water showed a conical shape (Figure 3), with a maximum of 1.6 mW/cm2 at the center of the vibrating surface. The transducer surface was a disk-shaped disk, and the average output from the emitting surface was 0.71 mW/cm2. Effective radiant power was obtained from the following formula. Effective radiant power=(radiating surface average power) x (radiating area)=(0.71 mW/cm2) x (n(1.4 cm)2)=4.4 mW. Acoustic distribution in the resin skull model was measured. The maximum output was simultaneously applied to the transducers attached to the outside of the frontal and occipital regions. Sound levels in the model were 3 μW/cm2 frontal, 22 μW/cm2 posterior foramen magnum, and 8 μW/cm2 occipital. The center area was mountain-shaped compared to the surrounding area, showing approximately five times the strength. When the acoustic vibration was applied to the skull, it was observed that it gathered in the brainstem.

fig 1

Figure 1: Vibrator

fig 2

Figure 2: Sound pressure distribution

fig 3

Figure 3: Wearing

2. We investigated the changes in cerebral blood flow using a transcranial weak ultrasonic vibration stimulator with high-penetration long-wave ultrasound (30 kHz, 2 mW/cm2 or less) [2]. Stimulation of only the frontal region showed an increase of about 10% in blood flow throughout the brain in the X-ray CT image of Xe gas (Figure 4). Approximately 15% increase in cerebral blood flow (Figure 5) was observed in SPECT images with combined stimulation from the frontal and occipital regions (Figure 6).

fig 4

Figure 4: Upper: Before, Lower: After

fig 5

Figure 5: L: Before, C: after R: difference

fig 6

Figure 6: Change rate of UPDRS-III (Total score)

3. A comparative clinical trial was conducted on 12 patients using the sham device and an actual device [3]. The primary endpoints were significant improvement in the severity of Behavioral and Psychological Symptoms of Dementia (NPI-Q) and caregiver burden (8 and 12 weeks later). As for the secondary endpoints, significant improvement was observed in the nursing care burden assessment Zarit-8 (Figure 7), and significant improvement was also observed in the cognitive function test “MMSE” (after 8 weeks). It also improved Parkinson’s symptoms associated with dementia with Lewy bodies. No adverse events were observed.

fig 7

Figure 7: Change rate of ZARIT8 (Total score)

4. A total of 6 cases of dementia with Lewy bodies (DLB) and 2 cases of Alzheimer Type Dementia (ATD) were used for a total of 12 weeks in a 12-week clinical trial. Mini-Mental State Examination (MMSE) was used for cognitive function evaluation, and Neuropsychiatric Inventory Questionnaire (NPI-Q) was used for BPSD [4]. As a result, in 6 cases of MMSE and 5 cases of NPI-Q, improvements in cognitive function, psychiatric symptoms, patient severity, and caregiver burden were confirmed.

5. A 12-week clinical trial was conducted on a patient with Parkinson’s symptoms (Stage 4) in combination with drugs [5]. It was effective in treating cognitive impairment and Parkinson’s symptoms, had a high immediate effect, and was able to reduce the burden on caregivers. Wheelchair-bound patients with strong Parkinson’s symptoms can now walk with assistance.

References

  1. Okano S, Shimotori Y (2015) Measurement of sound field of ultrasound massager for the head in skull model: Iiryo kiki gaku 85: 14-21.
  2. Okano S, Shimotori Y, et al. (2015) Changes of Cerebral Blood Flow by the Weak Trans-Cranial Ultrasound Irradiation in Healthy Adult Volunteers: Japanese Journal of Complementally and Alternative Medicine 12: 73-78.
  3. Manabe Y, Shimotori Y (2023) A clinical study on the efficacy and safety of the head ultrasonic stimulator Ultra-Ma for patients with clinically diagnosed dementia with Lewy bodies: Clinical Study Report.
  4. FujiiI H, Shimotori Y, et al. (2021) Reduction of dementia symptoms by weak transcranial ultrasound therapy. Japan Society for Dementia Prevention 11: 49-57.
  5. FujiiI H, Shimotori Y (2022) Effects of Transcranial Weak Ultrasonic Stimulation on Parkinson’s Symptoms – Consideration Focused on Cognitive Function Tests Japanese Journal of Complementally and Alternative Medicine 19.

Sustainable Management of Ecosystem and Control of Natural Secondary Disaster in Soil and Water Loss Regions

DOI: 10.31038/GEMS.2023534

Abstract

Water and soil resources are the foundation of Agriculture high-quality development. Water and soil loss is a serious natural secondary disaster and affects the redistribution of Water and soil resources and land productivity. Soil and water conservation influence high-quality development. After about one hundred years of efforts, soil and water conservation has developed rapidly, for example in China, the surface runoff and soil loss in soil and water loss areas have decreased rapidly. The people’s living conditions have gradually improved as economy and society development. Now, economy and society development enter a new time, people living level increase and put forward higher requirements for soil and water conservation because the current efficiency of soil and water conservation cannot meet people’s higher requirements. In this paper, a new theory of soil and water conservation developed. The results shows that soil and water losses refer to the process of transferring soil and water resources from one place to another, and the consequences of these losses can be divided into positive and negative effects on high quality development. Soil and water conservation is not only the use of some methods or measures to reduce soil erosion to soil allowable loss requirements, but also to make efficient use of soil and water resources. The construction standard of soil and water conservation measures must be based on the allowable amount of soil erosion and be applied using spatially optimal allocation, and the high-quality sustainable management of soil and water conservation should be made to ensure regional ecological security and realize the high quality and sustainable development of soil and water conservation.

Keywords

Soil and water loss, Soil and water conservation, Food and ecological security, Soil and water conservation measure, Most optimum distribution of resources, Sustainable development

Introduction

Neotectonic movement is tectonic change occurring in the Tertiary and thereafter, and is characterized by vertical and horizontal movement. Under the influence of many natural background factors, such as mountainous terrain and unstable monsoon precipitation, formed by intense neotectonic movement, as well as the long history of agricultural development and the large population, China has become one of the countries with the most serious soil erosion, notably on the Loess Plateau .Water and soil loss affects the carbon and nitrogen cycles of terrestrial ecosystems, vegetation ecosystem products and services, the ecological environment and economic development, and ultimately the quality of life and sustainable development of the public. Over the past 100 years, great progress has been made in the work of soil and water conservation in China with the unremitting efforts of the vast number of soil and water conservation workers. For example, as evidenced by the establishment of the State Key Laboratory of Soil Erosion and Dryland Agriculture in Yangling, China, the concept of cover degree and cover rate of water conservation forest has been developed [1,2]. The degree of vegetation coverage is the percentage of the total area covered by the vertical projection area of the tree canopies, and the vegetation cover rate is the proportion of high-quality grassland or forestland area of the total land area in a region or a country. The vegetation coverage includes the effective cover degree, critical degree, and potential coverage [3,4]. The establishment of a large area of soil and water conservation vegetation has been established in the area of in the area of soil and water loss region, such as water conservation forest (or vegetation), Windproof and sand-fixing forest, water source conservation forest, and adult forest construction standards and their construction scale and suitable developmemt scale have also been established; the effective coverage rate of wind-proof sand forest, of water conservation forest, and of water conservation forest [1-9], the theory of soil water resources utilization limit by plants and the soil moisture vegetation bearing capacity appeared in 2000 [3,4,9,10]. However, due to the lag in theoretical research, construction standards of soil and water conservation measures are low with small range of water conservation measures, the spatial allocation of soil and water conservation measures is unreasonable, the work of soil and water conservation attaches importance to quantity and not quality, and its efficiency is low, which cannot meet the modern needs of high-quality development of soil and water conservation. Such incidents as drought, forest fires, extreme weather and precipitation, hurricanes, and flash floods lead to widespread erosion of soil and water conservation vegetation, collapse of dams and other incidents, resulting in serious soil erosion, destruction of farmland, villages, roads, and vehicles, which affects transportation, food and ecological security, and cause large losses to the state and society. In order to overcome these difficulties, promote the high-quality development of soil and water conservation, and meet current requirements of the public for soil and water conservation, it is necessary to develop a new theory of soil and water conservation. Through comprehensive analysis of relevant literature, a new theory of soil and water conservation is proposed. The purpose of the paper is to better understand the new theory of soil and water conservation and carry out High-quality sustainable development of soil and water conservation. The main content as the followings [11].

Soil and Water Loss

Soil erosion is a natural phenomenon, and it originated in China as a technical term in the early 20th century [12], where it was applied to the Northwestern Loess Plateau [13]. The forces that cause soil and water loss are called external soil and water loss forces, including water, wind, temperature (freeze–thaw) and son on. The term erosion has long been used in geology, mostly to express the flattening due to external force, and soil erosion was first mentioned in the book of Kozmenko in 1909 [12]. It was then widely used and was introduced into China in the 1930s. Soil erosion refers to the whole process of soil and its parent material, as well as the destruction, stripping, transport, and deposition of surface components of the land under external forces such as hydraulic, wind, freeze-thaw, and gravity [12]. Water power is the force produced by the flow of water and wind is the magnitude of the force that air exerts on an object. Temperature is the measure of the average translational kinetic energy of the molecular motion, and is the collective expression of molecular thermal motion. At present, people’s understanding of water and soil loss is not uniform. It has been argued that soil erosion refers to the destruction and loss of soil and water resources and land productivity under the action of external forces, including surface erosion and soil erosion; most believe that water and soil loss is equivalent to soil erosion, i.e., soil erosion by hydraulic, wind, or gravity erosion, resulting in soil dispersion, transport, and accumulation processes. However, we are entering a new period. In order to promote the high-quality development of soil and water conservation in this new period, we should first unify the understanding of water and soil loss. The water and soil loss are the process of soil and water resources transferring from one place to another, which includes both generalized and narrow-sense soil erosion. Generalized water and soil loss refers to the process of carbon and nitrogen cycle, land productivity, and ecological environment change caused by the transfer of soil and water resources induced by external forces. Water and soil loss in the narrow sense is equivalent to soil erosion [14].

Consequences of Soil and Water Loss

The influence of Water and soil loss on high-quality development of soil and water conservation can be divided into positive and negative effects as follows:

Water and Soil Loss Leads to Decline or Even Loss of Soil Fertility and Land Productivity in the Water and Soil Loss Regions

The term soil fertility refer to the capability of soil to support plant production in agricultural contexts [15]. Serious water and soil loss will affect carbon and nitrogen cycles in agriculture ecological systems and result in surface soil thinning of fertile soil in the water and soil loss region, and decreases in cultivated land area, soil fertility, and crop [16].

Soil Erosion Affects People’s Daily Activities

Water and soil loss destroys house, farmland, roads, bridge and silts up rivers, lakes, and reservoirs, which affects People’s Daily activities. Floods, landslides, mudslides, and other serious soil erosion results in siltation of channels, lakes, and reservoirs.

Water and Soil Loss Pollution Water Quality and Affects Ecological Balance

Water and soil loss accelerates non-point source pollution. When heavy rain happens, strong surface runoff will pile up surface garbage into rivers, seriously affecting their water quality and irrigation. A typical example is the poor water quality of the Yangtze River.

Typhoons, Haze, Dust, and Dust Storms Affect People’s Health, Travel, and Social Activities

As the economy and society develops, people are increasingly interested in health, and travel and social activities are becoming more frequent, while typhoons, haze, dust-raising weather, and dust storms affect flights and road traffic, and seriously hinder people’s rapid travel and social activities.

Water and Soil Loss Accelerates the Formation of Unique Landforms and Promotes the Development of Eco-tourism

Soil and rock through hydraulic, wind, freeze/thaw, and joint action of other external forces form a number of magic, wonderful natural landscapes, which raise living standards and accelerate the high-quality sustainable development of eco-tourism. For example, there are some famous eco-tourism sites such as Keshiketeng stone array scenic spots in the northeast of Keshiketeng County, Danxia natural scenic spots in Yulin city, and Zhashui cave in the Qinling Mountains. Zhashui cave is the result of long-term dissolution of groundwater. Calcium carbonate in limestone forms micro-soluble calcium bicarbonate under the action of water and carbon dioxide. Because the limestone layer contains different lime quality with different erosion degrees, it is gradually dissolved and divided into independent, diverse, steep and beautiful peaks, and caves in a strange landscape, which promotes eco-tourism and local economic development. Hukou waterfall was a Hukou waterfall but now has become a tourist hot spot.

Water and Soil Loss Forms Silt Plains and Expands Land Area in Estuaries

A large amount of sediment is deposited in estuary areas, over time forming silt plains and expanding the land area, which increase nitrogen density in soil, soil fertility, land production, and carbon dioxide fixation; for example, Chongming Island at the mouth of the Yangtze River and the Huanghe Delta at the mouth of the Yellow River. Chongming Island was originally only a small sand dune and, as more sand was deposited, the sand dunes grew larger and became an island where fishermen lived.

Soil and water conservation workers should broaden their horizons, make best use of the advantages of water and soil loss and bypass the disadvantages of water and soil loss. Thus, they can meet the requirements of rapid and high quality economic and social development, especially to strengthen the prediction and prevention of serious soil erosion phenomena caused by typhoons and haze caused by strong winds, dust-raising weather, and sandstorms.

Soil and Water Conservation

Soil and water conservation refers to the use of certain measures and technologies to reduce the loss of soil and water to a certain goal, i.e., soil allowable loss, to make efficient use of soil and water resources in the process of water and soil loss and increase the ecological, economic, and social benefits of soil and water resources in the soil and water loss system to provide high quality products and services for social development and to maximize the safety of the life and property [14]. Soil and water conservation makes rational use of soil and water resources to achieve sustainable development. For example, introduction of flood irrigation with high sediment concentration to form high-quality farmland using water sources of rivers, lakes, and reservoirs in the sand area; drawing water by gravity or by machinery; washing sand dunes using hydraulic power, and carrying sand to positions to form high quality farmland, or using runoff and topography to promote eco-tourism, such as the Shapotou and Hukou tourist attractions in the Loess Plateau. Soil and water conservation measures can effectively conserve soil and water [17]. These measures include engineering measures, farming and biological measures for soil and water conservation. In the restoration of vegetation, natural forces can be used to restore vegetation in uninhabited areas; however, in areas where there is a population, artificial interference should be used to restore vegetation in order to create the vegetation ecosystem goods and services to meet the needs of human production and life. Over the past 100 years, with the unremitting efforts of the vast number of soil and water conservation workers, China has made great progress in its work on soil and water conservation. A large area of soil and water conservation vegetation has been established in water and soil loss areas, and a large number of reservoirs have been built; some water and soil conservation measures such as water and soil conservation projects including dams or levees have been set up along the tributaries of the Yellow River and other soil erosion areas, which have made great progress in controlling water and soil loss below the allowable amount and promoting regional economic development. However, due to the lag in theoretical research on soil and water conservation, the construction standard of soil and water conservation measures is low and imperfect, and the spatial allocation of soil and water conservation measures is not balanced. For example, silt storage dams for farmland buildings have played important roles in preventing floods, consolidating the return of farmland to forests or grassland, safeguarding ecological security and food security, and promoting the development of economy and social stability. However, in construction of silt storage dams, the problems of low-quality construction, serious disease-risk dam, and poor management of reconstruction, especially concerning the large number of small dams, have not received enough attention [18]. Therefore, it is urgent to strengthen the study of soil allowable loss on different underlying surfaces, formulate high quality and strict standards for soil and water conservation engineering and vegetation construction, and carry out spatial optimal allocation to obtain maximum soil and water conservation efficiency. The space optimal configuration is expressed by the spatial optimal configuration coefficient. Spatial optimal allocation coefficient indicates that, in a water and soil loss area or watershed, soil and water conservation funds or measures may have different allocation methods; these different allocation methods result in different soil and water conservation efficiency, i.e., different surface runoff and soil loss. The optimal allocation of space is the allocation that results in maximum soil and water conservation efficiency.

High-quality and Sustainable Management of Soil and Water Conservation

In order to achieve high-quality and sustainable development of soil and water conservation, it is necessary to implement high-quality and sustainable management of soil and water conservation measures, reduce or even eliminate unsafe traffic accidents and loss of life and money accidents caused by serious soil and water loss, reduce dam dyke damage and flood dam overturn caused by inadequate design, material fatigue, rodent damage and piping, and continue to achieve the maximum efficiency of soil and water conservation. The high-quality sustainable management approach for soil and water conservation includes: Based on the external forces of soil and water loss, the temporal and spatial changes of soil and water loss, and the requirements of residents, we should improve the anti-erosion standards of infrastructure such as homes, roads, Bridges, levees and DAMS, improve the design and construction standards of soil and water conservation measures, and optimize spatial allocation to avoid soil and water conservation from exacerbating ecological security. At the same time, the prediction of extreme weather such as sandstorm, tornado, heavy rainfall, earthquake and other geological disasters should be strengthened, and Beidou satellite, UAV and other monitoring equipment should be used to dynamically monitor key sites prone to geological disasters. The corresponding emergency plan for high-quality sustainable management of soil and water conservation should be formulated, and the emergency plan should be launched immediately in case of disasters. According to the theory of resource utilization limit and the theory of vegetation carrying capacity, the utilization limit of soil water resources and the vegetation carrying capacity of soil water in water shortage areas should be the limit of soil water resources utilization and the vegetation carrying capacity of soil water, and the high-quality sustainable management of soil and water conservation vegetation should be implemented to continuously obtain the maximum efficiency of soil and water conservation [14] to reduce loss of life and property.

Application Effect

Because of the large area of soil and water loss area, people’s understanding level of soil and water conservation is uneven, and the development of soil and water conservation work is unbalanced. In the areas with early understanding and high level of soil and water conservation, the new theory of soil and water conservation is practiced consciously to achieve high-quality sustainable development of soil and water conservation, and satisfactory results have been achieved. For example, we have been engaged in innovative research on soil and water conservation for many years, and carried out high-quality sustainable management of soil and water conservation vegetation for Caragana (Caragana Korshinskii) shrubland in the Guyuan experimental Station the semi-arid loess Hilly , Guyuan, China according to the theory of utilization limit of soil water resources and the theory of soil water and vegetation carrying capacity. In order to reduce soil water consumption in the dry season, the vegetation cover of Caragana Korshinskii forest should be kept at least 60% to ensure that the canopy coverage is not lower than the construction standard of soil and water conservation forest in the region. In the growing season, when the soil water resources in the soil depth ranged from land surface (0 cm) to maximum infiltration depth (290cm) decreased to the soil water resources utilization limit by plants of 212.7 mm, the plant water relationship entered the critical period of plant water relationship regulation. The end time of plant water relationship regulation is when the plant water relationship regulation period fails.

If plant density of soil and water conservation forest, expressed by goal tree species in the critical period of plant water relationship regulation is greater than soil water vegetation carrying capacity, timely plant water relationship regulation should be carried out according to the soil water vegetation carrying capacity, so as to ensure normal plant growth, prevent drought from leading to early deciduous leaves, dry shoot or death of caragana (Caragana Korshinskii ) before the rainy season, resulting in forest canopy intercession and disappearance, so as to continuously obtain maximum soil and water conservation efficiency. For the economic forest, such as red plum and apricot, firstly enlarge the tree pit and improve the quality of terrace according to local conditions, realize all the precipitation in situ infiltration, and reduce the soil and water loss to the allowable soil loss. At the same time, according to the local weather forecast, green house and high smoking at 1 meter above land surface measures were taken to prevent the damage of low temperature frost during the flowering and young fruit period in the period from late March to early May, and high efficiency cyhalothrin was adopted around May 20 to prevent the harm of eating worms. If the conservation density in the critical period of plant water relationship regulation exceeds the soil water vegetation carrying capacity, the plant water relationship in the critical period of plant water relationship regulation should be regulated first according to the right amount of leaf when the plant density is equal to the soil water vegetation carrying capacity, and then the vegetative growth and reproductive growth relationship should be regulated according to the right leaf amount in the carrying capacity and the leaf amount and quality fruit relationship to obtain the maximum yield and economic benefits, the income of red plum and apricot mu can reach more than 10,000 yuan [14]. Since 2017, the national high-quality red plum apricot demonstration base has been established on hilly land to demonstrate and promote high-quality production methods of red plum and apricot (Figure 1).

fig 1

Figure 1: solar Power Plant (Dengkou, right photo)

After the founding of New China, Gao Zuyu, the secretary of Gaoxigou Village, Mizhi County, Yulin City, China,under the guidance of Mr. Tao Ke, carried out comprehensive management of soil and water conservation, such as silting dam, terraced fields and forest and grass vegetation construction. After years of continuous efforts, Gaoxigou Village has built a barren mountain gully with broken surface, serious soil and water loss into terraced mountain tops, pine and cypress contiguous pieces, soil loss is lower than the allowable soil loss, and efficient use of water and soil resources. Gaoxigou cultivated organic apples, e-commerce helps to develop ecological tourism, walk a variety of management. In 2020, the per capita income is 18,851 yuan, far exceeding the county’s average level (5,834 yuan), becoming a typical example of high-quality sustainable development of soil and water conservation in the area. The government of Hangjin Qi built diversion sluices, diversion channels, ecological levees, and drainage sluices connected with the main trunk channel to divert water from the Yellow River into the Kubuqi Desert and back water into the Yellow River. More than 200 million cubic meters of water were diverted in total, reducing runoff, sediment and siltation in the middle and lower reaches of the Yellow River, and forming a surface area of nearly 20km2 and an ecological wetland of nearly 60km2 in the Kubuqi Desert. Plants grow well, some water birds come to roost here, let the desert into an oasis wonder, aroused the attention of all countries, the diversion of water and sand control law let the world imitate.

State Power Investment Group Beijing Electric Power Co., Ltd. innovatively put forward the concept of “photovoltaic sand control and ecological restoration”. The Dengkou Industrial Park Management Committee of Bayannur City, Inner Mongolia cooperated with the State Power Investment to build the Dengkou photovoltaic sand control project. It not only reduces exposure to sunlight under photovoltaic solar panels and near-surface wind speed, promotes plant growth, and achieves good desertification control effect, but also obtains green and clean energy, which achieves good effect, as shown in the Figure. It is currently promoted in Gansu, Ningxia, Tibet, etc. Build wind power stations in tuyere areas to reduce wind and sand hazards [14]. The establishment of high-standard construction and water and soil conservation projects in soil erosion areas can not only avoid the harm of soil erosion, but also achieve good ecological, economic and social benefits, such as high-standard Hani terraces, e Guanyin Ge in Building in Yangzi river, Ezhou, Hubei Province, Dujiangyan and contemporary Three Gorges Dam, which have continuously given full play to the comprehensive benefits of flood control, irrigation, water transportation and social water use for two thousand years [14]. On the contrary, in the areas without the guidance of the new theory of soil and water conservation and the implementation of high-quality sustainable management, once encountered hurricanes, sandstorms and rainstorms, there will be serious dam collapse, dam collapse, flood destroyed houses, roads and farmland, and other serious events affecting high-quality development, resulting in the destruction of civil houses, roads, levees and storage DAMS. Car scrapping, human casualties and other serious events, such as in 2021 in many European countries, the United States and China’s Henan, Shanxi and Shaanxi provinces serious flood disaster. In 2022, severe soil and water events occurred in many parts of China, such as shaanxi, Shanxi and Henan province and Pakistan in 2022.

Acknowledgment

This project was supported by the National Key Research & Development Plan (Project No: 2016YFC0501702) and the National Natural Science Foundation of China (Project Nos: 41271539 and 41071193). We thank International Science Editing (http://www.internationalscienceediting.com) for editing the English language in the manuscript.

Competing Financial Interest Statement

There are no competing financial interests

References

  1. Guo ZS (1998a) Difference and relationship between vegetation cover degree and cover Rate. Journal of Soil Erosion and Soil and Water Conservation 4: 119-119.
  2. Guo, Z.S. & Den J.M.2009. Review on effective coverage rate of soil and water conservation forest. Soil and Water Conservation in China 4: 29-31.
  3. Guo ZS (2000a) Three cover degree in soil and water conservation vegetation construction: Potential cover degree, effective cover degree and critical cover degree. Soil and Water Conservation in China 4: 30-31.
  4. Guo ZS (2000b) Three cover degree in soil and water conservation vegetation construction: Potential cover degree, effective cover degree and critical cover degree. Bulletin of Soil and Water Conservation 20: 30-31.
  5. Guo ZS (1996) Research on the effective cover rate and its determination method for soil and water conservation. Forest 2: 67-72.
  6. Guo ZS (1997) Preliminary study on effective cover rate of soil and water conservation forest. Journal of Northwestern Forestry College 12: 97-100.
  7. Guo ZS (1998b) Area mergement and functional conversion coefficient among different forest category. Forestry Science and Technology Newsletter 4: 21-22.
  8. Guo ZS (1999) Three major problems in forest and grass plantation construction in Loess Plateau. Journal of Soil Erosion and Soil and Water Conservation 5: 72-75.
  9. Guo ZS (2000c) Target and quality criterion of vegetation construction for soil and water conservation in Loess Plateau. Bulletin of Soil and Water Conservation 20: 53-58.
  10. Guo ZS (2014) Theory and practice of soil water carrying capacity for vegetation. Chinese Science Press 1-104: 216-241.
  11. Cao BS, Zhu CX, Gao JX, et al. (2019) Ecological security assessment method and its application.Journal of Ecology and Rural Environment 35: 953-963.
  12. Guan JW (1996) Principles of soil and water conservation. Beijing China. China Forestry Press, 1-3.
  13. Li m., Zhang C.Y., Wang HY (2019) Study on soil and water conservation stage in Loess Plateau. Study on Soil and Water Conservation Stage in Loess Plateau SWCC. (2): 1-4.
  14. Guo ZS (2022) New theory of Soil and Water Conservation. Soil and Water Conservation 1: 64-69.
  15. Chen S, Lin B, Li Y, Zhou S (2020) Spatial and temporal changes of soil properties and soil fertility evaluation in a large grain-production area of subtropical plain. China Geoderma 357.
  16. Wolka K, Mulder J, Biazin B (2018) Effects of soil and water conservation techniques on crop yield, runoff and soil loss in Sub-Saharan Africa: A review. Agricultural Water Management 207: 67-79.
  17. Zhao J, Yang Z, Gerard Govers (2019) Soil and water conservation measures reduce soil and water losses in China but not down to background levels: Evidence from erosion plot data. Geoderma 337: 729-741.
  18. Fu WT, Zhang XY (2019) Suggestions for dam construction and risk control in Loess Plateau were paid attention. China Science Newspaper 8 November 2019, ScienceNet.