Monthly Archives: September 2019

Frustration in Seeking Information about Health Conditions and Health Insurance: Methodological Presentation of a Mind Genomics Cartography

DOI: 10.31038/ASMHS.2019343

Abstract

The paper uses the emerging science of Mind Genomics to understand emotional responses (frustration) and prevention of decisions experienced when the respondent reads test vignettes describing websites which provide medical information (health) and/or medical insurance information (health-related finances). Respondents read and evaluated combinations of 2–4 messages (answers to questions), with the messages combined according to an experimental design. The ratings on a five- point scale provided an assessment of both estimated ‘frustration’ and estimated ‘difficulty to make a decision.’ The analysis related the presence/absence of the messages to both frustration and to inability to make a decision. Three mind-sets emerged, suggesting that the estimated frustration encountered in difficult web searches for healthcare information is not unidimensional. The three emergent mind-sets are: MS1 (moderate latent frustration), MS2 (little latent frustration but easily & strongly frustrated) and MS3 (a great deal of latent frustration, doing best with a very simple, direct search process). The paper concludes with the presentation of the PVI, personal viewpoint identifier, which allows the healthcare provider to understand the sensitivities of the prospect, in terms of what problems increase frustration for that prospect. The objective of the PVI is to improve the user experience by understanding the mind of the user.

Introduction

The use of the Internet for searching and finding health information is rising and is accompanied by the realization that the ‘experience’ itself must be made easier. We are no longer in the birthing years of the 1970’s – 1990’s, when simply having access to a large world of information sufficed, astonishing those who had grown up in a world where information was to be sought after, no matter what the difficulty [1]. Experts have been replaced by websites, by chat advisors, by guided searches, so much so that often there is no expert but rather guidance embedded in the software and the instructions emerging from the software. People often first search the internet for information about diseases, then talk to their friends, and then encounter the doctors [2]. For diseases such as cancer, in earlier days a death sentence for many has spawned an entire network of communications and information [3–5]. The same goes for diabetes [6] and for heart disease [7]. As a consequence, medical information, may be getting increasingly dense over time as medicine advances and the literature and alternative options become overwhelming, for example the “BELONG” community of cancer patients [8]. Much of this this transition and new world is contained within the words ‘user experience,’ a phrase which encompasses the range from one’s impression of the website to one’s experience with the website to achieve certain goals. In the previous generations of science this area would have been subsumed under the rubric ‘man-machine interaction’ in the world of ‘human factors.’

This paper focuses specifically on one aspect of the user experience, the source for diagnosis and treatment information, both in terms of medical information and in terms of medical coverage information. The objective is to quantify the important of different aspects of the search as they drive expected frustration and expected inability to make a decision [9]. A traditional strategy to obtain the information is by a guided interview. The research instructs respondents to answer questions about needs, asks about sources of frustration, and experienced challenges in choosing an answer. The study would also measure responses when participants are exposed to the actual information and instructed to make a decision. Our approach complements this typical study just described. Our experiment presents respondents with vignettes defining the situation and instructs the respondents to select the likely outcome based upon the description of the experience. The analysis deconstructs the response to these vignettes into the contribution of the different elements of the vignette as drivers of expected frustration.

Mind Genomics as an emerging science traces its history to a combination of statistics (experimental design [10] conjoint measurement as ways to study decision-making [11, 12]. Mind Genomics expands topics from the laboratory out to everyday life. Furthermore, Mind Genomics expands the capabilities of design of experiments, using individual permutations of a basic, fundamental design. The consequence is that one need not overthink the selection of combinations of elements to go into the design. The permutation covers a wider amount of the space, analogous to the way the MRi in medicine takes many pictures of underlying tissue, not just the ‘correct one’, which may not even be known [13,14] The result has been the creation of a new science with applications from policy to products, from law to health and everyday life [15,16].

Mind Genomics method

Mind Genomics approaches the problem by an easy to construct, easy to analyze experiment. The experiment comprises a topic (sources of frustration and choice prevention during the search for medical information on the Internet), a set of four questions which ‘tell a story’ (the Socratic approach), and then requires four simple answers to each question, or a total of 16 answers. The Mind Genomics paradigm is designed to be fast, iterative, provide optimal results, and powerful results terms of a measure of the ability of each answer to ‘drive’ the response, a measure of conscious judgment, as well as measuring response time, a metric which reflects deeper cognitive processing or emotions.

The set of four questions and the 16 answers, four answers to each question, appears in Table 1. The objective is to work with untrained respondents, over the Internet, requiring that the answers be simple, direct, and easy to comprehend. The questions in Table 1 never appear in the test stimuli. Rather, the test stimuli comprise simple vignettes, combinations of the answers, 2–4 answers for any vignette. Each vignette has at most one answer from a question, but for many of the vignettes one or two questions do not contribute an answer. This design structure is deliberate, for statistical reasons, specifically to increase the strength of the analytic tool, OLS (ordinary least-squares) regression.

Table 1. The four questions and the four answers to each question

Question 1 – Stage of Life

A1

Current disease

A2

Time since diagnosis

A3

Stage of disease

A4

Transition in life

Question 2 – Reason for search

B1

Make best decision

B2

Make best decision considering health

B3

Make best decision considering my situation

B4

Make best decision for my future

Question 3 – Reactions to information presented

C1

Information is relevant but hard to understand

C2

Have to do multiple searches before making a decision

C3

Information is scattered – frustrates me

C4

Information doesn’t seem trustworthy

Question 4 – Information Wanted

D1

Looking for: specific rates

D2

Looking for simple way to contact and get answers

D3

Looking for specific services

D4

Looking for process

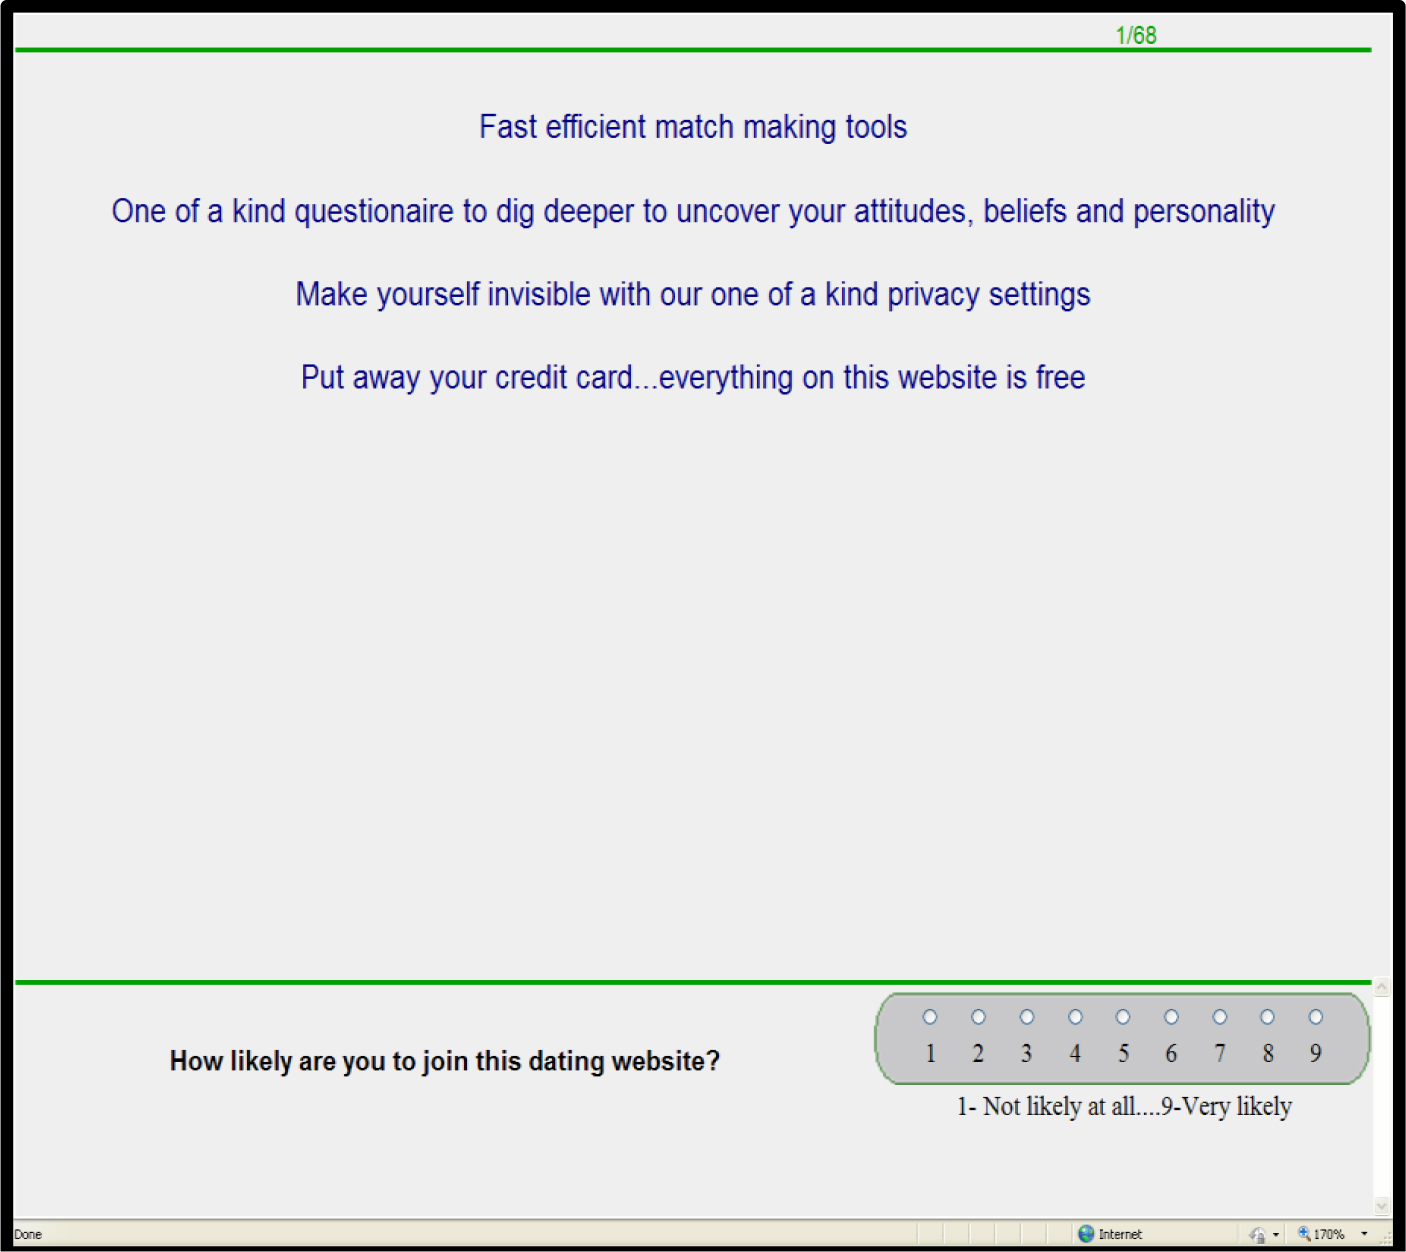
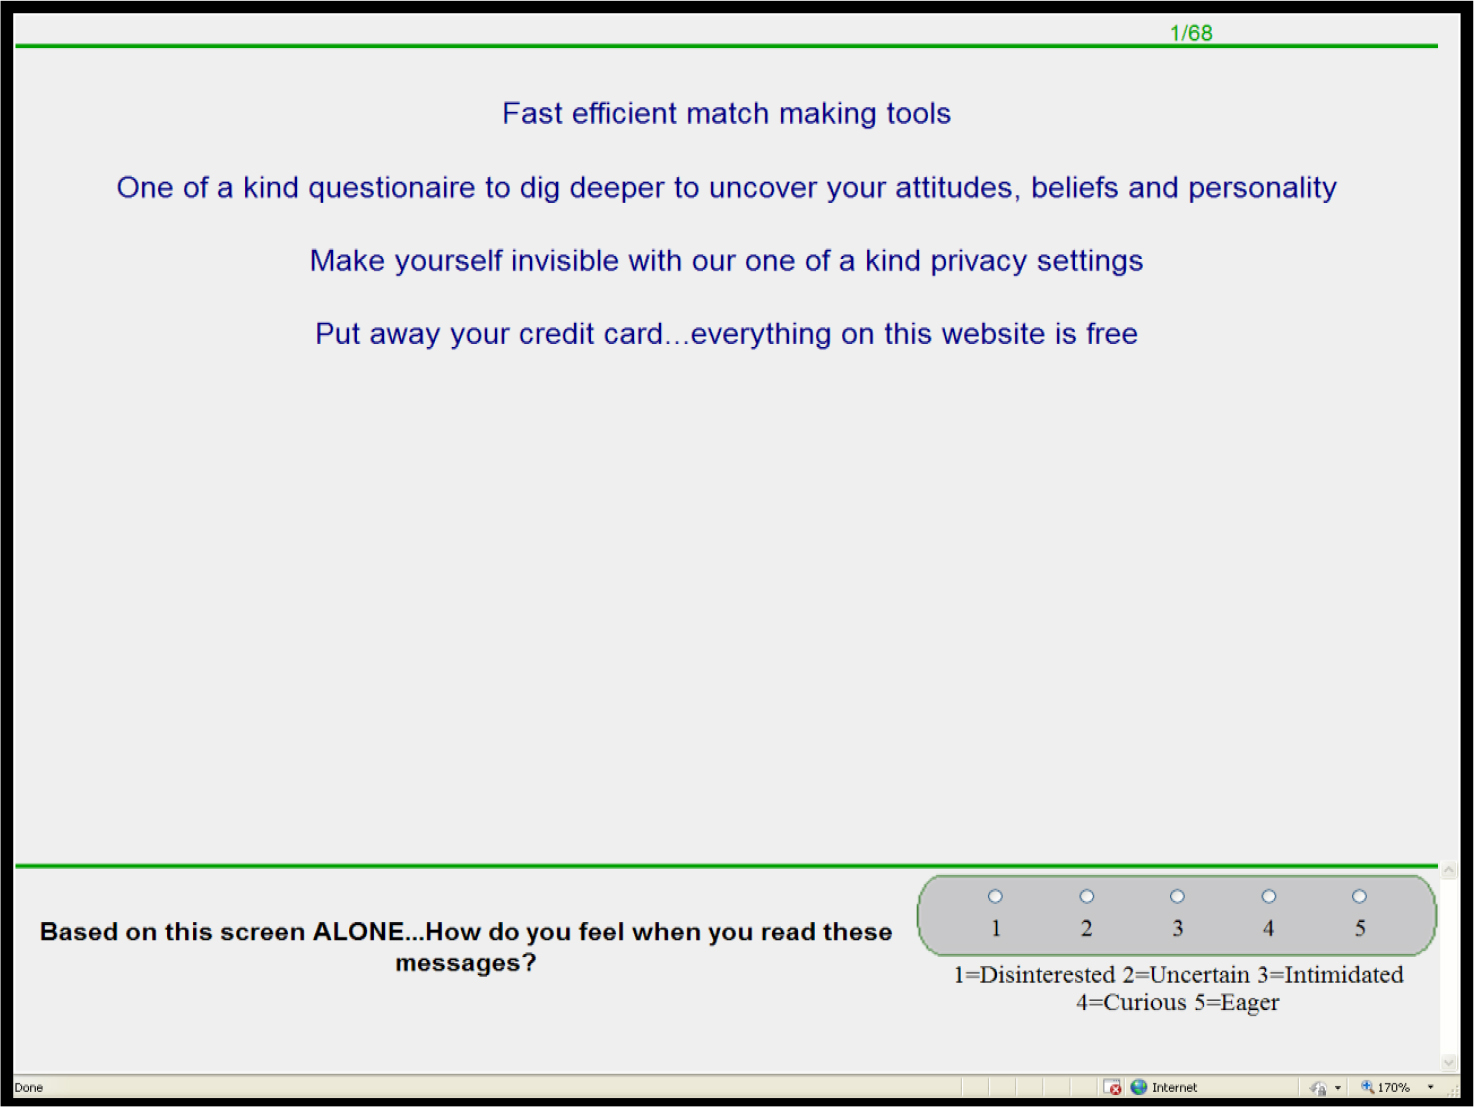
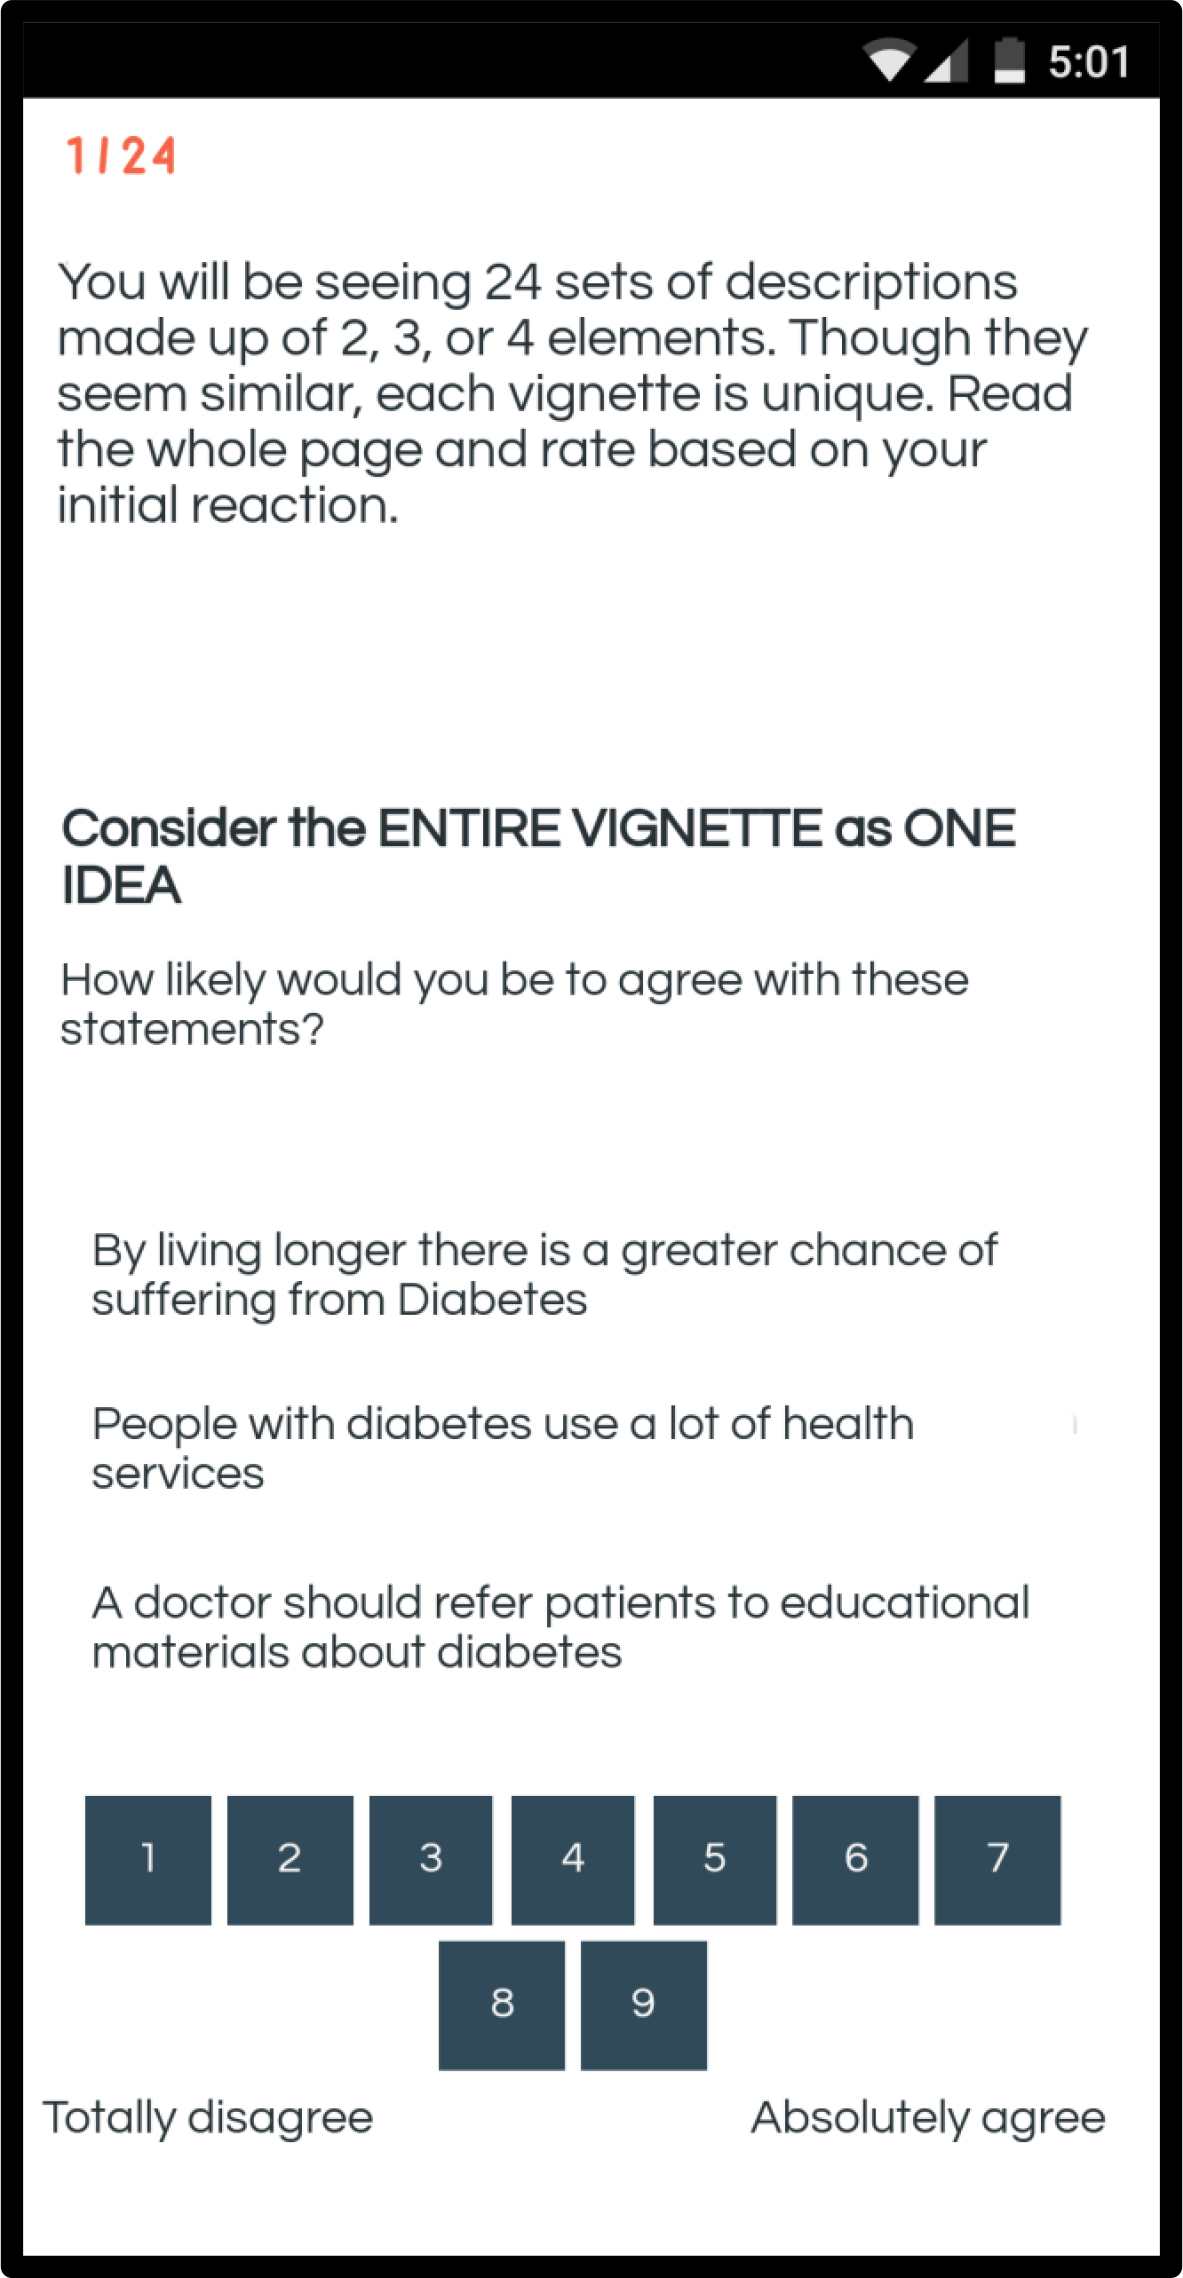
Figure 1 (left panel) shows the screen shot requiring the researcher to ask four questions. Figure 1 (right panel) shows one question, and the four answers to that question. The answers should be stand-alone phrases that can be understood, in and of themselves. The set-up system for Mind Genomics thus encourages critical thinking, and in the end, a deeper understanding of the topic by combining this thinking with affordable, rapid experimentation among prospective customers.

Mind Genomics-027 - ASMHS Journal_F1

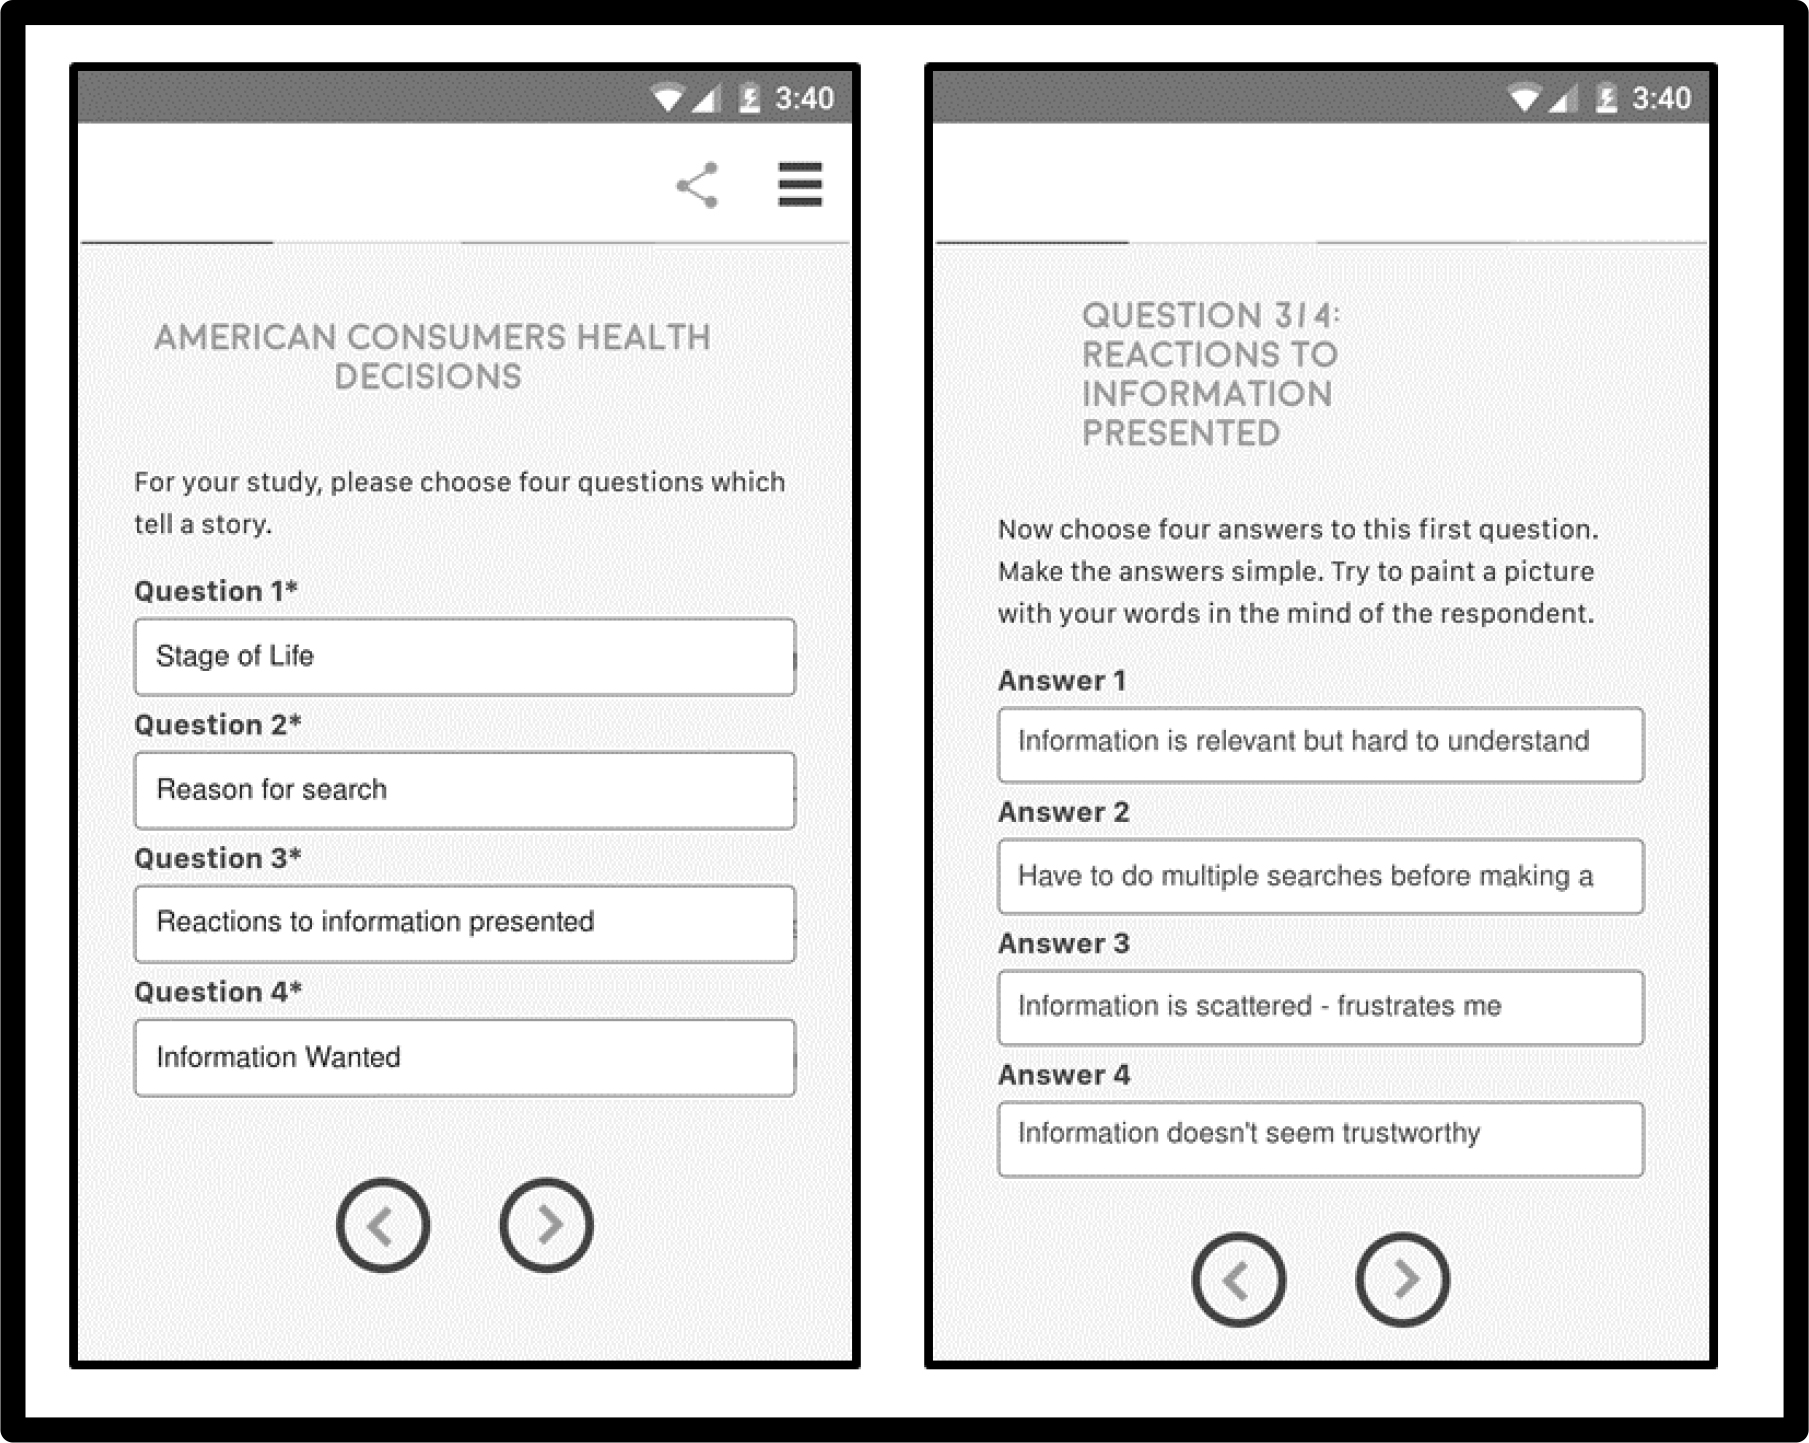
Figure 1. Screen shots from the set-up of the study. The left panel shows the four questions. The right panel shows the four answers provided by the research to question 3

Experimental design

Each respondent evaluated a unique set of 24 combinations or vignettes. Each vignette comprised 2–4 elements or answers, no more than one answer from any question. The answers were stacked atop each other. The experimental design ensures that for each individual the 16 answers appear several times, and an equal number of times. The incompleteness of the design, with some vignettes absent one or two answers, ensures that the OLS (ordinary least-squares) regression will run without any problem. When the researcher requires each vignette to contain exactly one answer or element from each question, a very common practice, the sad, actually destructive outcome is that the OLS regression can return only with relative values for the coefficients, not absolute values, the cause being the multi-collinearity among the elements due to the requirement that each vignette be ‘complete’ with exactly one answer from each question.

Statistical analysis

The rating scale comprises five points, covering two dimensions, frustration and inability to make a decision. The actual rating scale appears below

Please read the experience below about a person searching for medical information about medical insurance plans. Select which of the following phrases describe the feeling

 1=no problem
2 =not frustrated … Easy to make decision
3=not frustrated … Hard to make decision
4=frustrated … Easy to make decision
5=frustrated … Hard to make decision

We create four variables from this single scale, as follows:

The two ‘negative outcomes’

Frustrate YES (abbreviated as Frust YES) – when the rating is 4 or 5, we code this new variable, Frustrate YES, as 100. Otherwise we code Frust YES as 0.

Decide NO (abbreviated as Dec NO) – when the rating is 3 or 5, we code this new variable, Decide NO, as 100. Otherwise we code DEC NO as 0.

The two ‘positive outcomes’

Frustrate NO (abbreviated as Frust NO) – when the rating is 1,2 or 3, we code this new variable, Frust NO, as 100. It should be obvious that Frust NO is the inverse of Frust YES

Decide YES (abbreviated as Dec YES) – when the rating is 1, 2, or 4, we code this new variable, Dec YES, as 100. Otherwise we code it as 0. Again, Dec YES is the inverse of Decide NO.

The experimental design enables us to run models, at the level of the individual, relating the presence/absence of the 16 elements or answers to either the two negative outcomes, or to the two positive outcomes, respectively. The analysis pools all the data from the relevant subgroup, and runs one entire or ‘grand’ models. The analysis will, however, run individual-levels models for the mind-set segmentation, discussed below in the section on mind-sets.

The equation relating the presence/absence of the 16 elements to the ratings (positive or negative outcome) is expressed by the simple equation: Specific Outcome = k0 + k1(A1) + k2(A2) … k16(D4)

The additive constant, k0, shows the estimated value of the variable (e.g., Frust YES), in the absence of elements. Of course, all vignettes comprised 2–4 elements by design, so that the additive constant is an estimated value. It can be considered the baseline, the estimated percent of the time one is expected to hear that there a negative or positive experience, even without information about what exactly was presented.

The response time is defined as the time in seconds (to the nearest tenth of second) between the time that the vignette appears on the screen and the time that the respondent assigns a rating. The computer program measures that time. The response time model is written almost in the same way, but without the additive constant. We interpret the model as telling us the estimated number of seconds that the respondent spent ‘processing’ the specific element. The response time is a so-called objective measure, not under the control of the respondent. The respondent may not even be aware of the processing.

Total panel

Table 2 shows the parameters of five models relating the presence/absence of the 16 elements/answers from the four questions to response time (fifth data column) and to four “NET” ratings, those ratings talking about frustration (Frust YES, Frust NO), and those talking about the ability to make a decision (Dec YES, Dec NO). The table is arranged to show the elements which drive the negative outcomes (Frust YES, Dec NO), then the response time, and then the elements which drive the positive outcomes (Frust NO, Dec YES).

Table 2. Parameters of the models relating the presence/absence of the 16 elements to the NET negative and the net positive outcomes respectively, as well as to response time

NET Negative
Outcome

NET Positive
Outcome

Total

Frust Yes

Dec No

Response Time

Frust No

Dec Yes

Additive constant

20

52

 NA

80

48

C3

Information is scattered – frustrates me

38

10

1.2

-38

-10

C4

Information doesn’t seem trustworthy

19

15

1.3

-19

-15

C1

Information is relevant but hard to understand

16

16

1.5

-16

-16

D3

Looking for specifics

10

-4

1.8

-10

4

C2

Have to do multiple searches before making a decision

9

1

1.7

-9

-1

A1

Disease

4

-10

1.1

-4

10

A4

Time since diagnosis

0

-9

1.3

0

9

A2

Stage of disease

4

-9

1.1

-4

9

A3

Current Life stage: Transition

1

-7

1.0

-1

7

D2

Looking for simple way to contact and get answers

1

-2

1.7

-1

2

B2

Make best decision considering health

4

-1

1.7

-4

1

D1

Looking for prices and rates

5

-1

1.7

-5

1

B4

Make best decision for my future

-2

0

1.8

2

0

D4

Looking for process …how to ….

6

0

2.0

-6

0

B1

Make best decision

-2

1

1.7

2

-1

B3

Make best decision considering my situation

1

2

1.9

-1

-2

We begin with the additive constant, which gives us a sense of the percent of responses that will be assigned the NET rating in the absence of elements. Of course, all of the vignettes were created according to an experimental design which prescribed 2–4 elements per vignette, making the additive constant a purely calculated parameter. Nonetheless, the additive constant gives us a sense of a baseline response.

The additive constants for the two negative and the two positive outcomes are the following:

Negative: Frust Yes = 20
Negative: Dec No = 52
Positive: Frust No = 80
Positive: Dec Yes = 48

We conclude that there in general, people don’t feel that they are frustrated with the websites giving information (additive constant = 20 for Frus YES versus additive constant = 80 for Frust NO). In contrast, people feel that they cannot make a decision based upon the website (additive constant = 52 for Dec NO versus additive constant = 48 for DEC Yes).

Five specific answers or elements strongly frustrate the five frustrating elements are:
Information is scattered – frustrates me
Information doesn’t seem trustworthy
Information is relevant but hard to understand
Looking for specific answers
Have to do multiple searches before making a decision

Of these, three lead to aborting the decision
Information is scattered – frustrates me
Information doesn’t seem trustworthy
Information is relevant but hard to understand

Response time tells us additional information, namely the degree to which respondent think about the answer
Looking for process … how to…
Make best decision considering my situation
Looking for specifics
Make best decision for my future
Have to do multiple searches before making a decision
Looking for simple way to contact and get services
Make best decision considering health
Looking for: specific rates
Make best decision
Information is relevant but hard to understand

How problems interact with solutions

A key benefit of the permuted experimental design is the ability to assess the nature of the interaction between pairs of elements [13]. The approach is called scenario analysis. The scenario analysis holds a single element constant from one question, and estimates the coefficients of all elements or answers from the other questions.

The method of scenario analysis was applied to determine how the elements or answers to Question D, information wanted, interacted with the remaining elements. As will be seen in this analysis, the interactions can be dramatic. Depending upon the specific type of information wanted, some elements may be seen to frustrate not at all, or turn around and frustrate a great deal.

The process followed these steps for the first dependent variable, the negative outcome Frustrate YES

  1. Sort the 1200 records into five strata, based upon the specific element or answer from Question D. Question D contribute either no answer to a vignette, or one of four answers. We sort the database into the five strata.
  2. For each stratum, we estimate the additive constant and the 12 coefficients, A1-C4. We do not use the elements or answers from Question D because they are either absolute, or held constant.
  3. The results appear in Table 3 for the dependent variable being Frustrate YES, i.e., the combination of answers where the respondent said she or he would be frustrated, whether or not the respondent would make a decision.
  4. We begin with the additive constant, which is very low when there is no information wanted (additive constant = 18). The basic frustration is highest (additive constant = 35) when the respondent is presented with the task of ‘looking for process how to file the claim.’
  5. An element can be alternately not frustrating or very frustrating, depending upon what one is searching for. Consider element C2 (Have to do multiple searches before making a decision.) When the respondent is looking for information (specific rates or simple way to get services), there is no frustration. Multiple searches do not lead to much frustration. When the issue specific and concrete (e.g., specific coverage or process to make a claim), the multiple searches becomes frustrating.
  6. The scenario analysis provides the researcher with a new tool to understand how pairs of elements interact with each other. The researcher need not incorporate specific interactions ahead of time. Rather, the permutation of the underlying experimental design leads naturally to the emergence of interactions, and an easy way to discover them.

Table 3. Scenario analysis showing how the combination of specific elements with elements from the fourth question (information-wanted) drives Frustrate YES

Question 4: Information Wanted


Frustrate YES

none

Looking for: specific rates

Looking for simple way to contact and get services

Looking for specific coverage

Looking for process how to file claim

D0

D1

D2

D3

D4

Additive constant

18

27

23

26

35

C3

Information is scattered – frustrates me

69

26

30

41

35

C4

Information doesn’t seem trustworthy

45

8

19

20

14

C1

Information is relevant but hard to understand

44

1

11

18

18

C2

Have to do multiple searches before making a decision

19

1

-3

25

9

B2

Make best decision considering health

7

10

-2

7

-6

B1

Make best decision

4

-1

3

7

-23

B3

Make best decision considering my situation

-5

3

9

-1

-9

A2

Current disease

-9

11

6

3

-5

A1

Current disease stage

-14

9

6

-2

8

A3

Time since diagnosis

-16

4

4

-1

2

B4

Make best decision for my future

-17

3

0

-5

9

A4

Current Life stage: Transitioning

-25

14

0

2

-3

We now turn to the second dependent variable, the negative outcome of No Decision Made. The results appear in Table 4. The pattern is radically different.

Table 4. Scenario analysis showing how the combination of specific elements with elements from the fourth question (information-wanted) drives Decision NO

Question 4: Information Wanted


Decision NO
(no decision made)

none

Looking for: specific rates

Looking for simple way to contact and get services

Looking for specific coverage

Looking for process how to file claim

D0

D1

D2

D3

D4

Additive constant

22

40

40

72

59

C4

Information doesn’t seem trustworthy

34

20

10

-2

17

C3

Information is scattered – frustrates me

26

17

7

-6

5

B1

Make best decision

24

7

-7

-13

7

B3

Make best decision considering my situation

21

6

-8

-14

12

C1

Information is relevant but hard to understand

19

40

17

-2

8

B4

Make best decision for my future

15

4

-6

-2

2

B2

Make best decision considering health

14

5

-8

-5

-3

A3

Current disease

5

-3

18

-16

-28

C2

Have to do multiple searches before making a decision

3

2

9

-15

12

A2

Current disease stage

-3

-13

13

-17

-12

A4

Time since diagnosis

-3

-13

9

-9

-28

A1

Current life stage: Transitioning

-12

-4

1

-8

-16

  1. The greatest basic likelihood of no decision is ‘Looking for specific coverage’ (additive constant = 72.) The next highest likelihood of no decision is ‘Looking for process how to file a claim’ (additive constant = 59). The remaining two elements (Looking for specific rates and Looking for simple way to contact and get answers) show lower additive constants, 40 each. The take-away from this initial finding is that the likelihood of no decision is a function of what people are looking for, with the most problematic being specifics. The website should concentrate on example of specific services, or a way to provide a rate.
  2. When there is no task, the additive constant is low (22) but many of the elements drive the decision. The most severe is ‘information doesn’t seem trustworthy’ but there are many other elements which strongly drive ‘No Decision.’
  3. There are specific interactions which make intuitive sense, such as Looking for simple way to contact and get answers (D2) coupled with Current disease stage (A3). We might not immediately think of that, but the data reveals the interaction, and suggests that we pay attention to that possible problem combination.

We now turn to the third and final dependent variable, response time. As noted above, response time does not measure a cognitively meaningful response to the vignette such as Frustrate YES, Decide NO, but rather the length of time required for the respondent to process the information in the vignette, and assign a rating. The equation does not have an additive constant, because without any elements there is no predisposition to respond. Furthermore, our focus is on the effect of one of the four searches, D1-D4. We consider only four strata, each stratum fixing one of the four search goals.

Table 5 shows the parameters of the models. The response times are quite long for the individual elements, often longer than 2.3 seconds, the cut-off level beyond which the cell is shaded, and the numbers in bold text. The interactions are different across the four answer for Question D, ‘Information Wanted.’

Table 5. Scenario analysis showing how the combination of specific elements with elements from the fourth question, information-wanted, drives Response Time

Information Wanted (Question 4)


Response Time

Looking for: specific rates

Looking for simple way to contact and get services

Looking for specific coverage

Looking for process how to file claim

B2

Make best decision considering health

2.9

1.7

1.7

1.8

B1

Make best decision

2.5

2.7

1.8

1.8

A1

Current disease stage

2.3

1.1

2.0

2.0

B3

Make best decision considering my situation

2.2

2.9

2.1

2.3

B4

Make best decision for my future

2.0

2.7

1.4

2.8

C1

Information is relevant but hard to understand

2.0

2.3

2.7

2.4

C2

Have to do multiple searches before making a decision

1.9

2.1

2.9

2.2

C3

Information is scattered – frustrates me

1.6

1.6

2.8

1.8

C4

Information doesn’t seem trustworthy

1.6

1.9

2.2

2.6

A4

Time since diagnosis

1.8

1.5

1.9

2.8

A3

Current disease

1.8

1.5

1.4

1.7

A2

Current disease stage

1.6

1.4

1.4

1.7

Looking for: specific rates
Make best decision considering health
Make best decision
Current disease stage

Looking for simple way to contact and get answers
Make best decision considering my situation
Make best decision
Make best decision for my future
Information is relevant but hard to understand

Looking for specifics
Have to do multiple searches before making a decision
Information is scattered – frustrates me
Information is relevant but hard to understand

Looking for process …. how to….
Current disease stage
Make best decision for my future
Information doesn’t seem trustworthy
Information is relevant but hard to understand
Make best decision considering my situation

Key subgroups

The ability to have each respondent evaluate the precise array of vignettes makes it easy to the researcher to look at different groups of respondents, and at the same time be assured that the pooled data will both maintain the statistical independence need for OLS regression, and cover a large proportion of the design space.

We begin again with the net attribute, Frustrate YES. The additive constant shows dramatic group to group differences in the basic likelihood to say ‘frustrated’ when presented with the vignette ‘without elements’ (see Table 6). When we compare the additive constant with the net attribute, Decide NO, we find radical differences. There is a very wide range of basic levels of frustration, as shown by the additive constant, whereas a much narrower range in the basic inability to make a decision.

Table 6. Additive constants for group-based models relating the presence/absence of the 16 elements/answers to both the Net Attribute ‘Frustrate YES’ and the Net Attribute ‘Decide NO’

Frustrate YES

Decide NO

Frustrates


Age: 60 Plus

26

50

Age: 30–49

24

60

Life stage: Family

23

58

Gender: Female

23

52

Age: 23–20

21

40

Retards Decision


Life stage; Retire

18

66

Age: 30–49

24

60

Life stage: Just graduated college

1

60

Neither


Gender: Male

18

54

Age 50–59

5

54

Table 7 shows the parameters of the models by each subgroup for Frustrate YES

Table 7. Group models relating the presence/absence of NET Variable Frustrate YES to the 16 elements

Net Frustrate YES
(Frustrates Me)

Male

Female

Age 23–29

Age 30–49

Age 50–59

Age 60+

Just graduated

Family

Retire

CONSTANT

18

23

21

24

5

26

1

23

18

C3

Information is scattered – frustrates me

28

48

28

45

37

36

17

51

23

C4

Information doesn’t seem trustworthy

14

24

15

25

9

24

15

29

17

D3

Looking for specifics

14

7

-2

13

13

16

17

12

12

D1

Looking for rates

13

-2

-12

8

8

14

30

1

22

C1

Information is relevant but hard to understand

10

22

7

13

19

29

19

17

9

A1

Current life stage: transitioning

8

0

10

7

7

-14

17

2

5

A3

Current disease

8

-6

3

6

-2

-11

18

2

-3

D2

Looking for simple way to contact and get services

7

-6

-8

3

10

-5

16

-6

-4

D4

Looking for process how to file claim

7

5

-13

6

15

12

13

3

14

C2

Have to do multiple searches before making a decision

5

13

3

14

7

7

10

12

3

A4

Time since diagnosis

4

-5

-5

1

9

-11

18

-5

-1

B2

Make best decision considering health

2

7

5

3

5

5

-1

7

7

A2

Current disease stage

1

8

1

1

16

-2

12

11

10

B1

Make best decision

1

-4

0

-5

-4

11

11

-8

14

B3

Make best decision considering my situation

-4

4

6

-7

4

9

2

-6

8

B4

Make best decision for my future

-4

0

6

-6

1

0

1

0

4

Among the most frustrating elements are
Information is scattered – frustrates me
Information doesn’t seem trustworthy

Table 8 shows the parameters of the model by each subgroup for Decide NO

Table 8. Group models relating the presence/absence of NET Variable Decide NO to the 16 elements

Net Decision NO
(Prevents me from making a decision)

Male

Female

Age 23–29

Age 30–49

Age 50–59

Age 60+

Just graduated

Family

Retire

Additive constant

54

52

40

60

54

50

60

58

66

C4

Information doesn’t seem trustworthy

12

18

15

9

18

27

0

16

19

C1

Information is relevant but hard to understand

13

19

9

13

15

25

-2

16

25

C3

Information is scattered – frustrates me

7

13

11

-3

21

22

-9

11

8

C2

Have to do multiple searches before making a decision

-1

3

6

-7

-2

20

-9

-5

14

B1

Make best decision

-6

8

2

-6

5

12

-9

-3

8

B3

Make best decision considering my situation

-4

6

-8

2

-3

9

-3

-2

-5

B4

Make best decision for my future

-2

1

5

-5

2

3

5

-4

-7

B2

Make best decision considering health

-4

2

5

-12

12

0

4

-5

-7

A2

Current disease stage

-9

-9

-8

-11

-8

-7

-15

-6

7

A4

Time since diagnosis

-3

-15

-13

-5

-16

-7

-7

-15

6

A1

Current life stage: Transitioning

-4

-15

-8

-11

-13

-8

-8

-15

0

D1

Looking for specifics

-3

0

-4

3

-5

-11

9

2

-12

D2

Looking for simple way to contact and get answers

-3

-2

8

-3

-2

-11

-5

5

-9

A3

Current disease

-2

-12

-3

-11

4

-15

-12

-11

4

D4

Looking for process… how to…

0

-1

7

2

4

-15

6

5

-19

D3

Looking for specifics

-7

-3

-7

1

-4

-19

8

-1

-17

Among the elements which hinder decisions are
Information doesn’t seem trustworthy
Information is relevant but hard to understand
Information is scattered – frustrates me

The older respondents (age 50–59 and age 60+) are the most likely to report frustration or inability to make a decision.

The youngest respondents, report that they are frustrated, but they say that they can make a decision. This is an important fact. It appears that frustration may be an emotional reaction whereas decision may be a simple action.

Mind-Sets in the population based upon how easily a person is frustrated in the search

A key feature of Mind Genomics is the extraction of new-to-the-world mind-sets, based upon how the person thinks with regard to the specific topic. During the past sixty years, consumer researchers have recognized the value of dividing people by patterns, either of WHO they age (geo-demographics), what they DO (behavior), or how they THINK about general topics [17].

The notion that people differ from each other is obvious but it is not clear that one can know exactly WHAT TO SAY to a person when one knows WHO they are, what they DO, or what they BELIEVE. One could make the case, of course, that one knows certain things that one should say, but what are the precise words, the precise communication messages for a person, say in the world of health information? How does one know what to say to a person on the web, or the next person who walks in the door?

It is tempting to believe that the general segmentations based upon previous behavior will indicate what to say. The answer is not clear. Behavioral targeting is all the rage today, as of this writing (August, 2019), but it is not clear that a person who asks for rates about a health service will answer every message. The words must be correct. The sensitivity to the mind of the patient must be tuned. And, most of all, one must ‘know’ what words to do, what actions to take, not so much in the grand world at so-called 20,000 feet, where the detail is lost, but rather ‘on the ground’ in granular detail.

Mind Genomics works in the world of the concrete, the world of daily experience, the world of specific words and phrases. The studies in Mind Genomics are not posed as questions to be answers, but as vignettes to which one reacts. This structure eventuates in the above-demonstrated set of coefficients. Segmentation, in turn, becomes the identification of different and meaningful patterns of coefficients, and therefore ‘mind-sets.’ The ‘mind-set’ is a coherent pattern of coefficients, with each respondent in the study assigned to one of the mind-sets, based upon the pattern of that individual’s coefficients.

For this study, the discovery of the mind-sets was based upon clustering of individuals using the coefficients from Frustrate YES, i.e., individual patterns of getting frustrated. Frustration is a basic emotion among people, especially those who search for necessary information. The process follows these steps:

  1. Array the coefficients for Frustrate ME so that each row is a respondent, and each respondent has 16 numbers, one for each coefficient. The additive constant is not used for the cluster analysis.
  2. Cluster the respondents using K-means clustering [18]. so that individuals close together are clustered together. The measure of distance is (1-Pearson R), with Pearson R taking on the value of +1 when two patterns are identical (distance = 0) and with Pearson R taking on the value of -1 when two patterns are diametrically opposite (distance = 2).
  3. The objective of clustering and segmentation is to find a meaningful division of respondents, based upon specific criteria. Clustering is a heuristic in exploratory data analysis, not a hard-and-fast system, although the mathematics are stringent and reproducible.
  4. Compare the two-cluster and three-cluster solution. Choose the solution with the lower size only when it is easy to interpret. For these data, the three-cluster solution was easier to interpret, but interpretation is a subjective matter.
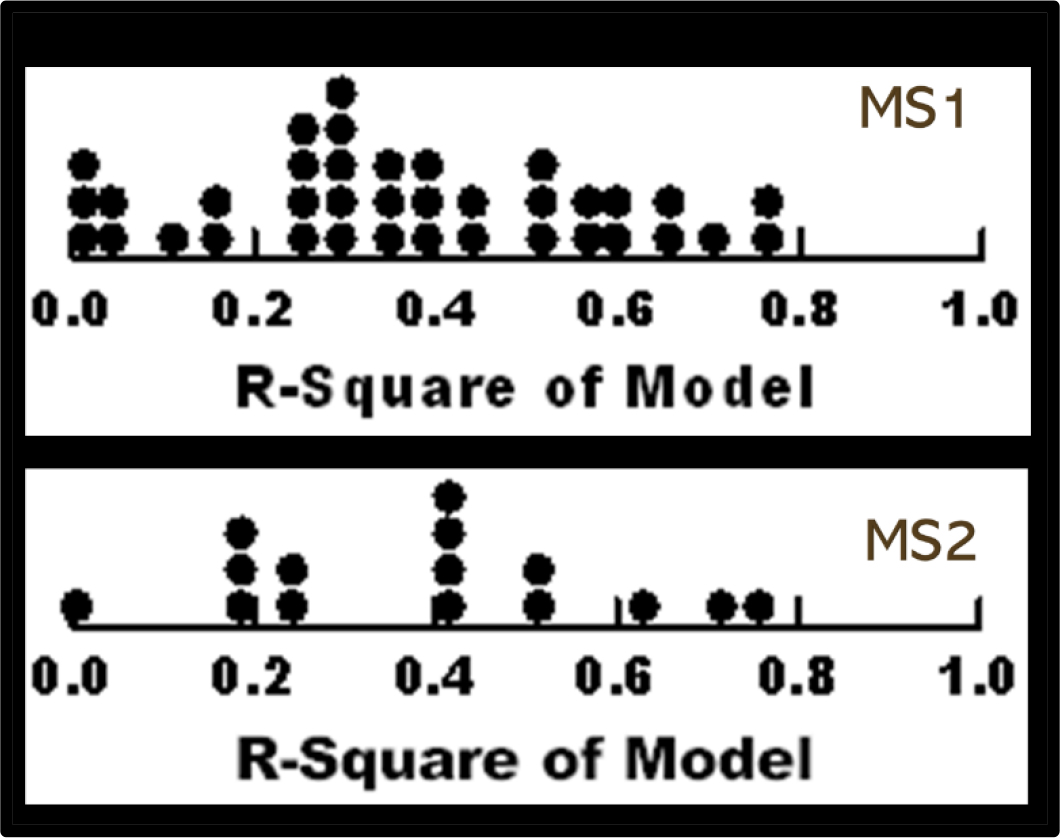
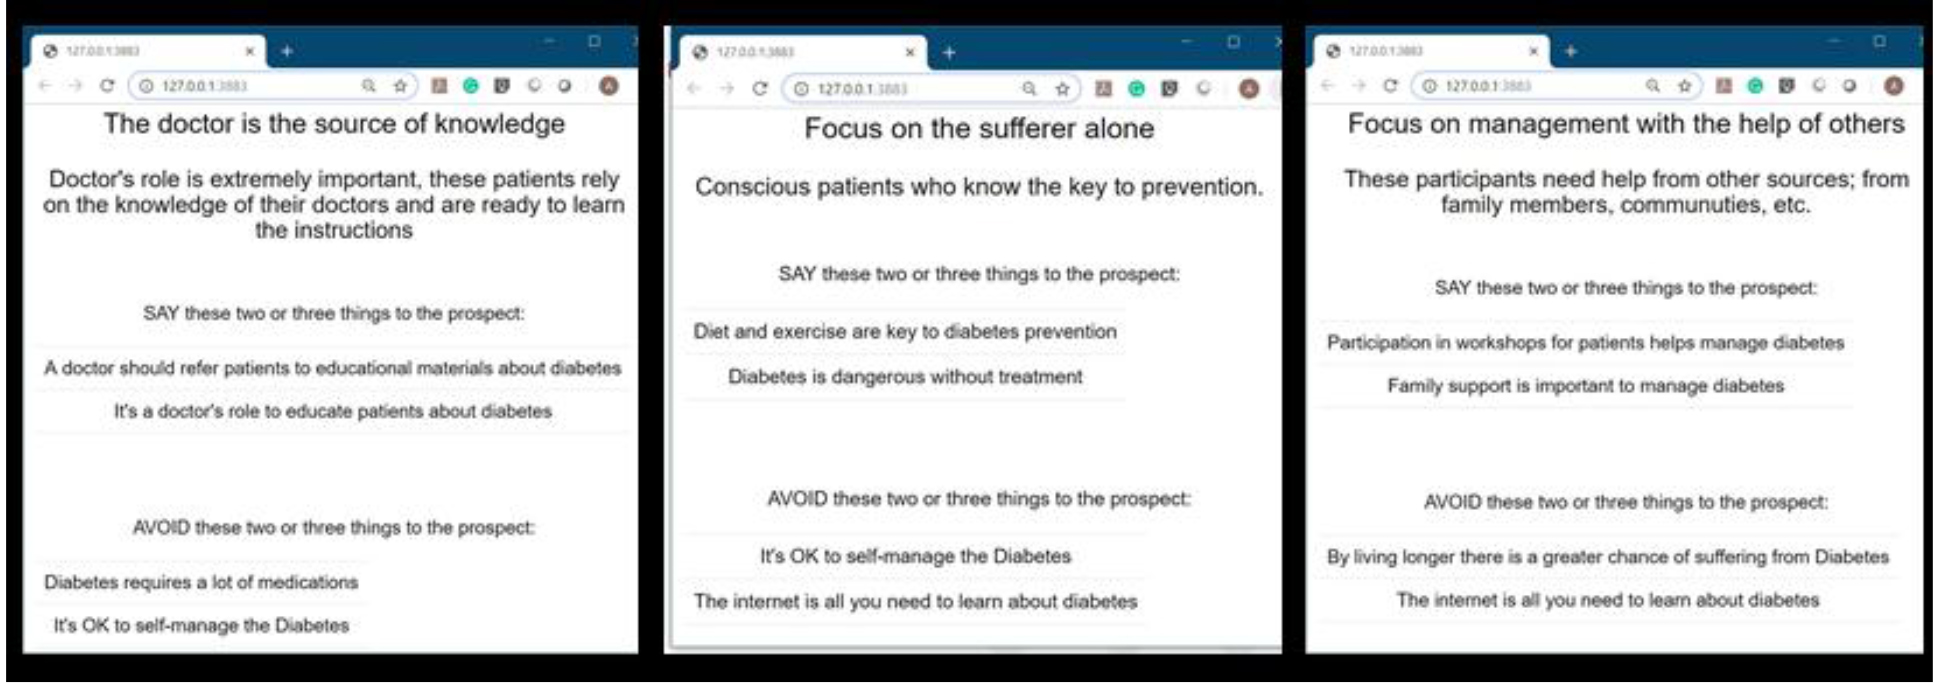
  5. Three mind-sets emerged from the clustering. The clustering program does not label these, but rather the naming of the mind-is left to the researcher. The typical naming considers the strongest performing elements, and in this study, the additive constant. Table 9 presents the strongest performing elements for each of the three mind-sets.

Table 9. How three emergent mind-sets based on what drives ‘Frustrate YES) respond to the elements in terms of the segmenting criterion, Net Frustrate YES


Net Frustration (Frustrate YES – basis of the clustering)

MS1

MS2

MS3

Additive constant

24

3

35

Mind-Set 1 – Has some latent frustration, but gets really frustrated when search is difficult

C3

Information is scattered – frustrates me

46

63

3

C4

Information doesn’t seem trustworthy

25

35

-3

Mind-Set 2 – Has very little latent frustration, but easily and strongly frustrated

C3

Information is scattered – frustrates me

46

63

3

C4

Information doesn’t seem trustworthy

25

35

-3

C1

Information is relevant but hard to understand

13

34

0

Mind-Set 3 –A lot of latent frustration, wants search to be simple, direct, give the information, gets frustrated when process is not simple, direct (KISS)

D2

Looking for simple way to contact and get answers

-9

-5

21

D3

Looking for specific service

11

4

20

D1

Looking for rates

17

-11

17

D4

Looking for process …how to…

6

1

10

B2

Make best decision considering health

-3

8

9

B4

Make best decision for my future

-17

-1

8

Elements which do not strongly drive frustrations among the mind-sets

B3

Make best decision considering my situation

-7

7

1

A1

Current life stage: Transitioning

8

3

1

B1

Make best decision

-12

2

1

C2

Have to do multiple searches before making a decision

15

17

-4

A3

Current disease

13

-3

-7

A2

Current disease stage

-2

19

-9

A4

Time since diagnosis

12

-1

-11

Mind-Set 1 – Has some latent frustration, as shown by the modest additive constant, 24. Mind-Set 1 gets really frustrated when the search is difficult. The latent frustration emerges from the relatively high additive constant of 24. The two strongest elements drive a high degree of frustration

Information is scattered – frustrates me
Information doesn’t seem trustworthy

Mind-Set 2 has almost no latent frustration (additive constant = 3), but also easily frustrated, and strongly so. The same two elements drive Mind-Set 2 compared to Mind-Set 1, only far more.

Mind-Sets 1 and 2 may be combined to generate a general mind-set which simply wants easy answers, in general.

Mind-Set 3 is altogether different. Mind-Set 3 exhibits quite strong latent frustration (additive constant = 35, wants search to be simple, direct, give the information, gets frustrated when process is not straightforward. Here are the strongest frustrating elements for Mind-Set 3:

Looking for simple way to contact and get answers
Looking for specific service
Looking for rates

When we apply the mind-sets just discovered for frustration to blockers of decision (Net Decide NO), we find that Mind-Sets 1 and 2 are similar in terms of their propensity not to decide (additive constant 58 and 60) whereas Mind-Set 3 is less hindered (additive constant 42.). Mind-Set 3 is more of a perfectionist, with B1 (make best decision) a source of failure to make a decision. Table 10 shows these results.

Table 10. How three emergent mind-sets based on what drives ‘Frustrate ME) respond to the elements hindering a decision (Net Decide NO)


NET Decide NO

MS1

MS2

MS3

Additive constant

58

60

42

C4

Information doesn’t seem trustworthy

20

12

16

C1

Information is relevant but hard to understand

17

12

22

C3

Information is scattered – frustrates me

-5

14

19

B1

Make best decision

-9

1

9

C2

Have to do multiple searches before making a decision

-8

3

7

B3

Make best decision considering my situation

-1

-3

4

D1

Looking for rates

-5

-3

2

A3

Current disease

-9

-14

2

D2

Looking for simple way to contact and get services

-4

-6

1

D3

Looking for a specific service

-7

-10

1

B2

Make best decision considering health

-10

3

0

A4

Time since diagnosis

1

-25

0

D4

Looking for process … how to…

6

-3

-2

B4

Make best decision for my future

6

-4

-2

A1

Current life stage: transitioning

-4

-22

-3

A2

Current disease stage

-6

-14

-6

When we move to response time, we find dramatic differences.

Mind-Set 2, which showed the least latent frustration (additive constant = 3), also shows the longest response times. That is, Mind-Set 2 reads everything closely.

Mind-Sets 1 and 3 both show a high level of latent frustration (additive constant = 24 for Mind-Set 1 and additive constant = 35 for Mind-Set 3.). These two mind-sets show shorter response times, consistent with their latent frustration. Mond-Set 3 appears to consider the information in a slightly deeper way than does Mind-Set 1, because its response times are slightly longer.

Finding these mind-sets in the population (The Personal Viewpoint Identifier)

A continuing result from Mind Genomics studies is mind-sets distribute in the population in ways that are unexpected. Everyday experience with the different services suggests that there are different mind-sets or preference patterns for various services. The value of a conversation with a health provider (boot, chat or live) is obtained through the personalization using tailored messaging.

Table 12 suggests that who a person IS does not correspond to the mind set to which the person belongs.

Table 11. How three emergent mind-sets based on what drives ‘Frustrate YES) respond to the elements in terms of Response Time


Response Time – To process information

MS1

MS2

MS3

D3

Looking for specific services

2.0

2.0

1.3

B3

Make best decision considering my situation

1.9

2.5

1.3

B4

Make best decision for my future

1.7

2.3

1.3

D2

Looking for simple way to contact and get answers

1.3

2.2

1.3

B2

Make best decision considering health

1.2

2.2

1.4

D4

Looking for process… how to …

1.9

2.1

1.8

D1

Looking for: specific rates

1.4

2.0

1.5

B1

Make best decision

1.2

2.0

1.8

C2

Have to do multiple searches before making a decision

1.7

1.7

1.6

A4

Time since diagnosis

0.4

1.7

1.8

C4

Information doesn’t seem trustworthy

1.2

1.6

1.1

A3

Current disease

0.4

1.6

0.8

C1

Information is relevant but hard to understand

1.1

1.5

1.9

C3

Information is scattered – frustrates me

1.1

1.5

1.2

A2

Current life stage: transitioning

0.6

1.3

1.2

A1

Current disease stage

0.8

1.2

1.2

Table 12. Distribution of mind-sets across geo-demographics and disease stage

Mind-Set 1 – Has some latent frustration, but gets really frustrated when search is difficult 

Mind-Set 2 – Has very little latent frustration, but easily and strongly frustrated 

Mind-Set 3 –A lot of latent frustration, wants search to be simple, direct, give the information, gets frustrated when process is not simple, direct 

Total

Total

14

19

17

50

Gender 

Male

10

6

10

26

Female

4

13

7

24

Age

Age 23–29

1

3

3

7

Age 30–49

10

6

6

22

Age 50–59

2

6

4

12

Age 60 Plus

1

4

4

9

Life Stage

Graduate College

3

0

3

6

Family

8

10

4

22

Retired

1

2

4

7

No Answer

2

7

6

15

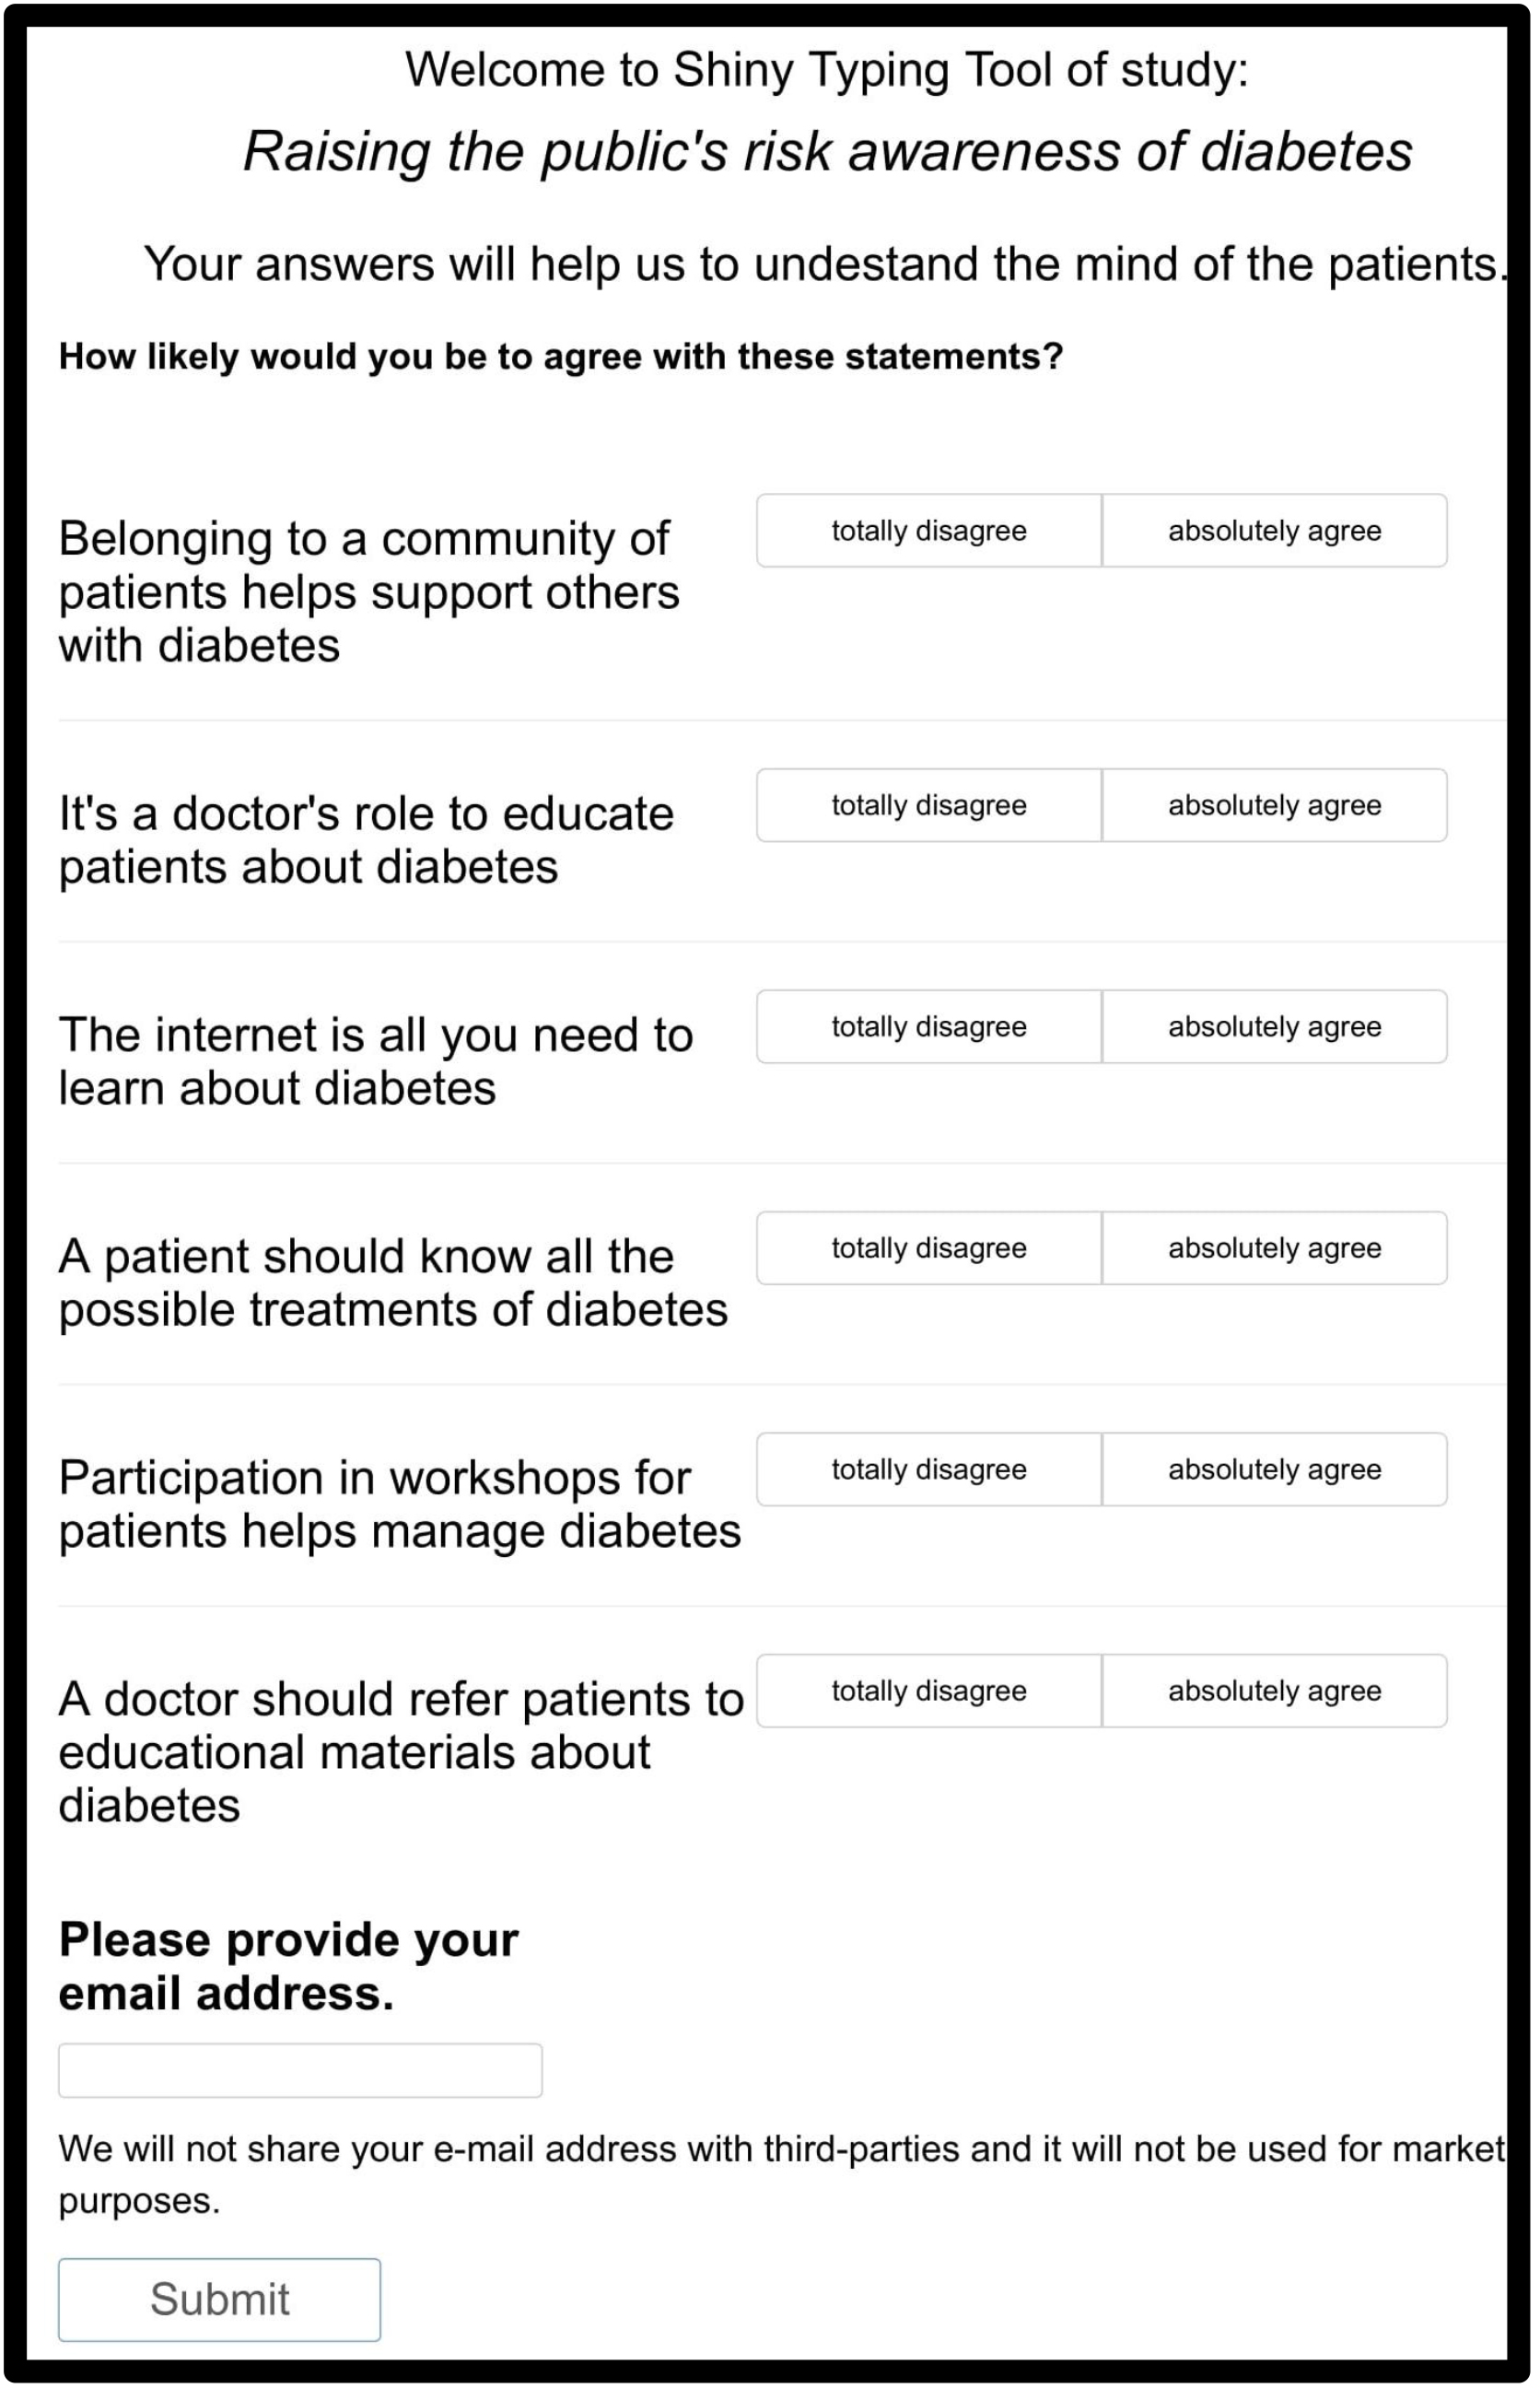
During the past several years authors Gere and Moskowitz have developed a set of simple algorithms based upon the coefficients of corresponding elements emerging from the clustering program. Either all or just a limited number of the elements need to be used, but at least eight elements are required. The algorithm uses a Monte-Carlo method to identify those elements which best discriminate between two mind-sets or across three mind-sets, when ‘noise’ is added to the data. The algorithm has been labelled the PVI, the Personal Viewpoint Identifier. The PVI works with individual respondents, identifying their mind-set, and where relevant, returning information to them, either information which is informative, prescriptive, or both. Figure 2 shows an example of the PVI. The PVI returns with the mind-set of the respondent and may provide the respondent or the health maintenance organization with additional information in terms of feedback. The PVI takes approximately 30 seconds to administer.
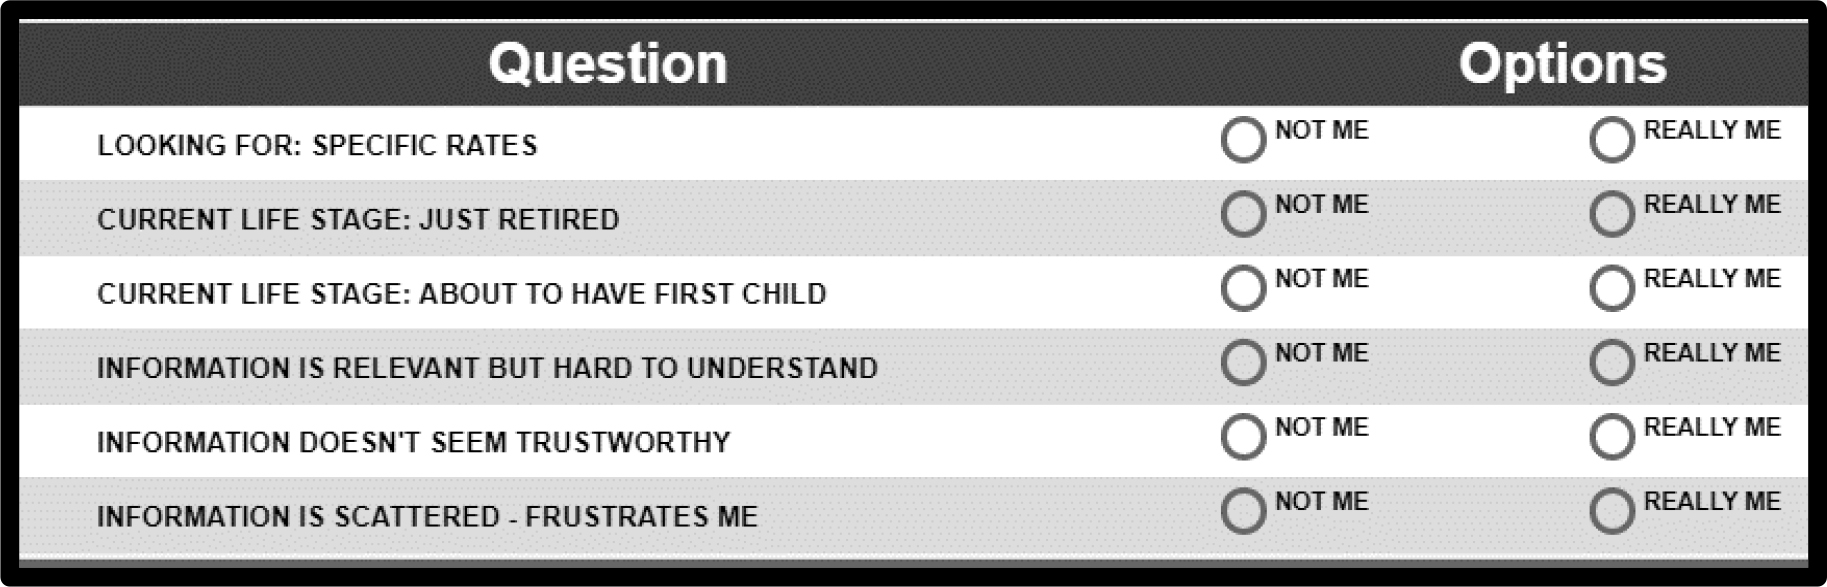
Mind Genomics-027 - ASMHS Journal_F2

Figure 2.
The PVI for the study, showing the questions and the two possible answers to each question

Discussion and Conclusions

In a world where individuals are increasing empowered to discover information previously known only to a cadre of specialists brings with it the problem of frustration and indecision. The world of UX and CX, user experience and patient experience, respectively, have developed to address this situation. These efforts did not begin with the world of the Internet, but rather were begun much earlier by psychologists studying the interaction of people and machines, the field of human factors.

The issue of user experience is magnified when we move beyond games and shopping, with momentary risk, to the search for health information on the internet. Looking at the response times shows us the amount of time that respondents take to process the information. The response times are quite long compared to other topics.

The importance of this study stems from the use of Mind Genomics as an easy-to-implement first stage in understanding the user experience. Rather than building out the system and then first testing the system for usability, the Mind Genomics approach can suggest different aspects of what frustrates a person, what prevents a decision and the nature of the person as a user. Mind Genomics thus gives voice to the individual as well, not as a purely linked part of the user experience, but as another independent dimension, based upon the proclivities of the user. As such, Mind Genomics carries forth the vision of Goldsmith [19], who two decades ago recognized the coming tidal wave of innovation. Mind Genomics is just one of the contributors to what promises to be an increasing tidal wave of innovation as the opportunities and problems in managed health care become increasingly obvious with our aging population.

Acknowledgement

Attila Gere thanks the support of Premium Postdoctoral Research Program of the Hungarian Academy of Sciences.

References

  1. Fein R (1986) Medical care, medical costs: The search for a health insurance policy. Cambridge, MA: Harvard University Press.
  2. Fox S (2011) The social life of health information. DC: Pew Internet & American Life Project 1–33.
  3. Arora NK, Hesse BW, Rimer BK, Viswanath K,Clayman ML, et al.(2008) Frustrated and confused: the American public rates its cancer-related information-seeking experiences. Journal of general internal medicine 23: 223–228.
  4. Kim K, Kwon N (2010) Profile of e-patients: analysis of their cancer information-seeking from a national survey. Journal of health communication 15: 712–733.
  5. Viswanath K (2005) the communications revolution and cancer control. Nature reviews cancer 5: 828.
  6. Janeice-Morgan A, Janeice-Mogan M, Trauth M (2013) Socio-economic influences on health information searching in the USA: the case of diabetes. Information Technology & People 26: 324–346.
  7. Ayers SL, Kronenfeld JJ, (2007) chronic illness and health-seeking information on the Internet. Health 11: 327–347.
  8. Macinnes N,HaglundBJ (2011) Readability of online health information: implications for health literacy. Informatics for health and social care 6: 173–89.
  9. Cebul RD, Rebitzer JB, Taylor LJ, Votruba ME(2011) Unhealthy insurance markets: Search frictions and the cost and quality of health insurance. American Economic Review 101: 1842–1871.
  10. Box GE, Hunter WG, Hunter JS (1978) Statistics for experimenters. New York, John Wiley.
  11. Green PE, Rao VR (1971) conjoint measurement for quantifying judgmental data. Journal of marketing research 8: 355–363.
  12. Green PE, Srinivasan V (1990) conjoint analysis in marketing: new developments with implications for research and practice. The journal of marketing 54: 3–19.
  13. Moskowitz HR (2012) ‘Mind genomics’: The experimental inductive science of the ordinary, and its application to aspects of food and feeding. Physiology & Behavior107: 606–613.
  14. Gofman A, MoskowitzH (2010) Isomorphic permuted experimental designs and their application in conjoint analysis. Journal of Sensory Studies 25: 127–145.
  15. Moskowitz HR, Gofman A, Beckley J, Ashman H (2006) Founding a new science: Mind genomics. Journal of sensory studies 21: 266–307.
  16. Moskowitz HR, Gofman A (2007) Selling blue elephants: How to make great products that people want before they even know they want them. Pearson Education.
  17. Wells WD (2011) Life Style and Psychographics, Chapter 13: Life Style and Psychographics: Definitions, Uses, and Problems. Marketing Classics Press.
  18. Dubes R, Jain AK (1980) Clustering methodologies in exploratory data analysis. Advances in Computers 19: 113–238.
  19. Goldsmith J (2000) The Internet and managed care: A new wave of innovation. Health Affairs 19: 42–56.

Electronic Aids to Emotional Relations: A Mind Genomics Development Cartography of a ‘Dating App’

DOI: 10.31038/ASMHS.2019342

Abstract

We present a new approach to understand what draws individuals to romantic ‘dating’ sites. The approach follows a Socratic sequence, requiring the researcher to follow a set of steps. These begin with defining the topic (dating site), then ask six related questions which ‘flesh out’ the topic, and then require six answers for each question, these answers or elements providing the detail. The actual approach is an experiment, in which test participants (respondents) evaluated 48 different combinations of these answers, in short vignettes comprising 2–4 answers. The relation between the individual respondent’s ratings and the presence/absence of the 36 elements allow for a regression model, whose parameters show the contribution of the elements. The process creates a database of knowledge (what do people want), identifies complementary mind-sets, and then creates a personal viewpoint identifier (PVI) which assigns a new person to one of the mind-sets by a simpler set of six questions, and one of two possible answers. We discuss the potential of this simple, rapid, cost-effective, and powerful method to create a large library about the ‘mind of the consumer.’

Introduction

A great deal of the popular press, especially on the Internet, involves the search for relationships, especially between those who would be called ‘potential partners.’ A quick look at ‘relationship dating apps’ in Google comes up with 366 MILLION ‘hits,’ ‘dating sites’ comes up with 704 MILLION hits. Asking for the ‘best‘dating apps’ produces a long list, some which are: Zoosk®, Match®, Elite®, Silver Singles®, and so forth. Moving over to the academic world, with Google Scholar, the repository of academic publications, we see 1.4 MILLION hits for ‘dating sites’ and 33,200 hits for ‘dating apps.’

Of course, we do not have to go to Google® or the scientific literature. We need only listen to the casual conversations around us to know how focused people are on their current partners, past partners, possible partners, and of course the world of non-partners considered from the viewpoint of casual relationships.

To capitalize on this search for partners and this fascination, a variety of companies have been formed to match partners. The applications do not begin as of this writing, or even as of this century, but go back to the 1960’s with computer dating. Indeed, author Moskowitz has had personal experience with these programs as far back as 1966, when the computer was recognized as a device to ‘match profiles,’

The presumed superiority of on-line dating sites comes from claiming that an underlying algorithm is better at matching two people than the traditional methods, such as blind introduction by friends of relatives. Whether, in fact, the algorithm is better than judgment is not the topic of this study. Rather, it would appear that even if the algorithm were not as good as judgment, the dating site comes up with an assortment of prospective partners, making the pursuit of the ‘right partner’ more time-efficient [1] There are a variety of studies of the user of the dating site from different aspects of the person himself or herself [2–6] but these studies do not appear to focus on the dating site as a product to be created, like any other consumer product.

Background

We use the emerging science of Mind Genomics to understand how people respond to the features of an online dating ‘app.’ Mind Genomics is an emerging psychological science dealing with the experimental analysis of the ‘everyday,’ and, specifically, the criteria by which we make decisions [7,8] Mind Genomics is an ‘experimenting science,’ which means it bases its data on the results of experiments in which the respondents are given various combinations of messages, features, ideas, combined in assortments according to a plan, so-called experimental design [9] The objective is to estimate how every one of the different messages of features ‘drives’ a response, whether the response be interest (our first rating question), or selection of a feeling after reading the combination.

The notion of experiment is important in Mind Genomics. A great deal of information about people, about desires in relationships, and so forth, is obtained by direct questions, the survey procedure. The survey answers are tabulated, analyzed through statistics, perhaps correlated with each other and with outside information, until the answers emerge through a pattern. The survey may be attitudinal. Another approach, increasingly popular, observe behavior in a natural setting, such as search information, and establishes patterns from the search information.

Mind Genomics is neither a survey of attitudes and practices, nor an observation of free ranging behavior in a choice situation. Rather, Mind Genomics is an experiment. Mind Genomics presents the ideas in combinations, vignettes, as noted above, deconstructs the response into the contribution of the individual components of the combination, the vignette, and then identifies a pattern from the data. The components, i.e., phrases, are ‘cognitively rich.’ They are statements about behavior which can stand alone and have meaning, the type of information to which we would ordinarily be subjected. It becomes easy to discover new ideas by simply looking at the ‘meaning’ of elements which perform well together in a specific subgroup.

Putting the Mind Genomics approach into action with ‘Online Dating’

The study comes from the interest of the authors in the nature of relationships, and what people want from a technology which creates the introduction. The topic, while not seeming profound, is actually quite deep in terms of the engagement of people who ‘set up the study.’ That is, for many Mind Genomics studies the efforts to create the study are made, but there is little excitement at the beginning. The topics may be profound, but to the ordinary person, the non-expert, the topics are mundane, if not downright boring. In contrast, the group(s) working on this study and similar studies comprised mainly women, typically between the ages of 18 and 50, rather than men. The topic, the questions, the answers (elements), were generated by women.

Step 1: Choose the topic and ask six questions which ‘tell a story.’ The topic as chosen was ‘online dating,’ specifically the features that a person would find interesting, and the emotions that would be experienced when using this online dating. Table 1 presents the six questions, and for each question, six answers.

Table 1. The six questions and the six answers to each question

Question A: How does it work, and what does it do?

A1

Easy login… with Facebook

A2

Online dating made easy

A3

Meet singles all around the world

A4

Registration is fast and effortless

A5

Fast efficient match making tools

A6

Receive matches by e-mail, free

Question B: How do numbers prove your point?

B1

We are the best predictors of happy and long-lasting relationships

B2

Has more dates, more relationships and more visits than any other online dating website

B3

Over 1 million conversations per day, with 30,000 new singles everyday

B4

Over 8,000 singles online now…making more connections everyday

B5

Debbie from New York says, “I never thought I would use a dating website… but that is how I met my husband, Paul”

B6

In the USA, 1 out of every couple found their spouse online

Question C: How do you appeal to authority, and what kind of tag lines support your appeal?

C1

Date smarter, not harder

C2

One-of-a-kind questionnaire to dig deeper to uncover your attitudes, beliefs and personality

C3

Find G-d’s match for you

C4

A fun, unique way to meet people

C5

Start finding all of the Mr. and Ms’ Rights you can handle

C6

Our online dating site and dating service is modern, professional and user-friendly

Question D: How do you ensure technical security?

D1

Number one most trusted online dating website

D2

100% invitation only…to better protect your privacy

D3

Your information is stored in our database for historical and legal purposes only

D4

Make yourself invisible with our one-of-a-kind privacy settings

D5

For singles concerned with privacy, rest assured contact details are never published

D6

Ranked in 2011 as McAfee’s most secure dating website

Question E: What are ‘simple’ reason to believe

E1

Oldest online dating website

E2

Use our respectable matching system

E3

Personal match maker working with you

E4

Partnership with Match.com to increase our services to you

E5

 No other website offers relationship expertise of someone like Dr. Phil or professional match making services

E6

Our website gives more meaning to ‘we are family’ than any other

Question F: What are the fees?

F1

Free personality test…matches you with more singles in your area

F2

Online dating for the cost of a single date

F3

Free trial for your first three months

F4

No credit card required

F5

Pay as you go…no contract necessary

F6

Put away your credit card…everything on this website is free

Combining Elements (Answers To The Questions) Into An Experimental Design

One of the tenets of Mind Genomics is that people cannot easily tell the researcher ‘what is important’ or, in a more quantitative fashion, assign the level of importance of each aspect of a situation. We may believe we can, but our judgment of what we read, what we see, what we hear, feel, smell and taste is so rapid that it is likely that any post-hoc reporting of what was important for the judgment may be a rationalization, an intellectualization of an otherwise rapid, almost automatic process. Indeed, Nobel Laureate Daniel Kahneman suggests that most of our everyday decisions come from an automatic reaction to the situations which confront us, decisions that are controlled by so-called System 1. When we are asked to think in a rational way, even about what has been reacted to automatically, we invoke a slower system, so-called System 2 [10]

Mind Genomics works using experimental design, which combines the elements into vignettes, test combinations, with the property that each vignette comprises a limited number of elements (2–4), with at most one element or answer from a question. The rationale is that the experimental design is useful both for ensuring the downstream statistical analyses by regression, and a bookkeeping device to prevent the juxtaposition of potentially mutually contradictory pieces of information in one vignette.

Each respondent evaluated a set of 48 vignettes, with each respondent evaluating a set of combinations totally different from the combinations evaluated by another respondent. The structure of the underlying experimental design is maintained. The mathematics allows the elements to appear an equal number of times, and ensures that at the level of an individual respondent the 36 elements are statistically independent of each other.

The use of mixtures, and the measurement of subjective response to those mixtures, constitutes a hallmark of Mind Genomics. The research strategy focuses on the response of a respondent to a series of unique combinations, with no discernable pattern, no single ‘story,’ and therefore an array of test stimuli, which in the words of psychologist William James, constitute a ‘blooming, buzzing confusion.’ One cannot ‘game’ this system. The stimuli come quickly, change, demanding simply that the respondent react to the combinations, a response which may start out as deliberate, but quickly becomes ‘automatic’ as the respondent realizes there is no discernable pattern. It is impossible to ‘game’ the experiment. Even the most determined respondent quickly becomes defeated, and returns to virtual automatic responding.

Figure 1 shows an example of the vignette. The vignette shows a four-element combination, with the elements centered to make reading easy. There are no connectives. The ingoing assumption is that respondents will scan the vignette, graze for the necessary information, and assign their rating. The bottom of the vignette shows the actual rating scale, in this example a 9-point Likert scale, anchored at both ends. The design of the vignette makes it easy to go through a large number of different vignettes, without becoming fatigued. Furthermore, the program is set up so that as soon as the vignette is rated on the first scale (joining), the second rating scale comes up (select an emotion, Figure 2). After the respondent has rated the vignette on these two scales (joining, select an emotion), the program automatically presents the next vignette.

Mind Genomics-025 - ASMHS Journal_F1

Figure 1. Example of a four-element vignette, with the first rating scale

Mind Genomics-025 - ASMHS Journal_F2

Figure 2. Example of the same four-element vignette, this time with instructions to select the appropriate emotion experienced after reading the vignette.

Table 2. Presents the summary results, sorted by the performance on Question #1 (join)

Total

Male

Female

Age 18–38

Age 39–52

Age 53+

Base Size

52

10

42

15

16

21

Additive constant

21

19

22

34

27

8

F6

Put away your credit card…everything on this website is free

14

17

13

10

18

13

F1

Free personality test…matches you with more singles in your area

13

20

11

6

12

17

B4

Over 8,000 singles online now…making more connections everyday

12

7

13

22

16

2

A2

Online dating made easy

10

16

9

12

11

8

A6

Receive matches by e-mail, free

9

15

8

6

9

12

B3

Over 1 million conversations per day, with 30,000 new singles everyday

9

4

10

11

10

6

B1

We are the best predictors of happy and long-lasting relationships

8

1

9

12

11

2

C2

One-of-a-kind questionnaire to dig deeper to uncover your attitudes, beliefs and personality

8

8

8

10

8

6

B2

Has more dates, more relationships and more visits than any other online dating website

7

3

7

-1

17

4

E4

Partnership with Match.com to increase our services to you

7

3

8

-1

14

7

F4

No credit card required

7

6

8

2

12

8

B5

Debbie from New York says, “I never thought I would use a dating website… but that is how I met my husband, Paul”

6

6

6

12

-4

10

D1

Number one most trusted online dating website

6

-4

8

2

9

5

D5

For singles concerned with privacy, rest assured contact details are never published

6

7

5

-7

4

16

E3

Personal match maker working with you

6

7

5

6

-1

10

E5

No other website offers relationship expertise of someone like Dr. Phil or professional match making services

6

2

6

2

3

10

A4

Registration is fast and effortless

5

19

2

5

9

3

B6

In the USA, 1 out of every couple found their spouse online

4

11

3

7

9

-1

C4

A fun, unique way to meet people

4

6

3

7

4

1

A3

Meet singles all around the world

3

11

2

4

2

4

A5

Fast efficient match making tools

3

18

0

5

-2

5

C1

Date smarter, not harder

3

11

1

3

0

5

C3

Find G-d’s match for you

3

2

3

-7

5

9

C6

Our online dating site and dating service is modern, professional and user-friendly

2

8

1

-4

5

4

D4

Make yourself invisible with our one-of-a-kind privacy settings

1

-4

2

-7

6

4

D6

Ranked in 2011 as McAfee’s most secure dating website

1

-1

2

-7

5

4

C5

Start finding all of the Mr. and Ms’ Rights you can handle

-1

7

-3

-2

-5

3

E1

Oldest online dating website

-1

3

-2

-7

14

-8

A1

Easy login… with Facebook

-2

15

-6

-16

4

3

F2

Online dating for the cost of a single date

-2

6

-4

-13

-6

9

F3

Free trial for your first three months

-2

1

-2

-8

-2

3

E2

Use our respectable matching system

-3

3

-4

1

-10

0

E6

Our website gives more meaning to ‘we are family’ than any other

-3

8

-6

-7

-2

-1

D2

100% invitation only…to better protect your privacy

-4

-4

-4

-16

1

0

D3

Your information is stored in our database for historical and legal purposes only

-7

-7

-7

-20

-1

-2

F5

Pay as you go…no contract necessary

-7

-4

-8

-14

-11

0

Running The Study

Upon clicking a link in the embedded email, sent by the e-panel provider, the respondent was presented with the invitation, and the information shown in Figure 3. The information provides very little background about the reasons for the study, other than the statement ‘Today, you will taking a survey regarding Online Dating.’ Although Mind Genomics is an experiment, the term ‘survey’ is less frightening, and was used in order to assuage any fears that might be aroused by the use of the technically more correct word ‘experiment.’

Mind Genomics-025 - ASMHS Journal_F3

Figure 3. The orientation page, shown to the respondent at the start of the Mind Genomics experiment

There are some specific caveats about the actual material, such as the fact that all of the vignettes differ from each other. In the earlier visions of the program, especially those not on the web but done in person on micro-computers, many respondents stated that they felt they were seeing the same vignette several times. This is a natural reaction, stemming from the fact that the respondent sees the same elements, combined however into different vignettes. They remember some of the phrases, and when they see the phrase again, they may not realize that the other elements in the vignette have changed.

The second noteworthy piece of information is the statement that the study will take 10–15 minutes. Respondents do not like open-ended, boring experiences which seem that they will never end. By giving the respondent a sense of a 10–15-minute experience, we forestall a lot of the potential for the length of the Mind Genomics experiment to become an issue.

A parenthetic note: We should keep in mind that there were no marital requirements for this experiment when the respondents were selected. We could have limited the study to unmarried individuals, but we wanted to get a general representation of individuals, married, single, younger, older males and females, respectively.

Data Analysis By Modeling – Question #1 – Join

Each respondent evaluated a set of 48 vignettes, arranged according to an experimental design. The ratings for each respondent for question 1 (join the dating website) were transformed so that ratings of 1–6 were replaced by 0 to denote little or no interest, and ratings of 7–9 were replaced by 100 to denote moderate or high interest. A very small random number was added to each binary transformation. The binary transformation follows the common practice of researchers in the social sciences and in political polling, who have come to realize that the precision of the scale is not easily translated to meaningfulness when the results of the study are subsequently applied by managers. Most managers, and indeed most researchers, do not know what the scale means, and especially have little or no idea what the intermediate scale points signify. The binary transformation simplifies the communication of the results and the use of the data.

The first column is the element code, the second column is the element text, and the remaining columns are the results from the different groups (total, gender, age).

The base size – number of respondents in the specific group

Additive constant –percent of responses which would be 7–9 in the absence of elements. The additive constant is a purely estimated parameter since all the vignettes by design comprised 2–4 elements. Nonetheless, the additive constant can be viewed as a baseline, showing the predisposition of the respondent to be positive. The additive constants are low, with the younger respondents (age 18–38) most optimistic, and the older respondents (age 53+) least optimistic about the site.

The performance of the individual elements. Mind Genomics provides a rich database from which to extract patterns. Mind Genomics does not need a pattern to ‘jump out,’ with the elements of the pattern simply observations. Rather, each element is ‘cognitively rich,’ with many possible meanings. The patterns which emerge come from both the meaning of the individual elements which score highest, as well as the commonality among those elements.

Total panel – free is the strongest performer:

Put away your credit card…everything on this website is free

Free personality test…matches you with more singles in your area

Male – many different elements, but free and easy are the strongest performers

Free personality test…matches you with more singles in your area

Registration is fast and effortless

Fast efficient match making tools

Put away your credit card…everything on this website is free

Online dating made easy

Receive matches by e-mail, free

Easy login… with Facebook

Females – free, safe (with an emphasis on safe, no risk)

Put away your credit card…everything on this website is free

Over 8,000 singles online now…making more connections everyday

Age 18–38 – Others are involved

Over 8,000 singles online now…making more connections everyday

Age 39–52 – Free, others are involved, the system has a number of assurances of ‘performance’

Put away your credit card…everything on this website is free

Has more dates, more relationships and more visits than any other online dating website

Over 8,000 singles online now…making more connections everyday

Partnership with Match.com to increase our services to you

Age 53+ – Privacy, assurance of ‘performance’

Free personality test…matches you with more singles in your area

For singles concerned with privacy, rest assured contact details are never published

Linking Emlinking Emotions To Elements

An emerging topic of interest over the past decade has been the way emotions come into play when a person reads something or does something, the idea of affect as an accompanying feature of behavior. Often it is difficult to pinpoint the precise emotion, since there are hundreds of words which describe one or another feeling, emotion, disposition. The nomenclature of emotion makes it very difficult to select a set of words, although if a limited set is not chosen, the task becomes virtually impossible.

A parenthetical note: The same issue, description of the qualitative aspect of emotion, can be said to describe the state of our approach to the description of odor and a lesser issue but a problem nonetheless for the description of texture. The issue in emotion, olfaction, and texture, is simply the fact that there are no agreed-upon primaries, and the subjective richness of the emotion, the smell, and the touch can be simply overwhelming.

We recognized this problem, and selected five different emotions, two negative (uncertain, intimidated), one intermediate (disinterested), and two positive (curious, eager.) The emotions were not mean to describe a continuum, but simply designed to capture a variety of feelings, positive, negative, and a variety of actions (information-seeking; approach-avoidance.)

After the respondent rated the vignette on the overall evaluative criterion of ‘join,’ the respondent was instructed to rate how she or he felt when reading the vignette. The five selections became five new dependent variables. When a specific emotion or feeling was selected (e.g., uncertain) the newly created variable corresponding to that emotion was assigned the value of 100. The remaining four newly created variables were assigned the rating of 0.A small random number was added to each newly created rating.

The coefficients for the five newly created variables were estimated, this time again using OLS regression, but without an additive constant.

Table 3, 4 presents the linkages between the 36 elements and the nature of the feeling (both positives, neutral, both negatives, and then the four specific feelings).For the positive, disinterest (neutral) and negative feelings, we show the strongest linkages, shading those of 15 or higher. For the remaining four feelings (uncertain, intimidated, curious, eager) we shade those linkages of 11 or higher. A linkage of 10 is highly statistically significant in the OLS regression model

Table 3. Linkage between the 36 elements and the positive, neutral (disinterest) and negative feelings, as well as the four specific feelings

General Feelings

Specific Feelings


Positive

Disinterest

Negative

Uncertain

Intimidated

Curious

Eager

D4

Make yourself invisible with our one-of-a-kind privacy settings

16

2

8

8

8

6

2

C3

Find G-d’s match for you

8

22

-2

3

5

-2

0

F5

Pay as you go…no contract necessary

9

16

2

6

3

3

-1

F6

Put away your credit card…everything on this website is free

-1

1

26

-1

0

16

10

F1

Free personality test…matches you with more singles in your area

6

3

18

5

1

15

3

C1

Date smarter, not harder

7

2

18

7

0

15

3

C6

Our online dating site and dating service is modern, professional and user-friendly

5

4

17

6

-1

17

0

C2

One-of-a-kind questionnaire to dig deeper to uncover your attitudes, beliefs and personality

10

2

17

7

3

14

3

A6

Receive matches by e-mail, free

7

6

15

7

0

14

1

C4

A fun, unique way to meet people

6

6

15

4

2

13

2

B6

In the USA, 1 out of every couple found their spouse online

13

8

6

9

4

5

1

B2

Has more dates, more relationships and more visits than any other online dating website

13

4

11

9

4

10

1

D5

For singles concerned with privacy, rest assured contact details are never published

13

4

9

6

7

6

3

F2

Online dating for the cost of a single date

12

13

2

10

2

3

-1

D3

Your information is stored in our database for historical and legal purposes only

12

10

4

7

5

3

1

B4

Over 8,000 singles online now…making more connections everyday

12

4

12

11

1

8

4

B3

Over 1 million conversations per day, with 30,000 new singles everyday

12

4

10

7

5

10

0

D1

Number one most trusted online dating website

12

1

12

8

4

12

0

A1

Easy login… with Facebook

11

8

7

9

2

3

4

D2

100% invitation only…to better protect your privacy

11

8

6

5

6

5

1

A2

Online dating made easy

11

5

12

7

4

11

1

E1

Oldest online dating website

11

2

11

9

2

10

1

E2

Use our respectable matching system

10

5

8

6

4

7

1

E6

Our website gives more meaning to ‘we are family’ than any other

6

13

4

2

4

3

1

E4

Partnership with Match.com to increase our services to you

4

11

11

3

1

8

3

B1

We are the best predictors of happy and long-lasting relationships

6

10

11

5

1

11

0

C5

Start finding all of the Mr. and Ms’ Rights you can handle

8

10

9

7

1

7

2

F4

No credit card required

4

9

14

4

0

8

6

A5

Fast efficient match making tools

8

6

14

7

1

10

4

E5

No other website offers relationship expertise of someone like Dr. Phil or professional match making services

3

6

14

0

3

10

4

B5

Debbie from New York says, “I never thought I would use a dating website… but that is how I met my husband, Paul”

9

6

13

7

2

12

1

D6

Ranked in 2011 as McAfee’s most secure dating website

7

6

13

2

5

11

2

A3

Meet singles all around the world

8

7

12

5

3

9

3

F3

Free trial for your first three months

8

7

12

7

1

8

4

E3

Personal match maker working with you

6

6

12

3

3

9

3

A4

Registration is fast and effortless

9

9

9

7

2

7

2

Table 4. Performance of the elements by the two mind-sets

Mind-Set 1

Mind-Set 2

Base Size

37

15

Additive constant

21

22

Mind-Set 1: Lots of people, easy and free

B4

Over 8,000 singles online now…making more connections everyday

18

-3

F6

Put away your credit card…everything on this website is free

17

6

B3

Over 1 million conversations per day, with 30,000 new singles everyday

14

-4

A6

Receive matches by e-mail, free

13

-1

B1

We are the best predictors of happy and long-lasting relationships

13

-5

F1

Free personality test…matches you with more singles in your area

13

12

B2

Has more dates, more relationships and more visits than any other online dating website

12

-6

A2

Online dating made easy

11

6

A5

Fast efficient match making tools

10

-15

A4

Registration is fast and effortless

9

-3

F4

No credit card required

9

4

B5

Debbie from New York says, “I never thought I would use a dating website… but that is how I met my husband, Paul”

8

0

E4

Partnership with Match.com to increase our services to you

8

4

Mind-Set 2 – Serious dater

C3

Find G-d’s match for you

-5

22

D1

Number one most trusted online dating website

4

11

E3

Personal match maker working with you

4

11

C2

One-of-a-kind questionnaire to dig deeper to uncover your attitudes, beliefs and personality

6

10

E5

No other website offers relationship expertise of someone like Dr.Phil or professional match making services

4

8

Does not drive a respondent to join

E1

Oldest online dating website

-4

7

F2

Online dating for the cost of a single date

-4

4

D5

For singles concerned with privacy, rest assured contact details are never published

7

2

F3

Free trial for your first three months

-3

2

C6

Our online dating site and dating service is modern, professional and user-friendly

3

1

E2

Use our respectable matching system

-4

0

A3

Meet singles all around the world

6

-3

C1

Date smarter, not harder

5

-3

B6

In the USA, 1 out of every couple found their spouse online

7

-4

C4

A fun, unique way to meet people

7

-5

E6

Our website gives more meaning to ‘we are family’ than any other

-2

-5

F5

Pay as you go…no contract necessary

-8

-6

D2

100% invitation only…to better protect your privacy

-3

-7

D4

Make yourself invisible with our one-of-a-kind privacy settings

5

-8

D6

Ranked in 2011 as McAfee’s most secure dating website

6

-9

D3

Your information is stored in our database for historical and legal purposes only

-7

-9

C5

Start finding all of the Mr. and Ms’ Rights you can handle

2

-10

A1

Easy login… with Facebook

6

-22

Table 3 tells us that the majority of strong emotional linkages to these elements are either disinterest or negative. Although there are some elements which may drive an individual to say that she or he will ‘join’ the dating site, there is very little ‘massive’ positive reaction. What positive reactions occur can be traced more to curiosity than to eagerness

Discovering Mind-Sets In The Population

Underlying the Mind Genomics effort is the belief that for any specific topic where decisions are made, people exhibit a range of criteria, or ‘mind-sets.’ The effort may be very broad such as what interests an individual in an organization, or very narrow, such as the topic of joining a data site, or even a narrower aspect of the topic, such as how to pay for the site, and so forth. The key is being able to ask questions, provide relevant answers, and execute the study among the relevant respondents. The topic of ‘relevant’ is an entirely separate issue, and may be limited to individuals who are single (for a data site), individuals who have used a dating site, or even individuals who have used a specific dating site. On the other hand, the relevant respondent may be just about anyone.

In the world of genomics, we deal with a gene, and alternative versions of the same gene, alleles. The comparison to Mind Genomics is metaphoric. Whether the respondents are from a specific group or from a general population, they nonetheless often divide into groups with different points of view, so-called mind-sets, mental genomes. The experiment we have just run in the above-discussed results provide us with the tools to isolate mental alleles, mental variations of the same ‘gene,’ the gene being the ways one thinks about joining to a dating site.

Discovering mind-sets in the population of respondents combines objective statistics and subjective interpretation. Each respondent generated a model relating the presence/absence of the elements to the binary value of 0/100 (0 when the original rating was 1–6, 100 when the original rating was 7–9). The binary-transformed ratings were then used as the dependent variable and related to the presence/absence of elements. The coefficients (but not the additive constant) were used as inputs to a k-means clustering program (Jubes& Jain, 1980). The program divided the respondents into two groups (clusters, mind-sets), and then again into three groups. The criteria for dividing the respondents was mathematical in nature. The selection of the clusters, two or three, was based upon a simple pair of criteria, parsimony (fewer clusters are better than more clusters), and interpretability (the clusters must ‘tell a coherent story.’)

For these results, it was easy to interpret the two-cluster solution, suggesting two radically different mind-sets. Table 3 shows the coefficients for the two mind-sets. Both start with low additive constants, 21 and 22, respectively, suggesting that in the absence of the elements about one-fifth of the time the rating will be 7–9. This means that it is the task of the elements to drive ‘join.’ In neither mind-set are people ready to join.

The richness of the elements in terms of what they convey, how they represent the way a person feels, and the simplicity of the pattern reflects the nature of Mind Genomics. Rather than extracting a pattern from points, and thus forcing oneself to see order in possible chaos, Mind Genomics extracts a pattern from phrases which themselves are meaningful. One need not even ‘name’ the mind-sets to understand the results. Just knowing the high-scoring elements may often suffice, although it is in the nature of researchers to label groups, if only as a aide-memoire.

Mind-Set 1 responds to ‘make it easy and free.’

Over 8,000 singles online now…making more connections everyday

Put away your credit card…everything on this website is free

Mind-Set 2 is a ‘serious dater’

Find G-d’s match for you

Establishing The Consistency of The Ratings From Individual Respondents

The question is often asked whether the respondents in these Mind Genomics studies are serious in their participation, or whether they just answer at random. As of this writing (Summer, 2019) the issue of survey fraud, especially with online studies, has come to the fore as a major topic, especially because survey fraud can be committed with ‘bots’ programmed to answer surveys as if the bots were legitimate respondents.

One way to determine whether or not the respondents were actually focused on doing the project uses a measure of ‘goodness of fit’ of the equation to the data, the multiple R-square. The individual-level regression model, so-called curve-fitting model, OLS (ordinary least-squares) regression, may or may not ‘fit the data. ’When the regression model fits the data, the R-squared is high. The R-square ranges from a high of 1.00 when the regression model fits the data perfectly, to a low of 0.0 when the regression model essentially fails entirely, and is simple a ‘best fit’ but is really irrelevant,

Figure 4 shows the distribution of R-square values for the respondents, each respondent generating a single value from the model generated by her or his ratings, versus the presence/absence of the elements. R-square values of 0.25 or higher (R>0.5) suggest that the respondent is taking the study seriously. Figure 4 shows that most respondents generate reasonably high R-square statistics for their individual models.

Mind Genomics-025 - ASMHS Journal_F4

Figure 4. Distribution of R-square values by mind-set, for the individual models relating of question 1 (‘Join’) vs the presence/absence of the 36 elements

Finding Segments In The Population

It is easy to classify people by who they ARE or what they DO. These classifications can be quickly obtained from many commercial sources. Once can also define a person by one of the many different classification schemes such as PRIZM® by Claritas, Inc. in San Diego, CA. What is almost impossible, however, is to identify the likely membership in a mind-set that is relevant to a specific, local issue such as dating. How can one assign a new person to Mind-Set 1 or Mind-Set 2 for a dating site?

Recent developments by author Gere have evolved into a method which assigns new individuals to the two mind-sets, using a simple algorithm. The approach, PVI (personal viewpoint identifier), is a simplified algorithm, taken in part from the more powerful method of discriminant function analysis [11] DFA requires the raw data, whereas the PVI uses the average data to identify a set of questions, which best differentiate among the different mind-sets. The PVI is a Monte-Carlo process, which adds ‘noise’ to the coefficients to simulate ordinary variation, and identifies the best set of questions and the pattern of answers. The output of the process is the set of questions (usually six), each with two answers, and thus 64 possible patterns of answers. The pattern of answers defines mind-set membership.

Figure 5 shows the PVI. Once the respondent participates in the PVI, the program automatically assigns the respondent to a mind-set, and stores the data. The PVI can be programmed to send feedback to the respondent based upon the pattern of responses, and the mind two which the participant in the PVI is assigned.

Mind Genomics-025 - ASMHS Journal_F5

Figure 5. The PVI (personal viewpoint identifier) for the dating site

Discussion And Conclusions

The sheer volume of interest in dating sites drive researchers to focus on the site as a way to understand the motives of people, their feelings, and their behavior. In turn, business people recognize the great deal of money to be made from these dating sites because those who are on the sites are there for emotional reasons, whether sincere or feigned, whether looking for connection or for something else.

Mind Genomics brings a different focus to the issue of dating sites. The sites are interesting as a product that can be designed, as well as a micro-topic of everyday life which is of great interest to people in the world of always-connected, and the ubiquitous Internet. The consequence of a new world of interconnections through technology, and increasing social isolation of people because of the advances in technology which have destroyed the tight-knit local communities, make a perfect matrix of research opportunities for Mind Genomics to look at various aspects of dating sites. This first study looks at the site as a business opportunity, using research questions and probes typically encountered in the development of products in the world of commerce. Further studies might well focus on issues of emotionality when the site is used. These further studies would represent the application of Mind Genomics to more traditional aspects of dating sites, the aspects looked at by sociologists and psychologists.

Acknowledgement

Attila Gere wishes to acknowledge and thank the Premium Postdoctoral Research Program of the Hungarian Academy of Sciences

References

  1. Finkel EJ, Eastwick PW, Sprecher S (2012) Online Dating: A Critical Analysis from the Perspective of Psychological Science. Psychological science in the public interest
  2. Blackhart GC, Fitzpatrick J, Williamson (2014) Dispositional factors predicting use of online dating sites and behaviors related to online dating. In: Computers in Human Behavior Elsevier.
  3. Kim M, Kwon KN, Lee (2009) Psychological characteristics of Internet dating service users: The effect of self-esteem, involvement, and sociability on the use of Internet dating services. CyberPsychology&Behavior 12: 445–449.
  4. Sautter JM, Tippett  RM, Morgan SP (2010) The social demography of Internet dating in the United States. Social Science Quarterly 91: 554–575.
  5. Stevens SB, Morris TL (2007) College dating and social anxiety: Using the Internet as a means of connecting to others. CyberPsychology&Behavior 10: 680–688.
  6. Valkenburg PM, Peter J (2007) Who visits online dating sites? Exploring some characteristics of online daters. CyberPsychology&Behavior 10: 849–852.
  7. Moskowitz HR, Gofman A, Beckley J, Ashman H (2006) Founding a new science: Mind genomics. Journal of sensory studies 21: 266–307.
  8. Moskowitz HR, Gofman A (2007) Selling blue elephants: How to make great products that people want before they even know they want them. Pearson Education.
  9. Box GE, Hunter WG, Hunter JS (1978) Statistics for experimenters  New York, John Wiley
  10. Kahneman  D,  Egan P (2011) Thinking, fast and slow. New York: Farrar Straus and Giroux.
  11. Crask MR, PerreaultJr WD (1977) Validation of discriminant analysis in marketing research. Journal of Marketing Research 14: 60–68.

Messages about Diabetes: A Mind Genomics Exploration of Communicating for Medicine & Public Health

DOI: 10.31038/EDMJ.2019354

Abstract

Awareness to risks of type II diabetes, the epidemic of the 21st century, is low. We present an investigation into the messages about diabetes which resonate with respondents. The approach uses experimentally designed combinations of messages, unique for each respondent, with the property that the messages appear in a way that prevents the respondent from ‘gaming’ the experiment. Each respondent generates a unique pattern of coefficients for both important of messages, and response time to messages. The study suggests three mind-sets (Focus on the sufferer alone; The doctor is the source of knowledge; Focus on management with the help of others.) We present the PVI, personal viewpoint identifier, allowing the researcher to identify the appropriate convincing message for each respondent, who is first assigned to one of the three mind-sets by the PVI. The Mind Genomics study provides the health community with an easy-to-use system for understanding and deploying convincing messages in health-relevant situations, and may serve as an ongoing, working tool, for health maintenance among the general population.

Introduction

One only needs to open any medical journal to read about the medical issues involved in one or another aspect of diabetes. The popular press, and especially the web, are filled with stories about the issues of diabetes, the newspapers filled with latest information about specific issues involved with diabetes as a looming disaster for society, the magazines filled with stories about personal encounters with diabetes, and to those on the web innumerable advertisements about what to do and what not to do to forestall diabetes.  The sheer popularity of diabetes as an issue of discussion is witness to the growing recognition of this developing scourge of society. Type II diabetes has been recognized as a global epidemic of the 21st   century [1]. Diabetes is the seventh leading cause of death and disability worldwide [2]. Disability resulting from diabetes has grown substantially between 1990 to 2013 particularly among ages 15–69 years; age-standardized prevalence among adult men doubled from 4.3% to 9% and age-standardized prevalence among adult women increased by 60% from 5% to 8% [3]. People suffering from diabetes are at risk of developing a range of complications endangering their health, functionality and survival. Diabetes has increased across countries [4]. In 2013, 382 million people in 130 countries had diabetes [5]. It is estimated that by 2030 the number of people with Diabetes will rise to 552 million by 2030, and that by 2035 the number of people with diabetes will rise to 592 million (5–7). Despite these concerning data, only a few countries, mostly in Western Europe, seem to have a chance of halting the rise in diabetes by 2030 [4].

Health expenditures associated with diabetes create an economic burden [8]. Epidemiological and economic data for 184 countries suggest that direct global costs accounted for $1.31 trillion, based on WHO’s general health expenditure figures and data from the 2015 [9]. Furthermore, indirect costs of premature mortality and comorbidity due to diabetes accounted for 35% of the total burden with America being the largest contributor to global costs of diabetes [10].

Type II diabetes is caused by factors such as obesity, sedentary lifestyle, diet, smoking, physical and emotional stress which are modifiable [11,12]. Interventions to target modifiable risk factors can prevent or delay the onset of diabetes, but awareness of risks of diabetes is low [10]. The human suffering in diabetes and the economic burden of diabetes on health systems of every country, make diabetes an urgent matter to combat the disease [4].

Education, and especially effective communication, are critical. When people can be effectively educated about the risk and the modifiable factors that can be changed, there is the possibility that the effects of Diabetes can be reduced. One consequence of education is that those individuals who perceive themselves to be at risk of diabetes may be more conscious about what to do, and more likely to follow up on efforts which reduce their risk of developing diabetes [8].

Sadly, little attention was paid to creating effective messages which raise the awareness diabetes risks [1,12]. To be sensitive and effective, messages about risk awareness need proper shaping through framing, narrative impact or visual imagery [11]. These messages should acknowledge the role of individuals in adopting healthy behaviors, and consciously avoid activating negative stereotypes or arousing anger at the message source [13]. Effective messaging will enable health professionals and health policy makers to identify and to use the most effective message for each person in the population by mind-set segments of the sample. How do we understand the mind, and enhance risk awareness effectively?

Formal statistics provide no sense of how people ‘feel’, and to what people ‘react’. Softer yet quantitative methods provide other points of view. Mind-Genomics is an approach best described a ‘cartography of the mind’ which studies responses to different aspects of daily life experience [14–16]. Mind-Genomics maps an experience, identifies its different facets, determines to what facets the person attends, and how important each facet is for each person [14,17–22] By dealing with responses to elements of everyday experience, as they are reacted to by people, Mind-Genomics reveals how people react to the specifics of experience, looking at the nuances, and thus taking into account the richness of experience. Mind-Genomics is an empirical science, mapping aspects of experience by importance, and segmenting different groups of people by their different viewpoints, so-called mind-sets. This Mind-Genomics study identifies effective messaging to raise awareness to risk of diabetes, looking at the general population by the different mind-sets, and what will work (as well as what will fail) for each mind-set.

At the very practical level, in both the medical and non-medical worlds, what does one say to alert the population to the potential problems of diabetes? What does one say to direct people to the proper behaviors, and encourage them, in order to forestall diabetes?  And, if one puts the current messaging to the test, do the content of today’s messages strike a resonant chord in the mind of the average consumer?  Must we frighten people into a better lifestyle? [23–26].

Finally, as part of this introduction, can we identify different types of people, responding to various messages. We know from the popular press that there is a plethora of choice and the corresponding paradox of choice [27]. In the world of food, for example, we now know both from science and from the marketplace that people have different preferences for products, and will gravitate to what they like, rejecting what they dislike.  Prego, for example, is just such a phenomenon, of a product once appearing in one SKU (shop-keeping unit), but now proliferating into more than a dozen, with varieties coming in and out of the market every year. Do we have the same distribution of preferences, not for a physical food product, but rather for a message, such as the type of message to warn us about diabetes?

Method

The approach used is known as Mind Genomics, a form of experimental design in which messages are combined into short, easy-to-read vignettes, such as that shown in Figure 1 for this study. The messages are developed by a Socratic method of choosing a topic, asking four related questions which ‘tell a story,’ providing four answers to each question, and testing combinations of these answers. Mind Genomics, based upon the statistical rigor of experimental design [28] combined with simple testing of combinations by the web, creates a method which is fast, easy, affordable, iterative, and scalable.  The objective is to work with small, cost-effective groups of respondents, members of a large on-line panel, and explore different messages in an iterative fashion, to discover what ‘works’, to discover possibly ‘new-to-the-world’ mind-sets, and when possible iterate rapidly across a series of studies to fine tune messages [14,29,30.]

Mind Genomics-022 EDMJ Journal_F1

Figure 1. Example of a vignette for the diabetes study

The methods of Mind Genomics enjoy a long history. Psychologists and marketers have known for decades that the everyday experience of people is not easily uncovered by the conventional scientific method of isolate and then study. For some phenomenon, such isolation works very well to help the researcher understand the phenomenon. The everyday experience of people, the world of normal behavior where diabetes is a relevant issue, cannot be easily understood by isolating variables in a clinical way. Rather, it is important to simulate the compound and complex nature of experience, where an individual is presented with many stimuli of different types, all competing for attention.  To this end, experimental design of ideas was promoted by pioneer researchers in the world of marketing, Professors Paul Green and Jerry Wind, at the Wharton School of the University of Pennsylvania [31,32]  It is their pioneering which has stimulated the research in this paper, albeit the topic has changed from issues in marketing to issues in public health, namely diabetes.

It is important to keep in mind that Mind Genomics studies do not purport to be the ultimate in terms of what works in communication of a topic. Rather, each Mind Genomics study provides a wealth of information in and of itself, as well as a platform both for archiving scientific information, and as a jumping-off point for additional improvement. Mind Genomics thus differs from the conventional A/B tests of communication, now prevalent on the web to ‘optimize’ messaging. Mind Genomics provides structured information, not just a comparison of performance.

The process and the results

We illustrate the approach to diabetes with a small study of 50 respondents, run in March 2019. The objective of the study was to institute a new set of studies on the way to message to the public on topics of increasing importance, yet topics whose criticality has not been sufficiently established in the public’s mind. Diabetes is one of these issues, a disease which promises to become an economic scourge in the years to come.   Similar looming problems are opioid use leading to addiction, and eating patterns leading to obesity and illness.

We can best understand the issue of diabetes by following the structured approach imposed by Mind Genomics. The underlying notion is that these studies must be easy to design and implement, must produce fast results, must be very affordable, and must generate a way to implement the key findings (e.g., finding Mind-Sets in the population, responsive to different types of messages.)  The power of Mind Genomics lies both in the requirement is imposes for the researcher to ‘think’ in a structured manner, and to return with powerful data that can be acted upon quickly. Mind Genomics is thus a technology of today, the ‘push button age,’ where thinking has become superficial, where solutions are vital, where communication is the driver of change, and where iteration, redoing and correcting, is the evolving way to create products and services [33]

  1. Identify the problem, create questions, provide answers. Mind Genomics traces some of its intellectual history to the world of Socratic thinking.  When exploring a topic, Mind Genomics begins by forcing the researcher to think about four questions that can be related to each, questions which ‘tell a story.’ This step is not as easy as one might surmise. Asking a series of questions which tell a story requires the researcher to conceptualize the problem of just what is the ‘story’ behind diabetes.  Table 1 shows a set of four questions, not necessarily the only questions that could be asked.  Underneath each question are four answers. The answers are phrased in the language of ordinary people, simple, and at a level promoting ‘fast reading’ and even ‘information grazing’ as will be discussed below. This is so-called System 1 thinking, the fast, intuitive way that we think when we deal with the world of the everyday [34]. As a side note, it should be kept in mind that the respondent never sees the questions. The only material that the respondent will ever see are the answers, to be combined in a systematic way, discussed below.

    Table 1. The four questions and the four answers to each question for the diabetes study

    Question 1 – What is the risk?

    A1

     By living longer there is a greater chance of suffering from diabetes

    A2

    Diabetes is dangerous without treatment

    A3

     Diet and exercise are key to diabetes prevention

    A4

    Diabetes is the most profound disease of this century

    Question 2 – What are the healthcare needs?

    B1

     It’s OK to self-manage diabetes

    B2

     People with diabetes use a lot of health services

    B3

     Frequent doctor visits help adherence to diabetes treatment

    B4

    Diabetes requires a lot of medications

    Question 3 – What education is expected?

    C1

     It’s a doctor’s role to educate patients about diabetes

    C2

     The internet is all you need to learn about diabetes

    C3

     A doctor should refer patients to educational materials about diabetes

    C4

     A patient should know all the possible treatments of diabetes

    Question 4 – What role does the support of others play?

    D1

     Family support is important to manage diabetes

    D2

     Learning how others cope with diabetes is beneficial

    D3

     Participation in workshops for patients helps manage diabetes

    D4

     Belonging to a community of patients helps support others with diabetes

  2. Create the basic experimental design and permute it.  The underlying experimental design works with the four sets of four answers (four per question), creating a set of 24 vignettes. Each vignette comprises at most one element from each question. Many vignettes, however, are incomplete, missing either answer from one question (3-element vignette) or an answer from each of two questions (2-element vignette.)  Each element appears equally often in the set of 24 vignettes. The underlying experimental design used to construct the vignettes ensures that the 16 elements or answers appear in a statistically independent fashion, allowing the ratings to be ‘deconstructed’ by statistical methods (regression) into the separate contributions of the elements. Finally, each respondent evaluated a unique set of 24 vignettes, but the underlying structure was maintained, so that the mathematical rigor of the design could be used to create valid regression models [35]

    Table 2 shows the structure for five vignettes from one respondent, #27, male, age 31, who is defined by age as being in the younger of the two groups, and who classifies himself as being moderately concerned about diabetes. This will be the only private information needed for the respondent, and indeed even this information about WHO the respondent IS, or WHAT the respondent THINKS will not be necessary for the analysis.

    Table 2. Five vignettes from the experimental design for one respondent. The table shows the information about the respondent, the structure of the five vignettes, the binary expansion of the 16 elements, the ratings, response time, and binary-transformed ratings

    Vig#1

    Vig#2

    Vig#3

    Vig#4

    Vig#5

    Respondent #27; Male, Age 31, Younger group, Moderately concerned about diabetes

    Design

    Question A:

    Answer A4

    Absent

    Answer A4

    Answer A2

    Answer A2

    Question B:

    Absent

    Answer B2

    Answer B2

    Answer B1

    Answer B4

    Question C:

    Answer C2

    Answer C1

    Answer C1

    Absent

    Answer C4

    Question D:

    Answer D4

    Answer D1

    Answer D2

    Answer D1

    Answer D4

    Binary Expansion of Design

    A1

    0

    0

    0

    0

    0

    A2

    0

    0

    0

    1

    1

    A3

    0

    0

    0

    0

    0

    A4

    1

    0

    1

    0

    0

    B1

    0

    0

    0

    1

    0

    B2

    0

    1

    1

    0

    0

    B3

    0

    0

    0

    0

    0

    B4

    0

    0

    0

    0

    1

    C1

    0

    1

    1

    0

    0

    C2

    1

    0

    0

    0

    0

    C3

    0

    0

    0

    0

    0

    C4

    0

    0

    0

    0

    1

    D1

    0

    1

    0

    1

    0

    D2

    0

    0

    1

    0

    0

    D3

    0

    0

    0

    0

    0

    D4

    1

    0

    0

    0

    1

    Dependent variables

    Rating on 9-point scale

    4

    7

    6

    5

    3

    Response Time (Sec)

    5.3

    2.9

    4.6

    5.5

    4.8

    Binary transformed rating

    Top3

    0

    100

    0

    0

    0

    Bot3

    0

    0

    0

    0

    100

    Below the experimental design, described in words, is the same set of 16 elements, this time representing the elements as 16 variables, each variable taking on the value ‘0’ when the element is absent from the vignette, and taking on the value ‘1’ when the element is present in the vignette. The element is coded 0/1 because the analysis will tell us how much the element contributes to the response. This form of coding is known as ‘dummy variable’ because the element, i.e., the answer, does not carry any intrinsic numerical information that we want to use as a predictor. It is simply the element itself, without the ‘meaning of the element.’ Later, after the analysis, we will look for meaning.

    Beneath the binary variables are two sets of two dependent variables each. The first dependent variable is the rating of the vignette on the anchored 9-point scale. The second dependent variable is the response time to the vignette in seconds. The third dependent variable is the transformed rating ‘Top3,’ with ratings of 1–6 transformed to 0 and ratings of 7–9 transformed to 100. This is the so-called Top 3 Box, and shows the response transformed to study how the messages drive ‘important.’  The fourth dependent variable is ‘Bot 3’ with ratings 1–3 transformed to 100, and ratings of 4–9 transformed to 0. This is the so-called Bottom 3 Box, and shows the response transformed to study how the messages drive ‘irrelevant’ (or extremely unimportant.)

  3. Execute the study. We worked with a panel provider, Luci.id. The respondents were part of the Luc.id panel of several millions of respondents. Respondents were recruited to participateand compensated by the sample provider. Working with a sample provider specializing in these types of studies creates the possibility that the study can be executed and analyzed (at a superficial level) in a period of one-two days.

    The respondents who agree to participate were told to click on a link embedded in their email. The first screen required the respondents to profile themselves (age, gender, concern with diabetes.) The second screen introduced the study. The third screen (Figure 1) presented the first of the 24 systematically created vignettes. The entire process took approximately four minutes.  Figure 1 shows an example of the vignette:

  4. Run the regression model for the total panel: Relate the presence/absence of the 16 elements to the ratings (important = Top3; irrelevant = Bot3) using OLS (ordinary least-squares) regression. OLS provides an easy way to deconstruct the response to the vignettes into the contributions of the elements, and a predisposition (additive constant). Table 3A presents the parameters of the OLS regression run twice, first when the dependent variable was defined as Top3 (Ratings 1–6 → 0, Ratings 7–9 → 100) and Bot3 (Ratings 1–3 → 100, Ratings 4–9 → 0). The two transformations give a sense of what is really important and what is really irrelevant. Not important may or may be irrelevant.  Similarly, not irrelevant may or may not be important.

    Table 3A. Parameters of the regression models for Top3 (important) and Bot3 (irrelevant). Data from the total panel

    Top3 – Important

    Bot3 – Irrelevant

    Coeff

    T-Stat

    P-Val

    Coeff

    T-Stat

    P-Val


     Additive constant

    58.80

    7.70

    0.00

    5.74

    1.38

    0.17

    A3

    Diet and exercise are key to diabetes prevention

    8.16

    1.75

    0.08

    -4.57

    -1.80

    0.07

    A2

    Diabetes is dangerous without treatment

    6.86

    1.48

    0.14

    -3.28

    -1.29

    0.20

    D1

    Family support is important to manage diabetes

    5.25

    1.13

    0.26

    -2.88

    -1.13

    0.26

    B3

    Frequent doctor visits help adherence to diabetes treatment

    3.96

    0.85

    0.40

    0.37

    0.15

    0.88

    D2

    Learning how others cope with diabetes is beneficial

    2.55

    0.55

    0.58

    -2.99

    -1.19

    0.23

    D3

    Participation in workshops for patients helps manage diabetes

    2.43

    0.53

    0.60

    -4.77

    -1.89

    0.06

    D4

    Belonging to a community of patients helps support others with diabetes

    0.87

    0.19

    0.85

    -2.91

    -1.15

    0.25

    C4

    A patient should know all the possible treatments of diabetes

    0.17

    0.04

    0.97

    -0.66

    -0.26

    0.80

    B2

    People with diabetes use a lot of health services

    -2.62

    -0.56

    0.57

    2.37

    0.93

    0.35

    A4

    Diabetes is the most profound disease of this century

    -2.93

    -0.63

    0.53

    1.28

    0.51

    0.61

    C3

    A doctor should refer patients to educational materials about diabetes

    -2.94

    -0.63

    0.53

    3.30

    1.29

    0.20

    C1

    It’s a doctor’s role to educate patients about diabetes

    -4.13

    -0.88

    0.38

    0.90

    0.35

    0.73

    B4

    Diabetes requires a lot of medications

    -4.83

    -1.03

    0.30

    2.86

    1.12

    0.26

    A1

    By living longer there is a greater chance of suffering from Diabetes

    -9.33

    -2.00

    0.05

    1.11

    0.44

    0.66

    B1

    It’s OK to self-manage diabetes

    -17.27

    -3.65

    0.00

    9.01

    3.49

    0.00

    C2

    The internet is all you need to learn about diabetes

    -25.63

    -5.53

    0.00

    10.90

    4.31

    0.00

    1. Table 3A show three parameters from the OLS regression. The first is the coefficient, which is the probability that the vignette will receive a rating of 7–9 when the element is in the vignette (Top3) or that the vignette will receive a rating of 1–3 when the element is in the vignette (Bot 3).
    2. The second parameter is the T-statistic, a measure of signal to noise. The idea T value is as high as possible. The T statistic shows the magnitude of the coefficient divided by the expected variation of the coefficient. The higher the T statistic, the more likely it is that we are seeing a ‘real signal,’ and not just random fluctuation.
    3. The third parameter is the P-Value, the probability that the coefficient is really 0, and what we are seeing is some random deviation, but with a real value of 0.  The P value is inversely to the absolutely magnitude of the T statistic, which makes sense. The higher the signal/noise ratio, the more likely we have a real signal, and the lower is the P value.  P is simple the probability that are seeing the results of random fluctuation.

    The analysis is based on the fitted linear equation: Response = k0 + k1(A1) + k2(A2) … k16(D4)

    1. The additive constant indicates the probability that the rating will be assigned either a 7–9 in the absence of elements (Important; Top3) or a 1–3 in the absence of elements (Irrelevant: Bot3). Table 3A shows quite clearly that the respondents take the messaging seriously. The additive constant is 58.80, meaning that in the absence of elements (a purely hypothetical situation), we should expect 58.8, i.e., almost 60% of the responses to be ‘important.’ In contrast, the additive constant for Bot3 (irrelevant) is 5.74, meaning that only 6% of the responses are expected to be ‘irrelevant.’ The respondents treat the information as serious
    2. The most important elements are A3 (Diet and exercise are key to diabetes prevention) and A2 (Diabetes is dangerous without treatment.) These are the phrases to which people react most strongly.
    3. The most irrelevant elements are B1 (It’s OK to self-manage diabetes) and C2 (The internet is all you need to learn about diabetes).
  5. Run the regression model for key self-defined subgroups: For the total panel, it comes as a surprise that only two elements are deemed to be very important for the total panel (A3, A2), and only two elements are deemed to very irrelevant for the total panel (B1,C2). The remaining elements are generally modest in their importance. Such poor performance may stem either from the possible reality that today’s messages are simply not strongly relevant, or perhaps that there exist groups in the population responding to different messages. The results from the total panel do not show these groups. They must either identify themselves directly or be uncovered through statistical means.

The Mind Genomics experiment required the respondent to provide information about gender and age, respectively, as well as about degree of concern with diabetes.  The ages were divided into three ranges, following a hypothesis that there are certain general stages in a person’s life

Table 3B presents the coefficients for the Top3 model (importance) by total, gender, age, all self-defined groups, and by two groups of mind-sets, those extracted from two segments, and those extracted from three segments, respectively. The strong performing elements are shown as shaded cells with told numbers. The definition of a strong performing element is a coefficient of +7.51 or higher, rounded to a +8

Table 3B. Performance of all elements by self-defined subgroups and emergent mind-sets

Coefficients from equations relating the presence/absence of the elements to the rating of important (Top3)

Total

Male

Female

Age 13–34

Age 35–54

Age 55+

Mind-Set 2A – Focus on management with the help of others

Mind-Set 2B – Focus on the sufferer alone

Mind-Set 3C – Focus on the sufferer alone

Mind-Set 3D– The doctor is the source of knowledge

Mind-Set 3E – Focus on management with the help of others

Base size

50

25

25

25

12

12

28

22

18

13

19

Additive constant

59

73

44

61

62

48

66

53

62

43

67

A1

By living longer there is a greater chance of suffering from Diabetes

-9

-11

-6

-11

-2

-10

-9

-10

1

-5

-20

A2

Diabetes is dangerous without treatment

7

8

7

3

12

12

4

9

14

8

-1

A3

Diet and exercise are key to diabetes prevention

8

8

10

2

18

14

10

6

17

4

3

A4

Diabetes is the most profound disease of this century

-3

-5

1

-8

-1

6

-6

0

4

0

-10

B1

It’s OK to self- manage the Diabetes

-17

-15

-18

-14

-5

-33

-11

-26

-14

-27

-13

B2

People with diabetes use a lot of health services

-3

-5

0

-1

0

-9

-2

-8

-4

-13

2

B3

Frequent doctor visits help adherence to diabetes treatment

4

2

7

4

0

7

8

-4

4

-8

11

B4

Diabetes requires a lot of medications

-5

-5

-3

-6

0

-4

-2

-12

5

-22

-4

C1

It’s a doctor’s role to educate patients about diabetes

-4

-6

-2

-8

-6

3

-14

7

-13

16

-9

C2

The internet is all you need to learn about diabetes

-26

-30

-22

-27

-20

-32

-38

-13

-24

-4

-42

C3

A doctor should refer patients to educational materials about diabetes

-3

-11

5

-8

-2

4

-12

7

-13

20

-11

C4

A patient should know all the possible treatments of diabetes

0

-3

3

1

1

-1

-10

10

-3

12

-7

D1

Family support is important to manage diabetes

5

-1

11

2

7

14

11

-1

0

0

16

D2

Learning how others cope with diabetes is beneficial

3

1

3

-2

7

12

3

2

-5

4

8

D3

Participation in workshops for patients helps manage diabetes

2

-3

7

3

6

2

16

-12

-12

-2

19

D4

Belonging to a community of patients helps support others with diabetes

1

-2

3

-2

14

-1

7

-6

-10

-3

15

In a relatively large data set of the type we have, comprising 1200 responses from 50 respondents and 16 elements in the basic set of messages, with a variety of groups, it is natural for a variety of elements to score well, even by chance. The key to the data is whether we see interpretable patterns. With that caveat, we look now at the groups.

Gender

Males are more likely to rate the basic vignette as important, even without the message. The additive constant is 73 for males, and a much lower 44 for females.

Both genders believe in diet and exercise. Men feel that treatment is important (problem/solution), whereas women feel that social support from family is important.

Age

The younger respondents have a higher base level of belief that the vignette is important, even without the elements (additive constant =61 and 62), whereas the older respondents feel that its more likely the messages (additive constant = 48)

The youngest respondents (age 13–34) don’t feel that any message stands out

Both older groups recognize the important diet and exercise, and the need for treatment. In contrast, the youngest group does not agree. This is the group that needs the messaging.

Both older age groups recognize the importance of community support.

Beyond WHO to HOW THEY REACT TO SPECIFICS – Emergent Mind-Sets discovered with Mind Genomics

During the past sixty years or so marketers have recognized that people differ from each other in the way they look at the world, especially the everyday world. Of course, inter-individual variation is not new. The old proverb ‘of taste there is no dispute’ recognizes that people differ in what they like and what they do not like.  The issue facing science is to understand the nature of these inter-individual differences. The reductionist might wish to ascribe these differences to biological variations in composition, and indeed three quarters of a century ago, Dr William Sheldon discussed the personalities of people based on body type (ectomorph, mesomorph, endomorph). Author Moskowitz studied with one of Sheldon’s associates, S. S. Stevens at Harvard University in the 1960’s, had met Sheldon, and had many discussions with Stevens on the influence of body type as it affects behavior and thinking.

In some way, Mind Genomics emerged thirty years later from those initial discussions, not so much talking about the nature of the body type influencing behavior, but rather on the need to ‘reverse the discussion’ and discuss the how people differed in the specifics of their thinking, and perhaps from understanding these specifics, find a correlated physiological explanation. In other words, work in the opposite way, from the granular, the way of thinking about the specific topics, to the general.

The Mind Genomics exercise, as shown here, reveals that that response to different messages about diabetes does not reveal any massively strong messages. Dividing people by gender by age, and so forth, does not seem to produce the very large differences suggested either by pioneer market researcher [36] in his work on psychographic segmentation, nor the differences that might be expected from dividing people by body types.

Mind Genomics extends the nature of dividing people, working at the level of the very specific, looking at the patterns of coefficients for a set of respondents, for a single study, such as the study reported here on diabetes. The underlying principle is that, without theory, one can use the statistical powerhouse of clustering to divide a group of objects, here people, into complementary, i.e., non-overlapping groups. The division is based on strictly mathematical criteria and is agnostic to the meaning of the emergent groups. It is the task of the researcher to decide how many such groups (mind-sets, clusters) should be extracted [37] Parsimony is best, i.e., the fewer the number of such mind-sets, the better is the solution. Interpretability is a must; the mind-sets must ‘make intuitive sense’ and not seem to be forced combinations of divergent elements.

The specific method for creating these mind-sets comes from clustering. The objective is to divide the objects, here people, based upon the mathematical criteria underlying the specific clustering algorithm. In this study of diabetes, the clustering is based upon separating respondents into groups so that the ‘distances’ between the respondents within a group is low, and the distances between the centroids or averages of the groups on the 16 elements is high. The ‘distance between two people’ is operationally defined as the quantity (1-Pearson Correlation Coefficient.) The Pearson Correlation Coefficients shows the degree of linear relation between two variables, her the linear relation between two people, base upon their 16 coefficients. (The additive constant is not considered.)  The Pearson Correlation Coefficient, R,] ranges from a high of 1 for two people perfectly related to each other (distance = 1–1 = 0), to a low of -1 for two people perfectly inversely related to each other (distance = 1 – – 1 = 2).

How many mind-sets? The conflict between parsimony and explainability

The clustering procedure as described above is a mathematical exercise, which operates by strictly formal means, in turn agnostic to the meaning of the clusters extracted.  In actuality, the entire effort of clustering is to impose an interpretable order on what might otherwise be a cloud of different points. The clusters which emerge are simply way to understand this cloud of different points. Indeed, as SS Stevens, professor of Psychophysics at Harvard University would tell author HRM, ‘the hardest thing in science is to divide what is essentially a continuum into discrete points’ [38]

Mindful of the nature of clustering, to satisfy the mutually antagonistic objectives of parsimony (fewer are better) and interpretability (more let the story be simpler to emerge), we look at the results for two mind-sets (Mind-Set 2A vs Mind-Set 2B), and then the results for three mind-sets (Mind-Sets 3C, vs 3D vs 3E.)  Table 4 shows the strongest performing elements for each of the complementary mind-sets.  As Table 4 shows, increasing the number of segments to generate more mind-sets allows a finer set of gradations to emerge. For example, in the two-segment solution the ‘story’ is about the help of others versus the patient alone. When the two-segment solution is expanded to three segments, i.e., a new Mind-Set is permitted, the focus on the Doctor as the Expert emerges, a focus that could not emerge with the two-segment solution.

Table 4. Strongest messages emerging from the two versus three segment solution

Two-Segment Solution

Mind-Set 2A – Focus on management with the help of others

D3

Participation in workshops for patients helps manage diabetes

16

D1

Family support is important to manage diabetes

11

A3

Diet and exercise are key to diabetes prevention

10

B3

Frequent doctor visits help adherence to diabetes treatment

8

Mind-Set 2B– Focus on the sufferer alone

C4

A patient should know all the possible treatments of diabetes

10

A2

Diabetes is dangerous without treatment

9

Three Segment Solution

Mind-Set 3C – Focus on the sufferer alone

A3

Diet and exercise are key to diabetes prevention

17

A2

Diabetes is dangerous without treatment

14

Mind-Set 3E – The doctor is the source of knowledge

C3

A doctor should refer patients to educational materials about diabetes

20

C1

It’s a doctor’s role to educate patients about diabetes

16

C4

A patient should know all the possible treatments of diabetes

12

A2

Diabetes is dangerous without treatment

8

Mind-Set 3E – Focus on management with the help of others

D3

Participation in workshops for patients helps manage diabetes

19

D1

Family support is important to manage diabetes

16

D4

Belonging to a community of patients helps support others with diabetes

15

B3

Frequent doctor visits help adherence to diabetes treatment

11

D2

Learning how others cope with diabetes is beneficial

8

Beyond interest to ‘engagement’ – the value of response time as a measure

Experimental psychologists have sought physiological correlates of attention and psychological processes, doing so for more than a century. One of the earliest of these measures is the so-called ‘reaction time’ [39], presumed to reflect the amalgam of psychological forces interacting with each to drive a behavior. The response time itself is simply a measure but becomes of interest when it can be linked to antecedent stimuli.

In the Mind Genomics experiment, the computer system measured the response time between the appearance of the vignette on the screen and the rating assigned by the respondent.  The reaction times to the different vignettes vary, but like the ratings, it’s the deconstruction of the response times into the different contributions from the 16 elements which are of interest.  Again, the benefit of experimental design is that we know the exact contribution of each element.

The deconstruction uses the method of OLS regression, this time without the additive constant. The rationale for abandoning the additive constant is that in the absence of elements the response time to the vignette should be 0 seconds.

Table 5 shows the estimated response times to the different elements, by total panel, gender, and then the two mind-sets and the three mind-sets, respectively. To make the table easier to read, we have shaded all response times of 1.8 seconds or longer. This value of 1.8 is simply a convenient cut-point. Furthermore, the response time does not equal agreement

Table 5. Estimated response times in seconds to individual elements

Total

Male

Female

Age13–34

Age 35–54

Age 55+

Mind-Set2A

Mind-Set2B

Mind-Set3C

Mind-Set3D

Mind-Set3E

A4

Diabetes is the most profound disease of this century

1.9

1.7

2.0

1.8

1.4

2.4

1.6

2.2

2.0

1.7

1.9

A1

By living longer there is a greater chance of suffering from Diabetes

1.7

1.6

1.8

1.3

1.8

2.4

1.6

1.8

1.6

1.5

1.9

A2

Diabetes is dangerous without treatment

1.7

1.8

1.6

1.7

1.2

2.1

1.8

1.6

2.3

1.0

1.6

A3

Diet and exercise are key to diabetes prevention

1.7

1.7

1.7

1.6

1.3

2.2

1.6

1.7

2.0

1.2

1.7

C2

The internet is all you need to learn about diabetes

1.6

2.0

1.3

1.5

1.9

1.6

1.7

1.5

1.6

1.6

1.6

B2

People with diabetes use a lot of health services

1.6

1.6

1.6

1.3

1.7

2.0

1.4

1.8

2.0

1.5

1.2

C3

A doctor should refer patients to educational materials about diabetes

1.6

1.6

1.5

1.2

1.8

2.0

1.7

1.4

1.6

1.2

1.8

D4

Belonging to a community of patients helps support others with diabetes

1.6

1.7

1.4

1.0

2.3

1.9

1.4

1.8

1.7

1.6

1.4

B3

Frequent doctor visits help adherence to diabetes treatment

1.5

1.4

1.7

1.2

1.7

2.1

1.4

1.6

1.4

2.0

1.3

C1

It’s a doctor’s role to educate patients about diabetes

1.5

1.6

1.4

1.1

1.9

1.8

1.5

1.6

1.6

1.6

1.5

D2

Learning how others cope with diabetes is beneficial

1.5

1.5

1.5

1.4

1.8

1.4

1.7

1.4

1.6

1.3

1.6

B4

Diabetes requires a lot of medications

1.5

1.6

1.4

1.1

1.5

2.0

1.5

1.4

1.1

1.9

1.5

D1

Family support is important to manage diabetes

1.5

1.7

1.3

0.9

1.9

2.1

1.5

1.4

1.2

1.4

1.8

D3

Participation in workshops for patients helps manage diabetes

1.4

1.3

1.5

1.2

1.5

1.5

1.2

1.6

1.1

1.4

1.7

C4

A patient should know all the possible treatments of diabetes

1.4

1.6

1.1

1.1

1.6

1.6

1.3

1.4

1.4

1.3

1.3

B1

It’s OK to self-manage the Diabetes

1.3

1.5

1.0

0.8

1.4

1.8

1.0

1.5

1.3

1.8

0.8

Table 5 suggests that when we look at the elements which occupy a respondent’s attention, take longer to read, the elements are information, rather than exhortative. That is, the respondents pay attention to phrases which relevant information. Each of the three phrases below provides information that can be used to make decisions.

Diabetes is the most profound disease of this century

By living longer there is a greater chance of suffering from Diabetes   

Diabetes is dangerous without treatment

Finding Mind-Sets in the population through the PVI (personal viewpoint identifier)

Diabetes poses a general risk to people and to the economy world-wide.  Communications which fail to recognize the existence and nature of the different mind-sets involved in diabetes are likely to be less than optimal. Indeed, as Table 3B shows quite clearly, when we look at newly revealed Mind-Sets in the population, we see that some messages are simply irrelevant, whereas others seem irrelevant on average, but are quite polarizing, striking a strong chord among one mind-set and turning off the other mind-sets. Finding the compelling messages is critical for all cultures, and all economic groups [40,41,42,43]

The differences between and among mind-sets can either be ignored at the peril of choosing irrelevant or negatively messages on the one hand or choosing the most effective message for each person on the other.  The latter is clearly preferable, namely choose the correct message.  The question is ‘How?’ A facile answer is ‘Big Data’ and the well-worn but meaningless statement ‘the answer has to got to be in there, somehow.’  The reality is that the answer is probably not easy to find in Big Databut may be easy to find using a slightly different approach, the data emerging from the Mind Genomics experiment.

A sense of the frustration with using conventional data analytics can be obtained from Table 6, which shows the number of respondents in the set of 50, belonging to each of the three mind-sets, versus the self-defined classification of age (WHO) and stated concern with diabetes (PSYCHOGRAPHIC.)  There is no pattern, and indeed in most Mind Genomics studies evidencing clear mind-sets, the covariation of these mind-sets with traditional, easy-to-find groups in the population has been disappointing at best.  The reason is simple. ‘Birds of a feather DO NOT THINK ALIKE.’  Quite simply, just because two people resemble each other on criteria easy to measure does not mean that they share the same world-view, and more important, does not mean that they share the same mind-set for a specific issue, such as diabetes.

Table 6. Distribution of the 50 respondents by mind-set (column) versus age (row) and versus concern with diabetes (row)


MindSet1
Focus on the sufferer

MindSet2
The doctor is the source of knowledge

MindSet3  Focus on management with the help of others

Total

Total

18

13

19

50

Demographic –

Age

Younger

9

6

10

25

Middle

7

1

4

12

Older

2

5

5

12

No Answer

1

Psychographic – Concern with diabetes

I have diabetes

1

1

3

5

I worry about becoming diabetic

4

1

0

5

I am at risk for diabetes

3

0

2

5

Diabetes is never on my mind

3

1

1

5

Not applicable

7

10

13

30

We already know the coefficients for the same elements, but from different mind-sets.  The task is to identify those elements which best differentiate between two or among three mind-sets and create a scoring system. The new respondent, whose mind-set is to be determined, is presented with the set of elements, in the form of six no/yes questions, creating 64 combinations. The pattern of the combinations determines the most likely mind-set to which the respondent will be assigned.  The task is simple. The results are not perfect, of course, but give the opportunity for a quick assignment of a person to the most likely mind-set. In addition, the PVI is based solely on the data from the study which uncovered the mind-sets in the first place, and thus the PVI does not need to intervening variables or hypothetical constructs.

Figure 2 shows the six question PVI. Figure 3 shows the set of answers, feedback, either for the person being typed, or for the health professional who is counseling or treating the patient.  The power of the PVI is its ability to personalize the message, and thus generate potentially greater compliance or behavior change. The PVI addresses the sensibilities of the individual rather being a random shot of information, determined for the population at large, and which through the process of attenuation by having to appeal to different factions, ends up modestly appealing to many people, and thus for the most part, bland and ineffective.

Mind Genomics-022 EDMJ Journal_F2

Figure 2. The six-question PVI for diabetes

Mind Genomics-022 EDMJ Journal_F3

Figure 3. The three feedback pages, each attuned to the sensibilities of the person assigned to the mind-set by the diabetes-focused PVI

Discussion and conclusions

Mind Genomics provides a new vision for the world of the person’s experience with the worlds of medicine and public health.  Whereas much of what we know about medicine comes from clinical studies with patients as test subjects, and in turn, much of what we know about public health comes from statistical studies of populations, Mind Genomics plunges right into the mind of the person, to find out what is important.  Mind Genomics begins at the bottom, at the simplest level of communication, the communication of facts and suggestions. Soon, however, Mind Genomics moves on to understanding the attitudes of the person towards issues and situations in medicine and public health.  In doing so Mind Genomics may be said to provide a major advance to the worlds of medicine and public health because it deals with the person, the specifics, and recommends actions.

A proactive health program recognizes the need for better communications (23,44)Until now, however, the focus has been on recognizing the ‘need’ and ‘effectiveness’ of communication, viz., on the establishment of these topics as relevant. Enter Mind Genomics with the ‘HOW,’ the specific ‘WHAT TO SAY.’  We may hope for a more powerful, more specific, targeted, effective communication, which in the case of diabetes may lead to more healthful activities before diabetes strikes, and in turn more medically-relevant compliance and behavior just as diabetes strikes, or threatens to strike.

Acknowledgment

Attila Gere thanks the support of the Premium Postdoctoral Researcher Program of the Hungarian Academy of Sciences

References

  1. Chen R, Song Y, Hu Z, Brunner EJ (2012) Predictors of diabetes in older people in urban China. PloS one 7: 50957.
  2. World Health Organization: World Diabetes: https://www.who.int/news-room/fact-sheets/detail/the-top-10-causes-of-death. Retrieved on May 25, 2019.
  3. Feigin VL, Roth GA, Naghavi M, Parmar P, Krishnamurthi R, et al (2016) Global burden of stroke and risk factors in 188 countries, during 1990–2013: a systematic analysis for the Global Burden of Disease Study 2013. The Lancet Neurology 15: 913–924..
  4. Krug EG (2016) Trends in diabetes: sounding the alarm. The Lancet 387: 1485–1486.
  5. Guariguata L, Whiting DR, Hambleton I, Beagley J, Linnenkamp U, et al (2014) Global estimates of diabetes prevalence for 2013 and projections for 2035. Diabetes research and clinical practice 103: 137–149.
  6. Shaw JE, Sicree RA, Zimmet PZ,( 2010) Global estimates of the prevalence of diabetes for 2010 and 2030. Diabetes research and clinical practice 87: 4–14.
  7. Whiting DR, Guariguata L,Weil C, Shaw J (2011) IDF diabetes atlas: global estimates of the prevalence of diabetes for 2011 and 2030. Diabetes research and clinical practice 94: 311–321.
  8. International Diabetes Federation: IDF Diabetes Atlas (2011), Brussels, Belgium: International Diabetes Federation, 5; Risk factors. 2014. www.idf.org/about-diabetes/risk-factors.
  9. Wang, Yu, Zhang, Li et al,(2014)
  10. Bommer C, Heesemann E, Sagalova V, Manne-Goehler J, Atun R, et al (2017) The global economic burden of diabetes in adults aged 20–79 years: a cost-of-illness study. The lancet Diabetes & endocrinology 5: 423–430.
  11. Hackworth N, Moore SM, Hardie E (2007) A risk factor profile for pre-diabetes: biochemical, behavioural, psychosocial and cultural factors. eJApplPsychol 3: 14–26.
  12. Mumu SJ, Saleh F, Ara F, Haque MR, Ali L (2014) Awareness regarding risk factors of type 2 diabetes among individuals attending a tertiary-care hospital in Bangladesh: a cross-sectional study. BMC research notes 7: 599.
  13. Niederdeppe J, Bu QL, Borah P, Kindig DA, Robert SA (2008) Message design strategies to raise public awareness of social determinants of health and population health disparities. The Milbank Quarterly 86: 481–513.
  14. Moskowitz HR (2012) ‘Mind genomics’: The experimental inductive science of the ordinary, and its application to aspects of food and feeding. Physiology & Behavior 107: 606–613.
  15. Moskowitz HR (2014) 14 Mind genomics® and texture: the experimental science of everyday life. In: Food Texture Design and Optimization In: Dar YL, Light JM (eds.) John Wiley.
  16. Moskowitz H, Gofman A (2003) I-nnovation Inc, System and method for content optimization. U.S. Patent: 6,662,215.
  17. Gabay G, Zemel G, Gere A, Zemel R, Papajorgji P, et al (2018) On the threshold: What concerns healthy people about the prospect of Cancer? Cancer Studies and Therapeutics Journal, 3: 1–10.
  18. Gabay G, Moskowitz HR, Silcher M, Galanter E (2017) New NovumOrganum: Policy, perceptions and emotions in health Pardes-Ann Harbor Academic Press.
  19. Gabay G, Gere A, Stanley, Habsburg-Lothringen C, Moskowitz H (2019) Health Threats Awareness – Responses to Warning Messages about Cancer and Smartphone Usage. Cancer Stud Ther J  4: 1–10.
  20. Gabay G, Gere A, Moskowitz H (2019) Understanding Effective Web Messaging – The Case of Menopause. IntegrGynObstet J 2: 1–16.
  21. Gabay G, Gere A, Zemel G, Moskowitz D, Shifron R, et al (2019) Expectations and Attitudes Regarding Chronic Pain Control: An Exploration Using Mind Genomics. Internal Med Res Open J 4: 1–10.
  22. Gabay G, Gere A, Moskowitz H (2019) Uncovering Communication Messages for Health Promotion: The Case of Arthritis. Integr J OrthopTraumatol 2: 1–13.
  23. Aikens JE, Bingham R, Piette JD (2005) Patient-provider communication and self-care behavior among type 2 diabetes patients. The Diabetes Educator 31: 681–690.
  24. Freeman J, Loewe R (2000) Barriers to communication about diabetes mellitus. Journal of Family Practice 49:  507.
  25. Greene JA, Choudhry NK, Kilabuk E, Shrank WH (2011) Online social networking by patients with diabetes: a qualitative evaluation of communication with Facebook. Journal of General Internal Medicine 26: 287–292.
  26. Rhodes P, Nocon A (2003) A problem of communication? Diabetes care among Bangladeshi people in Bradford. Health & social care in the community 11: 45–54.
  27. Dar-Nimrod I, Rawn CD, Lehman DR, Schwartz B (2009) The maximization paradox: The costs of seeking alternatives. Personality and Individual Differences 46: 631–635.
  28. Box GE, Hunter WG, Hunter JS (1978) Statistics for experimenters, New York, John Wiley
  29. Moskowitz HR, Gofman A (2007) Selling blue elephants: How to make great products that people want before they even know they want them. Pearson Education.
  30. Moskowitz HR, Gofman A, Beckley J, Ashman H (2006) Founding a new science: Mind genomics. Journal of sensory studies 21: 266–307.
  31. Green PE, Rao VR (1971) Conjoint measurement for quantifying judgmental data. Journal of marketing research 8: 355–363.
  32. Green PE, Srinivasan V (1990) Conjoint analysis in marketing: new developments with implications for research and practice. The journal of marketing 54: 3–19.
  33. Moskowitz HR, Gofman A, Itty B, Katz R, Manchaiah M, et al (2001) Rapid, inexpensive, actionable concept generation and optimization: the use and promise of self-authoring conjoint analysis for the food service industry. Food Service Technology 1: 149–167.
  34. Kahneman D, Egan P (2011) Thinking, fast and slow. New York: Farrar, Straus and Giroux.
  35. Gofman A, Moskowitz H (2010) Isomorphic permuted experimental designs and their application in conjoint analysis. Journal of Sensory Studies 25: 127–145.
  36. Wells WD (2011) Chapter 13: LifeStyle and Psychographics: Definitions, Uses, and Problems. In: Wells WD (ed.), LifeStyle and Psychographics. Marketing Classics Press Decatur, GA, USA.
  37. Dubes R, Jain AK (1980) Clustering methodologies in exploratory data analysis. Advances in Computers19: 113–238.
  38. Stevens SS (1966) Personal communication to Howard Moskowitz, Harvard University, Department of Psychology, Laboratory of Psychophsysics.
  39. Rieber RW, Robinson (2001) Wilhelm Wundt in history: The making of a scientific psychology In: DK (eds.).  Springer Science & Business Media. Heidelberg, New York,USA.
  40. Heisler M, Bouknight RR, Hayward RA, Smith DM, Kerr EA (2002) The relative importance of physician communication, participatory decision making, and patient understanding in diabetes self-management. Journal of general internal medicine 17: 243–252.
  41. Heisler Michele, Ian Cole, David Weir, Eve A Kerr, Rodney A Hayward (2007) “Does physician communication influence older patients’ diabetes self-management and glycemic control? Results from the Health and Retirement Study (HRS).”  The Journals of Gerontology Series A: Biological Sciences and Medical Sciences 62: 1435–1442.
  42. Matthews SM, Peden AR, Rowles GD (2009) Patient–provider communication: Understanding diabetes management among adult females. Patient education and counseling 76: 31–37.
  43. Schillinger D, Bindman A, Wang F, Stewart A, Piette J (2004). Functional health literacy and the quality of physician–patient communicationamong diabetes patients. Patient education and counseling 52: 315–323.
  44. Naik AD, Kallen MA, Walder A, Street Jr RL (2008) Improving Hypertension Control in Diabetes Mellitus, the Effects of Collaborative and Proactive Health Communication. Circulation 117: 1361.

High Energy CdZnTe 3D-Detectors for Spectroscopy and Polarimetry

DOI: 10.31038/NAMS.2019224

Introduction

The semiconductor detectors technology has dramatically changed the broad field of X- and γ-rays spectroscopy and imaging. Semiconductor detectors, originally developed for particle physics applications, are now widely used for X/γ-rays spectroscopy and imaging in a large variety of fields, among which for example, X-ray fluorescence, γ-ray monitoring and localisation, non-invasive inspection and analysis, high energy astronomy, and diagnostic medicine. The success of semiconductor detectors is due to several unique characteristics as the excellent energy resolution, the high detection efficiency and the possibility of development of compact and highly segmented detection systems. Among the semiconductors device, silicon (Si) detectors are the key detectors in the soft X-ray band (<15 keV). Si-PIN diode detectors and silicon drift detectors (SDDs) [1], operated with moderate cooling by means of small Peltier cells, show excellent spectroscopic performance and good detection efficiency below 15 keV. On the other side germanium (Ge) detectors are unsurpassed for high resolution spectroscopy in the hard X-ray energy band (>15 keV) and will continue to be the first choice for laboratory-based high performance spectrometers [2].

However, in the last decades, there has been an increasing demand for the development of room temperature detectors with compact structure having the portability and convenience of a scintillator but with a significant improvement in energy resolution and/or spatial resolution. To fulfill these requirements, numerous high-Z and wide band gap compound semiconductors have been exploited [3,4]. In fact, as demonstrated by the impressive increase in the scientific literature and technological development around the world, cadmium telluride (CdTe) and cadmium zinc telluride (CdZnTe or simply CZT) based device are today dominating the room temperature semiconductor applications scenario, being widely used for the development of X/γ-ray instrumentations [5,6].

In this paper we will focus on a particular type of detectors based on sensitive elements of CZT namely, spectrometers with spatial resolution in three dimensions. These, in fact, represent the new frontiers for applications in different fields that require increasing performance such as high energy astrophysics, the environmental radiation monitoring, medical diagnostics with PET and inspections for homeland security. The advantages offered by the possibility to reconstruct both the position of interaction of the incident photons in three dimensions (3D) and the energy deposited by each interaction are of fundamental importance for applications that require a high detection efficiency even at high energies (> 100 keV), i.e. in the Compton scattering regime, as well as a wide-field localization of the direction of incidence and a uniform spectroscopic response throughout the sensitive volume. In fact the possibility to reconstruct the photon interaction position in 3D will allow to correct from signal variations due charge trapping and material non uniformity and therefore allow to increase the sensitive volume of each detector unit without degrading the spectroscopic performance.

Principles of Operation

The typical operation of semiconductor detectors is based on collection of the charges, created by photon interactions, through the application of an external electric field. The choice of the proper semiconductor material for a radiation detector is mainly influenced by the energy range of interest. Among the various interaction mechanisms of X-rays and gamma rays with matter, three effects play an important role in radiation measurements: photoelectric absorption, Compton scattering and pair production. In photoelectric absorption the photon transfers all its energy to an atomic electron, while a photon interacting through Compton process transfers only a fraction of its energy to an outer electron, producing a hot electron and a degraded photon; in pair production a photon with energy above a threshold energy of 1.02 MeV interacts within the Coulomb field of the nucleus producing an electron and positron pair. Neglecting the escape of characteristic X-rays from the detector volume (the so called fluorescent lines), only the photoelectric effect results in the total absorption of the incident energy and thus gives useful information about the photon energy. The interaction cross sections are highly dependent on the atomic number. In photoelectric absorption it varies as Z4,5, Z for Compton scattering and Z2 for pair production.

Semiconductor detectors for X-ray and γ ray spectroscopy behaves as solid-state ionization chambers operated in pulse mode. The simplest configuration is a planar detector i.e. a slab of a semiconductor material with metal electrodes on the opposite faces of the semiconductor (Figure 1). Photon interactions produce electron-hole pairs in the semiconductor volume through the discussed interactions. The interaction is a two-step process where the electrons created in the photoelectric or Compton process lose their energy through electron-hole ionization. The most important feature of the photoelectric absorption is that the number of electron-hole pairs is proportional to the photon energy. If E is the incident photon energy, the number of electron-hole pairs N is equal to E/w, where w is the average pair creation energy. The generated charge cloud is Q0 = eE/w. The electrons and holes move toward the opposite electrodes, anode and cathode for electrons and holes, respectively (Figure 1).

NAMS 2019-109 - Stefano del sordo Spain_F1

Figure 1. Planar configuration of a semiconductor detector: (a). Electron–hole pairs, generated by radiation, are swept towards the appropriate electrode by the electric field; (b) the time dependence of the induced charge for three different interaction sites in the detector (positions 1, 2 and 3). The fast rising part is due to the electron component, while the slower component is due to the holes

The movement of the electrons and holes, causes variation ΔQ of induced charge on the electrodes and it is possible to calculate the induced charge ΔQ by the Shockley–Ramo theorem [7]. The charge collection efficiency is a crucial property of a radiation detector and affects the spectroscopic performances and in particular the energy resolution. High charge collection efficiency ensures good energy resolution which also depends by the statistics of the charge generation and by the noise of the readout electronics. Therefore, the energy resolution (FWHM) of a radiation detector is mainly influenced by three contributes:

NAMS 2019-109 - Stefano del sordo Spain_F4

The first contribution is the Fano noise due to the statistics of the charge carrier generation. In semiconductors, the Fano factor F is much smaller than unity (0.06–0.14) [8]. The second contribute is the electronic noise which is generally measured directly using a precision pulser, while the third term takes into account the contribution of the charge collection process. Different semi-empirical relations have been proposed for the charge collection contribution evaluation of different detectors [9]. (Figure 2) shows a typical spectroscopic system based on a simple semiconductor detector. The detector signals are amplified by a charge sensitive preamplifier (CSP) and then shaped by a linear amplifier (shaping amplifier). Energy spectra are obtained by a multichannel analyzer (MCA) which samples and records the shaped signals.

NAMS 2019-109 - Stefano del sordo Spain_F2

Figure 2. Block diagram of a standard spectroscopic detection system for X- and γ-rays.

3D CZT Sensor Configurations and Developments

One of the most recent development in this field regards the so called three dimensional (3D) detectors. A 3D spectrometer is, in principle, a detector divided into volume elements (voxels), each operating as an independent spectroscopic sensor. The signal produced in each voxel by the interaction of an incoming X/γ photon must be able to be is read and converted into a voltage signal proportional to the energy released. If the readout electronics of the detection system implements a coincidence logic, it will be possible to determine to some extent the history of the incident photon inside the sensitive volume by associating the energy deposits in more voxels to the same incident photon. The need for this type of sensors comes from the applications requirements. For example, in the field of hard X- and soft γ-rays astrophysics (10–1000 keV), there are promising developments of new focusing optics operating for up to several hundreds of keV, through the use of broadband Laue lenses [10] and new generation of multilayer mirrors [11]. These systems make it possible to push the sensitivity of a new generation of innovative high energy space telescopes at levels far higher (100–1000 times) than current instrumentation. To obtain the maximum return from this type of optics up to MeV, then you it is required the use of focal plane detectors with high efficiency (> 80%) even at higher energies and with that shall have also the ability to measure the energy spectrum with good spectroscopic resolution and also to localize accurately (0.1–1 mm) the point of interaction of the photons used for the correct attribution of their direction of origin in the sky.

In fact the realization of 3D spectrometers by a mosaic of single CZT crystals is not as easy as for the case of bi-dimensional imagers, mainly because to the small dimension of each sensitive unit necessary to guarantee the required spatial resolution and also for the intrinsic difficulty of packaging in 3D sensor units in which each one requires an independent spectroscopic readout electronics chain. A solution is offered by the realization of stack of 2D spectroscopic imagers [12, 13]. This configuration, is very appealing for large area detector, but has several drawbacks for application requiring fine spatial resolution in three-dimension and compactness. Indeed the distance between each 2D layer of the stack limits the accuracy and the sampling of the third spatial coordinate as well as passive materials are normally required for mechanical support.

To solve this kind of problems, in the last 10–15 years, there have been several groups that have focused their activity on the development of sensors based on high volume (1–10 cm3) crystals of CZT/CdTe capable of intrinsically operating as 3D spectrometers and therefore able to meet the requirements for certain applications, or to make more efficient and easy the realization of 3D detectors based on matrices of these basic units. The main benefits are: a limited number of required readout channels to achieve the same spatial resolution, packing optimization and a reduction of passive material between sensitive volumes. In these developments, a key role is played by the adopted electrode configurations. Various electrode configurations have been proposed and studied to improve both the spectroscopic performance and the uniformity of the response of CZT detectors compensating and correcting problems related to trapping and low mobility of the charge carriers in these materials. In fact, these electrode configurations, with the implementation of appropriate logical reading of the signals, makes it intrinsically able to determine the position of interaction of the photon in the direction of the collected charge (depth sensing) and therefore are particularly suited to the realization of 3D monolithic spectrometers without requiring a drastic increase of the electronics readout chains. In the framework of a project recently funded by the Italian Space Agency we are working on the development of a 3D CZT prototype for astrophysical applications and, in particular, on the realization of an advanced front-end electronics based on the RENA3 ASIC suitable for a flexible qualification and characterization of several CZT crystal samples. Here we report some detail about the development of this electronics.

Electronic chain for selection and qualification of 3D CZT detectors

The processing of the signals provided by a 3D CZT detector required to obtain an imaging-spectroscopy device needs sophisticated electronics. The detector treated here, for example, is biased so as to provide the signals through three different types of electrodes: anodes, cathodes and drift strips. For this reason the front-end electronics has to be able to process signals of both polarities, positive and negative, in the case of cathodes and anodes, and of a polarity unknown in the case of the drift strip. The main function of the analogue front-end electronics (AFEE) is to connect the 12 anode strips and the 10 cathodes to a RENA-3 ASIC from NOVA R&D Inc. (CA, USA) used as signal readout device (RENA-3TM IC User Specifications Rev 1.31, May 11, 2015). The RENA-3 ASIC is a 36- channel charge sensitive amplifier self-triggering. Each channel includes a low-noise preamplifier, a shaper with sample/hold, and in addition a fast shaper that gives a trigger signal for coincident event detection. The signal range is selectable channel by channel over two full scales (equivalent to 200 keV and 1.3 MeV for CZT) as the peaking time that ranges from 0.1 to 40 μs. The comparator thresholds can be adjusted through an 8 bit DAC on each channel in order to obtain an accurate and uniform threshold setting. A pole-zero cancellation circuit is available for minimizing pileup errors. All these features are selectable by software and are independent for each input channel.

A very important feature for our purposes is the presence of two trigger chains, a “slow” and a “fast”, each of which has programmable thresholds, independent of each other and configurable channel by channel. Through the slow trigger chain and the associated digital register, it is possible to know which channels produced a trigger, or in other words which channels were affected by an event with energy higher than set threshold. This information allows to digitally convert only the triggered channels (sparse MODE), thus contributing to the decrease of the total acquisition time and then of the dead time. In any case, there is always the possibility to digitally convert all 36 channels, independently by the trigger condition and consequently increasing the system dead time. The slow trigger signal starts the acquisition phase sampling and holding, of the 10 cathodes and the 12 anodes signals. The acquired signals are then digitized by an external ADC, managed by an FPGA, which converts one channel at a time given the presence of a single output. Peak detector, present in each channel, allows to keep the maximum value of the signal for a necessary time to be able to convert all channels by the single external ADC. The fast trigger chain allows the time-stamp implementation within each individual channel and the generation of the system trigger. The time-stamp function is obtained through two cells that sample and hold the amplitude of two quadrature sinusoids when channel fast trigger occurs. The acquired sinusoids values are extracted and digitized using the same acquisition procedure. From the knowledge of these values it possible univocally determine to the timing informations within a period of the two sinusoids. Therefore, with this technique it is possible to establish the time interval between an event detected by two different portions of the detector belonging to two different channels of the RENA3.

Moreover, in our system the fast trigger is sent to an FPGA, in which it runs an algorithm with configurable parameters, that triggers the acquisition of the signal produced by the drift strips. The digitized data related to signal and time intervals are transferred from the FPGA to the PC, in which a software allows to calculate the energy collected by each electrode and relate it to the events recorded by the drift strips and taking into account temporal coincidences.

The block diagram of the system is shown in the figure:

NAMS 2019-109 - Stefano del sordo Spain_F3

Several analysis and characterization systems are being developed to study 3D-CZT detectors, that use fast ADCs and algorithms that run on FPGA, aimed at reducing the large amount of data produced by sampling. These systems have the advantage of providing to the user all the informations of each single event. On other hand the “firmware” algorithms, involved to reduce the big amount of data, are hard to optimize. Furthermore, fast components and high-performance algorithms running on FPGA, required more power than an acquisition system based on peak detector.

We are realizing a system that does not want to achieve performance of fast sampling or the processing of digital data in real-time, but wants to reach a good compromise between performance, space and power consumption requirement so that it can be well exploited in space applications.

Considerations on 3D CZT Spectrometers Applications

The development of CZT spectrometers with high 3D spatial resolution and fine spectroscopy represent a real challenge to the realization of a new class of high performance instruments able to fulfil the current e future requirements in several applications fields. The possibility to achieve also a very good detection efficiency, even at high energy (up to few MeV) [14], because of the sensitive volumes that can be obtained also by mosaic or stack of 3D sensor unit, without losing significantly their spectroscopic performance and response uniformity, together with their capability to operate at room temperature, are really appealing for application as radiation monitoring and identification [7] and homeland security as well as in industrial non-invasive controls and, in the research field, for new hard X- and soft γ-ray astronomy instrumentations. Furthermore, the fine spectroscopy (few % at 60 keV and <1% above 600 keV) and the high 3D spatial resolution (0.2–0.5 mm), that these devices can guarantee coupled with an high performance readout electronics, allow to operate not only in full energy mode, but also as Compton scattering or pair detectors if equipped with an appropriate electronics providing a suitable coincidence logic to handle multi hit events. This possibility imply that these sensors are suitable to realize wide field detector for γ-ray sources (> 100 keV) localization and detection both in ground and space applications [15]. Evaluation done using a single 3D CZT sensor, as a 4π Compton Imager, has demonstrated the possibility to obtain an angular resolution ~15° at 662 keV. This is really an excellent result in the small distance scale used to reconstruct the Compton events kinematics and can be achieved only because the good 3D and spectroscopic performance of the CZT proposed sensor units.

On the possibility to operate 3D spectrometers as Compton scattering detectors rely the appealing opportunity to utilize these devices for measurements of hard X- and soft γ-rays polarimetry. Today, this type of measurement is recognized of fundamental importance in high energy astrophysics and is one of the most demanding requirements for next space mission instrumentation in this energy range (10–1000 keV). The presence of linearly polarized photons in the incoming flux from a cosmic source determine a modulation in the azimuthal direction of Compton scattered events. A 3D spectrometer able to handle properly scattered events is intrinsically able to measure this modulation, i.e. operate as a scattering polarimeter [15]. The quality (modulation factor) of a scattering polarimeter is strictly dependent on his spatial resolution and spectroscopic performance. Several experimental measurements [16,17, 18] and simulation model have demonstrated that a detector allowing a good selection of events using both the spectroscopic and position information of each hits can achieve very high modulation factor. In particular the possibility to select events within thin layer of the sensitive volume, thanks to the intrinsic 3D segmentation of the detector (i.e. close to 90° scattering direction), drastically improve the modulation factor and therefore the reliability of the polarimetric measurements.

References

  1. Lechner P (2004) Novel high-resolution silicon drift detectors. X Ray Spectrometry 33; Pg No: 256.
  2. Eberth J, Simpson J (2006) From Ge (Li) detectors to gamma-ray tracking arrays-50 years of gamma spectroscopy with germanium detectors. Progress in Particle and Nucl Phys 60; Pg No: 283.
  3. Owens A, Peacock A (2004) Compound semiconductor radiation detectors. Nucl Instr and Meth in Phys Res A  531; Pg No: 18.
  4. Sellin PJ (2003) Recent advances in compound semiconductor radiation detectors. Nucl Instr and Meth in Phys Res A 513; Pg No: 332.
  5. Lebrun F (2003) ISGRI: The INTEGRAL Soft Gamma-Ray Imager. Astronomy & Astrophysics 411; Pg No: L141.
  6. Ogawa K, Muraishi M (2010) Feasibility Study on an Ultra-High-Resolution SPECT with CdTe Detectors. IEEE Trans. on Nucl. Sci 57; Pg No: 17.
  7. Wahl CG, He Z (2011) Gamma-Ray Point-Source Detection in Unknown Background Using 3D-Position-Sensitive Semiconductor Detectors. IEEE Trans On Nucl Sci 58; Pg No: 605.
  8. Devanathan R (2006) Signal variance in gamma-ray detectors – A review. Nucl Instr Meth in Phys Res A 565; Pg No: 637.
  9. Kozorezov AG (2005) Resolution degradation of semiconductor detectors due to carrier trapping. Nucl Instr Meth in Phys Res A 546; Pg No: 207.
  10. Frontera F (2013) Scientific prospects in soft gamma-ray astronomy enabled by the LAUE project. Proc of SPIE 8861, Pg No: 886106-1.
  11. Della Monica Ferreira D (2013) Hard X-ray/soft gamma-ray telescope designs for future astrophysics missions. Proc. of SPIE 886; Pg No: 886116-1.
  12. Watanabe S (2009) High Energy Resolution Hard X-Ray and Gamma-Ray Imagers Using CdTe Diode Devices. IEEE Trans on Nucl Sci 56; Pg No: 777.
  13. Judson DS (2011) Compton imaging with the PorGamRays spectrometer. Nucl Instr and  Meth in Phys Res  652; Pg No: 587.
  14. Boucher YA (2011) Measurements of Gamma Rays above 3 MeV using 3D Position-Sensitive 20×20×15 mm3 CdZnTe Detectors. IEEE Nucl. Sci Symp Conference Rec Pg No: 4540.
  15. Xu D (2004) 4π Compton imaging with single 3D position sensitive CdZnTe detector. Proc of SPIE 5540; Pg No: 144.
  16. Curado da Silva RM (2011) Polarimetry Study With a CdZnTe Focal Plane Detector. IEEE Trans On Nucl Sci 58; Pg No: 2118.
  17. Antier S (2014) Hard X-ray polarimetry with Caliste, a high performance CdTe based imaging spectrometer. submitted to Experimental Astronomy.
  18. Lee K (2010) Development of X-ray and Gamma-ray CZT detectors for Homeland Security Applications. Proc of SPIE 7664; Pg No: 766423-1.

Analysis and Comparison of Mechanical-Structural Properties of Polymeric Compounds Reinforced With GTR Particles

DOI: 10.31038/NAMS.2019223

Summary

A serious environmental problem, which affects most of the countries for years, is the massive use of tires, which once used, generate large stocks of waste material. A common method to process these used tires goes through crushing, in which the fiber, steel and rubber obtained from the crushing process are separated. This article affects the reuse of rubber obtained from these tires, also called GTR (Ground Tires Rubber), by mixing with various thermoplastic polymeric compounds, in order to improve some of its mechanical and structural properties, and at the same time, give exit to these surpluses that cause already used tires. For this purpose, the article analyzes the mechanical-structural properties of seven common thermoplastic polymers, which mixed with the GTR ) for a single particle size (p <200µm). could be useful in industrial processes. From the results obtained, it follows that this proposal is valid, in lower percentages of GTR (5% -10% of GTR) analyzed (from 5% to 70% of GTR).

Keywords

GTR, Recycling, Reuse, Composite, Microstructural Analysis, Mechanical Properties, Polymeric compounds, thermoplastics, Scanning Electronic Microscopy

Introduction

The environmental problem of the accumulation of used tires (GTR) [1–3] has driven the efforts of the scientific community to seek solutions for the recovery and reuse of these tires. In general, a thermoplastic or thermosetting polymer acts as a matrix and the elastomer (GTR) acts as a dispersed phase [4–6] or reinforcement. As in other two-phase polymer mixtures, in these compounds [7–8] the interfacial compatibility between components is basic to achieve the desired mechanical properties. In the case of recycled elastomers, the expected compatibility is low, so it is intended to increase this compatibility by reducing the degree of GTR crosslinking by devulcanization [9–11], also observing significant changes in the properties when we vary the particle size of GTR [12] reinforcement. The use of these recycled tires as reinforcements in composite materials has been extensively studied in numerous works of physical characterization of polymers with GTR particles, but in this case, a complete comparative mechanical and structural analysis of these properties in different compounds has been performed [13–15], quantifying how the presence of GTR in the polymer matrix modifies its mechanical behavior. The size of the GTR particles, in this work, is restricted to p <200μm. The aim is to analyze what percentage of GTR can be added to the different polymeric matrix polymers (PVC, EVA, HDPE, PP, PA, ABS and PS) analyzed, in order to keep their mechanical properties and structure of the polymers within acceptable values [16 -18]. For this purpose, several concentrations of Polymer / GTR (from 0% to 70% in GTR) have been analyzed, with one particle size, always with the GTR as a reinforcing agent. Some authors such as [19 -20] have observed that the presence of carbon black as reinforcement in composites increases the mechanical properties. Composite materials are heterogeneous, and their properties depend on the quantity, size and shape of the reinforcement, as well as other factors such as their preparation, or their compatibility.

[21] have studied different PVC samples with different compositions and varying proportions of additives such as carbon black (CB). Studies show that PVC with CB produces compounds that improve mechanical properties. In summary, the objectives of this research are to analyze and compare the mechanical-structural behavior of different composite materials obtained by mixing different polymers with different percentages of GTR (up to 70%) and, demonstrating that although the addition of GTR normally excludes industrial applications with high mechanical requirements, that pure polymers do provide, if they could, instead, be part of the recycling solution in many other industrial applications.

Materials And Methods

Materials

The following polymers have been used in this study: Polyvinyl Chloride (PVC); High density polyethylene (HDPE); The ethylene vinyl acetate (EVA) copolymer especially used for the production of extrusion films and coatings (18% vinyl acetate and 82% ethylene); Polypropylene (PP); Acrylonitrile butadiene styrene (ABS) white, consisting of 30% acrylonitrile, 20% butadiene and 50% styrene, being an amorphous thermoplastic material and highly impact resistant. Polyamide 6 (PA), known as Nylon 6, being a semi-crystalline thermoplastic that has high strength, toughness and impact resistance, showing good sliding behavior and good wear resistance; Polystyrene, (PS or styrene-butadiene-styrene), solid, transparent, hard and fragile, being an amorphous thermoplastic, highly resistant to impact. Regarding the GTR, with a particle size smaller than <200 μm, its content was verified by means of a TGA analysis, with 54% elastomers (36% natural rubber, and 18% styrene-butadiene), 29% of carbon black (CB) and 16% inorganic.

Preparation of the Compound

The recycled tire powders were dried in an oven at 100°C for 24 hours. Five samples of Polymer / GTR compound were prepared, varying the composition (5%, 10%, 20%, 40%, 50% and 70% GTR), for a single particle size (p <200μm). The mixing process was carried out with a Brabender mixing machine. Polymer / GTR laminates were obtained using a hot plate press at a constant pressure of 200 bar and different temperatures for 10 minutes, depending on the polymer to be treated. The samples for the test were prepared correctly in accordance with the specifications of Standard ASTM-D-638 type V. A sample of the pure polymer was also prepared with the same requirements for comparable results.

Microstructural Analysis

Scanning Electron Microscopy S.E.M. It was used to analyze the fracture surface of broken samples in stress-strain tests. It is possible to analyze the effects of this filler material on the matrix by observing the fracture surface of the polymer with the reinforcing particles. The images of the samples were analyzed according to the concentration of GTR. A JEOL 5610 microscope was used, and the samples were previously coated with a thin layer of gold in order to increase conductivity. The samples were photographed at 180 magnifications. The scanning electron microscope (MEB) is an instrument to obtain three-dimensional photographs because it has a high resolution and a great depth of field. In the photographs you can see the microstructure of microscopic samples. The SEM uses an electron beam instead of a light beam to form an image. It has a great depth of field, which allows a large part of the sample to be focused at the same time. In the scanning electron microscope, the sample is coated with a layer of carbon or a thin layer of a metal such as gold to give conductive properties to the sample.

Mechanical Analysis

The Tension-Deformation tests were performed with a Universal Instron 3366–10 kN machine, following the specifications of ASTM-D-638 Type V Standard. The test speed was 20 mm / min. The test temperature was 23 ± 2 ° C, and the relative humidity was 50 ± 5%. The study of mechanical properties, according to the concentration of GTR in the matrix and the size of the particles, includes the Modulus of Elasticity or Young’s, tensile strength, elongation at breakage and hardness or toughness. Five samples were used for each test.

Results And Discussion

Structural Analysis: Scanning electron microscopy, S.E.M.

SEM photomicrographs of the fracture surface of the Polymer / GTR specimens of the Deformation-Traction test [Section 2.4] are shown in Figure 2. It is observed that the GTR particles do not reach their melting temperature when mixing with the different polymers analyzed, so that they are observed in the microphotographs, GTR particles dispersed in the homogeneous medium (matrix of the different polymers), while the polymer reaches its melting temperature, its dispersion being correct. The result is a microgranulated mass with a degree of dispersion that depends on the mixing time and temperature, which does not facilitate cohesion between phases, as can be seen in the different analyzed micrographs. Figures 2-a; 2-f and 2-g, shows compounds with low concentration of GTR (10%). It is observed that the particle of the reinforcement is integrated and covered practically by the matrix, showing a good interfacial adhesion. There are no gaps in the contour of the particle, and polymer fragments are dispersed over the entire surface of the particle by adhering to it. Figures 2-b, 2-d, 2-h, on the contrary, show compounds with high concentrations of reinforcement (40% -70% GTR), which causes an increase in faults and cracks in the matrix, worsening interfacial adhesion. In this case, the percentage of thermoplastic polymer is not sufficient to wrap the GTR particles, so that the joint is more difficult, cracks and pores of considerable size appearing in its contour. The GTR particles are clean and easy to extract, so the fracture has occurred through the interface of the matrix. On the other hand, with high concentrations of GTR there are greater possibilities of particle agglomeration, this agglomerate acting as a large particle.

Table 1. Main processing characteristics of the different polymers used

Polymer Type

Commercial Name

Density (kg/m3)

Processing Temperature (ºC)

Fusion Temperature  (ºC)

Press Temperature ºC)

PVC

Etinox

1.225

195–200 ºC

200 ºC

210 ºC

EVA

Alcudia PA 539 type

937

105–110 ºC

110 ºC

120 ºC

HDPE

Alcudia 4810-B

960

150–155 ºC

155 ºC

170 ºC

PA 6

Ultramid B3S

1130

195–200 ºC

220 ºC

210 ºC

ABS

Terluran® HH-106

1050

180–185 ºC

230 ºC

195 ºC

PP

Isplen® 099 K2M type

902

155–165 ºC

165ºC

165 ºC

PS

Polystyrol 486 M

1050

180–185 ºC

180°C

195 ºC

NAMS 2019-107 - Marc Martin Spain_f1

Figure 1. Scanning electron microscopy S.E.M., used for the Structural analysis of Polymer / GTR compounds. a) Scanning Electron Microscopy JEOL 5610. b) electrolytic coating machine (sputtering). c) Sample holder of the S.E.M., with the samples coated in a layer of 20 nanometers of gold.

NAMS 2019-107 - Marc Martin Spain_f2

Figure 2. SEM photomicrographs of the Polymers – GTR, for some concentrations of GTR particles in the polymer: a) EVA / GTR-10%; b) HDPE / GTR-40%; c) PA / GTR-20%; d) PVC / GTR-40%; e) PP / GTR-20%; f) ABS / GTR-10%; g) PS / GTR-10%; h) PS / GTR-70%

Results of Comparison Of Mechanical Properties

Through the Tension-Deformation test, the mechanical properties of the different polymers with different concentrations of GTR and size of reinforcement particles (p <200μm) in the polymer matrix have been analyzed. Regarding Young’s Module (Figure 3. a)), we can see how the compounds of EVA, HDPE and PS have a better performance with the addition of low percentages of GTR (5–10%) in the compound. In the rest of materials, generally, from the addition of GTR particles, Young’s Module worsens. A very clear case is the EVA copolymer, which has lower Young’s modulus properties and improves with the incorporation of GTR. In tensile strength (Figure 3. b)), we can see more evident decreases for concentrations greater than 10% of GTR, except for HDPE compounds, which exhibit better behaviors with the addition of quantities of GTR in low proportions (5–10% of GTR).

Regarding the elongation at break of the GTR compounds (Fig. 3. c)), the highest level is for the EVA compounds, which range between 700% and 350%, for 0% GTR concentrations. to 20% respectively. The reduction of the deformability of the elastomer influences the decrease in elongation and, subsequently, the decrease in hardness, showing similar behaviors in terms of hardness for compounds with EVA / GTR. The decrease in elongation at break is related to imperfect interfacial adhesion between the components, as discussed previously in section 3.1. The incidence of poor adhesion between phases is a particularly important result. Elongation at break with the addition of GTR particles decreases dramatically, rising only in the case of PA, with the addition of GTR. Regarding the tenacity (Figure 3. d)), these falls are even greater. The toughness ranges decrease for concentrations of 10% GTR. From the observation of the comparative graphs of tenacity (J) it can be seen that, the ones with the greatest energy to produce the fracture are EVA and PP. For EVA or PP that add 10–20% GTR, the breakage energies of the compound decrease significantly. For PP, ABS and, to a lesser extent, HDPE, the addition of GTR negatively affects the properties of tear strength (J). A very prominent case is the PVC and PA polymers, which show very low breaking energy values for the pure polymer and improve this property (strength) with the addition of the percentage of GTR in the polymer matrix.

NAMS 2019-107 - Marc Martin Spain_f3

Figure 3. a) Young’s modulus (MPa), b) Tensile strength (MPa), c) Elongation at break (%), d) Tenacity or hardness (J), for the seven Polymer / GTR concentrations and particle sizes p <200μm.

A deeply Comparative-Analysis Stress-Strain model is needed, for a further research we can obtain curves obtained from the test of the polymers mixed with the full range of GTR concentrations. In this case, the complex morphology of the matrix polymer blended with GTR particles does not allow the use of the standard elastoplastic equations or the classical approach. For this reason, and in the same way as purposed [22], a simple uniaxial tensile stress–strain relation is proposed, based on three parameters, σY, εY, and n, where σY is the yield strength and εY the elongation at yield.

NAMS 2019-107 - Marc Martin Spain_f4 [1]

Conclusions

There are necessary for a deep analysis of the compounds analyzed, through DSC, Differential Scanning Calorimetry, that allows the study of those processes in which enthalpic variation occurs, for example determination of specific calories, boiling points and fusion, purity of crystalline compounds, reaction enthalpy and determination of other first and second order transitions. The calorimetry applied to the composite materials is used as a tool to detect the possible changes in the crystallinity and microstructure of the matrix by adding a second component as a reinforcement [23–24]. By measuring the melting temperatures and enthalpy of the compounds, these changes can be analyzed through DSC analysis. The thermal behavior of the compounds can be studied using DSC, the final thermogram (heat / temperature flow) is obtained. The melting point of the sample and the glass transition temperature can be obtained to determine the modification of the internal structure of the matrix and possible reactions that may occur in the mixture. So, in this sense can be an interesting analysis for further research.

Comparatively, it can be deduced from the observation of the results of HDPE, PVC, EVA, PP, PA, ABS and PS with GTR, that the analyzed mechanical properties of the compounds may have some significant changes depending on the amount of GTR that is supplied to the polymer matrix, that is, some properties vary according to the percentage of GTR added. As can be seen in section 3.2, generally the highest property values correspond to the pure polymer (0% GTR). Thus, for EVA, HDPE, PA and PS, some mechanical properties are improved by the addition of microparticles (p <200 µm) of GTR in the polymer matrix. With low concentrations of GTR (5–10%), the Young’s Modulus of the compound increases, although other mechanical properties decrease as with the compounds of EVA, PS and HDPE. This behavior may be due to the fact that the reinforcement matrix is correct for these formulations (as shown in section 3.1 of this investigation) and, therefore, some mechanical properties improve. However, for GTR concentrations greater than 10%, all mechanical properties decrease, except for PA compounds. The results obtained from the analysis of these compounds show the limit concentration of GTR in order to maintain acceptable values of the mechanical properties is of the order of 5–10% in general, values that would allow its use in various fields of industry with mechanical solicitations not too high, giving out disused amounts of GTR, as other authors have studied before, GTR compounds can be reused with other applications [25–26]. At a structural level we see a clear relationship between structural properties and mechanical properties, relating the compounds that show better internal cohesion (Section 3.1), compounds with low proportions of GTR (10%) and that coincide with the compounds that have better mechanical properties. Likewise, with high concentrations of GTR (from 40% to 70% GTR), we see how the mechanical-structural properties progressively worsen with the addition of percentages of GTR, as the photomicrographs performed at 180 magnifications with electron microscopy show. What clearly reveals the structural study is that the interaction between the polymeric matrix with the GTR particles is very weak and low

Financing: This research was funded by the MINISTRY OF ECONOMY AND COMPETITIVENESS, Government of Spain ENE2015-64117-C5-3-R (MINECO / FEDER).

Conflicts of Interest: The authors declare no conflict of interest.

References

  1. European Tyre Recycling Association (ETRA). www.etra-eu.org (accessed aug 14, 2018)
  2. Used Tyre Working Group (UTWG). Tyre Recycling; Department of Trade and Industry: London, UK. www.tyredisposal.co.uk (accessed novembrer 18, 2006).
  3. Liu HS, Richard CP, Mead JL and Stacer RG. Development of Novel Applications for Using Recycled Rubber in Thermoplastics. Technical Research Program. Chelsea Center for Recycling and Economic Development, University of Massachusetts: Lowell, 2000.
  4. Figovslq O, Beilin D, Blank N, Potapo J and Chernyshe V. Development of polymer concrete with polybutadiene matrix. Cem Concr Compos. 1996, 18, 437–444.
  5. Hernandez-Olivares F, Barluenga G, Bollatib M and Witoszekc B. Static and dynamic behaviour of recycled tyre rubber-filled concrete. Cem Concr Compos. 2002, 32, 1587–96.
  6. Goncharuk GP, Knunyants MI, Kryuchkov AN and Obolonkova ES. Effect of the specific surface area and the shape of rubber crumb on the mechanical properties of rubber-filled plastics. J Polym Sci Part B: Polym Chem. 1998, 40, 166–169.
  7. Dierkes WK. Rubber recycling. In Recent research developments in macromolecules, Pandalai SG, Ed.; Trivandrum: Research Signpost, 7, 265–292, 2003.
  8. Radeshkumar C and Karger-Kocsis J. Thermoplastic dynamic vulcanisates containing LDPE, rubber, and thermochemically reclaimed ground tyre rubber. Plast Rubber Compos. 2002, 31, 99–105.
  9. Yehia A, Mull MA, Ismail MN, Hefny YA and Abdel-Bary EM. Effect of chemically modified waste rubber powder as a filler in natural rubber vulcanizates. J Appl Polym Sci. 2004, 93, 30–36.
  10. Colom X, Andreu-Mateu F, Cañavate FJ, Mujal R and Carrillo F. Study of the influence of IPPD on thermo-oxidation process of elastomeric hose. J Appli Polym Sci. 2009, 114, 4, 2011–2018.
  11. Cepeda-Jimenez CM, Pastor-Blas MM, Ferrándiz-Gómez TP and Martín-Martinez JM. Surface Characterization of vulcanized Rubber treated with sulphuric acid and its adhesion to polyurethane adhesive. J Adhesion. 2000, 73, 135–160.
  12. Mujal R, Marín-Genescà M, Orrit J, Rahhali A, Colom X, Dielectric, mechanical, and thermal characterization of high-density polyethylene composites with ground tire rubber. Journal of thermoplastic composite materials. 2012, 25, 5, 537–559
  13. Mujal, R.; Orrit J., Ramis, X.; Marin-Genesca, M.; Rahhali, A. Study on dielectric, mechanical and thermal properties of polypropylene (PP) composites with ground tyre rubber (GTR). Polymers & Polymer Composites (ISI). 2012, 20, 9.
  14. Mujal, R.; Ramis, X.; Orrit-Prat, J; Marin, M. Study on dielectric, thermal, and mechanical properties of the ethylene vinyl acetate reinforced with ground tire rubber. Journal of Reinforced Plastics and Composites0. 2011, 30, 7, 581–592
  15. Mujal R, Orrit-Prat J, Ramis-Juan X, Marin-Genesca M. Electrical application of polyamide reinforced with old tire rubber (ground tire rubber): Dielectric, thermal, mechanical and structural properties. Journal of thermoplastic composite materials. 2014. 27, 9, 1209–1231
  16. Nakason C, Kaesaman A and Supasanthitikul P. The grafting of maleic anhydride onto natural rubber. Polym Test. 2004, 23, 35–41.
  17. La Mantia FP, Lo Verso S and Tzankova Dintcheva N. EVA Copolymer Based Nanocomposites. Macro Mat Eng. 2002, 287, 12, 909–914.
  18. Kim JI, Ryu SH and Chang YW. Mechanical and dynamic mechanical properties of waste rubber powder/HDPE composite. J Appl Polym Science.  2000, 77, 2595–2602.
  19. Markov A., Fiedler B., Schulte K. Electrical conductivity of carbon black/fibres filled glass-fibre-reinforced thermoplastic composites. Composites Part A: Applied Science and Manufacturing. 2006, 37, 9, 1390–1395
  20. J.R. Pothnis , M. Sridevi, M.K. Supreeth , A.R. Anilchandra, G. Hegde, S. Gururaja. Enhanced tensile properties of novel bio-waste synthesized carbon particle reinforced composites. Materials Letters 251 (2019) 110–113.
  21. Saad ALG, Aziz HA and Dimitry OIH. Studies of Electrical and Mechanical Properties of Polyvinyl chloride) Mixed with Electrically Conductive Additives. J Appl Polym Science. 2004, 91, 1590–1598.
  22. Giroud, J.P. Mathematical model of geomembrane stress-strain curves with a yield peak. J. Geotext. Geomembr. 1994, 13, 1–22.
  23. N. Aini Fauziyah , A. Rosyidy Hilmi, M. Zainuri, M. Zainul Asrori, M.i Mashuri, M. Jawaid, S. Pratapa. Thermal and dynamic mechanical properties of polyethylene glycol/quartz composites for phase change materials. J. APPL. POLYM. SCI. 2019, DOI: 10.1002/APP.48130
  24. A. A. Gadgeel , Shashank Tejrao Mhaske. Novel approach for the preparation of a compatibilized blend of nylon 11 and polypropylene with polyhydroxybutyrate: Mechanical, thermal, and barrier properties. J. APPL. POLYM. SCI. 2019, DOI: 10.1002/APP.48152
  25. Colom X., Cañavate J., Carrillo F. Structural and mechanical studies on modified reused tyres composites. Eur Polym Journal. 2006. 42. 2369–2378.
  26. Kim JI, Ryu SH and Chang YW. Mechanical and Dynamic Mechanical Properties of Waste Rubber Powder/HDPE Composite. J. Appl. Polym. Science. 2000, 77, 2595–2602.

Nano Materials Application in Development of Novel Class of Fiberoptic Modulators

DOI: 10.31038/NAMS.2019222

Abstract

The application of nano materials, in developing a novel class of fiberoptic modulators, is presented. The developed modulators are capable of high speed modulation up to 140 Gbps. The technology is based on building the device directly on the surface of the optical fiber core in a cylindrical symmetrical and uniform fashion, for polarization independent and ultra high speed applications. The design of the device is based on modifying optical fibers by removing the fiber jacket and the passive cladding materials off a very short length of the fiber. Then, the fiber core, in the modified section, is coated with a multilayer structure of nano-materials. This modified cladding includes a nano layer of high-speed electro-optic polymer sandwiched between two nano metallic electrodes, for modulating signals application. In this way, the device speed can reach up to 140Gbps and more, based on the polymer’s improved electro-optic properties. Also, this structure can eliminates polarization dependent problems associated with all available integrated rectangular waveguide modulators. Which are used in most optical telecomm networks. Demonstration prototypes have been manufactured and successfully tested, and the proof of concept is completed.

OCIS Codes: Fiberoptic, Nano-materials, Optical modulators/switches, Optical communication, Optical networks, EO polymer, EO devices, Optical active devices, On-fiber devices.

http://www.photonicslabs.com;
http://www.photonicsonfiber.com;
https://www.linkedin.com/pub/dr-mahmoud-el-sherif/7/ab6/38b

Introduction

Because of the importance of integrated optics in optical communication networks, a great deal of effort has been expanded to take the advantage of newly developed nano materials to build Electro Optic (EO) devices directly onto the core of regular optical fibers, wherein, optical fibers can be used as active devices as well as the optical transmission link. In this way, many of existing problems associated with integrated optics can be eliminated, such as insertion loss associated with coupling optical signals between integrated optical devices and communication networks.

In this Letter, an overview on development of a novel class of fiberoptic modulators is presented. The development is based on using advances in nano materials in manufacturing active devices directly on the fiber core, in a symmetrical cylindrical and uniform structure. Also, this design eliminates polarization dependent in existing devices, which are constructed of rectangular waveguides acting as the device active channel. This technology can be applied to any ordinary optical fiber. So, the fiber can be used as an active device as well as the communication link, in any fiber network.

Most commercially available EO modulators are constructed of rectangular waveguides, made of Lithium Niobate (LiNbO3) crystals. They are polarization dependent devices. Therefore, the device has to be positioned next to the light source, or a polarization maintaining fiber has to be used between the light source and the device. Therefore, using this type of devices in any fiber network, imposes certain limitations on the device location with respect to the light source. Also, coupling light between the active channel of the device, which is a rectangular waveguide, and the circular cross section of the fiber core is another challenge.

In this Letter, a brief explanation of the developed technology is presented. The technology has been successfully tested in development of an EO modulator, and proof of concept has been completed. A demonstration prototypes have been manufactured and tested at low frequency. Results show perfect match between the modulating electric signals and the modulated optical signals, even when a triangle modulating signal was applied. The manufacturing of the devices is based on using novel processing techniques to have full control on the deposition thickness uniformity and parameters for each layers of the applied nano materials.

Available Technology

For more than three decades, much effort has been directed to the development of high-speed EO modulators for optical communication networks, using LiNbO3 rectangular waveguide as the device active channel [1,2]. The effort focused on improving the modulation efficiency as well as reducing insertion loss associated with those integrated devices. However, those modulators are polarization dependent, very costly and still have shown other drawbacks including coupling mismatch, and high insertion loss, when connected to fiberoptic networks.

On the other hand, the development of the high-speed EO polymers has resulted in a new generation of integrated EO modulators. The EO polymer is used as the active waveguide, to replace the single crystal LiNbO3 modulators. A lot of research has been done to improve the properties of the developed EO polymers as well as modulation efficiency [3–6]. However, because of the rectangular shape of the active channel, polarization dependent is still a problem. The rectangular structure of the active channel of this type of modulators has imposed so many limitations and disadvantages. The modulator has to be positioned next to the light source output, to limit the effect of polarization dependent. However, experimental research has proven that; even when the modulator is positioned near to the light source, the polarization dependent is still a problem. This is clear from the test results reported in reference [3], when the modulating signal is a triangle wave. It is shown that the modulated signal cannot follow the shape of the modulating signal. Instead of having a single peak as in the modulating triangle signal, a double peak is shown in the modulated signal, as shown in Figure 4 [3].

Based on polarization problems associated with integrated rectangular waveguide modulators, there were several reported trials with the intention of building passive and active devices directly on the fiber core. Passive devices were mainly built for various sensors applications. One of the main advantages, of using on-fiber structure for sensors applications, is to improve signal stability and accuracy, because of the device polarization independent [7].

For active on-fiber devices, challenges were not easy for coating very thin multilayers nano materials onto the cylindrical surface of the fiber core. Early trials were reported in 1980’s, before electro-optic polymers were developed or known. Also, it was impossible to grow or deposit electro-optic crystals, such as LiNbO3 crystal, on the cylindrical surface of the fiber core. Therefore, liquid crystals were used as the modified EO cladding [8, 9]. As a result, the problems of using rectangular waveguide were illuminated, however, using liquid crystal imposed sever limitation on the speed of the modulator.

Newly Developed Technology

Along with interest in solving the problems associated with those devices, a novel technology based on nano materials application, has been developed for manufacturing on-fiber modulators, as shown in Figure.1. This developed technology has resulted in a new class of polarization independent modulators. It is based on constructing a layer of nano EO material, as an active channel, sandwiched between two nano metallic electrodes directly on the cylindrical surface of the fiber core, in a cylindrical uniform structure. In his way, polarization dependent as well as coupling problems, exist between integrated devices and fiber networks, can be completely eliminated. This can be achieved by modifying a small section of ordinary optical fiber, replacing the passive cladding with an active multilayer cladding, using nano processing techniques. The multilayer modified cladding has to be surrounding the fiber core in a symmetric uniform 360o cylindrical shape. Also, in this way, there will be no need to cut the optical fiber to integrate optical modulators into the fiber network. The advantages of using this novel structure are unlimited, ranging from simplicity and cost effectiveness to high efficiency and high signal to noise ratio, as well as the devices are all polarization independent, because of the symmetrical uniform cylindrical structure.

NAMS 2019-106 - Mahmoud A. El-Sherif USA_f1

Figure 1.    A schematic of an on-fiber EO Modulator, wherein, the device is constructed directly on the cylindrical surface of the fiber core.

Design and Manufacturing

In this Letter, an overview of the design, manufacturing and testing of the on-fiber EO modulator is presented. The design is based on modifying ordinary optical fibers in a small section, to act as an EO modulator. The fiber jacket is removed by mechanical stripping, then, the passive cladding material is partially (or totally) etched away, by a standard chemical etching technique. The etching process rate has to be calibrated, then, applied under continuous light transmission, for full control on the final thickness. This modified section is then prepared for multilayer coatings by applying the proper mask, before each layer of coating, based on the required geometry of this coating layer, as shown in Figure. 2 for the first layer of coating. The coating process is performed for each layer of the multi-layer structure, in 360o, as shown in Figure. 3.  After each coating step the mask is removed and a new mask is applied based on the geometry of the next coating layer. The modified cladding includes a number of nano-layer of different materials. One of the layers is a high speed EO polymer, sensitive to electromagnetic fields. The polymer is coated by a spinning technique, used under certain conditions for nano layer coating. This layer of EO polymer is sandwiched between two cylindrical coated nano metallic electrodes, using enhanced plasma deposition technique. The inner electrode is deposited first, then, the polymer layer is coated, wherein, the poling process of the polymer is achieved in-situ using the first deposited electrode, under high voltage application in a high temperature oven. This process is applied for a certain time, under vacuum and nitrogen gas, to generate the electro-optic property within the coated polymer. Then, the second nano-metallic electrode is deposited on the top of the EO polymer. Before and after each of the coating steps a special surface treatment is performed. After the last layer of nano-materials is coated, the jacket material is applied on the top of the second electrode, as shown in Figure. 4.

NAMS 2019-106 - Mahmoud A. El-Sherif USA_f2

Figure 2.   A schematic of the modified section of the optical fiber, after stripping the jacket and etching the cladding, and with the mask ready for the first coating process.

NAMS 2019-106 - Mahmoud A. El-Sherif USA_f3

Figure 3.   A schematic of the modified section of the optical fiber, after the multi-nano-layers coating, including the EO polymer and the two metallic electrodes.

NAMS 2019-106 - Mahmoud A. El-Sherif USA_f4

Figure 4.   A schematic of the on-fiber EO modulator, after applying the jacket to the modified section, for handling and protection.

Several on-fiber EO modulators were manufactured and tested, based on the structural design explained before. For each modulator, after the passive cladding was etched away, the inner electrode was coated, in 360o, on the top of the fiber core, using a transparent nano metallic material, using an enhanced plasma deposition technique modified for cylindrical coating of fibers. Then, the polymer base material was spin coated on the top of the inner electrode, while it was synthesized. Adjusting the spin coating process, speed and time, controls the thickness of the coated thin layer of the polymer. After drying in a nitrogen oven at room temperature, the polymer was radially poled for about one hour at the required temperature and voltage, using the corona poling method. It was then cooled down to the room temperature while keeping the poling voltage on. The thermosetting cross-link of the material system occurred simultaneously during the poling process. This process is very critical to satisfy the required change in the polymer high speed electro-optic property. Detailed information concerning the synthesis process and the in-situ poling of the polymer are reported elsewhere [5].

After the coating process of the EO polymer is completed, the outer metallic electrode was coated on the top of the EO polymer. Before coating any of the electrodes or the EO polymer, special chemical surface treatment was conducted to enhance interface properties. Then, the jacket material was applied on the top of the second electrode. The design of the jacket includes two exposed metallic rings, which are connected to the electrodes. All coated layers were designed in a symmetrically uniform cylindrical structure, in 360o. The schematic of the manufactured EO modulator is shown in Figure. 4.

In the presence of a modulating signal, applied to the electrodes, an electromagnetic field is generated between the two electrodes resulting in changing the optical properties of the EO polymer, mainly the equivalent refractive index of the polymer material. This change will be uniform across the 360o of the cylindrical surface of the fiber core, resulting in a uniform modulation of optical signals propagating within the fiber core, regardless of the polarization direction of the propagating optical signals within the fiber core. Thus, the problem of polarization dependent, in commercially available devices, has been eliminated. Another major advantage is that; modulation can exist at more than one location along the length of the same optical fiber, and can be far from the light source location.

Several modulators were manufactured and successfully tested. Different types of modulating signals (sinusoidal, triangle, and digital) were used for testing the manufactured devices. Also, two different experimental test set-ups (Mach zehnder or Michelson interferometers) were used in testing and proof of concept. All test results were encouraging, and modulated signals were always identical to the modulating signals. One of testing results, of the manufactured devices, is presented next.

Testing Results

Before testing the selected device, a reasonable packaging process was done, using available tools and facilities. An actual image of the packaged device is shown in Figure. 5, which is in size about 1.0in x 2.0in x 0.3in. Using the proper packaging tools and facilities, the device size can be reduced by 80% or more, and it can also be in a cylindrical shape with a diameter less than 0.3in and length about 1.0in to 1.5in. The packaging process includes the integration of a RF/MW socket connected from inside with the two electrode rings. Also, for fiber mechanical protection, two rubber sleeves were used to cover the exposed fiber ends.

NAMS 2019-106 - Mahmoud A. El-Sherif USA_f5

Figure 5.    An actual image of the manufactured EO modulator, after packaging with a metallic shield box. The fiber two ends are exposed from both sides, and protected by two black rapper holder. The microwave socket is connect from inside with the two metallic rings on the fiber jacket, for direct application of the modulating signals.

A sample of the device test results is presented here, using the Michelson interferometer set-up. The schematic diagram of the Michelson test set-up is shown in Figure 6. The Figure shows two input signals to the oscilloscope. The inputs are the modulating electric signal and the photo-detector output, which is the modulated signal.

NAMS 2019-106 - Mahmoud A. El-Sherif USA_f6

Figure 6.   A schematic of a Michelson interferometer test set-up, used for the evaluation and proof of concept of the developed on-fiber EO modulator, showing the input signal (as modulating electric signal) and the photo-detector output (as the modulated signal).

A sample of the test result is shown in Figure. 7. It shows that the modulating signal is a triangle signal. This type of modulating signal was selected to proof the high quality polarization independent. It is clear from Figure. 7 that the modulated signal is following exactly the shape of modulating signal, with a triangle shape too. For better understanding of the achieved high quality performance of this on-fiber modulator, a comparison has to be done with respect to the modulated signal of a device consisting of a rectangular waveguide channel. This was explained before, using the results reported in reference [3], which explain that when a triangle’ modulating signal is applied to a rectangular waveguide modulator, a double peak signal will result at the device output, as a result of the device polarization dependent. This polarization dependent is clear, as presented in reference [3], even when the device is positioned next to the light source as in Figure. 4 of the reference [3]. On the other hand, this novel on-fiber modulator shows a smooth single peak in the modulated signal, even when the device is positioned far from the light source. Therefore, the polarization dependent has been completely eliminated. Based on recent advances in available EO polymers the device speed can now reach 140 Gpbs, and expecting much higher speed in the near future. Also, the developed technology can be applied to other type of devices, such as EO switch, tunable couplers and wave division multiplexers.

NAMS 2019-106 - Mahmoud A. El-Sherif USA_f7

Figure 7.   A sample of the test result showing a sawtooth (triangle) applied modulating signal and the photo-detector output of the modulated optical signal, using the Michelson interferometer setup in figure 6.

Conclusion

A novel class of on-fiber EO modulators has been developed, manufactured, and successfully tested, using advances in processing of nano-materials. The technology is based on building the device directly on the fiber core, after removing the fiber jacket and etching the cladding layer. For demonstration, an on-fiber modulator was manufactured, using a nano-layer of advance EO polymer as the active channel within the fiber modified cladding. The layer of the EO polymer was sandwiched between two uniform cylindrical electrodes. Ordinary optical fiber can be used for such application. The test results were encouraging and provide a clear proves on polarization independent. The device can be used for application up to 140Gbps, and can be constructed at any location on the optical fiber and fare from the light source. Multiple devices can also be constructed on the same fiber at different locations. The developed on-fiber technology can be used for the actual realization of all-fiber networks, where the fiber is used as an active device as well as the networking link. In addition, the technology has been tested in application to on-fiber switches, tunable couplers and tunable DWDM.

The author gratefully acknowledges that the EO polymer used in most developed and tested modulators were provided by Prof. Alex Jen and his group, including Dr. Antao Chen, and Dr. Jingdong Luo, of the University Of Washington, USA.

References

  1. Ed L. Wooten, Karl M. Kissa, Alfredo Yi-Yan, Edmond J. Murphy, Donald A. Lafaw, et al. (2000) A Review of Lithium Niobate Modulators for Fiber-Optic Communications Systems. IEEE J. of Selected Topics in Quantum Electronics 6: 69–82.
  2. High-Speed Photonic Devices, Edited by Nadir Dagli, CRC Press, Taylor & Francis Group, 2007
  3. Dechang An, Zan Shi, Lin Sun, John M. Taboada, Qingjun Zhou, et al. (2000) Polymeric electro-optic modulator based on 1Ã2 Y-fed directional coupler. Appl. Phys. Lett  76: 1972–1974.
  4. Dechang An, Suning Tang, Zu Zhou Yue, John Taboada, Lin Sun, et al. (1999) Linearized Y-coupler Modulator Based on Domain-inverted Polymeric Waveguide. SPIE Conference on Optoelectronic Interconnects VI, San Jose, California, SPIE, 3632: 220–231.
  5. Ma H, Jen AK-Y, Dalton LR (2002) Polymer-based optical waveguides: Materials, processing, and devices Advanced Materials 14: 1339–1365.
  6. Taylor EW, Nichter JE, Nash FD, F. Haas, Szep AA, et al. (2005) Radiation resistance of electro-optic polymer-based modulators Appl. Phys. Lett 86: 201122-1–201122-3.
  7. Optical Guided-wave Chemical and Biosensors II, Chapter 5: Fiber Optic Chemical and Biosensors, Mahmoud El-Sherif, Editors M. Zourob and A. Lakhtakia, Springer-Verlag GmbH, Germany (2010)
  8. El-Sherif MA, Shankar PM, Herczfeld PR, Bobb L, Krumboltz H (1986) On-Fiber Electro-optic Modulator/Switch. Appl. Opt 25: 2469–2470.
  9. El-Sherif MA, Shankar PM, Herczfeld PR, Bobb L, Krumboltz H (1987) An on-fiber active transducer in Technical Digest, IEEE Fourth International Conference on Solid-State Sensors and Actuators,  200–203.

New Field Theory Based in Curvature and Torsion Energies and their Applications in Nanotechnology

DOI: 10.31038/NAMS.2019221

Abstract

New field theories considering new re-interpretations of field observables are used in a wider context to be applied in the design and development of energy technologies to fine different applications through the spectra of field observables and the particles interaction that act in the shedding, correction, alignment, cure, re-directing of the fields to different process. In it are of our interest those applications to Nano medicine and design of biomedical devices at quantum level. Also are mentioned some parallel developments realized in this respect.

Introduction

New Theories, New Re-interpretations of the Knowledge and New Tools to the Next One Hundred Years

New postulates and principles have been considered as given in [1,2] where the torsion field theory has been embraced by some as the scientific explanation of homeopathy [1,3], electromagnetic propulsion, magnetic levitation [2], and deep studies of the development and evolution of the Cosmos or space-time [4–6]. All before phenomena are related beyond the terrestrial technology and are connected under the same topological field theory and principles considering the same field theory developed through algebraic geometry and mathematical physics. In this respect, are used frequently the cohomological spaces as of the type H1 (B, O(–k)), to explain and demonstrate the correspondences between helicities of the “quantum” fields bundles and the spin actions in spin manifolds developed. Last mentioned may be to the twistors (mini-twistors, ambitwistors and etcetera) in the correction and restoring of fields, or the introduction of the intention to transform a space, matter, body, organism or ambient of the any type [7].

The twistor geometry created Penrose [8], has been useful to describe from a point of view of the sources (that are singularities in usual differential geometry), the possibility to use the geometry created from start of these singularities. This last re-interpretation has been developed and also used in diverse research by me. However, has been necessary add some new concepts realising research in derived categories to explain the equivalences and different dualities that arise in this study.  In this new context, also arise the identification problem of the different topological groups or Lie groups that define the symmetries and other gauging actions in the interaction with the elements that offers the Universe. Recently, was realised a research on the field observable study and the duality of invariants in the Universe field equations through twistor-spinor framework in spectral theory of curvature to detection of gravitational waves [9].

In the last theme relative to the deep studies of the Universe, I have given several results that incorporate the fundamental principles of the matter in gravitation and a new re-interpretation of field observable under co-cycles defined in vector topological spaces [10–12]. However, these results go beyond treat to give a precise description of how functions the Universe from their Higgs boson [11].  Also are searched and wanted technologies, which derive of certain theorems to develop sensors and transducers of the field observable, having as final goal the creation of an advanced sensor of quantum gravity (see the figures 1 A), B), C) and D)) [13].

Also are of interest the quantum communication (telepathy, telekinesis, [15]) and the levitation (for example, this understood as the production of electro-antigravity described in the papers [5, 16, 17]. Here again we have used a cohomological space seemed to before, considering twistor geometry to describe the action of a rotation ring and their magnetic field in the movement of the ship in magnetic levitation).

In the mind phenomena as the clairvoyance and extra-sensorial perception [15], and other paranormal phenomena are had the same principles established to define field conscience by operators [18] in an integral operators theory that join the quantum mechanics with the relativistic and macroscopic theories of the Universe. Here under these arguments, are demonstrated that the second theories (relativistic and macroscopic theories) in reality are consequences of the quantum theories. Disorders in the mind are quantum perturbation generating coercive charges given energy weight that provoke the appearing of symptoms in the mind (see figure 2).

NAMS 2019-105 - FRANCISCO BULNES Mexico_F1

A). Curvature in microscopic level to analyse microcrystal deforming. B). Distribution of Neutrinos in the Universe [12, 14].
Figure 1. Field Detections through dilatons or gauge fields in the space-time and their relation with the SWAP mapping. Detection of the super-massive object (singularity) through sensor device to detect and measure quantum gravity using the fermionic spectral behaviour. Could be that the Universe field is the master control on our mind? If this is true then a good managing of photons as bosons of certain class could be the solution to all mental illness.

NAMS 2019-105 - FRANCISCO BULNES Mexico_F2

Figure 2. A). How begins the anxiety and their disorders? B). ……..what happens with the symptom space?

The application of torsion fields in medicine has been determining. Everything cure can be possible from photonics cure devices (including devices that cure all sickness such and as my hypothesis [1, 3] given to explain the appearing of organic illness and the re-composition of the fields by codes given by path integrals (Bulnes-Feynman integrals [1] to obtain the health).

Remember that one of my postulates and principles in the formal engineering theory is that the engineering is the creation of technology on the energy. Because, all is energy and as has been planted and demonstrated in a work [13], the Universe is all of energy because the unispace or universal covering is all of energy. The realised argumentations were done the global analysis that uses the universal covering of a Lie group with the causality (or causal structure).

This study consider the causal structure of the scattering phenomena through past and future light cones,  create the possibility of energy for one thousand years, perpetual motion  machines and star-gates (worm holes in the space) with advanced analogues as the synchrotronic propulsion (advanced spaceships)  and disintegrative mass weapons, using the same principles in all case.

Torsion fields can interact with laser beams (change frequency); creating effects of diverse, for example, in the biological processes, where torsion affects directly the ADN. Also can melting or solidifying some materials, affect quartz crystals increasing their properties as resonators. Also, affect some electronic components creating radiation coverings. The torsion can favourably change some beverages, and have been noted to affects gravity.

Spintronics and Micro-electronics Research

New theoretical developments have been given in quantum field theory[1], more specific in micro-electronics, realizing research on advanced electronics, photonics and spintronics[2], in the problems of electromagnetic propulsion, nano-medicine, sensors of field observables and transducers. Here is necessary to detach the importance of the obtained results in these research lines in electronics where have been complete theories with prototypes to detection of quantum gravity, cure of all illness, storage of energy through curvature and torsion energies, concept created [19, 20] to can to build the devices with technology on particles, fields, radiation and waves. Likewise, can be affirmed that the prospective in the use of the energy process of the electrons managing will give major developments of the advanced electronics considering no only their photon but also the use of their spin giving as result the spintronics [21]. This last also consider to the electron as the fundamental particle in all the processes of transference and information to the managing of other particles considering basal and transitory states of the electron through technologies, as are the dots, magnetons or spin-transistors.

Based and supported by important contributions and theorems on the deep study of the Universe, much of this research has been realized. Then have been given results in algebraic geometry and mathematical physics and published in the British and American journals of mathematics: Theoretical Mathematics and Applications [26], and other mathematics research journals [27].

Field Theory Applications in Nanomedicine

However, the vision of the research in field theory goes beyond the matter and molecular level. As has been mentioned in biomedical research scenarios [28], any illness begins in the atomic level through a collateral atomic damage when voracious protons are eating unstable electrons whose electronically information through photons is erroneous, and provokes the exit of these electrons attracted for voracious protons outside of the atom.

The electronic hypothesis in this respect can be detected for field variations of the vital field, or deviations of this field in their geometry. Of fact, integral geometry elements are incorporate to explain and determine this field deviation for their energy spectra. There is a report of these talks in the Current Medical Chemistry Journal [current], which has included the most famous scientific reports in advanced research in medicine and their different areas. In this important and prestige journal is included a complete scientific report in nano-medicine [28].

Here is planted the possibility of cure through the energy scanner of the human body to different organic systems using their different spectral resonances.

The research developed through different and various papers [29–31] shows through advanced mathematics the interchange of particles required to spill in the damaged part of the body of the photons required to correct information of their atoms. Then is corrected and restored the vital field and with it we achieve the obtaining of cure. He uses a version of the Feynman integrals to explain the interchanges and actions through the energy paths of the particles (see the figure 4).

NAMS 2019-105 - FRANCISCO BULNES Mexico_F3

Figure 3. A). Liquid light to help to the development of future advanced electronics in the threshold of the spintronics in the transducers design.  B). Direct sum of H-states to establish the curvature energy by the field ramification. C). Surface of energy E(k1, k2), to a metallic structure whose energy and prohibit trenches of energy in the solid were obtained applying a elementary electric charge that produce a planar constant superconductivity [20, 22–25].

NAMS 2019-105 - FRANCISCO BULNES Mexico_F4

Figure 4. Nanomedicine research based in quantum field theory [59, 60].

However, these researches were beyond the organic sufferings arriving to the conclusion that all suffering or illnesses have an origin metal in the mind-body. Likewise, is concluded in a research presented in an international conference [30] that “…all is reduced to correct and recover The WILL…”, “…the will is all”.

A graph is showed on the possible correction and restoring of the will compensating the energy displacement required by the cure (see figure 5).

NAMS 2019-105 - FRANCISCO BULNES Mexico_F5

Figure 5. Fill of incomplete atoms with free spaces for lack of one electron even of the order of their Fermi energy ∈F. This distribution is analyzed for the mono-pharmacist Pulsani considering an analytic electromagnetic potential ϕ(x) = x2(1–ex)log(x), [=nJ].

By the property recognize + displacement = ϕ(1)δ(0 – 1) + δ(1)u(0) (Theorems F. Bulnes applied to nano-medicine and radionics) with an evolution change given by exp(tX), we have the curve of recovering of the will. This graph corresponds to the action of Pulsani quantum mono-pharmacists. The continuous strengthen of the will [30].

Now recently have been realised an incursion on possible photonics and radionics developments on bio-medical devices adding research of photonics and spintronics, from the QED (Quantum Electrodynamics) and recent results in theoretical physics obtained and published in archival physics.

Likewise, is published an important theory of these devices linked with the study of some quantum complements and organic metal complements rich of certain class of photons that enrich the cure power and action of mono-pharmacists in quantum medicine and nano-medicine. In this research are explained possible mechanism to cure any illness from quantum level (figure 60).

A problem that has been presented in these researches is the fine nanometric gauging of quantities of the energy that can be registered in electronics devices, because these devices to experiments have been not invented yet. However, are established at least in design level possible quantum electronic devices to the correction, detection and alignment of energy fields of the human body [29–32].

References

  1. F Bulnes, FH Bulnes-González, E Álvarez, J Maya, F Monroy (2010) Integral Medicine: New Methods of Organ Regeneration by Cellular Encoding through Path Integrals Applied to the Quantum Medicine Journal Nanotechnol. Eng. Med 1: 031009.
  2. F Bulnes, J Maya,  I Martínez (2012) Design and Development of Impeller Synergic Systems of Electromagnetic Type to Levitation/Suspension Flight of Symmetrical Bodies. Journal of Electromagnetic Analysis and Applications 1: 42–52.
  3. F Bulnes, FH Bulnes, E Hernández, J Maya (2011) Diagnosis and Spectral Encoding in Integral Medicine through Electronic Devices Designed and Developed by Path Integrals. Journal of Nanotechnology in Engineering and Medicine ASME 021009: 10.
  4. F Bulnes, S Fominko (2016) Dx-Schemes and Jets in Conformal Gravity using Integral Transforms. International Journal of Mathematical Research 2: 154–165.
  5. Bulnes F (2015) QED-Lie Algebra and their Modules in Superconductivity. Journal of Applied Mathematics and Physics. 3: 417–427.
  6. F Bulnes (2015) Local Diffeomorphisms and Smooth Embeddings to Gravitational Field II: Spherical Symmetry and their Breaking in the Space-Time. Physics and Astronomy International Journal 2: 00045.
  7. Francisco Bulnes (2015) Mathematical Electrodynamics: Groups, Cohomology Classes, Unitary Representations, Orbits and Integral Transforms in Electro-Physics. American Journal of Electromagnetics and Applications 6: 43–52.
  8. LJ Mason, J Frauendiener (1990) Sparling 3-form, Ashtekar variables and quasi-local mass, Twistor in Mathematics and Physics, Cambrindge, UK, 1990.
  9. F Bulnes, Y Stropovsvky, I Rabinovich (2017) Curvature Energy and Their Spectrum in the Spinor-Twistor Framework: Torsion as Indicium of Gravitational Waves. Journal of Modern Physics 8: 1723–1736 2017.
  10. F Bulnes (2015) Integral Transforms and Opers in the Geometrical Langlands Program. Journal of Mathematics1: 2015.
  11. Bulnes F Integral geometry methods on deformed categories to geometrical Langlands ramifications in field theory, Ilirias Journal of Mathematics 3: 1–13.
  12. Bulnes F (2014) Design of Quantum Gravity Sensor by Curvature Energy and their Encoding. IEEE Proc, SAI 2014, London, UK Pg: 855–861.
  13. Francisco Bulnes (2013) Quantum Intentionality and Determination of Realities in the Space-Time Through Path Integrals and Their Integral Transforms, Advances in Quantum Mechanics, Prof. Paul Bracken (Ed.), InTech.
  14. Francisco Bulnes (2017) Detection and Measurement of Quantum Gravity by a Curvature Energy Sensor: H-States of Curvature Energy, Recent Studies in Perturbation Theory, Dr. Dimo Uzunov (Ed.), InTech.
  15. Bulnes F, Bulnes FH, Cote D (2012) Symptom Quantum Theory: Loops and Nodes in Psychology and Nanometric Actions by Quantum Medicine on the Mind Mechanisms Programming Path Integrals, Journal of Smart Nanosystems in Engineering and Medicine 1: 97–121.
  16. Bulnes F, Álvarez A (2013) Homological Electromagnetism and Electromagnetic Demonstrations on the Existence of Superconducting Effects Necessaries to Magnetic Levitation/Suspension. Journal of Electromagnetic Analysis and Applications 5: 255–263.
  17. Mahmoud J, Hashim S (2015) Principles of Superconducting Spintronic Device to Generate Fermionic Orbital Spaces. Journal on Photonics and Spintronics 4: 1 USA.
  18. Bulnes F (2013) Mathematical Nanotechnology: Quantum Field Intentionality. Journal of Applied Mathematics and Physics 1: 25–44.
  19. Bulnes F (2015) Curvature Spectrum to 2-Dimensional Flat and Hyperbolic Spaces through Integral Transforms. Journal of Mathematics RP 1: 1 USA.
  20. Bulnes F, Martínez I, Mendoza A, Landa M (2012) Design and Development of an Electronic Sensor to Detect and Measure Curvature of Spaces Using Curvature Energy. Journal of Sensor Technology 2: 116–126.
  21. Mahmoud J (2013) Spintronics in Devices: A Quantum Multi-Physics Simulation of the Hall Effect in Superconductors. Journal on Photonics and Spintronics 2: 1 USA.
  22. Bulnes F, Martínez I, Zamudio O (2016) Fine Curvature Measurements through Curvature Energy and their Gauging and Sensoring in the Space, Advances in Sensors Reviews 4, (Ed.) Sergey Y. Yurish, IFSA.
  23. Bulnes F, Humeini S (2018) Topological Superconductors Characterizing II: Curvature Energy in Hall-Spintronics Developments, SciFed Journal of Spintronics and Quantum Electronics, 1: 1.
  24. Bulnes F (2016) Electromagnetic waves in conformal actions of the group SU (2,2), on a dimensional flat model of the space-time. VI International Conference “Geometry, Dynamics, Integrable Systems”-GDIS, Izhevsk, Russia.
  25. Prof. Dr. Francisco Bulnes (Editor-in-Chief.) (2018) Mini-Workshop on Nanoparticles, Photonics and Advanced Electronics. Journal on Photonics and Spintronics Chalco, State of Mexico.
  26. Bulnes F (2017) Extended d- Cohomology and Integral Transforms in Derived Geometry to QFT-equations Solutions using Langlands Correspondences. Theoretical Mathematics and Applications 7: 51–62.
  27. Bulnes F (2014) Derived Categories in Langlands Geometrical Ramifications: Approaching by Penrose Transforms. Advances in Pure Mathematics 4: 253–260.
  28. Bulnes F (2012) Combination of Quantum Factors in Integral Mono-pharmacists and their Actions in Cellular Regeneration and Total Cure, Current Medicinal Chemistry International Conference of Drug Discovery and Therapy 2012 Reports, Bentham Science, Dubai, UAE, 2012.
  29. Bulnes F, Bulnes FH, Hernandez E (2010) Integral Medicine: New Methods of Organ-Regeneration by Cellular Encoding through Path Integrals applied to the Quantum Medicine. Journal of Nanotechnology in Medicine and Engineering 1: 7.
  30. Bulnes F (2013) The Anxiety Factor in the Dimension of the Symptom Space and their Elimination for Nano-Metric Actions of Quantum Mono-Pharmacists,” Drug Discovery and Therapy World Congress 2013, 3–6 June, Boston Massachusetts, USA, 2013.
  31. Bulnes F, Bulnes-Gonzalez FH (2014) Quantum Developments in Nanomedicine: Nanocurative Actions by Soft Photons Sources and their Path Integrals. Nanomedicine  Open Central Press, UK, Pg: 238–267.
  32. Bulnes F (2015) Photonic Chains of Wave-links to the Quantum Communication. Journal on Photonics and Spintronics 3: 10–14.

[1] Exists a research programme called electrodynamics research programme, which is dedicated to the future technologies whose fundamentals are the quantum and classical electrodynamics including the modern developments in advanced electronics.

[2] I am Editor-in-Chief of the Journal on Photonics and Spintronics, in USA. See: http://researchpub.org/journal/jps/editorial%20board.html

Implantation of Continuous Flow Pumps in Aortic Valve Position: Theoretical Advantages and Disadvantages

DOI: 10.31038/JCCP.2019211

Abstract

Left ventricle assist devices has become an alternative in treatment of cardiac failure. They are used as bridges to recovery, heart trasplant or destination therapy. There are two principal types of circulatory support systems: pulsed flow pumps and continuous flow pumps. The latter correspond to small turbines that levitate in a magnetic field and driving the blood from the left ventricle into the aorta. The common configuration consist in an inflow cannula in the left ventricular apex, a turbine and an output tube graft anastomosed to the ascending or descending aorta. All they are controlled and powered electrically by a wire from the outside. Despite this advances, there remains a high rate of complications. Including anatomical problems (pocket, inflow cannula, outflow graft), technical problems (bleeding, adhesions), infections, thrombosis, embolism and aortic valve problems. To reduce some of these complications, some investigators have developed the concept of aortic intravalvular pump (Valvo – pump). The prototypes are in the experimental stage and are not adapted to use for extended periods or in humans. The theoretical advantages and disadvantages of the implantation of a continuous flow pump in aortic valve position are discussed, and the first experimental models are described.

Keywords

Cardiac Surgery, Heart Failure, Heart Transplant, Left Ventricle Assist Devices, Valvo Pump

Introduction

Heart failure has become one of the most common causes of hospitalization in developed countries. It accounts for 5% of emergency hospitalizations and about 10% of all hospitalizations in Europe. According to statistics from the European Society of Cardiology, 1 – 2% of the european adult population currently suffer from heart failure. The incidence increases to 10 – 20% in people over 75 years and heart failure remains a leading cause of death. Finally, because of the aging of the population, the prevalence is increasing [1]. The prognosis remains poor, with a mortality of 50% at 4 years. Current medical treatments, ventricular re-synchronization, conventional cardiac surgery (coronary or valvular) and ventricular remodeling surgery have improved the overall prognosis of this disease, but for a significant number of patients, the only treatment possible remains the heart transplantation [2]. The results of transplantation are very encouraging, with one-year survival of 77%, five years of 67%, and ten years of 53% [3]. Unfortunately the number of donors has decreased and the number of patients on the waiting list continues to increase. As a result, there is a real lack of grafts to satisfy demand [4].

Since the early 1960s, circulatory assistances have been developed to support the function of the left ventricle. All the advances made in this field have made it possible to move from extracorporeal circulation to pneumatic, electromechanical implantable mechanical assistance systems, and even the appearance of a total artificial heart and continuous flow assistance [5]. Rose and coworkers of the REMATCH study investigators compared 61 patients with non-transplantable, medically treated terminal heart failure versus 68 patients who received implantable mechanical assistance (Heartmate, Thoratec ®). At two years, the survival of the group under assistance was 23% against 8% in the group treated medically (p = 0.09) [6]. There are currently two main implantable circulatory assistance systems: pulsatile flow and axial flow circulatory assistances.

Pulsatile flow assistances used pneumatic energy to fill and empty cavities similar to ventricles. Flow is directed through uni – directional inlet and outlet valves that provide pulsed flow and “physiological” cardiac output. This systems can be used to assist both ventricles. Pulsatile flow assistance is now virtually abandoned in favor of axial pumps, because of their smaller size, lower thrombotic risk, and better energy efficiency, even if the reduction or abolition of the pulsatility has been criticized. In all cases, these axial flow pump systems are composed of an inlet cannula implanted at the apex of the left ventricle, an electric pump and an outlet tube anastomosed directly to the ascending aorta or down. They can be implanted by sternotomy or by thoracotomy, with or without cardio pulmonary bypass. These pumps provide a continuous flow sufficient to ensure the theoretical cardiac output. The Heartmate 2 Investigators group compared the use of a pneumatic pump, the Heartmate®, to a continuous flow pump, the Heartmate II®. After two years, the survival with the pneumatic pump was 24% against 58% with the continuous flow pump (p = 0.008) [7]. These results showed that, in addition to the technical advantages (small size, electrical energy), there is an advantage in terms of survival for the patients, and the continuous flow pumps are more and more the first choice for the patients with a left ventricle failure. Thanks to technical progress made on development of pumps and the experience in management of complications, LVADs are accepted as one of the major tools to treat the cardiac failure, either as bridge to transplantation or to recovery (even if the rate of explant due to recovery is low) or as a definitive therapy (destination) [8–10].

Problems and Complications of Current Pumps

The main complications observed in the Interagency Registry for Mechanically Assisted Circulatory Support (INTERMACS) are infection (17,46%), bleeding (16,5%), cardiac arrhythmia (7,68%), respiratory failure (4,5%), neurological dysfunction (2,87%), renal dysfunction (2,48%), device malfunction (1,98%) and right heart failure (1,89%). Mortality under assistance is close to 20%, and is related to cardiac failure, infection, CNS event, multi – organ failure and respiratory failure [11].

There are also unregistered complications due to apical implantation of axial flow pumps, such as thrombosis of the left ventricular outflow tract or the aortic valve, the risk of postoperative bleeding, and difficult explantation of the LVAD in the event of transplantation or recovery. In addition, these systems are not usable in case of bi ventricular failure.

Anatomical Problems (Pocket, Cannula, Exit Cannula)

  1. The implant of an axial flow pump requires the preparation of a pocket at pre-peritoneal level, in front of the diaphragm. For large patients there is no limitation, but the implantation of the pump may be limited in small patients.
  2. The in-flow cannula is placed in the apex of the left ventricle. The heart muscle forms two spirals that make up the ventricles. An under – endocardial spiral turns to the right and a sub – epicardial spiral turns to the left [12]. During ventricular dilatation, these spirals unfold and expand, but keep their shape. Once the assistance is in place, the ventricle is unloaded, they must return to their normal size to recover ventricular function. The cannula in the apex can interfere with normal contraction and, in addition, constitute a scar that affects the recovery of the contractile function of the ventricle.
  3. The out-flow line of the pumps consists of a prosthetic tube anastomosed directly into the aorta. He can bend and stick to the sternum.

Technical Problems (Bleeding, Adhesions)

Bleeding and tamponade can affect more than one fifth of patients undergoing assistance. These complications may concern the suture lines, the apex of the left ventricle, as well as the anastomosis of the prosthetic tube on the aorta. Currently, “bridge to transplantation” accounts for 80% of indications for ventricular assistance. Indeed, most patients will eventually be re-operated. Postoperative adhesions become a frequent and serious problem, which increases the operating time, the risks inherent to the detachment of the heart with an increased risk of postoperative bleeding, transfusions, and could affect the post transplant survival [13].

Infections

The large implantation area of the pumps and the fluid possibly accumulated around can facilitate bacterial adhesion and multiplication. This susceptibility, in combination with heart failure, malnutrition, and immunosuppression state, makes infection the most frequent complication of mechanical circulatory assistance [10, 14]. (10, 14) Infections associated with LVADs can be local (the drive line, the pocket, the scar, the sternum and the mediastinum) or haematogenous (sepsis, endocarditis, pump), they can affect 20% of patients at six months, and were related to 16,2% of deaths [10,14] .

Tromboses, Embolism And Valve Problems

Thrombus and neurological events, including ischemic stroke, hemorrhagic stroke, and transient ischemic attack, are relatively common and often severe complications following LVAD placement. Thromboembolic complication rates range from 3% to 20% and are related to the duration of the asistance [15]. The frequent sites of thrombosis are the connection of the conduits to the pump, both the inlet and the outlet, and particularly the suture rings of the tubes to the vascular system. Reilly et al. published a retrospective study of 51 consecutive patients receiving left ventricular assistance over a 2-year period. In this series, transesophageal echocardiography showed ventricular thrombus in 8 patients (16%). Predictors of thrombosis were: infarction, atrial cannulation and postoperative bleeding. The presence of thrombus is associated with four times the risk of stroke compared to patients without thrombi. Ventricular cannulation and short duration of assistance may decrease the incidence of LV thrombosis [16]. Thrombosis of the aortic valve and the ascending aorta may also occur after the implantation of a LVAD despite adequate anticoagulation. This is more common in patients with a prosthetic valve, continuous flow devices and devices with grafts anastomosed on the descending thoracic aorta. In addition, the lack of left ventricular ejection with persistent closure of the aortic valve creates stagnation at this level and contributes to thrombosis [17]. Commissural fusion of the native aortic valve frequently occurs with increasing frequency of aortic insufficiency during continuous flow assistance. The impact of valvular lesion in long-term assisted patients as a bridge to transplantation or as a definitive therapy is unclear. Aortic stenosis may be a real problem for patients in whom assistance has been posed as a bridge to recovery or in those in whom assistance is unsuccessful [18–20].

Advantages and Disadvantages of A Pump in the Aortic Valve Position

Anatomical, Technical and Physiological Advantages

  • The placement by vertical median sternotomy reduces the risk of bleeding and postoperative pain, as well as the duration of the procedure. Even the pump could be implanted by mini sternotomy (superior parcial sternotomy) reducing post operative pain.
  • Implantation technique is the equivalent of aortic valve replacement, and thus largely known by all surgeons: a single line of suture, without apical approach of the ventricle, nor aortic anastomosis, also reducing the risk of bleeding: reproducible technique.
  • The size of the machine would allow its implantation in patients of all sizes. There is no material to put in place in a pocket.
  • The absence of a pocket to place the device would reduce the risk of associated infection.
  • The “anatomical” position of the pump would allow physiological ventricular emptying, maintaining flow through the left ventricular outflow tract, and anterograde flow at the ascending aorta and coronary arteries.
  • Anterograde emptying may reduce the risk of intracardiac or valvular thrombosis, and reduce the risk of systemic embolism.
  • Because of the absence of an apical scar and scars, the ventricular geometry would not be modified, and the ventricular contraction (during or after the weaning) would be more effective.
  • Implantation in the intracardiac valve position would eventually lead to dual aortic and pulmonary implantation in the event of bi-ventricular failure.
  • In case of transplantation, the absence of strong apical pericardial adhesions, the absence of aortic prosthetic tube and the fully intra-cardiac position of the machine, would allow a “classical cardiectomy”, with removal of the system and the heart in one. “Block”.
  • In the event of ventricular function recovery, there would be no ventricular scar and no loss of myocardial mass and the aortic valve would be replaced by a conventional prosthesis, similar to an aortic valve redux.

Disadvantages

  • The operative technique demanded the use of CPB and aortic clamping. Today CPB is considered a safe and low risk technique that allows complex and long-lasting procedures on the heart. In addition, the majority of devices, except the Jarvik 2000®, are implanted under CPB with lateral clamping of the aorta to anastomose the prosthetic tube.
  • The implantation of the device requires sacrifice of the aortic valve and its replacement in case of recovery.
  • Implantation in the aortic position makes the assistance the only way of ventricular ejection, and thus implies absolute reliability of the device. There are several causes of device malfunction, including thrombus formation with hemolysis, mechanical failure of the impeller, and driveline lead fractures with electrical failure. Current continuous-flow
  • devices consisting of only a single, nearly moving part-the impeller- sowed in clinical trials, statistically significant lower pump replacement rates in comparison to their first and second generation counterparts.
  • Even if the rate of device malfunction is low, in the event of a technical problem a massive aortic insufficiency would occur and the ventricle would have no ejection channel and the patient would die. A mechanism, such as an internal valve, should be found to protect the heart in the event of a technical problem with the machine.
  • There are the same disadvantages common to all electrical pumps, the transcutaneous passage of an activation line for the power supply. The Jarvik 2000 the activation line pass through the thorax, the neck and comes out retro-ear position. This technique has greatly decreased cable site infections and represents a great advance in decreasing this complication.

Valvular Pumps

The Valvo Pump

The idea of an aortic valve pump was first published by Yoshinori Mitamura ,in Japan, in 1991. Mitamura and his colleagues developed a small axial flow pump (33 mm length, 37 mm diameter) capable of generating a flow of 6.9 l / min and a differential pressure of 48 mm Hg. Initial studies showed the feasibility of the pump [21]. In 1999 the Mitamura team released a final pump model of 44mm in length, and 38mm in external diameter. This pump was experimentally tested in a closed circuit and was able to operate for 41 days without stopping, to generate a flow of 5 L / min at 7000 rpm and did not to produce too much haemolysis [22]. Unfortunately, the size of the Mitamura pump does not allow its implantation in vivo.

The Dynamic Aortic Valve

Li and coworkers, at the Department of Cardiac Surgery, Institute of Cardiology and Fu Wai Hospital, Beijing, and the Union Medical College and the Chinese Academy of Medical Science, Beijing, China, have also developed an axial flow pump implanted in aortic position [23]. Since the device is intended for long-term use, the motor and pump unit are physically separated. The device consists of a finned wheel and a rotor contained in a cage. The magnetic rotor rotates in the presence of alternating magnetic fields produced by an electric motor. The pump is sutured to the aortic ring. The assembly also includes a valve that maintains the proper hemodynamics through the aortic port. A prototype was manufactured and evaluated in vitro. It was capable of delivering a flow rate up to 5 L / min with a rotation rate of 12,600 rpm with a differential pressure of 100 mmHg.

Intraventricular Axial Flow Pump

Yamazaki et al, in the Department of Cardiovascular Surgery, Tokyo Women’s Medical College, Heart Institute, Japan, and later in the Medical Center at the University of Pittsburgh, USA, have developed a ventricular assist axial flow pump left fully implantable in the left ventricle [24]. The system consists of a finned wheel (13.9mm), combined with a guide fin, a tube housing and a motor. The pump is made of titanium alloy and the weight of the pump is 170 g. It produces a flow of more than 5 L / min against 100 mm Hg of pressure at 9,000 rpm, with a total power consumption of 8 W. The maximum total efficiency exceeds 17%. The pump was implanted in the LV cavity trough the apex and passes the aortic valve. Blood is drained from the VG to the intake ports at the pump base and discharged into the ascending aorta. In an animal model, three pumps were implanted in three cases (26, 30 and 168 days of assistance). The operation of the pump remained stable during all experiments. No cardiac arrhythmias were detected, even during stress tests in these 3 cases. Plasma free hemoglobin level remained within acceptable limits. The post mortem examination did not reveal any interference between the pump and the mitral apparatus. No thromboembolism was detected in the vital organs in Cases 1 and 2, but some small renal infarctions were detected in case 3 [25]. Due to anatomical problems, and conditioning, the pump was not considered a durable device.

Cross-valvular cannular pump

Kun Xi Qian at the Institute of Biomedical Engineering of Jiangsu University, China, in association with the University of Texas, USA, built a ventricular energy transduction pump totally implantable in the left ventricle [26]. The device has a motor and a pump completely contained in a cannula. The motor has a coil with an iron core and a rotor with the four-pole magnet; the pump has a finned wheel and a flow guide fin. The dimensions of the engine are 60mm in length and 13mm diameter. The dimensions of the pump are 55mm in length and 11mm in diameter. The total length of the device is 115millimeters. The total weight of the device is 53g. The use bearing motor supports eight needles on each side of the rotor magnets. A special purge system is provided by infusion of saline mixed with heparin in the pump inlet chamber (30 – 50 cc per hour). Thus no mechanical wear or thrombus formation was observed during use of this pump. During the hemodynamic experiment, the pump produced a flow of 4 L / minute with a pressure increase of 60 mmHg, at a speed of 12500 rpm. At zero flow, corresponding to the diastolic period of the heart, the pump can maintain the aortic pressure at more than 80 mmHg at the same rotational speed. According to the authors, this new pump can be quickly inserted in an emergency and removed easily after the recovery of the native heart and may be useful for patients with acute left ventricular failure.

The “USJ – III Aortic Valvo Pump

The same authors have also developed other pump intended to be implanted in aortic position [27]. Like those described previously, it consists of a cylindrical steel box which contains a stator and a rotor activated by external magnetic field. The pump has a weight of 40g and an outer diameter of 25mm. around the pump is a flange to allow its attachment to the aortic ring. It operates at three speeds: 10000, 12500 and 15000 rpm. The prototype of the pump was tested in an experimental model in vitro for four months. The power consumption is 7W at 15000rpm, it has been able to generate a maximum flow of 10 L / min (range 4 -10) and pressures of 80 mm Hg, parameters which are quite satisfactory for support human hemodynamics. The authors developed other 23mm diameter prototype with a weight of 31g, tested in vitro and implanted in a pig of 80 kg [28]. Finally the same team has developed a pump of 21mm diameter for weight of 27g that operates at three speeds (12500, 15000 and 17500 rpm and was capable of generating a flow of 5 L / min in vitro [29]. Until today, this pump is the smallest and most advanced in the world. Currently the authors are working to improve the biocompatibility of this pump and ensure its durability.

Discussion & Conclusion

The idea of implanting a pump in the aortic position is not recent. Several tests have been done over the last 20 years to manufacture a pump with a size that allows its implantation in aortic position and the power adequate to support the hemodynamics of a human being. These efforts are still in an experimental stage, but there are already small pumps in development, and it is likely that in future years the improvement of their biocompatibility and durability will allow their human implantation. It is also probable that after some modifications of the current pumps these could be put in place in aortic position. If the theoretical benefits are real, probably this new generation of pumps will hold a place among the audience of the future, especially by their ease of implementation. Different anticoagulation protocols will have to show if there are any advantages for this type of implantation on the thrombotic risk. In addition, one can imagine a double implantation (aortic and pulmonary) for bi ventricular failure.

Acknowledgement

[List here any individuals who contributed in the work and grant details.]

Abbreviations

LVAD: left ventricle assist device.

CPB: cardio pulmonary bypass

CVA: cerebrovascular accident

CNS: Central nervous system

LV: Left ventricle

References

  1. Ponikowski P, Voors A, Anker S, Bueno H, Cleland J, et al. (2016) Guia ESC 2016 sobre el diagnóstico y tratamiento de la insuficiencia cardiaca aguda y crónica. Rev Esp Cardiol 69: 1119–1125.
  2. Nicolini F, Gherli T (2009) Alternatives to transplantation in the surgical therapy for heart failure. Eur J Cardiothorac Surg 35: 214–228.
  3. Tjang YS, van der Heijden GJ, Tenderich G, Grobbee DE, Körfer R (2008) Survival analysis in heart transplantation: results from an analysis of 1290 cases in a single center. Eur J Cardiothorac Surg 33: 856–861.
  4. de Jonge N, Kirkels JH, Klöpping C, Lahpor JR, Caliskan K, et al. (2008) Guidelines for heart transplantation. Neth Heart J 16: 79–87.
  5. De Bakey M (2005) Development of Mechanical Heart Devices. Ann Thorac Surg 79: 2228 – 2231.
  6. Rose EA, Gelijns AC, Moskowitz AJ, Heitjan DF, Stevenson LW, et al. (2001) Long-term mechanical left ventricular assistance for end-stage heart failure. N Engl J Med 345: 1435–1443.
  7. Slaughter M, Rogers J, Milano C, Russell S, Conte JV, et al. (2009) Advanced Heart Failure Treated with Continuous-Flow Left Ventricular Assist Device. N Engl J Med 361: 2241–2251.
  8. Baughman K, Jarcho A (2007) Bridge to Life — Cardiac Mechanical Support. N Engl J Med 357: 846–849.
  9. Topkara VK, Garan AR, Fine B, Godier-Furnemont AF, Breskin A, et al. (2016) Myocardial Recovery in Patients Receiving Contemporary Left Ventricular Assist Devices: Results From the Interagency Registry for Mechanically Assisted Circulatory Support (INTERMACS). Circ Heart Fail 9: e003157.
  10. Kirklin JK, Naftel DC, Pagani FD, Kormos RL, Stevenson L, et al. (2012) Long-term mechanical circulatory support (destination therapy): on track to compete with heart transplantation?. J Thorac Cardiovasc Surg 144: 584–598.
  11. Kirklin JK, Naftel DC, Kormos RL, Stevenson LW, Pagani FD, et al. (2010) Second INTERMACS annual report: more than 1,000 primary left ventricular assist device implants. J Heart Lung Transplant 29: 1–10.
  12. Sengupta PP, Korinek J, Belohlavek M, Narula J, Vannan MA, Khandheria BK et al. (2006) Left ventricular structure and function: basic science for cardiac imaging. J Am Coll Cardio 48:1988–2001.
  13. Patolla V, Patten R, Denofrio D, Konstam MA, Krishnamani R, et al. (2009) The effect of ventricular assist devices on post transplant mortality in analysis of the United Network for organ sharing thoracic registry. J Am Coll Cardiol 5:264–271.
  14. Holman W, Pamboukian S, Blood M, Tallaj J, McGiffin D, et al. (2005) Managing Device Infections: Are We Progressing or Is Infection an Insurmountable Obstacle?. ASAIO Journal 51: 452–455.
  15. McIlvennan CK, Magid KH, Ambardekar AV, Thompson JS, Matlock DD, et al. (2014) Clinical outcomes after continuous-flow left ventricular assist device: a systematic review. Circ Heart Fail 7: 1003–1013.
  16. Reilly M, Wiegers S, Cucchiara A, O’Hara ML, Plappert T, et al. (2000) Frequency, risk factors, and clinical outcomes of left ventricular assist device-associated ventricular thrombus. The American Journal of Cardiology 86: 1156–1159.
  17. Crestanelloa J, Orsinellib D, Firstenberga M, Sai-Sudhakara C (2009) Aortic valve thrombosis after implantation of temporary left ventricular assist device. Interactive CardioVascular and Thoracic Surgery 8: 661–662.
  18. Mudd JO, Cuda JD, Halushka M, Soderlund KA, Conte JV, et al. (2008) Fusion of aortic valve commissures in patients supported by a continuous axial flow left ventricular assist device. J Heart Lung Transplant 27: 1269–1274.
  19. Rose AG, Park SJ, Bank AJ, Miller LW (2000) Partial aortic valve fusion induced by left ventricular assist device. Ann Thorac Surg 70: 1270–1274.
  20. Connelly JH, Abrams J, Klima T, Vaughn WK, Frazier OH (2003) Acquired commissural fusion of aortic valves in patients with left ventricular assist devices. J Heart Lung Transplant 22: 1291–1295.
  21. Mitamura Y, Yozu R, Tanaka T, Yamazaki K. (1991) The valvo-pump. An axial, nonpulsatile blood pump. ASAIO Trans 37: M510–512.
  22. Mitamura Y, Nakamura H, Okamoto E, Yozu R, Kawada S, et al. (1999) Development of the valvo pump: An axial flow pump implanted at the heart valve position. Artif Organs 23: 566–571.
  23. Li GR, Ma WG, Zhu XD (2001) Development of a new left ventricular assist device: the dynamic aortic valve. ASAIO J 47: 257–60.
  24. Yamazaki K, Umezu M, Koyanagi H, Outa E, Ogino S, Otake Y, et al. (1993) Development of a miniature intraventricular axial flow blood pump. ASAIO J 39: 224–230.
  25. Yamazaki K, Kormos RL, Litwak P, Tagusari O, Antaki JF, Kameneva M, et al. (1997) Long-term animal experiments with an intraventricular axial flow blood pump. ASAIO J 43: 696–700
  26. Qian KX, Wang DF, Topaz S, Ru WM, Zeng P, et al. (2007) Novel totally implantable trans-ventricular and cross-valvular cannular pump with rolling bearings and purge system for recovery therapy. Journal of Medical Engineering & Technology 131: 10–13.
  27. Qian KX, Wang DF, Topaz S, Zeng P, Yuan HY, et al. (2005) World-first implantable aortic valvo pump (IAVP) with sufficient haemodynamic capacity. Journal of Medical Engineering & Technology  6: 302–304.
  28. Qian KX (2006) An implantable aortic valvo-pump for destination therapy. Cardiovasc Eng 6: 41–43.
  29. Qian K X, Wang D F, Topaz S, Ru W M, Zeng P, et al. (2007) World-smallest LVAD with 27 g weight, 21 mm OD and 5 l min-1 flow with 50 mmHg pressure increase. Journal of Medical Engineering & Technology 31: 181–184.

Social Learning in Birds Studied by Cross-Fostering in the Wild

DOI: 10.31038/IJVB.2019321

Abstract

Social learning is widespread in nature and important for the behaviour, ecology and conservation of animals. We applied a method of cross-fostering between passerine birds in woodland areas in Norway, including great tits Parus major, blue tits Cyanistes caeruleus, and pied flycatchers Ficedula hypoleuca. When cross-fostering between tit species, the offspring sexually mis-imprinted on the foster species. Survival rate was similar to the controls but mating success was strongly reduced and mixed pairings occurred between cross-fostered birds of the two species, resulting in one case of hybridization. Song was affected, but the extent showed great variation among males. Male pied flycatchers raised by tits also included strophes from the foster species in their song, in particular if they had been raised together with siblings of the foster species. However, surprisingly, in flycatchers, mate choice was not affected by cross-fostering, indicating a different mechanism between song learning and mate choice. In tits, choice of nest site was affected by the cross-fostering, the birds taking characteristics of the natal nest site into account, and the behaviour of members of their foster parent species. Cross-fostering had a strong effect on foraging behaviour in terms of spatial location of foraging sites and the type of prey items provided to the young. Learning foraging techniques within the natal habitat may explain why prey provided by immigrant tits new to the study area differed from those provided by local recruits. We discuss how social learning may affect the evolution, behaviour and ecology of these birds, including the evolution of nest parasitism, and how cross-fostering among species may be used in management programs of endangered species.

Introduction

During the last decades, it has been recognized that social learning is widespread in nature and strongly affects evolution, behaviour and ecology of animals, and is thus also significant for conservation [1]. Studies in captivity, with control of the rearing environment, have provided the most convincing evidence whereas less is known form the wild. We studied social learning in three hole-nesting passerine birds in woodlands in Norway, namely in the great tit Parus major, the blue tit Cyanistes caeruleus, and the pied flycatcher Ficedula hypoleuca. The species are widespread in Europe and on our study area, use nest boxes almost exclusively for breeding. The return rate of birds raised locally has been sufficiently high (5–10% of offspring banded) to study the significance of early social learning throughout a bird´s life.

The study began in 1995 in an effort to explain why only about 1% of bird species are obligate, interspecific nest parasites, although female birds are often away from the nest during the egg laying period, leaving an opportunity for females of other species to deposit an egg there to reduce their own cost of breeding. We transferred eggs between nests to simulate nest parasitism between species and this led to studies of how the cross-fostering affected social learning of several aspects of behaviour. The main results are summarized and discussed below, including how cross-fostering may be used in management programs of endangered species.

Material and Methods

We cross-fostered birds in mixed deciduous – conifer woodlands near Oslo, Norway, during 1995 – 2017. Both whole clutches and single eggs were swapped between nests to study the effect of sibling species on the degree of imprinting. All nestlings were ringed with a numbered metal ring, and adults were ringed with various combinations of plastic leg colour rings, allowing us to follow individual birds for life. Because the birds almost exclusively used our nest boxes for breeding, unringed birds were assumed to be immigrants to the study area, possibly having been raised in a different habitat [2]. The study complied with the current laws of Norway and was approved by the animal welfare committee.

Results and Discussion

Mate Choice and Brood Parasitism

The cross-fostered eggs and nestlings were accepted and cared for by their hosts, and they recruited into the adult population with a similar frequency as the controls [3,4]. However, in tits, most of the cross-fostered birds became sexually mis-imprinted, trying to mate with a member of the foster species. Therefore, many did not succeed in pairing with a conspecific but they often mated with a member of the other species that had also been cross-fostered. Over the years, more than 30 such mixed pairs were found (T. Slagsvold, unpublished data). Their eggs often did not hatch, but occasionally the female hatched nestlings of her own species which had resulted from extra-pair copulation with a conspecific male that was not her social partner. Only one case of mixed-pairings resulted in a hybrid (between a female great tit and a male blue tit), to our knowledge the only hybrid known between the two species.

We tested the degree of sexual mis-imprinting by presenting a live, caged bird on their territory. The cross-fostered tits typically attacked a same-sex member of the foster species much more than a conspecific rival, showing that early social learning influences intrasexual species recognition in these birds [5]. The mis-imprinting continued for life [6]. In contrast, pied flycatchers that were raised by tits did not become sexually mis-imprinted as shown by their responses to live, caged birds upon arrival in spring [3,4]. Perhaps the host species was too different in appearance, and the flycatchers overwinter in tropical Africa where the two species of tits are not found. Species recognition appears to be more innate in flycatchers than in tits [7]. Because of polygyny, many flycatchers are raised without a male present, and so an innate species recognition mechanism may have evolved to allow identification of conspecific males. In pied flycatchers, males and females usually differ in plumage colour and mate choice is very rapid, often taking only a few hours [8].

In nature, great tits and blue tits are not parasitized by other bird species. Experiments with such birds are needed to study how parasitism can start in absence of traits coevolved in an arms race with the host. We conclude that sexual imprinting may constrain the evolution of brood parasitism. It is a puzzle how some species have solved the problem [9,10]. However, as mentioned above, pied flycatchers do not become sexually mis-imprinted when raised by a heterospecific host. Therefore, species with an innate species recognition mechanism may more likely evolve interspecific nest parasitism.

Social Dominance, Stress, Mate Guarding, Paternity and Sex Ratio

In winter, cross-fostered tits were subordinate to conspecific controls at feeding stations although they were not smaller-sized [11]. They also seemed to suffer higher levels of stress, as measured by corticosterone in the blood, showing that rearing conditions may have long-term consequences for stress responsiveness in free-living birds [12]. Probably because of the mis-imprinting, cross-fostered male tits guarded their females less during the fertile period of their mate than did controls [13] but apparently this did not result in loss of paternity [14]. For an unknown reason, broods with at least one cross-fostered parent contained relatively more male offspring than did control broods [15].

Song

In all three species studied, cross-fostered males included strophes from the foster species when display-singing in spring. However, the variation among males was great; in the tits, some cross-fostered males only sung strophes of the foster species, some only strophes of their own species and some a mixture of the two [16,17]. Play-back studies showed that territorial cross-fostered male tits responded more strongly than controls to heterospecific song than to conspecific song [18]. Thus, social learning strongly influenced both inter- and intraspecific communication. Tits of both sexes also produced warning calls that differed according to the species they had been raised by [10]. Overall, males appear to prefer vocal tutors that visually resemble their social father although their social mother´s appearance and behaviour may also influence the preference [17].

The song of pied flycatchers is much more complex than the song of tits, but even in this species, song was heavily affected by cross-fostering. If the bird had been raised both with foster parents and alongside siblings of the foster species then the strophes almost perfectly resembled those of the host species [19]. However, surprisingly, as mentioned above, mate choice in the flycatcher was not affected, indicating a different mechanism between song learning and mate choice.

Choice of Nest Site

Nest boxes were of two sizes, and most great tits used the larger ones and most blue tits the smaller. In both species, choice of nest box was affected by treatment; cross-fostered birds took the size of their natal nest box into account (vertical transmission of preference), and also the behaviour of members of their foster species (horizontal transmission of preference). However, although effects were statistically significant, the nest site choice seemed mainly to be innate [20].

Foraging

Blue tits typically forage higher above the ground, and more on twigs, than great tits, and they also feed on smaller prey. In both tit species, cross-fostering had a strong effect on the foraging and it lasted for life, the birds apparently learning from their foster parents [21]. This included both choice of foraging site [21], and which prey items they provided to the young [22]. The effect of the cross-fostering constituted about half of the difference in prey items between these birds and the controls. Cross-fostering also affected how parents chose prey items when the food demands of their offspring changed [23].

In tits, prey choice differed between immigrant and local recruits and we suggested this was a result of social learning in different natal habitats. Immigrant great tits provided more brown larvae and fewer green ones to their nestlings whereas in blue tits, a difference was found in prey size. Such foraging differences also held true within pairs, where one parent was an immigrant and the other was a local recruit, and thus when confounding factors like habitat quality, year and time of season, and the weather conditions during the video-filming were taken into account [2]. In both species, the offspring stay with their parents for about three weeks after leaving the nest and then learn foraging behaviour from their parents. The differences between the two groups of birds in prey types differed most in yearling birds. Apparently, many immigrants had been raised in different and less productive forest habitats and it took some time until they were able to forage optimally after they settled in a new habitat after natal dispersal. In great tits, immigrant females laid fewer eggs than local recruits, and laying date was also affected, presumably because the birds were not fully adapted to the new local micro-habitat [2].

There is great variation in feeding habits and type of parental care among bird species. For instance, precocial birds start self-feeding soon after hatching but altricial birds are characterized by a long period of parental care after hatching during which vertical transmission of skills can take place. However, learning by horizontal transmission after a bird has left its family may also be important, as demonstrated in diffusion experiments in tits [24]. We conclude that early learning is crucial for foraging behaviour later in life, and thus may affect the extent of natal dispersal, choice of habitat, and breeding success.

Cross-Fostering As A Management Tool

In birds, cross-fostering within and between species has been used to save endangered species. The case with the black robin Petroica traversi in New Zealand has been a promising example [25]. When a population is almost extinct, a few members may be brought into captivity to produce successive clutches if the eggs are removed. These extra eggs (or chicks) may then be transferred to nesting pairs of the same species in the wild (e.g. if eggs of natural nests suffer from contamination), or given to another species to rear. Here I summarize how knowledge gained from our cross-fostering studies may help such programs to succeed.

IJVB 2019-111 - Tore Slagsvold USA_F1

Figure 1. Male blue tit providing food to a brood containing a cross-fostered pied flycatcher chick alongside blue tit siblings. The display song of such cross-fostered flycatchers included strophes typical for the host species. However, they did not become sexually mis-imprinted on the host and bred successfully with a conspecific mate.

Pied flycatcher nestlings thrived well in great tit and blue tit nests [4] but the reverse was not true. This was not because flycatcher parents rejected the tit nestlings but because the nestlings could not swallow the prey delivered by their foster parents [26]. Tit parents provide mostly soft prey items, like caterpillars, whereas flycatchers often bring adult insects harder to ingest. Therefore, great care is needed to find a suitable host species, always starting with a few temporary trials to test for negative effects. If raised together with heterospecific siblings, it is important that the cross-fostered nestlings do not hatch later than their nest mates, in particular if they are smaller and less competitive than those of the host species [9]. Thus, species with similar length of the incubation period should be preferred. Typically, obligate nest parasites in the wild are larger than their host species and have shorter incubation periods. If a smaller species is used as host in a conservation program, all host eggs should be removed to avoid suffering of host nestlings and the number of nestlings cross-fostered per host nest should also be carefully considered so parents have enough resources to rear the brood. In our study, to ensure survival, we let blue tit parents raise fewer foster great tits than would be typical of conspecific blue tit broods. Swapping of whole clutches may be better than swapping single eggs because of less risk of mis-imprinting when raised with conspecific siblings in the foster nests [10,19].

Many of the cross-fostered tits became sexually mis-imprinted on their host species and so failed to pair with a conspecific, especially as yearlings. However, the mis-imprinting was not transferred across generations because offspring of fostered birds in the next generation showed no sign of mis-imprinting with regard to mate choice [27] and song [17]. Hence, the bottleneck of using heterospecific cross-fostering to save endangered species seemed to be the first breeding season and the first generation. When cross-fostering is applied, one should also consider a risk of hybridization. In our case, the three model species were apparently too distant genetically for this to be a problem.

Pied flycatchers raised by tits did not become sexually mis-imprinted. Although the males sung strophes similar to those of the foster species, they still attracted conspecific females, and some males even became polygynous [4]. Hence, cross-fostering as a management tool may be particularly useful for saving such species for which mate recognition is innate: even when members of a long-distant migrant is raised by a resident species, they may return and breed just as successfully as controls raised by their own species. We conclude that early social learning may affect the evolution, behaviour and ecology of birds, and that cross-fostering may be used with caution in management programs of endangered species.

Acknowledgement

The author is indebted to all the people that have assisted in the field during the extended study period, and to Karen Wiebe for comments on the manuscript.

References

  1. Brakes P, Dall SRX, Aplin LM, Bearshop S, Carroll EL, et al. (2019) Animal cultures matter for conservation. Science 363: 1032–1034.
  2. Slagsvold T, Wiebe KL (2018) Immigrants and locally recruited birds differ in prey delivered to their offspring in blue tits and great tits, Animal Behaviour 139: 127–135.
  3. Slagsvold T, Hansen BT, Johannessen LE, Lifjeld JT (2002) Mate choice and imprinting in birds studied by cross-fostering in the wild. Proceedings of the Royal Society of London B 269: 1449–1455.
  4. Slagsvold T (2004) Cross-fostering of pied flycatchers (Ficedula hypoleuca) to heterospecific hosts in the wild: a study of sexual imprinting. Behaviour 141: 1079–1102.
  5. Hansen BT, Slagsvold T (2003) Rival imprinting: interspecifically cross-fostered tits defend their territories against heterospecific intruders. Animal Behaviour 65: 1117–1123.
  6. Hansen BT, Johannessen LE, Slagsvold T (2008) Imprinted species recognition lasts for life in free-living great tits and blue tits. Animal Behaviour 75: 921–927.
  7. Sæther SA, Sætre G-P, Borge T, Wiley C (2007) Sex chromosome-linked species recognition and evolution of reproductive isolation in flycatchers. Science 318: 95–97.
  8. Dale S, Slagsvold T (1996) Mate choice on multiple cues, decision rules and sampling strategies in female pied flycatchers. Behaviour 133: 903–944.
  9. Slagsvold T (1998) On the origin and rarity of interspecific nest parasitism in birds. American Naturalist 152: 28–36.
  10. Slagsvold T, Hansen BT (2001) Sexual imprinting and the origin of obligate brood parasitism in birds. American Naturalist 158: 354–367.
  11. Hansen BT, Slagsvold T (2004) Early learning affects social dominance: interspecifically cross-fostered tits become subdominant. Behavioral Ecology 15: 262–268.
  12. Landys MM, Goymann W, Slagsvold T (2011) Rearing conditions have long-term consequences for stress responsiveness in free-living birds. General and comparative endocrinology 174: 219–224.
  13. Hansen BT, Johannessen LE, Slagsvold T (2009) Interspecific cross- fostering affects mate guarding behaviour in great tits (Parus major). Behaviour 146: 1349–1361.
  14. Johannessen LE, Slagsvold T, Hansen BT, Lifjeld JT (2005) Manipulation of male quality in wild tits: effects on paternity loss. Behavioral Ecology 16: 747–754.
  15. Johannessen LE, Kristiansen L, Hansen BT, Slagsvold T (2009) Facultative adjustment of brood sex ratio in response to indirect manipulation of behaviour. Ethology 115: 1057–1065.
  16. Johannessen LE, Slagsvold T, Hansen BT (2006) Song structure and repertoire size affected by social rearing conditions: experimental evidence from the field. Animal Behaviour 72: 83–95.
  17. Eriksen A (2011) Song learning in Oscine songbirds. Tutor choice, timing, and the relationship with sexual imprinting. PhD, Department of Biosciences, University of Oslo, Norway.
  18. Hansen BT, Johannessen LE, Slagsvold T (2010) Interspecific cross- fostering of great tits (Parus major) by blue tits (Cyanistes caeruleus) affects inter- and intraspecific communication. Behaviour 147: 413–424.
  19. Eriksen A, Lampe H, Slagsvold T (2009) Interspecific cross-fostering affects song acquisition but not mate choice in pied flycatchers, Ficedula hypoleuca. Animal Behaviour 78: 857–863.
  20. Slagsvold T, Wigdahl Kleiven K, Eriksen A, Johannessen LE (2013) Vertical and horizontal transmission of nest site preferences in titmice. Animal Behaviour 85: 323–328.
  21. Slagsvold T, Wiebe KL (2007) Learning the ecological niche. Proceedings of the Royal Society of London B 274: 19–23.
  22. Slagsvold T, Wiebe KL (2011) Social learning in birds and its role in shaping a foraging niche. Philosophical Transactions of the Royal Society B 366: 969–977.
  23. Wiebe KL, Slagsvold T (2015) Foraging trade-offs between prey size, delivery rate and prey type: how does niche breadth and early learning of the foraging niche affect food delivery? Ethology 121: 101–1017.
  24. Aplin LM, Farine DR, Morand-Ferron J, Cockburn A, Thornton A et al. (2015) Experimentally induced innovations lead to persistent culture via conformity in wild birds. Nature 518: 538–541.
  25. Butler D, Merton D (1992) The black robin. Oxford University Press, Auckland.
  26. Turtumøygard T, Slagsvold T (2010) Evolution of brood parasitism in birds: constraints related to prey type. Behaviour 147: 299–317.
  27. Hansen BT, Johannessen LE, Slagsvold T (2007) No cultural transmission of species recognition between parents and offspring in free-living great tits and blue tits. Behavoral Ecology and Sociobiology 61: 1203–1209.

Time for New Recommendation of Upper Limit of Serum Vitamin D in Humans

DOI: 10.31038/EDMJ.2019353

Abstract

There is a continued debate and exchange of knowledge with respect to serum 25- hydroxyvitamin D (25(OH)D) cut-off levels. Based on our current knowledge it is time to reconsider our recommendations of the optimal level of serum 25(OH)D in the clinical setting and not only focus on low levels but also recommend an upper serum limit of around 125 nmol/L (40–50 ng/mL) among healthy and diseased.

Keywords

Vitamin D

Issues and Opinions

There is a continued debate and exchange of knowledge with respect to serum 25-hydroxyvitamin D (25(OH) D) cut-off in the lower end and when to start supplementation. This debate includes the general population as well as in a long list of diseases. The discussion of a cut-off level insufficiency and deficiency of25 mmol/L (10 ng/mL) and 50 mmol/L (20 ng/mL), respectively, is one debate another is the optimal level of serum 25(OH)D and of most importance a missing debate of a recommended upper limit.

It is well known that vitamin D plays an essential role in the regulation of metabolism, calcium and phosphorus absorption.Essentially, the effect of vitamin D is in the hydroxylated form 1,25-dihydroxy vitamin D. However, the effects of vitamin D are not limited to mineral homeostasis and skeletal health maintenance. The presence of Vitamin D Receptors (VDR) in other tissue and organs suggest that vitamin D physiology extends well above and beyond bone homeostasis in cell and animal studies. There has been an association of serum 25(OH)D deficiency to several diseases among others osteoporosis, cancers, autoimmune disorders, infectious diseases, cardiovascular disease, Type 2 Diabetes (T2D) and neurological disorders such as sclerosis [1]. Knowledge from the literature is that low levels are problematic and strong associations are published indicating higher morbidity and mortality among individuals with the low levels of serum 25(OH)D<50 mmol/L (20 ng/mL). On the other hand, clinical randomized studies do not so far support the beneficial effect of vitamin D supplementation other than in osteoporosis, falls and fractures.

A vitamin D dose range of 20–25 µg (800–1000 IU) per day has been effective in several studies whereas lower doses have generally been ineffective. Further hereto several doses above this range have increased the risk of falls and therefor the recommendation is that older adults with serum 25(OH)D levels < 40 nmol/L likely have fewer falls if supplemented with 20–25 µg (800–1000 IU) per day of vitamin D [2]. A recent RCT showed maximum decrease in falls at 12-month serum 25(OH)D level of 80–95 nmol/L (32–38ng/mL) and of extreme importance is that the faller rates increase when the serum 25(OH)D level exceed 40–45 ng/mL (100–112.5 nmol/L) [3].

We have learned from clinical randomized studies (RCT) with high-dose vitamin D supplementation that for mental health benefit is seen when normalizing. But no benefit is seen of higher high levels of monthly doses of vitamin D compared with the standard monthly dose of 600 µg (24,000 IU) [4]. Monthly high-dose vitamin D supplementation does not prevent Cardio-Vascular Disease (CVD) [5] and a combined study evaluating supplementation with vitamin Ddid not show a lower incidence of cardiovascular events or invasive cancer than placebo [6]. Long-term vitamin Dsupplementation, which increased mean 25-hydroxyvitamin D3 concentration >100 nmol/L for 18 months, had no effect on systolic or diastolic BP in predominantly white, healthy adults without severe vitamin D deficiency [7].In a long-time the authors of a RCT showed no significant lung function improvements in a study of high-dose vitamin D versus placebo [8]. It is often claimed that vitamin D might protect colo-rectal cancer but among patients with metastatic colo-rectal cancer, addition of high-dose vitamin D3 vs standard-dose of vitamin D3 to standard chemotherapy was inconclusive indicating the need of further and larger multicenter randomized clinical trials [9]. Related hereto, patients with digestive tract cancer, vitamin D supplementation, compared with placebo, did not result in significant improvement in relapse-free survival at 5 years [10]. Looking at neurology, the latest published meta-analysis of vitamin D supplementation in sclerosis were including all the RCT’s and highlighted the very low-quality of these and the missing evidence of effect as data suggests no benefit of vitamin D for patient-important outcomes among people with multiple sclerosis (MS). Several studies inMS is initiated and will likely provide further evidence that can be included in a future updates [11]. A meta-analysis of 19 RCT’s of vitamin D supplementation in T2D patients shows that supplementation seem to improve HbA1c, insulin resistance, and insulin in short-term intervention, suggesting that vitamin D can be considered as a therapeutic agent along with the other treatments for T2D if patients are supplemented at low serum levels [12]. In patients with pre-diabetes and hypovitaminosis D, high dose vitamin D improves insulin sensitivity and decreases risk of progression toward diabetes [13]. In thyroid disease no significant changes were observed in the serum levels of T3 and T4 hormones to vitamin D supplementation and therefore further well controlled, large, longitudinal studies are needed [14]. In all these executed studies the included patients mostly improve serum 25(OH)D from low to normal levels and in few cases to high levels and as presented the risk of fall increases.

Several epidemiologic studies support a  serum 25(OH)D upper limit of 100–125 nmol/L (40–50 ng/mL) when evaluating all-cause mortality [15,16], CVD [17] and cancer [18]. The J-shaped curve indicate significant higher risk than benefits at levels higher than 100–125 nmol/L (40–50 ng/mL) and the above mentioned high-dose RCT’s does not report on benefits.

In the literature the excess and toxicity levels of serum 25(OH)D are as high as 250 nmol/L (100 ng/mL) and 325 nmol/L (150 ng/mL), respectively. Based on the literature we have no evidence in support of a normal level up to 250 nmol/L (100 ng/mL).

I think it is time to reconsider our recommendations of the optimal level of serum 25(OH)D in the clinical setting and not only focus onlow levels but also recommend an upper serum limit of around 125 nmol/L (40–50 ng/mL) among healthy and diseased (Table 1).

Table 1. Diagnostic clinical cut-offs of levels of serum 25(OH)D

Serum 25(OH) Level (nmol/L)

Serum 25(OH) Level (ng/mL)

Laboratory Diagnosis

<25

<10

Insufficiency

<50

25

Deficiency

50–125

25–50

Normal

>125

>50

Excess

>325

>150

Intoxication

References

  1. Holick MF (2017) The vitamin D deficiency pandemic: Approaches for diagnosis, treatment and prevention. Rev Endocr Metab Disord 18: 153–165.
  2. Dawson-Hughes B (2017). Vitamin D and muscle function. J Steroid Biochem Mol Biol 173: 313–316.
  3. Smith LM, Gallagher JC, Suiter C (2017). Medium doses of daily vitamin D decrease falls and higher doses of daily vitamin D3 increase falls: A randomized clinical trial. J Steroid Biochem Mol Biol 173: 317–322.
  4. Gugger A, Marzel A, Orav EJ, Willett WC, Dawson-Hughes B et al (2019) Effect of Monthly High-Dose Vitamin D on Mental Health in Older Adults: Secondary Analysis of a RCT. J Am Geriatr Soc..
  5. Scragg R, Stewart AW, Waayer D, Lawes CMM, Toop L, et al (2017) Jr. Effect of Monthly High-Dose Vitamin D Supplementation on Cardiovascular Disease in the Vitamin D Assessment Study : A Randomized Clinical Trial. JAMA Cardiol 2: 608–616.
  6. Manson JE, Cook NR, Lee IM, Christen W, Bassuk SS, et al (2019) Vitamin D Supplements and Prevention of Cancer and Cardiovascular Disease. N Engl J Med 380: 33–44.
  7. Scragg R, Slow S, Stewart AW, Jennings LC, Chambers ST, et al (2014) Long-term high-dose vitamin D3 supplementation and blood pressure in healthy adults: a randomized controlled trial. Hypertension 64: 725–730.
  8. Sluyter JD, Camargo CA, Waayer D, Lawes CMM, Toop L, et al (2017) Effect of Monthly, High-Dose, Long-Term Vitamin D on Lung Function: A Randomized Controlled Trial. Nutrients 9(12).
  9. Ng K, Nimeiri HS, McCleary NJ, Abrams TA, Yurgelun MB, et al (2019) Effect of High-Dose vs Standard-Dose Vitamin D3 Supplementation on Progression-Free Survival Among Patients With Advanced or Metastatic Colorectal Cancer: The SUNSHINE Randomized Clinical Trial. JAMA 321: 1370–1379.
  10. Urashima M, Ohdaira H, Akutsu T, Okada S, Yoshida M, et al (2019). Effect of Vitamin D Supplementation on Relapse-Free Survival Among Patients With Digestive Tract Cancers: The AMATERASU Randomized Clinical Trial. JAMA 321: 1361–1369.
  11. Jagannath VA, Filippini G, Di Pietrantonj C, Asokan GV, Robak EW, et al (2018). Vitamin D for the management of multiple sclerosis. Cochrane Database Syst Rev 9: CD008422.
  12. Hu Z, Chen J, Sun X, Wang L, Wang A (2019) Efficacy of vitamin D supplementation on glycemic control in type 2 diabetes patients: A meta-analysis of interventional studies. Medicine (Baltimore) 98: e14970.
  13. Niroomand M, Fotouhi A, Irannejad N, Hosseinpanah F (2019). Does high-dose vitamin D supplementation impact insulin resistance and risk of development of diabetes in patients with pre-diabetes? A double-blind randomized clinical trial. Diabetes Res Clin Pract 148: 1–9.
  14. Chahardoli R, Saboor-Yaraghi AA, Amouzegar A, Khalili D, Vakili AZ, et al (2019) Can Supplementation with Vitamin D Modify Thyroid Autoantibodies (Anti-TPO Ab, Anti-Tg Ab) and Thyroid Profile (T3, T4, TSH) in Hashimoto’s Thyroiditis? A Double Blind, Randomized Clinical Trial. Horm Metab Res 51: 296–301.
  15. Durup D, Jorgensen HL, Christensen J, Schwarz P, Heegaard AM, et al (2012). A reverse J-shaped association of all-cause mortality with serum 25-hydroxyvitamin D in general practice: the CopD study. J Clin Endocrinol Metab 97: 2644–2652.
  16. Sempos CT, Durazo-Arvizu RA, Dawson-Hughes B, Yetley EA, Looker AC, et al (2013). Is there a reverse J-shaped association between 25-hydroxyvitamin D and all-cause mortality? Results from the U.S. nationally representative NHANES. J Clin Endocrinol Metab 98: 3001–3009.
  17. Durup D, Jorgensen HL, Christensen J, Tjonneland A, Olsen A, et al (2015). A Reverse J-Shaped Association Between Serum 25-Hydroxyvitamin D and Cardiovascular Disease Mortality: The CopD Study. J Clin Endocrinol Metab 100: 2339–2346.
  18. Vojdeman FJ, Madsen CM, Frederiksen K, Durup D, Olsen A, et al (2019). Vitamin D levels and cancer incidence in 217,244 individuals from primary health care in Denmark. Int J Cancer 145: 338–346.