Abstract
Objectives: We developed and tested a very brief Zero-time exercise (ZTEx) community-based intervention to reduce sedentary behaviour and enhance physical activity and family communication in older people. ZTEx uses a foot-in-the-door approach to integrate simple strength- and stamina-enhancing physical activity into daily life at anytime, anywhere, and by anybody.
Methods: A 15-minute ZTEx intervention mini workshop with demonstrations by interventionists and practice by participants was conducted in each of the 18 districts in Hong Kong for a total of 556 public housing estate residents from 2015 to 2016. 141 participants (87% female, 73% aged ≥ 50 years) completed the evaluation. Primary outcome: intention to increase physical activity. Secondary outcomes: perceived knowledge, attitude (intention and self-efficacy) and practice regarding simple strength- and stamina-enhancing physical activity (i.e. ZTEx), days spent engaged in >= 10-minute moderate or vigorous physical activities and family communication (encouraging and engaging family members in ZTEx), and sitting time.
Results: Participants were enthusiastic and enjoyed the workshops. Perceived knowledge and attitude regarding sedentary behaviour, ZTEx, and family communication significantly increased immediately after the workshops (Cohen’s d = 0.20 to 0.30, all p < 0.05). At the 2-week follow-up, doing ZTEx and encouraging family members to do ZTEx significantly increased by 0.7 days and 0.4 days (Cohen’s d = 0.18 and 0.26, p < 0.05) respectively.
Conclusion: Our findings show early evidence that a brief ZTEx community-based intervention is an innovative, enjoyable and effective approach to improve perceived knowledge, attitude, practice, and family communication regarding simple strength- and stamina-enhancing physical activity in older people.
Keywords
Zero-time Exercise, Physical Activity, Sedentary Behaviour, Brief Community-Based Intervention
Introduction
We describe the development and feasibility of a pilot trial of a brief theory- and community-based intervention to reduce sedentary behaviour and enhance physical activity and family communication in older Chinese people in Hong Kong, the most westernized and urbanized city with rapid aging in China. Physical activity has been shown to reduce the risk of non-communicable diseases such as cardiovascular disease, stroke, and diabetes [1], improve mental health [2], and delay the onset of dementia [3]. Despite the well-known importance of physical activity for physical and mental health, physical inactivity is major public health problem globally and in Hong Kong. Physical inactivity is especially of concern given population ageing: physical activity tends to decline and sedentary behaviour tends to increase with advancing age, and the World Health Organization has stated that the proportion of the worlds’ population aged over 60 years is set to nearly double from 12% to 22% between 2015 and 2050 [4].
New, simple, and cost-effective approaches are needed to promote healthy ageing, particularly to reduce sedentary time and enhance physical activity. The present very brief intervention utilized multiple theory-based strategies: (i) cognitive dissonance, to arouse participants’ intrinsic motivation regarding exercise autonomy; (ii) the ‘foot-in-the-door’ approach, to promote participants’ exercise self-efficacy by starting with simple physical activity; (iii) gamification, by transforming the fitness assessments into fun games to promote exercise intention; and (iv) family involvement, by giving simple and specific instructions to participants to share what they have just learned with family members and praise them during the process to enhance family communication.
Zero-time exercise (ZTEx) uses a foot-in-the-door approach to kick-start the integration of simple strength- and stamina-enhancing physical activity, such as simple movements and stretching while sitting or standing, into daily life. ZTEx includes easy, enjoyable and effective (3Es) exercises that do not require extra time, money or equipment, and can be done anytime, anywhere and by anybody [5]. This approach is in line with the suggestions from physical activity guidelines for Americans that moving more and sitting less will benefit nearly everyone, and some physical activity is better than none [6]. Examples of ZTEx while sitting include raising the feet and legs off the ground, pedalling both legs, and stretching. Examples while standing include raising both heels and standing on one leg. More examples of ZTEx are shown in our YouTube videos (https://www.youtube.com/watch?v=ym3nGLGE4fg). Our pilot trials on ZTEx for lay health promoters (n = 28), social service and related workers (n = 56) and individuals with insomnia (n = 37) showed increased physical activity and perceived well-being [5, 7, 8]. The foot-in-the-door approach is a compliance tactic, which offers the easiest first step to start with, the idea being that small demands are easier to meet [9]. This approach has been applied in various fields such as the promotion of tobacco control and regular physical activity [10, 11].
Cognitive dissonance refers to the feeling of mental conflicts that occurs when an individual holds inconsistent attitudes, beliefs, and behaviours; this can lead to an alteration in attitudes, beliefs or behaviours to reduce the discomforts and restore psychological balance [12]. The desire to avoid the cognitive dissonance induced by discrepancies between one’s thoughts (harms of sedentary behaviour and advantages of physical activity) and current behaviour (low levels of physical activity) can help to arouse intrinsic motivation to increase physical activity. Dissonance interventions have been applied to improve health outcomes and suggested for health interventions for older people [13].
The Jockey Club FAMILY Project was initiated and funded by The Hong Kong Jockey Club Charities Trust. It aimed to promote family communication and family health, happiness and harmony (3Hs) in Hong Kong (website: http://www.family.org.hk/) [14]. In 2015, the School of Public Health, The University of Hong Kong was invited by the Hong Kong Department of Health and the Estate Management Advisory Committee of to add ZTEx content to a series of health talks aimed at residents living in public housing estates (low rental housing for low income groups) across the 18 districts in Hong Kong. The total duration of each session was 60 minutes, and the School of Public Health team was invited to utilize about 15 minutes in the middle to conduct a very brief ZTEx community-based intervention (i.e. a mini workshop). We hypothesized that this brief intervention would promote the knowledge, attitude (intention and self-efficacy), and practice of simple strength- and stamina-enhancing physical activity (i.e., ZTEx), family communication through encouraging and engaging family members in ZTEx, and personal and family well-being.
The primary outcome was the participants’ intention to increase simple strength- and stamina- enhancing physical activity (ZTEx) immediately after the workshop. The secondary outcomes were participants’ perceived knowledge and attitude regarding ZTEx, sedentary behaviour, and family communication (encouraging and engaging family members in ZTEx), immediately after the workshop. We also assessed participants’ sitting time, levels of simple strength- and stamina-enhancing physical activity, moderate and vigorous physical activity, and family communication regarding ZTEx, and personal and family well-being through a phone follow-up 2 weeks later. Feedback from participants on the quality of the intervention content and onsite observations on participants’ responses and intervention implementation were recorded.
Methods
Participants
The inclusion criteria included: (i) aged 18 years or older, (ii) can read Chinese and speak Cantonese, and (iii) can complete a short questionnaire. The exclusion criteria included having serious health conditions that might prevent them from physical activity. 556 participants from the 18 public housing estates attended the mini workshops as part of the health talks. All participants were invited to join the trial. The research protocol was approved by the Institutional Review Board of The University of Hong Kong/Hospital Authority Hong Kong West Cluster with registration number UW15-743, and was registered at the National Institutes of Health (http://www.clinicaltrials.gov; identifier number: NCT02645071).
Intervention
The brief ZTEx intervention was a 15-minute face-to-face session (mini workshop) designed by academic health professionals (a public health physician and a nurse). The same intervention was conducted at the public housing estate health talks in each of the 18 districts in Hong Kong from 2015 to 2016. The intervention was grounded in cognitive dissonance theory. We first introduced the phenomenon of physical inactivity in Hong Kong and emphasised the harms of sedentary behaviour. Then, we asked simple questions related to the participants’ physical activity habits, aiming to induce dissonance between their beliefs and behaviour and arouse intrinsic motivation regarding exercise autonomy.
We then utilized a foot-in-the-door approach to kick-start participants’ practice of easy-to-do and simple strength- and stamina-enhancing physical activity (ZTEx) in daily life. We demonstrated examples of ZTEx, and invited the participants to follow the actions and practice immediately. We gave simple and clear instructions and examples for how to integrate ZTEx into daily life and encouraged them to choose and create their own ZTEx (varying type, frequency, intensity and time) to increase their exercise self-efficacy and autonomy. A meta-analysis of 41 studies indicated that providing choice enhanced intrinsic motivation, effort, task performance, and perceived competence [15]. The brief intervention utilized experiential learning, which is a powerful learning tool [16]. Throughout the intervention, the participants were actively engaged, practicing ZTEx (in the form of fun games, explained below) together.
We then incorporated the positive psychology themes ‘happiness’ [17] and ‘praise’ [18] into group activities during the intervention. Two interactive and fun games were used to promote doing ZTEx as a norm in the group; as positive reinforcement, participants’ efforts and improvements were praised. The first game (the ‘single-leg–stance game’) transformed an assessment test into a group competition game [19]. All participants were invited to stand on one leg and count the time in seconds that they could effectively balance on one leg, up to a maximum of 120 seconds. We used informal physical fitness benchmarking, with the interventionist and participants counting out loud (001, 002, 003, …, 120) at a steady pace to obtain an ongoing estimate of the time for which they were able to maintain balance while standing on one leg. After the ‘game’, we revealed the age- and gender-specific reference values for the single-leg-stance and encouraged participants to compare their results with the normative data [19]. We explained the clinical relevance, highlighted the importance of balance to reduce the risk of falling, and emphasized that one can quickly improve balance with a few days’ practice.
For the second game (the ‘grip strength game’), participants were invited to hold a spoon between the handles of a handgrip by squeezing the handles together. Participants counted the number of seconds that they could effectively hold the spoon, up to a maximum of 60 seconds. After the game, we introduced a simple and clear health message on the relationship between grip strength and cardiovascular disease: “Every 5 kilograms decrease in grip strength is associated with a 9% and 7% higher risk of stroke and heart attack (such as myocardial infarction), respectively [20]”.
Before the close of the session, each participant received a leaflet with pictorial instructions and examples of ZTEx and a handgrip to bring home, which would serve as visual reminders to practise grip strength exercises and other ZTEx regularly. We highlighted the interest and positive feelings of achievement to strengthen participants’ intrinsic motivation for doing physical activity. Lastly, we emphasised the importance of regular physical activity for healthy ageing and the relationship between healthy ageing and individual and family well-being. We recommended that the participants should take two actions: (i) introduce ZTEx to family members using the leaflet; and (ii) engage in the ‘single-leg-stance game’ and ‘grip strength game’ with family members with competition among family members. To play the games with family members, participants could follow the examples practiced in the workshop (by counting the time duration out loud). We highlighted that such games can provide a good opportunity for positive family communication and expressing care toward family members. The interventionists suggested that participants and their family members could record their baseline scores as reference, monitor their own progress, and set realistic goals and make plans regarding physical activity. Family well-being (health, happiness and harmony) was expected to be enhanced through the fun games and positive family communication.
Measures
Our research staff closely observed the responses and interaction among the participants and the interventionist. Structured questionnaires were used to measure the outcomes at baseline, immediately after the session, and at a 2-week phone follow-up.
Perceived knowledge and attitude regarding sedentary behaviour and physical activity
We asked the participants to indicate the extent of their agreement to four statements about their own knowledge and attitude regarding sedentary behaviour and physical activity. Simple strength- and stamina-enhancing physical activity (i.e. ZTEx) was introduced briefly with some examples before participants answered the questions. The statements were: (i) “I understand the general concept of ZTEx” (perceived knowledge); (ii) “I intend to do ZTEx regularly” (intention); (iii) “I need to reduce my sedentary behaviour” (intention); and (iv) “I am confident that I can do ZTEx regularly” (self-efficacy).
We also asked participants to indicate the extent of their agreement with five statements regarding family communication and engaging family members in ZTEx. Three statements addressed exercise intention: “I think there is a need for my family members to reduce their sedentary behaviour”; “I intend to encourage my family to do ZTEx regularly”; and “I intend to engage in ZTEx with my family regularly”. Two statements addressed exercise self-efficacy: “I am confident that I can encourage my family to engage in ZTEx regularly”; and “I am confident that I can engage in ZTEx with my family regularly”. Responses were made on a 6-point Likert scale, ranging from 1 (strongly disagree) to 6 (strongly agree). Higher scores indicated greater exercise intention and self-efficacy.
Practice regarding sedentary behaviour and physical activity
Questions from the short form of the International Physical Activity Questionnaire – Chinese version (IPAQ-C) were used to assess participants’ level of sedentary behaviour and physical activity by asking for their self-reported sitting time and the number of days on which they engaged in moderate and vigorous physical activity, respectively (21). The questions were: “On a typical weekday in the last 7 days, how many hours per day did you typically spend seated?”; “During the last 7 days, on how many days did you do at least 10 minutes of moderate physical activity?”; and “During the last 7 days, on how many days did you do at least 10 minutes of vigorous physical activity?” [21]. We assessed the number of days on which participants performed simple strength- and stamina-enhancing physical activity by asking three questions. The questions were: “During the last 7 days, on how many days did you do simple strength- and stamina-enhancing physical activity?”; “During the last 7 days, on how many days did you encourage your family to do simple strength- and stamina-enhancing physical activity?”; and “During the last 7 days, on how many days did you do simple strength- and stamina-enhancing physical activity with your family?”. The responses ranged from 0 to 7 days.
Perceived well-being
Perceived personal well-being was assessed by asking two questions: “Do you think that you are healthy?” and “Do you think that you are happy?” [7]. Perceived family well-being was assessed by asking three questions: “Do you think that your family is healthy?”; “Do you think that your family is happy?”; and “Do you think that your family is harmonious?”. Each item allowed a response on a scale from 0 (not at all healthy/happy/harmonious) to 10 (very healthy/happy/harmonious). A higher score indicated a more positive perception of family well-being [22].
Reactions to intervention content
Participants were asked to grade the quality and utility of the mini workshop (i.e. intervention) and its contents through two questions: “How much did you like the workshop?”; and “How feasible will it be to incorporate the exercises you have learned into your daily life?”. Responses were made on an 11-point Likert scale, ranging from 0 (very unsatisfied / totally not feasible) to 10 (very satisfied / very feasible) [23].
Feedback on intervention implementation by on-site observers
We asked on-site observers to indicate the extent of their agreement with four statements regarding the quality of intervention implementation: “The time arrangement is suitable for the intervention”; “The location is suitable for the intervention”; “The room size is suitable for the intervention; and “The facilities and manpower can meet the needs of the intervention”. Responses were made on a 5-point Likert scale, ranging from 1 (strongly disagree) to 5 (strongly agree). On-site observers also rated the level of participant participation on two aspects: participants’ punctuality, and participants’ involvement. Responses were made on a 5-point Likert scale, ranging from 1 (very low) to 5 (very high). A higher score indicated better performance.
Statistical Analysis
Analyses were conducted using SPSS version 24.0. The calculation of sample size was based on the assumption that the intervention on the change of intention to do simple strength and stamina enhancing physical activity (ZTEx) with small effect size (Cohen’s d = 0.3) immediately after the workshop. Ninety subjects in a group were required for a power of 80% and a maximum error of 5% by paired t-test. It was estimated that 100 subjects would be needed for this single-group trial, assuming a small attrition rate. The paired t-test and Wilcoxon signed-rank test were used to compare the continuous parametric and non-parametric data between two time-points, respectively. The McNemar test was used to examine the changes in categorical data between two time-points. Following convention, an effect size of 0.2 to < 0.5 was considered as small, 0.5 to < 0.8 as medium, and 0.8 or above as large (Cohen, 1988). Statistical significance was determined by p < 0.05. By intention-to-treat analysis, missing data for participants who were lost to follow-up or declined to complete the questionnaires were replaced with the corresponding baseline values. Complete-case analysis was conducted for the participants with completed assessments at baseline, immediately after the workshop, and at the 2-week follow-up, to determine whether the results were consistent with intention-to-treat analysis. Sensitivity analysis was performed using complete-case analysis, which included participants who completed the 2-week follow-up and excluded those with missing data.
Results
During 2015 to 2016, we conducted 18 mini workshops with the same content and procedures for 556 public housing estates residents. Most of the participants were enthusiastic, actively involved, enjoyed the session and showed great appreciation. The average duration of mini workshop was 15 ± 4 minutes. We could not include 299 participants in the trial because most participants were older people with poor eyesight and needed assistance in answering questionnaires. The workshops needed to start on time, but we did not have enough time and manpower to obtain consent from all participants and help them to complete the questionnaires, even though most were willing to join. 96 refused to give their phone number for the 2-week follow-up. 20 agreed to join, but did not complete the baseline questionnaire.
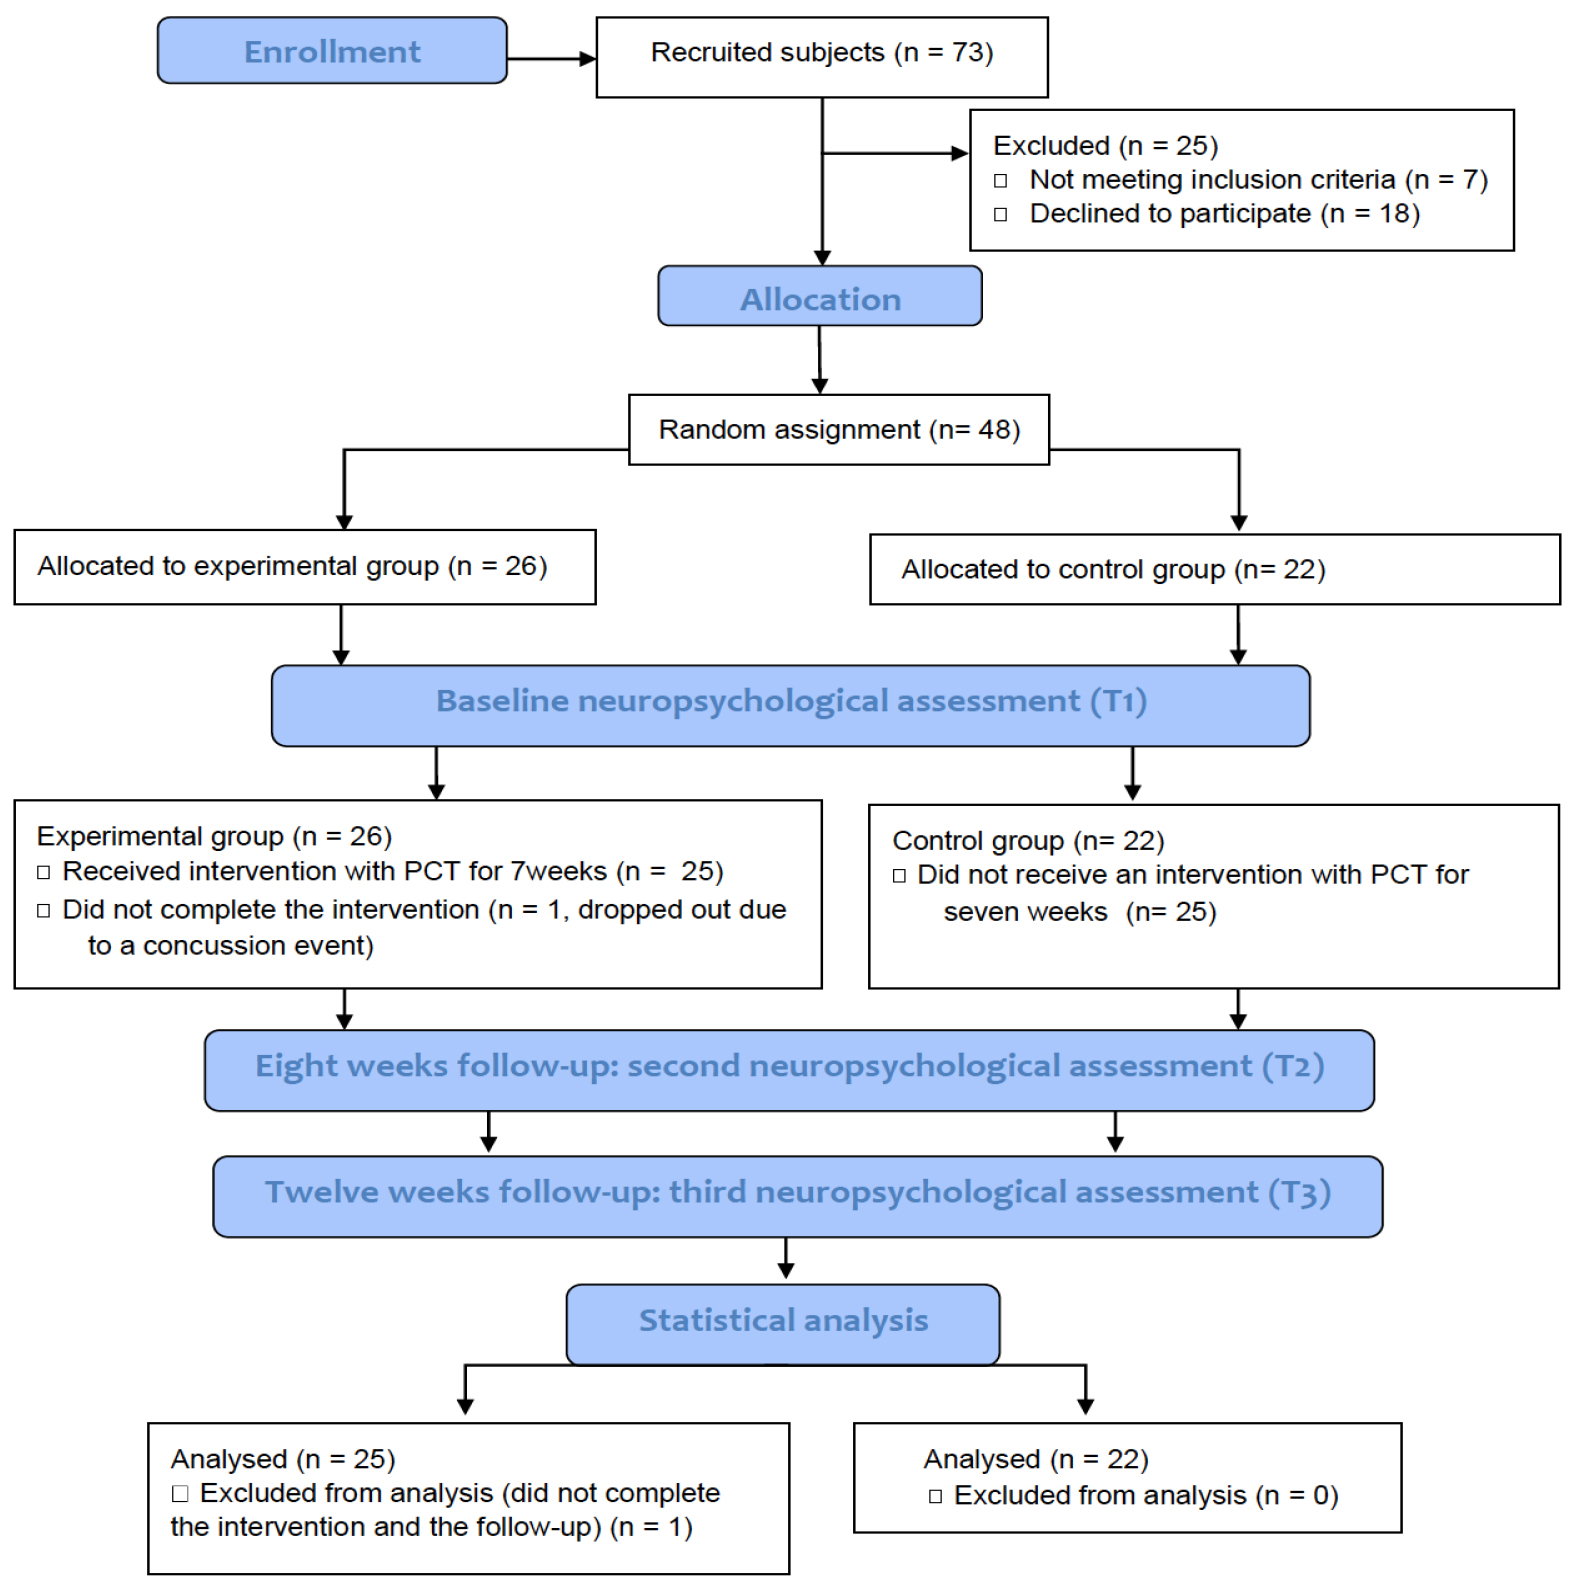
Before the start of the workshops, 141 participants (87% female, 73% aged ≥ 50 years) agreed to join the trial and completed the baseline questionnaires. Immediately after the workshops, 117 participants completed the immediately post-intervention questionnaire; 24 declined to answer or were unable to complete the questionnaire as they left the venue immediately. At the 2-week phone follow-up, 79 participants completed the 2-week phone follow-up questionnaire; we were unable to contact 25 participants after three phone call attempts per participant and 13 refused to answer. (Figure 1 and Table 1) show the flow and characteristics of the participants, respectively. There was no significant difference in the characteristics between two groups, except that the participants who completed the 2-week follow-up did more vigorous physical activity than those who did not complete the follow-up (p <0.05).
Table 1. Characteristics of all participants, those who completed and those who did not complete the 2-week follow–up.
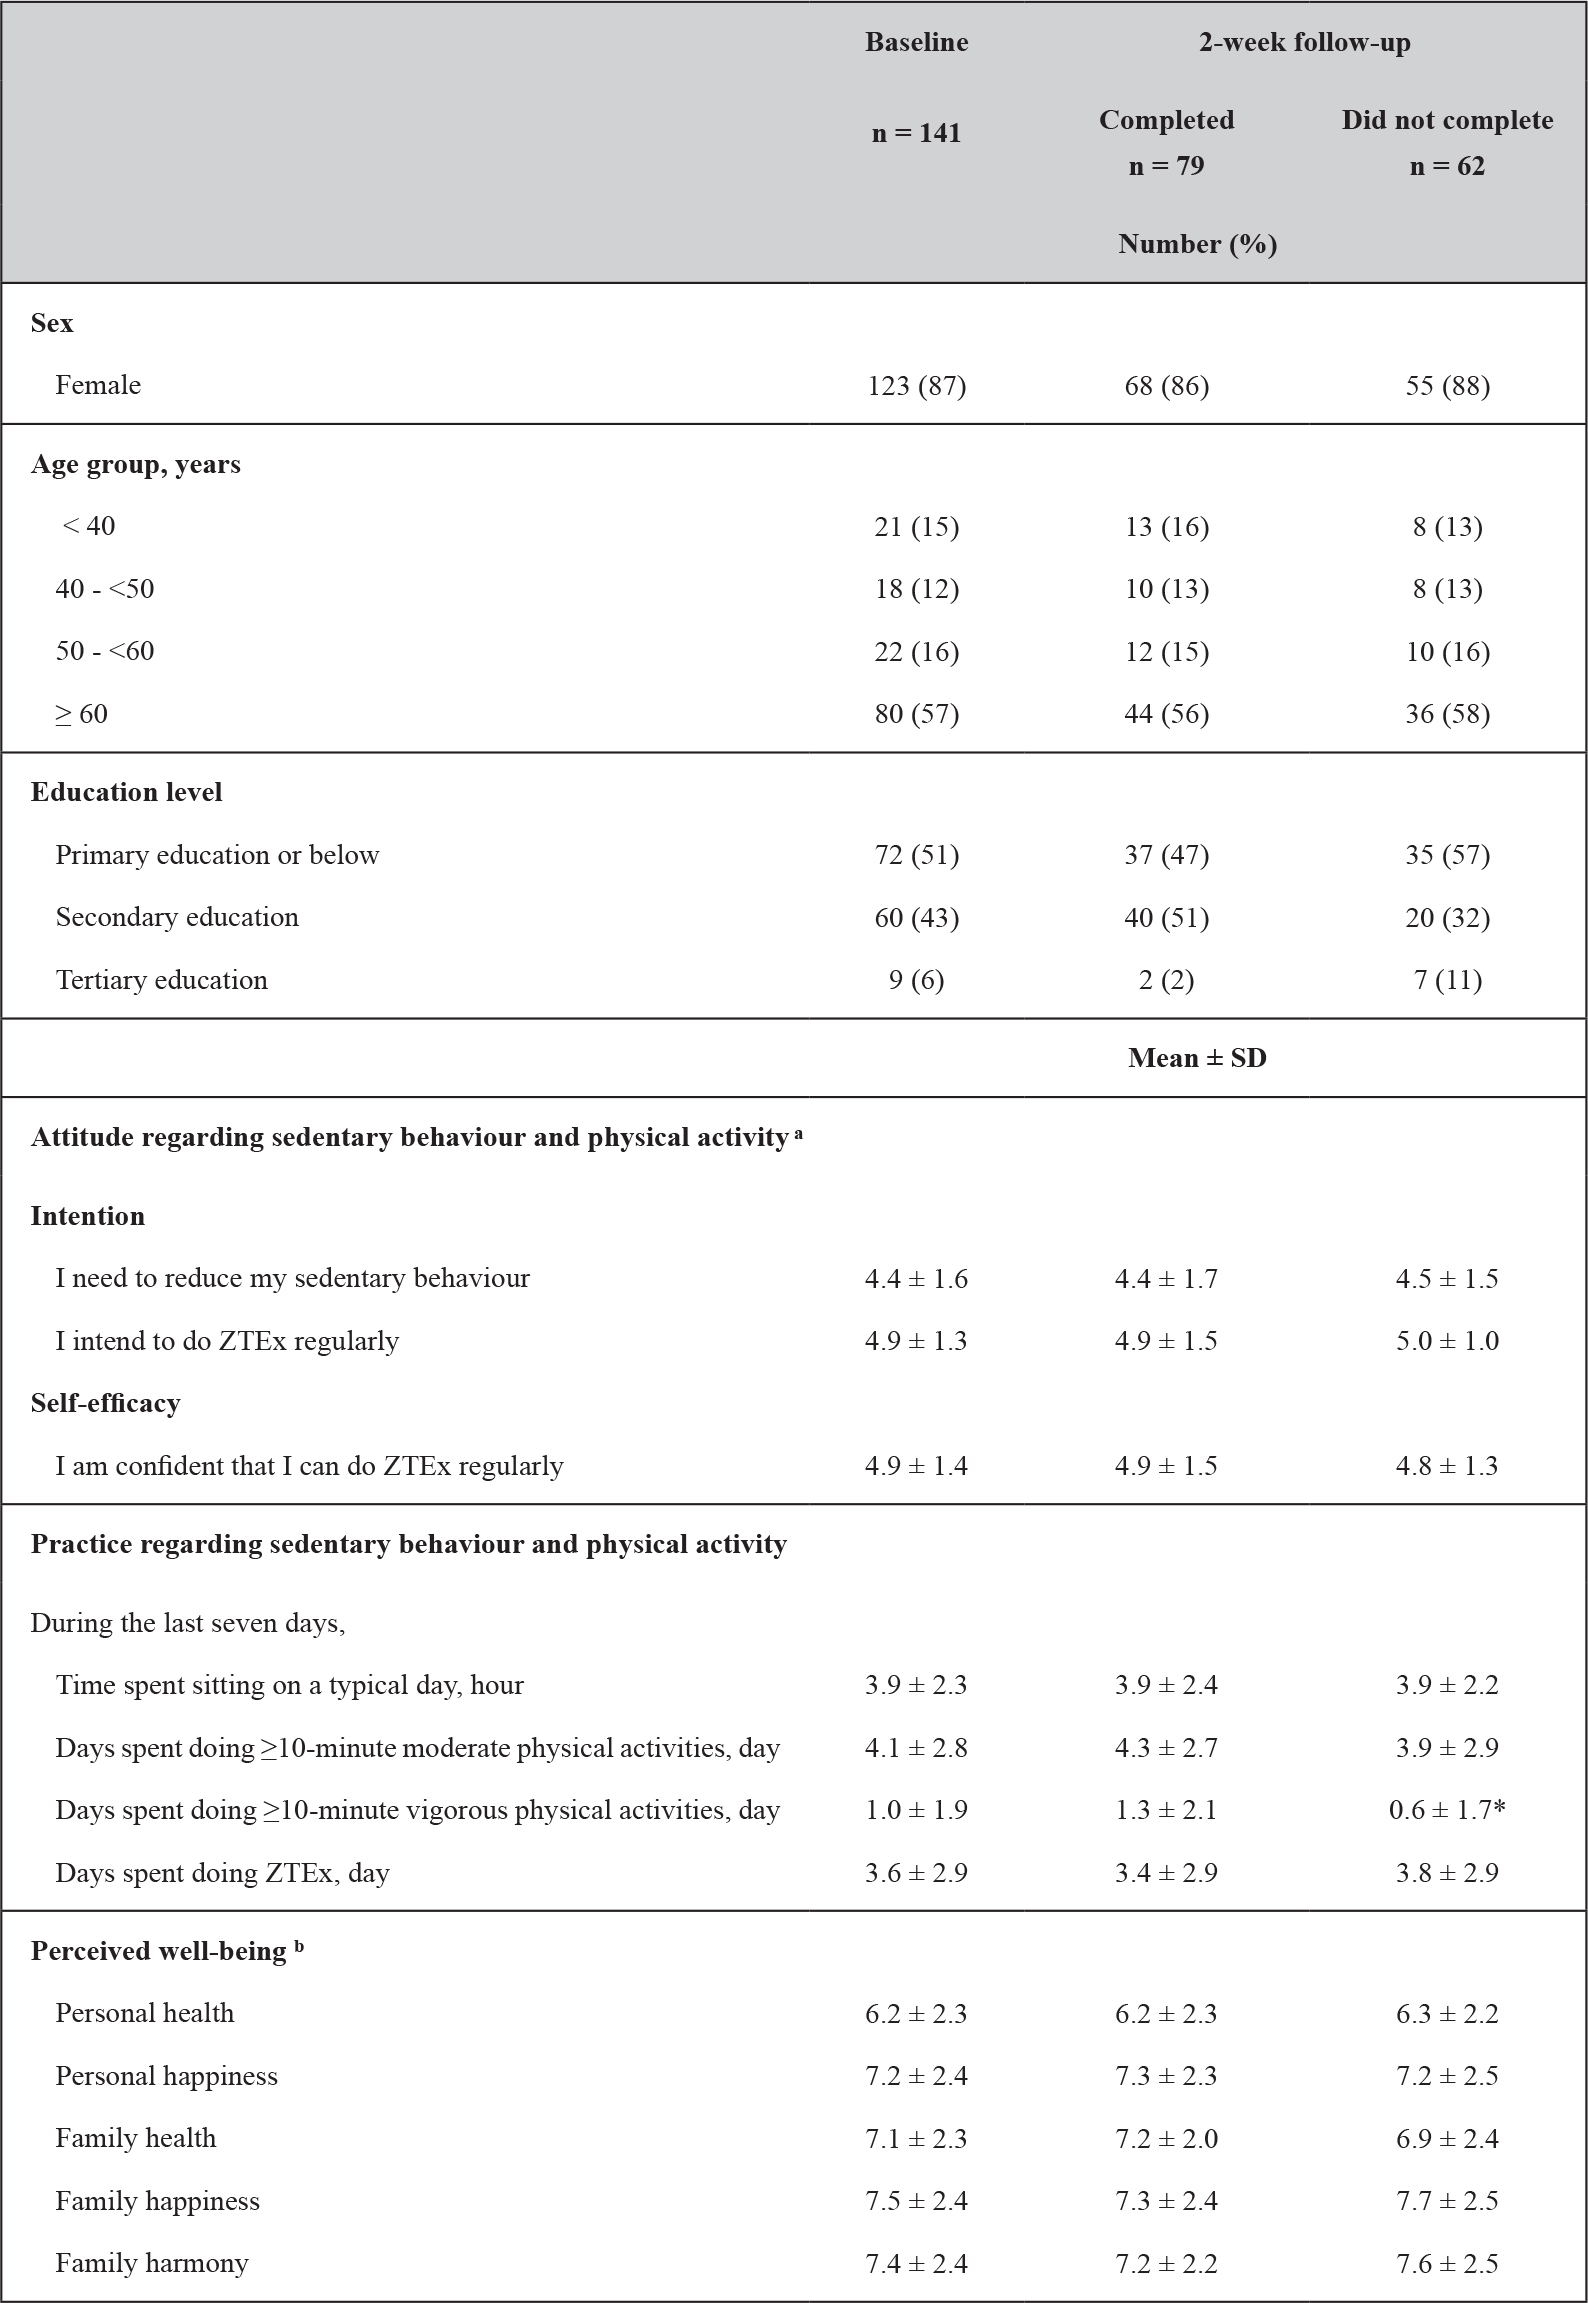
ZTEx = Zero-time exercise refers to simple strength- and stamina-enhancing physical activity
Independent T-test and Mann-Whitney test to compare the difference of the continuous parametric data and non-parametric data, respectively; Chi-square test to compare the difference of the categorical data between two groups; Difference between two time points:*p < 0.05
a 6-point Likert scale:1 (strongly disagree); 2 ( disagree); 3 (slightly disagree); 4 (slightly agree); 5 (agree); 6 (strongly agree).
b 11-point Likert scale: ranging from 0 (not at all healthy/happy/harmonious) to 10 (totally healthy/happy/harmonious).
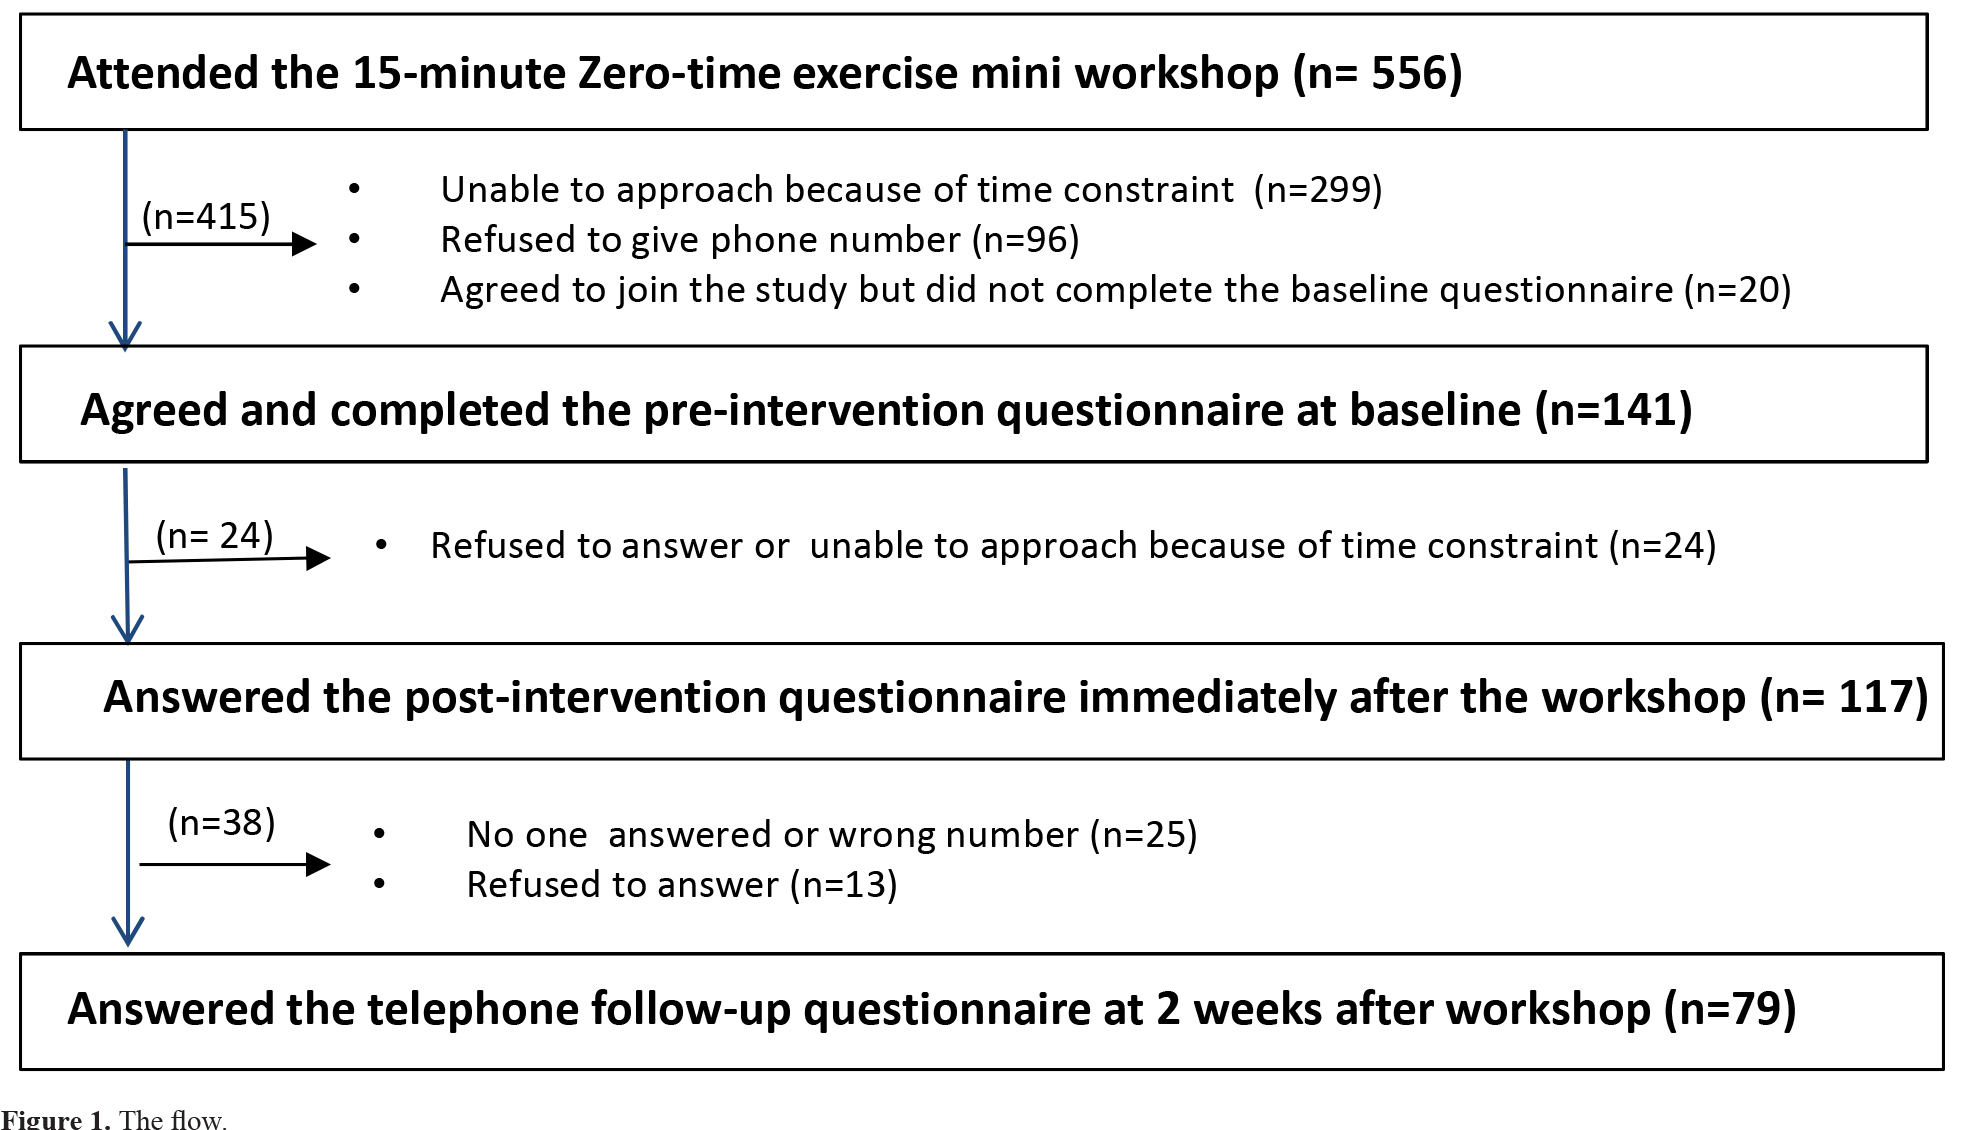
Figure 1. The flow.
Perceived knowledge and attitude regarding sedentary behaviour and physical activity
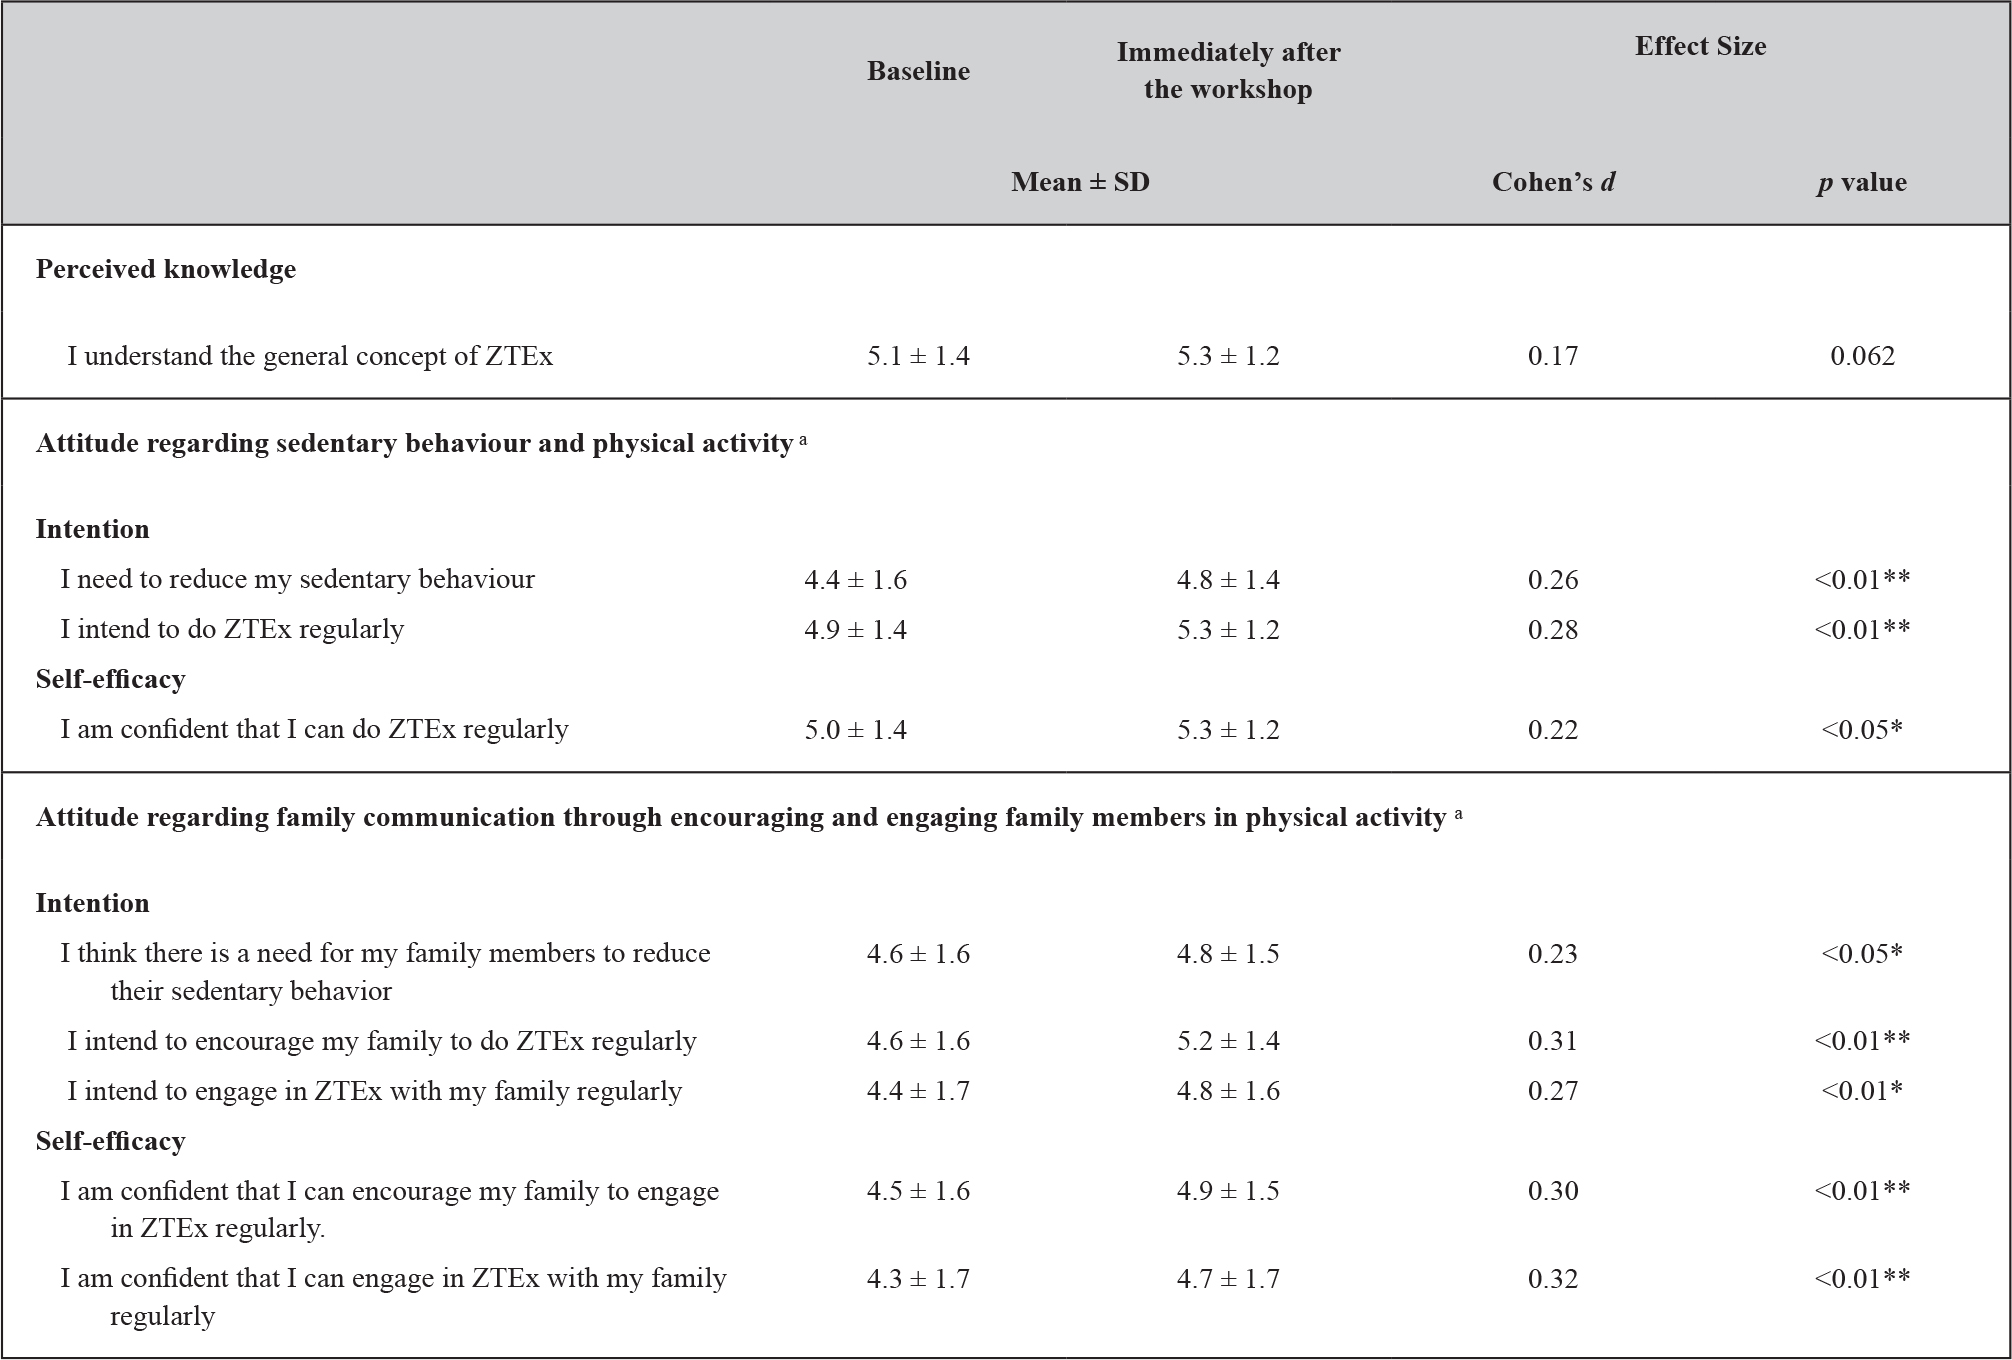
Table 2 shows significant increases in participants’ intention to reduce sedentary behaviour and perceived knowledge and attitude (intention and self-efficacy) regarding ZTEx immediately after the workshops, with small effect sizes (Cohen’s d: 0.20 to 0.27, all p < 0.05).
Table 2. Participants’ perceived knowledge and attitude regarding sedentary behaviour and physical activity at baseline and immediately after workshop: intention-to-treat analysis (n = 141).
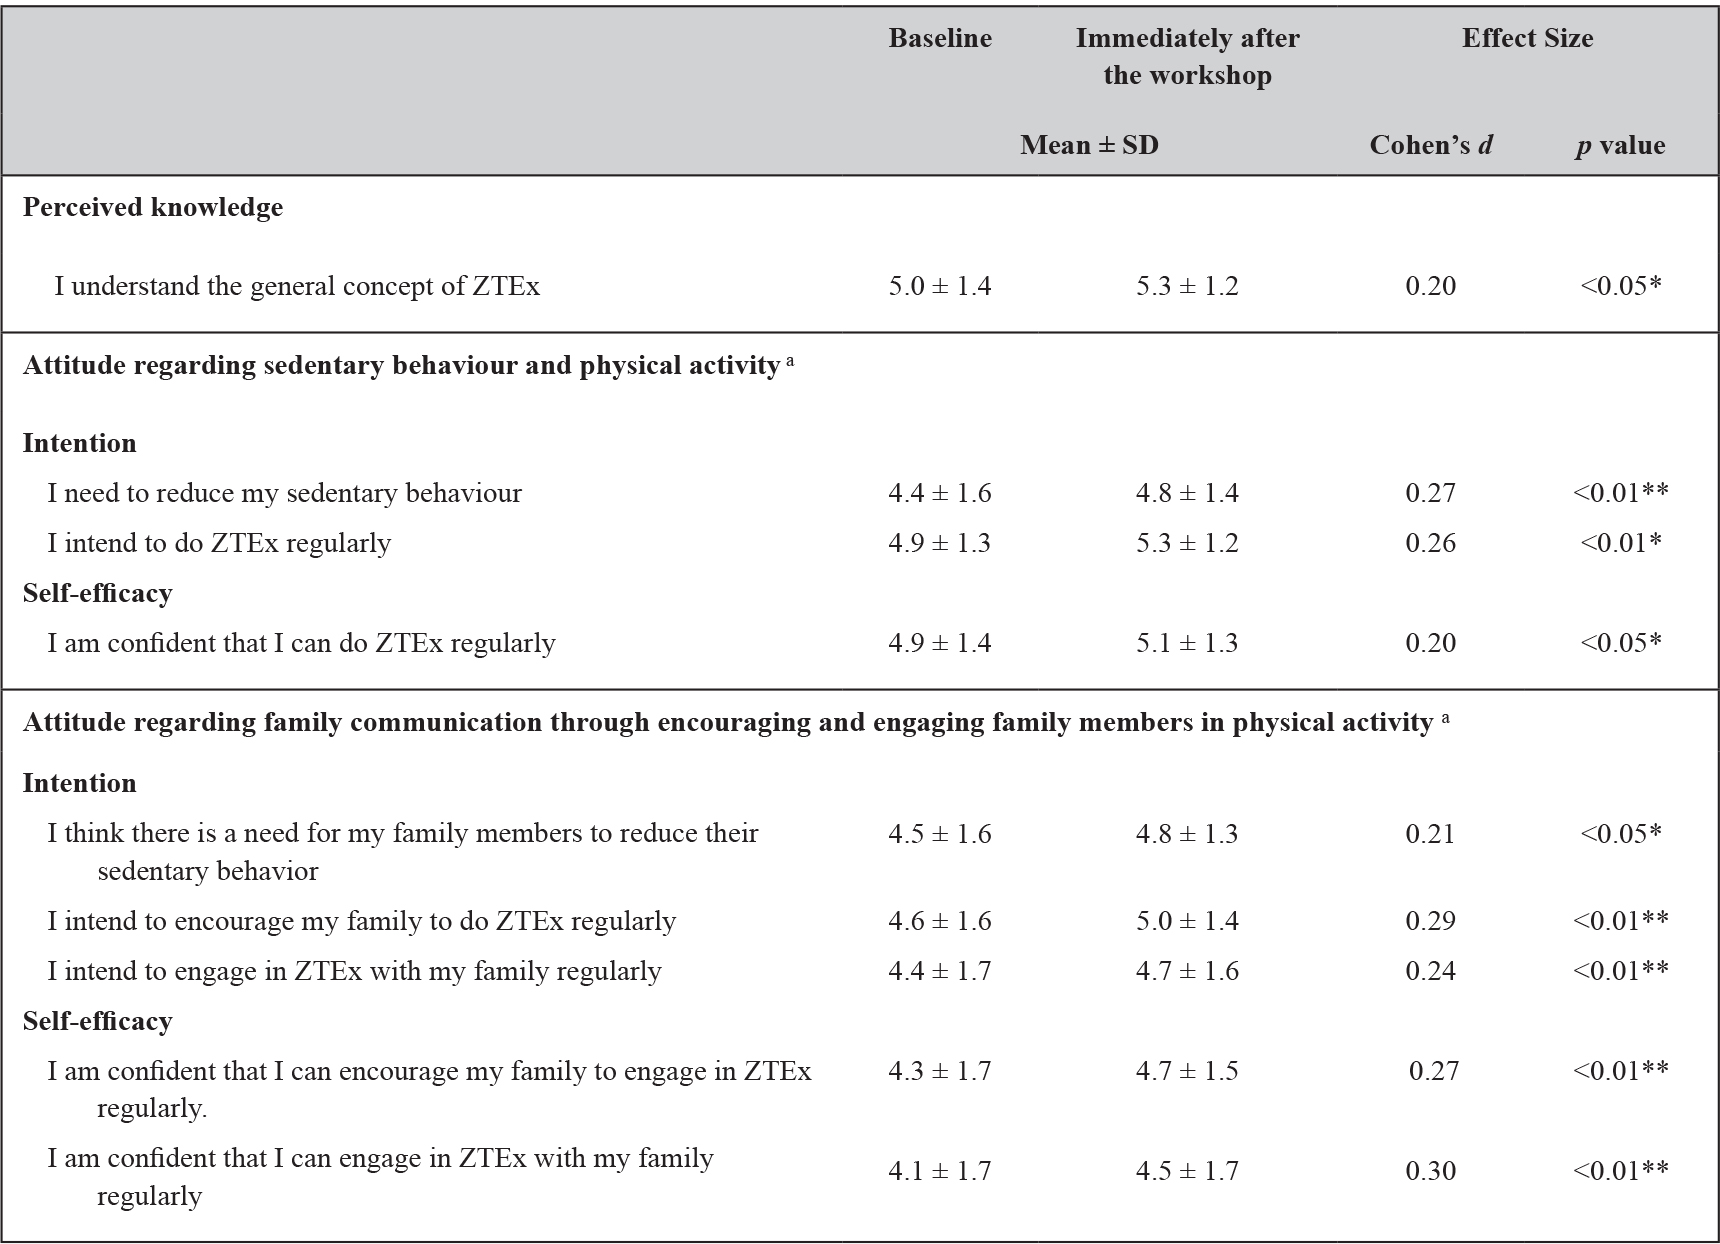
ZTEx = Zero-time exercise refers to simple strength- and stamina-enhancing physical activity
Paried T-test to compare the difference of the continuous parametric data between two groups; Difference between two time points: *p < 0.05, **p < 0.01
a 6-point Likert scale, 1 (strongly disagree); 2 ( disagree); 3 (slightly disagree); 4 (slightly agree); 5 (agree); 6 (strongly agree).
Effect Size (Cohen’s d): small = 0.20, medium = 0.50 and large = 0.80
Attitude regarding family communication through encouraging and engaging family members in physical activity
Immediately after the workshops, participants’ attitude (intention and self-efficacy) regarding family members’ sedentary behaviour, encouraging family members to do ZTEx, and engaging family members to do ZTEx with them were significantly increased with small effect sizes (Cohen’s d: 0.21 to 0.30, all p < 0.05) (Table 2).
Practice regarding sedentary behaviour and physical activity
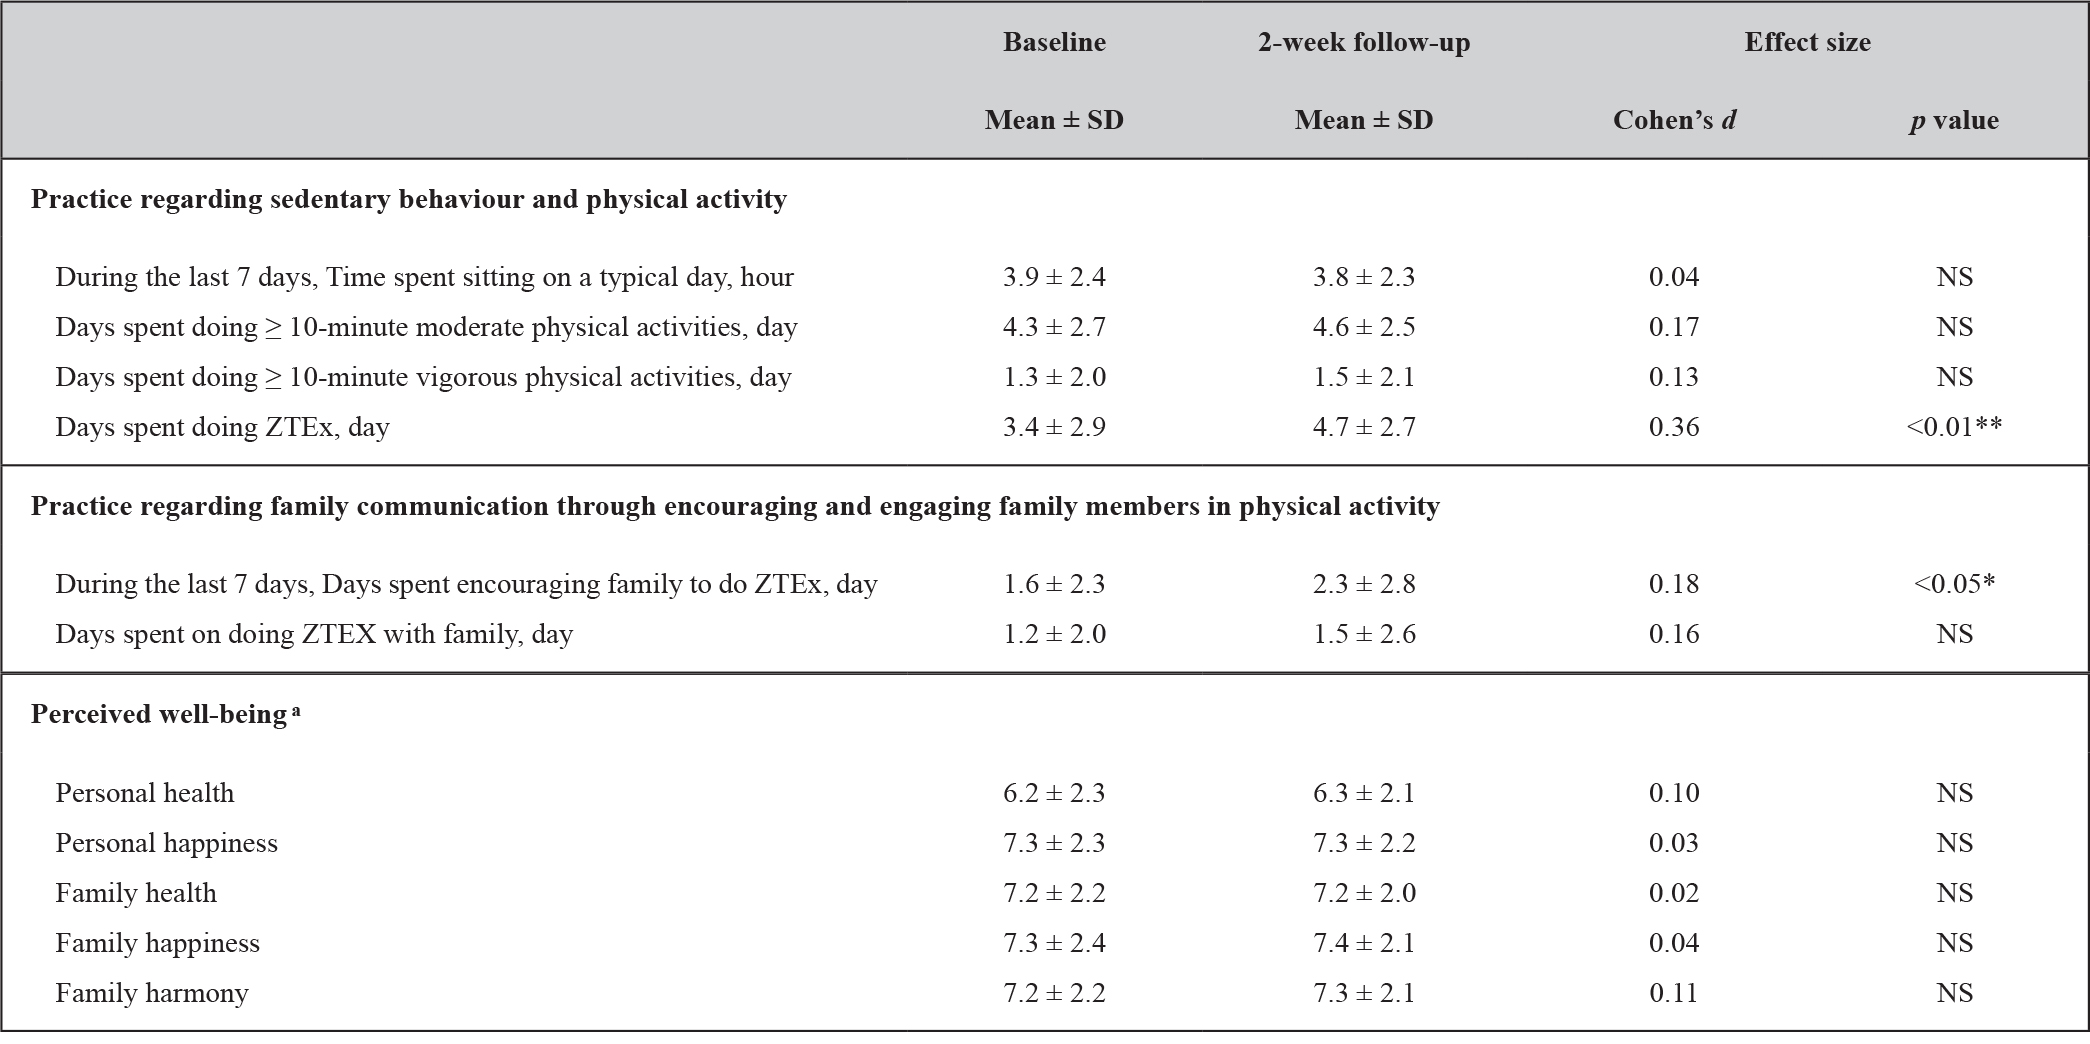
Table 3 shows that at the 2-week follow-up, participants’ number of days spent doing simple strength- and stamina-enhancing physical activity (i.e. ZTEx) increased significantly by 0.7 days (Cohen’s d: 0.26, p < 0.01), and days spent encouraging family members to do ZTEx increased significantly by 0.4 days (Cohen’s d: 0.18, p < 0.01), both with small effect size. However, sitting time, moderate or vigorous physical activity, and days spent doing ZTEx with family members did not change significantly.
Table 3. Participants’ practice regarding sedentary behaviour, physical activity, family communication and well-being at baseline and the 2-week follow-up (n = 141).
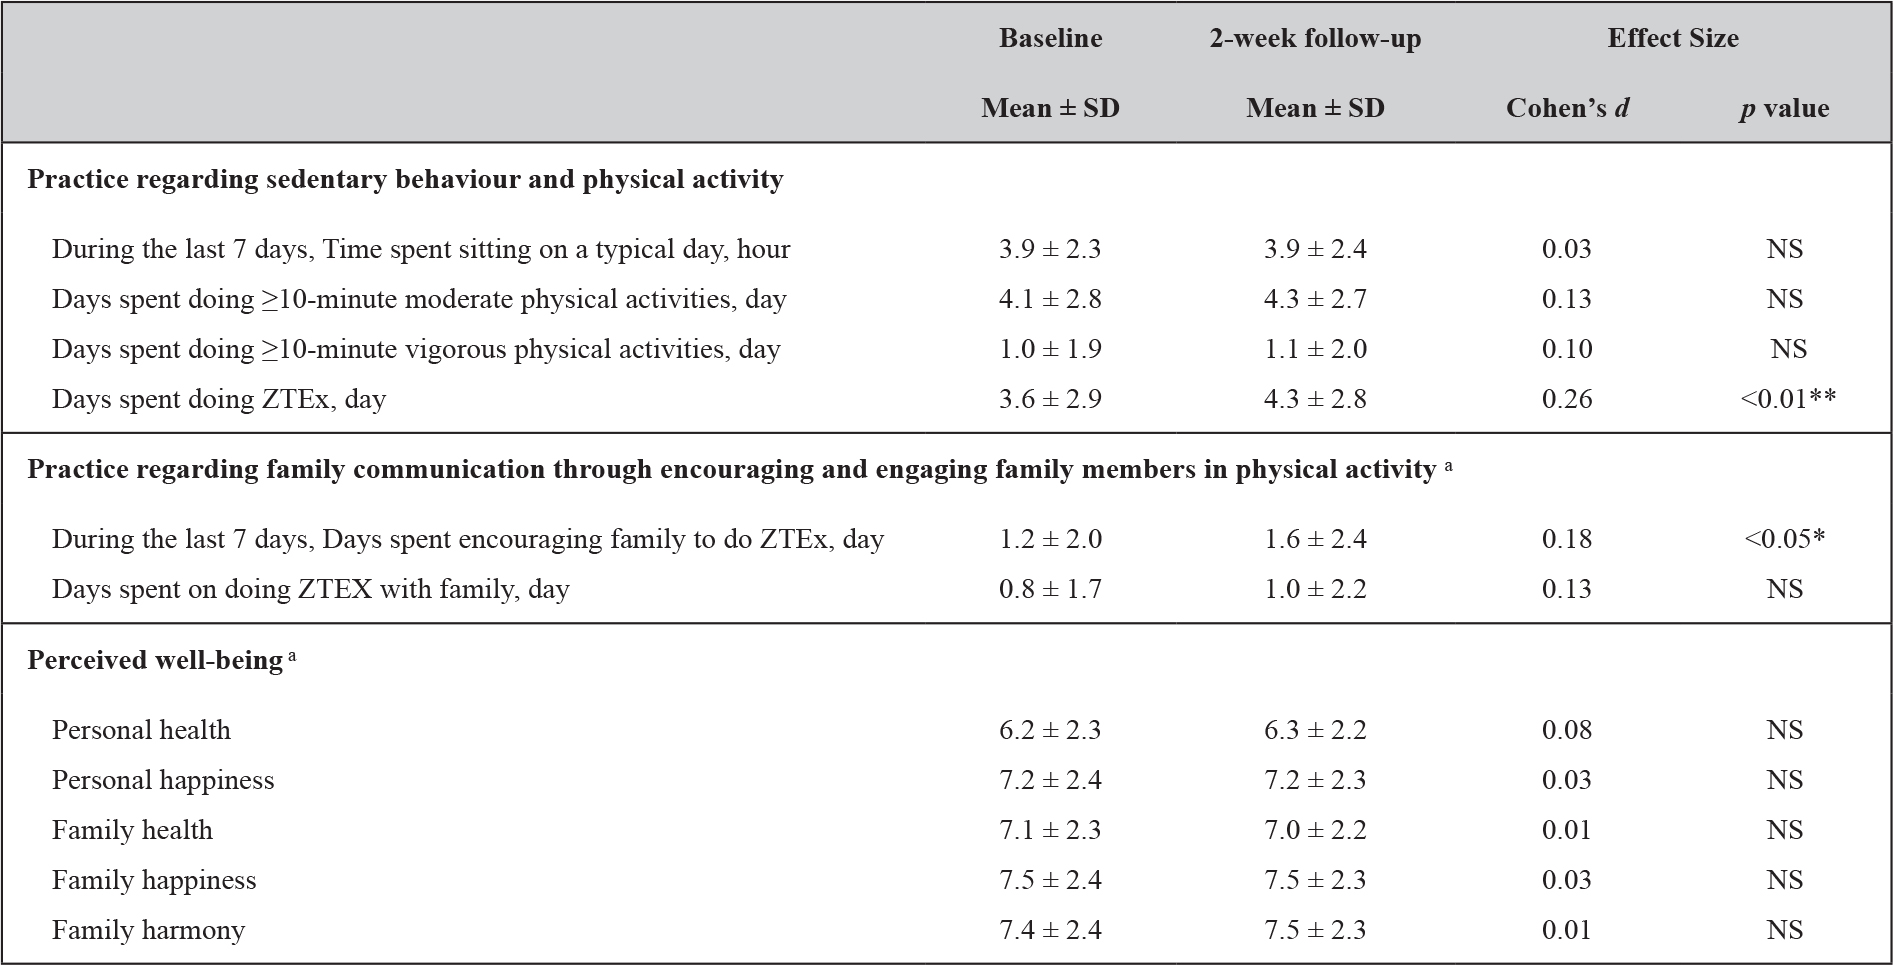
ZTEx = Zero-time exercise refers to simple strength- and stamina-enhancing physical activity
Paried T-test to compare the difference of the continuous parametric data between two groups; Difference between two time points: NS= not significant, *p < 0.05
a 11-point Likert scale: ranging from 0 (not at all healthy/happy/harmonious) to 10 (totally healthy/happy/harmonious ).
Effect Size (Cohen’s d): small = 0.20, medium = 0.50 and large = 0.80
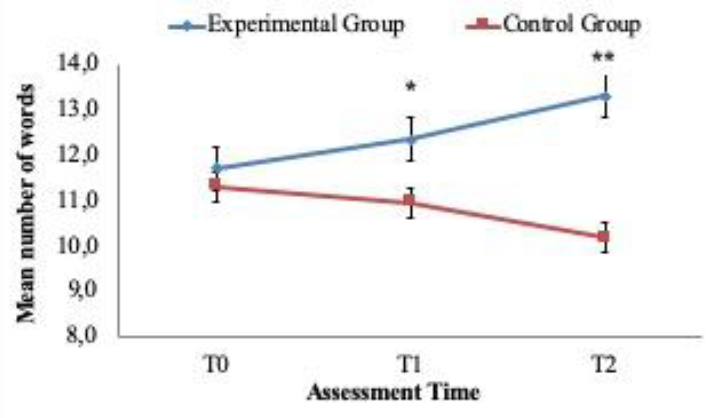
(Figure 2) shows the proportion of participants doing simple strength- and stamina-enhancing physical activity and encouraging their family members to do simple strength- and stamina-enhancing physical activity. At the 2-week follow-up, there were significant increases in the proportion of participants doing ZTEx on 1 day or more, 4 days or more, and 7 days per week. The percentage increase (the ratio of the increased value to the baseline value multiplied by 100) ranged from 14% to 41% (all p < 0.05). The proportion of participants encouraging family members to do ZTEx on 1 day or more, 4 days or more, and 7 days per week increased significantly with the percentage increases ranging from 12% to 71% (all p < 0.05).
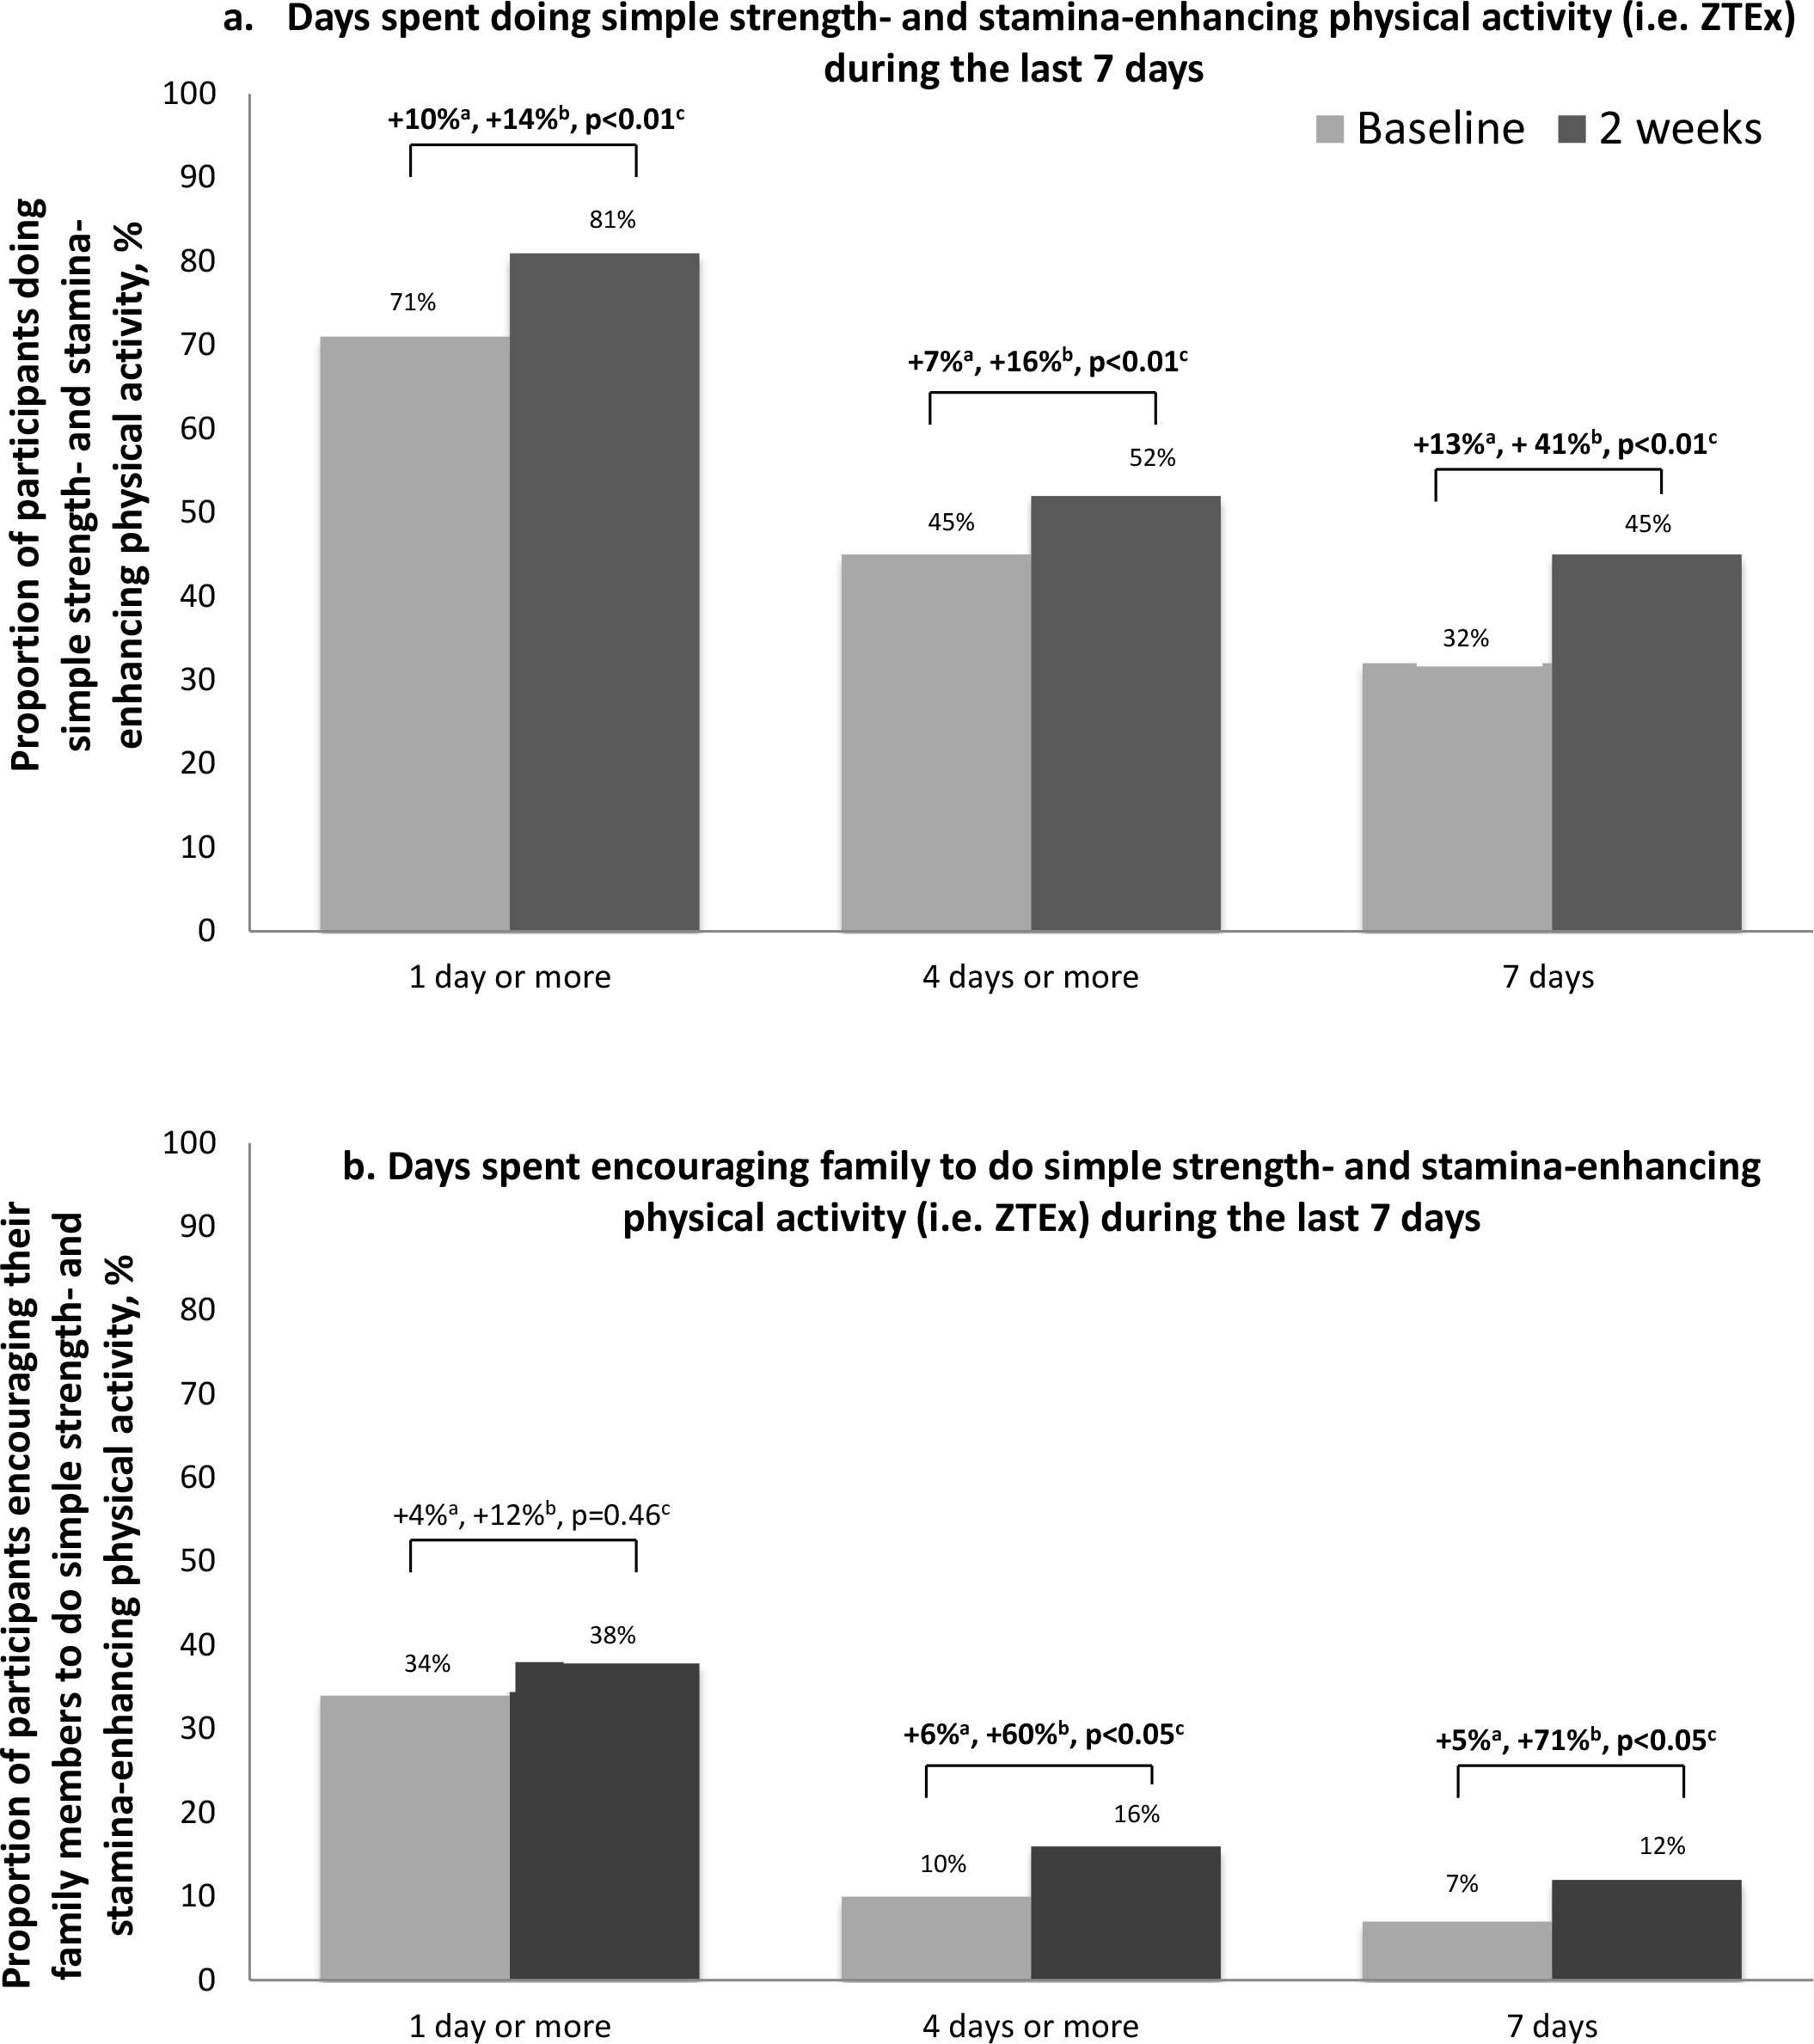
Figure 2. Proportion of participants doing simple strength- and stamina-enhancing physical activity (i.e. ZTEx) and encouraging their family members to do ZTEx.
aIncreased percentage =Percentage of participation at 2 weeks minus percentage of participation at baseline.
bRelative increase = (Increased percentage divided by percentage of participation at baseline) ×100%.
c p value of McNemar’s test for assessing the difference between baseline and 2 weeks ZTEx= Zero-time exercise refer simple strength-stamina –enhancing physical activity
Perceived well-being
Table 3 shows no significant changes in perceived personal well-being (health and happiness) and family well-being (family health, happiness, harmony) at the 2-week follow-up. The complete-case analysis showed similar findings to the intention-to-treat analysis, but with greater effect sizes (Cohen’s d: 0.12 – 0.36, all p <0.05) immediately after the workshop and at the 2-week follow-up.
Reactions to intervention content
All participants rated the workshops highly. Immediately following the workshops, the participants rated the quality of intervention content as 8.9 ± 1.3 on a scale of 0 to 10. The level of the utility of the intervention (feasibility of incorporating the exercises into daily life) was rated 8.9 ± 1.4 on a scale of 0 to 10.
Feedback on intervention implementation by on-site observers
The scores for time and location arrangement, on a scale of 1 to 5, were 4.2 and 3.8, respectively. The scores for the suitability of the room size and facilities and manpower were 3.8 and 3.9, respectively. Most workshops were held in the morning, which facilitated the elderly to join. However, a few venues could only be accessed via long staircases or were too small for all participants to practice the demonstrated ZTEx together.
Participants were actively involved during the intervention mini workshop and excited about the games; the score for participant involvement was 4.2. However, the score for participant punctuality was 3.5. This might be related to the accessibility (long staircases) of the venues and weather conditions (rainy days).
Discussion
To our knowledge, the current paper is the first report of a very brief 15-minute community-based ZTEx intervention for reducing sedentary behaviour, enhancing perceived knowledge, intention, self-efficacy, and practice of simple strength- and stamina-enhancing physical activity (ZTEx), and promoting positive family communication showing small effect sizes. This brief ZTEx intervention is probably the shortest community-based intervention for reducing sedentary behaviour and enhancing physical activity with outcome and process evaluation as well as follow-up assessment in the community. Our trial successfully used a collaborative community-academic research partnership work model from the FAMILY Project to implement a simple intervention in the community. The collaborative work model allowed us to maximize existing community resources to promote physical activity and family well-being. This culminated in the present pilot trial that demonstrated the feasibility of a brief intervention using simple demonstrations, practice and games to deliver short and specific messages and encourage participants to share the messages with family members. The participants appreciated the intervention and enjoyed the simple games.
Most studies on reducing sedentary behaviour and increasing physical activity reported in the literature engaged participants in time- and resource-demanding intensive physical activity programs [23, 24]. In contrast, this trial used a brief session ‘mini workshop’ approach to deliver simple and specific messages and content. Such easy-to-do exercises can facilitate integration into and application in various community activities and settings. Our brief, theory-based and structured intervention also supports the suggestion from a recent systematic review that brief interventions may be as effective as more intensive interventions [25]. Our ZTEx intervention is particularly suitable for older people who are unable to meet physical activity guidelines due to limiting factors such as age and chronic diseases. This has clinical and public health significance since increasing physical activity can facilitate healthy ageing, helping minimize the burden on health and social care [26]. Our trial is in line with the idea that brief interventions delivered in primary care have the potential to reduce the public health burden of inactivity at relatively low cost [27].
We encouraged participants to engage in physical activity according to their abilities and incorporated fun game elements, with emphasis on enjoyment throughout the process, aiming to inspire the participants and promote the likelihood of establishing healthy physical activity habits [28]. This approach is supported by findings from a systematic review of 14 studies on the acceptability of physical activity interventions to the older adults: fun and enjoyment of social interaction and enjoyment coming from being physically active are important motivators of being physically active and maintaining physical activity beyond an intervention [29]. Dissonance could have also contributed to increased motivation [30].
Our trial had several limitations. First, we did not include objective measurements of sedentary behaviour and physical activity. Second, as validated questionnaires were not available in the literature, we developed our own outcome-based questionnaire to assess the changes in knowledge, attitude and practice regarding ZTEx, measuring perceptions rather than actual knowledge and skills. Such perceptions can be affected by individual self-perception and personality, and may be prone to under or over estimation. Third, the trial design did not include a control group and social desirability bias might have exaggerated the positive findings. However, no significant changes in sitting time or moderate or vigorous physical activity was reported, suggesting that the responses of participants were not primarily driven by social desirability. The consistent findings from the intention-to-treat and complete-case analyses indicated robust results. Third, the follow-up duration was short (2 weeks) and the completion rate was low (56%); we could consider modifying the study with a longer follow-up period and providing incentive…
Several suggestions can be derived from our findings and experiences. Additional supporting activities, such as periodic electronic prompts of text, pictorial and video messages could be sent to the participants; this might strengthen the participants’ intention, self-efficacy and practice. The reinforcement created by mobile messaging may increase the likelihood of exercising and may extend the effectiveness of the intervention [31, 32]. Further dissemination might be achieved by encouraging the participants to share information about ZTEx with their friends and neighbours, thereby extending the influence of the intervention within the community. Studies on a larger scale with longer period and a control group (such as randomised controlled trials) are needed to assess the effectiveness of the intervention and the sustainability of these changes.
Conclusion
Physical inactivity demands urgent attention to achieve cost-effective healthy ageing to alleviate this significant public health problem. Our findings show early evidence that a brief ZTEx community-based intervention is an innovative, enjoyable and effective approach to improve perceived knowledge, attitude, practice, and family communication regarding simple strength- and stamina-enhancing physical activity in older people. Further trials on this simple and low-cost intervention to deliver a simple-to-do specific message is the first step to promoting other behavioural change in community settings.
Informed consent: Informed consent was obtained from all individual participants included in the study.
Ethical approval
All procedures performed in studies involving human participants were in accordance with the ethical standards of the institutional and/or national research committee and with the 1964 Helsinki declaration and its later amendments or comparable ethical standards. “All applicable international, national, and/or institutional guidelines for the care and use of animals were followed.” The research protocol was approved by the Institutional Review Board of The University of Hong Kong/Hospital Authority Hong Kong West Cluster with registration number UW15-743, and was registered at the National Institutes of Health (http://www.clinicaltrials.gov; identifier number: NCT02645071).
Funding
The FAMILY Project was funded by The Hong Kong Jockey Club Charities Trust.
Acknowledgement
We would like to thank the Hong Kong Jockey Club Charities Trust for the funding support, the staff from Hong Kong Department of Health and the Estate Management Advisory Committee for their coordination and implementation and the participants for joining the community programs.
References
- World Health Organization. PA for health (2018) More active people for a healthier world: draft global action plan on PA 2018- 2030. Vaccine 2018.
- Schuch FB, Vancampfort D, Richards J, Rosenbaum S, Ward PB, et al. (2016) Exercise as a treatment for depression: A meta-analysis adjusting for publication bias. J Psychiatr Res 77: 42–51. [crossref]
- Livingston G, Sommerlad A, Orgeta V, Costafreda SG, Huntley J, et al. (2017) Dementia prevention, intervention, and care. The Lancet 390: 2673–2734. [crossref]
- World Health Organization. Ageing and health 2018 [Available from: https://www.who.int/news-room/fact-sheets/detail/ageing-and-health accessed December 8 2019.
- Lai A, Stewart S, Wan A, Thomas C, Tse J, et al. (2019) Development and feasibility of a brief Zero-time Exercise intervention to reduce sedentary behavior and enhance physical activity: A pilot trial. Health and social care in the community 27: 233–245. [crossref]
- Piercy KL, Troiano RP, Ballard RM, Carlson SA, Fulton JE, et al. (2018) The Physical Activity Guidelines for Americans. JAMA 320: 2020–2028. [crossref]
- Lai AYK, Stewart SM, Wan ANT, Shen C, Ng CKK, et al. (2018) Training to implement a community program has positive effects on health promoters: JC FAMILY Project. Transl Behav Med 8: 838–850. [crossref]
- Yeung WF, Lai AY, Ho FY, Suen LK, Chung KF, et al. (2018) Effects of Zero-time Exercise on inactive adults with insomnia disorder: A pilot randomized controlled trial. Sleep Medicine 52: 118–127. [crossref]
- Freedman JL, Fraser SC (1966) Compliance without pressure: The foot-in-the-door technique. Journal of Personality and Social Psychology 4: 195–202.
- Chan SSC, Cheung YTD, Wong DCN, Jiang CQ, He Y, et al. (2017) Promoting smoking cessation in China: A foot-in-the-door approach to tobacco control advocacy. Glob Health Promot 26: 41–49.
- Gomes AR, Morais R, Carneiro L (2017) Predictors of exercise practice: from intention to exercise behavior. International Journal of Sports Science 7: 56–65.
- Festinger L (1957) A theory of cognitive dissonance. Stanford, CA: Stanford University Press.
- Cooper J, Feldman LA (2019) Does cognitive dissonance occur in older age? A study of induced compliance in health elderly population. Psychology and Aging 34: 709–713.
- Chan SSC, Viswanath K, Au DWH, Ma CM, Lam WW, et al. (2011) Hong Kong Chinese community leaders’ perspectives on family health, happiness and harmony: A qualitative study. Health Education Research 26: 664–674.
- Patall EA, Cooper H, Robinson JC (2008) The effects of choice on intrinsic motivation and related outcomes: a meta-analysis of research findings. Psychol Bull 134: 270–300. [crossref]
- Kolb DA (2015) Experiential Learning: Experience as the source of learning and development. New Jersey: Pearson Education Ltd.
- Seligman ME (2002) Authentic Happiness: Using the new positive psychology to realize your potential for lasting fulfillment: Simon and Schuster.
- Peterson C, Seligman M (2004) Character strengths and virtues: A handbook and classification. Washington, DC: American Psychological Association.
- Newton R (1989) Review of tests of standing balance abilities. Brain Inj 3: 335–343.
- Leong DP, Teo KK, Rangarajan S, Lopez-Jaramillo P, Avezum A Jr, et al. (2015) Prognostic value of grip strength: findings from the Prospective Urban Rural Epidemiology (PURE) study. Lancet 386: 266–273. [crossref]
- Macfarlane D, Chan A, Cerin E (2010) Examining the validity and reliability of the Chinese version of the International Physical Activity Questionnaire, long form (IPAQ-LC). Public Health Nutrition 14: 443–450.
- Soong C, Wang M, Mui M (2015) A “Community Fit” Community-Based Participatory Research Program for Family Health, Happiness, and Harmony: Design and Implementation. JMIR Res Protoc 28: 4.
- Costa EF, Guerra PH, Santos TId (2015) Systematic review of physical activity promotion by community health workers. Preventive Medicine 81: 114–121.
- Justine M, Azizan A, Hassan V (2013) Barriers to participation in physical activity and exercise among middle-age and elderly individuals. Singapore Med J 54: 582–586.
- Orrow G, Kinmonth AL, Sanderson S, Sutton S (2012) Effectiveness of physical activity promotion based in primary care: systematic review and meta-analysis of randomised controlled trials. BMJ 344: 1389. [crossref]
- Aittasalo M, Miilunpalo S, Suni J (2004) The effectiveness of physical activity counseling in a work-site setting. A randomized, controlled trial. Patient education and counseling 55: 193–202.
- Lamming L, Pears S, Mason D (2017) What do we know about brief interventions for physical activity that could be delivered in primary care consultations? A systematic review of reviews. Prev Med 99: 152–163.
- Kwasnickaa D, Dombrowskic SU, Whited M (2016) Theoretical explanations for maintenance of behaviour change: A systematic review of behaviour theories. Health Psychology Review 10: 277–296.
- Devereux-Fitzgerald A, Powell R, Dewhurst A (2016) The acceptability of physical activity interventions to older adults: A systematic review and meta-synthesis. Social Science & Medicine 158: 14–23.
- Orcullo DJC, Teo HS, Member I (2016) Understanding cognitive dissonance in smoking behaviour: A qualitative study. International Journal of Social Science and Humanity 6: 481–484.
- Cole-Lewis H, Kershaw T (2010) Text messaging as a tool for behavior change in disease prevention and management. Epidemiol Rev 32: 56–69.
- Kendzor DE, Shuval K, Gabriel KP (2016) Impact of a mobile phone intervention to reduce sedentary behavior in a community sample of adults: A quasi-experimental evaluation. Journal of medical Internet research 18: 19.
Supplementary Table 1. Participants’ perceived knowledge and attitude regarding sedentary behaviour and physical activity at baseline and immediately after workshop: complete-case analysis (n=117).
ZTEx = Zero-time exercise refers to simple strength- and stamina-enhancing physical activity
Independent T-test and Mann-Whitney test to compare the difference of the continuous parametric data and non-parametric data, respectively; Chi-square test to compare the difference of the categorical data between two groups; Difference between two time points: *p < 0.05, **p < 0.01
a 6-point Likert scale:1 (strongly disagree); 2 ( disagree); 3 (slightly disagree); 4 (slightly agree); 5 (agree); 6 (strongly agree).
b 11-point Likert scale: ranging from 0 (not at all healthy/happy/ harmonious) to 10 (totally healthy/happy/harmonious).
Effect Size (Cohen’s d): small = 0.20, medium = 0.50 and large = 0.80
Supplementary Table 2. Participants’ practice regarding sedentary behaviour, physical activity, family communication and well-being at baseline and the 2-week follow-up: complete-case analysis (n=79).
ZTEx = Zero-time exercise refers to simple strength- and stamina-enhancing physical activity
Paried T-test to compare the difference of the continuous parametric data between two groups; Difference between two time points: NS = not significant, *p < 0.05, **p < 0.01
a 11-point Likert scale: ranging from 0 (not at all healthy/happy/harmonious) to 10 (totally healthy/happy/harmonious).
Effect size (Cohen’s d): small = 0.20, medium = 0.50 and large = 0.80