Monthly Archives: October 2022

fig 2

Recurrent/Persistent Glioblastoma: Complete Response and 24 Years Disease-free Survival in a 45-Year-Old Female Treated with Antineoplastons (Successful Treatment of Glioblastoma with Antineoplastons)

DOI: 10.31038/CST.2022733

Abstract

Rationale: Glioblastoma (GBM), which accounts for 48% of all malignant central nervous system (CNS) tumors and 57% of gliomas, has a very poor prognosis. Patients with recurrent/persistent GBM after standard therapy usually die within six months. The case of an adult female with a recurrent/persistent GBM is presented here to detail/discuss the efficacy of ANP therapy (Antineoplaston A10 {Atengenal} and Antineoplaston AS2-1 {Astugenal}) in the treatment of this disease. Objectives: This patient was treated at the Burzynski Clinic (BC), as a Compassionate Exemption (CE) according to the Phase II Protocol, BT-20, which utilized ANP therapy in the treatment of patients with GBMs. ANP therapy was delivered via subclavian catheter and infusion pump and then by mouth. Tumor response was measured by sequential magnetic resonance imaging (MRI) of the brain utilizing gadolinium enhancement. Findings: This patient was diagnosed with GBM of the right temporoparietal region in May 1997, at age 45, and underwent two surgical resections, radiation therapy (RT), and gamma knife ablation elsewhere. At age 46 years and eight months, she presented to the BC with recurrent/persistent disease. She complained of weakness, dizziness, short-term memory loss, and nausea. She had difficulty speaking and walked with assistance due to discoordination and left-sided weakness. Baseline brain MRI at the BC revealed a measurable enhancing nodule in the surgical bed. ANP therapy was initiated in August 1998 and the patient achieved a complete response (CR) within five months. Now, 24 years later, the patient is doing well and showing no evidence of tumor recurrence. Conclusions: The utilization of ANP therapy to obtain a cure in a patient with recurrent/persistent GBM is presented. We conclude that ANP therapy is an attractive therapeutic option for adults with a GBM who are ineligible for or refuse standard therapy or demonstrate recurrent/persistent disease after standard therapy.

Keywords

Brain tumor, Glioblastoma, Persistent glioblastoma, Recurrent glioblastoma, Phase II studies

Introduction

Glioblastoma (GBM), the most common malignant central nervous system (CNS) tumor, accounting for 48% of all malignant tumors and 57% of gliomas, has a very poor prognosis [1]. Long term-survival is rare. Patients with recurrent/persistent GBM after standard therapy usually die within six months. Radiation therapy (RT) and chemotherapy therapy have not significantly affected outcome. Negative prognostic factors include advanced age, low Karnofsky Performance Status (KPS), and less than a gross total resection at initial surgery [2,3]. The overall survival (OS) rate at five years has remained constant for two decades at 5.8% [1,4,5].

Exposure to ionizing radiation [6], and the Li-Fraumeni and Lynch syndromes (<1% of cases) [7] are risk factors for GBM. Based on registry data from 2011 through 2015, the annual age-adjusted incidence of GBM is 3.2 per 100,000 population in the United States while the overall prevalence is 9.2 per 100,000 population [1]. The male: female ratio is 1:4.

Isocitrate dehydrogenase (IDH) enzymes participate in several major metabolic processes, such as the Krebs cycle, glutamine metabolism, lipogenesis and redox regulation [8-10]. Concerning the diagnosis of GBM, the 2016 revision of the World Health Organization (WHO) of CNS tumors, included IDH status, which resulted in three sub-groups, IDH-wild-type, IDH-mutant, and not otherwise specified (NOS) [11,12]. IDH–wild-type GBM is characterized by de novo development with no identifiable precursor lesion and represents 90% of patients with GBM [12]. On the other hand, IDH-mutant GBM, typically arises from a precursor diffuse or anaplastic astrocytoma and represents 10% of patients with GBM [12]. O6-methylguanine-DNA methyltransferase (MGMT) promoter methylation is seen in 30-50% of IDH-wild-type GBMs and may allow a better response to alkylating chemotherapy, especially temozolomide, providing for a better prognosis [13].

Gadolinium-enhanced magnetic resonance imaging (MRI) of the brain is used in the diagnosis and follow-up of GBM. T2-weighted, T2-fluid attenuated inversion recovery (T2-FLAIR), T1 weighted, and T1-weighted contrast-enhanced images are obtained. GBMs are gadolinium-enhancing and sequential T1-weighted contrast-enhanced images are utilized to determine the effect of therapy [14,15].

We present here the successful use of ANP therapy (Antineoplaston A10 {Atengenal} and Antineoplaston AS2-1 {Astugenal}) in the treatment of recurrent/persistent GBM in a 46 year and eight-month-old female, initially diagnosed at age 45 and treated with gross total resection, radiation therapy (RT), gamma knife ablation of recurrent tumor, and subsequent right lobectomy elsewhere. We also present the use of targeted therapy in the treatment of GBM, including our own preliminary results.

Materials and Methods

ANP research began in 1967, when significant deficiencies were noticed in the peptide content of the serum of patients with cancer compared with healthy persons. Initially ANP were isolated from the blood and later from urine [16]. Subsequent studies of the isolated ANP demonstrated that Antineoplaston A-10 and Antineoplaston AS2-1 were the most active ANPs. The chemical name of Antineoplaston A-10 is 3-phenylacetylamino-2,6-piperidinedione. It consists of the cyclic form of L-glutamine connected by a peptide bond to phenylacetyl residue. When given orally, Antineoplaston A10 resists the attack of gastric enzymes. In the small intestine, under alkaline conditions, 30% is digested into phenylacetylglutamine (PG) and phenylacetylisoglutaminate (isoPG) in a ratio of approximately 4:1. The mixture of synthetic PG and isoPG in a 4:1 ratio, dissolved in sterile water constitutes Antineoplaston A10 intravenous (IV) injection. Further metabolism of Antineoplaston A10 results in phenylacetate (PN). Both metabolites PG and PN have anticancer activity. The mixture of PN and PG in a 4:1 ratio, dissolved in sterile water constitutes Antineoplaston AS2-1 IV injection [17].

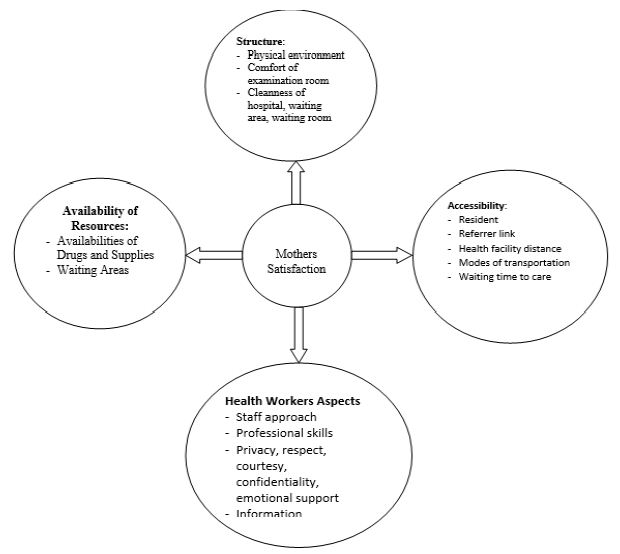
This patient was 45-years-old when she presented to a local hospital with a several month history of frequent headaches followed by left-sided weakness. Magnetic resonance imaging (MRI) of the brain showed a tumor in the right temporoparietal region. In May 1997, she underwent gross total resection of the tumor. Pathological examination of the microscopic slides from the submitted surgical specimen showed a GBM. The patient then received RT at a dose of 5940 cGy over 6 weeks. Six months later, she underwent gamma knife ablation of recurrent tumor. Seven months later, MRI of the brain MRI showed an enhancing lesion in the right temporal region. At that time, the patient underwent a right temporal lobectomy elsewhere. Histological examination of the surgical specimen provided a diagnosis of GBM. This was confirmed by positron emission tomography (PET). The patient was advised to undergo a third operation, but she refused and elected to be treated at the Burzynski Clinic (BC). MRI of the brain performed on July 30, 1998 showed a 1.3 cm x 1.2 cm (volume = 1.56 cm2) enhancing nodule in the surgical bed (Figure 1).

During her baseline evaluation at the BC, the patient complained of weakness, dizziness, short-term memory loss, discoordination, and nausea. She was found to have difficulty speaking and could not walk without assistance due to discoordination and left-sided weakness. Both optical discs were blurred. Karnofsky Performance Status (KPS) was 50. On August 10, 1998, the patient began ANP therapy according to Protocol BT-20, “Antineoplaston Therapy in Treating Adults with Residual/Recurrent/Progressive Glioblastoma Multiforme”. Intravenous (IV) ANP therapy was delivered via a subclavian catheter and a programmable infusion pump.

This Phase II trial was conducted in accordance with the U.S. Code of Federal Regulations, Title 21, Parts 11, 50, 56 and 312; the Declaration of Helsinki (1964) including all amendments and revisions; the Good Clinical Practices: Consolidated Guideline (E6), International Conference on Harmonization (ICH) and Guidance for Industry (FDA). By participating in this study protocol, the investigators agreed to provide access to all appropriate documents for monitoring, auditing, IRB review and review by any authorized regulatory agency.

Results

Response to ANP therapy was measured by serial brain MRIs, with and without gadolinium contrast. Tumor volume was calculated as the sum of the volume of all measurable lesions (>5 mm diameter) with imaging. The response criteria were as follows: a CR indicated complete disappearance of all enhancing tumor while a partial response (PR) indicated a 50% or greater reduction in total enhancing tumor volume. CR and PR required a confirmatory brain MRI performed at least four weeks after the initial finding. PD indicated a 25% or greater increase in enhancing tumor volume, or new enhancing disease, while stable disease (SD) did not meet the criteria for PR or PD [15]. All brain MRIs were reviewed by a prominent outside radiologist. Consent was obtained from the patient for publication of the brain MRIs presented in this report.

The patient’s starting dose of A10 was 1.23 g/kg/d and was gradually increased to 10.48 g/kg/d and subsequently reduced to 5.20 g/kg/d. Her starting dose of AS2-1 was 0.15 g/kg/d and was gradually increased to 0.17 g/kg/d. On December 8, 1998, MRI of the brain showed that the patient had achieved a complete response (Figure 1). IV ANP therapy was discontinued after 18.5 months [18-44].

fig 1

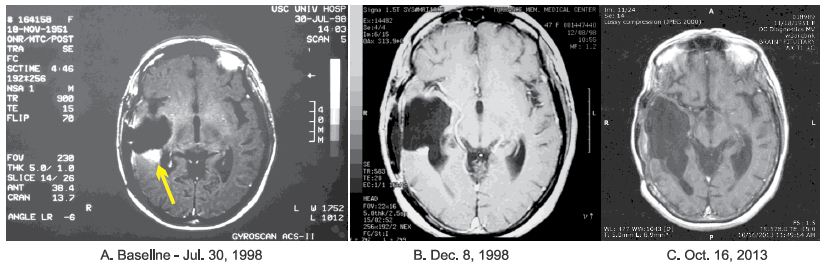
Figure 1: Axial MRI images of the brain: A – July 30, 1998 – Baseline magnetic resonance imaging (MRI) of the brain showing measurable enhancing tumor (see arrow), with a volume of 1.56 cm2, in the surgical bed of a temporal lobectomy. B – December 8, 1998 – MRI of the brain showing a complete response (CR) with no enhancing tumor seen. C – October 16, 2013 – Post-therapy MRI of the brain showing maintenance of the CR.

Adverse events (AEs) were graded according to the Common Terminology Criteria for Adverse Events Version 3.0 (CTCAE v.3). While receiving IV ANP therapy, the patient experienced two Grade 1 AEs possibly related to IV ANP therapy. Both resolved.

Once IV ANP therapy was completed, the patient began oral ANP therapy. The starting dose of both A10 and AS2-1 was 0.05 g/kg/d and both were gradually increased to 0.14 g/kg/d. All ANP therapy was discontinued 31 months from treatment start.

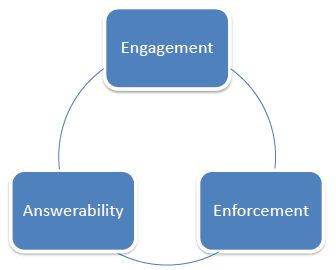
During the course of her ANP therapy, the patient made substantial clinical recovery. After 9 months of IV ANP therapy, she was able to walk with the help of a walker. Her KPS increased to 80. At 4 years after treatment completion, the patient was able to walk with a cane. Serial follow-up brain MRIs, with the latest performed in October 16, 2013, showed no recurrence of disease (Figure 1). At last follow-up (September 9, 2022), the patient was maintaining an excellent quality of life. The patient has not received any additional anti-tumor therapy since ANP therapy was discontinued and has consented to publication of the radiographs presented herein (Figure 2).

fig 2

Figure 2: Photograph of the patient, on an exercise bicycle, following completion of ANP therapy and achievement of a complete response (CR).

Discussion

Based on a Phase III study by R. Stupp and colleagues, published in 2005, standard therapy for GBM consists of maximal surgical resection, followed by 60 Gray (Gy) RT over 6 weeks with concomitant daily temozolomide followed by a further 6 cycles of maintenance temozolomide [18]. In patients with good performance status (KPS > 60), the median OS was 14.6 months for RT plus temozolomide vs. 12.1 months for RT alone (P < 0.001).

After standard therapy, most patients recur within 6 months. In this setting, there is no standard-of-care systemic therapy. Alkylating chemotherapy is commonly used, including lomustine, carmustine, and additional temozolomide although the benefits are modest and only patients with MGMT promoter methylation are likely to benefit [19-21]. Salvage chemotherapy with combined procarbazine, lomustine, and vincristine may have some activity, although its use is limited by significantly greater toxicity [22,23]. The quality of data for individual chemotherapy agents or regimens is generally poor and comparison of studies is difficult.

The US Food and Drug Administration (FDA) granted accelerated approval to single-agent bevacizumab based solely on early phase 2 data indicating improved progression-free survival (PFS), although no OS benefit was seen [24,25]. Subsequent randomized phase 3 trials have demonstrated that bevacizumab in combination with lomustine improves PFS compared with lomustine alone (4.2 months vs. 1.5 months; [P < 0.001]), but again, without any change in OS [26].

ANP therapy’s mechanism of action differs from that of RT or cytotoxic chemotherapy. Growth of normal cells is controlled by cell cycle progression genes (oncogenes) and by cell cycle arrest genes (tumor suppressor genes). In cancer, alteration of these control genes in malignant cells favors aggressive cell proliferation. Evidence suggests that ANP therapy affects 112 genes in the GBM genome and functions as “molecular switches” which “turn on” tumor-suppressor genes and “turn off” oncogenes [27,28]. Hence, the antineoplastic action of ANP therapy in DIPG involves restoration of cell cycle control, induction of programmed cell death, and interference with cancer cell metabolism and nuclear transport.

Current sequencing technology allows for advanced understanding of the GBM genome and underlying molecular biology [29]. Identifying crucial and targetable genomic alterations can expand our therapeutic options.

Tyrosine kinase inhibitors (TKIs) have failed to demonstrate significant efficacy when targeting epidermal growth factor (EGFR) [30-32]. For persistent EGFR-amplified GMB, depatuxizumab mafodotin, an antibody drug conjugate targeting EGFR, in combination with temozolomide, has shown promising activity in a Phase II trial [33]. In contrast to this, a Phase III trial of depatuxizumab mafodotin in combination with standard therapy for newly diagnosed EGFR-amplified glioblastoma was stopped early because an interim analysis showed no OS benefit [34].

PTEN, PIK3CA, and PIK3R1 are frequently seen in IDH-wild-type GBM [35]. However, buparlisib, in persistent GBM, and everolimus and temsirolimus, in newly-diagnosed GBM, have not shown efficacy as single agents [36-38]. Following accelerated approval to bevacizumab, trials of vascular endothelial growth factor (VEGF) and multikinase TKIs, such as cediranib, lomustine, tivozanib, pazopanib, and sunitinib have shown little or no activity as single-agent therapy [39-43].

While single-agent targeted therapy has not yet been shown to be effective in the treatment of recurrent/persistent GBM, we have published preliminary results that encourage the simultaneous use of multiple targeted agents as therapy for recurrent GBM [44]. Twenty-nine adult patients with recurrent/persistent GBM were treated at the BC between 9/11/2015 and 06/23/2018. Seven patients had no prior treatment with bevacizumab, had radiologic evidence of recurrent GBM, had MRI assessment of tumor response, and formed the study population. The treatment plan for any patient was based on genomic profiling and consisted of Antineoplaston AS2-1 and selected targeted agents for specific genomic abnormalities [45]. The median treatment time for these seven patients was 101 days (range: 55-208 days). An OR was achieved in six patients (85.7%) with a CR in four patients (57.1%) and a PR in two patients (28.6%). PD was seen in one patient (14.3%).

Conclusion

We present here the case of a 45-year-old female with a GBM, who presented to the BC at age 46 years and eight months with recurrent/persistent GBM and obtained a cure with ANP therapy, having obtained a CR and survived 24 years since the start of ANP therapy. This therapy is an attractive option for patients with recurrent/persistent GBM who are ineligible for or refuse standard therapy or demonstrate recurrent/persistent disease following standard therapy. Multiple Phase II clinical studies of ANP therapy in a variety of low-and high-grade brain tumors under the Burzynski Research Institute’s (BRI’s) IND # 43,742 have now been completed and numerous articles have been published [46-85]. Based on the preliminary study cited above [44], we propose a Phase II study of AS2-1 plus targeted therapy in patients with recurrent/persistent GBM following standard of care therapy.

References

  1. Ostrom QT, Patil N, Cioffi G, Waite K, Kruchko C, et al. (2020)CBTRUS statistical report: Primary brain and other central nervous system tumors diagnosed in the United States in 2013-2017. Neuro Oncol 22: 1-96. [crossref]
  2. Lacroix M, Abi-Said D, Fourney DR, Gokaslan ZL, Shi W, et al. (2001)A multivariate analysis of 416 patients with glioblastoma multiforme: prognosis, extent of resection, and survival. J Neurosurg 95: 190-198. [crossref]
  3. Lamborn KR, Chang SM, Prados MD (2004)Prognostic factors for survival of patients with glioblastoma: recursive partitioning analysis. Neuro Oncol 6: 227-235. [crossref]
  4. Ostrom QT, Cote DJ, Ascha M, Kruchko C, Barnholtz-Sloan JS (2018) Adult glioma incidence and survival by race or ethnicity in the United States from 2000 to 2014. JAMA Oncol 4: 1254-1262. [crossref]
  5. Ostrom QT, Gittleman H, Farah P, Ondracek A, Chen Y, et al. (2013) CBTRUS statistical report: primary brain and central nervous system tumors diagnosed in the United States in 2006-2010. Neuro Oncol 15: 1-56. [crossref]
  6. Fisher JL, Schwartzbaum JA, Wrensch M, Wiemels JL (2007) Epidemiology of brain tumors. Neurol Clin 25: 867-890. [crossref]
  7. Scheurer ME, Etzel CJ, Liu M, Jill BS, Wiklund F, et al. (2010)Familial aggregation of glioma: a pooled analysis. Am J Epidemiol 172: 1099-1107. [crossref]
  8. Koh HJ, Lee SM, Son BG, Lee SH, Ryoo ZY, et al. (2004) Cytosolic NADP+-dependent isocitrate dehydrogenase plays a key role in lipid metabolism. J Biol Chem 279: 39968-39974. [crossref]
  9. Badur MG, Muthusamy T, Parker SJ, Ma S, McBrayer SK, et al. (2018) Oncogenic R132 IDH1 mutations limit NADPH for de novo lipogenesis through (D)2-hydroxyglutarate production in fibrosarcoma sells. Cell Rep 25: 1018-1026. [crossref]
  10. Lee SH, Jo SH, Lee SM, Koh HJ, Song H, et al. (2004) Role of NADP+-dependent isocitrate dehydrogenase (NADP+-ICDH) on cellular defense against oxidative injury by gamma-rays. Int J Radiat Biol 80: 635-642. [crossref]
  11. Louis DN, Perry A, Reifenberger G, Deimling AV, Dominique FB, et al. (2016) The 2016 World Health Organization Classification of Tumors of the Central Nervous System: a summary. Acta Neuropathol 131: 803-820. [crossref]
  12. Ohgaki H, Kleihues P (2013) The definition of primary and secondary glioblastoma. Clin Cancer Res 19: 764-772. [crossref]
  13. Zawlik I, Vaccarella S, Kita D, Mittelbronn M, Franceschi S, et al. (2009) Promoter methylation and polymorphisms of the MGMT gene in glioblastomas: a population-based study. Neuroepidemiology 32: 21-29. [crossref]
  14. Shukla G, Alexander GS, Bakas S, Nikam R, Talekar K, et al. (2017) Advanced magnetic resonance imaging in glioblastoma: a review. Chinese Clin Oncol 6: 40. [crossref]
  15. Wen PK, Macdonald DR, Reardon DA, Cloughesy TF, Sorensen AG, et al. (2010) Updated response criteria for high-grade gliomas: Response Assessment in Neuro-Oncology (RANO) working group. J Clin Oncol 28: 1963-1972. [crossref]
  16. Burzynski SR (1976) Antineoplastons: Biochemical defense against cancer. Physiol Chem Phys 8: 275-279. [Crossref]
  17. Burzynski SR (1986) Synthetic antineoplastons and analogs: Drugs of the future. 11: 679-688.
  18. Stupp R, Mason WP, van den Bent MJ, Weller M, Fisher B, et al. (2005) Radiotherapy plus concomitant and adjuvant temozolomide for glioblastoma. N Engl J Med 352: 987-996. [crossref]
  19. Weller M, Tabatabai G, Kastner B, Felsberg J, Steinbach JP, et al. (2015) MGMT promoter methylation is a strong prognostic biomarker for benefit from dose-intensified temozolomide rechallenge in progressive glioblastoma: the DIRECTOR Trial. Clin Cancer Res 21: 2057-2064. [crossref]
  20. Wick W, Puduvalli VK, Chamberlain MC, Van den Bent MJ, Carpentier AF, et al. (2010) Phase III study of enzastaurin compared with lomustine in the treatment of recurrent intracranial glioblastoma. J Clin Oncol 28: 1168-1174. [crossref]
  21. Jungk C, Chatziaslanidou D, Ahmadi R, Capper D, Bermejo JL, et al. (2016)Chemotherapy with BCNU in recurrent glioma: analysis of clinical outcome and side effects in chemotherapy-naïve patients. BMC Cancer 16: 81. [crossref]
  22. Carvalho BF, Fernandes AC, Almeida DS, Sampaio LV, Costa A, et al. (2015) Second-line chemotherapy in recurrent glioblastoma: a 2-cohort study. Oncol Res Treat 38: 348-354. [crossref]
  23. Schmidt F, Fischer J, Herrlinger U, Dietz K, Dichgans J, et al. (2006) PCV chemotherapy for recurrent glioblastoma. Neurology 66: 587-589. [crossref]
  24. Friedman HS, Prados MD, Wen PY, Mikkelsen T, Schiff D, et al. (2009) Bevacizumab alone and in combination with irinotecan in recurrent glioblastoma. J Clin Oncol 27: 4733-4740. [crossref]
  25. Kreisl TN, Kim L, Moore K, Duic P, Royce C, et al. (2009) Phase II trial of single-agent bevacizumab followed by bevacizumab plus irinotecan at tumor progression in recurrent glioblastoma. J Clin Oncol 27: 740-745. [crossref]
  26. Wick W, Gorlia T, Bendszus M, Taphoorn M, Sahm F, et al. (2017) Lomustine and bevacizumab in progressive glioblastoma. N Engl J Med 377: 1954-1963. [crossref]
  27. Burzynski SR, Patil S (2014) The effect of Antineoplaston A10 and AS2-1 and metabolites of sodium phenylbutyrate on gene expression in glioblastoma multiforme. J Cancer Ther 5: 929-945.
  28. Burzynski SR, Janicki T, Burzynski G (2015) Comprehensive genomic profiling of recurrent classic glioblastoma in a patient surviving eleven years following antineoplaston therapy. Cancer Clin Oncol 4: 41-52.
  29. Cancer Genome Atlas Research Network (2008) Comprehensive genomic characterization defines human glioblastoma genes and core pathways. Nature 455: 1061-1068. [crossref]
  30. Yung WK, Vredenburgh JJ, Cloughesy TF, Nghiemphu P, Klencke B, et al. (2010) Safety and efficacy of erlotinib in first-relapse glioblastoma: a phase II open-label study. Neuro Oncol 12: 1061-1070. [crossref]
  31. Raizer JJ, Abrey LE, Lassman AB, Chang SM, Lamborn KR, et al. (2010) A phase II trial of erlotinib in patients with recurrent malignant gliomas and nonprogressive glioblastoma multiforme post radiation therapy. Neuro col 12: 95-103. [crossref]
  32. Prados MD, Chang SM, Butowski N, Deboer R, Parvataneni R, et al. (2009) Phase II study of erlotinib plus temozolomide during and after radiation therapy in patients with newly diagnosed glioblastoma multiforme or gliosarcoma. J Clin Oncol 27: 579-584. [crossref]
  33. van den Bent M, Eoli M, Sepulveda JM, Smits M, Walenkamp A, et al. (2020) INTELLANCE 2/EORTC 1410 randomized phase II study of Depatux-M alone and with temozolomide vs temozolomide or lomustine in recurrent EGFR amplified glioblastoma. Neuro Oncol 229: 684-693. [crossref]
  34. Lassman A, Pugh S, Wang T, Aldape K, Gan H, et al. (2019) ACTR-21. A randomized, double-blind, placebo-controlled phase 3 trial of depatuxizumab mafodotin (ABT-414) in epidermal growth factor receptor (EGFR) amplified (AMP) newly diagnosed glioblastoma (nGBM). Neuro Oncol 21: 17.
  35. Cancer Genome Atlas Research Network(2008)Comprehensive genomic characterization defines human glioblastoma genes and core pathways. Nature 455: 1061-1068. [crossref]
  36. Wen PY, Touat M, Alexander BM, Mellinghof IK, Ramkissoon S, et al. (2019)Buparlisib in patients with recurrent glioblastoma harboring phosphatidylinositol 3-kinase pathway activation: an open-label, multicenter, multi-arm, phase II trial. J Clin Oncol 37: 741-750. [crossref]
  37. Ma DJ, Galanis E, Anderson SK, Schiff D, Kaufmann TJ, et al. (2015) A phase II trial of everolimus, temozolomide, and radiotherapy in patients with newly diagnosed glioblastoma: NCCTG N057K. Neuro Oncol 17: 1261-1269. [crossref]
  38. Wick W, Gorlia T, Bady P, Platten M, Vandenbent MJ, et al. (2016) Phase II study of radiotherapy and temsirolimus versus radiochemotherapy with temozolomide in patients with newly diagnosed glioblastoma without MGMT promoter hypermethylation (EORTC 26082). Clin Cancer Res 22: 4797-4806. [crossref]
  39. Batchelor TT, Mulholland P, Neyns B, Nabors LB, et al. (2013) Phase III randomized trial comparing the efficacy of cediranib as monotherapy, and in combination with lomustine, versus lomustine alone in patients with recurrent glioblastoma. J Clin Oncol 31: 3212-3218. [crossref]
  40. Lombardi G, De Salvo GL, Brandes AA, et al. (2019) Regorafenib compared with lomustine in patients with relapsed glioblastoma (REGOMA): a multicentre, open-label, randomised, controlled, phase 2 trial. Lancet Oncol 20: 110-119.
  41. Kalpathy-Cramer J, Chandra V, Da X, Ou Y, Emblem KE, et al. (2017)Phase II study of tivozanib, an oral VEGFR inhibitor, in patients with recurrent glioblastoma. J Neurooncol 131: 603-610. [crossref]
  42. Iwamoto FM, Lamborn KR, Robins HI, Mehta MP, Chang SM, et al. (2010) Phase II trial of pazopanib (GW786034), an oral multi-targeted angiogenesis inhibitor, for adults with recurrent glioblastoma (North American Brain Tumor Consortium Study 06-02). Neuro Oncol 12: 855-861. [crossref]
  43. Hutterer M, Nowosielski M, Haybaeck J, Embacher S, Stockhammer F, et al. (2014) A single-arm phase II Austrian/German multicenter trial on continuous daily sunitinib in primary glioblastoma at first recurrence (SURGE 01-07). Neuro Oncol 16: 92-102. [crossref]
  44. Burzynski SR, Janicki T, Beenken S (2019) Treatment of recurrent glioblastoma multiforme (rGBM) with Antineoplaston AS2-1 in combination with targeted therapy. Cancer Clin Oncol 8: 1-15.
  45. Burzynski SR, Burzynski GS, Janicki TJ (2014) Recurrent glioblastoma multiforme: A strategy for long-term survival. J Cancer Ther 5: 957-976.
  46. Burzynski SR, Conde AB, Peters A, Saling B, Ellithorpe R, et al. (1999) A Retrospective Study of Antineoplastons A10 and AS2-1 in Primary Brain Tumors. Clin Drug Invest 18: 1-10.
  47. Burzynski SR, Weaver RA, Bestak M, Lewy RI, Janicki TJ, et al. (2003) Phase II study of Antineoplastons A10 and AS2-1 (ANP) in children with recurrent and progressive multicentric glioma: A preliminary report. Neuro Oncol 5: 358. [crossref]
  48. Burzynski SR, Weaver RA, Lewy RI, Janicki TJ, Jurida GF, et al. (2004) Phase II study of Antineoplaston A10 and AS2-1 in children with recurrent and progressive multicentric glioma: A preliminary report. Drugs in R & D 5: 315- [crossref]
  49. Burzynski SR, Lewy RI, Weaver R, Janicki T, Jurida G, et al. (2004) Long-term survival and complete response of a patient with recurrent diffuse intrinsic brain stem glioblastoma multiforme. Integ Cancer Ther 3: 257-261. [crossref]
  50. Burzynski SR, Weaver R, Bestak M, Janicki T, Jurida G, et al. (2004) Phase II studies of antineoplastons A10 and AS2-1 (ANP) in children with atypical teratoid/rhabdoid tumors (AT/RT) of the central nervous system: A preliminary report. Neuro Oncol 6: 427. [crossref]
  51. Burzynski SR, Weaver R, Bestak M, Janicki T, Szymkowski B, et al. (2004) Treatment of primitive neuroectodermal tumors (PNET) with antineoplastons A10 and AS2-1 (ANP): Preliminary results of phase II studies. Neuro Oncol 6: 428.
  52. Burzynski SR, Weaver R, Lewy R, Janicki T, Jurida G, et al. (2004) Phase II study of antineoplaston A10 and AS2-1 in children with recurrent and progressive multicentric glioma: A preliminary report. Drugs R&D 5: 315-326. [crossref]
  53. Burzynski SR, Weaver RA, Janicki, T, Szymkowski B, Jurida G, et al. (2005) Long-term survival of high-risk pediatric patients with primitive neuroectodermal tumors treated with Antineoplastons A10 and AS2-1. Integ Cancer Ther. 4(2):168-177. [crossref]
  54. Burzynski SR. (2006) Targeted Therapy for Brain Tumors. In: Yang AV, editor. Brain Cancer Therapy and Surgical Interventions. Nova Science Publishers, Inc, New York.
  55. Burzynski SR, Janicki, TJ, Weaver RA, Burzynski B (2006) Targeted therapy with Antineoplastons A10 and AS2-1 of high grade, recurrent, and progressive brainstem glioma. Integ Cancer Ther 5: 40-47. [crossref]
  56. Burzynski SR (2006) Treatments for astrocytic tumors in children: Current and emerging strategies. Ped Drugs 8: 167-168. [crossref]
  57. Burzynski SR (2007) Recent clinical trials in diffuse intrinsic brainstem glioma. Cancer Ther 5: 379- 390. [crossref]
  58. Burzynski S, Janicki T, Burzynski G, Marszalek A (2014) Long-term survival (>13 years) in a child with recurrent diffuse pontine gliosarcoma: A case report. J Ped Hematol Oncol 36: 433-439. [crossref]
  59. Burzynski SR, Janicki TJ, Burzynski GS, Marszalek A (2014) A phase II study of antineoplastons A10 and AS2-1 in children with high-grade glioma: Final report (Protocol BT-06) and review of recent trials. J Cancer Ther 5: 565-577.
  60. Burzynski SR, Janicki TJ, Burzynski GS (2014) A phase II study of antineoplastons A10 and AS2-1 in adult patients with recurrent glioblastoma multiforme: Final report (Protocol BT-21). J Cancer Ther 5: 946-956.
  61. Burzynski SR, Janicki TJ, Burzynski, GS, Marszalek A, Brookman S (2014) A phase II study of antineoplastons A10 and AS2-1 in children with recurrent, refractory or progressive primary brain tumors: Final report (Protocol BT-22). J Cancer Ther 5: 977-988.
  62. Burzynski SR, Janicki TJ, Burzynski GS, Brookman S (2014) Preliminary findings on the use of targeted therapy with pazopanib and other agents in combination with sodium phenylbutyrate in the treatment of glioblastoma multiforme. J Cancer Ther 5: 1423-1437.
  63. Burzynski GS, Janicki TJ, Marszalek A. (2014) Long-term survival (>20 years) of a child with brainstem glioma treated with antineoplastons A10 and AS2-1: A case report. Neuro Oncol 11: 16.
  64. Burzynski SR, Janicki TJ, Burzynski GS, Marszalek (2014) The response and survival of children with recurrent diffuse intrinsic pontine glioma based on phase II study of antineoplastons A10 and AS2-1 in patients with brainstem glioma. Childs Nerv Syst 30: 2051-2061. [crossref]
  65. Burzynski SR, Burzynski G, Janicki J, Marszalek A (2015) Complete response and Long-term survival (>20 years) of a child with tectal glioma: A case report. Pediatr Neurosurg 50: 99-103. [crossref]
  66. Burzynski SR, Janicki TJ, Burzynski G (2015) A phase II study of Antineoplastons A10 and AS2-1 injections in adult patients with recurrent anaplastic astrocytoma: Final report (Protocol BT-15). Cancer Clin Oncol 442: 13-23.
  67. Burzynski SR, Janicki TJ, Burzynski GS, Marszalek A (2015) A Phase II Study of Antineoplastons A10 and AS2-1 in adult patients with newly-diagnosed anaplastic astrocytoma: Final report (Protocol BT-08). Cancer lin Oncol 4: 28-38.
  68. Burzynski SR, Burzynski GS, Marszalek A, Janicki J, Martinez-Canca J (2015) Long-term survival (over 20 years), complete response and normal childhood development in medulloblastoma treated with Antineoplastons A10 and AS2-1. J Neurol Stroke 2: 00054.
  69. Burzynski SR, Burzynski GS, Marszalek A, Janicki TJ, Martinez-Canca JF (2015) Long-term survival over 21 years and pathologically confirmed complete response in pediatric anaplastic astrocytoma: A case report. J Neurol Stroke 2: 00072.
  70. Burzynski SR, Burzynski GS, Brookman S (2015) A case of sustained objective response of recurrent/progressive diffuse intrinsic pontine glioma with phenylbutyrate and targeted agents. J Cancer Ther 6: 40-44.
  71. Burzynski SR, Janicki, T, Burzynski G, Marszalek A (2015) A phase II study of antineoplastons A10 and AS2-1 in patients with brainstem gliomas: The report on non-diffuse intrinsic pontine glioma (Protocol BT-11). J Cancer Ther 6: 334-344. [crossref]
  72. Burzynski SR, Janicki T, Burzynski G (2015) A phase II study of Antineoplastons A10 and AS2-1 in adult patients with primary brain tumors: Final report (Protocol BT-09). J Cancer Ther 6: 1063-1074.
  73. Burzynski SR, Janicki TJ, Burzynski GS (2016) Primary CNS tumors and leptomeningeal, disseminated and/or multicentric disease in children treated in Phase II studies with Antineoplastons A10 and AS2-1. Cancer Clin Oncol 5: 38-48.
  74. Burzynski SR, Janicki TJ, Burzynski GS (2016) A phase II study of antineoplastons A10 and AS2-1 in children with low-grade astrocytomas: Final report (Protocol BT-13). J Cancer Ther 7: 837-850.
  75. Burzynski SR, Janicki TJ, Burzynski GS (2017) Antineoplastons A10 and AS2-1 in the treatment of children with optic pathway glioma. Final report (Protocol BT-23). Cancer Clin Oncol 6: 25-35.
  76. Burzynski SR, Janicki TJ, Burzynski GS, Marszalek A (2017) A phase II study of Antineoplastons A10 and AS2-1 in children with brain tumors: Final report (Protocol BT-10). J Cancer Ther 8: 173-187. [crossref]
  77. Burzynski, SR, Janicki, T, Burzynski, GS, Beenken S (2021) Long-term survival (27.7 years) following IV Antineoplaston Therapy (ANP) in a 36-year-old-female with a progressive diffuse intrinsic pontine glioma (DIPG). Int J Radiol Imaging Technol 7: 073-078.
  78. Burzynski, SR, Burzynski, GS, Janicki, T, Beenken S (2021) Long-term survival (23 years) in a 26-year-old male after Antineoplaston therapy for a progressive, diffuse intrinsic pontine glioma: A case report. Int J Brain Disord Treat 6: 038-044.
  79. Burzynski, SR, Janicki T, Burzynski GS, Beenken S (2021) Resolution of clinical signs, a complete response, and long-term survival (>23 Years) in a 3 and ½ month female with a newly diagnosed diffuse intrinsic pontine glioma treated with antineoplastons. Biomed Res Clin Prac 6: 1-6.
  80. Burzynski, SR, Janicki T, Burzynski GS, Beenken S (2021) Diffuse intrinsic pontine glioma in an 11-year-old female treated with antineoplastons: Complete response and > 25-year survival. Pediatr Neonatal Med 1: 1-5.
  81. Burzynski SR, Janicki T, Burzynski GS, Beenken S (2022) A 25-year-old female with diffuse intrinsic pontine glioma surviving for more than nine years following treatment with antineoplastons. Int J Clin Oncol Cancer Res 7: 1-7.
  82. Burzynski SR, Burzynski GS, Janicki T, Beenken S (2022) Twenty-two-year survival in a 15-year-old female with a recurrent posterior fossa ependymoma treated with antineoplastons. Oncol Clin Res 3: 99-105. [crossref]
  83. Burzynski S, Burzynski G, Janicki T, Beenken S (2022) Recurrent and progressive ganglioglioma in an 11-year-old male treated with antineoplastons: Partial response with more than nine years and nine months survival and complete resolution of clinical symptoms/signs. Biomed Res J 37: 1-13.
  84. Burzynski S, Burzynski G, Janicki T, Beenken S (2022) Newly-diagnosed Multicentric Pilocytic Astrocytoma: Complete response and > 22 Years Survival in a Six Year and Nine-month-old Female treated with Antineoplastons. Int J Clin Oncol Cancer Res 7: 76-82.
  85. Burzynski SR, Burzynski GC, Janicki T, Beenken S (2022) Outcome in Four Children with Persistent, Recurrent, and Progressive Gangliogliomas Treated in Phase II Studies with Antineoplastons A10 and AS2-1. Neurol Neurosci 3: 1-9.
fig 8

Manufacturing of β-type NbXTi (X=50 at%)/SWCNTs Matrix Nanocomposites by FAST-SPS: For Metallic Orthopedic Components and Superconductor Magnets in ITER

DOI: 10.31038/NAMS.2022524

Abstract

The synthesize of β-type phase NbxTi (x=50 at%)/SWCNTs intermetallic matrix nanocomposite by mechanical alloying to ensure the effective distribution of single walled carbon nanotubes (SWCNTs) within the matrix. It has been stated by several researchers that during ball-milling of NbxTi (x=50 at%) powder mixtures, Nb-Ti intermetallic compound formation occurs either gradually along milling time, or suddenly through a mechanically self-propagating reaction (MSPR), which occurs after a ignition time of MA. For this purpose, 0.4 and 0.8 wt% of SWNTs were added to the powder mixture after the completion of reaction between Nb and Ti. The resultant powders Nb50Ti intermetallic compound and with addition of powder of SWCNTs and then also ball-milled.Bulk samples were compacted and then sintered by field actived sintering technic spark plasma sintering method (FAST-SPS) at lower temperature in the range (1273 to 1473 K) with short time that retained the integrity of SWNTs in the intermetallic matrix. Structural and characteristics evolutions of the nanocomposites were investigated by X-ray diffractometery (XRD). Field emission scanning electron microscopy (FESEM) micrographs showed that the offered MA approach caused the SWNTs to uniformly embed in the in situ synthesized NbTi intermetallic matrix. Meanwhile better distribution of SWCNTs resulted in higher density of FAST-SPS-FCT bulk nanocomposite as well as higher hardness up to 2.75 GPa compared to2.4 of Nb50Ti intermetallic alloy obtained from the after MA time. The total porosity, compressive strength, and compressive elastic modulus of the FAST-SPS-FCT manufactured material were determined as 7%, 600 MPa, and 120 MPa, respectively. The alloy’s and its intermetallic nanocomposite have Young’s elastic modulus is comparable to that of healthy cancellous bone which makes it applicable in the biomedical field. The in vitro biocomptability will be performed in the near future. The comparable results for the FAST-SPS-FCT nanocomposites were 3%, 650 MPa, and 130 MPa. The alloy’s elastic modulus is comparable to that of healthy cancellous bone. This difference in mechanical properties results from different porosity and phase composition of the bot β-phase NbxTi (x=50 at%) and NbxTi (x=50 at%)/SWCNTs intermetallic matrix nanocomposite.

More other nanotechnologies applications of the nanocomposite will be focused in the study of the superconducting type I for the ITER Poloidal Field Coils by measuring of Jc (T, B) characteristics.

Keywords

β-type phase NbxTi (x=50 at%), SWCNTs, FAST-SPS-FCT, Microhardness, Fracture toughness, compressive strength, Compressive elastic modulus, Porosity architecture, Cancellous bone, ITER Poloidal Field Coils

Introduction

Titanium and porous Ti and its alloys are widely used as load-bearing implant materials for hard tissue support and replacement because of good mechanical properties, excellent biocompatibility, and high corrosion resistance. One of the short comings of commonly-used Ti-based alloys is high stiffness, expressed as high elastic modulus (E) (typically, >100 GPa). In implant applications, a large stiffness mismatch between the implant material and the contiguous bone can lead to stress shielding, which retards the mechanical stimulation of the bone healing process. Thus, for a given Ti-based alloy, it is desirable to reduce its E to that of healthy bone (4–30 GPa) while maintaining its high strength and good plasticity [1-8]. Two approaches have been taken to achieve this goal. One is the production of metastable β type phase wrought niobium-titanium (Nb-Ti) alloys (for example, Nb50Ti), but the reported minimum value of E (60–62 GPa) is too high [9,10].

Alternatively, porous Nb-Ti alloys, having a microstructure similar to that of cancellous bone, have been produced. Nb-Ti Intermetallic compound has been recognized as one of high temperature structural materials due to excellent physical, superconductivity and mechanical properties such as low density (5.7 g/cm3), high melting point (2173°K) and excellent oxidation resistance, as well as good thermal conductivity. NbTi compound is also known for its good ductility and fracture toughness at room temperature. Several methods such as grain refinement, second-phase strengthening, mechanical alloying, selective laser melting, field assisted spark plasma sintering and hot pressing, have been offered to overcome this limitation. High energy ball mills have been used for mechanical alloying (MA) as a production method to synthesize and modify intermetallic compounds like Nb-Ti. It has been stated by several researchers that during ball-milling of Nb and Ti powder mixtures, Nb-Ti intermetallic compound formation occurs either gradually along milling time, or suddenly through a mechanically self-propagating reaction (MSR), which occurs after a certain time of ball-milling called ignition time. In the last decade ball-milling has been widely used for the fabrication of intermetallic matrix composites containing ceramic or metalloid particles. In recent years carbon nanostructures such as carbon nanotubes (CNTs), fullerene and graphene have been the focus of significant research. Carbon nanotubes (CNTs) with exceptional mechanical and physical properties offer promising potential as a reinforcing material to enhance the mechanical, thermal and electrical properties of nanocomposites. It is obvious that a successful dispersion of CNTs in the matrix is needed before any sort of significant benefits in the nanocomposite is realized. In fact, adequate dispersion of the CNTs in the matrix is still challenging. It has been concluded from several researches that MA can be considered as an effective process to achieve homogenous distribution of CNTs in metallic and intermetallic matrix. It is known that CNTs are entangled between re-welded ductile particles during milling and after appropriate time are embedded within metal and intermetallic matrix. Milling of CNTs with brittle powders like ceramics and intermetallic compounds has been reported to result in the distribution of CNTs on the surface of particles that can affect the compressibility and sinter ability of powder particles [11-29]. There are a fair number of literature reports on production and characterization of porous Nb –Ti alloy. Lin et al. [30] used powder, produced using ball-milled powder and a powder metallurgical method to fabricate Nb35Ti porous samples. The samples were produced by sintering with ammonium bicarbonate particles as space-holder. Yang et al. [31] used powder produced by high energy vibration ball milling and gel casting to fabricate Nb25Ti samples. A. Helth et al. [32,33] used commercial titanium and niobium powders and PM to fabricate Nb40Ti. Zhuravleva et al. [34,35] used ball-milled Nb40Ti powder and a space-holder method to fabricate porous samples. One of the methods that has recently been introduced for the production of porous alloys is selective laser melting (SLM). The process involves direct melting of a powder and creation of net-shaped bodies through a “layer by layer” approach. Each layer is melted by a scanning laser and is mounted on a previously molten layer. The high temperature, steep temperature gradient, and fast cooling rates involved in SLM allow stabilization of metastable phases in an alloy [36].

To the best of our knowledge there are neither studies involving the use of SLM to fabricate porous Nb-Ti alloys nor studies involving comparison of properties of a Nb-Ti alloy fabricated using different techniques but with the powder produced using the same method. β-type structure Nb50Ti are developed for biomedical applications because of their expected high biocompatibility and low elastic modulus in compare with conventional titanium alloys. Low elastic modulus is important with respect to biomechanical compatibility. When using an implant with high elastic modulus it overtakes a considerable part of body loading. Then the bone is shielded from necessary stressing required to maintain its strength, density and healthy structure. This effect (usually termed as “stress shielding”) may cause bone loss, implant loosening and premature failure of the implant. The addition of elements like V, which has one of the highest cytotoxicity, and Al, that is suspected from causing neurological problems (Alzheimer disease). The designing of a novel biofuntional-structure hydroxyapatite composite with enhanced mechanical properties, high bioactivity and porous low modulus Ti40Nb compacts with electrodeposited hydroxyapatite coating for biomedical applications have been studied by A. Helth et al., R. Schmidt et al. [37-39] and K. Zhuravleva et al. [40]. The addition of Zr, Si, Pd, Fe, Sn, Ta and Indium [41-44] to Beta-type Nb-Ti forming biocompatible glass, apatite formation and bulk metallic composites for novel biocompatible materials with superior mechanical strength and elastic recovery were studied intensively. The designing biocompatible Ti-based metallic glasses for implant applications were also studied and applied. Finally, Ab-initio and experimental study of phase stability of Nb-Ti alloys [45,46].

Theoretical and experimental study concerning the crystallographic structure and electronic properties of NbxTi (x </50 at%) alloys is presented, aiming to enlighten the electronic origins of the β-phase stability which is of high interest for the development of novel β stabilized Ti-based alloys for biomedical applications. These data could enlighten the electronic origin of the Nb-Ti phase stability, thus, may contribute to the design of β stabilized low moduli Ti-based alloys suitable for load-bearing biomedical applications.

Nb-Ti is used in the TETRA tokamak systems code is used to compare designs for the International Thermonuclear Experimental Reactor (ITER) that uses Nb-Ti superconductor magnets. Its critical temperature is about 10 kelvins. The minimum-cost devices occur for peak fields at the toroidal field coil of about 11.5-13 T, depending on the physics requirements. Sensitivities to the allowable stress level indicate strong cost increases when the stress is reduced from the nominal 600 MPa level and weaker cost benefits when the stress is allowed to reach higher levels. Nb-Ti alloys have a maximal critical magnetic field of about 15 teslas, and are thus are suitable for fabricating super magnets capable of generating magnetic fields up to about 10 teslas. For higher magnetic fields, higher-performance but difficult to fabricate and thus more expensive superconductors such as niobium–tin are commonly employed. The substitution and using of the nanocomposite produced by FAST-SPS with higher density improved the superconducting properties Jc (Tc, B) and working with low cost. In the present study a route was proposed to synthesize NbxTi (x=50 at%)/0.4 to 0.8 SWCNTs by ball-milling of elemental powders 20 h to achieve effective accommodation of SWCNTs within the Nb-Ti intermetallic matrix during in situ formation of intermetallic compound. The milling time with SWCNTs was limited to 10 h to reduce the damage of single walled carbon nanotubes.4 to 0.8 wt% SWCNTs. In the present approach SWCNTs were added to the powder mixture after the completion of reaction between Nb and Ti. Therefore, SWCNTs could entangle between re-welding ductile powder particles before the complete evolution of particles to fully brittle intermetallic compound. The structural evolution during ball-milling was investigated. In order to obtain fully dense intermetallique nanocomposites, and minimize the decomposition of SWCNTs during sintering, FAST-SPS was employed after ball-milling in the present study. FAST-SPS, in which much lower sintering temperatures and shorter times are applicable, is an effective sintering technique for obtaining fully dense nanocrystalline composites and fine grain structure. Microstructure of powders and FAST-SPS samples was investigated, micro hardness and fracture toughness of bulk samples were evaluated. In addition, compressive straight and compressive elastic and Young’s modulus of the intermetallic nanocomposite were also estimated. The biomedical and nanotechnology applications of nanocomposite intermetallic matrix application. The purpose is to demonstrate the possibility of obtaining single phase β-type NbxTi (x=50 at%) powders by ball-milling followed by FAST-SPS. The influence of milling parameters, and initial powders morphology have been studied. The produced powder can be further used to synthesize compacts with a very low Young’s modulus for biomedical. To compare the properties/characteristics of NbxTi (x=50 at%) alloy and NbxTi (x=50 at%) reinforced SWCNTs fabricated using ball-milling and employing a better established method FAST-SPS. The properties/characteristics determined were phase composition, morphology, total porosity, inner pore architecture, compressive strength, compressive modulus, and in vitro biocompatibility. The in vitro biocompatibility, tribological properties and superconductivity measurement will be performed in the near future.

Experimental Section

Starting Material

In the present study, Niobium (Nb<3µm) and Titanium (Ti<5µm) elemental powders were used as initial material. High purity (~99.9% pure) Nb and Ti powders were supplied by Kojundo Chemical Laboratory Co. Ltd. (Japan). The FESEM micrographs of the as received Niobium (Nb) elemental Titanium (Ti), and SWCNTs produced by HiPCO process and by laser ablation method [47,48] with diameter of 1.0 nm (IFW-TU-Dresden-Germany) were used as the raw materials. The starting powders are shown in Figure 1. The Nb and Ti powder particles had an irregular shaped morphology together with both coarse- and fine-sized particles. Clearly, both the powders had comparable starting average particle size. Also, an X ray diffraction (XRD) analysis of the initial powders revealed that both the powders had cubic crystal structure not presented in this work.

fig 1

Figure 1: a-Ti powder morphology, b- Nb powder morphology, c, d, e, h- SEM of SWCNTs morphologies, f, g, j, k- TEM of SWCNTs with Fe catalyst, n, x: Bundles of SWCNTs.

Mechanical Alloying

The equilibrium phase diagram of NbTi binary alloy system. The phase diagram shows that the β-phase allotropic phase transformation, for pure titanium, occurs at 1155 K. Since niobium acts as a strong a-phase phase stabilizer, niobium additions result in a significant lowering of at β-type phase transformation temperature. It can be seen that Nb-Ti binary alloys with more than 50 wt% Nb can retain the β-phase at very low temperatures. Therefore, to obtain β-type phase stabilized Nb-Ti alloy, as received Ti and elemental Nb were blended together according to the desired optimum stoichiometric composition, i.e. 50 wt% titanium and 50 wt% Nb, NbxTi (x=50 at%) (further referred as Nb50Ti). The Nb and Ti powders were mechanically alloyed under argon atmosphere at room temperature, using planetary ball mill with stainless steel balls and vials-operating at a rotation speed of 200 rpm. To obtain homogenized and fine powder mixtures, the powder mixtures of NbxTi (x=50 at%) were ball-milled at a high speed of 200 RPM for 10 to 20 by using WC balls (diameter: 3 mm) and ethanol as the milling media. The ball to powder ratio was kept 6:1. To understand the microstructural evolution during ball-milling process, the mixture powder Nb and Ti samples were analyzed after mechanical milling time of 10 and 20 hours and then the powders mixture containing Nb50Ti were mixed with addition of 0.4 to 0.8 wt% of SWCNTs after preliminary treatment of SWCNTs was carried out to minimize the agglomerate of the added SWCNTs. Firstly; the weighed SWCNTs were immersed into acetone for about 5 h, and then were ultrasonically dispersed for 4 h. Secondly, the treated SWCNTs (0.4 to 0.8 wt% mixed with the former ball-milled blend Nb50Ti by magnetic agitation for 8 h and then ball milled for 10 h. The ball-milled intermetallic nanocomposites were prepared by wet milling in anhydrous alcohol for 3 h.

Finally, the powder mixtures with dispersed SWCNTs were dried by rotary evaporator under vacuum condition and were sieved to 70 mesh [49,50].

Consolidation of Powders via Spark Plasma Sintering

The field assisted sintering Technics-Spark Plasma Sintering (FAST-SPS) method is an effective technique for the compaction of powder materials. A main characteristic of this method is the direct heating of the pressing tool and/or the sample by pulsed direct electrical current with low voltage. This results in high heating rates and allows for short treatment times in order to obtain highly compacted sinter bodies. The material transport (e.g. by diffusion) occurring during the sintering process can also be used for performing chemical reactions. Especially the conditions during the FAST-SPS process allow the use of the method also as an alternative synthesis route for intermetallic compounds, of which, some can be obtained only with difficulties by other techniques.

The intermetallic matrix nanocomposites ball-milled powders were consolidated via FAST-SPS-FCT method under high vacuum conditions using graphite die and punch at an applied external pressure of 60 MPa. In order to prepare high density compacts with negligible porosity, temperature and compression pressure was programmed to rise simultaneously, until stabilized to the maximum temperature and compression pressure, followed by holding the system at the same sintering conditions for 1.6 ks. Circular compacts with diameter 20 mm and thickness 4 mm were prepared using FAST-SPS-FCT. The sintering conditions used in this study are provided in Table 1. The tree sintering schedules are. In the FAST-SPS-FCT, machine temperature profile, punch displacement or shrinkage and displacement velocity are presented in the FAST-SPS FCT machine (Table 1 and Figure 2).

Table 1: FAST-SPS synthesis parameters

Sintred Samples

T (°C)

Time of the cycle (mn)

Heating rate (°C/min)

P (MPa)

Ar (Sccm)

Wt.% SWCNTs d=1 nm

Current (A)

β-type phase Nb50Ti

1200

10

100

70

200

00

3000

β-type phase Nb50Ti/0.4 Wt% SWCNTs

1200

10

100

70

200

0.4

3000

β-type phase Nb50Ti/0.8 Wt% SWCNTs

1200

10

100

70

200

0.8

3000

fig 2

Figure 2: Variation of die displacement or shrinkage, temperature and applied pressure in dependence on the heating time during the FAST-SPS the sintered samples.

The resulting samples β-type phase Nb50Ti and β-type phase Nb50Ti/0.4-0.8 Wt% SWCNTs ultrafine powder mixtures were sintered by FAST-SPS in graphite dies (inner diameter of 20 mm) coated with graphite sheet lubricant atomized with cBN at 1273 to 1473°K in vacuum. Table 1 presented the sintering condition of intermetallic Nb50Ti and intermetallic nanocomposite Nb50Ti/SWCNTs 0.4-0.8. The applied pressure of 64 MPa was adjusted to the powder at room temperature and kept constant throughout the hot pressing process. The pressure was applied at the beginning of the sintering process because high green density is favorable for better densification rate by reducing the pores prior to the densification during heating. The heating rate was about 10°C/min and the dwelling time at terminal temperature was 60 min. The temperature was measured by an infrared pyrometer through a hole opened in the graphite die. Furthermore, for monitoring densification process, the shrinkage of the powder compact was measured by a displacement sensor during the sintering.

The dimensions of the finally sintered samples were about 20 mm in diameter and 3 mm in thickness after calculation of their weight using the densities values (Figure 3).

The mixtures were loosely compacted into a graphite die of 20 mm in diameter and sintered in the vacuum (1 Pa) at various temperatures using an FAST-SPS-FCT apparatus at the sinter Labs:

  1. ENSICAEN, 6, Boulevard Maréchal Juin, CS 45053 14050 Caen Cedex 04,
  2. Dipartimento di Ingegneria Chimica e Materiali, Universita` di Cagliari, Piazza d’Armi, 09123, Cagliari,
  3. Tycho lab, Institut fur Physik, universitat Rostock Germany FAST-SPS-1050, Sumitomo Coal Mining Co. , Germany). A constant heating rate of 120°C/min was employed, while the applied pressure was 65 MPa. The on/off time ratio of the pulsed current was set to 10/2 in each run. The maximum current reached approximately 3000 A during sintering.

The soaking time at high temperatures was within 10 min. The upper ram of the FAST-SPS apparatus was fixed, while the displacement of the shifting lower press ram was recorded in order to analyze the synthesis and sintering. The sintered samples are presented in the Figure 3.

Density of the sintered samples was measured by the Archimedes’ using the densimeter type Micromiritics Accupyc 1330.

fig 3

Figure 3: (a) Sintered samples in the die diameter of 20 mm of Nb50Ti /SWCNTs powder intermetallic nanocomposite. (b) Punch, die and spacer with 10 mm of diameter.

Mechanical Properties

Mechanical properties of the sintered compacts were evaluated the microhardness at the top were measured by a diamond Vickers hardness tester (MVK-H1, Meter-Mitutoyo, Japan).

The indentation loads, ranging from 2 to 500 N, were applied for 15 s for each measurement. The fracture toughness was measured using the Vickers indentation by the measurement of the producing failler.

In this study, 06 measurements for each sintering sample process were fabricated to obtain an average relative density and microhardness.

Young’s modulus of the composites was determined by ultrasonic wave transition method measuring the velocity of ultrasonicsound waves passing through the material using an ultrasonic flaw detector (Panametrics Epoch III). The microhardness and the fracture toughness were determined by the Vickers indentation method applying load of 294 N (HV30) and 490 N (HV50), by a Future Tech FLC-50VX hardness tester. For each sample, 6 indentations were made and the stress intensity factor KIC was calculated from the length of Palmqvistcracks which developed during a Vickers indentation test using E. Rocha-Rangel’s equation.

The wear resistance and the friction coefficient (tribological behavior will be performed in the near future. The hardness (H) and the toughness (KIC) of the manufactured samples were measured under ambient conditions using the instrumented Vickers indentation method (ZwickRoell, ZHU 2.5 apparatus). The impression diagonal (2a) was measured, and the hardness values were calculated according to the following relation:

Hv=(1.8544*F)/(2a)2                                                        (1)

The fracture toughness was also calculated by indentation fracture (IF) method according to the equation:

KIC=0.16Hva1/2(c/a)-3/2                                                    (2)

Where Hv was the Vickers hardness, a was the half-length of the indentation diagonal and c was the half-length of the median crack generated by indentation. Generally, the fracture toughness measured by IF method were fluctuating values with relatively large deviations due to the phase distribution and measurement errors of calculation. Thus a linear regression model was applied to get a reliable value of indentation fracture toughness.

To obtain the values of A, B and R2, a series of indentation loads (10 N, 50 N, 100 N, 300, 500 N) were applied to get the relations of P and c3/2

Where P was the indentation load. Through the combination of equations (1) and (2), the linear relation between P and c3/2was obtained:

P=Ac3/2 + B                                                           (A=KIC/0.075) (3)

A linear regression analysis was applied to the relations of P and c3/2 by the least square method. Where A was the slope, B was the intercept. To obtain the values of A and B.

In addition, a high determination coefficient (R2) was obtained through the linear regression model. Hence, when combined with the linear regression model, IF was shown to be an effective method in the evaluation of fracture toughness for its convenience and material saving. The compressive strength and the compressive modulus of elasticity of the produced alloy and nanocomposite were determined from compression tests carried out on the cylinders, at room temperature, at a strain rate of 10-3·s-1.

In vitro biocompatibility experiments to be performed using human bone marrow stromal cells (hBMSC). For isolation of hBMSC, bone marrow aspirates will be collected from bone marrow donors (age: 32 ± 3 years) at the CHU-Bone Marrow Transplantation Centre Hospital ibn Rochd-Annaba-Algeria to the laboratory.

The study will be approved by the local ethics commission. The donors will be informed and gave their approval. hBMSC were isolated using the method described by.

Bone marrow aspirate will be diluted 1:5 with 0.5% human serum albumin (HSA) in phosphate-buffered saline (PBS) and applied to a Percoll density gradient (d=1.073 g/mL). After centrifugation at 900 g for 30 min at 25°C, mononuclear cells in the interface will be harvested and filtered through a nylon cell strainer. The cells will be re-suspended in DMEM containing 10% heat-inactivated fetal calf serum FCS and antibiotics. After 24 h, non-adherent cells were removed. When the adherent cells reached about 90% confluence, they were trypsinized with 0.05% trypsin/0.02% EDTA (v/v) in PBS and sub-cultured. For the experiments, 5000 hMSC/cm2 were deposited on the test specimen. Metabolic activity was determined by the MTS assay (Cell Titer 96 Aqueous One Solution Proliferation Assay) 24 h after plating. Conditioned medium was replaced by fresh medium containing 10% of MTS dye solution. After 2 h of incubation at 37°C in a humidified CO2 incubator, 80 mL cellular medium was transferred to a 96-well plate and the absorbance of the formed MTS formazan dye will be measured photometrically at 490 or 655 nm.

In terms of statistics, the results of the quantitative parameters are presented as mean ± standard deviation (together with median and variance, in some cases). Significance of difference of the pT, ultimate compression strength, and compressive modulus of elasticity results between the two study groups was performed using the Mann-Whitney test, with significance denoted at p < 0.05. The superconducting measurement of critical temperature, critical current density and critical magnetic field on the nanocomposites samples for the superconducting magnet in ITER apparatus.

Results and Discussion

Phase and Microstructural Analysis

The general phase analysis was carried out at ambient temperature by XRD analysis with a CuKα (λ=1.5406 Å) source at 40 kV voltage and 30 mA current. The microstructural characterization of the initial powders, ball-milled powders, and consolidated compacts was carried out by FESEM equipped with back scattered electron (BSE) and electron back scattered diffraction (EBSD) facilities. Primary chemical characterization was carried out by Energy Dispersive X-ray Spectroscopy (EDS) technique. The diameter of single consists of β-type phase Nb50Ti about 24 ± 2 µm. The XRD pattern taken from the cross-section of the sintered samples is shown in Figure 4. Both a main β-phase and a minor α-phase are identifiable. The amount of α-phase was evaluated as 10 ± 2% by the Le Bail method. The appearance of α-phase can be mainly attributed to a slow cooling rate as the samples had to be cooled inside of FAST-SPS-FCT chamber. After slow cooling, the presence of the ω phase precipitates (hexagonal structure, space group P6/mmm) is also possible because, according to the literature data ω-phase precipitates may form during a slow quenching from the β-type phase region or during isothermal aging. The presence of the ω-phase is hard to detect from the XRD patterns but it was confirmed by TEM studies in a previous work [51-53].

The XRD patterns of the pre-mixed and ball-milled Nb50Ti powder mixtures (ball-milled from 10 to 20 haours) are shown in Figure 4a. These XRD patterns were compared with the JCPDS data of the oxides of Ti and Nb. No visible oxide peaks were found to be present in the XRD patterns of the ball-milled powders, indicating the absence of any substantial quantity of oxides. However, an analysis of the XRD profiles clearly shows a broadening of peaks with increasing milling time from 10 to 20 h. Sample made by FAST-SPS-FCT of intermetallic nanocomposite β-type phase Nb50Ti/0.4-0.8 Wt% SWCNTs ball-milled powder. At the Figure 4 is represented the higher resolution of its (101) peak.

fig 4

Figure 4: X-ray diffractometer (XRD), patterns of blue line, FAST-SPS of (ball-milled (Nb50Ti powder at 20 h + 0.8 wt% SWCNTs) ball-milled 10 h. Red line, FAST-SPS of (ball-milled (Nb50Ti powder at 20 h + 0.4 wt% SWCNTs) ball-milled 10 h. Black line FAST-SPS of ball-milled Nb50Ti powder at 20 h. A higher resolution of its (101) peak.

 
fig 4a

Figure 4a: X-ray diffractometer (XRD) patterns of green line Nb50Ti ball-milled 20 h. Black line Nb50Ti ball-milled 10h. A higher resolution of its (101) peak.

Figure 4a shows the XRD profiles of the ball-milled powders compacts sintered at 1473°K. These patterns depict and illustrate the microstructural/phase evolution at the sintering temperature. It can be clearly observed that the sintering temperatures led to almost formation of various new alloy phases such as Ti-rich α-type phase, and β-type phase. In particular, α, β-type phase, and pure niobium were formed at lower temperatures.

Ball-milled powder was sieved to select particle sizes of 20 ± 2 µm and its flowability was determined to be very good. Therefore, the ball-milling produced powder was found to be suitable for use in FAST-SPS-FCT. The broadening of the peaks in the XRD spectra at different stages of the ball-milling process suggests the formation of an ultrafine grain structure and an accumulation of strain in the lattice, which is typical for ball-milling related to severe mechanical deformation [54]. The ball-milling process, the morphology and phase composition of the powder were discussed in detail in the previous work of the authors (Figures 4 and 4a).

Structural and Morphological Characterization

To acquire the information on the distribution of various phases in the sintered samples, Energy-Dispersive X-ray Spectroscopy (EDS) analysis was performed on the samples. Although it is not possible to identify the phases by EDS directly, it is still very useful to detect elemental distribution of Nb, Ti and SWCNTs in samples. Thus, EDS analysis together with XRD results can provide more information regarding nature of FAST-SPS of compact powder.

The FESEM images and their corresponding elemental distribution maps of previous ball-milled and then FAST-SPS powders at T=1473°K are shown in Figure 5a. Figure 5b shows the morphology, and their corresponding elemental distribution, of the powder mixture (Nb, Ti, SWCNTs).

Zhang et al. [55] has reported that cold welding and severe plastic deformation is the dominant mechanism which operates during mechanical milling of ductile Nb powder particles. Due to severe plastic deformation and cold-welding, Nb particles become hard and brittle, leading to their fragmentation during subsequent mechanical milling. As a result, relatively coarser Nb particles are obtained in the ball-milled powder mixture. It would also be worth mentioning that such a deformation and fracturing of particles leads to the formation of niobium particles with energetically activated surface.FESEM images and their corresponding elemental distribution maps phase evolved as the major phase in the sintered compacts and the intensity of the peaks corresponding to the β-type phase increased with increasing of amount of SWCNTs at the sintering temperature. Finally, β-type phase appeared to be the major phase formed in the compacts sintered at 1473°K. They consisted of primarily beta phase together with extremely small amounts of alpha phase. Microstructure of the Nb50Ti alloy intermetallic ball-milled 20 h compacts sintered at T=1473°K is illustrated in Figure 5a through typical FESEM micrographs collected in back scattered electron (BSE) mode. The sintered Nb50Ti and intermetallic nanocomposite Nb50Ti/SWCNTs samples exhibited very high density, approximately 94%, with appearance of minimum porosity. The microstructure of low-temperature sintered (1473°K) Nb40 Ti intermatallic alloy compacts (Figure 5a) show three different color composition: (I) bright colored phase, which is the pure Nb phase as verified by energy dispersive X-ray spectroscopy (EDS) analysis and contains Nb and Ti; (II) grey-colored phase, which is the β-type phase and contains Nb50Ti; and(III) comparatively dark-colored phase, which is the α-phase and contains Nb50Ti. Similarly, the microstructure of the Nb50Ti/0.8 wt% WCNTs intermatallic nanocomposite compacts sintered at moderate temperature (1473°K), as shown in Figure 5b, also demonstrated three different phases similar to the ones observed in the low temperature sintered Nb50Ti compacts. It can be observed that, the fraction of the bright and the dark phases decreased whereas the fraction of the grey phase increased in the matrix with increasing of amounts of SWCNTs from0.4 wt% to 0.8 wt%, which could be attributed to the increased inter-diffusion of Ti and Nb and SWCNTs at the sintering temperature. The EDS analysis clearly demonstrated that the grey phase corresponds to the β type phase composition. Therefore, the above results clearly show that the lower sintering temperature result β type phase rich Nb50Ti intermetallic alloy with increased homogeneity. Clearly, these results are in conformity with the phase evolution as observed via XRD results, as already shown in Figure 4.

The FESEM represented separately each α-phase and β-type phase. For Nb50Ti compacts sintered at 1473°K, the calculated average grain size for α and β-type phase was 2.9 ± 1.02 μm and 9.61 ± 4.20 μm, respectively (Figures 5a and 5b).

fig 5

Figure 5: High magnification micro structural representative FESEM image and EDS spectra obtained on tree different regions of the surface of the sample made of sample of Nb50Ti ball- milled 20 h and sintered at T=1473°K.

fig 5a

Figure 5a: High magnification micro structural representative FESEM image their corresponding elemental distribution maps (Nb, Ti) of previous sample of Nb50Ti ball-milled 20 h of polished and etched surface sintered at T=1473°K.

fig 5b

Figure 5b: High magnification micro structural representative FESEM image their corresponding elemental distribution maps (Nb, Ti and C) of FAST-SPS (ball-milled Nb50Ti powder at 20 h + 0.8 wt% SWCNTs) ball-milled 10 h of polished and etched surface sintered at T=1473°K. Its higher resolution global analysis EDS pics is presented.

Finally, the average grain size α-type phase and β-type phase of Nb50Ti/0.8 wt% SWCNTs intermatallic nanocomposite compacts sintered at 1473°K was 1.75 ± 0.4 μm and 4.75 ± 0.83 μm, respectively, in the Figure 6 is presented the homogenous distribution of carbon nanotubes (Figure 6).

fig 6

Figure 6: High magnification micro structural représentative FESEM of FAST-SPS (ball-milled Nb50Ti powder at 20 h + 0.8 wt% SWCNTs) ball-milled 10 h of polished and etched surface sintered at T=1473°K.

High magnification micro structural representative FESEM image sample of Nb50Ti ball-milled 20 h of polished and etched surface sintered at T=1473°K, showing the precipitates embedded in the β-type phase matrix intermetallic nanocomposites (Figure 7).

fig 7

Figure 7: High magnification micro structural representative FESEM image sample of Nb50Ti ball-milled 20 h of polished and etched surface sintered at T=1473°K, showing the precipitates embedded in the β- type phase matrix.

These results clearly demonstrate that fine-grained β-type phase Nb50Ti intermetallic alloy and its nanocomposite based on SWCNTs can be successfully prepared via present processing technique FAST-SPS after sequentially ball-milling wherein the high yield of the material with good density and defined porosity remains ensured for biomedical and nanotechnologies applications by FAST-SPS method.

Mechanical Testing

Mechanical Properties

Density and Porosity of Sintered Samples

The theoretical density of the nanocomposite used for obtaining relative density was calculated using a rule of mixture, using the densities of two constituent phase (Nb50Ti=6 5.7 g/cm3, ρSWCNTs=2.25 g/cm3) with the given FAST-SPS processing parameters, the Nb50Ti without addition of 0.4 to 0.8 wt% SWCNTs sample exhibited best densification with relative density greater than 94.5%, with the similar processing parameters with addition of SWCNTs. The relative density increases with the addition of SWCNTs. The Nb50Ti with addition of 0.4 to 0.8 wt% SWCNTs intermetallic nanocomposites at T=1200°C exhibited relative density of about 97.2%. Depending on the final density to be achieved, the FASY-SPS operating condition were properly chosen, that is, 1200°C, 75 MPa for 10 min, to obtain a highest relative density for the intermetallic nanocomposites for 7, 23, and 2.8% compacts porosity, 94.5, 97.06 and 97.6, respectively.

The porosity (pT) for the FAST-SPS fabricated cylinders was 7% ± 1% (median=7.0%; variance: 0.4%), which is in good agreement with the value obtained using density determined by simply dividing the mass of the cylinder by its volume for Nb50Ti for biomedical application. The porosity is mainly formed by spherical pores, which result from the gas uptake by the powder during the ball milling process. These spherical pores and such a relatively low porosity are typical for alloys fabricated using FAST-SPS.

For FAST-SPS cylinders, the size of the micropores and pT were 3–12 µm and 3 -2.6% ± 0.4% (median=3.0%; variance=0.06%), for Nb50Ti with addition of 0.4 to 0.8 wt% SWCNTs which is in good agreement for biomedical application (Table 2 and Figure 8).

Table 2: Basic physical–mechanical properties of the samples obtained by ball-millig and then FAST-SPS

Sintred samples

β-type phase

Nb50Ti

β-type phase

Nb50Ti/0.4 Wt% SWCNTs

β-type phase

Nb50Ti/0.8 Wt% SWCNTs

Relative density (g/cm3) (%)

94.04

97.06

97.6

Young’s modulus (relative Young’s) (GPa)

60

62

64

Compressive elastic straingh (MPa)

620

630

650

Compressive elastic modulus (MPa)

124

126

130

Porosity (pT) (%)

7

3.0

2.8

fig 8

Figure 8: Micro-computed tomography (µCT) images of (a) sample manufactured by FAST’SPS of (ball-milled (Nb50Ti powder at 20 h + 0.8 wt% SWCNTs) ball-milled 10 h.(b) its inner porous architecture (from image analysis); (c) sample made FAST-SPS of ball- milled Nb50Ti powder at 20 h.

Vickers Microhardness of Sintered Samples

Hardness values were measured on the bulk Nb50Ti alloy and its nanocomposite based SWCNTs compact samples sintered at T=1473°K. The variation in the hardness with the amounts of SWCNTs at sintering temperature is shown in Figure 9. It can be seen that the average hardness increases significantly with increase in the amounts of SWCNTs from 0.4 to 0.8.

fig 9

Figure 9: Representation of the variation of Vickers micro hardness function of the indentation leads of the sintered samples using a 20-mm.

Nevertheless, it would be worth noticing that the hardness of the specimens with coarser grain size and higher amounts of softer β-type phase demonstrates higher average hardness values as compared to those having relatively harder α phase. Interestingly, it can also be observed that the standard deviation decreased from 2.35 to 2.65 Gpa (Table 2) with increasing of amounts of SWCNTs. These results can be explained with respect to the volume fraction of various phases and homogeneity of microstructures. The average hardness of any specimen is essentially an average of the hardness of these individual phases coupled with volume fractions resulting in better mechanical properties and ductility.

According to the above results, it can be concluded that the Vickers hardness has been improved by adding SWNCs and enhanced with the fracture toughness value giving a better ductility and defined porosity for the reinforced β-type phase samples for bio-application. With this addition in the matrix, the electro discharge among powders may lead to self-heating and purification of the particle surface, resulting in activation of the formation of the nanocomposites. The addition of SWNCs plays an important binder less role (the ductility) in the propagation of failler in this nanocomposites and thus enhance the fracture toughness in comparison with his higher hardness.

Fracture Toughness (KIC) of Sintered Samples

Niobium is known by his ductility and superconductivity. In this context we proceeded to the determination of the tenacity of the sintered samples as well as the determination of the parameters associated with this calculation. But unfortunately we could not determine the critical cracking load due to ductility of the sintered samples.

Vibronic Properties

Raman Spectroscopy Analysis

To verify the XRD experimental results Raman spectroscopy is a powerful technique for characterizing degree of disorder of CNTs. SWNTs with a Raman spectroscopy measurement of 513.5 nm were studied. In general, Raman spectroscopy can observe the distribution of dielectric bonding SP3, D band and metallic bonding SP2, G band [55-61].

Different regions of the sample. In Figure 10 is presented which depicts the absence of radial breathing mode (RBM), which is attributed to the absence of SWCNTs. The first-order Raman spectra of MWCNTs has a small peak at 1364 cm-1 and strong peak at 1590 cm-1. A band at 1364 cm-1 (D) arises due to the presence of disorder in the carbon system as well as breathing of hexagons at border of crystalline areas of nanoparticles and fine crystallite. A sharp and narrow high-intensity band occurred at 1590 cm-1 (G band) which approved high crystallinity of graphite and graphitic structure of graphene. 2D or G-band peak at 2705 cm-1 and at 2720 cm-1 for second order of D band. They investigated that 2D band peak of synthesized graphene have no shoulder, which corroborates the characteristics of graphene with few layers which is a characteristic of graphene with more layer and ascribed to the overtone of first-order D band (1364) cm-1.

fig 10

Figure 10: Raman spectra of FAST-SPS (ball-milled Nb50Ti powder at 20 h+0.8wt% SWCNTs) ball-milled 10 h of polished and etched surface sintered at T=1473°K (region 1 and 2).

The ratio of D band and G band demonstrates the degree of disorder induced in bulk samples. If both bands have equal intensity, then there is a high degree of disorder in the bulk samples. The relations among D band, G band and RBM play predominant role to distinguish between different variants of CNTs.

The experimental results are shown in Figure 10. The peak positions of SWCNTs were similar, but the ratios of the D band 1380 cm-1 and the G band 1590 cm-1 were quite different and collective excitation of β-type phase from the difference in the ratios, it was found that region 1 have higher dielectric properties than region 2 (Figure 10) because SWCNTs have underwent a transformation during heating of sintering to DWCNTs or MWCNTs in high vacuum.

To analyze these experimental results qualitatively, we modeled the composite system which is composed of CNTs nanoparticles in Nb50Ti host medium. The CNTs have both metallic and semiconducting properties (region 3 and 4) (Figure 10a) because they consist of diverse nanotubes and contact junctions [62,63].

fig 10a

Figure 10a: Raman spectra of FAST-SPS (ball-milled Nb50Ti powder at 20h + 0.8wt% SWCNTs) ball-milled 10 h of polished and etched surface sintered at T=1473°K (region 3 and 4).

Describing these properties, the dielectric function of CNTs (ϵCNTs) CNTs can be represented as a combination of the Drude and Lorentz harmonic oscillator models [64] (Figures 10 and 11).

fig 11

Figure 11: Raman images caption, region 1 and 2 corresponding to carbon nanotubes and β-type phase Nb50Ti. The region 3 and 4 correspond to carbon nanotubes.

Conclusions

vIn this study, intermetallic alloys fine-grained β-type phase matrix Nb50Ti/SWCNTs nanocomposite was successfully prepared by ball-milling of titanium elemental niobium and SWCNTs powders followed by spark plasma sintering. The final ball-milling (Nb50Ti/SWCNTs) resulted in a very high yield of milled powders, the powder had micron-sized Nb50Ti and a nano-sized (Nb50Ti/SWCNTs).

After the FAST-SPS the obtained material was a small amount of α and major β-type phase. The microstructure and the phase evolution in the sintered Nb50Ti compacts depend on the SWCNTs addition because now diffusion between Nb, Ti and SWCNTs was not observed, and almost complete β-type phase was achieved after sintering at 1473 K. Spark plasma sintering demonstrated the capability to yield fine grained microstructure even after sintering at low temperatures. The grain size of the synthesized Nb50Ti strongly depends on the on the SWCNTs addition, i.e. the grain size of α and β-type phases increases with of amounts of SWCNTs.

Compressive strength and modulus of the FAST-SPS -manufactured β-type phase were 620 ± 6 MPa and 124 ± 2 GPa, respectively, whereas the corresponding values for the intermetallic nanocomposite β-type phase matrix were 650 ± 8 MPa and 130 ± 2 GPa. For each of these properties, the difference in results for the two materials may be attributed to the difference in phase composition and pT.

These findings suggest that the combination of ball-milled of Nb50Ti/SWCNTs powder and FAST-SPS may have promise for use in manufacturing load-bearing metallic orthopaedic components, such as the femoral stem of a hip implant and in superconductor magnets (Poloidal Field Coils) in ITER.

The average hardness increased significantly with increasing of SWCNTs wt% at the sintering temperature 1473 K. The increasing average hardness with increasing of SWCNTs wt% at the sintering temperatures of 1473 K at 0.4 to 0.8 wt% of SWCNTs was attributed to the increasing volume fraction of β-type phase together with the embrittlement of β-type phase due to SWCNTs entrapment in the sintered compacts. In other hand SWCNTs increase the ductility and then the fracture toughness by stopping failler of the materials. The superconducting and wear properties will be performed in the near future.

Acknowledgments

The present work was supported by the Algerian Ministerium of Higher Education and Scientific Research and the PRFU project under contract N° A11N01UN240120220005. These supports are gratefully appreciated.

Conflicts of Interest

The authors declare no conflict of interest.

Declaration of Interests

  • The authors declare that they have no known competing financial interests or personal relationships that could have appeared to influence the work reported in this paper.
  • The authors declare the following financial interests/personal relationships which may be considered as potential competing interests.

References

  1. Attar H, Löber L, Funk A, Calin M, Zhang LC, et al. (2015) Mechanical behavior of porous commercially pure Ti and Ti–TiB composite materials manufactured by selective laser Materials Science and Engineering: A 625: 350-356.
  2. Bönisch M, Stoica M, Calin M (2020) Routes to control diffusive pathways and thermal expansion in Ti-alloys. Scientific Reports 10: 1-9. [crossref]
  3. Attar H, Calin M, Zhang LC, Scudino S, Eckert J (2014) Manufacture by selective laser melting and mechanical behavior of commercially pure titanium. Materials Science and Engineering: A 593: 170-177.
  4. Attar H, Prashanth KG, Chaubey AK, Calin M, Zhang LC, et al. (2015) Comparison of wear properties of commercially pure titanium prepared by selective laser melting and casting processes. Materials Letters 142: 38-41.
  5. Zhang LC, Attar H, Calin M, Eckert J (2016) Review on manufacture by selective laser melting and properties of titanium based materials for biomedical Materials Technology.31: 66-76.
  6. Lekka CE, Gutiérrez-Moreno JJ, Calin M (2017) Electronic origin and structural instabilities of Ti-based alloys suitable for orthopaedic Journal of Physics and Chemistry of Solids 102: 49-61.
  7. Bönisch M, Calin M, Van Humbeeck J, Skrotzki W, Eckert J (2015) Factors influencing the elastic moduli, reversible strains and hysteresis loops in martensitic Ti–Nb alloys. Materials Science and Engineering: C 48: 511-520. [crossref]
  8. Okulov IV, Bönisch M, Okulov AV, Volegov AS, Attar H, et al. (2018) Phase formation, microstructure and deformation behavior of heavily alloyed TiNb-and TiV-based titanium Materials Science and Engineering: A 733: 80-86.
  9. Okulov IV, Volegov AS, Attar H, Bönisch M, Ehtemam-Haghighi S, et al. (2017) Composition optimization of low modulus and high- strength TiNb-based alloys for biomedical Journal of the Mechanical Behavior of Biomedical Materials 65: 866-871. [crossref]
  10. Panigrahi A, Bönisch M, Waitz T, Schafler E, Calin M, et al. (2015) Phase transformations and mechanical properties of biocompatible Ti– Z16.1 Nb processed by severe plastic deformation. Journal of Alloys and Compounds.628: 434-441.
  11. Prashanth KG, Zhuravleva K, Okulov I, Calin M, Eckert J, et al. (2016) Mechanical and corrosion behavior of new generation Ti-45Nb porous alloys implant devices. Technologies 4: 33.
  12. Gennari S, Maglia F, Anselmi-Tamburini U, Spinolo G (2003) SHS (Self-sustained high-temperature synthesis) of intermetallic compounds: effect of process parameters by computer simulation. Intermetallics 11: 1355-1359.
  13. Liu E, Jia J, Bai Y, Wang W, Gao Y (2014) Study on preparation and mechanical property of nanocrystalline NiAl intermetallic. Materials & Design 53: 596-601.
  14. Geist D, Gammer C, Rentenberger C, Karnthaler HP (2015) Sessile dislocations by reactions in NiAl severely deformed at room Journal of Alloys and Compounds.621: 371-377. [crossref]
  15. Liu E, Gao Y, Bai Y, Yi G, Wang W, et al. (2014) Tribological properties of self-lubricating NiAl/Mo-based composites containing AgVO3 Materials Characterization 97: 116-124.
  16. Zhang JF, Shen J, Shang Z, Feng ZR, Wang LS, et al. (2012) Microstructure and room temperature fracture toughness of directionally solidified NiAl–Mo eutectic in situ composites. Intermetallics 21: 18-25.
  17. Zhuravleva K, Bönisch M, Prashanth KG, Hempel U, Helth A, et al. (2013) Production of porous β-Type Ti–40Nb alloy for biomedical applications: Comparison of selective laser melting and hot pressing. Materials 6: 5700-5712. [crossref]
  18. Bocanegra-Bernal MH, Dominguez-Rios C, Echeberria J, Reyes-Rojas A, Garcia-Reyes A, et al. (2016) Spark plasma sintering of multi-, single/double-and single-walled carbon nanotube-reinforced alumina composites: is it justifiable the effort to reinforce them?. Ceramics International 42: 2054-2062.
  19. Moshksar MM, Mirzaee M (2004) Formation of NiAl intermetallic by gradual and explosive exothermic reaction mechanism during ball Intermetallics 12: 1361-1366.
  20. Suryanarayana C (2001) Mechanical alloying and milling. Progress in Materials Science 46: 1-184.
  21. Beyhaghi M, Kiani-Rashid AR, Kashefi M, Khaki JV, Jonsson S (2015) Effect of powder reactivity on fabrication and properties of NiAl/Al2O3 composite coated on cast iron using spark plasma sintering. Applied Surface Science 344: 1-8.
  22. Umanskii AP, Polyarus EN, Ukrainets MS, Kapitanchuk LM (2015) Structure and tribotechnical characteristics of NiAl–CrB2 composite materials and Powder Metallurgy and Metal Ceramics 54: 53-59.
  23. Singla D, Amulya K, Murtaza Q (2015) CNT reinforced aluminium matrix composite-a review. Materials Today: Proceedings 2: 2886-2895.
  24. Alizadeh A, Abdollahi A, Biukani H (2015) Creep behavior and wear resistance of Al 5083 based hybrid composites reinforced with carbon nanotubes (CNTs) and boron carbide (B4C) Journal of Alloys and Compounds 650: 783-793.
  25. Zhang M, Hou X, Wang J, Li M, Hu S, et al. (2014) Interweaved Si@ C/CNTs&CNFs composites as anode materials for Li-ion Journal of Alloys and Compounds 588: 206-211.
  26. Peng T, Chang I (2014) Mechanical alloying of multi-walled carbon nanotubes reinforced aluminum composite powder. Powder Technology 266: 7-15.
  27. Vishlaghi MB, Ataie A (2014) Investigation on solid solubility and physical properties of Cu–Fe/CNT nano-composite prepared via mechanical alloying route. Powder Technology 268: 102-109.
  28. Mazaheri M, Mari D, Hesabi ZR, Schaller R, Fantozzi G (2011) Multi-walled carbon nanotube/nanostructured zirconia composites: outstanding mechanical properties in a wide range of temperature. Composites Science and Technology.71: 939-945.
  29. Pang LX, Sun KN, Ren S, Sun C, Fan RH, et al. (2007) Fabrication and microstructure of Fe3Al matrix composite reinforced by carbon Materials Science and Engineering: A 447: 146-149.
  30. Schmidt R, Pilz S, Lindemann I, Damm C, Hufenbach J, et al. (2017) Powder metallurgical processing of low modulus β-type Ti- 45Nb to bulk and macro-porous compacts. Powder Technology 322: 393-401.
  31. Wang Q, Cui G, Chen H (2021) Effect of the Ta addition on densification and mechanical properties of NbTi alloys prepared by Journal of Alloys and Compounds 868: 159106.
  32. Helth A, Gostin PF, Oswald S, Wendrock H, Wolff U, et al. (2014) Chemical nanoroughening of Ti40Nb surfaces and its effect on human mesenchymal stromal cell response. Journal of Biomedical Materials Research Part B: Applied Biomaterials 102: 31-41. [crossref]
  33. Gostin PF, Helth A, Voss A, Sueptitz R, Calin M, et al. (2013) Surface treatment, corrosion behavior, and apatite‐ forming ability of Ti‐ 45Nb implant Journal of Biomedical Materials Research Part B: Applied Biomaterials 101: 269-278. [crossref]
  34. Zhuravleva K, Bönisch M, Scudino S, Calin M, Schultz L, et al. (2014) Phase transformations in ball-milled Ti–40Nb and Ti–45Nb powders upon quenching from the ß-phase Powder Technology 253: 166- 171.
  35. Kauschke V, Gebert A, Calin M, Eckert J, Scheich S, et al. (2018) Effects of new beta-type Ti-40Nb implant materials, brain-derived neurotrophic factor, acetylcholine and nicotine on human mesenchymal stem cells of osteoporotic and non-osteoporotic PLoS One 13: e0193468. [crossref].
  36. Attar H, Calin M, Zhang LC, Scudino S, Eckert J (2014) Manufacture by selective laser melting and mechanical behavior of commercially pure Materials Science and Engineering: A 593: 170-177.
  37. Helth A, Pilz S, Kirsten T, Giebeler L, Freudenberger J, et al. (2017) Effect of thermomechanical processing on the mechanical biofunctionality of a low modulus Ti-40Nb alloy. Journal of the Mechanical Behavior of Biomedical Materials 65: 137-150. [crossref]
  38. Schmidt R, Hoffmann V, Helth A, Gostin PF, Calin M, et al. (2016) Electrochemical deposition of hydroxyapatite on beta-Ti-40Nb. Surface and Coatings Technology 294: 186-193.
  39. Gostin PF, Helth A, Voss A, Sueptitz R, Calin M, et al. (2013) Surface treatment, corrosion behavior, and apatite‐ forming ability of Ti‐ 45Nb implant Journal of Biomedical Materials Research Part B: Applied Biomaterials 101: 269-278. [crossref]
  40. Zhuravleva K, Chivu A, Teresiak A, Scudino S, Calin M, et al. (2013) Porous low modulus Ti40Nb compacts with electrodeposited hydroxyapatite coating for biomedical applications. Materials Science and Engineering: C 33: 2280-2287.
  41. Abdi S, Oswald S, Gostin PF, Helth A, Sort J, et al. (2016) Designing new biocompatible glass‐ forming Ti75‐ xZr10NbxSi15 (x= 0, 15) alloys: corrosion, passivity, and apatite formation. Journal of Biomedical Materials Research Part B: Applied Biomaterials 104: 27-38.
  42. Hynowska A, Blanquer A, Pellicer E, Fornell J, Surinach S, et al. (2015) Nanostructured Ti‐ Zr‐ Pd‐ Si‐ (Nb) bulk metallic composites: Novel biocompatible materials with superior mechanical strength and elastic recovery. Journal of Biomedical Materials Research Part B: Applied Biomaterials.103: 1569-1579.
  43. Calin M, Helth A, Gutierrez Moreno JJ, Boenisch M, Brackmann V, et al. (2014) Elastic softening of β-type Ti–Nb alloys by indium (In) additions. Journal of the Mechanical Behavior of Biomedical Materials 39: 162-174. [crossref]
  44. Hynowska A, Pellicer E, Fornell J, Gonzalez S, van Steenberge N, et al. (2012) Nanostructured β-phase Ti–31.0 Fe–9.0 Sn and sub-μm structured Ti–39.3 Nb–13.3 Zr–10.7 Ta alloys for biomedical applications: Microstructure benefits on the mechanical and corrosion performances. Materials Science and Engineering: C 32: 2418-2425.
  45. Calin M, Gebert A, Ghinea AC, Gostin PF, Abdi S, et al. (2013) Designing biocompatible Ti-based metallic glasses for implant Materials Science and Engineering: C 33: 875-883.
  46. Gutierrez Moreno JJ, Boenisch M, Panagiotopoulos NT, Calin M, Papageorgiou DG, et al. (2017) Ab-initio and experimental study of phase stability of Ti-Nb Journal of Alloys and Compounds 696: 481-489.
  47. Bendjemil B, Borowiak-Palen E, Graff A, Pichler T, Knupfer M, et al. (2004) Elimination of metal catalyst and carbon-like impurities from single-wall carbon nanotube raw material. Applied Physics A 78: 311-314.
  48. Selbmann D, Bendjemil B, Leonhardt A, Pichler T, Täschner C, et al. (2008) A parametric study of the synthesis and purification of single- walled carbon nanotubes using the high-pressure carbon monoxide Applied Physics A 90: 637-643.
  49. Bendjemil B, Mouyane M, Noudem JG, Bernard J, Reboul JM, et al. (2018) Sintering Behavior and Properties of cBN/TiC/SWCNTs or NC Ceramics Matrix Nanocomposites (CMNC’s) by Field Actived Sparck Plasma Sinter.
  50. Bendjemil B, Noudem JG, Mouyane M, Bernard J, Guhel Y, et al. (2020) Study of the Nanocomposite Mo2C (1-x)-TiC (x)-SWCNTs by Field Actived Sparck Plasma Sintering Journal of Advances in Nanotechnology 1: 30-47.
  51. Le Bail A (1995) Modelling the silica glass structure by the Rietveld method. Journal of Non-Crystalline Solids 183: 39-42.
  52. Moffat DL, Kattner UR (1988) The stable and metastable Ti-Nb phase diagrams. Metallurgical Transactions A.19: 2389-2397.
  53. Zhuravleva K, Bönisch M, Scudino S, Calin M, Schultz L, et al. (2014) Phase transformations in ball-milled Ti–40Nb and Ti– 45Nb powders upon quenching from the ß-phase Powder Technology 253: 166-171.
  54. Zhuravleva K, Scudino S, Khoshkhoo MS, Gebert A, Calin M, et al. (2013) Mechanical Alloying of β‐ Type Ti–Nb for Biomedical Advanced Engineering Materials 15: 262-268.
  55. Zhang DZ, Qin ML, Zhang L, Qu XH (2012) Fabrication and characterization of nanocrystalline Nb–W–Mo–Zr alloy powder by ball milling. International Journal of Refractory Metals and Hard Materials 32: 45-50.
  56. Hempel U, Müller K, Preissler C, Noack C, Boxberger S, et al. (2016) Human bone marrow stromal cells: a reliable, challenging tool for in vitro osteogenesis and bone tissue engineering Stem Cells International 14. [crossref]
  57. Herzer R, Gebert A, Hempel U, Hebenstreit F, Oswald S, et al. (2021) Rolled‐ Up Metal Oxide Microscaffolds to Study Early Bone Formation at Single Cell Resolution. Small 17: 2005527. [crossref]
  58. Vishnu J, Calin M, Pilz S, Gebert A, Kaczmarek B, et al. (2020) Superhydrophilic nanostructured surfaces of beta Ti29Nb alloy for cardiovascular stent Surface and Coatings Technology 396: 125965.
  59. Charifoulline Z (2006) Residual resistivity ratio (RRR) measurements of LHC superconducting NbTi cable IEEE Transactions on Applied Superconductivity 16: 1188-1191.
  60. Fang L, Feng L, Huixian G, Chao C, Bo L, et al. (2015) Comparison and analysis of twist pitch length test methods for ITER Nb3Sn and NbTi Rare Metal Materials and Engineering 44: 2095-2099.
  61. Dresselhaus MS, Dresselhaus G, Avouris P (2001) Carbon Nanotubes Synthesis, Structure, Properties, andApplications.
  62. Ugawa A, Rinzler AG, Tanner DB (1999) Far-infrared gaps in single- wall carbon Physical Review B 60: R11305.
  63. Hilt O, Brom HB, Ahlskog M (2000) Localized and delocalized charge transport in single-wall carbon-nanotube Physical Review B 61: R5129.
  64. Ahn JS, Kim KH, Noh TW, Riu DH, Boo KH, et al. (1995) Effective-medium theories for spheroidal particles randomly oriented on a plane: Application to the optical properties of a SiC whisker-Al2O3 composite. Physical Review B 52: 15244. [crossref]
fig 4

Effects of Photoenhanced Thin Oil Sheens on Survival and Growth of Newly Hatched Fishes: Sheepshead Minnow (Cyprinodon variegatus), spotted seatrout (Cynoscion nebulosus), and Red Drum (Sciaenops ocellatus)

DOI: 10.31038/AFS.2022444

Abstract

The release of polycyclic aromatic hydrocarbons (PAHs), related to oil spills, can have devasting effects on the environment. In the presence of ultraviolet (UV) light, PAHs can be photoenhanced into more toxic compounds, leading to increased toxicity in aquatic organisms as measured by 24-h survival. PAHs cause a suite of physiological consequences particularly in the early stages of fish development due to increased surface area to volume ratios and nascent immune systems. This study compared the impacts of photoenhanced thin oil sheens on the survival and growth of larvae of three ecologically important coastal fish species: sheepshead minnows (Cyprinodon variegatus), red drum (Sciaenops ocellatus) and spotted seatrout (Cynoscion nebulosus). PAH + UV exposure increased the toxicity of thin oil sheens in all three species, with red drum demonstrating the highest sensitivity. An acute oil exposure at 1-2 days post hatch (dph) increased the rate of latent mortality and oxidative stress in sheepshead minnows. Non-photoenhanced oil caused a significant decrease in the growth of 1-2 dph sheepshead minnows and spotted seatrout. Results from this study reveal long-term effects of oil exposure on fish growth and survival, which could lead to better restoration and conservation outcomes for these vital estuarine species.

Introduction

Petroleum can enter waterways through large spills such as the April 2010 Deepwater Horizon (DWH) oil spill and the March 1989 Exxon Valdez shipping container oil spill [1]. More frequently, however, oil is released on smaller scales through industrial discharge, smaller vessel spills, runoff from impervious surfaces, and commercial port usage [2]. Oil pollution can cause physical and chemical changes to the coastal environment, as well as negatively impact the health of marine organisms [3].

Oil contains polycyclic aromatic hydrocarbons (PAHs), which are a group of organic molecules that are composed of fused benzene rings which allow them to be lipophilic, readily bioaccumulated, and have mutagenic and carcinogenic properties [4-7]. The effects of PAHs, especially those found in crude oil, on marine organisms have been extensively researched and the documented effects are widespread across a wide range of organisms [8-26]. Effects such as deformities, reduced growth and reproduction, genetic and behavioral changes, and altered physiological functions have been seen in invertebrates, as well as vertebrate species.

Although, PAHs alone have negative impacts on marine life, certain abiotic factors can increase the toxicity of PAHs. In particular, ultraviolet (UV) light has been shown to potentially make PAH compounds in fresh oil products up to 1000x more toxic than the original structure of the compound [27-33]. UV light can create enhanced toxicity via two mechanisms: photosensitization or photomodification [29]. Photosensitization occurs when an organism is exposed to UV light after biouptake of PAHs. PAH molecules within the organism’s tissues will absorb the UV light and promote electrons to enter an excited-state orbital. Alternatively, photomodification occurs when UV light oxidizes PAH molecules in the water column, forming more toxic molecules. The photomodified products can then be incorporated into the surrounding biota [29]. Studies of the interaction of UV light and PAHs in oil have documented increased toxicity and mortality in invertebrate and vertebrate larvae after short-term exposure [4,28,32-46]. Other documented effects of oil exposed larvae include damage to cell membranes through lipid peroxidation [30,44,47].

The present study used three larval estuarine fish, red drum, spotted seatrout, and sheepshead minnows, to examine and compare the effects of a co-exposure to PAH + UV light and PAH alone. Red drum, spotted seatrout, and sheepshead minnows are all ecologically important species, as they are prey items for larger fish, crustaceans, and wading birds [48,49]. In addition, red drum and spotted seatrout also have recreational and commercial significance among the Atlantic and Gulf of Mexico coasts [50-52]. Fish early life stages are particularly vulnerable to oil pollution because of the increased capacity for contaminant uptake due to greater surface area to volume ratios, increased metabolic rates, and less developed immune systems. In addition, many larval fish lack pigmentations and are often found at the surface making them particularly liable to UV light from sunlight, surface oil, and oil that has dispersed and dissolved in the water column [29,35,44,53,54].

Although photoenhanced oil effects on fish mortality are well known, few studies have sought to examine potential latent sublethal effects. While some research has focused on effects of water-accommodated fractions (WAF) of oil, thin oil surface sheens enhanced by UV light often are in direct contact with many newly hatched fish species. Therefore, this study’s primary aim was to compare the effects of thin oil sheens and UV light on the larval stages of red drum, spotted seatrout, and sheepshead minnows by examining endpoints of 24-hour mortality, latent mortality, growth metrics, and oxidative stress. The results of this study may be used to inform oil spill mitigation decisions and inform the assessment of impacts and ecosystem dynamics after an oil exposure.

Materials and Methods

Test Species

Red drum and spotted seatrout eggs (~12 h post fertilization (hpf)) were obtained from the Marine Resources Research Institute (MRRI), Mariculture division, of the SC Department of Natural Resources (SCDNR) in Charleston, SC during spawning months of April-May for spotted seatrout and July-October for red drum. The eggs were transferred to the NOAA National Centers for Coastal Ocean Science Charleston laboratory. After arrival, temperature, dissolved oxygen, and pH of the egg transfer water was measured, and aeration was provided. Viable eggs were transferred to four 10 -L tanks of seawater (35 ppt and 25°C) and allowed to hatch. The seawater was collected from Charleston Harbor, and polished via sand filtration, UV sterilization, and 5 µm nominal filtration. Adult sheepshead minnows were collected from a local tidal pond located on the Hollings Marine Laboratory property (N 32° 74′ 82.24”; W 79° 90′ 12.35”) using minnow traps. Adult fish were acclimated to laboratory conditions for 24 hours and then placed in spawning chambers within 75 -L aquariums (20 ppt and 25°C). Fish were fed Tetramin® fish flakes daily. Egg collection trays were used to retrieve eggs produced. Eggs were then transferred to shallow glass finger bowls and allowed to hatch. Larval sheepshead minnows were fed newly hatched brine shrimp (Artemia salina) prior to testing.

Initial PAH + UV Light Exposure

Fish larvae were used in experimental testing at 1-2 dph (Institutional Animal Care and Use Committee 2018-009). Eight to ten larvae were placed in 270 mL glass crystallizing dishes with 200 mL of 20 ppt (sheepshead minnows) or 35 ppt (red drum and spotted seatrout) seawater. Tests were run in two environmental incubators set at 25°C (Percival Scientific IntellusUltra C8) – one for PAH + UV exposures and one for PAH exposures. PAH + UV conditions were established using T5 AgroMax UV-A PLUS bulbs, whereas PAH conditions used cool-white fluorescent bulbs. PAH photoperiod was set at 16 h light:8 h dark while the PAH + UV photoperiod was set at 4 h UV:12 h light:8 h dark (red drum and seatrout) or 8 h UV:8 h light: 8 h dark (sheepshead minnow). Preliminary UV light threshold tests were conducted prior to the initial oil and UV light experiments to obtain the UV photoperiods for each fish species. Measures of irradiance (µW/cm2) of UV-A (λ= 380 nm) light exposures were taken using a miniature spectrometer (Ocean Optics Flame Series). A total integrated average dose was calculated for each 4 h and 8 h period of UV light by multiplying the average instantaneous irradiance measurements by the photoperiod in seconds.

Once placed in the incubator, fresh Louisiana Sweet Crude (LSC) oil was pipetted onto the surface of the water in the dishes containing the fish larvae to achieve an oil sheen. A range of sheen thicknesses (0.25, 0.5, 1.0, 2.0, and 4.0 µm) was tested dependent on sample number and a hypothesized estimated range that each species could tolerate. The equation (V=πr2h) was used to determine the volume (V) of oil needed to achieve the desired sheen thickness (h) using the radius (r) of the container; 1.42 µL, 2.84 µL, 5.67 µL, 11.34 µL, and 22.68 µL, respectively. Three to five replicates were used for each oil treatment and control. The test was run under static conditions with no renewal of the oil or seawater for 24 hours. After removal at the end of the test, if control fish mortality was ≤ 20%, all fish treatments were transferred for the grow-out phase. Water quality (temperature, pH, dissolved oxygen, and salinity) was measured from one replicate of each treatment at the end of the experiment.

Grow-out Phase Setup and Growth Measurements

Fish that survived the 24 h oil exposure were transferred to 200 mL of clean seawater in 237 mL polyethylene jars in the No UV incubator with a 16 h light:8 h dark light cycle. Each jar had a hole drilled in the lid for oxygen exchange. Water changes and feeding occurred daily. Spotted seatrout and red drum were initially fed rotifers followed by a mixture of rotifers and brine shrimp and then brine shrimp only. Sheepshead minnows and 12 dph spotted seatrout and red drum were fed brine shrimp ad libitum. Mortality was assessed daily, along with any behavior changes or any morphological deformities.

The fish grow out period was terminated after 30 days. Photo documentation was done utilizing Image-Pro Premier 9.2 64-bit software. Individual fish wet weight (mg) was recorded and the whole fish was frozen at -80°C for lipid peroxidation assay. Total body length (mm), total body depth (mm), and total ocular diameter (mm) were measured and recorded. The length was measured from the anterior to the posterior peduncle excluding the caudal fin. The depth was measured from dorsal to ventral behind the gill opening. The ocular diameter was measured across the maximum length of the retina.

Oxidative Stress: Lipid Peroxidation Assay

Lipid peroxidation activity was assessed using the malondialdehyde (MDA) method (modified from [55]). Whole fish tissues were kept frozen and homogenized on ice in potassium phosphate (K2PO4) buffer (1:4 wet weight to volume ratio) using a Pro Scientific model Pro 200 motor with a 20 mm x 150 mm stainless steel rod for a minimum of 30 sec. Samples were then centrifuged at 13,000 x g for 5 min at 4°C. Aliquots of 1400 µL of 0.375% thiobarbituric acid/15% trichloroacetic acid and 14 µL of 2% butylated hydroxytoluene were added to new microcentrifuge tubes along with 100 µL of the centrifuged supernatant for each sample, including 100 µL of K2PO4 buffer as a blank. A 10 mM stock solution of MDA was previously heated for 1 h at 50°C and allowed to cool to room temperature before generating standards. A secondary solution of 3200 µM MDA was used to prepare serial dilutions from 800 µM to 6.25 µM using K2PO4 buffer. All samples, standard tubes and the blank were vortexed and placed in a hot plate at 92°C for 15 minutes. Once heated, all tubes were centrifuged at room temp for 5 min at 13,000 x g. Aliquots of 300 µL supernatant for each sample, standard and a blank were loaded in triplicates in a clear Corning 96-well plate. Absorbance was measured with a Bio-Tek µQuant MQX200 microplate spectrophotometric reader at 532 nm in conjunction with Bio-Tek KC junior software. Absorbance readings for each sample and serial dilution were adjusted by subtracting from the blank value and the slope of the standard line was used to determine the amount of MDA in nmol/g (wet weight).

Chemical Analysis of Water Samples

Additional treatment containers without fish were setup for oil chemical analysis. Water samples from beneath the oil sheens (both PAH + UV and PAH) were collected via Teflon tubing siphons taped to the side of each glass crystallizing dish prior to the start of the experiment. Samples were analyzed for PAH concentrations according to methods detailed in [56]. Briefly, each sample was acidified to a pH of 2 using 18% hydrochloric acid (HCl) and then transferred to separatory funnels to undergo liquid/liquid extraction. The samples were spiked with isotopically labeled PAH internal standards, then solvent extracted three times, once with dichloromethane, once with 50:50 dichloromethane/hexane, and once with hexane. After extraction, samples were passed through GF/F paper containing anhydrous sodium sulfate, concentrated in a water bath, cleaned up using silica solid phase extraction (SPE) (Phenomenx Strata SI-1 Silica 500 mg/3 mL) and analyzed using gas chromatography/mass spectrometry (GC/MS). Samples were processed using an Agilent Technologies 6890/5973 GC/MS containing a DB17ms analytical column (Agilent J & W 60 m x 0.25 mm x 0.25 µm). Samples were introduced into the instrument through a split/splitless inlet operated in splitless mode. The mass spectrometer was operated in electron impact ionization (EI) and selected ion monitoring (SIM) modes. Samples were analyzed using Agilent Technologies MSD Chemstation Version E.02.02.1431 software. Total PAH (tPAH50) in this present study is reported as the sum of 50 parent and alkylated PAHs.

Statistical Analysis

Median lethal concentrations (LC50) and 10% lethal concentrations (LC10) were calculated from the 24 h exposures using SAS Probit Analysis (parametric data) [57] or Trimmed-Spearman Karber Analysis (nonparametric data) [58]. The lowest observable effect concentration (LOEC) values, 24 h exposure mortality, latent mortality, and all growth parameters (lengths, depths, ocular diameter, weights) were analyzed first using two-factor analysis of variance (ANOVA)(alpha=0.05) with interaction tests, the two factors being light treatment (UV or No UV) and PAH concentration. If no interactive effect was observed, a one–factor ANOVA (alpha=0.05) was used to further analyze the data. In the event that the assumptions of the parametric statistics were not met, a nonparametric Kruskall-Wallis (alpha=0.05) was used instead. Normality was assessed for all tests using histogram plots and a Shapiro Wilks test (alpha=0.05) and homogeneity of variance was assessed using a Levene’s test (alpha=0.05). Cook’s D and studentized residuals calculations were also used to determine cases of influential data within a specific endpoint. If a mortality endpoint or growth parameter measurement had a Cook’s D number > 4/n  or a studentized residual number with an absolute value >3, the data point was deemed an influential observation and removed [59,60]. Lastly, a William’s Test for a Monotonic Trend was used to evaluate if there was a significant trend among the different light treatments and PAH concentrations for calculated MDA concentrations.

Results

Fish Mortality of Red Drum, Sheepshead Minnows, and Spotted Seatrout after 24 H Oil Exposure With and Without UV Light

The mean tPAH50 concentrations for each oil sheen thickness for all three species were calculated (Table 1). There was a positive correlation between the tPAH50 concentrations obtained from analysis of the water samples and the oil sheen thicknesses used in this study. Larval 1-2 dph red drum mortality was significantly affected (ANOVA; p=0.0388) at 14.47 µg/L (4.0 µm sheen) tPAH50 without UV light, however all oil treatments showed significant mortality with UV light (Figure 1). The LC10 value with No UV light was 1.35 µg/L tPAH50. When tested with UV light, survival was affected at significantly lower oil concentrations (≥3.0 µg/L tPAH50, 0.5 µm sheen) and the LC10 value was reduced to 0.59 µg/L tPAH50 (95% C.I. = 0.0002, 1.4942). UV light alone did not significantly affect fish survival (fluorescent light seawater control versus UV light seawater control). There was a significant interaction between oil and light for the overall ANOVA model (p<0.0001) and between the treatment levels (Figure 1).

Table 1: The measured mean tPAH50 (µg/L) for each oil sheen thickness. n is the number of samples used for each oil sheen thickness.

table 1
 
fig 1

Figure 1: Percent mortality after 24 h for PAH and PAH + UV light treatments of 1-2 dph red drum (n=400) exposed to 4 hours of UV light and averaged oil sheen tPAH50 concentrations of 3.0 µg/L, 5.26 µg/L, and 14. 47 µg/L. Two influential data points were removed from the set. Asterisks and corresponding p-values for that treatment indicate a statistical significant difference from that light treatment’s control (0 µg/L).

In PAH + UV exposures, there was a significant effect (ANOVA; p=0.0095) on 1-2 dph spotted seatrout mortality at the highest concentration tested of 5.26 µg/L tPAH50 (1.0 µm sheen) (Figure 2). Additionally, for PAH and PAH + UV treatments below 5.26 µg/L, no significant effect was observed within 24 h on 1-2 dph spotted seatrout survival and there was no significant interaction between light and oil factors.

fig 2

Figure 2: Percent mortality after 24 h for the PAH and PAH + UV light treatments of 1-2 dph spotted seatrout (n=240) exposed to 4 hours of UV light and averaged oil sheen tPAH50 concentrations of 2.75 µg/L, 3.0 µg/L, and 5.26 µg/L. The asterisk and corresponding p-value indicate a statistical significant difference from the UV control (0 µg/L) treatment.

For 1-2 dph sheepshead minnows, there was a significant increase (ANOVA; p=0.0295) in mortality at the highest exposure dose, 7.45 µg/L tPAH50 (Figure 3), for the PAH + UV treatments. There was no significant effect on survival after a 24 h exposure to oil sheen thicknesses ≤ 2.0 µm (7.45 µg/L tPAH50) (Figure 3). No significant effect was observed at any oil sheen concentration in the PAH treatments. The 24h LC50 value for PAH + UV exposure was 6.80 µg/L (95% C.I. = 6.34, 7.29).

fig 3

Figure 3: Percent mortality after 24 h for the PAH and PAH + UV light treatments of 1-2 dph sheepshead minnows (n=240) exposed to 8 hours of UV light and averaged oil sheen tPAH50 concentrations of 3.0 µg/L, 5.26 µg/L, and 7.45 µg/L. The asterisk and corresponding p-value indicates a statistical significant difference from the UV control (0 µg/L) treatment.

When comparing PAH + UV effects in all three species, 1-2 dph red drum had a LOEC of 3.0 µg/L and a LC10 value of 0.59 µg/L (95% C.I. = 0.0002, 1.4942), 1-2 dph spotted seatrout had a LOEC of 5.26 µg/L and a LC10 value of 0.75 µg/L (95% C.I. = ND), and 1-2 dph sheepshead minnows had a LOEC of 7.45 µg/L and a LC10 value of 5.41 µg/L (95% C.I. = -1063.83, 6.47). Exposure to UV light increased the toxicity of oil in all species. Larval red drum were the most sensitive species tested among the three.

Latent Mortality after Initial 24 H Oil Exposure with and without UV Light

To examine the latent effects of a 24 h oil and/or UV exposure, surviving fish were moved to clean seawater and mortality was reassessed after 7 days. The number of surviving fish varied among treatments. In larval sheepshead minnows that were grown out in fresh seawater, a higher mortality was observed among the PAH + UV light treatments versus the PAH treatments compared to the controls, however, there was no significant difference calculated (Figure 4). In other larval fish examined for latent mortality, the spotted seatrout displayed 96% mortality in all treatments at and above 3.0 µg/L. In larval red drum, 100% mortality occurred in all treatments including the controls after 5 days, preventing growth measurements.

fig 4

Figure 4: Latent percent mortality at 7 days post transfer to clean seawater for the PAH and PAH + UV light treatments of sheepshead minnows (n=178) previously exposed at 1-2 dph to 24 hours of averaged tPAH50 concentrations of 3.0 µg/L, 5.26 µg/L, and 7.45 µg/L and 8 hours of UV light.

Growth of Sheepshead Minnows and Spotted Seatrout after Initial 24 H Oil Exposure with and without UV Light

Average lengths, depths, ocular diameters, and weights were determined for fish at 30-31 dph to assess effects of short-term PAH + UV light exposure on growth. An initial 24 h oil exposure at 1-2 dph yielded significant effects on sheepshead minnow growth. Average length, depth, ocular diameter and weight at 30-31 dph were all significantly reduced in PAH treatments at tPAH50 concentrations of 5.26 µg/L and greater (Table 2). Similar results were seen with the PAH + UV treatments, although ocular diameter was not significantly different from the control.

Table 2: Mean growth measurements for the PAH and PAH + UV light treatments of 30-31 dph sheepshead minnows (n=129) exposed at 1-2 dph to 24 hours of average tPAH50 concentrations of 3.0 µg/L, 5.26 µg/L, and 7.45 µg/L and 8 hours of UV light. Six influential data points were removed. Bolded numbers with an asterisk indicate a statistical significant difference from that light treatment’s control. There were significant differences from the controls among the 5.26 µg/L and 7.45 µg/L PAH concentrations in all growth measures but there was no significant interactive effect between light and PAH concentration.

table 2
 

When spotted seatrout were exposed at 1-2 dph to an initial 24 h oil exposure, significant decreases in average size (length and depth) and weight were seen after 30 days at tPAH50 concentrations of 2.75 µg/L (PAH + UV and PAH) compared to its control (Table 3). Overall, for both PAH + UV and PAH treatments, sheepshead minnows and spotted seatrout had decreased growth as PAH concentration increased with effects threshold starting at 5.26 µg/L and 2.75 µg/L, respectively. Growth measurements for red drum were unavailable due to 100% latent mortality 5 days after the transfer.

Table 3: Mean growth measurements for the PAH and PAH + UV light treatments of 30-31 dph spotted seatrout (n=31) exposed at 1-2 dph to 24 hours of average tPAH50 concentrations of 2.75 µg/L, 3.00 µg/L, and 5.26 µg/L and 4 hours of UV light. N/A indicates almost 100% latent mortality in that treatment after the initial exposure of oil and light. One influential data point was removed. Bolded numbers with an asterisk indicate a statistical significant difference the No UV control. There were differences between the controls and the 2.75 µg/L PAH concentration for No UV and UV treatments but there was no significant interactive effect of light and PAH concentration.

table 3
 

Oxidative Stress of Sheepshead Minnows after Initial 24 H Oil Exposure with or without UV Light

Oxidative stress was only assessed in larval sheepshead minnows due to the high latent motality in larval red drum and spotted seatrout. There was a significant upward trend (William’s Test; p<0.0001) of MDA concentrations in the PAH + UV light treatments of 30-31 dph sheepshead minnows exposed as larvae but none in the PAH light treatment (Figure 5).

fig 5

Figure 5: Mean MDA concentration for the PAH and PAH + UV light treatments of 30-31 dph sheepshead minnows (n=129) exposed at 1-2 dph to 24 hours of averaged tPAH50 concentrations of 3.0 µg/L, 5.26 µg/L, and 7.45 µg/L and 8 hours of UV light. Three influential data points were removed.

Discussion

Sheepshead minnows were most resilient to oil exposures with and without UV light, compared to spotted seatrout and red drum. Both of the latter species have reproductive strategies which include releasing thousands of eggs with each spawn, followed by high larval mortality [50,61]. This spawning strategy makes these species more sensitive to variable environmental factors, and made it difficult to use these species for toxicity assessment in a laboratory environment. Another factor that contributes to greater resilience in sheepshead minnows is the buoyancy of each larval species. Both red drum and spotted seatrout obtain nutrients through a yolk sac the first three days of life making them more positively buoyant than sheepshead minnows. This strategy makes the former species more likely to have an exposure to UV light at the surface. The fragility of the red drum and seatrout larvae has ecological importance, since these fishes are managed by NOAA, targeted by recreational fishers and are among the most sensitive to oil [62]. Increased large external stressor mortality, such as an oil spill, could lead to potential reductions in population size.

24 h Mortality

All three species, red drum (LC10 = 0.59 µg/L), spotted seatrout (LC10 = 0.75 µg/L), and sheepshead minnows (LC10 = 5.41 µg/L) exhibited PAH + UV light enhanced mortality in a 24 h acute exposure. The differences in species sensitivity are most likely due to life history strategies and habitat utilization. Estuaries are known to be harsh environments to extreme variation in environmental conditions and long-term accumulation of pollutants. Sheepshead minnows have adapted biological mechanisms such as the ability to withstand hypoxic and heavily contaminated conditions, as well as large temperature changes [63]. This demonstrates their tolerance to these dynamic estuarine conditions, making it the most resilient among the three. Although an LC50 value could not be calculated due to treatment mortality ≥ 50 % in red drum larvae, the significant mortality threshold (<3.0 µg/L) and LC10 value (0.59 µg/L) were similar to findings in [35]. [35], though using HEWAFs instead of oil sheens, observed an LC50 value of 3.42 µg/L for 1-2 dph red drum larvae exposed to PAH + UV, with significant mortality in PAH concentrations at and above 3.13 µg/L. This present study found an LC50 value could not be calculated for 1-2 dph spotted seatrout at the concentrations tested, however the LC10 value (0.75 µg/L) was within the range of effects reported by [35], which determined an LC50 value of 0.827 µg/L. Differences in LC50 value sensitivity and threshold mortality among the studies could be due to many different factors such as: experimental setup variance, UV exposure time, wavelength of UV light, intensity of UV, oil exposure type, concentration, and water conditions, such as temperature or salinity[42,44,64,65]. For example, preliminary UV threshold testing with red drum and spotted seatrout obtained from the SCNDR revealed <100% treatment survival at 4 hours of UV exposure (23.80 ± 17.22 µW/cm2). [35] used 6 h durations of natural UV allowing more time and UV wavelengths for photoenhancement to occur, potentially causing the mortality to be different than the mortality at 4 hours observed in this study. Additionally, the larvae used for each of these studies came from two different individual adult broodstock populations with potentially distinct environmental adaptations and sensitivities.

Latent Mortality

All species tested exhibited latent mortality after the initial exposure. Latent mortality after oil exposures is an often overlooked and underestimated endpoint despite the importance it may play in assessing development, survival, and population structure later in life [66]. [67] found a 25-77% reduction in survival of larval bay anchovies 6 days following a 24 h exposure to Macondo source oil. Similarly, larval coral reef fish exposed to low doses of PAHs in oil for 24 hours showed a significant increase in latent mortality [68]. In a pilot study performed by [69], pink salmon embryos exposed to Exxon Valdez oil, released into the wild, and then recaptured 2 years later exhibited a 15% reduction in survival. Although these three other studies did not test with an added UV factor, the findings from this present study were similar in that those fish exposed to thin oil sheens led to an increase in mortality several days to a week after exposure and decreased survival rates. With the added UV factor in this present study, it was demonstrated that fish exposed to thin oil sheens and UV light in one event could lead to a greater increased mortality rate in higher oil sheen exposures weeks later. This could potentially lead to reductions in survival rates over years like those seen in [69], and also changes in population structure.

Growth Parameters

Exposures to oil sheens for a 24 h period at and above 5.26 µg/L at 1-2 dph (UV and No UV light) had an impact on the lengths, weights, depths, and ocular diameters 30 days later in sheepshead minnows. Significant decreases in average size (length and depth) and weight were seen 30 days after exposure to tPAH50 concentrations of 2.75 µg/L (UV and No UV light) in spotted seatrout. Similar to the results found in this study, [70] found that sheepshead minnow larvae experienced significantly reduced lengths (5-13% reduction) and wet weights (13-35% reduction) with a long term exposure to LSC oil in sediment. Reduced wet weight has also been seen after a 28-day exposure to Macondo source oil in inland silversides [71].

In this present study, ocular diameter in sheepshead minnows was also affected but only in the 5.26 µg/L and 7.45 µg/L PAH treatments. Research conducted by [72] and [15] both found that the length of the retina and lens area, respectively, were smaller in oil treated larval zebrafish. [22] also found that there was a 11% and 15% decrease in lens diameter of 11 dph red drum and 8 dph sheepshead minnows, respectively, after a 24 h oil exposure prior to hatch.

No reductions in growth were observed between light treatments. This may be explained by the concentration of napthalenes and fluorenes in LSC and MC252 oil, which have low potential for phototoxicity [8,29,73]. [29] found that phototoxic compounds of oil appear to be restricted to specific PAHs with three to five fused benzene rings. LSC and MC252 oil have been shown to have a high concentration of naphthalenes and fluorenes, PAHs with only two benzene rings [8,73], suggesting the main oil components in this study have a low potential to become phototoxic. LSC contains relatively- high concentrations of phenanthrene, a compound with three benzene rings, thus, while photoenhanced toxicity was observed in the initial 24 h of LSC oil sheen exposures, the increased effect did not extend to long term effects on fish growth. Several studies, including [10,12,17,69,74], found that weathered oil, which typically contains more degradation, metabolites, and PAHs with three or more rings, is more likely to cause sublethal effects such as cardiac, ocular, and circulatory defects. Future studies should consider using crude oils containing higher proportions of PAHs with three or more rings to explore the interactive effect between PAH + UV on growth. Another potential cause of no reductions of growth after an exposure to PAH + UV light is the mechanism of action. Parent PAHs are typically those with three to four benzene rings and those that could be uptaken through bioaccumulation and photomodification mode of action and cause the associated cardiac effects. In this present study, if the mode of action that occurred was photosensitization, reactive products that were created within the larval fish’s body caused oxidative damage rather than associated growth effects. Therefore, growth may be a less relevant toxic endpoint for oil and UV exposures.

Although anecdotal, and not specifically recorded as an endpoint, throughout the grow-out phases for all species, there was noticeable swimming and behavioral impairments, such as swimming in circles and trouble maintaining position in the water column that lasted until the conclusion of the grow-out phase or became precursors to mortality. [75] saw a similar trend in larval fish which were previously exposed to oil and then removed to clean water. They started to exhibit melanosis, less mobility, reduced startle response, erratic swimming patterns, and loss of equilibrium. [21] also saw decreased swimming performance in 25 day old mahi-mahi exposed to comparable PAH concentrations (1.2 µg/L) upon hatching. Research conducted by [76] shows that these types of behaviors are indicative of narcosis and typical of high short-term naphthalene dominated oil exposures, such as MC252 oil. Fish from this present study may have dealt with the same type of narcosis. This reveals that fish that do not experience significant mortality initially may still succumb to behavioral changes later on in life with the potential to affect prey-predator dynamics [11]. Future studies may consider tracking fish behavior to support this claim.

Oxidative Stress

MDA is one of the byproducts seen from an increase in free radicals and therefore, is often used as a biomarker to measure damage due to oxygen radical formation. Mean MDA concentrations for 30-31 dph sheepshead minnows exposed to PAH + UV at 1-2 dph were higher for all UV plus oil treatments when compared to fish exposed to oil treatments alone. Moreover, the highest mean levels of MDA production occurred in the 2 µm UV exposed sheen (tPAH50 concentration of 7.45 µg/L) and there was a significant upward increasing trend of MDA concentrations in the UV treatments. Ultimately, this demonstrates that fish had undergone oxidative stress and the effects remained 30 days after the exposure was ended. Similarly, [75] found there was increased lipid peroxidation occurring in pink salmon gill tissue in fish exposed to oil, UV, and oil plus UV. [77] also found that bluegill sunfish (40-55 g) exposed to concentrations of a PAH plus UV, produced a higher concentration of MDA than any other of their treatment groups tested. PAHs accumulate in fish tissues through passive diffusion across the gills, absorption through the skin, and through ingestion [44]. Since 1-2 dph sheepshead minnows have little to no pigment, UV light is easily able to penetrate a larval body, interact with PAHs, create reactive oxygen species, and cause chain reactions with the potential to damage cell membranes through various modes of action [30,78-81]. Cell membrane damage has physiological and immune health implications, such as latent mortality and impaired growth, as observed in this present study. These effects play a role in the survival and fitness of early life-stages and consequently, could have the potential to impact community structure if population dynamics are shifted due to increased early life mortality.

Conclusions

The effects of thin oil sheens demonstrated in this study occurred at environmentally relevant concentrations and are important due to the observed associated consequences of exposure to PAHs from thin sheens rather than WAFs. LOEC concentrations ranged from 3.0 (0.5 µm) to 7.45 (2.0 µm) µg/L tPAH50 for the species tested, which are well within in the lower range of tPAH50 concentrations reported during the Deepwater Horizon oil spill and effect concentrations in other studies [35,82]. The UV-A (λ=380 nm) instantaneous light readings measured in this study ranged from 7.74 µW/cm2 to 41.55 µW/cm2 with a total average of 23.80 ± 17.22 µW/cm2 and a total integrated average dose of 685.44 mW s/cm2 for 8 hours and 342.72 mW s/cm2 for 4 hours [35]. These measurements are relatively lower when compared to other studies, but the integrated 8 hour dose still falls within the range of UV light measurements encountered in Gulf of Mexico surface waters during Deepwater Horizon oil spill [83].

The implications of larval exposure to PAH + UV related toxicity are important to understand because they may have an effect on individual fish, population changes and ultimately, community structure. As demonstrated by this study, a combination of thin oil sheens and UV can have acute mortality effects on sheepshead minnows, red drum and spotted seatrout and latent mortality effects on sheepshead minnows. Exposure to oil sheens alone can still impact physiological processes that result in oxidative stress in sheepshead minnows and decreased growth in sheepshead minnows and spotted seatrout. Small changes that decrease larval fish survival and fitness can detrimentally impact the interconnected predator- prey dynamic of an ecosystem and even impact human activities such as recreational fishing.

This present study demonstrates that some, but not all, estuarine fish acutely exposed to oil have immediate and long-term consequences for survival and growth associated with short-term exposure. Co-exposure of oil with UV light significantly increased oil toxicity for all three species tested. Short-term (24 h) oil exposures induced sublethal effects 30 days later on fish growth (reduced lengths, depths, weights, and ocular diameters) and increased oxidative stress. The oil rainbow sheens, and water concentrations used for this research are similar to environmentally relevant concentrations that can be seen in estuarine waterways and therefore, the results from this present study represent possible outcomes for larval fish exposed to combinations of UV light and oil sheens or oil sheens alone in their first few days of life.

Acknowledgements

This project would not have been possible without the generous provision of red drum and spotted sea trout eggs from Aaron Watson and staff at the SC Department of Natural Resources Mariculture Division. Graduate student support for Danielle Beers was provided by the College of Charleston and the Slocum Lunz Foundation. We appreciate the assistance of the NCCOS Ecotoxicology Branch staff who provided support for this project including Pete Key, Blaine West, and James Daugomah. The NOAA, National Ocean Service does not approve, recommend, or endorse any proprietary product or material mentioned in this publication. The use of larval fish species for this project was approved under the College of Charleston’s Institutional Animal Care and Use Committee (2018-009).

Statements and Declarations

Funding

The authors declare that no funds, grants, or other support were received during the preparation of this manuscript.

Competing Interests

The authors have no relevant financial or non-financial interests to disclose.

Declarations of Interest

The authors have no personal/financial interest or belief that would affect their objectivity.

Ethical Approval

The use of larval fish was approved under the College of Charleston’s Institutional Animal Care and Use Committee (2018-009). All authors followed ethical and professional standards in the completion of this research study.

Consent to Participate

All authors consent to participate in this research study.

Consent to Publish

All authors consent to have this manuscript published.

References

  1. Incardona JP, Swarts TL, Edmunds RC, Linbo TL, Aquilina-Beck A, et al. (2013) Exxon Valdez to Deepwater Horizon: Comparable toxicity of both crude oils to fish early life stages. Aquat Toxicol 142-143: 303-316.
  2. Transportation Research Board and National Research Council (2003) Oil in the Sea III: Inputs, Fates and Effects. Washington, DC: The National Academies Press.
  3. Yuewen D, Adzigbli L (2018) Assessing the impact of oil spills on marine organisms. J Oceanogr Mar Res 6: 1.
  4. Alloy M, Baxter D, Stieglitz J, Mager E, Hoenig R, et al. (2016) Ultraviolet radiation enhances the toxicity of Deepwater Horizon oil to mahi-mahi (Coryphaena hippurus) embryos. Environ Sci Technol 50: 2011- 2017. [crossref]
  5. Baumard P, Budzinski H, Garrigues P, Sorbe JC, Burgeot Y, et al. (1998) Concentrations of PAHs (polycyclic aromatic hydrocarbons) in various marine organisms in relation to those in sediments and to trophic level. Mar Pollut Bull 36: 951-960.
  6. Weinstein JE (1996) Anthropogenic impacts on salt marshes-A review. In: (eds) Sustainable Development in the Southeastern Coastal Zone, eds. Vernberg FJ, Vernberg WB, Siewicki T, 20:135-170. Columbia, SC: Belle W. Baruch Library of Marine Science University of South Carolina.
  7. Xue W, Warshawsky D (2005) Metabolic activation of polycyclic and heterocyclic aromatic hydrocarbons and DNA damage: a review. Toxicol Appl Pharmacol 206: 73-93. [crossref]
  8. Almeda R, Wambaugh Z, Wang Z, Hyatt C, Liu Z, et al. (2013a) Interactions between zooplankton and crude oil: toxic effects and bioaccumulation of polycyclic aromatic hydrocarbons. PLoS one 8: e67212.
  9. Almeda R, Baca S, Hyatt C, Buskey E (2014) Ingestion and sublethal effects of physically and chemically dispersed crude oil on marine planktonic copepods. Ecotoxicology 23: 988-1003.
  10. Carls MG, Rice SD, Hose JE (1999) Sensitivity of fish embryos to weathered crude oil: Part 1. Low-level exposure during incubation causes malformations, genetic damage, and mortality in larval pacific herring (Clupea pallasi). Environ Toxicol Chem 18: 481-493.
  11. Carvalho PSM, Kalil DCB, Novelli GAA, Bainy ACD, Fraga APM (2008) Effects of naphthalene and phenanthrene on visual and prey capture endpoints during early stages of the dourado Salminus brasiliensis. Mar Environ Res 66: 205-207. [crossref]
  12. Diamante G, Muller GAS, Menjivar-Cervantes N, Xu EG, Volz DC, et al. (2017) Developmental toxicity of hydroxylated chrysene metabolites in zebrafish embryos. Aquat Toxicol 189: 77-86. [crossref]
  13. Dubansky B, Whitehead A, Miller JT, Rice CD, Galvez G (2013) Multitissue molecular, genomic, and developmental effects of the Deepwater Horizon oil spill on resident gulf killifish (Fundulus grandis). Environ Sci Technol 47: 5074-5082. [crossref]
  14. Frometa J, DeLorenzo ME, Pisarski E, Etnoyer PJ (2017) Toxicity of oil and dispersant on the deep water gorgonian octocoral Swiftia exserta, with implications for the effects of the Deepwater Horizon oil spill. Mar Pollut Bull 122: 91-99.
  15. Huang L, Wang C, Zhang Y, Wu M, Zuo Z (2013) Phenanthrene causes ocular developmental toxicity in zebrafish embryos and the possible mechanisms involved. J Hazard Mater 261: 172-180. [crossref]
  16. Huang L, Zuo Z, Zhang Y, Wu M, Lin JJ, et al. (2014) Use of toxicogenmoics to predict the potential toxic effect of benzo(a)pyrene on zebrafish embryos: Ocular developmental toxicity. Chemosphere 108: 55-61. [crossref]
  17. Incardona JP, Collier TK, Scholz NL (2004) Defects in cardiac function precede morphological abnormalities in fish embryos exposed to polycyclic aromatic hydrocarbons. Toxicol Appl Pharmacol 196: 191-205. [crossref]
  18. Incardona JP, Gardner LD, Lindo TL, Brown TL, Esbaugh AJ, et al. (2014) Deepwater Horizon crude oil impacts the developing hearts of large predatory pelagic fish. Proc Nat Acad Sci U.S.A. 111: 1510-1518.
  19. Johansen JL, Esbaugh AJ (2017) Sustained impairment of respiratory function and swim performance following acute oil exposure in a coastal marine fish. Aquat Toxicol 187: 82-89. [crossref]
  20. Khursigara AJ, Perrichon P, Bautista NM, Burggren WW, Esbaugh AJ (2017) Cardiac function and survival are affected by crude oil in larval red drum, Sciaenops ocellatus. Sci Total Environ 579: 797-804. [crossref]
  21. Mager EM, Esbaugh AJ, Stieglitz JD, Hoenig R, Bodinier C, et al. (2014) Acute embryonic or juvenile exposure to Deepwater Horizon crude oil impairs the swimming performance of mahi-mahi (Coryphaena hippurus). Environ Sci Technol 48: 7053-7061. [crossref]
  22. Magnuson JT, Khursigara AJ, Allmon EB, Esbaugh AJ, Roberts AP (2018) Effects of Deepwater Horizon crude oil on ocular development in two estuarine fish species, red drum (Sciaenops ocellatus) and sheepshead minnow (Cyprinodon variegatus). Ecotoxicol Environ Saf 166: 186-191. [crossref]
  23. Rice SD, Thomas RE, Carls MG, Heintz RA, Wetheimer AC, et al. (2001) Impacts to pink salmon following the Exxon Valdez oil spill: Persistence, toxicity, sensitivity and controversy. Rev Fish Sci 9: 165-211.
  24. Whitehead A, Dubansky B, Bodinier C, Garcia TI, Miles S, et al. (2012) Genomic and physiological footprint of the Deepwater Horizon oil spill on resident marsh fishes. Proc Natl Acad Sci U.S.A. 109: 20298-20302. [crossref]
  25. Xu EG, Mager EM, Grosell M, Pasparakis C, Schlenker LS, et al. (2016) Time- and oil- dependent transcriptomic and physiological responses to Deepwater Horizon oil in mahi-mahi (Coryphaena hippurus) embryos and larvae. Environ Sci Technol 50: 7842-7851.
  26. Xu EG, Khursigara AJ, Magnuson J, Hazar ES, Hardiman G, et al. (2017) Larval red drum (Sciaenops ocellatus) sublethal exposure to weathered Deepwater Horizon crude oil: Developmental and transcriptomic consequences. Environ Sci Technol 51: 10162- 10172. [crossref]
  27. Ankley GT, Erickson RJ, Sheedy BR, Kosian PA, Mattson VR, et al. (1997) Evaluation of models for predicting the phototoxic potency of polycyclic aromatic hydrocarbons. Aquat Toxicol 37: 37-50.
  28. Arfsten DP, Schaeffer DJ, Mulveny DC (1996) The effects of near ultraviolet radiation on the toxic effects of polycyclic aromatic hydrocarbons in animals and plants: a review. Ecotoxicol Environ Saf 33:1-24. [crossref]
  29. Barron MG, Kaaihue L (2001) Potential for photoenhanced toxicity of spilled oil in Prince William Sound and Gulf of Alaska waters. Mar Pollut Bull 43: 86-92. [crossref]
  30. Landrum PF, Giesy JP, Oris JT, Allred PM (1987) Photoinduced toxicity of polycyclic aromatic hydrocarbons to aquatic organisms. In: Oil in Freshwater, eds. J.H. Vandermeulen, S. E. Hrudey. New York: Pergamon Press.
  31. Larson RA, Berenbaum MR (1988) Environmental phototoxicity: Solar ultraviolet radiation affects the toxicity of natural and man-made chemicals. Environ Sci Technol 22: 354-360.
  32. Pelletier MC, Burges RM, Ho KT, Kuhn A, McKinney RA, et al. (1997) Phototoxicity of individual polycyclic aromatic hydrocarbons and petroleum to marine invertebrate larvae and juveniles. Environ Toxicol Chem 16: 2190-2199.
  33. Sweet LE, Magnuson J, Garner TR, Alloy MM, Stieglitz JD, et al. (2017) Exposure to ultraviolet radiation late in development increases the toxicity of oil to mahi-mahi (Coryphaena hippurus) embryos. Environ Toxicol Chem 36: 1592-1598. [crossref]
  34. Alloy MM, Boube I, Griffitt RJ, Oris JT, Roberts AP (2015) Photo-induced toxicity of Deepwater Horizon slick oil to blue crab (Callinectes sapidus) larvae. Environ Toxicol Chem 34: 2061-2066. [crossref]
  35. Alloy M, Garner TR, Bridges K, Mansfield C, Carney M, et al. (2017) Co-exposure to sunlight enhances the toxicity of naturally weathered Deepwater Horizon oil to early lifestage red drum (Sciaenops ocellatus) and speckled seatrout (Cynoscion nebulosus). Environ Toxicol Chem 36: 780-785. [crossref]
  36. Almeda R, Harvey TE, Connelly TL, Baca S, Buskey EJ (2016) Influence of UVB radiation on the lethal and sublethal toxicity of dispersed crude oil to planktonic copepod nauplii. Chemosphere 152: 446-458. [crossref]
  37. Barron MG, Carls MG, Short JW, Rice SD (2003) Photoenhanced toxicity of aqueous phase and chemically dispersed weathered Alaska North Slope crude oil to pacific herring eggs and larvae. Environ Toxicol Chem 22: 650-660. [crossref]
  38. Boese BL, Lamberson JO, Swartz RC, Ozretich RJ (1997) Photoinduced toxicity of fluoranthene to seven marine benthic crustaceans. Arch Environ 32: 389-393. [crossref]
  39. Bridges KN, Lay CR, Alloy MM, Gielazyn ML, Morris JM, et al. (2018a) Estimating incident ultraviolet radiation during the Deepwater Horizon oil spill. Environ Toxicol Chem 37: 1679-1687. [crossref]
  40. Cleveland L, Little EE, Calfee RD, Barron MD (2000) Photoenhanced toxicity of weathered oil to Mysidopsis bahia. Aquat Toxicol 49: 63-76. [crossref]
  41. Damare LM, Bridges KN, Alloy MM, Curran TE, Soulen BK, et al. (2018) Photo-induced toxicity in early life stage fiddler crab (Uca longisignalis) following exposure to Deepwater Horizon Ecotoxicology 27: 440-447. [crossref]
  42. Diamond SA, Milroy NJ, Mattson VR, Heinis LJ, Mount DR (2003) Photoactivated toxicity in amphipods collected from polycyclic aromatic hydrocarbon-contaminated sites. Environ Toxicol Chem 22: 2752-2760. [crossref]
  43. Finch BE, Stefansson ES, Langdon CJ, Pargee SM, Stubblefield WA (2018) Photo-enhanced toxicity of undispersed and dispersed weathered Macondo crude oil to Pacific (Crassostrea gigas) and eastern oyster (Crassostrea virginica) larvae. Mar Pollut Bull 133: 828-834. [crossref]
  44. Finch BE, Stubblefield WE (2016) Photo-enhanced toxicity of fluoranthene to Gulf of Mexico marine organisms at different larval ages and ultraviolet light intensities. Environ Toxicol Chem 35: 1113-1122. [crossref]
  45. Little EE, Cleveland L, Calfee R, Barron MG (2000) Assessment of the photoenhanced toxicity of a weathered oil to the tidewater silverside. Environ Toxicol Chem 19: 926-932.
  46. Sweet LE, Revill AT, Strzelecki J, Hook SE, Norris JM, et al. (2018) Photo-induced toxicity following exposure to crude oil and ultraviolet radiation in two Australian fishes. Environ Toxicol 37: 1359-1366.
  47. Vaca CE, Wilhelm EJ, Harms-Ringdahl M (1988) Interaction of lipid peroxidation products with DNA: A review. Mutat Res 195: 137-149. [crossref]
  48. Frederick PC, Loftus WF (1993) Responses of marsh fishes and breeding wading birds to low temperatures: A possible behavioral link between predator and prey. Estuaries 16: 216-222.
  49. Kushlan J (1980) Prey choice by tactile-foraging wading birds. Colon Waterbird 3: 133-142.
  50. Atlantic States Marine Fisheries Commission (2020) Red Drum. Accessed 28 January 2020.
  51. NOAA Fisheries (2020) Science & Data. Accessed 28 January 2020.
  52. Swingle WE (1990) Status of the commercial and recreational fishery. In: Red Drum Aquaculture. College Station, Texas: Texas A&M Sea Grant Program.
  53. Hunter JR, Kaupp SE, Taylor JH (1980) Assessment of effects of UV radiation on marine fish larvae. In: The Role of Solar Radiation in Marine Ecosystems, ed. J. Calkins. New York: Plenum Press.
  54. Roberts AP, Allo MM, Oris JT (2017) Review of the photo-induced toxicity of environmental contaminants. Comp Biochem Physiol 191: 160-167. [crossref]
  55. Ringwood AH, Houget J, Keppler CJ, Gielazyn ML, Ward BP, et al. (2003) Cellular Biomarkers (lipid destabilization, glutathione and lipid peroxidation) in three common estuarine species: A methods handbook. Marine Resource Institute, South Carolina Department of Natural Resources: Charleston, SC.
  56. May LA, Burnett AR, Miller CV, Pisarski E, Webster LF, et al. (2020) Effect of Louisiana sweet crude oil on a Pacific coral, Pocillopora damicornis. Aquat Toxicol 200: 105454.
  57. Newman MC (1995) Quantitative methods in aquatic ecotoxicology. In: Advances in Trace Substances Research. Boca Raton, Florida: Lewis Publishers.
  58. Hamilton MA, Russo RC, Thurston RV (1978) Trimmed Spearman-Karber method for estimating median lethal concentrations in bioassays. Environ Sci Technol 12: 417.
  59. Belsley DA, Kuh E, Welsch RE (1980) Regression Diagnostics: Identifying Influential Data and Sources of Collinearity. Hoboken, New Jersey: John Wiley & Sons.
  60. Cook R (1977) Detection of influential observations in linear regression. Technometrics 19: 15-18.
  61. Sea Grant Louisiana (2019) Louisiana Fisheries. Biological Info: Red Drum. Accessed 24 February 2020.
  62. NOAA Data Integration and Visualization Exploration and Reporting (DIVER). 2020. Deepwater Horizon DRDA Data, NOAA’s Deepwater Horizon Trustee Toxicity Testing Program Results.
  63. Bennett WA, Beitinger TL (1997) Temperature tolerance of the sheepshead minnows, Cyprinodon variegatus. Copeia 1: 77-87.
  64. Diamond SA, Mount DR, Burkhard LP, Ankley GT, Makynen EA, et al. (2000) Effect of irradiance spectra on the photoinduced toxicity of three polycyclic aromatic hydrocarbons. Environ Toxicol Chem 19: 1389-1396.
  65. Hodson PV (2017) The toxicity of fish embryos of PAH in crude and refined oils. Arch Environ Contam Toxicol 73: 12-18. [crossref]
  66. Pasparakis C, Esbaugh AJ, Burggren W, Grosell M (2019) Physiological impacts of Deepwater Horizon oil on fish. Comp Biochem Physiol Part-C: Toxicol 224: 1-29.
  67. Duffy TA, Childress W, Portier R, Chesney EJ (2016) Responses of bay anchovy (Anchoa mitchilli) larvae under lethal and sublethal scenarios of crude oil exposure. Ecotoxicol Environ Saf 134: 264-272. [crossref]
  68. Johansen JL, Allan BJM, Rummer JL, Esbaugh AJ (2017) Oil exposure disrupts early life-history stages of coral reef fishes via behavioural impairments. Nat Ecol Evol 1: 1146-1152. [crossref]
  69. Heintz RA, Short JW, Rice SD (1999) Sensitivity of fish embryos to weathered crude oil: Part 2. Increased mortality of pink salmon (Oncorhynchus gorbuscha) embryos incubating downstream from weathered Exxon Valdez crude oil. Environ Toxicol Chem 18: 494-503.
  70. Raimondo S, Hemmer BL, Lilavois CR, Krzykwa J, Almario A, et al. (2015) Effects of Louisiana crude oil on the sheepshead minnow (Cyprinodon variegatus) during a life-cycle exposure to laboratory oiled sediment. Environ Toxicol 31: 1627-1639. [crossref]
  71. Echols B, Smith A, Gardinali PR, Rand GM (2016) Chronic toxicity of unweathered and weathered Macondo oils to mysid shrimp (Americamysis bahia) and inland silversides (Menidia beryllina). Arch Environ Contam Toxicol 71: 78-86.
  72. de Soysa TY, Ulrich A, Friedrich T, Pite D, Compton S, et al. (2012) Macondo crude oil from the Deepwater Horizon oil spill disrupts specific developmental processes during zebrafish embryogenesis. BMC Biol 10: 40. [crossref]
  73. Overton EB, Wade TL, Radovic JR, Meyer BM, Miles MS, et al. (2016) Chemical composition of Macondo and other crude oils and compositional alterations during oil spills. Oceanography 29: 50-63.
  74. Brette F, Shiels HA, Galli GLJ, Cros C, Incardona JP, et al. (2017) A novel cardiotoxic mechanism for a pervasive global pollutant. Sci Rep 7: 41476. [crossref]
  75. Barron MG, Carls MG, Short JW, Rice SD, Heintz RA, (2005) Assessment of the phototoxicity of weathered Alaska North Slope crude oil to juvenile pink salmon. Chemosphere 60: 105-110. [crossref]
  76. Rice SD, Short JW, Brodersen CC, Mecklenburg TA, Moles DA, et al. (1976) Acute toxicity and uptake-depuration studies with Cook Inlet crude oil, Prudhoe Bay crude oil, No. 2 fuel oil, and several subarctic marine organisms. Processed Report. Northwest Fisheries Center Auke Bay Fisheries Laboratory, Juneau, AK.
  77. Choi J, Oris JT (2000) Evidence of oxidative stress in bluegill sunfish (Lepomis macrochirus) liver microsomes simultaneously exposed to solar ultraviolet radiation and anthracene. Environ Toxicol Chem 9: 1795-1799.
  78. McCloskey JT, Oris JT (1993) Effect of anthracene and solar ultraviolet radiation exposure on gill ATPase and selected hematologic measurements in the bluegill sunfish (Lepomis macrochirus). Aquat Toxicol 24: 207-218.
  79. Oris JT, Giesy JPJr (1986) Photoinduced toxicity of anthracene to juvenile bluegill sunfish (Lepomis macrochirus Rafinesque): Photoperiod effects and predictive hazard evaluation. Environ Toxicol Chem 5: 761-768.
  80. Oris JT, Giesy JP Jr (1987) The photo-induced toxicity of polycyclic aromatic hydrocarbons to larvae of the fathead minnow (Pimephales promelas). Chemosphere 16: 1395-1404.
  81. Weinstein JE, Oris JT, Taylor DH (1997) An ultrastructural examination of the mode of UV-induced toxic action of fluoranthene in the fathead minnow, Pimephales promelas. Aquat Toxicol 39: 1-22.
  82. Diercks AR, Highsmith RC, Asper VL, Joung D, Zhou Z, et al. (2010) Characterization of subsurface polycyclic aromatic hydrocarbons at the Deepwater Horizon Geophys Res Lett 37: L20602.
  83. Bridges KN, Krasnec MO, Magnuson JT, Morris JM, Gielazyn ML, et al. (2018b) Influence of variable ultraviolet radiation and oil exposure duration on survival of red drum (Sciaenops ocellatus) larvae. Environ Toxicol 37: 2372-2379. [crossref]
fig 1

Maternal Satisfaction with Childbirth Services in Health Facilities in Nigeria: A Systematic Review of Literature and Recommendations

DOI: 10.31038/IGOJ.2022522

Abstract

Background: Maternal deaths in developing countries are quite high accounting for as much as 14 percent of global maternal deaths. One of the global strategies to reduce these deaths requires utilization of health facilities manned by skilled birth attendants for childbirth. Although 67% of women attend ANC in Nigeria, only 39% utilize health facilities for delivery. Thus, this review seeks to ascertain maternal satisfaction with delivery services which will influence childbirth in health facilities in Nigeria.

Methods: Literature search was done using different databases and search engines including goggle, PubMed/Medline, Google scholar, web of science, EMBASE, Cochrane library. The search on articles published in English on maternal satisfaction with delivery services in health institutions between 2000 and 2021 yielded 108 articles that were screened for eligibility out of which 44 underwent full text review. Thirteen (13) articles were included in the final analysis.

Results: Eight (61.5%) of the studies reported the prevalence of women’s satisfaction with delivery services to be over 90%. Dissatisfaction was reported in lack of availability and adequacy of electricity, water, equipment, space for consultation/admission and cleanliness of toilets in 5(62.5%) out of the eight studies that reported on physical environment. This was same with, availability of adequate staffing, cost, medicines and supplies. Five (62.5%) of studies reported dis-satisfaction with interpersonal relationship issues; courtesy, respect, privacy, promptness, perceived health worker competency and emotional support. There was report on preference for un-orthodox care centers in some instances.

Conclusions: Although overall satisfaction with health facility delivery services was fair, there was some dis-satisfaction expressed by the women in certain domains. There is need to improve on interpersonal attitudes, provision of medicines and supply as well as infrastructural upgrade and environmental cleanliness. A digitalized feedback system and periodic audits should be made compulsory.

Keywords

Maternal satisfaction, Mother’s perception, Associated factors, Quality of care, Health facility deliveries, Nigeria

Introduction

It is reported worldwide that approximately 800 women die daily from preventable causes which are pregnancy and childbirth related and 99% of all these maternal deaths occur in less developed nations of the world [1-4]. In some parts of the African continent Maternal Mortality Ratios (MMR) are as high as 686 per 100,000 live births which is very abysmal [2,3,5]. The World Health Organization (WHO) estimates put MMR in Nigeria at 814 per 100,000 live births. The lifetime risk of a Nigerian woman dying during pregnancy, childbirth, postpartum or post-abortion is said to be 1 in 22, in contrast to the lifetime risk in developed countries estimated at 1 in 4900 [6].

Utilization of delivery services at the hospital is believed to reduce these unacceptably high maternal complications and deaths especially in sub-Saharan Africa [7]. This is due to the fact that the hospital environment is expected to have the minimal medical standards that will guarantee clean delivery as well as a result of availability of equipment, medicine/supplies and skilled birth attendants [3,4,7,8]. Worldwide, statistics showed that about 2.5 million neonates died within the first 28 days of delivery [7]. It is reported that 2 in 3 neonates died within the first day of birth as a result of inadequate care during labour and delivery [7]. In low and middle income countries where neonatal mortality statistics are abysmal, achieving perinatal survival devoid of morbidity will guarantee maternal satisfaction [7].

Although the report of 2018 Nigeria Demographic Health Survey (NDHS) suggests that as much as 67% of women utilize Antenatal Care (ANC) services, only 39% of then deliver in a health facility where there is a Skill Birth Attendant (SBA) [9]. The poor rate of institutional deliveries shows that not all the women who are booked and attending antenatal care opt for institutional delivery [5]. A good proportion of registered antenatal attendees have alternative place of delivery and some even practice medical pluralism which entails utilizing Traditional Birth Attendants (TBAs), home deliveries and maternity homes at the same time [4,9].

A lot of reasons have been proffered as explanation to this irregular utilization of maternal health care services by women in Nigeria. These include; the high cost of services, cultural barriers, religious inclinations, attitude of health workers, distance from health facilities among others [4,8,10,11]. Childbirth experience of women will determine their future utilization and recommendation of hospital delivery to other women and yet not many studies have been conducted in Nigeria on maternal satisfaction with services [9,12].

Worldwide there have been constructive efforts to assess and subsequently improve the quality of maternal healthcare in health facilities in the last two decades which has led increase in importance being given to opinions, aspirations, expectations and actual experiences of women that use these facilities [13]. Although, assessing for maternal satisfaction may not be easy due to its multidimensional nature; because clients may be satisfied with some selected aspects of care and not minding others, maternal satisfaction is critical for quality assurance in maternal health care service delivery [14]. Hence the World Health Organization (WHO) recommends the evaluation of satisfaction by the women so as to help improve quality and effectiveness of maternity care services [10,15-17].

It is for this reason that this assessment is considered germane in Nigeria, a developing nation. The findings of the study were to provide informed recommendations and public health policy formulation, strategies and interventions that will eventually enhance institutional deliveries in Nigeria thereby not only improving maternal and child health but also reducing maternal deaths.

Methodology

Study Design

Systematic review of Literature that were peer reviewed or grey literature that was relevant to the study theme. The review followed the PICO model or frame work for systematic reviews. The population studied was women who delivered in health facilities in Nigeria whether at primary, secondary or tertiary level of care. Intervention was the delivery process which entails treatment, information, interpersonal relationship, and impact of infrastructure. The reports of women who delivered in health facilities were compared with those who delivered in un-orthodox centers. Outcome measures were the satisfaction of the women using the domains studied which included; physical environment, interpersonal issues, availability of drugs and supplies, access to health facilities.

Study Setting

It was focused on studies conducted on satisfaction of women with delivery services in health facilities in Nigeria. The country which is located in West Africa is the most populous black nation in the world with a population of about 200 million people. Maternal and child health services are offered at primary, secondary and tertiary levels. This service includes antenatal care, intra-partum care and post-partum care, family planning, child immunization and other reproductive health services.

Inclusion and Exclusion Criteria

Cross-sectional or cohort studies, some quantitative and others qualitative conducted on maternal satisfaction with delivery services in Nigerian health facilities. Therefore, the population was Nigerian women of reproductive age that had a birthing experience at primary, secondary or tertiary facility. They were also compared with those who delivered elsewhere. All included studies were published in English language. Those with no abstract or full text, editorials, anonymous authors, conference papers, lecture notes and incomplete data were excluded. Also excluded were those done on non-Nigerian population, focused on antepartum care and non-English. Also, those that did not test the outcome measures of physical environment, interpersonal issues, accessibility and availability of drugs and supplies were excluded.

Search Strategy

This was an extensive electronic literature search using different databases and search engines including Google, PubMed/Medline, Google scholar, web of science, EMBASE, Cochrane library. Report types considered were journal articles, book chapters, grey literature reports and academic theses provided that they reported a full account of either quantitative or qualitative research methods. Search terms used were “Maternal satisfaction with delivery services”, OR “Women’s satisfaction with childbirth services” AND “delivery in Nigerian health facilities”, OR “Women’s perception of satisfaction with hospital Childbirth experiences in Nigeria”, AND “satisfaction with maternity services”, “factors affecting satisfaction with child birth”. Other ways were; the manual search and review of reference lists of the included studies. Hand searching of the journals was also done as well as grey literature and interviews of experts. The period of these studies was restricted to between 2000 and 2021 to ensure that the findings were recent.

Quality and Eligibility Assessment

This was a diligent check through the full-text articles to further evaluate the quality and eligibility of the studies. Consideration was given to journal articles published by reputable publishers as high-quality research, and therefore they were included in the review: Thus, reliability of data was checked for and repetitions were also rejected.

Study Selection Process

This was a two-stage process in which the first stage involved screening of abstracts of identified studies by the researcher for relevance to the topic, based on the inclusion and exclusion criteria. In the second stage, full-text papers were reviewed for relevance and inclusion in the review work. Where there were doubts, the researcher referred the concerned abstracts/full texts to the two other researchers and decision to accept the articles were based on the inputs of the other researchers.

Risk of Bias in Assessment of Articles

Each article selected was considered to be of high, moderate or low quality. Articles were not rejected due to the study design limitations that could have existed. The priority was the achievements of the aim and objective of the study which was adjudged to have addressed the study questions and the hypotheses. So the overall interpretation became more important than technical criteria used for data collection and analysis. It was also important to take into cognizance the difficulty of research methodology for assessing the likelihood of publication or dissemination bias in qualitative studies or mixed studies even though such biases are well known to exist.

Outcome Measurement of Interest

The outcome data was satisfaction with delivery services and factors related to satisfaction with delivery services. Satisfaction was considered along the lines of prompt attention to patients, environmental issues (cleanliness, how tidy and organized, good toilets), interpersonal issues (politeness, respect and regards to patients, privacy, orientation, emotional support) and information (treatment, counselling, results of exams, hygiene, breast feeding etc.).

Data Extraction and Analysis

Data extraction was done from the included studies in Word document using a table. It included the first author, year of publication, study setting, study design, data collection method, and sample size, prevalence of satisfaction, study region, outcome measure and associated factors for satisfaction.

Table 1: Description of included studies for systematic review

S/N

Authors/year

Study setting

Study design

Data collection method

Sample size

Prevalence of maternal satisfaction (%)

Town/state

Outcome

Factors associated with satisfaction

1 Somade & Ajao,

2020

PHC Cross-sectional Structured

Questionnaire

380

66.7%

Ogun Maternal satisfaction Communication skill, Accessibility of care, Midwives’ availability and professionalism, Cost of services
2 Timane et al,

2017

PHC Cross-

Sectional

Structured

Questionnaire

250

96.7%

Sokoto Client

satisfaction

Waiting time, environment, cleanliness of toilets, availability of water, treatment and outcome
3 Lawali & Lamide

2020

Teaching hospital Cross-

Sectional

Structured

Questionnaire

158

97.7%

Sokoto Maternal

satisfaction

Waiting time, courtesy, privacy, competence, treatment given, support, sex of health worker
4 Okonofua et al

2017

Teaching

Hospitals

Cross-

sectional

FGD

40

Low

Zaria, Mina, Abuja, Oyo, Benin, Kano, Abeokuta, Ibadan Women’s

satisfaction

Staffing, electricity, water, attitude of staff, waiting time, availability of drugs, attention, support
5 Uzochuckwu et al, 2014 Community Cross-

sectional

Structured

Questionnaire

405

90.6%

Enugu Maternal

satisfaction

Availability of drugs, physical condition of facilities
6 Sayyadi et al,

2021

Hospitals Cross-

sectional

Structured

Questionnaire

438

67.6%

Kano Maternal

satisfaction

Supplies, competence of staff
7 Ilesami &

Akinmeye,

2018

PHC Cross-

Sectional

Questionnaire

66

98.5%

Ibadan Mother’s

satisfaction

Waiting time, staffing, attitude of staff, environment, water, supplies, distance to facility, competence
8 Ajayi, 2019 Teaching

Hospital

Cross-

Sectional

Questionnaire

57

66.7%

Ibadan Mother’s

satisfaction

Infrastructure, staffing, medicine, equipment
9 Anikwe et al,

2019

Hospitals Cross-

sectional

FGD

Interviews

1227

97.1%

Ondo, Ekiti,

Nasarawa

Maternal

satisfaction

Cleanliness of health facility, attitude of staff, privacy, supplies and medicine
10 Oyo-Ita et al,

2007

Teaching

Hospital

Cross-

sectional

Questionnaire

250

59.3%

Abakaliki Women’s

satisfaction

Environment, attitude of staff, communication, care
11 Odetola &

Fakorede,

2018

Hospital Cross-

sectional

Questionnaire

144

97.2%

Calabar Mother’s

satisfaction

Sanitation of facility, attitude of staff, basic amenity
12 Nnebue et al,

2021

PHC Cross-

sectional

Questionnaire

280

93.2%

Nnewi Maternal

satisfaction

Waiting time, cost, attitude of staff
13 Yakubu et al, 2020 UDUTH Cross-sectional Questionnaire

158

90.0%

Sokoto Maternal satisfaction Medical supplies/drugs, delivery beds, waiting rooms, toilets/showers, number of health workers, lab services.

Ethical Clearance

Ethical clearance was not applicable in this study being a literature review work.

Results

Search Outcome

A total of 108 journal articles were retrieved after the search and out of these, 33 were eliminated due to repetitions and not been directly related to the topic. Amongst the ones retained, 31 were dropped because they were studies done for maternal satisfaction in developing countries and not limited to Nigeria. Forty four (44) journal articles were eventually picked for the review but after further screening only 13 satisfied the eligibility criteria set for the study while those that do not qualify due to a slightly different approach in methodology were discarded (Figure 1).

fig 1

Figure 1: Flow diagram summarizing searches

Characteristics of Studies Selected for Review

All selected articles were studies that focused on maternal/mother’s or client satisfaction with delivery services in Nigerian health institutions. Some were conducted in primary health care centers, others secondary health facilities or teaching hospitals. They were all cross-sectional, questionnaire based, with in-depth interviews and some focused group discussions. They cut across the entire regions of the country in fact one particularly involved all the six geopolitical regions of Nigeria. They were all published in reputable journals with complete data and English language (Figure 2).

fig 2

Figure 2: Conceptual frame work for maternal satisfaction

Women’s Overall Satisfaction with Care

Eight (8) of the studies reported the prevalence of women’s satisfaction with delivery services to be over 90%. Three (3) reported slightly over 60%, one less that 60% and one did not report prevalence but documented a low satisfaction. From this report, there was an overall good satisfaction with the quality of care rendered in the health facilities studied.

Factors Associated with Maternal Satisfaction

A large spectrum of factors influencing maternal satisfaction emerged from this review. They are summarized here according to the Donabedian framework of structure, process and outcome, besides access, socioeconomic concerns and other factors.

Physical Environment of the Health Facilities

Eleven (11) of the studies have women’s assessment of the physical environment as a perceived factor that was associated with their satisfaction. Five (5) of them reported satisfaction of the women with environment of the facilities while six reported to be dissatisfactory by the women’s perception [18-25]. Two studies from Sokoto (North-west), one from Ibadan( South-west) and one from Abakaliki (South-east) and one from Calabar (south-south) reported that the women were satisfied with the cleanliness of the consulting rooms, waiting rooms, toilets and water supply [19,20]. However the others reported substandard facilities with dirty environment, irregular electricity, inadequate water supply, bad toilets, bad bathrooms and inadequate infrastructures [25].

The study done in secondary and tertiary health institutions in six geopolitical zones with cities such as – Zaria, Mina, Abuja, Oyo, Benin, Kano, Abeokuta, Ibadan involving a cross-section of women through in-depth interviews and focused group discussions reported that in almost all the cities women were not satisfied with facility based delivery services due to substandard infrastructure, unclean environment, lack of privacy, inadequate water supply and electricity supply [9]. They said these deficiencies in health institutions is what discourage most of them from utilizing orthodox facilities for delivery but rather prefer traditional facilities [9].

Availability of Human Resources or Manpower

In almost all the studies including those that reported satisfactory quality of care as perceived by the women there was a consistent dissatisfaction with the adequacy of the number of staffing. Inadequate manpower was considered to be responsible for long waiting time, poor attention to patients, lack of social support, poor attitude, inadequate education and information provided to the patients when needed. A study done in Sokoto reported that the women were dissatisfied with the sex of the health worker who attended to them [20].

Availability of Medicines, Supplies and Services

Only four (4) studies reported satisfaction by the women’s assessment for the supply of drugs and other medical provisions for their treatment. Most of them were not satisfied but complained of inadequacy or absence of basic medications and commodities and lamented of the high cost of the available drugs. A study in Kano reported that the women in rural compared with urban communities were more dissatisfied particularly with finance, shortage of drugs, hospital equipment, manpower deficiency and transportation difficulties [26].

Interpersonal Relationship

Out of eight (8) of the studies that reported on attitude of health workers towards the women, five (5) of them carried the report that the women were dissatisfied with the interpersonal relationship that exist between the medical personnel and their clients. Some women have reported verbal and physical insult against them [9]. Lack of respect and courtesy toward the women. The focused group discussions in the regional study revealed women complaining of maltreatment either before, during or after delivery. For instance in Edo a participant complained of harassment even when patients asked questions about their care [9]. However, two reported that hospital staff were respectful, gave orientation to patients, explained treatment procedures, sought for the opinion of the patients during treatment and gave the patients support.

Discussion

The general trend of maternal satisfaction with delivery services in Nigerian health facilities suggest a high satisfaction in most of the studies reviewed. The report is similar to those from southern Ethiopia (95%), multi-regional study in Ghana, Guinea, and Myanmar 88.4% but higher than reports from central Ethiopia (3.6%) and South Africa 55% [27].

However, the reported studies showed that a deeper and critical interrogation of the women through in-depth interviews and focused group discussions on maternal care following recommendations by the world health organization (WHO) and elaborated by Donabedian tool, revealed the obvious gaps in the health care system [21]. This probably suggests that the women may have not appreciated what their rights and privileges are due to lack of personal awareness and knowledge, although Nnebue et al. (2014), reported otherwise [28].

However, the regional study by Okonufua et al. (2017) showed so much knowledge and information that had been gathered by the women overtime. They were able to elucidate the challenges in the health sector and proffered solutions and recommendations which included; the improvement and expansion of hospital facilities, better organization of clinical services to reduce delays and mis-management, the training and re-orientation of health workers and the education/counseling of women [9]. These recommendations for rectification are consistent with previous recommendations reported in other studies in developing nations such as Ethiopia [2,29,30].

Physical Environment

Although some of the studies like the ones in PHCs in Ogun state suggested that mothers were satisfied with the physical condition of the environment, most of the reviewed studies reported dissatisfaction. In Sokoto, Kano, Minna, Ibadan and Enugu there were lack of satisfaction with electricity supply, adequacy of clean water, toilet facilities, bathrooms, waiting areas, consulting rooms and bed spaces for admission [16,19,20].

In some reports, women were said to sit on vehicles of doctors awaiting consultation because of inadequate chairs in the waiting area, some had delivered on the floor, and other situations patients bring water from home for their treatment [9,16,20]. The situation was found to be worse in the report that compared urban and rural health care service delivery as reported by Sayyad et al. (2021) in Kano [16]. These findings are typically synonymous to what is reported in other developing nations like Ethiopia, Ghana and Tanzania [31]. Women were prompt to say these were some of the reasons they do not want to utilize health facilities for delivery [17,32].

A qualitative study in Ghana in which in-depth interviews were conducted revealed some women complaining bitterly of the delivery conditions being grossly below their expectations. One women said; “I was not comfortable with the condition of the bed there, especially the mattress I slept on. The mosquito nets also need to be changed because they were not good enough for people to sleep inside them” [33]. In a study by Darebo et al. (2016) in Southern Ethiopia, some women were very unhappy with ward cleanliness. A 33-year-old woman from Soddo said: “… though I was very satisfied with the care all the way through, I felt embarrassed when I had to sleep on a couch which was left unclean from a previous birth, with some blood and secretions visible on top of the bed”. A shortage of water and dirty toilets was the main source of dissatisfaction for several women. This was particularly exacerbated by a disaster that led to interruption in power supply in the area for several days.

These are well known challenges that confront the health sector in developing countries like Nigeria. The issue of bed shortage was also a big problem in the public hospitals. According to the women surveyed, they were discharged as quickly as possible due to lack of beds or broken beds. The health sector leadership in developing nations should make more efforts in improving on the sanitary conditions of the hospitals and meeting the infrastructural needs and provision of basic amenities [2,17].

Interpersonal Relationship

The study in selected areas in Ogun State showed that the main perceived factor influencing quality of health care service was staff conducts and practice (94.6%). The women were satisfied with communications skill of the health personnel (67.6%) that attended to them [18]. This is contrary to the report from a study in Erbil City in Iraq by Ahmed (2020). The study in Sokoto [20] also, reported satisfaction with health worker attitude. Similarly, in Ondo, Ekiti and Nasarawa states where user fee removal policy was practiced, the women were also satisfied with health worker attitude [22]. High satisfaction rate was also seen in the survey of PHC centers in Ibadan which showed that 95.6% of the women were satisfied with the attitude of health workers whom they described as respectful and courteous, while 86.4% were happy with pain management [34].

However, further review of the studies show that although few reported satisfaction with conduct and practice of health workers, most were dissatisfied. Mothers reported maltreatment, disrespect and lack of courtesy by health workers [11]. In the study at Enugu south-eastern Nigeria, a lot of the participants complained of the unfriendly attitudes of the health workers [35]. Although they opined that the health personnel differs in character with some being courteous while some were not [35]. In the view of one of the client, “I think the attitude of our nurses is bad because they have no respect or mercy for a patient and they insult patients without been provoked” [35].

The clients went ahead to offer some explanations why staff behavior might be bad. Some participants felt that “easy fatigability as a result of stress on the few staff makes then easily irritable, coupled with the uncoordinated and misguided behavior of the patients who argue and jump queues” [11,35]. However, the most common explanation was that the health workers who are used to seeing illness and deaths have become insensitive to patient needs [35].

These findings were worse with the regional studies reported by Okonofua et al. (2018). In one of the narrative by a patient during the focused group discussion, in Kano the participant lamented: “they do not give enough attention to women in labour, some women will be shouting and crying and they still will not attend to them”. Several studies done in different parts of Nigeria report a lot of maltreatment [11,36]. Several women reported unfriendly, insensitive, poor and negative attitude towards them in their last deliveries by a range of 11.3% to 70.8% of women in eight cross-sectional surveys in Enugu , South-east, Nigeria [37] some in Benue State, North-central Nigeria (Orpin et al. 2018). Studies have shown that women who were maltreated are less likely to be satisfied [38,39].

A multi-country community based study done in Ghana, Myanmar, Guinea and Nigeria which reported verbal and physical abuse against the women showed that they were more likely to report less satisfaction with care [39] and this makes so many women prefer delivery at TBAs whom they say are more compassionate and supportive [40]. The same has been reported in Nigeria; for instance in Ota, Ogun State in South-western Nigeria [6]. This perhaps clearly shows the difference between actual qualities of care provided and perceived quality of care by the women [4].

Another study done in Lagos comparing satisfaction with the quality of care between faith-based and public facility care reported the women were more satisfied with the faith based health care services due to perceived effectiveness [41]. What this means is that, even if the modern health facilities in Ota have expert practitioners with internationally recognized good practice, the maternal deaths might unfortunately still be on the rise due to poor utilization, because women’s perception of ‘quality’ influences health service utilization[4,6,42].

Similarly, in Northern Nigeria, the practice of Purdah (female seclusion) is very common. In this practice, women are isolated and encouraged to give birth at home [6]. Many in these settings believe that allowing an outsider help with delivery could be disrespectful [6,42]. Thus, even if maternal health institutions exist in this region, it might not improve health outcomes because of people’s beliefs and culture [6,42].

Moreover, raising awareness on the existence of a maternal health facility, making it accessible and affordable does not always result to its utilization [6]. This has been shown for example, in Giwa Local Government Area (LGA) of Kaduna State North-western Nigeria. Despite living close to a health facility with free maternal health services, majority of the women were not utilizing the facility for child delivery [6]. One of the reasons for the poor use of formal health system in that community is the belief that health care providers have a negative attitude; consequently, many women would rather give birth at home or at a traditional health center [6].

Thus, even though the evidence towards reducing maternal mortality through access to skilled pregnancy care are largely relevant, it remains inadequate in ensuring a substantial decline in maternal deaths in Nigeria [6]. Improving the quality of health services goes beyond assessing only the supply aspect of care [4,6]. Some authors noted that even if the standard of services in Nigerian primary, secondary or tertiary health facilities is improved, maternal mortality may still be high [6]. This is because an increase in the quality of care provided at a health institution does not always translate to an increase in utilization of the health services by women [6].

Availability of Drugs and Supplies

Nnebue et al. (2014) reported the satisfaction with drugs availability and other supplies in a survey in PHCs in Nnewi amongst 78% of participants [28]. Odetola and Fakorede, 2018 reported that 93.3% of the women in Ibadan were satisfied with supplies, although 68% of the nurses were said to have complained of lack of certain instruments to work with [34]. This finding is similar to that of the report from Ethiopia by Asres et al. (2018) [43]. The challenge in developing nations is that of “out of stock” syndrome. The few inequitably distributed health centers are usually not well equipped and lack basic supplies for efficient service delivery.

Studies have shown that the private health facilities do have better supplies than public facilities [44], however the latter is usually not within the capacity of the not well to do people when it comes to the issue of affordability [44].

Accessibility to the Health Facilities

The satisfaction of the women was indirectly connected to how close the facility was to their places of residence [32,41]. A study had demonstrated that women who live closer to the health facility in which case it will take just about 30 minutes to locate the facility and do also have a means of transportation are more likely to deliver in the facility than those it will take an hour or more and do not have easy access by means of transportation [17,32,45]. On arriving the hospital, promptness of care was judged to be a criteria for satisfaction by the women while increase waiting time was a determinant for dissatisfaction as was reported by a study in Ethiopia [29,32,45]. A study done in Kenya reported that private facilities do have a lesser waiting time compared with public facilities. The report has it that a higher proportion of clients from private facility 98.1% were attended within 0 ± 30 minutes of arrival to the facility as compared to 87% from public facility [41,44].

Biosocial Factors and Maternal Satisfaction

Although majority of the studies for the assessment of perceived satisfaction with care by the women did not include biosocial factors, two particularly done in Kano by Sayyadi et al. (20210 and Ibadan by Otedola and Fakorede (2018) reported on the impact of level of education and economic status on satisfaction [26,34]. They opined that, most of the studies reporting high satisfaction were amongst women with relatively lower levels of education and economic status. Dis-satisfaction with maternity care services were seen more among women with higher socio-economic status and level of education. This could be as a result of the exposure and higher expectations of care among the higher class women. Coasta et al. (2019) in Brazil reported that the women’s birth satisfaction was positively associated with age, number of children, education level and income [46]. They found out that those who had more personal control during childbirth, lower labour pains, no underlying medical problems during delivery and more social support or labour companionship showed higher birth satisfaction levels [46].

Cultural Diversity in Childbirth Interplay

One prominent area that affects satisfaction of clients with maternal health care services that was not adequately focused on in the reviews but is worthy of mentioning is the diversity of cultures across ethnic divide in Nigeria [6,42]. Globally, it has been reported that the culture of the skill birth attendant and profession, client and the practice setting affects perceived quality of care [6,42]. There are about 374 ethnic groups, in Nigeria with different cultures which creates a challenge to the healthcare provider because these cultural variations are believed to affect the birth process [6,42]. This explains why for instance the clients could prefer certain sex of the healthcare giver to attend to them, patronage of either health facility or un-orthodox facility, interpersonal disagreements, pain coping/management issues and place of birth etc. [6,42]. It is therefore crucial for birth attendants to have a good knowledge of culturally bound behaviors in order to facilitate a satisfying birthing experience by the culturally diverse women of Nigeria. In the light of this assertion, it will be appropriate to train skill birth attendants on cultural interplay mechanism that affects client’s satisfaction with delivery services in health facilities.

Conclusion

Although overall satisfaction with health facility delivery services was good, there was some dis-satisfaction expressed by the women in certain domains. These factors that the women identified as causes of dissatisfaction with maternal care included; dirty hospital environment, inadequate and dirty toilets, inadequate water supply, and poor interpersonal relationship with health care givers in which patients have been verbally or physically maltreated. Also location/distance of health facilities, increased cost of some services and lack of drugs. For these reasons some women prefer to deliver outside orthodox health facilities. A digitalized feedback system, strict patient care pathways as well as periodic audits are compulsory. More regional research on maternal satisfaction is however recommended to capture particularly factors such as culture and place of residence whether urban or rural to appreciate their influence on maternal satisfaction.

Recommendations

To improve on the health care delivery system, the following recommendations become critical.

Physical Environment

  1. Health facilities should be kept clean and tidy. Environmentalist and cleaners as staff or contractors should be engaged for this responsibility of continuous maintenance of a decent hospital environment.
  2. Availability of adequate and clean toilets and water should be ensured regularly by health facility staff. A dedicated electricity line will guarantee regular supply of electricity to power equipment and machines for uninterrupted service delivery.
  3. Provision of sufficient seats in waiting areas for the clients as they await consultations as well as enough beds for admission should be ensured.
  4. Interpersonal Relationships

    1. Employment of more staff of different cadre to reduce burn out syndrome. Hopefully this could reduce the tension, irritability and anger exhibited by health workers towards patients as a result of stress of work.
    2. Deliberate training and retraining of health workers at maternal health care centers to improve their performance and quality of care devoid of maltreatment to patients. They should rather be able to counsel, inform and request for patient’s input into their care.
    3. There is need for continuous upgrading and refinement of patient care communication skills of staff in order to make them friendlier, more prompt and responsive to patients.
    4. There should be improvement on the hospital organization so as to reduce delays and long waiting time for consultations. Appointments to patients in batches could be considered as a strategy in this regards. Also computerization of hospital records and at every department of service delivery.
    5. Continuous monitoring of clients’ satisfaction with all aspects of care could aid in improvement of the quality of services.
    6. Provision of adequate compensation packages and appropriate incentives to health personnel to increase their commitment and motivation to work.
    7. Maintenance of adequate monitoring and supervision of health personnel to ensure the proper delivery of services.
    8. Digitalized feedback system and periodic audit is critical.
    9. Availability of Drugs and Supplies

      1. The Ministry of Health at both the federal, state and local governments should consistently provide adequate supplies, equipment and drugs for providing maternal healthcare services in all the health facilities.
      2. The drugs and cost of services should be made more affordable. Maternal health free services could be considered. The national health insurance scheme (NHIS) could also help in this regard.
      3. Accessibility to Health Services

        1. Creation of awareness through mass media, religious gatherings and social functions about the need to utilize institutional maternal health services, and about the dangers associated with using traditional birth attendance.
        2. The government, NGOs, community development efforts should be stepped up in the provision and equitable distribution of health facilities that are well manned by skill birth attendants and optimally equipped for efficient service delivery.
        3. Infrastructural development such as in provision of access roads and means of affordable transportation should be given priority to enable women access care.
        4. Funding of the health sector in Nigeria should as a matter of urgency is improved upon through legislation.
        5. Finally, Caregivers need to fully understand the expectations that patients have for their care, and provide service that is consistent with those expectations.

        Study Strength and Limitations

        The cross-sectional studies done through interviews with the use of questionnaires might have influenced the responses from the participants due to the fact that in most cases the care givers administer them to the clients. Although it was mentioned that, in the training of research assistants it was ensured that efforts were made by these research assistants to assure respondents of confidentiality of their responses. Qualitative data were also used to cross-check the quantitative results obtained from the questionnaires. Even the in-depth interviews through focused group discussion could have been biased for some form of conflict of interest. There were variation in the use of parameters and overall assessment of satisfaction and this non uniformity could have affected the general reporting of findings. The overall satisfaction of hospital delivery services in these studies was found to be suboptimal. Caregivers need to fully understand the expectations that patient have for their care, and provide care that is consistent with those expectations. Future studies should consider gathering more data from a more diverse sample to address the generalizability issue.

        Acknowledgement

        We acknowledge the advices offered by Jonah Musa, Audu Onyewoicho and Emmanuel Adegbe during the preparation of this manuscript.

        References

        1. Babure ZK, Assefa JF, Weldemarium TD (2019) Maternal Satisfaction and Associated Factors towards Delivery Service among Mothers Who Gave Birth at Nekemte Specialized Hospital, Nekemte Town, East Wollega Zone, Oromia Regional State, Western Ethiopia, 2019: A Cross-sectional Study Design. J Women’s Health Care 9: 489.
        2. Darebo TD, Abera M, Abdulahi M, Berheto TM (2016) Factors Associated with Client Satisfaction with Institutional Delivery Care at Public Health Facilities in South Ethiopia”. J Med Physiol and Biophysics 25: 19-28.
        3. Edaso AU, Teshome GS (2019) Mothers’ satisfaction with delivery services and associated factors at health institutions in west Arsi, Oromia regional state, Ethiopia”. MOJ Women’s Health 8: 110-119.
        4. Chizoba N, Tobiloba O, Chigozie N (2017) Factors Influencing the Choice of Health Care Provider during Childbirth by Women in Ibadan, Oyo State, Nigeria. Int J Caring Sc 10: 511-521.
        5. Bitew K, Ayichiluhm M, Yimam K (2015) Maternal Satisfaction on Delivery Service and Its Associated Factors among Mothers Who Gave Birth in Public Health Facilities of Debre Markos Town, Northwest Ethiopia. BioMed Res Int 1-6. [crossref]
        6. Ope BW (2020) Reducing maternal mortality in Nigeria: addressing maternal health services perception and experience. J Global Health Reports 4: e2020028.
        7. Demis A, Getie A, Wondmieneh A, et al. (2020) Women’s satisfaction with existing labour and delivery services in Ethiopia: a systematic review and meta-analysis. BMJ Open 10: e036552.
        8. Adegbe OE (2021) Factors that determine the place of Childbirth in Lagos State, Nigeria’. Walden Dissertations and Doctoral Studies 10628: 2021.
        9. Okonofua F, Ogu R, Agholor K, Okike O, Abdus-Salam R, et al. (2017) Qualitative assessment of women’s satisfaction with maternal health care in referral hospitals in Nigeria. Reprod Health 14: 44. [crossref]
        10. Oikawa M, Sonko A, Faye EO, Ndiaye P, Diadhiou M, et al. (2014) Assessment of Maternal Satisfaction with Facility-based Childbirth Care in the Rural Region of Tambacouda, Senegal. Afr J Reprod Health 18: 95-104.
        11. Bohren AM, Vogel JP, Tunçalp O, Fawole B, Titiloye MA, et al. (2017) Mistreatment of women during childbirth in Abuja, Nigeria: a qualitative study on perceptions and experiences of women and healthcare providers. Reprod Health 14: 9. [crossref]
        12. Babalola TK, Okafor IP (2016) Client satisfaction with maternal and child health care services at a public specialist hospital in a Nigerian Province. Turk J Public Health 14: 117-127.
        13. Amu H, Nyarko SH (2019) Satisfaction with Maternal Healthcare Services in the Ketu South Municipality, Ghana: A Qualitative Case Study”. BioMed Research International 2019: 2516469. [crossref]
        14. Mocumbi S, Högberg U, Lampa E, Sacoor C, Valá A, et al. (2019) Mothers’ satisfaction with care during facility-based childbirth: a cross-sectional survey in southern Mozambique”. Pregnancy and Childbirth 19: 303. [crossref]
        15. Panth A, Kafle P (2018) Maternal Satisfaction on Delivery Service among Postnatal Mothers in a Government Hospital, Mid-Western Nepal. Obstet Gynaecol Int 2018: 1-11. [crossref]
        16. Sayed W, ElAal DEM, Mohammed HS, et al. (2018) Maternal satisfaction with delivery services at tertiary university hospital in Upper Egypt, is it actually satisfying? Int J Reprod Contracept Obstet Gynaecol 7: 2547-2552.
        17. Debela AB, Mekuria M, Kolola T, Bala ET, Deriba BS (2021) Maternal Satisfaction and Factors Associated with Institutional Delivery Care in Central Ethiopia: a Mixed Study. Patient Preference and Adherence 15: 387-398. [crossref]
        18. Somade EC, Ajao EO (2020) Assessing Satisfaction with Quality of Maternal Healthcare among Child Bearing Women in Selected Primary Healthcare Centers in Ogun State, Nigeria. Int J Acad Res Bus Arts Sc 2: 200-210.
        19. Timane AJ, Oche OM, Umar KA, et al. (2017) Clients’ satisfaction with maternal and child health services in primary health care centers in Sokoto metropolis, Nigeria. Edorium J Matern Child Health 2: 9-18.
        20. Lawali Y, Lamide A (2020) The Health Workers and Delivery Process Related Maternal Satisfaction with Delivery Services at UDUTH Sokoto, Nigeria. Perception in Reprod Med 3: 256-260.
        21. Ilesami RE, Akinmeye JA (2018) Evaluation of the quality of postnatal care and mothers’ satisfaction at the university college hospital Ibadan, Nigeria. Int. J Nurs Midwifery 10: 99-108.
        22. Ajayi AI (2019) I am alive; my baby is alive”: Understanding reasons for satisfaction and Dissatisfaction with maternal health care services in the context of user fee removal policy in Nigeria. PLoS ONE 14: e0227010. [crossref]
        23. Anikwe CC, Egbuji CC, Ejikeme BN, Ikeoha CC, Egede JO, et al. (2019) The experience of women following caesarean section in a tertiary hospital in Southeast Nigeria. Afr Health Sci 19: 2660-2669. [crossref]
        24. Oyo-Ita AE, Etuk SJ, Ikpeme BM, Ameh SS, Nsan EN (2007) Patients perception of Obstetrics practice in Calabar Nigeria. Nig J Clin Pract 10: 224-228. [crossref]
        25. Yakubu L, Muhammad F, Zulkiflu MA, et al. (2020) Health Facility Related Maternal Satisfaction with delivery Services at UDUTH Sokoto. World J Pharma Med Res 6: 04-08.
        26. Sayyadi BM, Gajida AU, Garba R, Ibrahim UM (2021) Assessment of maternal health services: a comparative study of urban and rural primary health facilities in Kano State, Northwest Nigeria. Pan Afri Med J 38: 1-13. [crossref]
        27. Oosthuizen SJ, Bergh A-M, Pattinson RC, Grimbeek J (2017) It does matter where you come from: mothers’ experiences of childbirth in midwife obstetric units, Tshwane, South Africa. Rep Health 14: 1-11. [crossref]
        28. Nnebue CC, Ebenebe UE, Adinma ED, Iyoke CA, Obionu CN, et al. (2014) Clients’ knowledge, perception and satisfaction with quality of maternal health care services at the primary health care level in Nnewi, Nigeria. Niger J Clin Pract 17: 594-601. [crossref]
        29. Fikre R, Eshetu K, Berhanu M, Alemayehu A (2021) What determines client satisfaction on labor and delivery service in Ethiopia? Systematic review and meta-analysis. PLoS ONE 16: e0249995. [crossref]
        30. Amdemichael R, Tafa M, Fekadu H (2014) Maternal Satisfaction with the Delivery Services in Assela Hospital, Arsi Zone, Oromia Region. Gynecol Obstet (Sunnyvale) 4: 257.
        31. Gashaye KT, Tsegaye AT, Shiferaw G, Worku AG, Abebe SM (2019) Client satisfaction with existing labor and delivery care and associated factors among mothers who gave birth in university of Gondar teaching hospital; Northwest Ethiopia: Institution based cross-sectional study. PLoS ONE 14: e0210693. [crossref]
        32. Ayamolowo LB, Odetola TD, Ayamolowo SJ (2020) Determinants of choice of birth place among women in rural communities of south-western Nigeria. Int J Afr Nursing Sc 13: 1-7.
        33. Amu H, Nyarko SH (2019) Satisfaction with Maternal Healthcare Services in the Ketu South Municipality, Ghana: A Qualitative Case Study. BioMed Research International 2019: 2516469. [crossref]
        34. Odetola TD, Fakorede EO (2018) Assessment of Perinatal Care Satisfaction amongst Mothers Attending Postnatal Care in Ibadan, Nigeria. Annals of Global Health 84: 36-46. [crossref]
        35. Uzochukwu BSC, Onwujekwe OE, Akpala CO (2004) Community Satisfaction with the quality of Maternal and Child Health Services in Southeast Nigeria. East Afr Med J 81: 293-299. [crossref]
        36. Dahiru T, Oche MO (2013) Determinants of antenatal care, institutional delivery and postnatal care services utilization in Nigeria. Pan Afr Med J 21: 321. [crossref]
        37. Ishola F, Owolabi O, Filippi V (2017) Disrespect and abuse of women during childbirth in Nigeria: A systematic review. PLoS ONE 12: e0174084. [crossref]
        38. Orpin J, Puthussery S, Davidson R, Burden B (2018) Women’s experiences of disrespect and abuse in maternity care facilities in Benue State, Nigeria. BMC Pregnancy and Childbirth 18: 1-9.
        39. Maung TM, Mon NO, Mehrtash H, et al. (2021) Women’s experiences of mistreatment during childbirth and their satisfaction with care: findings from a multi-country community-based study in four countries. BMJ Global Health 5: e003688.
        40. Ebuehi OM, Akintujoye IA (2012) Perception and utilization of traditional birth attendants by pregnant women attending primary health care clinics in a rural Local Government Area in Ogun State, Nigeria. Int J Women’s Health 4: 25-34. [crossref]
        41. Ogunyemi AO, Ogunyemi AA, Olufunlayo TF, Odugbemi TO (2019) Patient satisfaction with services at public and faith based primary health centers in Lagos State: A comparative study. J Clin Sci 16: 75-80.
        42. Esienumoh EE, Akpabio II, Etowa JB et al. (2016) Cultural Diversity in Childbirth Practices of a Rural Community in Southern Nigeria. J Preg Child Health 3: 280.
        43. Asres GD (2018) Satisfaction and Associated Factors among Mothers Delivered at Asrade Zewude Memorial Primary Hospital, Bure, West Gojjam, Amhara, Ethiopia: A Cross Sectional Study. Prim Health Care 8: 293.
        44. Okumu C, Oyugi B (2018) Clients’ satisfaction with quality of childbirth services: A comparative study between public and private facilities in Limuru Sub-County, Kiambu, Kenya. PLoS ONE 13: e0193593. [crossref]
        45. Tadesse BH, Bayou NB, Nebeb GT (2017) Mothers’ Satisfaction with Institutional Delivery Service in Public Health Facilities of Omo Nada District, Jimma Zone. Clin Med Res 6: 23-30.
        46. Costa DDOO, Ribeiro VS, Ribeiro MRC, Esteves-Pereira AP, Sá LGC, et al. (2019) Psychometric properties of the hospital birth satisfaction scale: Birth in Brazil survey. Cad Saúde Pública 35: e00154918. [crossref]
fig 3

Accountability for SRHR Under Universal Health Coverage

DOI: 10.31038/AWHC.2022524

Introduction

Accountability describes a relationship between a duty holder and a person or organization to whom a duty is owed. Accountability is constituted of three different elements: engagement of citizens with power holders in shaping responsibilities, answerability of power holders to citizens, and enforcement of action on power holders who fall short on their duties (Figure 1) [1].

FIG 1

Figure 1: Different elements of accountability

WHO states SRHR “encompasses efforts to eliminate preventable maternal and neonatal mortality and morbidity, to ensure quality sexual and reproductive health services, including contraceptive services, and to address Sexually Transmitted Infections (STI) and cervical cancer, violence against women and girls, and sexual and reproductive health needs of adolescents” [2].

Accountability for sexual and reproductive health and rights (SRHR) in the context of Universal Health Coverage (UHC) entails:

  • Power holders engaging citizens and SRHR organizations while framing UHC legislation, policies, plans, financing arrangements and budgets; as well citizens and SRHR organizations influencing these processes from outside,
  • Citizens/clients, rights-based organizations, professional bodies and research institutions holding Ministries of Health, other relevant Ministries, and private health sector answerable for implementing SRHR sensitive UHC plans. It also entails the state holding private health sector and its own functionaries answerable internally, and
  • The state or/and citizens enforcing sanctions when power holders are not able to ensure comprehensive SRHR universally and without catastrophic expenditure.

Accountability for SRHR in the context of UHC is important if Sustainable Development Goal (SDG) target 3.8 and 5.6 are to be achieved. SDG target 3.8 states “Achieve universal health coverage, including financial risk protection, access to quality essential health-care services and access to safe, effective, quality and affordable essential medicines and vaccines for all”. SDG 5.6 specifically refers to SRHR. It emphasizes “Ensure universal access to sexual and reproductive health and reproductive rights as agreed in accordance with the Programme of Action of the International Conference on Population and Development and the Beijing Platform for Action and the outcome documents of their review conferences”. In the context of these international commitment, this paper fleshes out concepts in accountability, and show cases accountability strategies, interventions, tools, systems and mechanisms from different countries. It then pulls out lessons on making accountability for SRHR work in the context of UHC.

Unpacking Accountability

It is possible to distinguish between an accountability strategy, accountability intervention, accountability tool, accountability system, and accountability mechanism [3]. The first three are discussed in the context of SRHR, while the last two are outlined with reference to SRHR and its social determinants. “Accountability strategy” for SRHR in the context of UHC is an overarching set of interventions of governments, rights-based organizations, professional bodies, marginalized sector etc. to ensure accountability of power holders from national to local level. An “accountability intervention” refers more narrowly to the implementation of components of accountability strategy. Examples including, holding public hearings on unsafe abortions or strengthening village health committees to encourage men to adopt contraception, institutional delivery and expand access of women to iron tablets. An “accountability tool” is the use of particular accountability tool within the context of a given intervention. Examples include community scorecards of SRH services in facilities to assess qualities and public interest litigation to find out what kind of SRH services has been covered under public health insurance. Several different tools may feed into an accountability intervention. An “accountability system” for SRHR in the context of UHC may involve a “larger system” of accountability to gender and equity in general, beyond SRHR. Gender based violence protection committees, land and housing rights movement are examples. Accountability mechanisms explain what accountability strategy, instrument and tool works or does not work in what contexts.

The principle of participation, transparency & democracy, citizenship & human rights and substantive equality are crucial to any accountability process, including for SRHR in the context of UHC (Figure 2). These principles are elaborated below.

  • Participation: Participation can range from being “informed” to “influencing”, “agenda setting” or “decision making” on SRHR in the context of UHC. The higher order of participation is important.
  • Citizenship and human rights: Citizenship refers to the state of being a member of a particular country and having rights because of it. It is distinct from the term patient or client in the context of SRH services, in that one is referring to a rights holder vis a vis the state who may make demands even when healthy. The concept of citizenship is linked to the concept of human rights inherent to all human
  • Transparency and democracy: Transparency means placing all financial and public information and data including on SRHR in UHC in an easy-to-use and readily accessible manner. This allows citizens to see clearly how public servants are spending tax money and gives citizens the ability to hold their elected officials accountable. A vibrant democracy is central to transparency.
  • Substantive equality: Substantive equality recognizes that everybody is not the same and the specific needs of marginalized people have to be taken into account while framing SRHR in UHC plans and delivering services. Substantive equality financing packages will allow women to access abortion facilities anywhere within a district or province to allow for privacy.

fig 2

Figure 2: Principles underpinning accountability

Stakeholders in Accountability for SRHR in UHC and Their Roles

Several stakeholders need to be involved in accountability processes. These include policy makers, planners, service providers, health research institutes, health economists’ donors, professional bodies, local government, private health sector, marginalized groups, unions, organizations working on SRHR, lawyers collective etc. (Figure 3).

fig 3

Figure 3: Stakeholders in accountability for SRHR

Policy makers, and planners can bring the national perspective on SRHR in UHC into accountability, monitoring, evaluation and review. Donors can harness their international and regional perspectives. Involvement of professional bodies- doctors to village nurses- in accountability mechanisms ensures that technical perspectives and practical constraints that have a bearing on SRH are examined, and also ensures self-regulation towards SRHR in the context of UHC. Involvement of professional associations/unions of health workers is also important to ensure that there is no backlash against them through accountability processes. Involving health research institutes and health economists is crucial to use available research on SRHR for fostering accountability. Further, they may help to strengthen accountability interventions and tools itself from a SRHR in UHC lens. Groups working with a legal perspective on SRHR, may highlight legal measures that are required to make SRHR in UHC effective, or even go beyond like address social determinants of health. Involvement of private-not for profit health sector may also point to innovative ways of approaching SRHR in UHC.

From the bottom up, groups representing marginalized groups in terms of SRHR help to ensure that intersecting disadvantages and needs related to SRHR have been addressed the UHC and hold power holders to account in its translation. Citizens groups often draw up their own charter and could monitor the inclusion of SRHR in UHC plans and examine issues of quality of care and affordability. Local, national, and regional level SRHR organizations help generate qualitative data outside the health management information system on SRHR in UHC which can strengthen accountability. If these SRHR organizations are invited by the national government for review of progress on UHC they may help analyses public data from the vantage view of most marginalized. They can also create shadow reports before the official national level health reviews or before the Voluntary National Report on SDGs, and promote accountability from the bottom up.

Accountability with Respect to What SRHR Indicators?

There are four set of indicators that could be used in accountability system for SRHR in the context of UHC (Figure 4).

First, the extent to which comprehensive SRH services are covered under UHC, in a progressive manner (that is, with most marginalized being given priority).

Second, the extent to which financing arrangements prevent catastrophic expenditure on these services, again with a focus on the most marginalized groups [4]. The expenditure could be on getting to the service delivery point, accessing services, accessing drugs and supplies, and (direct/indirect costs of) adherence to treatment.

Third, inequalities in access to services under UHC, in health expenditure as a percentage of total household income and inequities in SRH and RR outcomes Inequities could be across class, caste, race, ethnicity, religion, migration status, marital status, spatial location, gender orientation, sexual identity, national identity etc.

Fourth, is around quality of SRHR services and promotional activities.

All four aspects- SRH service coverage, financing arrangements, quality of care, and inequities- can be discussed in terms of input, outputs and outcomes and related indicators, leading to a matrix of indicators (Nigel et al. 2016). Figure 4 gives an illustration of such a matrix, though it cannot claim to be a comprehensive list of indicators on SRHR in UHC. Data for inputs can be collected from qualitative and quantitative studies by health research institutions and SRHR groups. Data for process indicators can be gathered through review of policy documents, facility readiness assessment and client feedback at service delivery points. Outputs require review of policy documents, interviews with clients back home of different identities and in different locations and, health financing data.

fig 4

Figure 4: Accountability for SRHR in UHC – Examples of Indicators

Some sub-indicators to be looked into while focusing on service coverage and financial protection is what SRH services are covered and protected, what are not and for whom. It is important to examine if culturally sensitive services like safe and legal abortion and male sterilization, and low priority but expensive ones like sex realignment surgery are included, and whether services for adolescent girls, never married women, transwomen and transmen, women in sex work etc. are available.

Country Case Studies

Using Universal Progress Reviews to Advocate SRHR in the Context of UHC: The Case of Philippines

The Universal Progress Reviews (UPRs) were institutionalized in 2008 by the UN General Assembly as a mechanism for countries to report on their countries’ progress on human rights. The outcome of the review by reviewing countries includes a set of recommendations form the reviewing states, response of the national government and any voluntary commitment by the state on follow up of the recommendations. A total of 21,956 recommendations and voluntary commitments were made between 2008 and 2012, of which 5,720 (26%) pertained to SRHR and gender equality [5]. Seventy-seven of these were formally accepted by the states. There were 12 sessions held during this period, and the proportion of recommendations and voluntary commitments on SRHR and gender equality increased form 20% in the first session to 33% in the last session. Issues of lifting of reservations, gender-based violence, discrimination based on sexual orientation, maternal mortality, female genital mortality, and morbidity received attention in the UPRs [5].

The potential and challenges in using the UPR to promote SRHR is illustrated by the case of Philippines, wherein Family Planning Organization of the Philippines and Sexual Rights Institute lobbied in the UPR, 2012 for a comprehensive SRH law and policy, legalization of abortion age appropriate sexuality education, better contraceptive services, sexuality education, posting adequate number of midwives, and conduct of maternal death reviews [6]. The reviewing countries recommended passing of Reproductive Health law, legislation protecting rights of sexual and gender minorities, access to universal SRH services, enrolling poor in health insurance, addressing gender-based violence, strengthening family planning services and providing abortion for rape, incest, and risk to life of mothers [7]. A Reproductive Health Bill was passed by the Assembly of Philippines in 2012, but it has been as the pressure from the Church which is high in some provinces, and implementation is devolved. Contraception for adolescent is far from reality. Further, budget for contraception has been reduced and but parental/spousal consent is still required in some provinces, and emergency contraception is not easily available [8].

National Health Insurance: Weaving in SRH and Progressive Coverage in Zambia

The government of Zambia established UHC as a priority in its most recent National Health Strategic Plan (NHSP 2017-2021). In September 2017, the government developed a 10-year national health financing strategy and the mandatory National Health Insurance Scheme (NHIS). A National Health Insurance Act was then in April 2018 and a National Health Insurance Authority (NHIA) with a board was formed to manage the insurance scheme with an ambitious target of 100% coverage. In the early stages of designing the scheme there was little participation of SRHR groups. It is in this context that Population Action International and national organization Center for Reproductive Health Education came together in 2018 to organize a two-day workshop for 20 advocacy and service delivery civil society organizations, academicians, and representatives of medical associations. The objective of the workshop was to understand Zambia’s UHC financing policy reforms, their implications for SRH services, drugs and supplies and to develop an advocacy strategy for constructive engagement of civil society actors with the Ministry of Health and National Health Insurance Authority. A Ministry of Health official and a Zambian legal expert participated in the workshop, helping to understand Zambia’s health financing and legal landscapes, and timelines and functioning of the National Health Insurance Authority governing body and fund. Population Action International provided technical inputs as health financing and National Health Insurance Scheme was new to the civil society groups. It was also able to harvest relevant experience from other countries. The workshop examined whether National Health Insurance Scheme protects the existing National Health strategy – which prioritizes maternal health, adolescent sexual health education, contraception, Sexually Transmitted Infections, human immunodeficiency virus, and acquired immunodeficiency syndrome, cervical cancer screening and health services for survivors of violence. Three advocacy agendas emerged through the workshop: a) gather evidence on of out of pocket spending on SRH services and commodities and to advocate that comprehensive SRH is included in the essential service package b) include a civil society representative in the board of National Health Insurance Authority and its technical committees c) Help achieve communications objectives of National Health Insurance Scheme, in particular to reach information to women and girls in the informal sector, While the exact impact is not known of this advocacy, sexual and reproductive health organizations are being consulted by the government in deciding service package and they are represented in the National Health Insurance Authority committees, though not Board. Information is reaching women and girls in the informal sector on the scheme [9]. Population Action International is also intervening in India, Ghana, Ethiopia, Kenya and Uganda on UHC to strengthen integration of SRHR into package and financing.

Political Accountability to SRH through Interparliamentary Forums: The Case of Eswatini

Southern and Eastern African Parliamentary Alliance of Committees of Health (SEAPACOH) acts as a forum to strengthen political accountability to SRH in the region. Not only Parliamentarian, but also civil society and regional organizations attend the meetings of SEAPACOH to exchange information, facilitate policy dialogue, and identify concrete actions to advance health equity and sexual and reproductive health in the region. One of the countries that presented in the 2011 meeting of SEAPACOH was Swaziland (now called Eswatini). The Parliamentarian form Swaziland observed that the country had put in place an SRH strategic plan (2008-2015), a National Condom Strategy for men and women and a strategy to integrate SRH and HIV interventions. Nevertheless, he/she observed that implementation has been constrained by absence of SRH Policy, difficulty in mobilizing financial support and over prioritization of HIV over other SRH needs [10]. Comments then followed from the larger SEAPCOH forum on the need for the country to put in place overarching comprehensive SRH policy, strategies to accelerate reduction in maternal mortality, strengthen maternity waiting huts or homes near the hospital. Information on how far these comments have been acted on is not clear, and whether integrated into essential service packages and financing under UHC plans.

The UHC Card: The Case of Argentina

Argentina, an upper-middle-income country, has a well-developed health system, particularly comparing to standards of low- and middle-income countries. Although all inhabitants of Argentina are entitled to receive health carefree of charge in public facilities, UHC is still aspirational rather than actual. Quality of care is still an issue and inequalities in access and outcomes between rich and poor provinces. Variations in infant mortality rate, maternal mortality rate and cervical cancer screening and treatment prevail. To bridge such gaps officials from the Ministry of Health evolved a dashboard of key indicators that would be used to monitor UHC, called the UHC score card. Sixty-five indicators at primary health care level were selected of a total of 166 indicators identified initially. These UHC indicators were classified into five domains: system, inputs, service delivery, results and impact. Of the 65 indicators the ones that could have a bearing on SRH in the context of UHC are given in Table 1 below.

Table 1: Indicators across domains pertaining to SRH in Argentina UHC scorecard

Domains Indicators
1. System • Proportion of people with exclusive public coverage that have access to basic health services

• Proportion of people with exclusive public coverage assigned to a primary care facility

• Proportion of primary care facilities with geographical responsibility defined

• Proportion of primary care facilities that bill to social security

• Current primary health-care expenditure per capita

Inputs  Nurse density (per 10 000 population)

• Primary care doctor density (per 10 000 population)

• Health-care facility density (per 100 000 population)

• Vaccine supply according to risk groups

• Essential drugs availability according to target population

Service delivery • Barriers to access due to cost of treatment

• Barriers to access due to distance

• Dropout rate of treatment

Success rate of treatment


Results • Rate of women aged 25–64 years with cervical cancer screening

• Women aged 25–64 years that have started treatment for high-grade squamous intraepithelial lesions or invasive cervical cancer


Impact • Adult mortality from non-communicable diseases

• Maternal mortality

• Neonatal mortality

• Rate of hospitalization for primary-care-sensitive conditions

These indicators could be more SRH and RR aware, like availability of essential drugs related to SRH morbidity could be included under inputs, barriers to access due to health providers attitude (like on provision of safe and legal abortion) could be included under ‘service delivery’, rate of adolescents who get contraception on demand could be included under results and indicators like reduction in anemia amongst women of reproductive age could be included under impact.

Near Miss Maternal Case Review: Armenia, Georgia, Latvia, Republic of Moldova and Uzbekistan

WHO has been advocating “near miss maternal case reviews” since 2004, and guidelines were evolved in 2015. As there are less legal implications of near miss maternal case reviews than maternal death audits, the reviews will lead to more honest analysis and recommendations. Further the user’s views can potentially be secured unlike the case of maternal deaths. The WHO 2015 checklist for near miss maternal case reviews consisted of 50 items, grouped in 11 domains (internal organisation, ground rules, case identification, case presentation, inclusion of users’ views, case analysis, recommendations, follow up, documentation and diffusion and ensuring quality of near miss maternal case reviews). This checklist was used in the review of near miss maternal case reviews in the five countries. The sources of information for the assessment include direct observation of one or more near miss maternal case reviews sessions, discussion with participants, coordinators and managers and review of documents [11]. The findings from the review suggest that the quality of the near miss maternal case reviews implementation was heterogeneous among different domains, different countries, and within the same country. Overall, the first part of the audit cycle (from case identification to analysis) was performed on most indicators. However, users’ views were rarely secured. The second part (developing recommendations, implementing them and ensuring quality) was poorly performed- in particular implementation. There were inter country and intra country variations. In the ex-Soviet countries, hierarchies prevailed and even midwives were not involved. The tendency was for the doctors to affix blame on one staff, rather than look at health system issues and coming with organizational solutions. There were intra country variations too. Each country had at least one champion facility, where quality of the near miss maternal case reviews cycle (around one and a half years) was well completed from analysis to implementing recommendations. In the context of UHC, the implication of health financing policies needs to be examined in maternal health service access, utilization and outcomes.

Monitoring of Insurance Schemes from an SRH Lens: Mexico and India

In Mexico, the maternal mortality rate is 60 per 100,000 live births. While this is lower than many African counties, these deaths are concentrated among rural indigenous women and Afro-descendant women living in extreme poverty. The World Bank-funded “Coverage Extension Program” target marginalized communities and include maternal health among their priorities. In addition, there is the “Fair Start in Life” (APV) program which was specifically designed to address maternal and infant health. Fundar (an independent and interdisciplinary organization devoted to research issues) and its partners’ analysis of fund allocation of APV revealed that the maternal health budget was insignificant and that per capita expenditures were lowest in the regions of the country with the highest concentration of poverty. Furthermore, targeted programs did not improve health infrastructure or provide emergency obstetric care and mainly focused on prenatal care. Fundar and its partners also examined the government ‘s Seguro Popular or popular health insurance. On the positive side, the insurance program receives the majority of its funding from the federal government, with small contribution from the states. This reduces inequalities across states and between employed and unemployed. However, detailed budget information that had been previously available became hidden within huge budget categories. Seguro Popular did not initially include emergency obstetric care services. The coalition working on maternal mortality undertook the task of pricing the provision of basic and comprehensive emergency obstetric care and demonstrated its viability and life-saving relevance. As a result, a series of emergency obstetric care-related services and interventions were ultimately included in the program. Other areas the coalition advocated was utilisation of budget earmarked for infrastructure between 2004 to 2007, as 70% of funds for infrastructure was unspent. Through the analysis and advocacy strategies of Fundar and its partners, the profile of maternal mortality has been raised, and it is had become a public issue related social justice, gender, class and race. Allies in the Ministry of Health and Gender Equality Commission in Congress helped push emergency obstetric care. On the other hand, budget transparency varied across regimes and posed challenges [12].

Private Health Sector Accountability to Reproductive, Maternal, Newborn, and Child Health

The government policies in India seek to engage the private sector through public-private partnerships, insurance, and other schemes, including for reproductive, maternal, new-born, and child health (RMNCH). Through the USAID supported Vriddhi project, John Snow Inc (JSI), India conducted an assessment of RMNCH service delivery in the private sector [13]. Using a mixed-methods approach, the assessment gathered information from over 300 respondents, including facility-based private providers; professional associations; pregnant women and mothers with children under five years of age; government representatives at the national, state, and district levels; and social enterprises in 7 districts across 6 states, namely Delhi, Himachal Pradesh, Jharkhand, and Uttarakhand. The study revealed that only 37 of 87 Inpatient Departments had legal registration to provide medical services. Very few facilities were accredited under recognized systems. None of the facilities provided all RMNCH services as per global or national guidelines. There were gaps in knowledge of contemporary treatment guidelines. The study also found that only 20 of 67 of facilities provided the entire range of RMNCH services. The most commonly provided service was delivery care. The number of reported caesarean sections was much higher than expected, and many did not provide newborn care services. Private providers had reservations about participating in a government-supported health insurance program for the poor, citing that the program does not cover actual costs and that reimbursement is often delayed. In contrast, government representatives suspected that private providers submitted inflated bills and wrongful claims under the program. At the same time the study found that pregnant women often prefer to seek treatment from private providers. Almost all clients highlighted ease of access, time given by providers, better nursing facilities and cleanliness as top reason for private sector preference. However, clients revealed a preference for government facilities if doctors were accessible around-the-clock, as better counselling services were provided on RMNCH. The results of the assessment and recommendations were discussed at a national consultation with public and private sector stakeholders in 2017. The recommendations include establishing public-private partnerships cells at state level and building capacities of private medical professionals on RMNCH and government-endorsed RMNCH guidelines and protocols. Seven thousand medical practitioners were trained through the process.

Community and Service Provider Accountability to SRHR

SRHRs are co-produced/fulfilled by health providers and communities- comprising of marginalized citizens and gate keepers. The Center for Health and Social Justice (CHSJ), an Indian health rights-based organization, formed father’s groups and adolescent boys’ groups with the objective of fostering them to be responsible partners and caring fathers/brothers. The larger goal was to promote women’s rights. As of 2018 this initiative of CHSJ was operational in five states of India. In the state of Jharkhand, marginalized men and women (form indigenous groups, Dalits, women headed households) came together with local government representations, front line health and nutrition workers and interested schoolteachers to prioritize problems related to health and its social determinants through a secret ballot. On the basis of this participatory exercise, a citizen’s charter was evolved in 30 villages in three districts of the state of Jharkhand. A unique feature was that the charter was on what men would do to foster women and children’s health and empowerment. The charter included men’s commitment to monitor health and nutrition services and public distribution system along with women’s groups, encourage women and children to make use of the anganwadi centers (centers for early childhood development and care of pregnant and breast feeding mothers) centers and health sub centers, accompany pregnant women go to health facilities for ANC and institutional delivery, taking children for immunization, (men) adopting contraceptive methods, ending child marriage, and preventing acts of violence on women and children. The charter is hung in prominent places like tea shops, anganwadi centers and schools. However, the use of the chart for actually strengthening accountability of men or service providers varies across villages, dependent on vibrancy of women’s and fathers’ groups. In some villages, there were reports of reduction in domestic violence, men helping in housework, and accompanying women and children to facilities. However, issues like access to safe abortion, screening of reproductive cancers, health referral in instances of gender-based violence or adolescent access to SRH services did not appear in the charter [14-17]. Neither did issues of health financing and monitoring expenditure on health as a percentage of total health expenditure.

Key Lessons and Messages

  1. Accountability for SRHR in UHC (SDG 3.8) needs to be seen along with accountability to SRHR in general (SDG 5). When SRHR policy and legislation is weak, like the case of Philippines, accountability to SRHR in UHC cannot be promoted.
  2. Accountability for SRHR in the context of UHC entails attention to SRHR in essential service package, access to marginalized, quality of SRH services, and issues of health financing and avoidance of catastrophic expenditure. The case study on health insurance in Mexico is a good illustration of this lesson.
  3. Examples of accountability for SRHR as answerability are more common than as enforcement and engagement (Table 2).
  4. There are many accountability interventions and instruments for SRHR. These include involvement of international to local women’s groups in monitoring, implementing UHC score cards and near miss maternal reviews, using UPRs to press for accountability, analysis of health expenditure and financing data, getting into health insurance committees and consultations. No one size fits all situations, and a strategy/system combining mix of interventions and instruments need to be adopted.
  5. Few of the examples of strengthening accountability for SRHR are in the context of UHC. This is particularly true at the community level. There is a need to demystify UHC and take it to community level, like what is happening in Mexico.
  6. There are few examples of ways in which controversial or sensitive SRH services were brought into the UHC through accountability strategies, interventions and instruments. This includes safe and legal abortion, treatment for violence etc. There are more examples related to maternal and child health. However, the Mexico case study illustrates how even emergency obstetric care was not included till it was provided “financially” viable.
  7. There are examples of UHC plans reaching MCH services to the poor, but few to stigmatized groups like sex workers, sexual and gender minorities. The Argentina scorecard is an example.
  8. There are more examples of citizens groups monitoring or holding state accountable on SRH in the context of UHC but few on strengthening private sector accountable to SRHR in the context of UHC. The Vriddhi project example from India is an exception. This is also true of holding private insurance and pharmaceutical industries to account for SRHR.
  9. SRHR in the context of UHC requires that gender and social norms in society change too. Men, community leaders and local governments need to be held accountable as well. The CHSJ example from India illustrates this.
  10. Many of the examples pertain to “surrogates” for marginalized – civil society actors or donors- holding national governments and service providers to account, but not the marginalized. The challenge is to reverse this.
  11. Higher middle-income countries are able to afford services in essential service package which some of the lower income/lower middle-income countries cannot. It is hence important to track donor funding to SRHR. Further it is crucial to monitor funding to health by government as part of GDP, and not just SRHR in UHC. The politics of budget allocation is crucial.
  12. Democratic framework a must to strengthen accountability for SRHR in UHC. It cannot be implemented from top (Eastern Europe/Central Asia case study). At the same time while working with local elected government is important, they also hold discriminatory views, and need to be challenges (the Philippines case study).

Table 2: Examples of accountability for SRHR sector

Country/focus

Accountability as engagement

Accountability as answerability

Accountability as enforcement

Mode of accountability

Instruments

1Philippines- Weaving SRH Legislation and policy Engagement of civil society with Universal Progress Reviews to advocate legal abortion, contraception and sexuality education Monitoring provision of contraception and abortion budget allocated Intervention Lobbying at Universal Progress Reviews


Monitoring


2 Accountability in SRH sector through interparliamentary forums


Southern and Eastern African Parliamentary Alliance of Committees of Health monitoring implementation of SRH plan and condom strategy. Intervention Monitoring by Inter Parliamentary Committee on Health
3.Zambia- Weaving SRH and progressive coverage insurance


Engagement of SRHR groups with national health insurance authority (NHIA) to prioritize SRH services for informal sector SRHR groups represented in NHIA committees Intervention Lobbying nationally


Capacity building of SRHR groups on health financing


Representation in NHIA committee

4. Mexico – Monitoring health insurance schemes


Evaluation of Fair start programmed and health insurance programmed; highlighting poor attention to EmOC, outreach to indigenous Evidence to show viability of EmOC in insurance; and its subsequent inclusion Intervention


Cost Benefit analysis


Lobbying

5. Argentina- SRH integrated UHC scorecard


Monitoring inputs, service delivery, results and impact- includes maternal health and reproductive cancer Instrument UHC score card
6. Armenia, Georgia, Latvia, Republic of Moldova and Uzbekistan –

Near miss maternal case review


Evaluation of “Near miss maternal care reviews” using checklist revealed the tendency to fix blame, not involve midwives and users, and not draw systemic lessons” Instrument Evaluation


Check list

7. India: Private health sector reproductive, accountability in maternal, newborn, and child health (RMNCH)


An assessment of RMNCH service in private facilities, capacity building of private providers based on findings – including on protocols on RMNCH[1] Intervention Review


Capacity building


8. India: Men’s and service providers’ accountability in SRHR


Implementation of citizen’s charter on men’s role in MCH, contraception, reducing gender-based violence (GBV) and monitoring inter sectoral services Intervention


Eco system


Implementing charter on men’s responsibility for care of women and children, making local providers accountable and preventing GBV

To sum up this paper argues that accountability for SRHR and accountability for UHC are both important. Further, accountability for addressing social determinants of SRHR is also crucial, including in the context of disasters, conflicts and pandemics. Accountability for SRHR to policy makers and planners is more common than to marginalized (in addressing intersectional barriers). Accountability for sensitive SRHR issues is less like accountability to provide safe and legal abortion services and health services for gender-based violence and making sure these are part of essential service package. On the other hand, accountability to bring down fertility is higher. Accountability for SRH Services within UHC for controversial groups like adolescents, sex workers, transgenders, religious minorities, and migrants is limited. Accountability systems, strategies, interventions and tools can be seen more for answerability, than enforcement of sanctions (for lack of accountability) and somewhere in between for engagement of citizens in policy making, planning and budgeting. Few examples exist of accountability of private health services and insurance for SRHR. Democracy, active citizenship and resources are a must for accountability for SRHR in the context of UHC. Ultimately accountability to SRHR in the context of UHC is about the tilting the balance of power towards marginalised, public health sector and front-line workers.

References

  1. Caseley J (2003) Blocked Drains and open minds: multiple accountability relationships and improved service delivery performance in Indian city. Institute of Development Studies (IDS) Working Paper 211.
  2. World Health Organisation (2014), Sexual and reproductive health and rights: a global development, health and human rights priority, Comment, Lancet 384: e30-1. [crossref]
  3. Belle Van Sara, Vicky Boydell, Asha S George, Derrick W Brinkerhof, Rajat Khosla (2018) “Broadening Understanding of Accountability Ecosystems in Sexual and Reproductive Health and Rights: A Systematic Review” edited by J. P. van Wouwe 13: e0196788. [crossref]
  4. O’Neill K, Viswanathan K, Celades E, Boerma T (2016) Monitoring, evaluation and review of national health policies, strategies and plans. Strategizing national health in the 21st century: a handbook. Geneva: World Health Organization 1-39.
  5. Gilmore K, Mora L, Barragues A, Mikkelsen IK. (2015) The universal periodic review: A platform for dialogue, accountability, and change on sexual and reproductive health and rights. Health & Hum. Rts. J 17: 167. [crossref]
  6. Family Planning Organisation of the Philippines and Sexual Reproductive Rights Institute, 2012
  7. (2012) UPR of the Philippines 2nd Cycle 13th Session, Matrix of Recommendations https://www.ohchr.org/EN/HRBodies/UPR/Pages/PHindex.aspx Last accessed 20th February, 2020.
  8. Lloyd, Cristyn 2018, Whatever happened to The Philippines’ reproductive health law.
  9. Population Action International, (2019) Seizing the Moment: How Zambian Sexual and Reproductive Health Advocates are Accelerating Progress on Universal Health Coverage Finanicng.
  10. Ministry of Health, 2011, Presentation of the portfolio health committee from the parliament ofSwaziland, SEAPACOH meeting Kampala, Uganda.
  11. Bacci A, Hodorogea S, Khachatryan H, et al. (2018) What is the quality of the maternal near-miss case reviews in WHO European Region? Cross-sectional study in Armenia, Georgia, Latvia, Republic of Moldova and Uzbekistan. BMJ Open 8: e017696. [crossref]
  12. International Budget Partnership and the International Initiative on Maternal Mortality and Human Rights (2009), THE MISSING LINK Applied budget work as a tool to hold governments accountable for maternal mortality reduction commitments, USA.
  13. John Snow Inc, (2019) News and Stories: Engaging the Private Sector to Improve Reproductive Maternal and Reproductive Health in India.
  14. Murthy RK (2018) New Frontiers in working towards gender equality and child rights? Evaluation of the project.
  15. UPR Submission on the Right to Sexual and Reproductive Health in the Philippines 13th Session of the Universal Periodic Review – Philippines – June 2012.
  16. Population Action International, 2019 UHC Country Level Action, Last accessed 20th February, 2020.
  17. Rubinstein, Adolfo Mariela Barani, Analía S Lopez c2018) Quality first for effective universal health coverage in low-income and middle-income countries 6: e1142-e1143. [crossref]

Mind-Set Based Signage: Applying Mind Genomics to the Shopping Experience

DOI: 10.31038/NRFSJ.2022523

Abstract

The paper presents a new approach to optimizing the shopper experience, combining easy-to-implement tools for understanding shopper mind-sets at the granular, specific level (Mind Genomics; www.BimiLeap.com) with a simple, rapid way which assigns any shopper or prospective shopper to the relevant mind-set for that granular topic (www.PVI360.com). The approach begins with a simple study of the motivating power of relevant messages, and thus uncovers mind-sets or groups of respondents showing similar patterns of what motivates them. Then, using the same data, the approach creates a simple questionnaire comprising six questions taken from the original study, the pattern of answers to which assign a new person to a mind-set. Once the mind-set of the shopper is ‘identified’ for the granular topic using the PVI (personal viewpoint identifier) it is a matter of giving the shopper the appropriate motivating message, either at the time of shopping in brick and mortar store or e-store, or sending the message on the Internet in the form of an advertisement or individualized coupon.

Introduction

The past two decades have seen an explosion of knowledge about the consumer, the knowledge emerging from the speed and affordability of internet-based surveys, the sophisticated analysis of masses of cross-sectional data known as Big Data, and the application of artificial intelligence to uncover patterns. What continues to emerge is that nature is simultaneously tractable and intractable. As the macro level we know what to expect in terms of purchase patterns and expected time to repurchase, some of which knowledge may transfer to the level of the individuals, only for the general pattern just exposed to be disrupted by the idiosyncrasies of each individual.

The world at the time of this writing (Fall, 2022) is quite different from the world of just a decade ago, and most certain far different from the earlier decades. The notion that one could change advertisements is well-accepted, easily and widely done. Outdoor advertisements and LED technology assault us everywhere we go. We are accustomed to see large billboards with attention-grabbing sequences advertisements, the modern day evolution of signage of decades ago, once static, now plastic, and changeable at will. Now technology makes it possible to individualize the messaging for an individual, much as is done on a cell phone. This paper presents one approach.

The organizing nature of this paper is how one might advertise to a single customer, using science to uncover the ‘mind’ of that customer ahead of time. The objective of this study was to understand the different types of messages which might appeal to shoppers of cereal in the middle isle, and shoppers of yogurt in the refrigerated dairy section. Could the technology of 2022 be set up to deliver the proper messages to an individual who is walking along the store and could the approach be set up to be done at scale, affordably, quickly, with scientific precision rather than with guessing about what the person wants based upon who the person is. This latter condition is important. It means that the messages must be delivered to the person most likely to respond to the specific messages.

The studies reported here were done with the intention of testing out the possibility that one could create a knowledge-based system about messaging for simple, conventional, familiar products. The paper does not deal with new to the world products which have their own mystique, and both positive and negative messaging attached. Rather, the paper deals with what one might call ‘tired, old, utterly familiar’ products that may not be susceptible to the romance of the new and different.

A Short Historical Overview to ‘Messaging the Shopper’

The notion that one can influence the shopper by proper messaging is decades old, and the subject of numerous experiments. Indeed, the real-world behaviors of shoppers and the change in behavior resulting from the proper messaging opens up the topic to anyone interested in messaging, whether the interest be theory such as experimental psychology, to applied science such as consumer psychology, and of course the world of business applications. As a consequence, there have been a number of different studies focusing specifically on shopping [1-8].

  1. Schumann et al. (1991) reported only modest effectiveness of signage in shopping cart. To summarize their results: “Findings from both studies reflect that over 60% of the 2 samples… noted the presence of the signs in their carts. When Ss were questioned about their awareness of cart advertising on a specific occasion, only 3.0–6.5% recalled the product. There was no evidence that cart signage acts in a subliminal fashion that results in the purchase of the brand.” It may well be the signage in the cart was general information about the product, not necessarily information that would tug at the heartstrings of the shopper.
  2. Dennis et al. (2012) confirmed the efficacy of digital signage but argued for emotional content. They noted that the typical content of digital signal is ‘information-based’ whereas digital signage might be more effective if it were to comprise emotional messaging as well, or even instead of simple information. Results are limited as the DS (digital signage) screens content was information based, whereas according to LCM, (Limited Capacity Model of Mediate Messaging) people pay more attention to emotion-eliciting communications. The results have practical implications as DS appeals to active shoppers.
  3. Buttner et al., (2013) proposed at two types of shopping orientations (mind-sets), task focused and experiential shopping, respectively. They report that “Activating a mindset that matches the shopping orientation increases the monetary value that consumers assign to a product. …. marketers and retailers will benefit from addressing experiential and task-focused shoppers via the mindsets that underlie their shopping orientation.
  4. Chang and Chen (2015) reported that mind-sets are important, and that the communication should consider the different mind-sets. Their notion was that people may or may not be skeptical to advertising. Those who have a ‘utilitarian orientation’ and an ‘individualistic’ mind-set tend to be skeptical about advertising, and need messages which are different from those individuals who have a ‘hedonic’ and a ‘collectivistic’ mind-set. Chang and Chen bring this topic into discussions about CRM and donating, but their notions can be easily extended to the right type of messaging for digital signage.

The Contribution of Mind Genomics to the Solution

Mind Genomics is an emerging science which grew out of the need to understand how people make decisions about the issues of the ‘everyday’. Mind Genomics rests on the realization that the ‘everyday’ situations are compounds of different stimuli. To study these stimuli requires that the respondent, the test subject, be confronted by compound test stimuli which comprise different aspects of everyday situation, stimuli that the respondent ‘evaluates’, such as rating the combination. Through statistics, applied after the researcher properly sets up the blends, it becomes possible to understand just exactly what features ‘drive’ the rating. Properly executed, this seeming ‘roundabout way’, testing mixtures, ends up dramatically revealing the underlying mind of the respondent. (Gere et al., 2020; Moskowitz et al., 2019).

The foregoing process, testing systematically created mixtures and deconstructing through statistics, stands in striking opposition to the now-hallowed approach of ‘isolate and study.’ The traditional approach requires that the features of the everyday be identified, and separately evaluated, one feature at a time. Typically the evaluation ends up presenting each of the features separately, getting a rating, analyzing the pattern of ratings across people, and then identifying the key variables which a difference.

Attractive as the traditional methods may be, the one-at-a-time is severely flawed for several reasons:

  1. Combinations of features are more natural. It may be that a feature will receive a different score when evaluated alone compared to the evaluation of the feature as part of a mixture. And it may be that the feature will receive different scores when evaluated against backgrounds provided by a variety of other features. Thus, the wrong answer may emerge.
  2. People may change their criterion of judgment when presented with an array of different types of features, such as features dealing with product safety versus features dealing with branding, with benefits, and so forth. All too often the researcher AND the respondent fail to recognize the underlying shifts in these criteria.
  3. It becomes very difficult to ‘game the system’ when the test stimulus comprise a combination. Often, and perhaps even without knowing it, the respondent tries to assign the ‘correct’ or ‘socially appropriate’ answer. Such effort to ‘be right’ is doomed to failure when the respondent is presented with a combination. Often the respondent asks the researcher or interviewer for ‘help’, such as asking ‘what do I pay attention to in this combination?’

Mind Genomics works with the response to combination of text messages, called vignettes. The vignettes comprise specified combinations of elements, viz., verbal messages. Table 1 below (left part of table) shows these messages. The messages are sparse, to the point, paint a word picture. The vignettes are created according to an underlying plan called an experimental design. The experimental design may be thought of as a set of different combinations, different recipes, combining the same messages, the same elements, in different ways.

Table 1: Positive elements for cereal, viz., those elements which drive the rating of a vignette towards definitely buy/probably buy). All elements shown have positive coefficients of +2 or higher.

table 1(1)

table 1(2)

A key difference between Mind Genomics and conventional research is how Mind Genomics considers variability among people and how it deal with that variability. We start the comparison by considering conventional research, which often considers variability in the data to be error, usually unwanted error which masks the ‘signal’. Occasionally the variability can be traced to some clear factor, such as the nature of the respondent, in which case this irritating variation hiding the signal is actually a signal itself. For the most part, however, researchers consider variability to be unwanted, and either suppress it by meticulous control of the test stimulus/situation, or average out the variability by working with a lot of respondents, and assuming that the variability is random, and so will cancel out.

In the world of Mind Genomics variability is considered in a different light. Certainly there is the appreciation of error, but there is also the acceptance of the fact that people differ from each, and that these differences may be important. The differences between people are not necessarily random error, but rather point to potential profound differences among people, albeit differences which exist in a small, granular aspect of daily life. In other words, sometimes the differences are important, and sometimes the differences are merely random noise.

Explicating the Research Process

For the project reported here, the researcher selected two products (cereal, yogurt), asked six questions about the product, questions that could be used to create consumer-relevant messages, and then developed the database of 36 possible consumer messages for each product.

Thus far, the process is quite simple, requiring only that the researcher do a bit of thinking about what types of messages might be relevant to consumers. One of the in-going ‘constraints’ from the perspective of marketing and the trade was that the messages had to be of the type which drive purchase. It was not an issue of building one’s brand through advertising. Rather, the messages were chosen so that they could be put on a coupon, or flashed on an LCD panel as the respondent ‘walked by.’

The actual process of developing the raw materials can be daunting for those who are not professionals. In the two studies reported here, a significant effort was expended to develop the six ideas which tell a ‘product story’. One the six ideas are developed, the most intellectually intense part of the effort, the creation of six messages for each idea becomes much easier. Recently, the creation of these basic ideas (or questions), and the elements (or answers) has been improved by a process called Idea Coach, which provides different options, using artificial intelligence (www.BimiLeap.com). The data reported here were collected before the Idea Coach system was incorporated into Mind Genomics.

  1. The actual selection of messages generated six groups of six message, one set of 36 such messages for cereal (Table 1), and another set of comprising different messages, for yogurt (Table 2).When looking at the table, the reader should keep in mind that the elements either pain a simple word picture, or specify a specific a specific claim that could be turned into ‘copy.’
  2. When creating the messages and assigning them to groups, The only requirement for the researcher is to ensure that all of the messages in a single idea (viz., all the answers given to a single question) remain together. For example, messages about ‘calories’ must all be put into one group or idea, and not split across two groups or questions. The rationale for this requirement comes from the fact that the underlying experimental design will need to combine elements from different questions (described below). When the researcher puts a calorie message in one group, and another calorie messages in a second group, there is the likelihood that the underlying experimental design may put these mutually incompatible messages into the same combination.
  3. Once the elements are created, comprising the question and the six answers, as shown in Tables 1 and 2, the next step is to use the basic experimental design, which specifies 48 combinations, each combination comprising either three or four elements. Each combination or vignette contains at most one element from any question. The vignettes are by design incomplete, since there are six questions, but a vignette can only have three or four answers, one from three or four questions. As noted above, each respondent evaluates a unique set of 48 combinations. The underlying mathematics remains the same. What changes is the assignment of a message to a code. For example, for one person, element A1 may be assigned as A1, whereas for another person a permutation is done, so the former A1 becomes A2, A2 becomes A3, et. the experimental design is maintained, but the combinations change (Gofman & Moskowitz, 2010).
  4. The final steps comprise the introductory message and the rating scale. In Mind Genomics studies most of the judgment must be driven by the individual elements, and not by the introductory statement. It is better to be vague about the product, and let the individual elements drive the reaction, rather than to specify too much in the general introduction. For this study, the introduction was simply ‘Please read this description of cereal and rate it on the 5-point scale below. For yogurt the introductory statement was virtually the same ‘please read this description of yogurt and rate it on the 5-point scale below’
  5. The five-point rating of purchase is anchored: 1=definitely not buy, 2 = probably not buy, might not/might buy, 4= probably buy, 5 = definitely buy. The anchored five point purchase intent scale has been used for many decades in the world of consumer research, both because the scale is sensitive to differences and because managers understand the scale, and generally look at the percentage of responses that are 4 and 5 on the 5-point scale. These two rating scale points are probably buy and definitely buy. The scale is often transformed to a binary scale, as was done here. Ratings of 4 and 5 were transformed to 100. Ratings of 1, 2 and 3 were transformed to 0. Managers who use the data more easily understand a yes/no scale, buy/not buy.
  6. Following the evaluation of 48 vignettes, the respondent completed a short self-profiling questionnaire, providing information about gender and age.
  7. Respondents were sent one of two links, the first appropriate to the cereal study, the second appropriate to yogurt. Approximately 70% of the individuals who were invited ended up participating. The high completion rate can be traced to the professionalism of the on-line research ‘supplier’. As a general point of view, it is almost always better to work with companies specializing in on-line research. Trying to recruit the respondents oneself ends up with a completion rate much low, often lower than 15%.

Table 2: Strong performing elements for cereal, for divisions of respondents into two complementary mind-sets, and then into four complementary mind-sets. All elements shown have positive coefficients of +10 or higher.

table 2

Creating the Database and Analyzing the Data for a Study

Each respondent ended up evaluating 48 different combinations, called vignettes, assigning each vignette a rating on an anchored 5-point scale. The next step creates a ‘model’ or equation showing how each of the 36 elements about the product ‘drives’ purchase intent. Recall that all 48 vignettes of a respondent differed from respondent to respondent, although the mathematical structure was the same. This ‘permutation’ strategy allows the research to cover a large percent of the possible combinations (Gofman & Moskowitz, 2010).

In order to uncover the impact of the elements, the key variables, it is necessary to create an equation relating the presence/absence of the 36 text elements about the product to the rating. This can be easily done. The data are easily analyzed, first by OLS (ordinary least-squares regression) and then by clustering. OLS regression shows how the 36 elements ‘drive’ the response (purchase). Clustering identifies groups of respondents with similar patterns of coefficients groups that we will call ‘mind-sets.’

  1. The OLS regression, applied to either the individual data, or to group data, is expressed by the following: Positive Intent to Purchase = k0 + k1(A1) + k2(A2)… k36(F6).
  2. For regression analysis to work, the dependent variable, the transformed variable (either 0 or 100) must show some small variation across the different 48 ratings for each individual respondent. Often, respondents confine their ratings to one part of the scale (e.g. 1-2; 4-5, etc.). To avoid a ‘crash’ of the OLS regression program, and yet not affect the results in a material way, it is a good idea to add a vanishingly small random number (e.g. around 10-4) to every transformed rating. The random number ensures variation in what will be the dependent variable, but does not affect the magnitude of the coefficients which emerge from the OLS regression.
  3. The underlying experimental design for each individual respondent makes it straightforward to quickly estimate the equation, either for individuals or for groups. The coefficient, whether for individual or for group, shows the degree to the element drives the response the rating of ‘definitely or probably purchase.’ The individual coefficients, viz., for the hundreds of respondents, are typically ‘noisy’, but when the coefficients become stable and reproducible when the corresponding coefficients are averaged across dozens of respondents, or when the equation is estimated from the raw data of dozens of respondents.
  4. The additive constant (k0) shows the estimated proportion of responses that will be 4 or 5 (viz., definitely purchase or probably purchase), in the absence of elements. Of course the underlying experimental design dictated that all 48 vignettes evaluated by any respondent would comprise a maximum of four elements (at most one element from a group) and a minimum of three elements (again, at most one element from a group, not more).
  5. The 36 individual coefficients (A1-F6) represent the contribution of each element to the expected interest in purchasing. When an element is inserted into a vignette, we can estimate its likely contribution by adding together the additive constant and the coefficient for the element. The sum is the percent of the respondents who would assign a rating of 4 or 5 to that newly constructed vignette.
  6. One of the ingoing tenets of Mind Genomics is that there exist groups in the population which think about the same topic, but in different ways. The information to which these respondents react may be the same but these groups use the information in different ways. Some respondents may value the information so that the information appears to covary with their rating of purchase the product. In contrast, other respondents may completely ignore the information. These differences reflect what Mind Genomics calls ‘mind-sets’, viz groups of individuals with clearly defined and different ways of processing the same information.
  7. The mind-sets emerge through the well-accepted statistical analysis called clustering (Likas et al., 2003.) Briefly, the clustering algorithm computes the Pearson correlation between pairs of respondents, based upon their 36 pairs of corresponding coefficients. Respondents with similar patterns (high positive correlation) are assigned to the same mind-set. Respondents with dissimilar patterns (negative or low positive correlations) are assigned to different mind-sets.
  8. For this study the ideal number of mind-sets is as few as possible. The paper reports the results emerging from dividing the respondents into two mind-sets, and then into four mind-sets, to show the effect of making the clustering more granular. The focus will be on interpreting the results from the two mind-set solution, and creating a tool to assign a new person to the one of the two mind-sets.

Applying the Learning – Cereal

Our data with 328 respondents provides us a wealth of information about to say, what not to say, and to whom. Table 1 shows the results for cereal. The table is organized with the key subgroups of respondents across the top and the messages down the side. In order to make the table easier to read, and allow the patterns to emerge, the table only shows positive coefficients of 2 or higher. The other coefficients were estimated, but are not relevant to the presentation since they do not drive positive interest in purchase. Furthermore, Table 1 shows strong performing elements as shaded cells. Strong performing is defined as a coefficient of + 10 or higher. Table 1 is rich in detail. The table shows the results from running the aforementioned linear equation using the data from all respondents (total), then the data by gender, then by age.

    1. The additive constants differ, not by gender nor age. Again and again Mind Genomics studies reveal that for the most part, conventional methods dividing people fail to show dramatic differences in how these divisions generate groups which think differently. It is eternally tempting to divide people by who they are, and presume that because people are different they think differently.
    2. The total panel of 328 respondents shows very few positive elements, and no strong elements. That is, knowing nothing else we cannot find elements which strongly drive purchase intent. Most of the elements are blank, meaning that the coefficients for those elements are either around zero or negative. In effect, ‘doing the experiment,’ viz. evaluating different messages, fails to uncover strong performing elements. No matter what experts might think, there are no apparent ‘magic bullets’ for cereal.
    3. A first effort to divide groups looks at gender. The additive constant is the same, but the females have a few more positive than do the males. Yet, none of the elements are strong drivers purchase when evaluated in the body of a vignette.
    4. The second effort divides the respondents by age. In terms of the additive constant, the younger respondents (ages 18-39) show a slightly higher additive constant than do the older respondents (age 40+; constants of 58 vs 53). The only strong performer (coefficient >1= 10) is S4 for the younger respondents: The same great taste of cereal… only better.

The third effort divides the full set of respondents into exactly two mind-set and then into exactly four mind-sets using k-means clustering (Likas et al., 2003). To save space and make it easier for patterns to emerge, Table 2 shows the only those elements which perform strongly in at least one mind-set of the six created (two mind-sets + four mind-sets = six mind-sets). ‘Performing strongly’ is again operationally defined as a coefficient of +10 or higher. The groups with fewer strong performing elements will be harder to reach.

      1. Focusing just on the two mind-set solution, Mind-Set 2 is more primed than Mind-Set to be interested in buying the cereal (additive constant of 68 for Mind-Set 2, additive constant of 38 for Mind-Set 1). However, Mind-Set 1 shows two elements which excite its members:

O2: A tasty breakfast choice makes it easy to maintain a healthy body weight

O4: Ideal choice for those concerned about eating too much sugar

Applying the Learning – Yogurt

Our second study, this time with 307 respondents, shows similar patterns. Table 3 shows the data for the total panel, gender, and age. Table 4 shows the strong performing elements for the mind-sets, viz., those with coefficients of +10 or higher.

      1. The total panel again does not show strong performing elements (coefficient >= +10).
      2. The additive constants differ dramatically by gender. Recall that the additive constant is the basic level of purchase intent estimated in the absence of elements. Males shows a higher basic intent, females show a lower basic interest (74 vs 54). This is a dramatic difference.
      3. Closer inspection of Table 3 reveals that the coefficients for the males are around 0 or lower whereas there are a number of coefficients for females which are moderately positive. Males have a basic higher acceptance, but do not show any strong performing elements. In contrast, females show the lower basic acceptance, but are more selective. The two elements which drive their purchase intent are:

F4: So flavorful… it will satisfy your sweet taste

F5: Made with natural flavoring

        1. The second effort divides the respondents by age. In terms of the additive constant, the younger respondents (ages 18-39) show a lower additive constant, the older respondents show a higher additive constant (50 vs 62).

The younger respondents find five elements to drive purchase:

E6                    Great taste with none of the guilt 

F4                    So flavorful… it will satisfy your sweet taste

O3                    A refreshing healthy snack the whole family love

C1                    Ready to eat when you are

F6                    Flavor which sweetens

In contrast, the older respondents find only one element to drive purchase.

F5                    Made with natural flavoring

          1. The results emerging from clustering show the two mind-sets (MS1 of 2, MS2 of 2) to have dramatically different additive constants (39 for MS1 of 2; 72 for MS2 of 2). Mind-Set 2 is prepared to purchase, even without messaging, whereas Mind-Set 1 must be convinced. Fortunately, eight of the 36 elements for yogurt perform strongly, two performing quite strongly (F4, F5):

F5:            Made with natural flavoring

F4:            So flavorful… it will satisfy your sweet taste

C2:            Comes in snack size…great for packed lunches

B2:            Less sugar, less calories

C5:            A hassle free healthy snack – goes where you go

B4:            It’s good because IT’S REAL

C1:            Ready to eat when you are

F2:            Uses flavors to sweeten for a healthier you

Table 3: Positive elements for yogurt, viz., those elements which drive the rating of a vignette towards definitely buy/probably buy). All elements shown have positive coefficients of +2 or higher.

table 3(1)

table 3(2)

Table 4: Strong performing elements for yogurt, for divisions of respondents into two complementary mind-sets, and then into four complementary mind-sets. All elements shown have positive coefficients of +10 or higher.

table 4

Part 2– Messaging the Shopper

One thing we learn from Tables 1 and 3 versus Tables 2 and 4 is that when we look for a strong message for the total panel, we will not find any strong message for Total Panel, for either food. Tables 2 and 4 tell us that when we divide the shoppers in two mind-sets, the one mind-set for each food is ready to buy the food, whereas the other, complementary mind-set can be persuaded to buy, but only when the correct messages are ‘beamed’ to this second group of shoppers. It is to the task of finding this group of shoppers and then sending them the correct messages in the store to which the paper now turns.

One of the perplexing problems of knowing mind-sets is the difficulty of assigning a random individual to a mind-set. The reason is simple, but profound. The mind-sets emerge out of the granularity of experience, and are based on the response of people to small, almost irrelevant pieces of communication. We are not talking about issues which are critical to the shopper, issues such as health, income, and so forth, and the decisions one makes about them. Those topics are sufficiently important to people to merit studies by academics and by interested professionals. A great deal of money is spent defining the preferences of a person, so that the sales effort can be successful. Not so with topics like cereal and yogurt, where there is knowledge, but little in the way of knowing the preferences of a particular shopper. Companies which manufacturer cereal and yogurt ‘know’ what to say, but the revenue to be made by knowing the preferences a randomly selected individual is too little to warrant deep investment.

To understand the preferences of a randomly selected individual may require one of two things. The first is extensive information about that individual, and a way to link that knowledge to one’s preference about what to say about cereal or about yogurt. That exercise could happen, at least for demonstration purposes, although it does not lend itself to being scaled, at least with today’s technology. Another way is to present the person, our shopper, with the right messages for that shopper. This latter approach requires a way to identify the shopper, and to assign the shopper to the proper mind-set, with low investment, in a way that can be done almost automatically. This second approach has to reckon with practicalities, such as the reluctance of the shopper to provide personal information, the potential disruption of the knowledge-gathering step to the shopping experience, and of course the need to find the appropriate motivation. The proposed process has to be simple, quick, easy to implement. Most of all, the process should motivate the shopper to participate.

The answer to the question of ‘how to assign a shopper to a mind-set’ comes from the use of a simple questionnaire called the PVI (personal viewpoint identifier; Gere et al., 2020; Moskowitz et al., 2019.) The PVI uses the data from the Tables 2 and 4, to create a set of six questions having two answers (no/yes; not for me/for me, etc.) The questions come from the 16 elements, and are chosen to best differentiate between the two (or among the three) mind-sets. The important thing to keep in mind is that the PVI emerges directly from reanalysis of the data used to create the mind-sets. It will be the pattern of answers to the PVI which will assign a person to one of the mind-sets. With two products, and thus 12 questions, the PVI ‘step’ should take about a minute. The motivation might be lowered price for participants for some products, such as cereal and yogurt.

Figure 1 show the PVI, completed by the shopper at the start of the shopping effort or even ahead of visiting the store. Figure 2 shows a screen shot of the database, in which each shopper who participated is assigned to one of the two mind-sets for cereal, and one of the two mind-sets for yogurt.

fig 1(1)

fig 1(2)

Figure 1: The PVI (personal viewpoint identifier) for the cereal and yogurt, completed before the shopper begins, or completed at home. The website used to acquire the information is: https://www.pvi360.com/TypingToolPage.aspx?projectid=2317&userid=2

fig 2

Figure 2: Example of a database attached to the PVI which records the mind-set to which the respondent belongs and the recommended types of messages for that mind-set.

Here is a sequence of four proposed steps to test the approach.

          1. At the start of the shopping the individual could be invited to participate, by completing a short questionnaire on a computer, the PVI tool shown in Figure 1. The incentive could a special ‘participant’s pricing’ for the cereal or the yogurt. The objective is to get the shopper to participate, discover the shopper’s membership in a mind-set (in return for the promise of a lower price), and have the shopper interact, with the program assigning the shopper to the correct mind-set for one or several products. The opportunity further remains to engage the shoppers off-line, ‘type’ their preferences for dozens of products, and place ‘intelligent’ signage with the proper message for the two or three mind-sets emerging for each product. Thus the data would be granular, by person, and by product..
          2. Once the data has been acquired and put into the database, the shopper should be furnished a device linked to the database, with the shelf location linked both to the database, and to the shopper’s portable device.
          3. When the shopper reaches the appropriate store location, an ad for the product should be flashed on to the screen of the device, the ad possibly paid for by a vendor of yogurt or cereal. The ad should be the name of the vendor, the product type, and the appropriate message for the shopper, based upon the shopper’s assignment to the mind-set.
          4. The performance of the system can be measured by comparing the purchases of cereals and/or yogurt, comparing those who participated versus those who did not.

Selecting the Specific Messages to Show to the Shopper

Up to now we have focused on the science of the effort, figuring out the existence of mind-sets, the messages about cereal and yogurt to which they are most responsive, and then the creation of a simple tool, the PVI, to assign a person to a mind-set. We now face the most important task, selecting the messages that will be flashed to the shopper at the right time (e.g., when the shopper is passing the specific product, and the objective is to get the shopper to select the product).

Keep in mind that up to now the effort to learn about the mind-set of the shopper has been brand-agnostic. That is, the objective has been to identify what messages differentiate the two kinds of cereal shoppers and the two kinds of yogurt shopper. In the real world, it is necessary to drive the shopper towards the appropriate brand, using the appropriate message.

If we remain with two mind-sets, and concentrate on shopping, we need not worry about Mind-Set 2. Mind-Set 2 for cereal has an additive constant of 68. They are ready to buy. They should be directed to the ‘brand’. It is Mind-Set 1 which must be convinced, since Mind-Set 1 has an additive constant of 38. They need motivating messages. Here are the two strongest messages for Mind-Set 1

O2 A tasty breakfast choice makes it easy to maintain a healthy body weight        15

O4 Ideal choice for those concerned about eating too much sugar                     10

The same dynamics hold for yogurt. The additive constant is 72 for Mind-Set2, and 39 for Mind-Set 1. Mind-Set 2 is already primed to buy yogurt, and again should be directed to the ‘brand’. Mind-Set 1 with a low additive constant of 39 needs motivating messages, along with the brand. They have eight messages which score well in expected motivating power, and of those eight, three which score very well with coefficients 14 or higher.

F5 Made with natural flavoring                    17

F4 So flavorful… it will satisfy your sweet taste          16

C2 Comes in snack size…great for packed lunches            14

B2 Less sugar, less calories                          12

C5 A hassle free healthy snack – goes where you go        12

B4 It’s good because IT’S REAL             11

C1 Ready to eat when you are           11

F2 Uses flavors to sweeten for a healthier you                   10

Discussion and Conclusions

One need only read the trade magazines about the world of retail to recognize that the world is becoming increasing aware of the potential of ‘knowledge’ to make a difference to growth and to profits. Over the past half century, knowledge of the consumer has burgeoned in all areas of business, with the knowledge often making the difference between failure and success, or more commonly today, the magnitude of success.

We are no longer living in a business world dominated by the opinions of one person in the management of a consumer-facing effort. Whereas decades ago it was common for the key executives to proclaim that they had a ‘golden tongue’ which could predict consumer behavior, today just the opposite occurs. Managers are afraid to decide without the support of consumer researchers, or as they title themselves, ‘insights professionals.’

At the level of shopping, especially when one buys something, ore even searches for something, there are programs which ‘follow’ the individual, selling the data to interested parities who use that information to offer their own version of that for which the individual was shopping. The tracking can be demonstrated by filling out a form or a product or service, not necessarily buying such a product. The outcome is a barrage of advertisements on the web for that product, from a few different vendors offering their special version.

The Mind Genomics approach presented here differs from the current micro-segmentation on the basis of previous behaviors demonstrated on the internet. Rather than watching what a person does to put the person into a specific grouping, or rather than applying artificial intelligence to the text material produced by the person, Mind Genomics moves immediately to granularity. The basic science of the topic (viz., messages for cereal, or messages for yogurt) is established at a convenient time, using language that the product manufacturer selects as appropriate for a customer. The important phrases and the relevant mind-sets are developed inexpensively, and rapidly, perhaps within a day. The PVI is part of that set-up. The next steps involve the shopper herself or himself. What emerges is a system wherein the shopper plays a simple but active role, and through a few keystrokes identifies the relevant group(s) to which she or he belongs. Once the shopper encounters the appropriate location, it is only a matter of sending the shopper the appropriate message. The ‘appropriate location’ can be the store shelf where the product is displayed, or on the web at an e-store, or even when the prospective shopper searches for the item. Both the item and the relevant motivating messages can be sent to the shopper, as long as the shopper’s membership in the appropriate mind-set can be determined.

References

        1. Büttner OB, Florack A, Göritz AS (2013) Shopping orientation and mindsets: How motivation influences consumer information processing during shopping. Psychology & Marketing 30: 779-793.
        2. Chang CT, Cheng ZH (2015) Tugging on heartstrings: shopping orientation, mindset, and consumer responses to cause-related marketing. Journal of Business Ethics 127: 337-350.
        3. Dennis C, Michon R, Brakus JJ, Newman A, Alamanos E (2012) New insights into the impact of digital signage as a retail atmospheric tool. Journal of Consumer Behaviour 11: 454-466.
        4. Gere A, Harizi A, Bellissimo N, Roberts D, Moskowitz H (2020) Creating a mind genomics wiki for non-meat analogs. Sustainability 12: 5352.
        5. Gofman A, Moskowitz H (2010) Isomorphic permuted experimental designs and their application in conjoint analysis. Journal of Sensory Studies 25: 127-145.
        6. Likas A, Vlassis N, Verbeek JJ (2003) The global k-means clustering algorithm. Pattern recognition 36: 451-461.
        7. Moskowitz H, Gere A, Moskowitz D, Sherman R, Deitel Y (2019) Imbuing the supply chain with the customer’s mind: today’s reality, tomorrow’s opportunity. Edelweiss Applied Sci Tech 3: 44-51.
        8. Schumann DW, Grayson J, Ault J, Hargrove K (1991) The effectiveness of shopping cart signage: Perceptual measures tell a different story. Journal of Advertising Research 31: 17-22.

Factors Affecting the Attitude of Students towards TVET Education in Bedesa Town, Western Harerge Zone, Oromia Regional State

DOI: 10.31038/PSYJ.2022445

Abstract

The general objective of this study were to assess factors which impact Student’s attitude towards Technical and Vocational Education and Training of Bedesa Town, Oromia regional state, Ethiopia. To this end, Descriptive survey research design was employed in carrying out this study. The target population for this study consisted of 175 students, 25 teachers and 1 Dean of TVET College and in total 201 in the selected TVET college of Bedesa town. 134 samples were taken from 201 targeted populations. 71 male and 63 female respondents were selected through using stratified random sampling technique. The required data were collected through questionnaire. Descriptive and inferential statistics were used to analyze the quantitative data that have been collected through close ended questionnaires. The findings of the study revealed that 48.6% of the variation in the attitude of students towards TVET education can be explained by changes in Socioeconomic factors, parental influence, quality of technical and vocational education and training education and peer influence whereas 51.4% were unexplained variables that affect the attitude of students towards TVET education. The study therefore concludes that that ‘Socioeconomic factors, Parental influence, Quality of TVET education and Peer influence’ were the stronger predictor of attitude of students towards TVET education sequentially. It is recommended that government, head of TVET and TVET board members should arrange and provide a serious campaign on the importance of TVET in the development of the country, financial, material and human resources should be provided to strengthen and enhance the quality of education imparted at TVET institutions, guidance and counselling services should be strengthen in larger community to influence their children towards TVET education.

Keywords

Attitude, Factor, TVET, Vocational education

Introduction

One of the most important responsibilities in any education system is to train skilled and specialized staff of various sections of society. It can be done through learning areas such as technical education and employment and training. Technical education and vocational training play a vital role in the development of society. Technical and vocational skills are essential tools for economic development. Well educated and well trained people are essential to the acquisition, use, construction and dissemination of knowledge and skills that enhance productivity and economic growth. TVET are now increasingly important on the global and national policy agenda. UNESCO, for example, promotes TVET, claiming that technology education driven by market demand is very effective in improving employment and income for the disadvantaged. Therefore, all developing and developed countries place a high priority on this problem and strive to equip its producers with complementary science and technology in various fields such as agriculture, industry and services [1,2].

According to Ozioma (2011) believes, technical training and job training is to prepare students for specific skills, occupation, industry, agriculture, business to gain self-confidence and is generally linked to practical and manual skills and often excludes scientific skills. Billet (2011), Azeem and Omar (2019) also define TVET as a formal, informal and non formal study that provides young people with the necessary knowledge and skills in the world of work. As one of the developing countries in the world, with 33% of its population living on less than $ 1.25 a day, the Ethiopian Government (GoE) also needs the TVET program to participate in its active participation, in a global competitive market economy that requires technical and technical citizens who are trained in learning ability and get into a particular profession. Ethiopia’s TVET strategy proves that TVET programs seek to create capable and confident citizens to contribute to global economic development, thereby improving the quality of life of all Ethiopians and further reducing poverty [3-8].

The National TVET Qualification Framework (NTQF) also emphasizes the TVET program to be self-sufficient and self-sufficient, driven by demand and results-based, and appropriate to address the needs of Ethiopia’s sustainable economic development [9]. The level of skills and jobs of the country is critical to the transformation and productivity of its workforce. Skilled workers and professionals improve the quality and efficiency of production and maintenance and direct and train employees with minimal skills. This can be achieved by making crafts into education.

On the other hand, Ali (2013) in his study of determining the reluctance of female students to continue studying in vocational schools cited individual, family, economic, social, and cultural factors. Ozioma (2011) investigated whether the socioeconomic status of parents, gender and the lack of career counselors at school influenced students’ choice in terms of Technical and Vocational Education. Ohiwerei and Nwosu (2009) found that the country’s political and economic situation, high paying work and peer pressure were factors that influenced students’ attitudes towards Technical Education and Vocational Education. The result of equality in Technical and Vocational Education with general education, social status and content use are key factors in attracting students. This study will be fully utilized to understand the factors that influence students’ attitudes towards Technical Education and Vocational Education and to further develop policies to address this issue [10,11].

Statement of the Problem

Technical and vocational skills are essential tools for economic development. Well educated and well trained people are essential to the acquisition, use, construction and dissemination of knowledge and skills that enhance productivity and economic growth. Globally, governments and other stakeholders expect TVET to address a number of development and economic priorities, from poverty reduction, food security and social cohesion to economic growth and competitiveness. It also plays an important role in education programs around the world. In developed countries such as Australia, Germany, Great Britain, and South Korea, TVET is the key to economic prosperity and in developing countries TVET is seen as the key to economic independence [12,13].

Unemployment remains a very important issue that needs to be addressed, in many countries around the world including Ethiopia. In addition, it poses a significant challenge to economic development. TVET plays a key role in reducing unemployment, as its aim is to provide trained staff in the various fields covered, to provide technical knowledge and technical skills and competencies. However, the enrollment rate and graduation rate in technical and technical institutions will be lower day by day leading to a decline in well trained staff (ICBEM, 2015) According to the report many young people currently graduating from the official TVET programs are unemployed. Young people are interested in white collar work and feel embarrassed at work, related to working or working in factories. In Ethiopia, as in many African countries, TVET suffers from a negative public image. TVET is often associated with low employment, low wages and a lack of self-development opportunities, in part due to the low level of previous TVET programs that did not permit TVET graduates to successfully struggle in the labor market. TVET is seen as a place of counseling for those students who have failed to enter higher education [14].

To assess the attitudes of students and parents towards TVET education, various studies were conducted in Ethiopia and abroad. For example, a study by Tsehay (2014) shows that student’s attitude toward technical and skills education is not good. As the study states students were more interested in attending the preparatory program than in technical and vocational education. Nursiah et al. (2020) claimed that enrolment in Malaysia’s technical and vocational education and training programme has remained low since the implementation of TVET education. Similarly, in Nigeria, Akanbi (2017) announced that there was less than three per cent of overall enrolment in technical and vocational education programs as of 2016. In contrast to the above study, according to the (Esrael 2018) study, students perceive that TVET provides quality education; TVET training provides access to current resources and teacher skills. However, it was not clear to students whether TVET was enable technical and vocational students to pursue university studies over time. Choosing TVET is perceived as limiting one’s educational attainment, which in turn reduces lifetime upward mobility [15-18].

Even though efforts have been made by those researchers to identify the attitudes of students towards TVET education, as well as the enrolment rate in TVET education; it was limited to assessing student’s attitude towards TVET education. Therefore, the gap in both studies was that they did not take into account the factors that contributed to the negative attitudes of the students. Those studies focus on investigating the student’s status only in relation to TVET. Besides there is no any research conducted in the study area with the same topic. Therefore, in order to fill those research gaps, this study was assess and found out those factors that affect the student’s attitude towards TVET education in the town of Bedesa, Western Harerge Zone, Ethiopia.

Objectives of the Study

The general objective of this study were to assess factors which impact Student’s attitude towards Technical and Vocational Education and Training of Bedesa town. The specific objectives of the study were intended to:

  1. Determine the impacts of quality of TVET education on the attitude of students towards TVET education.
  2. Determine the impacts of parents influence on the attitude of students on the study of TVET education.
  3. Determine the impacts of socioeconomic influence on the attitude of students towards TVET education.
  4. Determine the impacts of peer influence on the attitude of students towards TVET education.

Literature Review

Factors that Affect Students Attitudes towards TVET

Various scholars such as Igbinedion and Ojeaga (2011) identified some of the major causes of low student participation in technical and vocational education including, among other things, the low social ratio of technical and vocational education such as basic education, basic education, to people of; low intelligent quotient, low achievement and sedation and lack of job awareness. Igbinedion and Ojeaga (2011) [19], explained that, some of the factors affecting student participation in TVE in Nigeria include; a negative public opinion; poor entry level; a negative attitude towards society; lack of recognition; discrimination against TVET graduates and elitism.

In addition, academics and various international organizations have reported similar issues affecting student participation in general education and technical education in particular. However, in Africa, the Caribbean and South Asia factors affecting student participation in TVET programs include: parental views on the costs / benefits of educating girls (this mainly affects low-income families in particular); ancestry (practices of separation of women and premature marriage); discriminatory practices in labor markets; TVET masculinity portrayed in textbooks, media and popular thinking; substandard facilities, including teacher provision, teacher quality and equipment; the nature of TVET activities that are not easily linked to child rearing and child care; lack of role models and career counseling aspects of community functioning within and outside the classroom; shortage of TVET female teachers and lack of role models; TVET gender bias curriculum; misconceptions made about male TVET teachers; peer pressure; first marriage; girls’ privacy; as well as location, physical properties and hours of instruction; direct costs; the need for women to care for their siblings, houses and farms. Factors affecting woman’s participation in vocational education programs according to Ayonmike (2010); Igbinedion and Ojeaga (2011) are negative perceptions in society, poor entry rates, invisibility and discrimination against graduates of technology education (TVE). Several researchers (see Azeem and Omar, 2019; Cheong and Lee, 2016; Dania et al., 2014) also contributed to the investigation of factors contributing to student participation in TVET and provided outstanding findings with critical views. Investigators have established issues related to student enrollment under TVET including job losses, discrimination against TVET graduates, dislike of the government for TVET, student dissatisfaction, lack of resources / infrastructure, and adequate job counseling [20-22].

Quality of TVET Educations

Quality can be described as standards of something as compared to other things that is the degree of Excellence. Good quality education is very necessary in the total development of the student, which ensures proper development, job prospects and the realization of academic goals and objectives. Quality technical and vocational education training refers to input and output of the program, the expressions of standard by which certain goals can be achieved. There are varied factors contributes for realization of quality of technical and vocational education in colleges. Some of them are qualified TVET teachers or trainers, and TVET infra structures.

Qualified TVET Trainers

One of the important principles used to define the quality of a TVET program is related to the preparation of adequately trained teachers and other professionals who shoulder the responsibility of preparing students with quality marketable skills for the dynamically changing world of work. According to this principle, quality TVET programs are distinguished by having a highly trained, experienced, technically competent, and enthusiastic staff including the coordinators, teachers, counselors, and all others who assist them in the instructional process [23]. TVET’s strategic documents acknowledge that the shortage of teachers / educators is one of the barriers to the expansion of TVET in Ethiopia. Due to the low profile of this work, the quality of TVET’s teaching dam is poor. The obstacle to the provision of TVET educators is particularly severe at the higher levels of TVET. Currently identifying and training TVET instructors is done through the following program. Students who complete TVET Level 4 and are tested have the opportunity to receive additional teaching training. After receiving this training, they are ready to teach TVET level 1 and 2. Such instructors are called C level instructors. After graduating as a Level C coach, a person can move on to specialized teacher training institutions for 3 to 4 years to become a B level trainer. The highest level of Teacher is A, and these teachers are ready to teach at any level. Clearly, exploring the issues here should be part of a comprehensive strategy to improve TVET education in Ethiopia [24].

The TVET program in Ethiopia is currently expanding rapidly. The government believes that low productivity is currently due to a skills gap, and that if left unchecked, the industry will provide less training than is fair to the public. Therefore, public vocational training is seen by the government as a means of closing the skills gap. Ethiopian government views community TVET as key to improving business productivity and increasing their competitiveness in the global market. Government involvement is more than just the provision of TVET. The Department of Education conducts moderate examinations at the end of primary school, and the scores on this test determine whether a student is continuing with preparatory school or being placed on a TVET track. This is a national test and determines what level of TVET a person can join. In this regard, the TVET program in Ethiopia is actually driven by mandate, even though the government recognizes the importance of ensuring that the program is flexible and responsive to the needs of the industry. In general highly competent, qualified, motivated, flexible and creative TVET teachers and instructors are the backbone of any TVET system, capable of adjusting to changing technological environments and creating conducive learning environments for different target groups.

TVET Infrastructure

Physical facilities are important for the proper functioning of training institutions. A functional as well as pleasant working environment may contribute a great deal to training. Thus, considerable thought should go into the planning and construction of physical facilities in order to create the appropriate environment. Among the important elements of these facilities are lecture rooms with good lighting and acoustics; classrooms designed for the particular function they will serve; small rooms for study groups and seminar work; space for individual work, e.g. study cubicle, best placed in library; well-organized library facilities conducive to individual research work and study; conference room; staff rooms; and of course, well-planned and equipped workshop facilities. The creation of appropriate physical facilities is not just a matter of providing the necessary funds and materials. They should be planned and designed by experienced specialized architects in conjunction with teacher educators in order to best serve the education process.

The goal of TVET is to improve practical skills for students, and acquiring the right building, design and maintenance skills requires efficient infrastructure and equipment to ensure effective, efficient and sustainable skills that can be employed by students. Conversely, the lack of such institutions can affect the enrollment of students in employment institutions. For example, the lack of infrastructure continued to affect the full potential of TVET in South Africa (Powell and Mcgrath, 2013), Nigeria (Ogbuanya, 2014), Bangladesh (Alam and Forhad, 2020), Chile (Rojas et al., 2019) and Kenya (Reuben et al., 2020). In addition, inadequate educational institutions, teaching and learning services, inconsistencies in curriculum compliance to meet business needs and a lack of industrial integration lead to lower enrollment. Therefore as we can understand from the above literature infrastructure of the technical and vocational education and training have impacts on students towards choosing TVET educations [25-29].

Socioeconomic Factors

As mentioned in another study in Papua New Guinea (PNG), integrated educational or TVET courses are required to be used or considered at the high school level. The students’ approach will improve further learning and training, as well as in the workplace and in improving their social life in Papua New Guinea. Communities and cultures can influence people’s choices and circumstances. In Nigeria, their people mostly choose a job because of their social status and status in their community and want to satisfy their friends and colleagues under the mines for their academic qualifications. People often view vocational and technical education as disabilities, school dropouts and undergraduate students. The issue of apprenticeships can be even worse in a country if there is a community that affects the community. The lower social groups have less confidence in TVET programs. This is because they themselves have always seen themselves at the lower level of social management, and therefore do not believe that TVET programs can help improve their job prospects than at a higher social level [30,31].

Parental Factor

The findings of the Ayub (2017) study indicate that parental influence is statistically significant and influences students’ decision regarding TVET choice. Bukantaite et al. (2006) investigated in their study that 77.9 percent of fourth-grade students responded that their desire to “learn anywhere” contributed to special choices. This figure can be explained by the fact that these students have failed to enter universities or colleges and have chosen vocational schools so that they do not spend a year. TVET students excel in their own decisions in education and especially strongly follow the decisions of their peers; this is because parents and their families have to fight for the resources needed to make the right educational decisions for their children. Most previous research has also found that parents’ attitudes toward technical and vocational education are strongly influenced by student choice. Most of the research findings have shown that student approach to TVET is influenced by their guardians. The majority of responding parents have a low level of economic, educational and social background [32-34].

A Peer Factor

In addition to parents, peers also influence student behavior in daily life as they are second only to parents in close association with students. In Ghana; another study found that generally no negative perception was attached to skills training as a separate occupation of student education. The results showed that concern for student program staff has a significant effect on enrollment, better communication with teaching high school colleagues and encouraging colleagues to interact with students in the area, could help increase enrollment. The study has stated, “Local institutions should emerge as friendly places with many opportunities to meet young people, and should also attend certain social events to help deal with change. To end the divisions of the elders, they may be tempted to make new friends.

Research Methods

Design

Descriptive survey research design was employed in carrying out this study to assess and understand the factors that affect the attitudes of students towards TVET education in Bedesa town because this method helps to describe the characteristics of objects, people, group or environment.

Population, Sample Size and Sampling Technique

The target population for this study consisted of 175 students, 25 teachers and 1 Dean of TVET College and in total 201 in the selected TVET college of Bedesa town. 134 samples were taken from 201 targeted populations. 71 male and 63 female respondents were selected through using stratified random sampling technique because firstly, there were different subdivisions in the targeted population which are important to be considered. Secondly, there were also variations in population sizes of different strata in this case (occupation, and sex). Moreover, the researcher used systematic random sampling to take the sample that has already been identified through stratification.

Instruments of Data Collection

A three-section questionnaire was used to collect relevant data. Section-I consisted of information about demographic data; section-II consisted of Factors affecting the attitude of students towards TVET education; section-III consisted of items focusing on attitude of students towards TVET education.

The tool was developed on five-point Likert scales ranging between strongly agree (5) to strongly disagree (1). It contains 20 items. Those items are divided into each construct of factors affecting the attitude of students towards TVET education in which for Quality of TVET education 5 items, for Parental influence 5 items, for Socioeconomic influence 6 items and 4 of them for Peer influence. The last instrument was the attitude of students towards TVET education, which consists of 10 items and it has five point likert scales from strongly agree to strongly disagree. A pilot study was conducted on 32 individuals (18 males and 14 females) who represented the population character but not the sample to check the reliability and validity of the items by using Cronbach Alpha and experts respectively. Accordingly, the researcher was able to decide the characteristics of the questionnaire that needed to be adjusted or remained or to be changed in some technical words or phrases that seemed to be technical for these respondents. The reliability of the questionnaire was, therefore calculated as 0.80, and 0.83 for the 2nd, and 3rd sections of the questionnaire which were highly reliable respectively. Therefore, it was safe to use them with a little modification. The validity was tested by expert and well-experienced teachers over the area. The questionnaire was administered on face to face basis so that the distributed questionnaires were collected from these respondents after they were completed filling them.

Data Analysis

For proper understanding and evaluating of the purpose of the research questions raised and to ultimately achieve the research objectives, different techniques of data analysis were employed. The researcher used descriptive statistics (percentages and frequency) to describe the characteristics of the respondents. Furthermore, inferential statistics (Multiple Regression) were used to show and determine the effects of influencing factors on the attitude of students towards TVET education. This result was statistically significant at α = 0.05 level.

Results

This chapter has two parts: the first part deals with the characteristics of the respondents; and the second part presents the analysis and interpretation of the main idea in the body. To this end, quantitative data were gathered through questionnaire. The data gathered through. Questionnaire was distributed to 134 respondents out of which 130 (97%) copies were returned back. The respective quantitative data were analyzed quantitatively using descriptive and inferential statistics.

Respondents Characteristics

Under these sub-topics, respondents’ characteristics by sex, age and level of education were critically described (Tables 1-4).

Table 1: Respondents’ Demographic Characteristics by Sex

Sex

Frequency

Percent


Valid

Male

68

52.3

Female

62

47.7

Total

130

100

As the Table 1 shows, the majorities (68, 52.3%) of the total sampled respondents were males whereas the rest (62, 47.7%) of them were females. From this, one can imply that there was no a big gap of sex disparities among respondents in these selected samples under the study.

Table 2: Respondents’ Demographic Characteristics by Age

Age in years

Frequency

Percent


Valid

15-20

34

26.1

20-25

61

47

25-30

35

26.9

Above 30

Total

130

100.0

As it can be seen from table 2, the majorities, 61 (47%) of the respondents were between 20-25 years old; 35 (26.9 %) of them were between 25-30 years old; 34 (26.1%) of them were found between 15-20 years old. This indicates that almost the sampled respondents were young peoples who can be the resources for any educational systems.

Table 3: Respondents’ Demographic Characteristics by Level of Education

 Age in years

Frequency

Percent


Valid

TVET education

114

87.7

First Degree

15

11.5

Master’s Degree

1

0.8

Total

130

100.0

As it can be seen from Table 3, the majorities (114, 87.7%) of the respondents were holder of TVET education; (11.5%) of them were first degree holders; (0.8%) of them were Master’s Degree holders.

Table 4: Respondents’ Demographic Characteristics by Occupation

Age in years

Frequency

Percent


Valid

Student

81

62.3

Teacher

16

12.3

Employee

18

13.9

Unemployed

15

11.5

Total

130

100.0

As it can be seen from Table 4, the majorities, 81 (62.3%) of the respondents were student; 18 (13.9 %) of them were employee; 16 (12.3%) of them were teachers and the rest 15 (11.5%) of them were unemployed.

Factors Affecting the Attitude of Students toward TVET Education

These parts of the data analyses were mainly dealing with those independent variables (quality of TVET education, parental influence, socioeconomic factors and peer influence) that have been contributing to affect the attitude of students on the study of TVET education under the study area. Therefore, the researcher tried to organize, present, analyze and interpret quantitative data that he collected through questionnaire as follows.

Impacts of Quality of TVET Education, Parental Influence, Socioeconomic Factors and Peer Influence on the Attitude of Students on the Study of TVET Education

To determine the impact, regression analysis were conducted. A multiple-linear regression model of the form Y= β0+β1X1+β2X2+β3X3 + β4X4 was used to determine the effect of the independent variables on dependent variable. In this model β0 was a constant, while β1, β2, β3 and β4 are regression coefficients and X1, X2, X3 and X4 are quality of TVET education, parental influence, socioeconomic factors and peer influence respectively. The results of the model are shown in Table 5.

Table 5: Multiple Regression Model Summary (ni = 130, p <0.05)

Model Summaryb

Model

R

R Square

Adjusted R Square

Std. Error of the Estimate

1

697a

.486

.525

4.289

aPredictors: (Constant), Socioeconomic factors, Parental influence, Quality of TVET education and Peer influence
bDependent Variable: Attitude of student towards TVET education

The R square value of .486 shown in the above Table 5 indicates that 48.6% (R2*100%) of the variation in the attitude of students towards TVET education can be explained by changes in Socioeconomic factors, Parental influence, Quality of TVET education and Peer influence whereas 51.4% (1- R2)*100% were unexplained variables that affect the attitude of students towards TVET education.

As it is indicated in Table 6, the independent variable ‘socio economic factors’ has the strong impact (β=.137) on the dependent variable ‘Attitude of students towards TVET education’, and this is statistically significant (the column ‘Sig.’ indicates that the level of significance, at 0.002); the independent variable ‘parental influence’ has strong impact (β=.135) on the dependent variable ‘Attitude of students towards TVET education’ and this is statistically significant (the column ‘Sig.’ indicates that the level of significance, at 0.003); the independent variable ‘Quality of TVET education’ has a positive predictive power (β=.063) on the dependent variable ‘Attitude of students towards TVET education’, and this is statistically significant (the column ‘Sig.’ indicates that the level of significance, at 0.007); the independent variable ‘peer influence’ has positive impact (β=.050) on the dependent variable ‘Attitude of students towards TVET education’, and this is statistically significant (the column ‘Sig.’ indicates that the level of significance, at 0.000).

Table 6: Multiple Regression Coefficients

Model 1

USC

SC

t

Sig.

B

SE

Beta

(Constant)

22.006

2.618

 8.405

.000

Socioeconomic factor

.144

.056

.137

2.533

.002

Parental influence

.143

.057

.135

2.509

.003

Quality of TVET education

.069

.059

.063

2.175

.007

Peer influence

.067

.072

.050

4.928

.000

a. Dependent Variable: Attitude of student towards TVET education

Even-though all independent variables have a statistically significant impact on the dependent variable, the beta weighting of the independent variable ‘socio economic factors’ (β=.137) is much higher than that of the independent variable ‘parental influence’ (β=.135) on the dependent variable ‘Attitude of students towards TVET education’; the beta weighting of the independent variable ‘parental influence’ (β=.135) is much higher than that of the independent variable ‘Quality of TVET education’ (β=.063) on the dependent variable ‘Attitude of students towards TVET education’; and the beta weighting of the independent variable ‘Quality of TVET education’ (β=.063) is much higher than that of the independent variable ‘peer influence’ (β=.050) on the dependent variable ‘Attitude of students towards TVET education’, this means that ‘Socioeconomic factors, Parental influence, Quality of TVET education and Peer influence’ are a stronger predictor of ‘Attitude of students towards TVET education sequentially.

Discussion of Findings

This section of the study presents the discussions of findings regarding Factors Affecting the Attitude of Students towards TVET Education in Bedesa Town, Western Harerge Zone, Oromia Regional State. The findings were discussed as follows:

Impacts of Socioeconomic Factor

The findings of this study reveal that socioeconomic factors have strong impact on the attitude of students towards TVET education. Socioeconomic status of their parents in their community was highly affecting the attitude of students in choosing technical and vocational education as a field for their future career. In line with this findings Chris (2016), noted that students with rich families have certain physical and sociological needs which then contribute positively to their education choice. Gemechu [35] identified that family’s socioeconomic status in one way or another affects students’ academic choice at any level of education. Moreover, the findings of Ayub (2017) confirmed that socioeconomic status of family have significant impact on student’s attitude towards Technical and Vocational Education and training. Furthermore, Awang et al. (2011) and Ozioma (2011) asserted that students have perception that Technical and Vocational education is for students from poor socioeconomic background. Mills and Lavender (2011) find out that parents place of living impact on their children for selection of TVET as a career. Therefore, it was identified that people mostly choose a course because of their socioeconomic status and their status in their community.

Impacts of Parental Influence

Parental influence was found to have statistically significant positive effect on the attitude of students towards technical and vocational education and training. This implies that if the attitude of parents towards TVET education is positive and good, the better the students can be enrolled in the TVET education and vice versa. Student’s decisions in education are highly influenced by their parents and especially strongly follow the decisions of their family while choosing where to join and what to learn. This indicates that most students have no or less chance to make the right educational decisions for themselves. This findings are supported by what Bukantaite et al. (2006) investigated in their study that 77.9 percent of students responded that their desire to “learn anywhere” is made by the family of students. Mills and Lavender asserted that most of the research findings have shown that student approach to TVET is influenced by their guardians. Otula [36] also supported by stating that families involvement determines the emotional and material input that further determined the motivation level in students towards education choice.

Impacts of Quality of TVET Education

Quality of TVET education was found to have a statistically significant positive impact on the attitude of students towards TVET education. This imply that poor quality TVET education lower the choice of students. Lack of adequately trained vocational teachers, technically incompetent staff, lack of infrastructure, poor Instructional materials and hours of instruction, at technical and vocational education and training colleges highly affects the attitudes of students towards choosing TVET courses.

In line with these finding, many researchers supported the results. For example, the lack of infrastructure continued to affect the full enrollment of TVET students in South Africa (Powell and Mcgrath, 2013), Nigeria (Ogbuanya, 2014), Bangladesh (Alam and Forhad, 2020), Chile (Rojas et al., 2019) and Kenya (Reuben et al., 2020). Moreover, inadequate teaching and learning services, inconsistencies in curriculum compliance to meet market needs and a lack of industrial integration lead to lower enrollment to technical and vocational education (Nursiah et al., 2020). Therefore, it was identified that quality of TVET education have impacts on student’s attitude towards choosing TVET educations.

Impacts of Peer Influence

Peer influence was found to have a statistically significant impact on the attitude of students towards TVET education. The data analyses showed us that In addition to parents, peers also influence student attitudes in the choice of TVET education. In support of this finding, Indoshi et al. [37] investigated that peers influence has most impact for selection of subjects. Some students select that subjects which their friends chose. Some peer group belongs to any social class who share same values so peers group influence to their peer in the choice of vocational education. In Ghana, another study found that generally no negative perception was attached to Technical and vocational training as a separate occupation of student education, but the results showed that concern for student program choice has a significant effect on technical and vocational school enrollment. Therefore, better communication with teaching high school colleagues and encouraging colleagues to interact with students in the area could help to increase the enrollment rate of students in to TVET education.

Conclusion

Based on the results of the current study, the following conclusions were drawn. First, it was indicated that there were no high sex disparities among respondents in the study area. The majority of the respondents were below 25 years, which suggests that most of the respondents were young adults who have great opportunities for further technical and vocational educational attainment for the future generations of the country. On the other hand, the results of the study revealed that 48.6% of the variation in the attitude of students towards TVET education can be explained by changes in Socioeconomic factors, parental influence, quality of technical and vocational education and training education and peer influence whereas 51.4% were unexplained variables that affect the attitude of students towards TVET education.

Even-though all independent variables (Socioeconomic factors, Parental influence, Quality of TVET education and Peer influence) have a statistically significant impact on the dependent variable, the impact of socioeconomic factors is much higher than that of parental influence on the attitude of students towards TVET education’; the independent variable ‘parental influence’ is much higher than that of the ‘Quality of TVET education on the attitude of students towards TVET education’; and the independent variable ‘Quality of TVET education’ is much higher than that of the independent variable ‘peer influence’ on the attitude of students towards TVET education’, The study therefore concludes that that ‘Socioeconomic factors, Parental influence, Quality of TVET education and Peer influence’ were the stronger predictor of Attitude of students towards TVET education sequentially.

Recommendations

Based on the major findings of the study and conclusions drawn, the following recommendations are forwarded:

  1. The government, Head of TVET and TVET board members should arrange and provide a serious and consistence campaign on the importance of TVET in the development of the country.
  2. Governments, communities and NGOs at local levels should provide financial, material and human resources to strengthen and enhance the quality of education imparted at TVET institutions.
  3. Guidance and counselling services should be strengthen in larger community in general and for parents in particular on the importance of TVET to influence their children towards Technical and vocational education and training.

References

  1. Adams AV (2011) The role of skills development in overcoming social disadvantage: Background paper prepared for the education for all global monitoring report 2011, paper commissioned for the EFA Global Monitering Report 2011.
  2. Ali Sh (2013) Evaluation of the factors contributing to the lack of interest of female students in studying in vocational schools in Tehran in 2011-2012.
  3. Ozioma C, Azubuike (2011) Influential Factors Affecting the Attitude of Students Towards vocational/Technical Subjects in Secondary Schools in Southeastern Nigeria. Journal of Educational and Social Research Vol 1: 2
  4. Billet S (2011) Vocational Education: Purposes. Traditions and Prospects. Journal of Vocational Education & Training.
  5. Azeem N, Omar MK (2018) Exploring Teacher Performance: A Review of Concepts and Approaches. [crossref]
  6. World Bank (2015) Small and Micro Enterprises, World Bank Group Review of Small Business activities: Washington, DC.
  7. Ministry of Education (2015) Education Sector Development Program V (ESDP V): Addis Ababa.
  8. Ministry of Education (2008) National Technical and Vocational Education and Training (TVET) Strategy. Addis Ababa, MoE,
  9. MoE (2010) Federal Democratic Republic of Ethiopia, Ministry of Education, Education Statistics Annual Abstract 2003 E.C (2010-11 G.C): Education Management Information System, Addis Ababa.
  10. Ohiwerei F, Nwosu B (2009) Vocational Choices among Secondary School Students: Issues and Strategies in Nigeria. Asian Journal of Business Management 1: 1-5. [crossref]
  11. Awang H, Sail R, Alavi K, Ismail I (2011) Image and Students’ Loyalty Towards Technical And Vocational Education And Training. Journal of Technical Education and Training (JTET) 3: 1.
  12. UNESCO (2012) Third International Congress on Technical and Vocational Education and Training Shanghai, People’s Republic of China.
  13. Chris Z, Lindsey M (2016) Vocational and Technical Education Oxford University Press.
  14. ICBEM (2015) International Conference on Business, Economics and Management.
  15. Tsehay F (2014) Gender Role Perception and Vocational Choice of Trainees in Tvet Colleges/Institutions. Thesis. Addis Ababa University.
  16. Nursiah ES, Azhar WCN, Mansor M, Maarof S (2020) The Role of Intellectual, Emotional and Spiritual Intelligence towards Entrepreneurial Intention among TVET Student Indonesia and Malaysia 2: 117-123. [crossref]
  17. Akanbi GO (2017) Prospects for technical and vocational education and training (TVET) in Nigeria: Bridging the gap between policy document and implementation. International Education Journal 16: 1-15.
  18. Esrael W (2018) Attitude of Students Towards Technical Vocational Education and Training (TVET) at Yeka Sub-city Government TVET Colleges.
  19. Igbinedion V (2011) Perception of Factors That Influence Students’ Vocational Choice of Secretarial Studies In Tertiary Institutions In Edo State Of Nigeria. European Journal of Educational Studies 3: 325-337.
  20. Ayonmike SC (2010) Skill training in Nigerian Technical Colleges: Benefits and challenges. Journal of Qualitative Education 6: 75-86.
  21. Cheong K, Lee K (2016) Malaysia’s Education Crisis – Can TVET Help ? 53: 115-134.
  22. Dania J, Bakar AR, Mohamed S (2014) Factors influencing the acquisition of employability skills by students of selected technical secondary school in Malaysia. International Education Studies 7: 117-124.
  23. Antonios F (2006) The Implementation of the Middle Level TVET Program in Addis Ababa.
  24. Irina S, Pramila K (2013) Technical and Vocational Education and Training in Ethiopia.
  25. Powell L, Mcgrath S (2013) Why students enroll in TVET – The Voices of South African FET College Students. Journal of Vocational Education and Training (JVET) 23.
  26. Ogbuanya TC (2014) Workshop equipment and facilities as critical factors for sustainable skill acquisition through TVET in Nigeria. JORIND 12: 2.
  27. Alam GM, Forhad MAR (2020) Roadblocks to university education for diploma engineers in Bangladesh.
  28. Rojas MP, Tapia PB, Kemper JM, Maldonado MK (2019) Country Case Study: on Technical Vocational Education and Training (TVET) in Chile.
  29. Reuben R, WanyekiPaul, Hebert D (2020) Influence of Occupational Stereotyping on Enrolment in Technical Courses: A Case of Female Students in Technical Training Institutions in North Rift Region, Kenya.
  30. Okello B (2013) Factors influencing the attitude towards technical education and training in Uganda. Kenyatta University.
  31. Eurobarometer (2011) Attitudes towards Vocational Education and Training.
  32. Ayub H (2017) Parental Influence and Attitude of Students towards Technical Education and Vocational Training. International Journal of Information and Education Technology 7: 7.
  33. Bukantaite D, Laužackas R, Sabaliauskas T (2006) Motivation for vocational education and training choice in Lithuania. In ECER 2006: Paper presented at the European Conference on Educational Research Post Graduate and New Researcher Pre-Conference [Elektroninis išteklius], University of Geneva, 11 September 2006. Switzerland: University of Geneva, 2006.
  34. Mills TA, Lavender T (2011) Advanced maternal age. Obstetrics, Gyna Ecology & Reproductive Medicine 21: 107-111.
  35. Gemechu A (2018) Family Socio-economic Status Effect on Students’ Academic Achievement at College of Education and Behavioral Sciences, Haramaya University, Eastern Ethiopia. Journal of Teacher Education and Educators 7: 207-222
  36. Otula PA (2007) Mastery of modern school administration.
  37. Indoshi F, Wagah M, Agak J (2010) Factors that determine students’ and teachers’ attitudes towards art and design curriculum. International Journal of Vocational and Technical Education 2: 9-17.