Monthly Archives: July 2021

fig 5

COVID-19 Sudden Outbreak of Mystery Case Transmissions in Victoria, Australia, May-June 2021: Strong Evidence of Tropospheric Transport of Human Passaged Infective Virions from the Indian Epidemic

DOI: 10.31038/IDT.2021214

Abstract

A sudden yet very small outbreak of COVID-19 mystery community transmissions occurred in a defined arc across the inner Western and outer Northern suburbs of Melbourne in May-June 2021. An infection zone that could be 1000 km2 in size. These sudden outbreaks of genuine mystery cases could not be traced to any direct infected contacts nor could they be directly genomically linked to any known infection clusters (e.g. among infected international travellers in hotel quarantine). In response the Government of Victoria on the recommendation of the Chief Medical Officer and the Victorian Department of Health locked down the entire State of Victoria in an extreme Stage 4 emergency. As a consequence, large numbers of PCR COVID-19 tests on oro-nasal swabs were conducted (> 30, 000 per day at peak) and all positives quarantined at home, a directive enforced by police and in some cases the Australian Army. Citizens were neither allowed to leave Melbourne nor from Victoria to any other State of Australia. Contact tracing was conducted on a very large scale by teams of experienced tracers. Several sudden mystery outbreaks continued to occur despite the lock-down on people movements. This included restriction of numbers of visitors at homes, crowd-size limitations, curtailment of sporting events, school closures, mandatory mask wearing, and personal tracking of all individuals in shops and supermarkets (via a personal “QR” digital tracking system linked to mobile phones or via written personal contact statements at store or shop entry). Many of the COVID-19 variants of concern (PANGO classification) were clearly mature human-passaged virions, many of which have been identified in the current and very large 2nd Wave Indian epidemic. We show here there is plausible strong evidence that a heterogeneous set of these “Indian” variants may have been transported by prevailing tropospheric global wind systems via the Indian Ocean and Southern Ocean (Roaring Forties West to East on the 40o S Latitude line) to Victoria, Australia. There is much precedent for such global wind transportations in the history of past Influenza virus pandemics in the last 100 years and the present observations relating to COVID-19 events in Australia are discussed in that context.

Introduction

A cool and objective scientific understanding the origins and global spread of the COVID-19 virus is the most pressing issue of our time. The multifactorial evidence that we have assembled through 2020 is fully consistent with COVID-19 arriving first via a loosely-held life-bearing carbonaceous cometary bolide that dispersed its viral cargo in the stratosphere on the 40o N Latitude line over Jilin in North East China on the night of October 11 2019 [1-3]. A long series of air-sampling experiments carried out in the stratosphere over the past 20 years have revealed unequivocal evidence of biological entities ranging in size from tens of nanometres, identifiable as virions, to several microns corresponding to bacteria at heights of up to 41 km [4,5]. More recently, Grebennikova et al. have identified by PCR techniques several bacterial species on the outside of the International Space Station (orbiting at a height of 400km) which are most plausibly of cometary origin [6]. A variable population of bacteria and viruses in the stratosphere thus appears to have a firm empirical basis, and is moreover consistent with the theory of cometary panspermia for which there is now a formidable body of evidence [7,8].

A critical evaluation of all the relevant evidence suggests the causative virus of the COVID-19 pandemic could not have come from an infected bat or pangolin to infect all of the central region of China around Wuhan city and Hubei province on the scale that was witnessed in Nov 2019-Jan 2020 [2,9]. In our opinion, guided by the relevant evidence and observations of many similar instances of suddenly emergent pandemics throughout history [10], this pandemic is entirely natural which is by no means unique. It represents a natural phenomenon consistent with the emerging paradigm that life is an all pervasive cosmic phenomenon [10-12]. It is unrelated to putative explanations based on non-scientific ad hoc human-induced conspiracy theories – such as those currently in vogue in the popular press e.g. “Wuhan Virus Lab Leak” theories. It cannot be emphasised too strongly that all such explanations are non-scientific. They require too many ad hoc assumptions, many incoherent and contradictory, when rationally examined in the light of all the unfolding temporal key evidence. The appropriate scientific domains in which the relevant data must be addressed and analysed for this pandemic must of necessity include immunology, genetics, epidemiology, astrobiology and atmospheric physics. The group of scientists that we represent has been tracking, analysing, explaining as well as predicting with accuracy the course of this suddenly emergent virus disease from its origin and early spread in Wuhan in late November 2019 through January 2020, following in our view the arrival at the Earth of a putative life-bearing cometary bolide [1,3]. We then analysed the early evidence against the standard explanation of global infection-driven solely by person-to-person (P-to-P) transfer of the COVID-19 virus [13]. The long-distance transfer of infection after the initial Wuhan strike to other far-flung global regions occurred primarily not by P-to-P transfer but via upper level tropospheric/stratospheric jet streams on a 40o – 60o N latitude band from East to West [14]. This process combined with more localised lower-level tropospheric wind systems (West-to-East) explains much of the unfolding data in the early weeks of the pandemic. This includes the otherwise mysterious transport across the Pacific Ocean of the L haplotype of the Wuhan-plumed P-to-P virus to infect the Grand Princess cruise ship off San Francisco [3].

The pandemic next appeared to move into lower – level Atlantic Ocean prevailing wind systems and thence into the Southern Hemisphere [15]. During this early period, up to May 2020, many ships at sea became engaged with sudden and seemingly mysterious COVID-19 outbreaks: cruise ships (Diamond Princess, Westerdam Grand Princess), aircraft carriers (USS Theodore Roosevelt, the French Navy’s Charles de Gaulle), various fishing trawlers and live animal transportation ships [9,16]. Wherever these ‘ship at sea’ strikes could be cleanly analysed it became evident that all such outbreaks are best understood as mid-ocean depositions of COVID-19 virions with all the tell-tale signs of aerial pathogenic attack [9,16]. Moreover, sudden strikes on isolated islands such as Sri Lanka that had flat-lined in COVID-19 case incidence all year (2020) and then suddenly became engaged in a few days (Oct 4-6, 2020) with over a thousand active cases are difficult to understand in terms of traditional P-to-P spreads considering the associated minimum incubation time between transfers of infections of about one week [3,17]. Another remarkable incident of a similar kind is the isolated Chilean military base in Antartica, thousands of kilometres from civilisation that became suddenly engaged late December 2020 [3]. A cool objective assessment of all these types of striking sudden COVID-19 outbreaks are inconsistent with traditional P-to-P infectious disease epidemiology, but entirely consistent with transportation via tropospheric winds and precipitation (rain) bringing the viral-laden clouds to ground. In this way we can explain the sudden and simultaneous appearance of sporadic mass infections in widely separated geographical locations that are mutually isolated, and thus cannot be cross-infecting one another by a P-to-P spread process. The intensity of each outbreak in any given geographical zone depends only upon viral density at in-fall, and the exposed susceptible human population density in that area. The viral density detected at ground level is predicted to be quite patchy, on scales determined by the turbulence patterns caused by thermal fluctuations determined by local heat sources.

The modern tendency to invoke the ad hoc concepts of super spreaders, asymptomatic carriers or “stranger-to-stranger” spread to explain any baffling aspects of the pandemic is a desperate attempt to maintain the status quo of the terrestrial origin of the virus and its P-to-P spread. It is interesting to recall that this is strikingly reminiscent of the Ptolemaic epicycles that were invoked in the last days of the Copernican revolution (Supplementary Information). It was the multiplication of such epicycles that finally led to the rejection of the Ptolemaic Earth-centred universe. Whether we have now come anywhere near this critical point in the story of COVID-19 epidemiology is left to be seen. Through 2020 we analysed the genetics of adaption of the COVID-19 virus in the first few months of the pandemic in 2020 at clear explosive hotspot locations (Wuhan, New York City, US West Coast) and defined the initial (ab initio) haplotype sorting process used by all respiratory epithelial lining cells in the innate -immune driven host -parasite relationship in the first 24-48 hrs of infection – APOBEC and ADAR deaminase-driven ribo-switching of a common set of COVID-19 haplotypes. These are best understood as co-ordinated single nucleotide variant (SNV) changes consistent with successful effective replicative RNA secondary structures [9,18]. This is discussed further in ‘Haplotype Analysis’ in Materials and Methods.

In a review of all the relevant key evidence the most parsimonious explanation seems to be that COVID-19 came from space [2,3], just as have many other similar suddenly emergent pandemics past and recent: such as the Spanish Flu 1918-1919 and the other pandemics that punctuate history over millennia, and in particular over the best documented period over the past 100 years spanning the 20th and 21st centuries [10-12]. In this report we now critically evaluate the publicly available infection and COVID-19 genomic data for the sudden, yet small, outbreak of COVID-19 cases in Victoria, Australia in May – June 2021. Many of the initiating cases prior to P-to-P spreading within a local cluster are genuine mystery/community transmissions that have still not been resolved as this paper was submitted (as June 19 2021) – either by contact tracing or by genomic sequencing matching with already known clusters in the epidemic target zone. Given the global isolation of Australia as an island continent, and the further isolation of the State of Victoria, taken together with the stringent quarantine and isolation regulations combined with diligent contact tracing that have been in place, we have here a remarkable setting for a controlled experiment for testing transmission models of the COVID-19 pandemic. As seen in Figure 1 all the case numbers in Australia are minuscule in comparison with the Northern Hemisphere infected zones (and see Supplementary Information). Further advantages in the situation in Victoria include the scale of mass PCR COVID-19 testing (≥30,000 per day, Figure 2); and a strictly policed social distancing/mask covering with Stage 3 and Stage 4 lock down regulations enforced in Victoria with the deployment of police and sometimes the army. The available data in the public domain allows scientific conclusions not as easily derived for the Northern Hemisphere infected zones, where the disease is of far greater intensity and wider geographic extent (two to four orders of magnitude greater than the greater metropolitan area of Melbourne, Victoria – this has, however, had well over 90% of all COVID-19 cases in Australia in 2020 and 2021 c.f. Figure 1 and URL link).

fig 1a

fig 1b

fig 1c

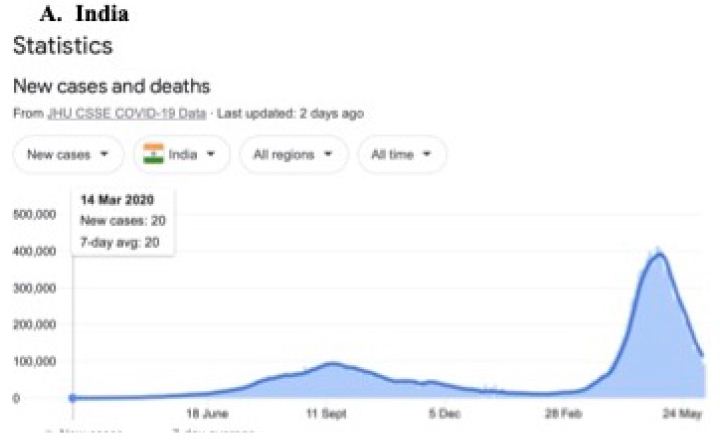
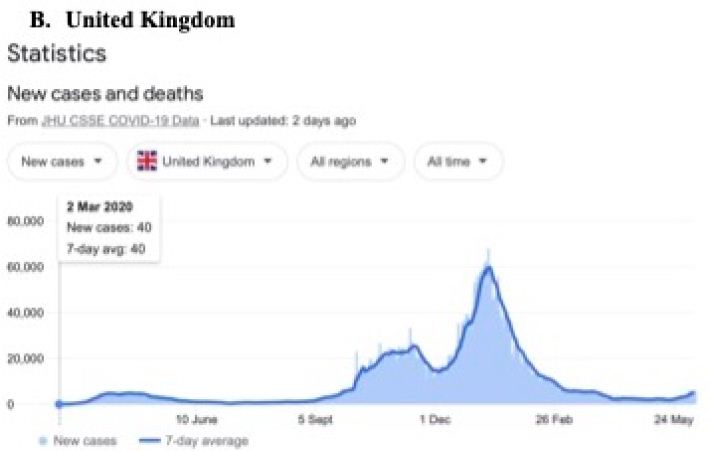
Figure 1: Magnitude and timing of the COVID-19 epidemics in Inda, United Kingdom amd Australia during 2020 and 2021.
Google: “Coronavirus disease statistics”URL is https://tinyurl.com/hcp8axvn. This gives you the “Australia” dashboard (from there you can choose your country in the menu bar scroll).

fig 2

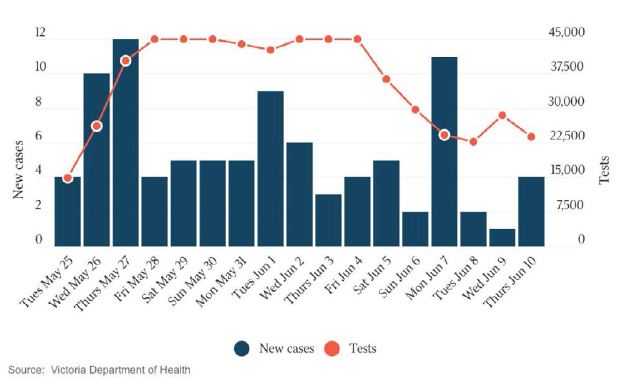
Figure 2: New Cases per Day and Total PCR Tests per Day  in Victoria. The Australian 10 June 2021. Hard Stage 4 lockdown across entire state of Victoria introduced on May 27.

There are two general tropospheric viral-laden in-fall hypotheses that could serve to explain the patterns in these mystery infection data. They could operate together, or one or other may prevail in quantitative terms.

The two possibilities are:

A. The sudden outbreaks are due to precipitation bringing down virus-laden cometary dust in an arc around inner-outer Melbourne (West-North, approximately 1000 Km2) thus contaminating the environment and causing spot mystery infections of SARS-CoV-2 respiratory disease (generating simple haplotype variants ab initio, as Steele and Lindley [18]).

B. The sudden outbreaks are caused by the same precipitation (rain) bringing down human passaged virions transported in global wind circulation from Northern Hemisphere infected zones, in particular from the Indian outbreaks.

The most likely source, in our view, would be the putative and massive viral plume over India of virions which have already “gone through” human passage (P-to-P), and thus showing substantially modified genomic sequences as multiple P-to-P products from the early ab initio haplotype sequences These were discussed, using data from the first three months of 2020, for haplotype diversification between Wuhan and New York City [9,18].

Here we assemble the evidence that strongly supports hypothesis B, that all the community transmission ‘mystery cases’ in the Victorian epidemic in May – June 2020 may have been caused by a range of Indian human-passaged viruses delivered to Victoria, Australia, from elsewhere, most likely via the Indian subcontinent viral plume via tropospheric wind systems. This conclusion is not inconsistent with low level tropospheric prevailing wind systems spreading viral pandemics in the recent past via non P-to-P processes on scale [10]. Many striking non P-to-P spreading events like this were reviewed over 30 years ago by Hammond et al. [19].

Materials and Methods

Publicly Available Data Resources

a. GenBank/NCBI Virus db

For full length COVID-19 genomic sequences and their haplotype analysis against the Wuhan Hu-1 29903 nt long RNA reference sequence (NC_045512.2) all Genbank Accession sequence data were obtained and aligned (multiple sequence alignments) using the NCBI Virus database and alignment tools. This publicly accessible site is hosted at The National Center for Biotechnology Information (NCBI) at the National Institutes of Health (NIH), Bethesda, Maryland, USA, which curates SARS-CoV-2 sequences at https://www.ncbi.nlm.nih.gov/sars-cov-2/#nucleotide-sequences

b. Epidemiological Information

This is from that published daily by the national newspaper The Australian and other information from Melbourne’s Herald-Sun newspaper. All specific details are referenced or expanded on in the Supplementary Information. Other data for background long term cross checking can be access at The Victorian Department of Health website https://www.dhhs.vic.gov.au/victorian-coronavirus-covid-19-data

c. Weather Information

This was from The Australian Bureau of Meteorology (BOM) and also news reports through April and May 2021

http://www.bom.gov.au/climate/dwo/202105/html/IDCJDW3050.202105.shtml

Haplotype Analysis

The haplotype approach to COVID-19 sequence diversification [18] differs from the PANGO classification system which uses a phylogenetic approach which generates putative person-to-person (P-to-P) lineages, clusters and clades [20,21]. The ab initio haplotype-sort/selection explanation, during first infection of respiratory epithelial cells in the first Host-Parasite encounter – by viral-laden meteorite tropospheric dust – is a better primary explanation of the APOBEC/ADAR-driven deaminase ribo-switching process and informs classification of sequences through molecular understanding based on variant RNA secondary structures. In the first three months of the pandemic this ribo-switching haplotype sorting and quasi-species selection process operates in the first subject infected host [22,23]. This generates, in our view, a range of quasi-species and then host-parasite selection allows successful emergence of a replicative 29903 nt long RNA secondary structure haplotype in that subject host (Steele and Lindley 2020 [18] Table 1). The PANGO variants published in The Australian newspaper (Saturday 5 June 2021) which are of concern to the Victorian Department of Health (Figure 3) have been assigned haplotypes using these markers (Table 2).

Table 1: Putative Ab Initio Haplotypes and Main Sites Defining COVID-19 Common Strain Variants in first 3 months of the pandemic (Jan-Mar 2020).

table 1

fig 3

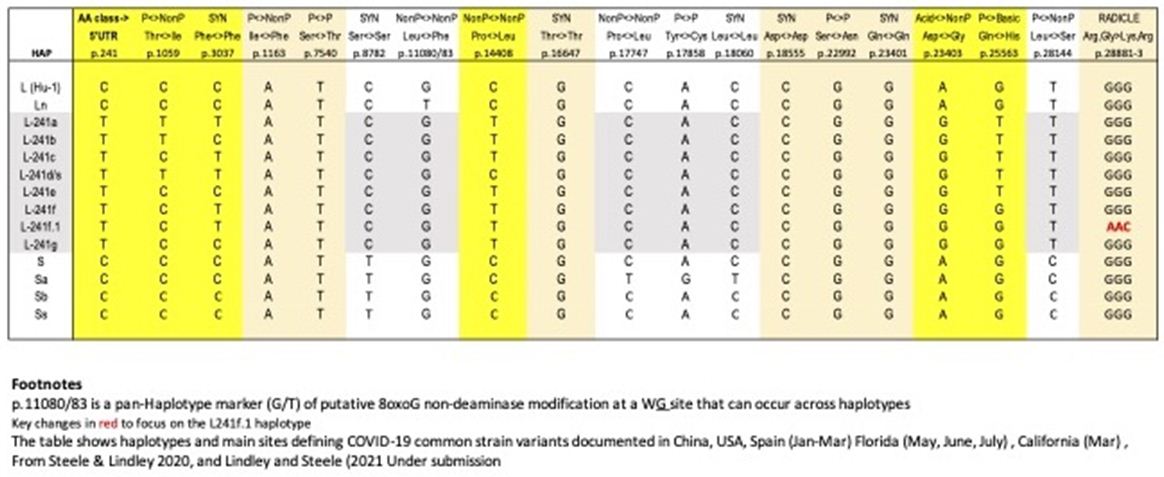
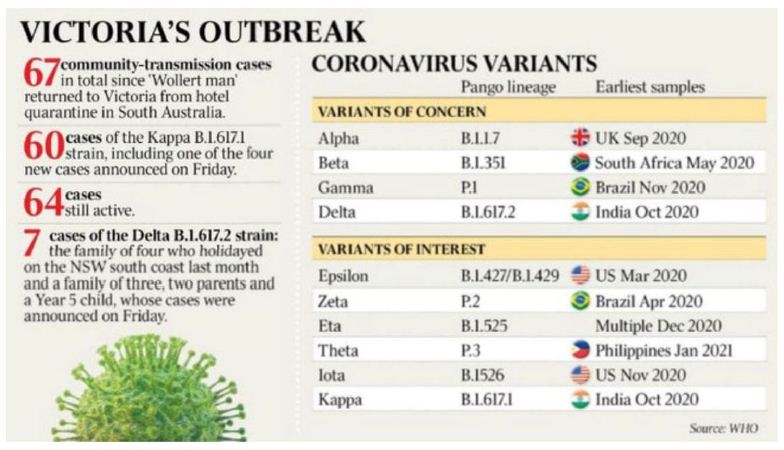
Figure 3: The Australian Saturday 5 June 2021

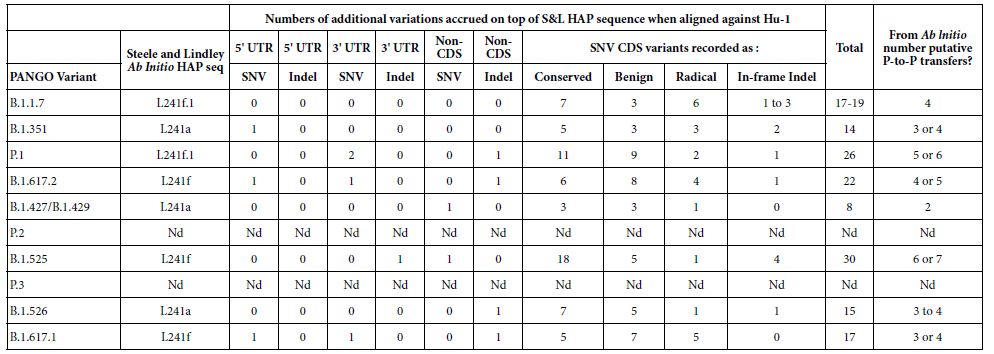
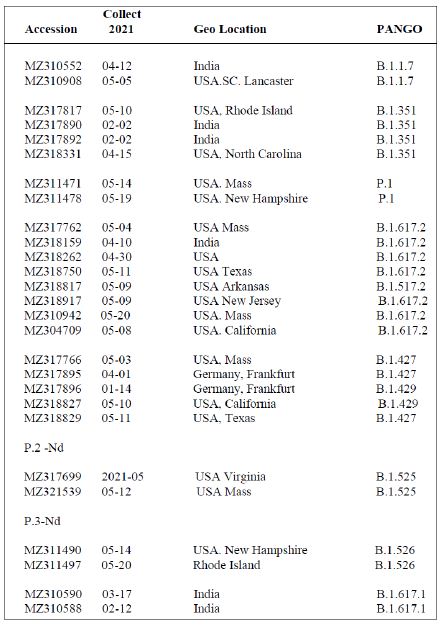
Table 2: PANGO variants of COVID-19 of interest and concern in Melbourne, Victoria outbreak of mystery cases in May-June 2021.

table 2

The PANGO variants from The Weekend Australian June 5-6 2021.

Criteria for a SNV in the Coding Regions (CDS) Classed as Conserved, Benign, Radical (Table 2) – as defined in Steele and Lindley (2020) [18]

Conserved: These are synonymous SNVs or a SNV change leading to the same amino acid (AA) functional class. Benign: These are AA changes which are Polar<-> NonPolar, Acid <-> Polar, or Basic<-> Polar. Radicle: These are AA changes Acid<-> NonPolar, Basic<-> NonPolar, Acidic<-> Basic.

Multiple PANGO Sequences Used to Determine Haplotypes as Shown in Table 2

Shown in Table 3 are the GenBank accession numbers of many of the PANGO variants of concern in Victoria from the NCBI Virus website for the haplotype analysis in the Melbourne, Victoria outbreak of mystery cases in May-June 2021- all haplotyped in multiple alignments v Hu-1 (NC_045512).

Table 3: Gen Bank accession numbers of all PANGO sequences multiply aligned for haplotype assignment.

table 3

Among a Set of the Same “PANGO Designated Variants” There Will be Variable Sites – that is “Not All PANGOS are Identical

It is important to understand that when newly isolated COVID-19 genomic sequences are assigned a PANGO variant/lineage label, all PANGO variants with that label are not necessarily identical. Human passaged (P-to-P) will introduce further new variable sites within that haplotypic framework. For example in a multiple alignment against the Hu-1 reference of six B.1.617.2 variants (MZ318750, MZ318917, MZ320553, MZ317762, MZ318262, MZ318150) the number of non- haplotypic shared sites above the 22 listed in Table 2 for B.1.617.2, there are 49 other sites that can vary. A similar pattern like this applies to sets of the other PANGO haplotypes in Table 2 aligned against Hu-1. Thus the statement that a freshly isolated sequence “has a particular PANGO variant sequence (i.e. haplotype) should not be taken to mean all members of that variant are identical as APOBEC/ADAR-driven variation at P-to-P transfers ensures most will be not identical. Most of these differences (>95%) result in conserved or benign AA changes i.e. there is considerable sequence conservation at the protein level due to Darwinian purifying selection (e.g. in the six B.1.617.2 sequences discussed above 48 of the 49 variable sites are conserved or benign as defined).

Estimates of P-to-P Transfers (Table 2)

It should be noted here that the estimates of the numbers of putative P-to-P transfers since ab initio creation in the first infection from raw meteorite dust-derived virus, is based on conservative estimates from the observations in the Wuhan (Jan 2020) and New York City (Mar 2020) hotspot zones [18].

Results and Discussion

To focus on the relevant geographical infected Melbourne region, Figures 4A and 4B show Google Maps of the West-North Melbourne arc where the great majority of waste water catchment COVID-19 fragment detections have been found (April to early May 2021, Supplementary Information) and where the suddenly emergent mystery case-generated clusters of COVID-19 infections have later been found (below and Supplementary Information). A conservative estimate of the size of the region could be at least 1000Km2, stretching from Altona/Maidstone in Melbourne’s South West to the northern Whittlesea local government area (LGA) in which the suburb of Wollert is on the southern edge. The distance from Altona to the northern edge of Whittlesea LGA is at least 30 Km.

fig 4a

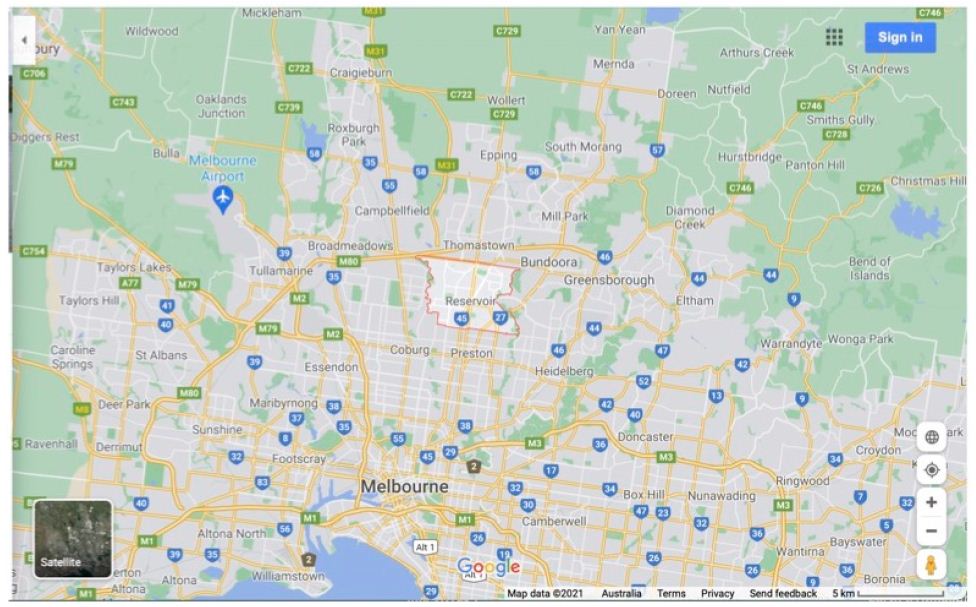
Figure 4A: Map West-North Melbourne Infected zones centred on “Reservoir”.

Weather in Melbourne and Environs through April into May 2021

There was significant April rain in greater Melbourne, usually at night and cold, on 9th (6.2mm), 10th (0.2 mm), 11th ( 3.4 mm), 12th (10 mm), 13th ( 0.6mm), 16th (1mm), 21st (10.4 mm), 23rd (0.4 mm), 25th ( 2.6 mm), 26th (1.2 mm), 27th (0.6mm), 28th ( 0.4mm) ; then again further rains well into May and June including severe flooding in the same regions covered in the Google Maps above. Precipitation coming up from the Southern Ocean in a SW to E direction (the typical prevailing way the winter weather visits Victoria) would be a necessary pre-condition for any tropospheric clouds of COVID-19 virion dust-associated particles to be brought to ground.

PCR COVID-19 Fragments Detected in Waste-Water Catchments Prior to Sudden Outbreak

The West-North arc and range of these detections is specifically covered in the Supplementary Information. They occurred during a period when no COVID-19 cases had been detected for many weeks (prior to May 11). These significant PCR detection signals occurred in late April early May before ‘Wollert Man’ the putative infective P-to-P trigger for the entire outbreak (see below and Supplementary Information) left the Adelaide quarantine hotel (May 4) and cover the same environment footprint where all the key putative mystery cases have been reported or deduced to have emerged. Thus, significant environmental contamination with COVID-19 genomes appears to have occurred and are manifest in waste-water catchment reservoirs in the W-N arc under discussion and analysis – it stretches incredulity that all the PCR fragments signals, in the face of massive dilution factors, are due to undetected high-rate urine shedders of COVID-19 virions by undetected asymptomatic infected subjects. The maps in Figures 4A and 4B can assist in visualising this COVID-19 fragment footprint in association with Supplementary Information.

fig 4b

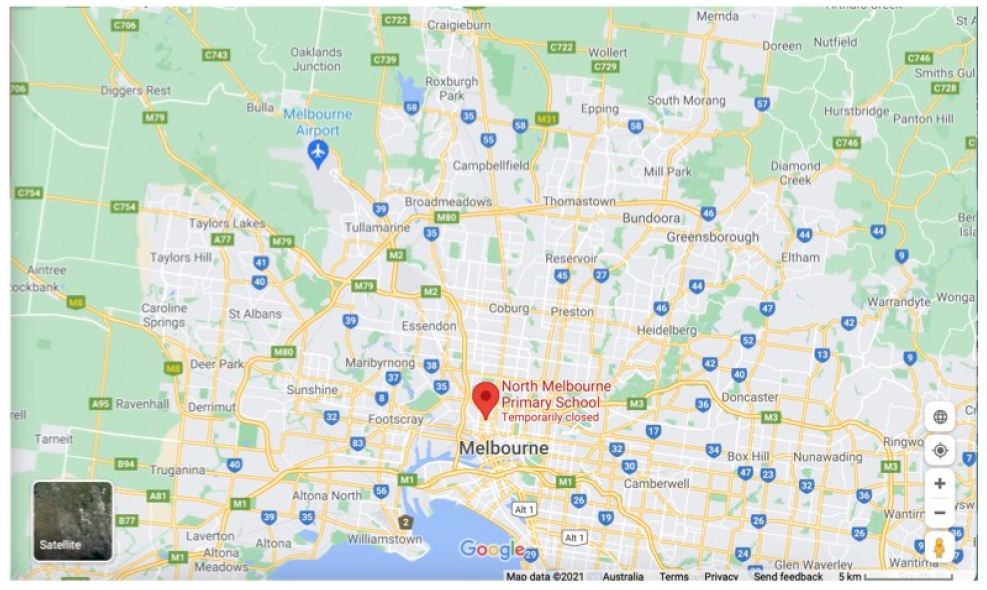
Figure 4B: Map West-North Melbourne Infected zones centred on “North Melbourne Primary School”.

Analysis of Key Mystery Cases and Clusters

The caveats to this analysis are the absence of meta-data (ethnicity, clinical status, exact likely locations at infection) and the non-availability of exact COVID-19 genomic sequence(s) apart from muted PANGO variant of the infected subjects as well as considerable mis-information about each case in the mass media. There is only limited knowledge of the genomic sequence (shown in Figure 3) – some are either Indian variant kappa (B.1.617.1) or delta (B.1.617.2) as assigned below. When it was neither variant that was acknowledged in the press release we can only deduce that in that particular mystery case the sequence was “one of concern” as summarised in Figure 3 and Table 2. All the key public information around the origin of each mystery cluster is provided in the Supplementary Information for the reader to independently weigh up the evidence pro and con. In our considered view every case in the list below is a real mystery community transmission- no definitive genomic links nor P-to-P contact links with any other cluster. There has been considerable speculation in the mass media with state-wide (and even nation-wide) searches for the ‘missing links’ between clusters. They have not been found. To claim, as indicated in Materials & Methods, that Wollert Man or those in the larger Whittlesea LGA cluster are of the kappa Indian variant does not constitute evidence of a direct genomic link-in a situation as in Wollert v Whittlesea where no direct physical P-to-P links can be established. The article by The Australian’s Stephen Lunn on the origins of ‘Wollert Man’ catching a kappa variant by a putative fleeting 18 second contact in a corridor at the Playford quarantine hotel in Adelaide CBD cannot be taken seriously in the light of all the other epidemiological evidence (discussed below)

. Wollert Man (Indian Variant Kappa B.1.617.1)

Wollert Man, a 30 yr male returned home to Australia on April 20 from India via Adelaide airport and went into hotel quarantine. Over the next 2 weeks he had 3 negative PCR tests. On May 4 he travelled to Adelaide airport, caught a plane to Melbourne, travelled from the airport by Sky bus to Melbourne’s Southern Cross Station in the CBD, then caught the train north to Wollert, where he lived. According to reports he had some symptoms on May 8 and was PCR positive on May 11. His close contacts in the household have not become PCR positive. He had limited movement while in Wollert (in the Whittlesea LGA) but all subsequent tests on all those putatively contacted by him on his May 4 travel to Wollert and since (several hundred contacts) have scored PCR negative. In addition there was no transmission of the Playford hotel kappa Indian variant in Adelaide or anywhere in South Australia. The later kappa Indian cluster in Whittlesea LGA (on May 24) some 5 to 10 km from his Wollert home has no direct link to Wollert man- only the loose ‘kappa variant’ associations highlighted by the media and the Victorian Department of Health discussed already and in Materials and Methods (and Supplementary Information).

The most parsimonious interpretation of these data is that Wollert Man became infected when he returned to the already COVID-19 contaminated environment in Wollert on his return. He did not overtly transfer the infection after that date. This is a real genuine in-fall infection from the troposphere with an already human passaged common Indian variant (Table 2).

. Whittlesea Cluster (Indian Variant Kappa B.1.617.1)

This is a much larger cluster that emerged suddenly on May 24 and grew to about 20 cases in a few days (Figure 2), then to even greater numbers > 60 cases (Figure 3 and Supplementary Information). We have established there is no link with Wollert Man. We have no idea if there is more than one kappa mystery infection that initiated the P-to-P expansion. It is conceivable there may have been more than one pro-band. The situation remains confused and that point is not resolved. This cluster is not linked genomically or by any P-to-P contact with the other mystery clusters (below).

. Arcare Outbreak (Variant Non-Indian Kappa or Delta)

This case appeared suddenly on May 30 2021 in a 55 yr female carer at the Arcare aged care facility in Maidstone, West Melbourne (see Supplementary Information). It was passed to several elderly residents (> 80 yr) and also to another female carer who was also working in another local aged care facility (Sunshine). Of interest the 55 yr female carer had already had one COVID-19 vaccination, and the resident she passed it to (90 yr male) had a full course of two vaccinations. The elderly infected residents were transferred to hospital and seem to have recovered at time of writing. The Arcare facility is in lockdown at time of writing.

. Delta Cluster, Nth Melbourne (Indian Delta B.1.617.2)

This cluster emerged around June 4. It involved two families from North Melbourne who travelled together on holiday to the South Coast of NSW in the same large people moving van. Most members of that travelling group have become PCR positive. There are no physical or genomic links to any other cluster. But a supposed link with a ‘delta’ Indian variant brought from overseas by a Sri Lankan traveller to Melbourne has been hypothesized (see Supplementary Information). The most parsimonious explanation is this is a genuine mystery cluster as recognized by authorities. Whether one or several mystery infected probands in that van is responsible for initiating P-to-P spreads is not known.

. Reservoir Cluster (Variant Non-Indian Kappa or Delta)

This appeared suddenly on June 10 2021 and “includes a man in his 80s, a woman in her 70s, a man in his 50s and a man in his 20s who all live in the same household in Reservoir in Melbourne’s northern suburbs” (see Supplementary Information). There is no genomic or physical P-to-P link with any other cluster. It is clear the coronavirus variants driving the mystery clusters in the Victoria outbreak are diverse and typical of prior P-to-P passaged virus variants (Table 2). Where did they suddenly and mysteriously come from? This, we would argue, is a classic signature of spot “infections from the sky” over a regional arc known to have been previously contaminated with COVID-19 genomes on a regional scale. So all these cases are fully consistent with an aerial pathogenic attack from the troposphere, contaminating the environment and capriciously infecting unsuspecting victims as we have discussed in other recent papers.

Possible Explanations

Ab Initio haplotype sorting of meteorite dust raw virus seems highly unlikely given the clear evidence of complex human-passaged variants, many of which appear to have come from the Indian subcontinent epidemic (Table 2). The variant diversity in India is remarkably wide, and not confined to the main “Indian variants” kappa and delta. It includes even the ‘UK Mutant’ (B.1.1.7) which has become engaged in the Indian epidemic (Figures 1, 3 and Table 2). Indeed, in a sample of recent Indian PANGO variants that were uploaded to NCBI Virus we find at least 5 that are of concern in Victoria (Figure 3 and Table 2) have also been found in India. Thus PANGO variants and numbers uploaded in this small sample, as determined over the first two hundred upload web pages – each page can accommodate 200 entries- on June 6 and 7 (in brackets) are : B.1.1.7 (11), B.1.617.1 (4), B.1.617.2 (33), B.1.36.8(10), B.1.36 (14), B.36.10 (1), B.1 (2), B.1.1.216 (3), B.1.367 (2), B.1.1 (4), B.1.1.306 (1), B.1.36.17 (1), B.1.351, (5), B.1.427/B.1.429 (2) (see Supplementary Information). So just how did these mature human-passaged Indian variants appear mysteriously in Victoria from a tropospheric in-fall?

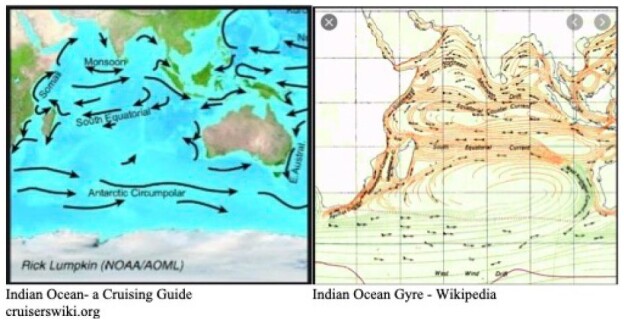
The recent outbreak in India is massive and cataclysmic. It has engaged almost all Indian provinces suddenly across the entire sub-continent (not shown, use URL in Figure 1 to check this fact out). We have speculated in the past that it has been triggered on scale by a viral laden dust comet dust in-fall off the 40o N Latitude band on the southern side of the Himalayan Mountains [3]. However, we can plausibly include, at a slightly later time, the Sri Lankan and Maldives outbreaks as also coming from India (Supplementary Information). Indeed, as we continue to marshal the relevant evidence, there is in fact a temporal sequential order of outbreaks further south on that same longitude line down the East African coast. New COVID-19 outbreaks of variable magnitude, temporally following India, appear evident in Kenya, Madagascar and South Africa. It is thus conceivable that the putative virus-laden plume (heterogeneous collection of human passaged COVID-19 viral variants) over India has been transported by tropospheric Indian Ocean and Southern Ocean prevailing winds to also cause the comparatively minor outbreak in Victoria, Australia in May-June 2021.

The prevailing winds in the Indian and Southern Ocean (Figure 5) make this global tropospheric transport route entirely credible. And indeed, the recent “upticks” in the rolling waves of Chilean epidemics suggest that the entire Roaring Forties 40o S line may now be entrapped by the tropospheric viral clouds from the plume of the Indian epidemic (Supplementary Information). Other independent evidence supporting this interpretation has been documented in the past for the global transport and spread of previous Influenza pandemics by global weather and wind systems [10,19]. Further, in the case COVID-19 in the first few months of the pandemic, the Wuhan plume carrying the dominant human passaged haplotype (L) appeared to have crossed the North Pacific by mid-February 2020 to infect passengers on the Grand Princess cruise ship who displayed genomic sequences of unmutated or lightly mutated L haplotype as discussed [3,18].

fig 5

Figure 5: Prevailing winds in Indian and Southern Oceans
Google link to Indian Ocean winds at: https://tinyurl.com/43axd6f8

Conclusions

It is plausible in the light of this analysis of a defined small COVID-19 outbreak that other global transfers of viral plumes are conceivable. The “UK Mutant” B.1.1.7 is now widespread and very common in the USA (inspection of the very large numbers of uploads of B.1.1.7 variants to NCBI Virus confirms this impression) and including many parts of Europe. These global transportations again via lower-level E-to-W and W-to-E tropospheric winds seem plausible given the expected size of the viral plume over the UK epidemic Dec-Feb (Figure 1). There are many unknowns on the size and potential rising-height of the putative viral plumes, so plausible speculation is required. From available epidemiological data (e.g. Figure 1) which suggest an estimated 10 million active Indian cases at any given time over several weeks (20 days of say 500,000 cases per day), we would have ~ 107 virus exhalers who undoubtedly contribute virions into the lower atmosphere. If we assume that each infected “exhaler” conservatively contributes 1012 aerosol virions we would have a total of 1019 virions potentially arising from the surface of the Indian subcontinent. Such virions which pass through regions of high humidity would be expected to acquire outer mantles of water ice that could help to retain viability to some degree. Fukuta et al. have recently shown that COVID-19 remains highly infectious for prolonged periods in cold and wet conditions [24]. In addition, Kwon et al. [25] have determined the stability of the virus in a variety of biological fluids (nasal mucus, sputum, saliva, tear, urine, blood, and semen) and “it remained infectious significantly longer under winter and spring/fall conditions than under summer conditions”. This suggests that dispersed viruses in aerosol biological fluid protective wraps may add to putative stability. If say 10% of these aerosol-protected virions survive lofting into the troposphere and subsequent wind transport, we have some 1018 virions (all amplified by victims in India) that are in circulation and which could contribute to the outbreaks of the so-called mystery clusters in Victoria, Australia. Indeed as this paper was being submitted it seems that the southern Chinese city of Guangzhou may be engaged in a sudden tropospheric strike of variants from India. Further, many other Northern Hemisphere countries (Russia, UK, USA) are also reporting the sudden spread of the Indian delta variant on real population wide scale (for news links see Supplementary Information File)

Given these developments, and on reflection, the sudden large outbreak in Sri Lanka October 4 – 6 2020 may well have been due to the 1st Wave Indian human-passaged viral plume (see Figure 1 and Supplementary Information). In contradistinction, the recent In Press report of Althoff et al. [26] of early spot detections and spreads of COVID-19 (late 2019-early 2020) suggest early fragmented in-fall of small clouds of raw (non P-to-P passaged) meteorite dust COVID-19 from the stratosphere on the 40o N latitude line as discussed viz [14]. “7 individuals had detectable SARS-CoV-2 immunoglobulin G prior to the first confirmed case in the states of Illinois, Massachusetts, Wisconsin, Pennsylvania, and Mississippi, suggesting that SARS-CoV-2 infections were occurring weeks prior to recognized cases in at least 5 US states [26].”

What lessons can we learn? Certainly, near-Earth surveillance of incoming pathogens from space, such as the suggested “Hoyle” shield needs to be an international imperative [27], as often reiterated by us [3,28], including for monitoring for tropospheric global transport of viral plumes as discussed here. But it seems also that once a viral pandemic is already underway, rising viral-plumes from major infected zones can potentially be transported to infect other global regions on a mass scale. Indeed pathogenic re-circulation via the troposphere during a pandemic is a major factor to consider for societies whose thinking seems restricted to “hard lockdowns and social distancing” to prevent or alleviate the spread of airborne viruses. If it is considered feasible a procedure by which the lower atmosphere and environments of infected areas could be sprayed with suitable disinfectants from the air must surely deserve serious attention. Face masks may be useful during an actual tropospheric in-fall event but may not work in the way the health authorities have advocated during a real mass outbreak on the scale of trillions of infectious virions falling from the sky. All the evidence from the 2nd Wave in the Victorian 2020 epidemic suggests the Stage 4 lockdown had no impact whatsoever on the course of the epidemic [3], a conclusion supported by critical analysis of similar lock downs in the USA [29].

What of the immediate future? Has all the raw cometary dust-protected virus or the P-to-P plumed-virus (almost certainly assisted and protected by pollution particles) [30,31], washed down from the troposphere? The Spanish Flu took two years to run its full course. COVID-19 is nowhere as lethal but its global reach is similar, implying a similar magnitude of initiating viral inoculation. If that is a valid comparison then full viral wash down could perhaps take another 6 months. This time frame is not incompatible with other micron-sized particle falling-rates as estimated for wash down of radioactive tracers following upper-atmosphere nuclear tests in the late 1950s [2]. In conclusion we stress that as scientists we have a responsibility to accept whatever facts that the universe presents us without fear or favour. Distorting or even simply tweaking emerging facts in order to fit a long-established paradigm should be avoided at all cost.

Acknowledgement

We thank Max K. Wallis for critical discussions on the pandemic contributions of rising plumes of P-to-P virus, particularly the Wuhan COVID-19 plume of January 2020. George Howard is thanked for bringing to our attention the recent study by Althoff KN, Schlueter DJ, Anton-Culver H, Cherry J, Denny JC, et al. (2020). We thank John A Schuster for a critical reading of the manuscript first draft.

References

  1. Wickramasinghe NC, Steele EJ, Gorczynski RM, Temple R, Tokoro G, et al. (2020) Comments on the Origin and Spread of the 2019 Coronavirus. Virology: Current Research 4:1. DOI: 10.37421/Virol Curr Res.2020.4.109
  2. Steele EJ, Gorczynski RM, Lindley RA, Tokoro G, Temple R, et al. (2020) Origin of new emergent Coronavirus and Candida fungal diseases- Terrestrial or Cosmic? Advances in Genetics 106: 75-100. [crossref] https://doi.org/10.1016/bs.adgen.2020.04.002
  3. Steele EJ, Gorczynski RM, Lindley RA, Tokoro G, Wallis DH, et al. (2021) Cometary Origin COVID-19 Infect Dis & Therapeutics 2: 1-4. DOI: 31038/IDT.2021212
  4. Wainwright M, Wickramasinghe NC, Narlikar JV, Rajaratnam P, Perkins Joy (2004). Confirmation of the presence of viable but non-culturable bacteria in the stratosphere. J. Astrobiology 3: 13-15. DOI: https://doi.org/10.1017/S1473550404001739
  5. Wainwright M, Wickramasinghe NC, Tokoro G (2021) Neopanspermia – evidence that life continuously arrives at the Earth from space. Advances in Astrophysics. In Press
  6. Grebennikova TV, Syroeshkin AV, Shubralova EV, Eliseeva OV, Kostina LV, et al. (2018) The DNA of bacteria of the world ocean and the Earth in cosmic dust at the international space station. World J. https://doi.org/10.1155/2018/7360147
  7. Steele EJ, Al-Mufti S, Augustyn KA, Chandrajith R, Coghlan JP, et al. (2018) Cause of Cambrian Explosion: Terrestrial or Cosmic? Biophys. Mol. Biol 136: 3-23. [crossref] https://doi.org/10.1016/j.pbiomolbio.2018.03.004
  8. Steele EJ, Gorczynski RM, Lindley RA, Liu Y, Temple R, et al. (2019) Lamarck and Panspermia – On the Efficient Spread of Living Systems Throughout the Cosmos. Biophys. Mol. Biol 149: 10-32. https://doi.org/10.1016/j.pbiomolbio.2019.08.010
  9. Steele EJ, Gorczynski RM, Rebhan H, Carnegie P, Temple R, et al. (2020) Implications of haplotype switching for the origin and global spread of COVID-19 Virology: Current Research DOI: 10.37421/Virol Curr Res.2020.4.115
  10. Hoyle F, Wickramasinghe NC (1979) Diseases from Space JM Dent Ltd, London.
  11. Hoyle, F and Wickramasinghe, NC. (2000) Astronomical Origins of Life: Steps Towards Panspermia. Klower Academic Publishers, Dordrechl, The Netherlands.
  12. Steele EJ, Wickramasinghe NC (Editors) (2020) Cosmic Genetic Evolution. Advances in Genetics. 106: 2-143.
  13. Wickramasinghe NC, Steele EJ, Gorczynski RM, Temple R, Tokoro G, et al. (2020) Growing Evidence against Global Infection-Driven by Person-to-Person Transfer of COVID-19 Virology: Current Research 4:1. DOI: 10.37421/Virol Curr Res.2020.4.110
  14. Wickramasinghe NC, Steele EJ, Gorczynski RM, Temple R, Tokoro G, et al. (2020) Predicting the Future Trajectory of COVID-19. Virology: Current Research 4:1. DOI: 10.37421/Virol Curr Res.2020.4.111
  15. Wickramasinghe NC, Wallis MK, Coulson SG, Kondakov A, Steele EJ, et al.(2020) Intercontinental Spread of COVID-19 on Global Wind Systems Virology: Current Research 4:1.DOI: 10.37421/Virol Curr Res.2020.4.113
  16. Howard GA, Wickramasinghe NC, Rebhan H, Steele EJ, Gorczynski RM, et al. (2020) Mid-Ocean Outbreaks of COVID-19 with Tell-Tale Signs of Aerial Incidence Virology: Current Research 4:2. DOI: 10.37421/Virol Curr Res.2020.4.114
  17. Wickramasinghe NC, Steele EJ, Nimalasuriya A, Gorczynki RM, Tokoro G, et al. (2020) Seasonality of Respiratory Viruses Including SARS-CoV-2 Virology: Current Research 4:2. DOI: 10.37421/VCRH.2020.4.117
  18. Steele EJ, Lindley RA (2020) Analysis of APOBEC and ADAR deaminase-driven Riboswitch Haplotypes in COVID-19 RNA strain variants and the implications for vaccine design. Research Reports. https://companyofscientists.com/index.php/rr
  19. Hammond GW, Raddatz RL, Gelskey DE (1989) Impact of atmospheric dispersion and transport of viral aerosols on the epidemiology of Influenza. Reviews of Infectious Disease 11: 494- 497. [crossref] https://doi.org/10.1093/clinids/11.3.494
  20. Rambaut A, Holmes EC, O’Toole Á, Hill V, McCrone JT, et al. (2020) A dynamic nomenclature proposal for SARS- CoV-2 to assist genomic epidemiology. Microbiol 5: 1403-1407. [crossref] https://doi.org/10.1038/s41564-020-0770-5
  21. Forster P, Forster L, Renfrew C, Forster M (2020) Phylogenetic network analysis of SARS-CoV-2 genomes. Natl. Acad. Sci USA 117: 9241-9243. https://doi.org/10.1073/pnas.2004999117
  22. Eigen M, Schuster P (1979) The Hypercycle: A Principle of Natural Self-Organization. Springer, Berlin.
  23. Andino R, Domingo E (2015) Viral quasispecies. Virology 479-480: 46-51. [crossref] https://doi.org/10.1016/j.virol.2015.03.022
  24. Fukuta M, Mao ZQ, Morita K, Moi ML (2021) Stability and Infectivity of SARS-CoV-2 and viral RNA in Water, Commercial Beverages, and Bodily Fluids. Microbiol 12: 667956. [crossref] https://doi.org/10.3389/fmicb.2021.667956
  25. KwonT, Gaudreault NN, Richt JA (2021) Seasonal Stability of SARS-CoV-2 in Biological Fluids. Pathogens 10: 540. https://doi.org/10.3390/pathogens10050540
  26. Althoff KN, Schlueter DJ, Anton-Culver H, Cherry J, Denny JC, et al. (2020) Antibodies to SARS-CoV-2 in All of Us Research Program Participants, January 2-March 18, 2020. Clinical Infectious Diseases. https://academic.oup.com/cid/advance-article/doi/10.1093/cid/ciab519/6294073
  27. Smith WE (2013) 2013; Life is a cosmic phenomenon: the Search for Water evolves into the Search for Life. Hoover RB, Levin GV, Rozanov AY, Wickramasinghe NC (Eds.). Proc. SPIE 8865, Instruments, Methods, and Missions for Astrobiology XVI. San Diego, California, United States. https://doi.org/10.1117/12.2046862.
  28. Qu J, Wickramasinghe NC (2020) The world should establish an early warning system for new viral infectious diseases by space-weather monitoring. MedComm 1: 423-426. DOI: 10.1002/mco2.20
  29. Luskin DL (2020) The failed experiment of COVID-19 lockdowns. The Wall Street Journal. Sept 2.
  30. Coccia M (2020) Factors determining the diffusion of COVID-19 and suggested strategy to prevent future accelerated viral infectivity similar to COVID. Science of the Total Environment 729: 138474. https://doi.org/10.1016/j.scitotenv.2020.138474
  31. Martelletti L, Martelletti P (2020) Air Pollution and the Novel Covid-19 Disease: a Putative Disease Risk Factor. SN Compr. Clin. Med 2: 383-387. https://doi.org/10.1007/s42399-020-00274-4
fig 1

Cenobamate: New Antiseizure Medication with High Seizure Freedom and Dual Mechanisms of Action

DOI: 10.31038/JPPR.2021424

Abstract

Cenobamate is a newly approved antiseizure medication for patients with focal epilepsy. Even though preclinical study revealed potential for both generalized and focal epilepsy, clinical study has been completed in refractory focal epilepsy patients to date. The efficacy of cenobamate at 100 to 400 mg per day has been strongly supported by two pivotal studies with significant seizure reduction and approximately 20% of seizure freedom rate among the refractory epilepsy patients. Cenobamate was well tolerated and the most frequently reported adverse effects during studies were somnolence and dizziness. In order to mitigate the potential hypersensitivity drug rash with eosinophilia and systemic symptoms (DRESS), cenobamate should be started at a low dosage of 12.5 mg per day and titrated at 2-week intervals. Cenobamate has dual mechanisms of action of inhibiting excitatory sodium channels and enhancing inhibitory GABAA currents as an allostatic modulator.

Introduction

Epilepsy is one of the most common neurological disorders affecting up to two percent of the population worldwide, and more than 3.5 million people in the United States alone. Treatment of epilepsy often imposes an exposure to various antiseizure medications (ASMs) and requires long-term commitment and compliance from the patient. Excluding the small percentage of people who underwent successful epilepsy surgery, large portion of patients are maintained through chronic medical management for seizure control. Despite the advent of new antiseizure medications (ASMs) over the past 25 years, approximately 30% of epilepsy patients experience recurrent seizures and many experience undesirable side effects. Cenobamate (also known as YKP3089, Xcopri®) is a new ASM, that received US Food and Drug Administration (FDA) approval for the treatment of focal onset seizures in adults as both monotherapy and adjunctive therapy in November 2019 [1]. Cenobamate is a novel tetrazole alkyl carbamate derivative, (1R)-1-(2-chlorophenyl)-2-(tetrazol-2-yl) ethyl carbamate. Pivotal clinical trials reported significant seizure improvement and favorable tolerability profile in patients with focal epilepsy.

Pharmacokinetics

Cenobamate was well absorbed after oral ingestion with >88% recovered in the urine. Fasting/fed studies showed no influence of food on the rate or extent of cenobamate absorption [2]. Plasma protein binding of cenobamate (mostly albumin) is about 60% in healthy subjects. The half-life for cenobamate is approximately 50 to 60 hours after single doses of 100 to 400 mg. Mild to moderate renal impairment may increase cenobamate plasma concentrations by 1.5-fold, while mild to moderate hepatic impairment may increase cenobamate plasma concentrations by 2-fold [2].

Drug Interactions

In dedicated drug interaction studies, changes in cenobamate exposures and plasma concentrations with other AEDs were generally less than 20%. Cenobamate was reduced 28% by phenytoin due to hepatic enzyme induction of phenytoin. On the other hand, due to CYP 2C19 inhibition of cenobamate, phenytoin exposure (AUC) can be increased by 84% and phenobarbital AUC by 37%. For the same reason, cenobamate can increase omeprazole and escitalopram exposure by 2-fold. In addition, cenobamate induces CYP3A4/5 which may reduce exposure to other medications such as midazolam, alprazolam, oral contraceptive pills, and simvastatin. Cenobamate also induces CYP2B6 and medications such as bupropion dosage should be increased as needed [3].

Mechanisms of Action

Cenobamate has a broad-spectrum of anticonvulsant effects in several animal models, including maximal electroshock model (traditional focal seizure model), pentylenetetrazol (traditional generalized seizure model), and picrotoxin models as well as hippocampal kindled and 6 Hz stimulation models. Cenobamate inhibits voltage gated sodium channels and enhances GABAA receptors in rodents. Cenobamate’s effects on persisting sodium channel currents are different from other sodium channel blocking ASMs. Cenobamate is also a positive allosteric modulator of GABAA receptors in hippocampal neurons, and binds at a non-benzodiazepine site and enhances GABAA receptor-mediated inhibitory currents. however, anti-seizure mechanisms in humans have not been fully elucidated.

Efficacy

The efficacy of cenobamate was established by the results from two double-blind, randomized, placebo-controlled, parallel-group, multicenter, multinational studies (Studies C013 and C017). Both studies were performed in adult patients with medically refractory focal epilepsy to evaluate the efficacy, safety, and tolerability of cenobamate . In addition, one open label safety study (C021) was completed. Both C013 and C017 studies required to have at least 3-4 focal seizures per 28 days with stable doses of 1-3 ASMs. Patients had a mean duration of epilepsy of approximately 22 years and median baseline seizure frequency of 8.5 seizures per 28 days. Study C013 enrolled 113 patients to the single target dose of 200 mg/day cenobamate arm, and 109 adult patients to placebo. A statistically significant improvement was observed in the 28-day median percent seizure reductions from baseline, with a reduction of 55.6% (p<0.0001) in the cenobamate 200 mg/day group, compared to 21.5% in the placebo arm [4]. In addition, a significant difference in the 50% responder rates (patients with ≥50% reduction in seizure frequency from baseline to maintenance) were also observed in the cenobamate treatment group (50%, p<0.0001), compared to placebo (22%). Seizure freedom rate (100% seizure reduction during the maintenance period) was 28% (p=0.0001) among cenobamate group, compared to 1% for placebo (Figure 1). Study C017 was a blinded, randomized treatment trial comparing three cenobamate doses vs. placebo; subjects were randomly assigned to cenobamate 100 mg (n = 108), 200 mg (n = 110), or 400 mg (n = 111) per day and placebo (n=108). The median percent reductions from baseline in seizure frequency per 28 days were 36.3%, 55.2%, and 55.3% for those patients who received cenobamate at 100 mg, 200 mg, 400 mg, respectively, compare to 24.3% in placebo arm [5]. The secondary end point, 50% responder rates, during the maintenance phase were significantly higher for the cenobamate 100 mg (40%, p=0.0365), 200 mg/day (56%, p<0.0001), and 400 mg/day (64%, p<0.0001) compared to placebo (25%). Seizure freedom rate during the 12-week maintenance phase were 4% (p=0·3688) for the cenobamate 100 mg group, 11% (p=0·0022) for the cenobamate 200 mg group, and 21% (p<0·0001) for the cenobamate 400 mg group (Figure 2). In addition, cenobamate showed statistically significant reductions in seizure frequency across all types of focal seizures including focal aware motor, focal impaired awareness, focal to bilateral tonic-clonic seizures at doses of 100, 200, and 400 mg/day in both studies.

fig 1

CBM=cenobamate
Figure 1:
Proportion of Patients Exhibiting Different Percent Seizure Reductions During the Maintenance Phase over Baseline in Study C013.

fig 2

CBM=cenobamate
Figure 2:
Proportion of Patients Exhibiting Different Percent Seizure Reductions During the Maintenance Phase over Baseline in Study C017.

Safety and Tolerability

The most frequent Treatment-Emergent Adverse Effects (TEAEs) reported with cenobamate were dose-dependent increases in somnolence and fatigue-related adverse reactions. In both placebo-controlled trials, 31% of patients randomized to receive cenobamate at 100 mg/day, 36% at cenobamate 200 mg/day, and 57% of cenobamate at 400 mg/day reported at least one of these, compared to 19% of patients who received placebo [4,5]. The second most common cenobamate related TEAEs were dizziness and disturbance in gait and coordination. Cognitive dysfunction related events (i.e., memory impairment, disturbance in attention, amnesia, confusion, aphasia, speech disorder, slowness of thought, disorientation, and psychomotor retardation) were low and occurred in 6% of cenobamate patients at 100 mg/day, 6% of cenobamate at 200 mg/day, and 9% of cenobamate at 400 mg/day, compared to 2% of placebo patients. The adverse reactions leading to discontinuation, in descending order of frequency, were ataxia, dizziness, somnolence, diplopia, nystagmus, and vertigo [4,5]. In a placebo-controlled study, cenobamate had higher rate of QT shortening (31% at 200 mg and 66% at 500 mg) compared to placebo (6-17%) [1]. Reductions of the QTc interval below 300 msec were not observed with cenobamate, but the patients with Familial Short QT syndrome should not be treated with cenobamate. The incidence of skin rash was not higher in cenobamate-treated patients than with placebo-treatment, with only 2 cases reported (0.45%). However, three subjects (one epilepsy patient and two healthy volunteers) developed drug rash with eosinophilia and systemic symptoms (DRESS) among 2,528 study patients. In all three cases, cenobamate was initiated at a higher starting dose and titrated faster. After these cases, C021 study (n=1,339) was conducted at the lower starting dose with slower titration rate. Subjects in this study began cenobamate at a low starting dose of 12.5 mg/day and titrated up slowly every 2 weeks to a target dose of 200 mg/day and then up to a possible maximum dose of 400 mg/day as tolerated. With this slow initiation and titration of cenobamate, no cases of DRESS were reported [6].

Dosing

To mitigate the risk for DRESS, cenobamate should be titrated slowly with the starting dose of 12.5 mg/day and titrated at 2-week intervals to a maintenance dose of 200 mg/day, with additional titration to a maximum dose of 400 mg/day as needed (Table 1).

Table 1: Recommended cenobamate titration at 2-week intervals.

Weeks 1-2

12.5 mg/day

Weeks 3-4 25 mg/day
Weeks 5-6 50 mg/day
Weeks 7-8 100 mg/day
Weeks 9-10 150 mg/day
Weeks 11 and maintenance 200 mg/day

Key Points and Conclusion

Cenobamate is a newly approved ASM for the treatment of focal epilepsy in adults. In three clinical studies, cenobamate showed significant seizure improvement at 100-400 mg once daily with a high seizure freedom rate even in refractory epilepsy population. Due to potential idiosyncratic DRESS, cenobamate should be started at 12.5 mg per day with gradual increase every two weeks. Cenobamate has dual mechanisms of action of inhibiting excitatory sodium channels and enhancing GABAA inhibitory currents. It is important to note that due to hepatic enzyme CYP3A4/5 induction and CYP2C19 inhibition, certain medication exposure can be affected by coadministration of cenobamate. Most commonly reported adverse effects of cenobamate were somnolence and dizziness, which were usually reported as mild to moderate. In conclusion, cenobamate expands treatment options for patients with focal epilepsy and may provide significant benefit to those patients who remain refractory to other AEDs.

References

  1. Prescribing information. Paramus, NJ: SK Life Science; 2019.
  2. Vernillet L, Greene SA, Kamin M (2020) Pharmacokinetics of Cenobamate: Results From Single and Multiple Oral Ascending‐Dose Studies in Healthy Subjects. Clinical Pharmacology in Drug Development. 9: 428-443. [crossref]
  3. Greene SA, Kwak C, Kamin M, et al. (2019) The Effect Of Cenobamate On The Single-Dose Pharmacokinetics Of Multiple Cytochrome P450 Probes Using A Cocktail Approach In Healthy Subjects [Data on File]. SK Life Science.
  4. Chung SS, French JA, Kowalski J, Krauss GL, Lee SK, Maciejowski M, et al. (2020) Randomized phase 2 study of adjunctive cenobamate in patients with uncontrolled focal seizures. Neurology 94. [crossref]
  5. Krauss GL, Klein P, Brandt C, Lee SK, Milanov I, et al. (2020) Safety and efficacy of adjunctive cenobamate (YKP3089) in patients with uncontrolled focal seizures: a multicentre, double-blind, randomised, placebo-controlled, dose-response trial. Lancet Neurol 19: 38-48.
  6. Sperling MR, Klein P, Aboumatar S, Gelfand M, Halford JJ, et al. (2020)Cenobamate (YKP3089) as adjunctive treatment for uncontrolled focal seizures in a large, phase 3, multicenter, open-label safety study. Epilepsia 6: 1099-1108. [crossref]

Thoughts on the Politics of COVID-19

DOI: 10.31038/JNNC.2021431


In previous papers in the Journal of Neurology and Neurocritical Care, I have provided a scholarly, referenced, data-based analysis of misinformation provided by the CDC, governments, the NIH, NIAID and leading physicians and medical journals concerning the COVID-19 pandemic [1-6]. I have had two doses of the Pfizer vaccine and am not an anti-vaxxer. Here I will provide some thoughts on the politics and social dynamics of the response to the pandemic.

Comparing COVID-19 to the Flu

Early in the pandemic, comparison of the SARS-CoV-2 virus to the flu was disallowed. This was peculiar since both are viral respiratory illnesses and both can have systemic complications. The 1918-1919 flu pandemic killed far more people than have died from the current coronavirus pandemic. Comparison of the SARS-CoV-2 virus to the flu virus was equated with minimizing the seriousness of the current pandemic. Why? It was OK to compare the two viruses as long as you were saying that the SARS-CoV-2 virus is far more dangerous. In actual fact, of the two biggest pandemics since the end of World War I, the flu pandemic was the more deadly by far.

Denigrating Hydroxychloroquine and Ivermectin

Two drugs for treatment of COVID-19 – hydroxychloroquine and ivermectin – have been ridiculed, lambasted and rejected by leading medical journals and the mainstream media. Both are generic, have been in use for decades and have very reasonable side effect profiles. The ridicule began before there was adequate published data to evaluate them. At the same time, remdesivir and convalescent plasma were widely endorsed by leading medical journals in the absence of adequate controlled data either to support or reject their usefulness. Why? Remdesivir and convalescent plasma proved to be either ineffective or only slightly superior to placebo. Yet both got the green light as tools to be used in a desperate situation. This is not balanced science. Backing remdesivir and convalescent plasma while putting down hydroxychloroquine and ivermectin is easy to understand – there’s very little money to be made from generic drugs. The duty of the medical profession, apparently, is to denigrate generic drugs while endorsing expensive interventions that are no more effective. This makes medicine look like a sales force for drug companies – not a very good strategy for increasing trust in the medical profession, or for reducing vaccine hesitancy.

Justifying Changes in Face Mask Policies with Non-Existent ‘Emerging Data’

Except in isolation units and operating rooms, hospital staffs have never worn face masks inside hospitals, prior to the onset of the pandemic. The WHO and the US Surgeon General stated in February, 2020 that wearing face masks in public is unnecessary and does not reduce viral transmission. Within a few months, the NIH, NIAID, CDC, Surgeon General and leading medical journals did a 180-degree turn on face masks. This resulted in face masks being widely mandated. The change in policy was justified by the emergence of new data, but in fact no such data existed. In May, 2021 the CDC, governments and some large corporations changed their position on face masks in public, saying that they are not necessary, again justifying the change in policy as being based on new evidence. There was in fact no new evidence. Changes in face mask mandates and policies in both directions were said to be based on science and new data, when no such data existed. Anyone who opposed the policies, in either direction, was accused of being against science.

The claim to be science-based has been used as a propaganda tool and as a tactic to discredit dissenters – now we see that the tool has been used in both directions – to mandate face masks and to remove mandates. Why is this happening? Is the face mask manufacturing lobby that strong? Is the goal social control? Is it a motivational technique to scare people into getting vaccinated? Is it just a power trip? Any, all or none of these motives could be at work. The problem is not with the politicians – they are politicians and are always attacking the opposition.

The problem is the medical profession, which has acted as an agent of the state in contradiction to the science concerning face masks, and has attacked dissenting physicians.

Death Counts and Infection Rates

It has been very difficult to evaluate what is going on in the pandemic because of false positive and false negative test results. Still, we have to use the best tools available. A more serious problem is the fact that hospitals have been getting paid more if they code a death as a COVID-19 death – even in the absence of a positive test. These problems create suspicion that the severity of the pandemic has been exaggerated by the CDC and the medical profession, which in turn causes distrust and results in vaccine hesitancy. Why should the public believe the CDC and doctors about vaccines when both have been all over the map on face masks and disease rates? Instead of blaming the public, the medical profession should examine how it has contributed to vaccine hesitancy. You can fool some of the people some of the time, but you can’t fool all of the people all of the time.

Whatever Happened To Contact Tracing and Testing?

Early in the COVID-19 pandemic, the pillars of public health interventions were face masks, vaccines (not yet on the market), social distancing, contact tracing, lockdowns and testing. Contact tracing and testing quietly disappeared from public discussion and recommendations. Why? I don’t know, but I assume that it finally became undeniable that contact tracing was futile. Other than catching COVID-19 from people you live with, in which case there’s no need for contact tracing, it’s impossible in most cases to figure out who you caught it from. Also, contact tracing is very labor intensive and expensive. The policy that contact tracing is essential was abandoned without any new data on its effectiveness, or any science-based rationale for the discontinuation. The talk was limited to vaccines, lockdowns, social distancing and face masks. Throughout 2020, while the need for contact tracing was disappearing, there was a lot of hyperbole about asymptomatic carriers. The threat posed by asymptomatic carriers was used to justify face mask mandates. If asymptomatic carriers are such a big threat, though, what is the point of contact tracing? A person who developed symptoms of COVID-19 would have to notify authorities, who in turn would have to notify everyone that person had come in contact with during the previous week. But then we would have to test countless people to identify the asymptomatic carriers. This could include everyone who was at a grocery store at the same time as the symptomatic person. How would all these people be identified and notified? The whole thing was logistically impossible. The two social control strategies of contact tracing and ramping up fear of asymptomatic carriers contradicted each other. No problem – we just dropped one of them. Actually, we’ve pretty much dropped both of them – the amount of emphasis on asymptomatic carriers in the media has dwindled a lot in 2021.

The same thing happened with testing – quietly stopping any mention of it. Up to mid-2020 there was a big emphasis on the need for testing. This need could have been met with a series of randomized testing studies in representative areas of the country, but these were never conducted. Instead, there was scattered, inconsistent testing throughout the United States. The percentage of positive tests was used to track the pandemic, and there was a lot of emphasis on getting the percentage of tests positive down under 10%. By mid-2021, public discussion about testing had pretty much vanished. Why? This doesn’t make any scientific or epidemiological sense. Wouldn’t we want to emphasize falling positivity rates to promote the idea that the vaccines are curbing the pandemic? Overall, recommendations about contact tracing and testing have fluctuated widely over the last 18 months, without any data being gathered or presented to the public to justify the changes. We just stopped talking about these two prior pillars of public health.

Disputes about Herd Immunity

If 100% of the population had SARS-CoV-2 antibodies this would result in herd immunity and stop the pandemic. This is true no matter what percentage of the immunity comes from vaccination and what percentage from natural infection. The medical profession has been unanimous on this point. What is the problem then?

The problem has been the politicization of discussion of herd immunity to attack and discredit physicians who emphasize the natural infection component of herd immunity. The need for herd immunity has been a major selling point for vaccines by the medical profession. Generally, 70% herd immunity is regarded as the threshold goal. Anything beyond that is welcome, but anything less leaves us relatively unprotected. This is true. Emphasizing natural immunity has been equated with being anti-science and anti-vaccine. Why? If 40% of people get vaccinated and an additional 40% have natural immunity due to being infected, then we have reached meaningful herd immunity. It doesn’t matter what the numbers are – the principle remains the same. Herd immunity is the sum of vaccine-derived immunity and infection-derived immunity. Unfortunately, we don’t have an exact figure for the percentage of the population that has been infected, even though an accurate figure +/- a small margin of error could be obtained by random sampling across the nation., at a low cost compared to the total financial burden of the pandemic.

Rather than attacking physicians who emphasize the natural immunity component of herd immunity, the public should be informed that in order to reach 70% herd immunity, fewer than 70% of people need to be vaccinated. Instead, the natural immunity component is not mentioned and is left out of the analysis. That may be fine as a motivational strategy for people to get vaccinated, but it is not science. Why can’t we have a rational, data-based discussion of herd immunity, rather than polarized political warfare? I don’t mean among politicians – I mean in the medical profession.

Attributing Reductions in Infections and Deaths to the Vaccines

Dropping rates of hospitalizations and deaths from COVID-19 in spring, 2021 have been widely attributed to the vaccines by the medical profession and public health officials. There is little mention of the fact that viral illness rates always go down in the summer. It could be that the vaccines are contributing but it could be that it is all due to the change in seasons. Most likely it is a combination of both. The percentage of the population vaccinated is far below the threshold for meaningful herd immunity, so it can’t all be due to vaccines. A balanced, data-based, analytical discussion of the contributions to falling rates is not allowed because that might interfere with promoting vaccines. Again, this could be fine as a public health and population control strategy, but it is not science-based.

Discounting the Social and Economic Costs of Lockdowns

An analysis of the costs and benefits of any medical or public health intervention is a standard approach. The gold standard is randomized controlled trials (RCTs) – everyone in medicine agrees on that, even though RCTs are not always feasible or available. Interventions that cause substantial morbidity and mortality such as chemotherapy and some surgical procedures are nevertheless ethical to prescribe. If more people die without the intervention than die from it, it is good medicine to recommend the intervention, after an informed consent discussion with the patient. No one disputes this in medicine. Anti-vaxxers who are alarmed about cases of post-vaccine morbidity and mortality fail to understand the principle of cost-benefit analysis. They also fail to take into account the base rate of the morbidity and mortality in the general population. They are alarmists for no sound scientific reason.

The medical profession makes the opposite error. For example, they belittle anyone concerned about severe vaccine side effects but either ignore or are unaware of the fact that the government of the United States has awarded over $4,000,000,000.00 due to vaccine damages. This has been done through the Vaccine Court – the National Vaccine Injury Compensation Program. This Court has a very high threshold of proof.

There are no other legal remedies for vaccine injuries because vaccine manufacturers and doctors are immune from liability for vaccine injuries. Vaccines are the only medical or public health intervention with such liability protection. Why is that?

The problem is not the desire to encourage people to get vaccinated. The problem is ignoring or distorting the science by making global statements that vaccines are ‘safe and effective’ – some years the flu vaccine is under 10% effective according to the CDC, whereas the measles and COVID-19 vaccines appear to be over 90% effective. Global statements that vaccines are ‘safe and effective’ are not based on science. The base rate, morbidity and mortality of a disease in the general population, and the effectiveness and adverse effects of a vaccine for it all have to be weighed in reaching an evidence-based decision. The Vaccine Adverse Event Reporting System (VAERS) currently has over 4,000 reported deaths related to COVID-19 vaccines, far more than the combined total for all other vaccines over a longer time period. When VAERS deaths from other vaccines are low, this is hailed as proof that the vaccines are safe. When they are high for COVID-19 vaccines, anyone who points this out is attacked and discredited as anti-science and an anti-vaxxer. The same is true for the costs of lockdown – economic, mental health, relationship, educational, on and on – not to mention opiate overdoses, murders, domestic violence, child abuse and blocked access to surgery, cancer treatment and other medical services. The medical profession and public health authorities have not provided a balanced cost-benefit analysis. Instead they have attacked and belittled anyone who emphasizes the cost side of the equation and have characterized them as not caring about grandma. Maybe the quality of grandma’s last year of life was severely impacted by the lockdowns. The fact that lockdowns have substantial costs doesn’t automatically mean they are bad. But ignoring the cost side of the equation is politics not science.

If Trump is for it, We are against it

If Trump is for it, we are against it. This theme has continued throughout the pandemic: whatever Trump says has to be attacked and discredited. Physicians who attacked Trump for politicizing the pandemic have been politicizing it themselves, but in the opposite direction. For them God is on the anti-Trump side. While doing so these physicians have adopted the pose of being science-based and have attacked people who disagreed with them as being unscientific. Actually, science is on neither side. An example is the once-ridiculous Trump conspiracy theory that the pandemic originated from a leak at the Wuhan Institute of Virology. This theory was savagely belittled as Trump nonsense. Now, Biden is being hailed for taking it seriously. The medical profession has been – by and large – marching to the same drummer. The further away we get from the Trump administration, the more easily his policies can be rehabilitated as Biden corrections to Trumpian excesses and errors – even when they are the same policies. All credit for vaccine rollout to Biden, none to Trump. Biden makes this claim because he is a politician – the medical profession should not agree with him. Credit should be given where credit is due; it should not be distributed as a political favor. The medical profession needs to get its house in order. It needs to be based, as much as possible, on data, science and rational analysis, not on partisan politics disguised as science.

References

  1. Ross CA (2021) Misinformation concerning face masks and the Wuhan lab leak. Journal of Neurology Neurocritical Care 4: 1-3.
  2. Ross CA (2020) Differences in evaluation of hydroxychloroquine and face masks for SARS-CoV-2. Journal of Neurology and Neurocritical Care 3: 1-3.
  3. Ross CA (2020) Thoughts on COVID-19. Journal of Neurology and Neurocritical Care 3: 1-3.
  4. Ross CA (2020) Facemasks are not effective for preventing transmission of the coronavirus. Journal of Neurology and Neurocritical Care 3: 1-2.
  5. Ross CA (2020) How misinformation that facemasks are effective for reducing COVID-19 is transmitted. Journal of Neurology Neurocritical Care 3: 1-2.
  6. Ross CA (2021) COVID Face masks and the Wuhan lab escape theory: An update. Journal of Neurology Neurocritical Care 4: 1-3.

Impact of Self-Measured Blood Pressure Monitoring on Hypertension Control

DOI: 10.31038/JCCP.2021423

Abstract

Background: The American Heart Association developed the Check, Change, Control self-measured blood pressure program. The Check, Change, Control program (2016-2017 cohort) demonstrated higher odds of blood pressure control with checking self-measured blood pressure more frequently. The purpose of this study was to evaluate the impact of patient factors related to utilization of self-measured blood pressure and their association with blood pressure control in the 2017-2018 cohort.

Methods: Retrospective cohort study of adults enrolled in the Check, Change, Control program. The 2017-2018 cohort data was used to evaluate the hypertension population and their self-measured blood pressure values. The primary outcome measures differences between frequency of individual self-measured blood pressure reporting: self-measured blood pressure frequently (> 2 times a month) and less frequent self-measured blood pressure (< 2 times a month) and blood pressure control. Risk ratios for factors were calculated to determine association with reported self-measured blood pressure and blood pressure control.

Results: Overall, 37.3% uploaded > 2 blood pressure values per month and 66% were female. The unadjusted risk ratios for having blood pressure < 140/90 mm Hg was higher for age > 60 vs. < 60 years (1.07; 95% Confidence Interval [CI] 1.04-1.10), lower for Black vs. nonblack adults (0.73; 95% CI 0.67-0.79), higher for females vs. males (1.04; 95% CI 1.01-1.07), and lower for individual vs. employer enrollment (0.60; 95% CI 0.58-0.63).

Conclusion: One-third of adults reported self-measured blood pressure values greater than 2 times per month. Lower rates of blood pressure control (< 140/90 mm Hg) were associated with age ≥ 60 years, Black race, male sex, and individual enrollment. An emphasis should be placed on the use of self-measured blood pressure to increase blood pressure control rates.

Introduction

Eighty-five million adults in the US have hypertension (HTN) and nearly half (46.0%) of them have uncontrolled blood pressure (BP) despite medication and dietary interventions [1]. In addition, there are known racial disparities in BP control in Black compared to Non-Black adults in the US and across the world. Over the last 20 years, the use of self-measured blood pressure (SMBP) and/or home blood pressure monitoring (HBPM) has increased as a means to assist in the diagnosis and management of HTN. The 2017 ACC/AHA HTN guidelines endorse a class 1 level of evidence A recommendation for out-of-office BP measurement to confirm the diagnosis of HTN and for BP medication titration with telehealth counseling or clinical interventions [2-6]. The American Heart Association (AHA) recommends SMBP for evaluation of most patients with known or suspected HTN to assess response to treatment and possibly improve adherence [7]. The AHA has developed the Check, Change, Control (CCC) program, an evidence based HTN management program that incorporates concepts of remote monitoring [8]. This program is designed to provide resources for individuals to be educated on and improve their lifestyle in order to improve their BP. In addition, the program allows for individuals to input their BP values in the CCC online program so they can track their BP as well this allows for them to communicate this information to their healthcare provider(s) if they so choose. There has been a previous analysis of the CCC program using the 2016-2017 cohort that demonstrated a higher odds of BP control for those program participants who checked their SMBP more frequently (>2 times a month). The more recent cohort of data (2017-2018) has not been evaluated relative to the frequency of SMBP monitoring and HTN control.

Aim of the Study

Our study was designed to determine the prevalence of self-measured blood pressure (SMBP) by demographic characteristics and hypertension categories (BP controlled vs. uncontrolled) using the AHA CC Program (2017-2018) data set.

Methods and Materials

A retrospective cohort study of men and women who have enrolled in the AHA CCC program from July 1, 2017 through June 30, 2018 was performed. During the study period, 18,617 adult individuals age 18 to 80 years of age who enrolled in the AHA CCC program uploaded 189,151 BP measurements. The cohort was reduced to those with at least 2 BP uploads, which narrowed the cohort to 10,638 individuals. The study population included individuals from across the United States who enrolled through their employer or self-enrolled. Those who uploaded values may or may not have elevated BP or HTN prior to enrollment. The data collection portal does not include any assessment of whether individuals have a diagnosis of HTN. The primary outcome measures differences between frequency of individual SMBP reporting: SMBP frequently (> 2 times a month) and less frequent SMBP (< 2 times a month) and BP control. Risk ratios (RR) for self-reported demographic parameters included gender, age, race/ethnicity, systolic blood pressure (SBP), diastolic blood pressure (DBP), and enrolled in CCC through employer or as individual were calculated to determine association with reported SMBP and BP control.

Demographic parameters were defined as follows: gender (male or female); age (18-39 years, 40-59 years, >60 years); race/ethnicity categorized into 4 groups (Hispanic or Latino, Black, White, other); employer enrollment (yes or no) by enrollment code.

Statistical Analysis

Data analyses were conducted using SAS version 9.4 (SAS Institute, Cary, NC). Differences between demographic categorical variables were evaluated with the chi-square test for frequent SMBP and nonfrequent SMBP reporting. Differences between continuous variables (e.g. SBP, DBP) was evaluated with the t-test for frequent SMBP and nonfrequent SMBP reporting groups relative to BP control. An alpha level of 0.05 was used set to determine statistical significance. Statistically significant variables in the univariate analysis were adjusted for with adjusted risk ratios (RR) and 95% confidence intervals (CI) calculated used a binomial regression model.

Results

Thirty-seven percent of program participants reported SMBP values greater than 2 times monthly during 2017-2018. Full patient demographics are reported out in Table 1. Program participants who uploaded SMBP values less frequently were more likely to be female, younger (18-39 years), and Black compared to other race/ethnicities. Individuals enrolling with their employer were less likely to report SMBP frequently compared to those enrolling individually. No difference in BP control rates between frequent and less frequent SMBP monitoring was noted when looking at BP values < 140/90 mm Hg or < 130/80 mm Hg in the univariate analysis. The mean SBP and DBP across SMBP reporting groups was 120/80 mm Hg.

Table 1: Patient Demographics

Characteristic

N Less Frequent SMBP (%) More Frequent SMBP (%)

P-value

Total

10638

6668 (62.7)

3970 (37.3)

Gender

10577

Female

6939

4565 (65.8)

2374 (34.2)

<0.0001

Male

3638

2055 (56.5)

1583 (43.5)

Age Groups (years)

10597

18-39

2155

1576 (23.8)

579 (14.6)

<0.0001

40-59

5197

3198 (48.2)

1999 (50.4)

≥60

3245

1856 (28.0)

1389 (35.0)

Race/Ethnicity

10638

Hispanicor Latino

947

618 (9.3)

329 (8.3)

<0.0001

White

6762

4111 (61.7)

2651 (66.8)

Black

1878

1248 (18.7)

630 (15.9)

Other

1051

691 (10.4)

360 (9.1)

Enrollment Group

10638

Individual

4206

2073 (31.1)

2133 (53.7)

<0.0001

Employer

6432

4595 (68.9)

1583 (46.3)

Mean (±sd) SBP (mmHg)

10638

127.8 ± 17.7 128.4 ± 16.8

0.0879

Mean (±sd) DBP (mmHg)

10638

79.9 ± 11.5 79.9 ± 11.2

0.9025

BP < 140/90 mmHg

10638

4718 (70.8) 2795 (70.4)

0.6992

BP < 130/80 mmHg

10638

2633 (39.5) 1539 (38.8)

0.4611

The unadjusted RR for having BP < 140/90 mm Hg was higher for age > 60 vs. < 60 years (1.07; 95% CI 1.04-1.10), lower for Black vs. Non-Black adults (0.73; 95% CI 0.67-0.79), higher for females vs. males (1.04; 95% CI 1.01-1.07), and lower for individual vs. employer enrollment (0.60; 95% CI 0.58-0.63). Complete unadjusted RR and adjusted RR are reported in Figure 1. After adjusting for SMBP frequency, age, race, gender, and type of enrollment, the RR for having BP < 140/90 mm Hg was higher for age > 60 vs. < 60 years (1.05; 95% CI 1.02-1.08), lower for Black vs. Non-Black adults (0.83; 95% CI 0.80-0.86), higher for females vs. males (1.04; 95% CI 1.01-1.06), and lower for individual vs. employer enrollment (0.73; 95% CI 0.71-0.75). In the adjusted model, having BP < 140/90 mm Hg and < 130/80 mm Hg was lower for less frequent versus more frequent SMBP reporting (0.95; 95% CI 0.93-0.97 and (0.92; 95% CI 0.88-0.96, respectively).

fig 1

Figure 1: Univariate and Multivariate Analysis of Hypertension Control Relative to Covariates and Frequency of SMBP.

Discussion

Study findings demonstrate that a small percentage of program participants (37%) were able to report SMBP values greater than two times per month. Based on these numbers it appears SMBP monitoring is a viable option to assess out of office BP measurements and reporting to their healthcare providers. Additionally, these numbers highlight an educational opportunity to highlight the importance of SBMP and the role it plays in the prevention and management of patients with hypertension. This approach of SBMP monitoring is supported by the 2017 ACC/AHA HTN guideline recommendations as a useful screening and monitoring tool for those with and without HTN.

This analysis demonstrated lower rates of BP control (< 140/90 mm Hg) associated with age ≥ 60 years, Black race, male gender, and individual enrollment in the unadjusted and adjusted models. These associated lower rates of BP control align with previous data demonstrating that age, race, and gender contribute to variance in BP control rate across populations. Further, when adjusting for age, race, gender, and type of enrollment, lower rates of BP control at < 140/90 mm Hg and < 130/80 mm Hg were seen in the less frequent versus more frequent SMBP reporting groups. Based on these findings, further focus needs to be placed on populations demonstrating lower BP control rates.

Study Limitations

One limitation of our study is the retrospective nature of the study which depends on the accuracy of data input into the AHA CCC online platform by participants in the program. Secondly, the retrospective study design could only demonstrate associations with and not any causal relationships with SBMP and BP control rates.

Conclusions

One-third of adults reported SMBP values greater than 2 times per month. Lower rates of BP control (<140/90 mm Hg) were associated with age ≥ 60 years, Black race, male sex, and individual enrollment. Overall, the use of SMBP should be recommended to help individuals to improve and maintain BP control and to identify factors associated with lower BP control rates.

References

  1. Virani AA, Alonso A, Aparicio HJ, et al. (2021) American Heart Association Statistics Committee and Stroke Statistics Subcommittee. Heart disease and stroke statistics-2021 update: a report from the American Heart Association. Circulation 143: e254-743.
  2. Whelton PK, Carey RM, Aronow WS, et al. (2018) 2017 ACC/AHA/AAPA/ABC/ACPM/AGS/APhA/ASH/ASPC/NMA/PCNA Guideline for the Prevention, Detection, Evaluation, and Management of High Blood Pressure in Adults: A Report of the American College of Cardiology/American Heart Association Task Force on Clinical Practice Guidelines. J Am Coll Cardiol 71: e127-e248. [crossref]
  3. Uhlig K, Balk EM, Patel K, et al. (2012) Self-Measured Blood Pressure Monitoring: Comparative Effectiveness. Rockville, MD: Agency for Healthcare Research and Quality (U.S.).
  4. Margolis KL, Asche SE, Bergdall AR, et al. (2013) Effect of home blood pressure telemonitoring and pharmacist management on blood pressure control: a cluster randomized clinical trial. JAMA 310: 46-56. [crossref]
  5. McManus RJ, Mant J, Haque MS, et al. (2014) Effect of self-monitoring and medication self-titration on systolic blood pressure in hypertensive patients at high risk of cardiovascular disease: the TASMIN-SR randomized clinical trial. JAMA 312: 799-808. [crossref]
  6. Siu AL (2015) Screening for high blood pressure in adults: U.S. Preventive Services Task Force recommendation statement. Ann Intern Med 163: 778-86. [crossref]
  7. Muntner P, Shimbo D, Carey RM, et al. (2019) Measurement of blood pressure in humans: a scientific statement from the American Heart Association. Hypertension 73: e35-e66. [crossref]
  8. Thomas KL, Shah BR, Elliot-Bynum S, et al. (2014) Check it, change it a community-based, multifaceted intervention to improve blood pressure control. Circ Cardiovasc Qual Outcomes 7: 828-834. [crossref]
Featured Image2

Nursing Leadership Role in Pharmacovigilance Needs Impetus

DOI: 10.31038/IJNM.2021224


The World Health Organization (WHO) definition of an adverse drug reaction (ADR), is “a noxious and unintended response of a drug, which occurs at a dose normally used in humans for prophylaxis, diagnosis, or therapy” [1]. ADRs are known to wreak serious effects on patients and put a strain on the resources of health services. Past documentation in the medical literature have unraveled that 7-11.2% of ADRs culminate in hospitalization [2-4]. The financial burden imposed by ADRs with consequent hospitalization was computed to be about Euro 11,357 per hospital bed per year [4]. The financial implication of ADRs in the United States has been put at 30 billion dollar per year [5]. The percentage of ADRs deemed to be avertible is roughly 80% [4]. Geriatric patients who have been prescribed multiple medications simultaneously due to long-standing afflictions are known to suffer from higher ADR rates [6]. A leading issue in detecting fresh and potential ADRs is under-declaring amidst healthcare providers. A systematic review has disclosed that only 6% of all ADRs are actually documented [7]. A perpetual issue is under-reporting of ADRs: variously ascribed to: inability or lack of knowledge (in terms of skill) to discern mild or moderate ADRs; fear of being interrogated; vacillation; hard-pressed for time; inefficient reporting processes; ambiguity that the adverse event is relatable to a prescription medication; and the commonly perceived impression that prescribed drugs are primarily safe and are devoid of adverse effects [8]. Nurses are in a distinctive position to oversee the patient’s reactions to drugs and, thereupon, where needed, detect and document probable ADRs [9-11]. A recent study has documented that freshly graduated nurses were deficient in terms of possessing the requisite pharmacological knowledge and skills in detecting adverse drug effects [12]. Betterment of one’s own capability in ADR declaring is a nurse’s responsibility. Two studies [13,14] reported that nurses can commit their efforts quantitatively and qualitatively to ADR reporting and therefore, augment drug-related safety. It has been noted that the nurse’s involvement in ADR declaring is still minimal in many nations like Portugal (0.55%), Sweden (12%) and Italy (2.6%) [15-17]. In a recent study from India it was noted that the average knowledge score of the respondents was 43% on ADR reporting and 16.5% on ADR burden, indicating that there is still much to be done to educate the nurses regarding ADR reporting [18]. ADR red-flagging and documenting is a mandatory precondition for efficiently and promptly tackling medication-associated issues [19], and ADR monitoring and reporting programmes determine and lessen avertible ADRs, while aiding professionals to combat ADRs skillfully [20].

Nurse-led monitoring and intervention has proven to be a convincing, economical, relatively safe and suitable approach for both service users and professionals, with promise for cost cutting and enhanced quality and safety of care [21]. Many observational studies and randomised controlled trials determined that meticulously planned nurse-led medicines’ monitoring tackles issues pertinent to ADRs, promote the quality of prescribing and pain management and direct attention to patients’ impressions and reports of adverse events [21-26]. The nurse-managed West Wales Adverse Drug Reaction (WWADR) Profiles were effectively employed by nurses within their usual work schedules [21,23,26,27]. They extend a rigorous and comprehensive check-list for possible medication-induced damage, the hazard of over-detection being surpassed by the identification of potentially manageable problems of ambiguous aetiology. Novel educational paradigms, like case histories of ADRs [28], can enhance knowledge of ADRs and antecedent hazard factors, like hypersusceptibility to “allergic” reactions, age, polypharmacy, and co-morbid renal, hepatic or cardiac afflictions, which could induce perturbations in drug distribution, metabolism and elimination [29,30]. Nurses’ collaboration is a crucial modality to track ADRs, as they oversee vital data about patient care, wellbeing, and administration of medications and can identify (red-flag) and document ADRs. A workable modality could be that ADR details (organized into structured checklists) of conceivable ADRs put together by nurses may be set-up prior to scheduled appointments and brainstormed with prescribers and pharmacists [21]. Nurse leadership could steer strategic planning and policy development to revamp practice and enhance quality and safe use of healthcare through utilization of practice guidelines, alteration, elucidation and catering towards motivation for ADR documenting; and providing help and evaluation to nurses to bolster the monitoring and control of ADRs [31]. Presently, all professionals, patients, their families, and friends are permitted to relay ADRs to the regulatory authorities. This modality opens up a window of opportunity for nurses to evolve and advance their roles [22]. Apellation of committed nurses to function as “ADR advocates” and connect with a stated prescriber or pharmacist, would boost overseeing and control of ADRs [32]. A number of ADRs could be obviated by improved medication monitoring. The best control of ADRs in healthcare systems necessitates nurses to bear professional authority to determine and detail problems and to alert the prescribers. Since nurses are the professionals most intricately dedicated to hands-on patient care and put in maximum contact time with patients, they are the ideal professionals to strategically red-flag ADRs [33]. Nurses should be supported to boost their engagement and bear responsibility for customarily determining ADRs [33]. However, to develop nurses for these roles necessitates educational backing and making provision for structured training, as provided by ADR monitoring profiles with standardized protocols [21,26]. Such strategies offer leadership possibilities to nurses, juxtaposing them as the pivotal professionals networking amongst patients and their pharmacists, prescribers to assure that ADRs are determined and resolved at the earliest [34,35]. Policy makers and nurse administrators have the occasion to develop, apply and edict structured medication monitoring systems.

References

  1. World Health Organization (1972) International drug monitoring: the role of national centres. Report of a WHO meeting. World Health Organ Tech Rep Ser 488: 1-25.
  2. Al Hamid A, Ghaleb M, Aljadhey H, Aslanpour Z (2014) A systematic review of hospitalization resulting from medicine-related problems in adult patients. Br J Clin Pharmacol78: 202-217. [crossref]
  3. Kongkaew C, Hann M, Mandal J, Williams SD, Metcalfe D, et al. (2013) Risk factors for hospital admissions associated with adverse drug events. Pharmacotherapy 33: 827-837. [crossref]
  4. Lagnaoui R, Moore N, Fach J, Longy-Boursier M, Begaud B (2000) Adverse drug reactions in a department of systemic diseases-oriented internal medicine: prevalence, incidence, direct costs and avoidability. Eur J Clin Pharmacol 56: 181-186. [crossref]
  5. Sultana J, Cutroneo P, Trifirò G (2013) Clinical and economic burden of adverse drug reactions. J Pharmacol Pharmacother 4.
  6. Kongkaew C,Noyce PR,Ashcroft DM (2008) Hospital Admissions Associated with Adverse Drug Reactions: A Systematic Review of Prospective Observational Studies. Ann Pharmacother 42: 1017-1025. [crossref]
  7. Hazell L, Shakir SAW (2006) Under-reporting of adverse drug reactions-A systematic review. Drug Saf 29: 385-396. [crossref]
  8. Lopez-Gonzalez E, Herdeiro MT, Figueiras A (2009) Determinants of under-reporting of adverse drug reactions: a systematic review. Drug Saf 32: 19-31. [crossref]
  9. Arnold GJ (1998) Clinical recognition of adverse drug reactions: Obstacles and opportunities for the nursing profession. J Nurs Care Qual 13: 45-55. [crossref]
  10. Griffith R (2013) Nurses must report adverse drug reactions. Br J Nurs 22: 484-485.
  11. Valente S, Murray L, Fisher D (2007) Nurses improve medication safety with medication allergy and adverse drug reports. J Nurs Care Qual 22: 322-327. [crossref]
  12. Lim AG, Honey M (2014) New Zealand newly graduated nurses medication management: results of a survey. Nurse Educ Pract 14: 660-665. [crossref]
  13. Hanafi S, Torkamandi H, Hayatshahi A, Gholami K, Shahmirzadi NA, et al. (2014) An educational intervention to improve nurses’ knowledge, attitude, and practice toward reporting of adverse drug reactions. Iran J Nurs Midwifery Res 19: 101-116. [crossref]
  14. Backstrom M, Ekman E, Mjorndal T (2007) Adverse drug reaction reporting by nurses in Sweden. Eur J Clin Pharmacol 63: 613-618. [crossref]
  15. Mendes D, Alves C Batel, Marques F (2014) Nurses’ spontaneous reporting of adverse drug reactions: expert review of routine reports. J Nurs Manag 22: 322-230. [crossref]
  16. Ulfvarson J, Mejyr S, Bergman U (2007) Nurses are increasingly involved in pharmacovigilance in Sweden. Pharmacoepidemiol Drug Saf 16: 532-537. [crossref]
  17. Conforti A, Opri S, D’Incau P, Sottosanti L, Moretti U, Ferrazin F, et al. (2012) Adverse drug reaction reporting by nurses: analysis of Italian pharmacovigilance database. Pharmacoepidemiol Drug Saf 21: 597-602. [crossref]
  18. Lohit K, Leena A, Jose M, Pandit AA (2017) Adverse drug reactions reporting among nursing staff and students: a validated questionnaire based knowledge, attitude, and practice study. International Journal of Basic and Clinical Pharmacology 6: 523-527.
  19. Desai CK, Iyer G, Panchal J, Shah S, Dikshit RK (2011) An evaluation of knowledge, attitude, and practice of adverse drug reaction reporting among prescribers at a tertiary care hospital. Perspect Clin Res 2: 129-136. [crossref]
  20. Arulmani R, Rajendran SD, Suresh B (2008) Adverse drug reaction monitoring in a secondary care hospital in South India. Br J Clin Pharmacol 65: 210-216. [crossref]
  21. Jordan S, Gabe-Walters ME, Watkins A, Humphreys I, Newson L, et al. (2015) Nurse-led medicines’ monitoring for patients with dementia in care homes: a pragmatic cohort stepped wedge cluster randomised trial. PLoS ONE. [crossref]
  22. Jordan S, Tunnicliffe C, Sykes A (2002) Minimizing side-effects: the clinical impact of nurse-administered ‘side-effect’ checklists. J Adv Nurs 37: 155-165. [crossref]
  23. Jordan S, Knight J, Pointon D (2004) Monitoring adverse drug reactions: scales, profiles, and checklists. Int Nurs Rev 51: 208-221. [crossref]
  24. Gabe ME, Murphy F, Davies GA, Russell IT, Jordan S (2014) Medication monitoring in a nurse-led respiratory outpatient clinic: pragmatic randomised trial of the West Wales Adverse Drug Reaction Profile. PLoS One. [crossref]
  25. Jordan S, Hardy B, Coleman M (1999) Medication management: an exploratory study into the role of community mental health nurses. J Adv Nurs 29: 1068-1081. [crossref]
  26. Jordan S, Gabe M, Newson L, Snelgrove S, Panes G, Picek A, et al. (2014) Medication monitoring for people with dementia in care homes: the feasibility and clinical impact of nurse-led monitoring. Scientific World Journal. [crossref]
  27. Gabe ME, Jordan SE (2014) Development and clinical gains of nurse-led medication monitoring profiles. J Nurs Manag 22: 331-349. [crossref]
  28. Jordan S (1997) Teaching pharmacology by case study. Nurse Educ Today. 17: 386-393. [crossref]
  29. Onder G, Petrovic M, Tangiisuran B, Meinardi MC, Markito-Notenboom WP, et al. (2010) Development and validation of a score to assess risk of adverse drug reactions among in-hospital patients 65 years or older: the GerontoNet ADR risk score. Arch Intern Med 170: 1142-1148. [crossref]
  30. Tabali M, Jeschke E, Bockelbrink A, Witt CM, Willich SN, et al. (2009) Educational intervention to improve physician reporting of adverse drug reactions(ADRs) in a primary care setting in complementary and alternative medicine. BMC Public Health 9. [crossref]
  31. Gonzalez-Gonzalez C, Lopez-Gonzalez E, Herdeiro MT, Figueiras A (2013) Strategies to improve adverse drug reaction reporting: a critical and systematic review. Drug Saf 36: 317-328. [crossref]
  32. Caplan L, Haverhals LM (2012) Barriers and facilitators for preventing adverse drug reactions of long latency: a qualitative study. Int J Risk Saf Med 24: 81-94. [crossref]
  33. Mendes D, Alves C, Batel Marques F (2014) Nurses’ spontaneous reporting of adverse drug reactions: expert review of routine reports. J Nurs Manag 22: 322-330. [crossref]
  34. Vaismoradi M, Bondas T, Salsali M, Jasper M, Turunen H (2014) Facilitating safe care: a qualitative study of Iranian nurse leaders. J Nurs Manag 22: 106-116. [crossref]
  35. Vogelsmeier A (2014) Identifying medication order discrepancies during medication reconciliation: perceptions of nursing home leaders and staff. J Nurs Manag 22: 362-372. [crossref]
fig 4

Highly Anomalous Electroencephalographic Synchronized Pattern during Wakefulness

DOI: 10.31038/IMROJ.2021634

Abstract

We have visually described and analyzed by means of quantifed EEG (qEEG) a highly unusual EEG pattern, not associated with cognitive or any other symptomatology. This pattern consists in an asymmetric highly stationary and highly synchronized trace through all the scalp, mainly composed by alpha-band rhythms. This anomalous pattern appears during quiet-basal and active wakefulness and alternates with more physiological patterns.

We demonstrate that there are not features of epileptic or irritative and show that alpha rhythms are the main component of this pattern. Conclusion: it is essential to be familiarized with objective and numerical measures in EEG clinical practice to sustain results that can be related with basic neurophysiological research. Just approaches like this, we will increase the theoretical foundations of EEG, improving its utility and increasing its accuracy.

Keywords

Alpha rhythm, Quantified EEG, Scalp EEG, Synchronization

Introduction

The electroencephalogram (EEG) during relaxing wakefulness is dominated by alpha rhythm, maximum at occipital lobes when eyes are closed [1]. There is an increasing evidence that it is linked to important aspects of perception, as maximal interstimulus interval for perceived simultaneity or reaction time [2,3]. Alpha activity is also present at central regions, where is known as mu-rhythm. However, other cerebral rhythms are present to at different scalp regions [4,5]. Several kinds of EEG patterns have been described, both in physiological and pathological conditions by means of de visu description and by means of quantitative EEG (qEEG). This method allows an objective description of several features and can be extremely helpful, especially when patterns are highly complex [6-9].

EEG is especially adequate to study epileptic condition, both during interictal as during ictal states. Irritative activity is a synonymous of epileptiform activity and its morphology denotes cortical hyperexcitability. Generally, it is spike-like shaped, with a faster ascend than descend phase, associated with some background slowness and monopolar or dipolar field configuration, at least when activity is focal [10]. Among irritative patterns is the fixation-off sensitivity (FOS), characterized by: i) occipital or generalized epileptic discharges, ii) that constantly occur after closing the eyes and last as long as the eyes are closed and iii) they are induced by the elimination of central vision and disappear with fixation [11,12].

EEG is highly effective to discriminate between irritative and non-irritative activities, although sometimes this is difficult, especially when pattern is not common or well described. In this case, qEEG can be extremely useful [7]. In this work, we describe and quantify an EEG pattern highly unusual during wakefulness and misdiagnosed as FOS and epileptic, probably by the unusual of presentation. We demonstrate that there are not features of epileptic or irritative and show that alpha rhythms are the main component of this pattern.

Materials And Methods

Clinical Case

A 41-year-old female, right hand dominance with premorbid conditions of hypothyroidism, irritable bowel syndrome, chronic migraine, and epilepsy was admitted telemetry unit for presurgical evaluation. In a different center was diagnosed as generalized epilepsy with FOS. Te patient was being treated with 3 antiepileptic drugs.

Study was made with fully informed consent as specified by the Declaration of Helsinki and approved by local La Prinesa review board.

EEG Recording and Quantification

EEGs records were performed using a 32-channel digital system (EEG32U, NeuroWorks. XLTEK®, Oakville, Canada) with 19 electrodes placed according to 10-20 international system. In addition, the differential derivation I of Einthoven for ECG was placed. Recordings were performed at 512 Hz sampling rate, a filter bandwidth 0.5 to 70 Hz and notch filter at 50 Hz. Electrode impedances were usually below 15 kΩ.

Artifact-free periods (e.g. electro-oculogram -EOG- electromyography -EMG- or movement) were selected when possible and exported in ASCII file. Sometimes, analysis was done in the presence of some artifact (e.g. during non-basal awake state). The algorithm used has been previously published [7-9]. Briefly, areas under the power spectrum (PS), obtained by fast Fourier transform, were computed for classical EEG bands delta (0.5-4 Hz), theta (4-8 Hz), alpha (8-13 Hz) and beta (13-30 Hz). Stationary periods were mostly used to obtain average PS, although sometimes non-stationary periods were deliberately analyzed. Pearson’s correlation coefficient (r) was also calculated. One second Hanning windowing 10% superimposed were used to compute all of these measurements. Exported records were between 120 and 300 s, which allowed a minimum of 130 and a maximum of 330 windows to be computed. For every channel, the average and the standard error of mean (SEM) of whole the PS analyzed were computed. A group of 20 adults neither neurological pathology nor pharmacological treatment (43 ± 5 years-old) was used as control. Synchronization values form this group were probed to be gaussian by means of Kolmogorov-Smirnoff’s test. Comparison between patient’s PS and averaged from control group was assessed after normalization of all channels to the area of the occipito-parietal lobes (P3-O1/P4-O2). Numerical analysis of EEG recordings was performed with custom-made Matlab® R2019 software (MathWorks, Natic, MA, USA).

Statistical comparison with control group was performed using the Student’s t-test because normality was probed. However, when normality failed, the Mann-Whitney test was used. When possible, paired data were used. The significance level was set at p = 0.05.

Results

De visu Description of EEG

De visu basal eyes-closed EEG showed an apparently symmetric high-voltage pattern, highly homogeneous without antero-posterior gradient (Figure 1A). Periods of several minutes showed a high stationarity (Figure 1A). Eyes opening sometimes removed this pattern, returning after closing eyes back (Figure 1B), but not always. Neither real spikes nor sharp-waves were observed (Figure 1C). Hyperventilation o photic stimulation did not modify the pattern. We have named this state as shyncronized (EEGsyn). Neither signs nor symptoms were claimed during the long-lasting periods of EEGsyn recorded.

During active wakefulness, sometimes EEG showed a physiological desynchronized pattern (Figure 1D and 2C). However, this desynchronized pattern (EEGdesyn) usually alternated with EEGsyn even during periods of mental work (e.g. reading or watching screen, see below). Patient stayed more than 50% of wakefulness period in EEGsyn.

fig 1

fig 1 b,c

fig 1 d

Figure 1: De visu description of wakeful trace. A) Medium-lasting trace during EEGsyn in basal state (eye closed) near 1 minute duration. A high amplitude, apparently symmetric and without antero-posterior gradient pattern is evident. B) Disappearing of EEGsyn pattern after eyes closure (EC) and re-appearing after eyes opening (EO). Only channels from right hemisphere are shown. C) Detail of the boxed-period form figure A. Neither spikes nor sharp-waves or any other epileptic elements are present. D) Physiological desynchronized pattern during active wakefulness. Short-lasting, small amplitude burst of alpha rhythm are present at occipital lobes.

Some anomalies in physiological responsiveness have been observed, as the blocking of mu rhythm with eyelid (Figure 2A), although a more frequent physiological vanish with movement of the contralateral upper limb has yet been observed (Figure 2B).

As previously stated, FOS appears always eyes are closed. However, this was not the case, because sometimes a truly physiological alpha rhythm vanished after eyes opening and appeared after eyes closing (Figure 2C). Moreover, EEGsyn pattern did not disappeared with gaze fixation, on the contrary, a highly stationary pattern remains during long-lasting periods of reading or gaze fixation onto screen.

fig 2 a,b

fig 2 c

Figure 2: De visu description of some properties during EEGdesyn. A) Anomalous blocking of right mu-rhythm with eyes closing, indicated by EOG potential. B) Physiological vanishing of mu-rhythm with movement of contralateral hand (arrow). C) Physiological EEGdesyn pattern with a suitable antero-posterior gradient and an alpha occipital rhythm during eyes closure (EC), adequately blocked by eyes opening (EO).

Numerical Characterization of EEG

Normalized PSs from basal resting state of EEGsyn was compared with the average from control-group. From Figure 3A we can observe a pattern completely different from control group (black lines), not only for the slower peak of posterior dominant rhythm, but for the great difference between anterior and posterior regions. In fact, in frontal and temporal lobes there is a significant reduction of delta activity. Although can be an effect of the channel used to normalization, what is clear is the great difference between physiological PS and those obtained from EEGsyn.

From Figure 3B we can observe the absence of physiological antero-posterior gradient. Through all the scalp there is three well-defined main components, one at 5.5 Hz in the theta band and two others in the alpha band at 9 and 11.5 Hz. The posterior dominant frequency (PDF) is 9 Hz. A faster component at 18 Hz (beta band) can be observed at occipito-temporal regions and can be a harmonic of PDF. Another relevant fact is that, although not observed from de visu description (Figure 1A), there is a great asymmetry between hemispheres, especially for parieto-occipital regions. Finally, it is remarkable the magnitude of PS, ranging even up to 400 µV2/Hz, at least one order of magnitude higher than usual PS.

fig 3a

fig 3b

Figure 3: Anomalous structure of EEGsyn. (A) Comparison between average normalized PS from control group (black lines) and normalized PS from patient; (B) Detailed comparison between PS from patient. Dotted lines mean SEM. Red lines = right hemisphere; Blue lines = left hemisphere. Vertical lines mark frequencies of the most relevant components at 5.5, 9 and 11.5 Hz. Y-axis units in µV2/Hz.

We have coined the term synchronized for this pattern because r values for whole hemispheres were higher than for control group. However, not all the regions were hypersynchronized than control group. In fact, left frontal and parieto-occipital lobes were relatively desynchronized, as can be observed from Figure 4. It’s also notably the significant asymmetry in synchronization between hemispheres for frontal and parieto-occipital lobes at all the three states (p < 0.001 for paired Student-t test).

fig 4

Figure 4: Average synchronization at several states for different regions for (A) left and (B) right hemisphere. Black = control group; red = EEGsyn in basal state; green = EEGsyn during active awake; yellow = EEGdesyn. *** p < 0.001 for Student-t test between control group and EEGsyn.

Hypersynchronized state not only appeared during closed eye periods, but also during cognitive task-performance (e.g. reading, writing, or watching t.v.). During these periods, de visu appearance of trace and PS was similar to that of basal state (Figure 5), as was also the mean PSs for channels. The main difference is the disappearence of the higher alpha components at fronto-polar regions (11 Hz) and the slight increase of the mean generalized alpha component to 10 Hz. The theta 5 Hz component is also present at both states. However, as can be observed from Figure 4, r average was higher (p < 0.001, Mann-Whitney test) for both hemispheres with similar values for frontal lobes, but desynchronization in left parieto-occipital (p < 0.001 Mann-Whitney test) and temporal lobes (p < 0.05 Mann-Whitney test) and hypersynchronization for right parieto-occipital (p < 0.01 Mann-Whitney test) and temporal lobe (p < 0.001 Mann-Whitney test).

fig 5a,b

fig 5c, d

Figure 5: Similar pattern during EEGsyn states. (A) Raw traces from quiet wakeful basal eye-closed state and (B) from active wakeful eye-open state. (C) Superposition of average PS for both states at every channel from left (D) and right hemisphere. Thick lines from quiet and thin line from active states respectively. Vertical lines are the same that in Figure 3B. Delta component during active EEGsyn at anterior regions reflects artifact from EOG.

Alpha Dependence of EEGsyn

We have addressed how EEGsyn appeared from EEGdesyn state. As can be observed for every state, alpha activity is remarkably similar for occipital and central regions (mu-rhythm). This late component spreads over neighbor regions, mixing with occipital dominant rhythm until affect whole scalp (Figure 6A). The generalized alpha component of PS but mainly located at frontal lobes (mu-alpha rhythm) increased clearly for all channels around the 10 Hz dominant frequency. The only component of new apparition during EEGsyn was the 5 Hz theta component asymmetrically distributed (Figure 6B and 6C). This last component, as stated above was always present during EEGsyn states, quiet and active.

fig 6a

fig 6b, c

Figure 6: Evolution from mu-alpha rhythm during EEGdesyn. (A) Raw traces during wakeful active eye-open state (EEGdesyn) showing mu-alpha and alpha occipital rhythms (left column at t = 0 s), 30 s later (middle column) and at 120 s (right column), when EEGsyn pattern is present. (B) Superposition of average PSs at different times for channels from left and (D) right hemisphere. Thick lines = 0 s; sliced line = 30 s; dotted-sliced = 70 s and dotted line = 120 s. Vertical lines are the same that in Figure 3B. Delta component during active EEGsyn at anterior regions reflects artifact from EOG.

During active wakefulness with mental activity sudden transitions between EEGsyn and EEGdesyn were observed (Appendix, Figure 1). The most dramatic change observed during these transitions was a decrease in alpha and in a lesser degree, beta bands (see Appendix, Figure 1C and 1D).

Discussion

We have described and analyzed a highly unusual EEG pattern, not associated with cognitive or any other symptomatology. This pattern consists in an asymmetric highly stationary and highly synchronized trace through all the scalp, mainly composed by alpha-band rhythms. This anomalous pattern appears during quiet-basal and active wakefulness and alternates with more physiological patterns.

The regulation of the EEG bands is carried out by different brain structures [13,14]. This complex neuroanatomic homeostatic system is probably genetically determined and regulates baseline levels of local synchronization, global interactions between different regions and spectral composition of the signal [15-18]. It is commonly believed that beta activity is originated from cortico-cortical interactions, meanwhile alpha implies thalamo-cortical activity. According to the International League against Epilepsy, an epileptic seizure is a transient occurrence of signs and/or symptoms due to abnormal excessive or synchronous neuronal activity in the cortex of the brain [19]. Therefore, we must expect that ictal activity would be associated with increase in the frequency of scalp activity, by increasing the beta activity [7]. We have showed that the EEGsyn pattern is composed by an asymmetric mixture of theta to beta components not changing during long period of time. In fact, there is a pattern highly stationary, not changing its PSs practically nothing during periods as long as tens of minutes. Synchronization, although higher than control, neither changes along the time. Therefore, once the pattern is stablished from EEGdesyn, neither evolution of frequency nor synchronization change is observed. This highly stationary pattern is not compatible with epileptic seizure dynamics [20,21]. Taking into account that EEGsyn was present during more than 50% of wakefulness and neither cognitive nor behavioral symptoms/signs were observed, no epileptic features can be associated with this state. Therefore, we can rule out that this would be a kind of ictal pattern.

In the same way, we must discard EEGsyn as FOS, and therefore as irritative. We have shown that waveforms have not irritative morphology, pattern does not constantly occur after closing eyes, in fact frequently appears during eyes opening and does not disappear with gaze fixation, and on the contrary, it’s commonly present during reading or watching screens. Therefore, none of the features defining FOS are present at EEGsyn pattern [11,12].

There is increasingly evidence showing that alpha rhythms are generated at thalamus [22-24] although the participation of occipital cortex is debated [25]. In fact, alpha, theta and also delta frequencies are elicited by acetylcholine and glutamate at thalamic lateral geniculate talamo-cortical (TC) neurons [22]. In mammal models, a convincing model of interplay between TC rely cells and interneurons, coupled by gap junctions and chemical synapses has been described [24]. It can be speculated that an abnormal network of TC neurons/interneurons (not necessary viewed as a morphological alteration) can be responsible of the EEGsyn pattern in this patient. This could explain why despite the anomalous structure of the EEG, neither cognitive complaint nor behavioral changes are observed during the pattern. Obviously, more studies would be needed to try this hypothesis (e.g. functional connectivity by MR, detailed cognitive evaluation or evoked potentials at different states).

To the best knowledge of authors, this pattern has not been previously described and we have not found beforehand in our experience (more than 25000 EEG along the last 25 years). Then, we do not expect that publish of this kind of pattern would be of great interest to neurophysiologists to keep in mind as a possible differential diagnosis. However, what is important in practical terms is to use objective concepts in EEG practice, allowing a differentiation between epileptic and non-epileptic patterns, because misdiagnosis can lead to an iatrogenic climbing with disastrous results for the patient. EEG is considered highly subjective (discussed at. [9]) and therefore, a basic theory of EEG is poorly developed. Therefore, it is essential to be familiarized with objective and numerical measures in EEG clinical practice to sustain results that can be related with basic neurophysiological research. Just approaches like this, we will increase the theoretical foundations of EEG, improving its utility and increasing its accuracy.

References

  1. Berger H (1933) Über das Electrenkephalogramm des Menschen Siebente Mitteilung (7th report). Psychiat. Nervenkr 103: 444-445.
  2. Van Rullen R, Koch C (2003) Is pereception discrete or continuous? Trends Cogn. Sci 7: 207-213. [crossref]
  3. Mathewson KE, Gratton G, Fabiani M, Beck DM, Ro T (2009) To see or not to see: prestimulus alpha phase predicts visual awareness. Neurosci 29: 2725-2732. [crossref]
  4. Klass DW, Westmoreland BF (2002) Electroencephalography: general principles and adult electroencephalogram. In: Clinical Neurophysiology, 2nd J. R. Daube. Oxford University Press, New York, 77-107.
  5. Schomer DL, Lopes Da Silva F (2011) Niedermeyer’s Electroencephalography, 6th Eds: D.L: Schomer, F. Lopes Da Silva. Wolters Kluver, Philadelphia.
  6. Sutter R, Kaplan PW (2013) Clinical and electroencephalographic correlates of acute encephalopathy. J Clin Neurophysiol 30: 443-53. [crossref]
  7. Vega-Zelaya L, Martín Abad E, Pastor J (2020) Quantified EEG for the characterization of epileptic seizures versus periodic activity in critically ill patients. Brain Sci 10: 158. [crossref]
  8. Pastor J, Vega-Zelaya L, Martin Abad E (2020) Specific EEG encephalopathic pattern in SARS-CoV-2 patients. Clin. Med 9: 1545. [crossref]
  9. Pastor J, Vega-Zelaya L, Martin Abad E. Necessity of quantitative EEG for the daily practice. In: Electroencephalography. Ed: H. Nakano. InTech. ISBN 978-1-83968-289-6.
  10. Hamer HM, Katsarou N (2004) Noninvasive EEG in the definition of the irritative zone. In: Presurgical Assessment of the Epilepsies with Clinical Neurophysiology and Functional Imaging. Eds: F. Rosenow, HO Lüders. Academic Press, Elsevier. 3.
  11. Brigo F, Rossini F, Stefani A, Nardone R, Tezzon F, et al (2013) Fixation-off sensitivity. Clinical Neurophysiology 124: 221-227. [crossref]
  12. Caputo D, Trivisano M, Vigevano F, Fusco L (2018) CHD2-epilepsy: Polygraphic documentation of self-induced seizures due to fixation-off sensitivity. Seizure 57: 8-10.
  13. John ER (2002) The neurophysics of consciousness. Brain Res Brain Res Rev 39: 1-28. [crossref]
  14. Kropotov JD (2009) EEG Rhythms. Quantitative EEG, event related potentials and neurotherapy. Elsevier, Amsterdam.
  15. Szava S, Valdes P, Biscay R, Galan L, Bosch J, et al. (1994) High resolution quantitative EEG analysis. Brain Topogr 6: 211-219. [crossref]
  16. Hughes JR, John ER (1999) Conventional and quantitative electroencephalography in psychiatry. Neuropsychiatry Clin. Neurosci 11: 190-208. [crossref]
  17. Kondacs A, Szabo M (1999) Long-term intra-individual variability of the background EEG in normals Neurophysiol 110: 1708-1716. [crossref]
  18. Buzsáky G (2006) Rhytms of the brain. Oxford university press, New York.
  19. Fisher RS, Acevedo C, Arzimanoglou A, Bogacz A, Cross JH, et al. (2014) ILAE official report: a practical clinical definition of epilepsy. Epilepsia 55: 475-82. [crossref]
  20. Sanz-García A, Vega-Zelaya L, Pastor J, Sola RG, Ortega G (2017) Towards operational definition of postictal stage: spectral entropy as a marker of seizure ending. Entropy 19.
  21. Vega-Zelaya L, Pastor J, Tormo I, Sola RG, Ortega GJ (2015) Assessing the equivalence between etomidate and seizure network dynamics in temporal lobe epilepsy. Clinical Neurophysiology 127: 169-178. [crossref]
  22. Hughes SW, Lörincz M, Cope DW, Blethyn KL, Kékesi KA, et al. (2004) Synchronized oscillations at alpha and theta frequencies in the lateral geniculate nucleus. Neuron 42: 253-288. [crossref]
  23. Hughes SW, Lörincz ML, Blethyn K, Kékesi KA, Juhász G, et al. (2011) Thalamic gap junctions control local neuronal synchrony and influence macroscopic oscillation amplitude during EEG alpha rhythms. Frontiers in Psychology 193. [crossref]
  24. Lörincz ML, Kékesi KA, Juhász G, Crunelli V, Hughes SW (2009) Temporal framing of thalamic relay-mode firing by phasic inhibition during the alpha rhythm. Neuron 63: 683-696. [crossref]
  25. Halgren M, Ulbert I, Batuji H, Fabó D, Eröss L, et al. (2019) The generation and propagation of the human alpha rhythm. PNAS 116: 23772-23782. [crossref]


Appendix

 
appendix fig a

appendix fig b

appendix fig c, d

Figure 1: Fluctuation between EEGsyn and EEGdesyn during mental activity in awake state (A) Raw traces meanwhile the patient is reading at screen, change head to watch and hold the cellular phone (upper horizontal solid bar) and later return to reading onto screen; (B) Dynamical of EEG bands grouped by lobes during whole the period. Vertical lines denoted the change from screen to cellular phone. Red = right hemisphere; blue = left hemisphere; (C) Average PSs for all the tree periods from left and (D) right hemisphere. Thin lines = first EEGsyn period; thick lines = EEGdesyn (cellular phone) and dotted lines = second EEGsyn period. Observe that delta activity is due by EOG and is mainly located at fronto-temporal areas. Considering the active state of the patient, obviously there is no change in the eye movements during the three periods.

fig 1

Therapeutic Effectiveness over Ground Walking with Body Weight Support Treadmill Training for the Treatment Subacute Stroke Gait Dysfunction

DOI: 10.31038/IMROJ.2021633

Abstract

Background: Stroke is an acute onset of neurological dysfunction due to abnormality in cerebral circulation with resultant signs and symptoms that correspond to the involvement of focal areas of the brain. Among all the neurological diseases of adult life, the cerebral vascular ones clearly rank first in frequency and importance.

Aim: To find out the effectiveness of over ground walking with treadmill gait training in right side subacute stroke subjects.

Settings and design: Physiotherapy Center, NIMHANS, Bangalore. Simple Random Sampling Technique used in this study.

Methods and material: 30 Subjects were selected on the basics of inclusion and exclusion criteria. All the subjects were divided equally into two groups; control Group and experimental Group. Before starting the training, pre-test scores are measured by using cadence and stride length. Control group received over ground walking and experimental group received over ground walking with treadmill gait training for 30 minutes, and both the groups received conventional therapy. At the end of five months, post-test scores of both groups were taken by used measure the cadence and stride length.

Results: Overground gait training with Treadmill gait training group post-test score (71.3, p<0.05) showed better improvements in mobility and gait speed, When compared to over ground gait training group (58.2.3, p<0.05).

Conclusion: The present study which proved that the use of body weight support treadmill training with partial body weight support combined with conventional physiotherapy to be more effective in improving gait ability in subacute subjects.

Keywords

Body weight support, Treadmill gait training, Gait speed, Mobility, Overground gait training

Introduction

Stroke refers to the sudden death of some brain cells due to a lack of oxygen when the blood flow to the brain is impaired by blockage or rupture of an artery to the brain [1].

Stroke may be manifested as Hemiplegia, which is the paralysis of muscles of one side of the body, contralateral to the side of the brain in which CVA occurred [2,3]. Clinically a variety of deficits are possible including the changes in the level of consciousness, impairments of sensory, motor, cognitive, perceptual and language functions. The locations of lesion, the extent of lesion, and the amount of collateral blood flow and early acute care management determine the severity of neurological deficits [4-6].

28% of stroke occurs in individuals under the age of 65 years. The incidence of Stroke is about 19% higher for males than females [7,8].

Stroke can be classified by etiological basis (Ischameic or Haemorrhagic), vascular basis (territory involvement), anatomical basis (cortical or brainstem or capsular or cerebellar or spinal), severity basis (minor or major) progression basis (completed or evolving) and onset basis (infantile or young or elderly stroke).

Stroke usually results in some degree of muscle weakness. It may lead to difficulty with producing force effectively within the context of a task and slowness to produce force is few of the commonest problems faced by the stroke subjects [9]. Moreover several studies have shown that muscle weakness is associated with reduced walking speed and endurance. And also muscle weakness has been suggested as a significant predictor of walking ability in stroke subjects [10].

Statement of Problem

Study on analyzing the effectiveness of Treadmill training with partial body weight support and physiotherapy in improving gait ability after stroke.

Need for the Study

Locomotion is one of the commonest problems after stroke in terms of asymmetry and reduction of speed etc. The most often stated goal for stroke subjects is to improve walking. For the improvement of walking, good strength of the lower extremity muscles is essential irrespective of the presence of spasticity because of growing evidence that muscle weakness rather abnormal reflex activity is a major limiting factor in physical function particularly for locomotor tasks following stroke. Through this study I would like to find out the effectiveness of body weight support treadmill training with partial body weight support and physiotherapy in improving gait ability of stroke subjects

Objectives

  1. To determine the effect if body weight support treadmill training with partial body weight support and physiotherapy in improving gait ability of stroke subjects in group A subjects.
  2. To determine the effect of body weight support treadmill training alone in improving gait ability of stroke subjects in group B.
  3. To determine the difference between the effectiveness of body weight support treadmill training with partial body weight support and physiotherapy in improving gait ability of stroke subjects.

Materials Used in This Study

  1. Treadmill
  2. Supporting Harness
  3. Set of pulleys
  4. Couch
  5. Pillows
  6. Towels
  7. Sand Bags
  8. Swiss Ball
  9. Parallel Bar

Methodology

Research Design

The design that is used for this study is experimental study design

Study Setting

Physiotherapy Center NIMHANS Bangalore

Study Sample

A total Number of 30 patient with stroke were selected by random sampling method with consideration of inclusion criteria and exclusion criteria and they were divided in to Group A and Group B.

Study Duration

All subjects participated in comprehensive 6 months Rehabilitation program.

A three week baseline study consisted of occupation therapy, and speech and neuro physiological therapy according to individual needs. During the subsequent 3 weeks of specific intervention gait training measured. Group A-Body weight support treadmill training with partial body weight support for 30 minutes 5 times a week. Group B – Body weight support treadmill training with partial body weight support for 30 minutes 5 times a week for 3 weeks.

Experimental Group (Group A): It consists of 15 subjects who underwent body weight support treadmill training and physiotherapy

Control Group (Group B): It consists of 15 subjects who underwent only partial body weight supported treadmill training.

Criteria for Selection

Inclusion Criteria: Subjects with all types of stroke.

  1. Age group between 29-40 years.
  2. Subjects of willingness of participate in the study.
  3. Subjects with both right and left hemiplegia
  4. Both genders.
  5. Able to understand at least simple instructions.
  6. No other orthopedic or neurological diseases impairing mobility.

Exclusion Criteria

  1. Subjects with other musculoskeletal disorder.
  2. Medically unstable.
  3. Non Co-operative subjects.

Parameter Used

Functional ambulation category (FAC).

Interventions

The purpose of the treatment and aim of the study were explained subjects who are selected for the treatment. All patients signed the consent form before undergoing treatment program. Subjects in group A was treated with body weight support treadmill training with partial body weight support and conventional physiotherapy. Subjects in group B was treated with exclusive body weight support treadmill training with partial body weight support. The treatment was given for both groups for periods of 6 months.

Procedure

Subjects were supported in a modified parachute harness suspended centrally by a set of pulleys connected to a flexible spring.

At the beginning of the therapy, two therapists provided manual help to correct gait deviations. One therapist sitting by the paretic side facilitated the swing of the paretic limb, determined that its initial ground contact was made with the heel, and prevented knee hyperextension during mid stance and encouraged symmetry of step length and stance symmetry.

The second therapist stood on the treadmill behind the patient and facilitated weight-shift onto the stance limb, hip extension and trunk erection. Mean treadmill speed was 0.21 (range 0.15-0.30 m/s was reached and kept constant until the end. The mean BWS was 27% (range 20-30) of body weight at the beginning. The support whilst 10 subjects needed a support of 5-15% BWS until the end. Net walking a support of treadmill was approximately 20 min per session with a brief rest in the middle.

Results

The pre and post-test values were assessed for gait ability in Group A. the standard deviation was 0.4. The ‘t’ values were calculated for gait ability by paired ‘t’ test was 28.5 and it was more than table value 2.15 for 5% level of significant at 14 degrees of freedom (Figures 1, 2, Tables 1 and 2).

fig 1

Figure 1: Mean and mean difference value for group A and group B.

fig 2

Figure 2: Standard Deviation value for Group A and Group B.

Table 1: Mean and mean difference value for group A and group B.

Study Group

Walking Ability

Mean

Mean Difference

Group A

Pre

Post

3

11

55

Group B

25

38

1

Table 2: Standard Deviation value for Group A and Group B.

Study Group

Standard Deviation

Walking Ability

Group A

0.4

Group B

0.85

The pre and post-test values were assessed for gait ability in Group B. the standard deviation was 0.85. The ‘t’ vales were calculated for gait ability by paired ‘t’ test was 4.5 and it was more than table value 2.15 for 5% level of significance at 14 degrees of freedom (Figure 3 and Table 3).

fig 3

Figure 3: Paired ‘t’ test values for Group A and Group B.

Table 3: Paired ‘t’ test values for Group A and Group B.

Study Group

Calculated Paired ‘t’ Values

Table Value

Significance

Walking Ability

Group A

28.5

2.15

Significant
Group B

4.5

2.15

Significant

The calculated ‘t’ values by unpaired ‘t’ test was 8.5. The calculated’ values were more than the table value 2.05 for 5% level of significance of 28 degrees of freedom (Figure 4 and Table 4).

fig 4

Figure 4: Un paired ‘t’ test Values for walking ability in Group A and B.

Table 4: Un paired ‘t’ test Values for walking ability in Group A and Group B.

Study Group

Calculated Unpaired ‘t’ Values

Table Value

Significant

Walking Pattern

Comparison of Group A and Group B

8.5

2.05

Significant

The paired ‘t’ values have shown that body weight support treadmill training with partial body weight support combined with physiotherapy are more effective for the improving gait ability of subjects after stroke. The unpaired ‘t’ test values have shown that there is significant difference in showing improvement in gait ability of stroke subjects.

This study has proved the 3 week combination of body weight support treadmill training with BWS and physiotherapy effected a large improvement of a gait ability of non-ambulatory hemi paretic subjects than an exclusive 3- week treadmill therapy with BWS.

Discussion

This study has proved that The 3 week combination of body weight support treadmill training with conventional physiotherapy effected a large improvement of a gait ability of non-ambulatory hemi paretic subjects than an exclusive 3- week treadmill therapy with BWS.

Recently, Kwakkel et al. reported that greater intensity of leg rehabilitation improved gait ability and activities of daily living in acute stroke victims [11]. The key elements of their lower limb rehabilitation program were comparable with the physiotherapy within the present study.

Richards et al had shown that an additionally applied, task-specific program including body weight support treadmill training without body weight support resulted In a larger gait velocity in acute stroke victims 6 weeks after study onset as compared with a conventionally treated group who received less therapy [12,13].

The potential for motor recovery after stroke therefore seems to be limited, and subjects of group A probably reached this presumed level faster, i.e. the combined treatment of physiotherapy and body weight support treadmill training accelerated motor recovery [14,15]. Richards et al. also reported in the above mentioned study that differences in gait ability between the high and low-intensity group had waned at follow-up 6 months later, also because of a further improvement of a large extent in the low- intensity group.

Conclusion

From the results of this study 3 weeks of body weight support treadmill training with BWS pulls physiotherapy accelerated the restoration of gait ability in chronic hemi paretic subjects; correspondingly, a focused and intense treatment regime including locomotion training seems most promising in gait rehabilitation after stroke.

The result was analyzed using which proved that the use of body weight support treadmill training with partial body weight support combined with physiotherapy to be more effective in improving gait ability in hemi paretic subjects.

Limitation of the Study

  1. This Study has been conducted on small size sample only.
  2. The outcome of the study has been limited to improving gait ability only.

Recommendations

  1. Further study may be extended with large sample.
  2. Other aspect of motor impairment such as balance, strength may be considered.
  3. The patient ability to either improve or retain the regained functional capacity may be assessed at regular intervals over a period of time.
  4. The efficacy of this treatment may be found by altering the frequency and intensity.
  5. The extended efficacy of these exercises may also be found out by increasing the total in duration of the treatment.
  6. The body weight support treadmill training with partial body weight support may be applied to other neurological conditions such as Paraplegia.

References

  1. Asanuma H, Keller A (1991) Neurobiological basis of motor learning and memory. Concepts Neuro Sci 2: 1-30.
  2. Carr J, Shepherd R (1998) Neurological Rehabilitation. Butterworth & Heinemann, Oxford.
  3. Collen FM, Wade DT, Bradshaw CM (1990) Mobility after stroke: reliability of measures of impairment and disability.
  4. Dietz V, Colombo G Jensen L, Baumgartner L (1995) Locomotor capacity of spinal cord in paraplegic subjects. Ann Neurol 37: 574-582.
  5. Grilner S (1985) Neurologic basis of rhythmic motor acts in vertebrates. Science 228: 143-149.
  6. Hesse S, Berlet C, Schaffrin A, Malezic M, Mauritz KH (1994) Restoration of gait in non- ambulatory hemiparetic subjects by treadmill with partial body weight support. Arch Med Rehabil 75: 1087-1093.
  7. Hesse S, Bertelt C, Jahnke MT, et al. (1995) Body weight support treadmill training with partial body weight support as compared to physiotherapy in non-ambulatory heparetic subjects. Stroke 26: 976-981.
  8. Hesse S, Malezic M, Schaffrin A, Maurtiz KH (1995b) Restporation of gait by a combained body weight support treadmill training and multichannel electrical stimulation in non-ambulatory hemiparetic subjects. Scand J Rehabil Med 27: 199-205.
  9. Holden MK, Gill KM, Magliozzi MR (1986) Gait assessment for neurologically impaired subjects.Standards for outcome assessment. Phys Ther 66: 1530-1539.
  10. Jorgensen HS, Nakayama H, Raaschou HO, Olsen TS (1995) Recovery of walking function in stroke subjects:the Copenhagen stroke study. Arch Phys Med Rehabil 76: 27-32.
  11. Kwakkel G, Wagenaar RC, Twisk JWR, Lankhorst GL, Koetsier JC (1999) Intensity of leg and arm training after middle cerebral artery stroke:a randomized trail. Lancent 354: 191-196.
  12. Visintin M, Barbeau H, Korner-Bitensky N, Mayo NE (1998) Anew approach to retain gait in stroke subjects through body weight support and treadmill stimulation. Stroke 29: 1122-1128.
  13. Werning A, Muller S (1992) Laufband locomotion with body weight support in persons with severe spinal cord injuries. Paraplegia 30: 229-238.
  14. Lovely RG, Gregor RJ, Roy RR, Edgerton VR (1986) Effects of training on the recovery of full weight bearing stepping in the adult spainal cat. Exp Neurol 92: 421-435.
  15. Visintin M, Barbeau H (1989) The effects of body weight support on the locomotor pattern of spastic paretic subjects. Can J Neurol Sci 16: 315-325.
fig

Case Report of Successful Lung Therapy in COVID-19

DOI: 10.31038/IMROJ.2021631


As in many countries COVID-19 infection levels are high, consecutivly many patients develop the severe form of the disease whilst the capacity of clinics is limited. SARS-CoV-2 is acting unfortunately on different levels, once infected there is no single drug able to prevent the ongoing disease. I would like to share my personal experience because it might help to prevent lung damage with simple and available remedies.

March 2020, aged 52 years, I got infected two times, the 11th and the 17th, by a double exposition to SARS-CoV-2 during several hours. The onset of a severe clinical form of the disease followed. No PCR-test was possible at that time.

The 19th of March the symptoms started. They disappeared at about the 29th, but the 30th March retrosternal pain began associated to a beginning pulmonary dysfunction, accompagnied by serious neurologic troubles. I suffocated while breathing normally and therefore a hypoxemia was more than possible. Hypoxia means reactive oxygen (ROS) and reactive oxygen nitrogen species (RNOS) occur. In the meantime their interference in COVID-19 has been proven.

In the Center of Oxygen, Research and Development, where I worked during my PhD studies on hypoxia, ROS and RNOS, my fellow researchers and colleagues examined the antioxidant properties of vitamin C, E, selenium, curcumin and resveratrol. Reseveratrol is found in highest levels in red wine like Pinot Noir. With the beginning of the pulmonary dysfunction I started the intake of several nutrients present at home as I was not sure medical doctors in a clinic would accept my hypothesis.

The pulmonary function decreased in a spectacular way during three days and stabilized then. A week later the improvement started.

The therapy was threefold: Increasing blood oxygen saturation, sustaining enzymes such as the glutathione peroxidase and intake of antioxidants.

In order to charge the blood physically with more oxygen the respiration pattern was voluntary increased several times a day. This means, first determination of the basal respiration frequency. Increasing this frequency with ten to fifteen more breath takes per minute during three minutes. Returning to the basal frequency.

Theophylline is known to improve the acute moutain sickness, another form of hypoxemia (known to lead to loss of smell and taste). Black tea was part of the diet.

On one hand the hypothesis worked out, on the other hand it did not.

It did not work out, because in the morning hours of the 25th April 2020 one of three heart beats missed and the blood pressure regulation got completely dysregulated.

The cardiac issues needed medical care.

It did work out, because the lungs did not develop the COVID-specific lesions as observable in the two joined images resulting from a contrasted thoracic CT scan the 29th May 2020.

 
fig
 

The 25th of April the access for the cardiac problems to the emergency unit of a local hospital has been declined due to a blood oxygen level of 96%, and 5th of May the same at another local hospital (97% oxygen blood saturation). A supplementary blood analysis at the 5th of May did no show any particularities other than a slight lymphocytosis, slightly increased basophiles, a neutropenia and an insufficient vitamin D level. The level of SARS-CoV-2 antibodies was negative.

The remaining effects of the SARS-CoV-2 infection are the heart issues and a slight tinnitus of the left ear. SARS-CoV-2 specific T-cells are not yet examined. Another blood sample of the 10th December presents high levels of Gamma-globulins, indicating the presence of non-specific antibodies. EBV has been excluded.

Taken together, it could be interesting to add antioxidants to the therapy of COVID-19 in order to prevent lung damage, especially when no other medical care is possible.

Please find below a list of nutrients:

Supplementation of nutrients:

Vitamin B1:                          1,1 mg

Riboflavin:                            2,8 mg

Niacin:                                  16 mg

Pantothenic acid:                    6 mg

Vitamin B 6:                          1,4 mg

Biotin:                                  50 µg

Folic acid:                              200 µg

Vitamin B 12:                        12,5 µg

Vitamin C:                            1800 mg

Vitamin D:                            10 µg

Vitamin E:                             12 mg

Calcium:                                400 mg

Iron:                                     10 mg

Zinc:                                     5 mg

Selenium:                              55 µg

Iodine:                                 100 µg

Diet

Darjeeling/Earl Grey: 600 ml

Pinot Noir (Aigle Noir, Gérard Bertrand, Pays d‘Oc, 2019): 350 ml

Herbal infusion (1,75 g : 55% curcumin, 14% cinnamon, apple, 7% ginger, cardamom, 3% stevia leafs, fennel, nutmeg, cocoa shell 2%, black pepper, cloves)

Dark chocolate (85%): 25 to 50 g

In undetermined amounts: peanuts, olive oil, almonds, curcumin, fatty fish.

References

  1. Pritom Chowdhury, Anoop Kumar Barooah (2020) Tea Bioactive Modulate Innate Immunity: In Perception to COVID-19 Pandemic. Review; Front Immunol 11: 590716. [crossref]
  2. PT Goud, D Bai, HM Abu-Soud (2021) A Multiple-Hit Hypothesis Involving Reactive Oxygen Species and Myeloperoxidase Explains Clinical Deterioration and Fatality in COVID-19. Review. Int J Biol Sci 17: 62-72. [crossref]
  3. M Iddir, A Brito, G Dingeo, SS Fernandez Del Campo, H Samouda , et al. (2020) Strengthening the Immune System and Reducing Inflammation and Oxidative Stress through Diet and Nutrition: Considerations during the COVID-19 Crisis. Review. Nutrients 12: 1562. [crossref]
  4. L Loffredo, F Violi (2020) COVID-19 and cardiovascular injury: A role for oxidative stress and antioxidant treatment? Int J Cardiol 312: 136. [crossref]
  5. Montserrat M, E de Gregorio, C de Dios, V Roca-Agujetas, B Cucarull, et al. (2020) Mitochondrial Glutathione: Recent Insights and Role in Disease. Review. Antioxidants 9: 909. [crossref]
  6. M Mrityunjaya, V Pavithra, R Neelam, P Janhavi, PM Halami, et al. (2020) Immune-Boosting, Antioxidant and Anti-inflammatory Food Supplements Targeting Pathogenesis of COVID-19. Front Immunol 11: 570122. [crossref]
  7. BB Muhoberac (2020) What Can Cellular Redox, Iron, and Reactive Oxygen Species Suggest About the Mechanisms and Potential Therapy of COVID-19? Front Cell Infect Microbiol 10: 569709. [crossref]
  8. J Saleh, C Peyssonnaux, KK Singh, M Edeas (2020) Mitochondria and microbiota dysfunction in COVID-19 pathogenesis. Mitochondrion 54: 1-7. [crossref]
  9. F Silvagno, A Vernone, GP Pescarmona (2020) The Role of Glutathione in Protecting against the Severe Inflammatory Response Triggered by COVID-19. Antioxidants (Basel) 9: 624. [crossref]
  10. J Wu (2020) Tackle the free radicals damage in COVID-19. Nitric Oxide 102: 39-41. [crossref]

MINI OPCAB Mammary to LAD and Optimal Medical Treatment in High Risk Patients with Multivessel Coronary Disease Long Term Results

DOI: 10.31038/JCCP.2021415

Abstract

Old patients with multivessel coronary artery disease (CAD) are a challenging group to treat The MINI OPCAB technique is an operation were we connected the left internal mammary to LAD artery through an small incision in the lower part of the sternum. The objective of this prospective study was to show the results and survival during a follow-up in a group of high-risk patients with Multivessel disease treated with the MINI OPCAB operation Results The operative mortality was 0% in this group of patients. The incidence of perioperative infarction was 0%. The average time of the operation was 2 hours and 20 minutes MACE in this group of patients at 80 months was 0%. The survival rate (K-M) at 80 months was 82% Conclusion We strong believe the combination of a MINI OPCAB operation in high risk patients with multivessel coronary disease and optimal medical treatment an eventually and stent in a very big dominate artery is a valuable option for this type of patients more experience is needed to confirm this data.

Statistics: Data were analysed with the Statistical Package for Social Sciences (SPSS, Version 15.0).

Keywords

Coronary surgery and medical treatment, Coronary surgery plus medical treatment, MINI OPCAB in High risk patients, Treatment in high risk coronary patients, Treatment in multivessel coronary

Introduction

Old patients with multivessel coronary artery disease (CAD) are a challenging group to treat; these cases elicit discussion within heart teams regarding the actual benefit of undertaking major surgery on these patients and often lead to abandon the surgical option. Since these patients usually present with age-related comorbidities, preoperative risk stratification is mandatory and less invasive treatment options are favorable. Although conventional surgical revascularization can be carried out in old patients with acceptable short- and long-term a result, perioperative mortality is markedly elevated [1]. For high-riskpatients with multivessel CAD, not eligible to on-pump complete revascularization surgery or percutaneous procedures, incomplete revascularization with OPCAB LIMA-on-LAD offers benefits in survival when compared to OMT (Optimal medical treatment) alone [2]. MIDCAB is an effective approach for managing high-risk patients with symptomatic three-vessel coronary artery disease. Longer follow-up is needed to further clarify patient selection and the long-term outcome of this approach [3,4].

The MINI OPCAB techniqueis an operation were we connected the left internal mammary to LAD artery through an small incision in the lower part of the sternum [5] The long term results were previous described [6]. The objective of this prospective study was to show the results and survival during a follow-up in a group of high-risk patients with Multivessel disease treated with the MINI OPCAB operation and maximal medical treatment during the last 7 years in our Foundation.

Patients and Methods

During the last ten years 14 high risk patients with multivessel coronary disease prospective enroled received a MINI OPCAB operation Left mammary to the LAD bypass plus maximal medical treatment and strictly risk factor controls. The average age was 71, 07(st D 9,051 ci 95%), 21% were females: The preoperative Logistic Euroscore was 10, 68 (st D 5,407 CI 95%). The patients were strictly follow monthly in the Clinic of the Foundation by the Heart Team.

Results

The operative mortality was 0% in this group of patients. The incidence of perioperative infarction was 0%. The average time of the operation was 2 hours and 20 minutes. Ten (71%) of the patients were extubated in the operating room. The average time of Hospitalization was two days and eleven hours One patient at 30 days received a PTCA STENT in the Right Coronary artery; was a very big and dominant artery and the patient started again with angor after the procedure;another patient with a big dominant Circumflex was stenting inmediatly after the operation MACE in this group of patients at 80 months was 0%. We lost one patient at 85 years old due to a cerebrovascular accident at almost 5 years (62 months). The survival rate (K-M) at 80 months was 82%

Discussion

The primarily supposed benefit of off-pump surgery in elderly patients is still undetermined [7] in selected patients with multivessel disease (MVD), MIDCAB can be reasonable with concomitant percutaneous coronary intervention (PCI) as a hybrid procedure [8,9]. To date, the 2014 ESC/EACTS guidelines on myocardial revascularization judge hybrid revascularization as reasonable only in selected patients when PCI of the LAD is not an option and conventional CABG is associated with an increased surgical risk [10].

During a total of 6.3 (median, 4.9) years of follow-up, the primary composite outcome of all-cause mortality, myocardial infarction, stroke, or repeat revascularization occurred in 26% (141/550) and 34% (179/529) of patients in the CABG and PCI groups, respectively (hazard ratio (HR), 0.75; 95% confidence interval (CI), 0.60-0.94; P =.012). CABG was associated with fewer myocardial infarction (4% vs. 8% for PCI; HR, 0.48; 95% CI, 0.29-0.80; P =.037); and repeat revascularizations (8% vs. 17% for PCI; HR, 044; 95% CI, 0.31-0.64; P <.001), but had little association with all-cause mortality or stroke [11].

For high-risk patients with multivessel CAD, not eligible to on-pump complete revascularization surgery or percutaneous procedures, incomplete revascularization with OPCAB LIMA-on-LAD offers benefits in survival when compared to OMT alone.

Patients who underwent OPCAB survived more than those discharged in optimal medical treatment [2]. Considerably more data are available concerning the outcome of old patients undergoing CABG. Sen et al. compared the outcome of 240 octogenarians with matched younger patients in a retrospective two-centre analysis. They found a statistically significant higher 30-day mortality rate of 6.8% in the elderly patients. Age was identified as a risk factor for early death [12] Gunn et al. [13] reported a 30-day mortality rate of 8.8% in octogenarians after CABG in a retrospective analysis where perioperative strokes were significantly more frequent than in younger patients (5.5 vs. 1.6%). We strong believe the combination of a MINI OPCAB operation in high risk patients with multivessel coronary disease and optimal medical treatment an eventually and stent in a very big dominate artery is a valuable option for this type of patients more experience is needed to confirm this data.

References

  1. Grischa Hoffmann. Christine Friedrich, Moritz Barrabas, Rainer Petzina, Assad Haneya, et al. (2016) Short- and long-term follow-up after minimally invasive direct coronary artery bypass. Interact Cardio Vasc Thorac Surg 23: 377-382. [crossref]
  2. Prestipino F, Cristiano Spadaccio, Antonio Nenna, Fraser Wh Sutherland, Gwyn W Beattie, et al. (2016) Off-pump coronary artery bypass grafting versus optimal medical therapy alone: effectiveness of incomplete revascularization in high risk patients. J Geriatr Cardiol 13: 23-30. [crossref]
  3. Benetti Method for coronary artery bypass (1999) United States Patent Ñ 5,888.
  4. Izzat MB, Yim AP (1997) Minimally invasive LAD revascularization in high-risk patients with three-vessel coronary artery disease. Int J Cardiol 1: S101-4. [crossref]
  5. Federico j Benetti , Natalia Scialacomo ,Gustavo Mazzolino (2021) Mini Opcab Operation Surgical Thecnique. Surg Thecnol Int 38: sti38/1400. [crossref]
  6. Federico J Benetti (2010) MINI-off-pump coronary artery bypass graft: long-term results. Future Cardiology 6: 791-795. [crossref]
  7. Deppe AC, Oliver J Liakopoulos, Elmar W Kuhn, Ingo Slottosch, Maximilian Scherner, et al. (2015) Minimally invasive direct coronary bypass grafting versus percutaneous coronary intervention for single-vessel disease: a meta-analysis of 2885 patients. Eur J Cardiothoracic Surg 47: 397-406. [crossref]
  8. Holzhey, Stephan Jacobs, Michael Mochalski, Denis Merk, Thomas Walther, et al. (2008) Minimally invasive hybrid coronary artery revascularization. Ann Thorac Surg 86: 1856 -60. [crossref]
  9. Repossini A, Maurizio Tespili, Antonio Saino, Igor Kotelnikov, Annalisa Moggi, et al. (2013) Hybrid revascularization in multivessel coronary artery disease. Eur J Cardiothorac Surg 44: 288-93. [crossref]
  10. Kolh P, Fernando Alfonso, Jean-Philippe Collet, Jochen Cremer, Volkmar Falk, et al. (2014) 2014 ESC/EACTS Guidelines on myocardial revascularization: the Task Force on Myocardial Revascularization of the European Society of Cardiology (ESC) and the European Association for Cardio-Thoracic Surgery (EACTS). Eur J Cardiothorac Surg 46: 517-92. [crossref]
  11. Chang, Cheol Whan Lee, Jung-Min Ahn, Rafael Cavalcante, Yohei Sotomi, et al. (2016) Outcomes of Coronary Artery Bypass Graft Surgery Versus Drug-Eluting Stents in Older Adults. Ann Thorac Surg 103: 517-525. [crossref]
  12. Sen B, Bernd Niemann, Peter Roth, Raed Aser, Markus Schönburg, et al. (2012) Short- and long-term outcomes in octogenarians after coronary artery bypass surgery. Eur J Cardiothorac Surg 42: e102-7. [crossref]
  13. Gunn j, Kari Kuttila, Francesco Vasques, Raine Virtanen, Anne Lahti, et al. (2012) Comparison of results of coronary artery bypass grafting versus percutaneous coronary intervention in octogenarians. Am J Cardiol 110: 1125-1129. [crossref]


Diagnosis and Therapeutic Tactics of Landau-Kleffner Syndrome in Adults

DOI: 10.31038/ASMHS.2021523

Abstract

Purpose: The clinical signs of Landau-Kleffner syndrome (LCS) are electroencephalographic features and are discussed in five patients aged 25-33 years.

Methods: LCS diagnostic criteria: 1) acquired aphasia or oral hearing aphasia; 2) to have focal, tonic-clonic seizures. The patients were observed at the Mental Health Center of the Ministry of Health of the Republic of Azerbaijan. Of the five people examined, four were women.

Results: The mean follow-up lasted 24 months (January 2019 to January 2020) and tonic-clonic seizures were observed in all five patients. Oral auditory agnosia was found to be moderately aphasic in all patients. Typical epileptiform EEG patterns in SLK are high-amplitude (200-400 μV) regional adhesions, sharp waves.

Conclusions: Landau-Kleffner syndrome is characterized by acquired oral hearing aphasia, seizures, and EEG changes in most patients. Patients were also prescribed depakine® chrono, lamotrigine and levetiracetam in combination with Cortexin®. After 3 months of treatment, speech and cognitive dysfunction were prevented. Patients were monitored regularly for 24 years. Observations showed no convulsions or speech or cognitive impairment.

Keywords

LCS adults, Diagnostics, Treatment, Landau – Kleerner syndrome, Adult epilepsy, Treatment

Introduction

Landau-Kleffner syndrome (LCS) is a rare age-related epileptic encephalopathy characterized by developmental regression in the tongue and electroencephalogram (EEG) abnormalities located mainly around the temporo-parietal areas. If present, seizures consist of absence seizures or tonic-clonic episodes and are more likely to occur during sleep. Behavioral disorders can form part of the clinical picture. The syndrome described in 1957 [1] is also referred to as acquired aphasia with epilepsy (ICD-10, F80.3) to indicate the main features of this disease. It is considered a form of continuous burst during slow wave sleep (CSWS), although the two syndromes have different clinical manifestations and diagnostic implications.

The exact etiology of Landau-Kleffner syndrome is unknown. Structural brain damage in patients with LCS is very rarely associated with pathophysiology. Moreover, genetic factors may be involved. For example, the disease may be correlated with GRIN2A (16p13.2) mutations. This gene encodes a protein called GluN2A (also known as NR2A), which is a subunit of the glutamate ion channel receptor N-methyl-D-aspartate (NMDA). It should be noted that NR2A can be identified at high concentrations in areas of the brain important for speech and language, while NMDA receptors are involved in a wide range of functions related to memory and learning. Again, GRIN2A changes correlate with a significant number of neurodevelopmental disorders, among which epilepsy may be a clinical manifestation [2,3].

It is difficult to express an estimate of the prevalence and incidence of the syndrome. Landau-Kleffner syndrome, indeed, is described as sporadic or limited case series. From the description of the syndrome, in 1957, no more than a few hundred cases have been reported in the literature. An epidemiologic study demonstrated that the incidence of children with LKS in Japan was about 1 in a million [4,5]. Furthermore, it emerges that males are more affected than females and that the reference age is between 3 and 8 years. However, documented cases also exist of younger children or adolescents with the syndrome.

We searched MEDLINE systems, – PreMEDLINE https://www.ncbi.nlm.nih.gov/pubmed/; https://www.ncbi.nlm.nih.gov/pmc/; The Cochrane Library; https://www.accessdata.fda.gov/scripts/cder/daf/; http://www.ema.europa.eu/ema/; https://scholar.google.com; https://www.rxlist.com/script/main/hp.asp; http://www.nejm.org; https://www.bmj.com in order to find at least some information about the incidence of Landau-Kleffner syndrome in adults. The main task of the search was to find information about the presence of Landau-Kleffner syndrome in adults. In none of these search engines did we find data on the primary onset of Landau-Kleffner syndrome in adults. Based on the above, the aim of this study was to study the clinical picture and develop tactics for the treatment of Landau-Kleffner syndrome in adults.

Materials and Methods

Consent

In accordance with the Helsinki Declaration of the World Medical Association “Recommendations for doctors engaged in bio-medical research involving people”, adopted by the 18th World Medical Assembly (Finland, 1964, revised in Japan in 1975, It-aly-1983, Hong Kong-1989, the South African Republic- 1996, Edinburgh-2000); The Constitution of the Republic of Azerbaijan, the Law “On Psychiatric Assistance” (adopted on 12.06.2001, with amendments and additions-11.11.2011. Parents or guardians have provided written informed consent to provide specific anonymized information obtained from their clinic visits for research use and have been reassured that their participation in the study is not related to ongoing clinical care. Consensus and data were obtained as patients were examined over a two-year period.

The decision of the Ethical Committee at the Azerbaijan Psychiatric Association on the article of NA. Aliev, ZN. Aliev “Clinical picture, diagnosis and therapeutic tactics of Landau-Kleffner syndrome in adults” submitted for publication in psychiatric journals: in connection with compliance with its legislative requirements and regulatory documents is to approve the article by NA. Aliyev, ZN. “Clinical picture, diagnosis and therapeutic tactics of Landau-Kleffner syndrome in adults” The patients were observed at the Mental Health Center of the Ministry of Health of the Republic of Azerbaijan from January 2018 to January 2020 for 24 months. Patients received depakin-chron 500 mg 2 times a day, lomotrigine 100 mg 3 times a day, levotisetam 1000 mg 2 times a day per os.

Additionally, the patients were assigned Cortexin® contains a complex of low-molecular water-soluble polypeptide fractions that penetrate through the BBB directly to nerve cells. The drug has a nootropic, neuroprotective, antioxidant and tissue-specific effect. The mechanism of action of the drug Cortexin® is due to the activation of peptides of neurons and neurotrophic factors of the brain; optimization of the balance of the metabolism of excitatory and inhibitory amino acids, dopamine, serotonin; GABAergic effects; a decrease in the level of paroxysmal convulsive activity of the brain, the ability to improve its bioelectrical activity; preventing the formation of free radicals (lipid peroxidation products). Active substance: polypeptides of cattle cerebral cortex. The drug is administered intramuscularly. Before injection, the contents of the vial are dissolved in 1 ml of a 0.5% solution of procaine (novocaine), water for injection or 0.9% sodium chloride solution and injected once daily: adults at a dose of 10 mg for 10 days; children from the neonatal period, with a body weight of up to 20 kg at a dose of 0.5 mg / kg, with a body weight of more than 20 kg – at a dose of 10 mg for 10 days. Before injection, the contents of the vial are dissolved in 1 ml of a 0.5% solution of procaine (novocaine), water for injection or 0.9% sodium chloride solution and injected once daily: adults at a dose of 10 mg for 10 days; If necessary, repeat the course in 3–6 months. Of the five people examined, four were women.

Results

Routine neurological examination of patients, as a rule, does not reveal any focal symptoms. Magnetic resonance imaging (MRI) with SLS, as a rule, does not reveal any pathology, however, it allows to exclude the symptomatic nature of the disease. The average follow-up lasted 24 months (January 2019 to January 2020) and tonic-clonic seizures were observed in all five patients. Oral auditory agnosia was found to be moderately aphasic in all patients. Typical epileptiform EEG patterns in SLK are high-amplitude (200-400 μV) regional adhesions, sharp waves. Landau-Kleffner syndrome is characterized by acquired auditory aphasia, seizures, and EEG changes in most patients. Cortexin® was also prescribed to patients with depakin-chrono, lamotrigine and levotirasem. After 3 months of treatment, speech and cognitive dysfunction were prevented. Patients were monitored regularly for 24 years. Observations showed no convulsions or speech or cognitive impairment.

Discussion

Our findings indicate that the most important characteristic of epileptiform activity in SLS is the tendency to diffuse spread. The diffuse propagation of peak-wave complexes in SLS is based on the phenomenon of secondary bilateral synchronization. At the same time, it is almost always possible to establish the temporal asynchrony of the complexes, as well as their amplitude predominance on the side dominant in speech. The highest amplitude is observed in the temporal leads, more often with an accent on the left; although cases of the location of the focus in the subdominant hemisphere of K.Yu. Mukhin [6] emphasize that sideliness of EEG disturbances does not always correspond to the dominant side, determined by the hand or eye, and epileptiform patterns can be observed in both the dominant and subdominant hemispheres [1].

This is the first preliminary descriptive study aimed at developing treatment strategies for clinical picture, diagnosis and therapeutic tactics of Landau-Kleffner syndrome in adults. It was found that Landau-Kleffner syndrome in adults after appropriate treatment, in all patients after appropriate treatment, in all patients, observations showed no convulsions or speech or cognitive impairment.

This study had several limitations; 1) a small number of patients; 2) a short time observation.

The sample size was relatively small. Further large-scale studies are needed to differentiate the use other anticonvulsants of Landau-Kleffner syndrome in adults.

Conclusions

Although clinical specimens are not representative of the wider population, this study nevertheless highlights the urgent need for further research of Landau-Kleffner syndrome in adults on the LCS diagnostic criteria- acquired aphasia or oral hearing aphasia, focal, tonic-clonic seizures. A. After appropriate treatment, in all patients, observations showed no convulsions or speech or cognitive impairment. The restoration of cognitive functions is very important to eliminate stigma and improve the quality of life of patients. It was found that in children the occurrence of aphasia not with epileptic seizures, but with epileptiform activity on the EEG, i.e., in fact, formulated the modern concept of epileptic encephalopathies. Our data indicate that in the Landau-Kleffner syndrome, the occurrence of aphasia is directly related to the frequency of epileptic seizures,

Author Disclosure

Authors declare that the manuscript is submitted on behalf of all authors. None of the material in this manuscript has been published previously in any form and none of the material is currently under consideration for publication elsewhere other than noted in the cover letter to the editor. Authors declare to have any financial and personal relationship with other people or organizations that could inappropriately influence this work. All authors contributed to and have approved the final manuscript.

Conflict of Interest Statement

The authors declare that the research was conducted in the absence of any commercial or financial relationships that could be construed as a potential conflict of interest.

References

  1. Landau WM, Kleffner FR (1957) Syndrome of acquired aphasia with convulsive disorder in children. Neurology 7: 523-530. [crossref]
  2. Lesca G, Møller RS, Rudolf G, Hirsch E, Hjalgrim H, et al. (2019) Update on the genetics of the epilepsy-aphasia spectrum and role of GRIN2A mutations. Epileptic Disord 21: 41-47. [crossref]
  3. Strehlow V, Heyne HO, Vlaskamp DRM, Marwick KFM, Rudolf G, et al. (2019) GRIN2A study group. GRIN2A-related disorders: genotype and functional consequence predict phenotype. Brain 142: 80-92. [crossref]
  4. Kaga M, Inagaki M, Ohta R (2014) Epidemiological study of Landau-Kleffner syndrome (LKS) in Japan. Brain 36: 284-286. [crossref]
  5. Caraballo RH, Cejas N, Chamorro N, Kaltenmeier MC, Fortini S, et al. (2014) Landau-Kleffner syndrome: a study of 29 patients. Seizure 23: 98-104. [crossref]
  6. Mukhin K Yu (2016) Landau–Keffner syndrome (acquired epileptic. aphasia) with a focus on electroencephalographic criteria. Russian Journal of Child Neurology 11: 3.