Monthly Archives: October 2019

A Rare Localisation of Osteoid Osteoma in a Young Male

DOI: 10.31038/IJOT.2019254

Abstract

Osteoid Osteoma is a benign bone tumor accounting for 10-12% of all benign bone tumors. There is an evident male: female ratio of 2:1. The far most common site of location is the long bones of the lower extremities, which accounts for approximately 50% of all osteoid osteomas. Osteoid osteoma in the hand is a rare finding, accounting for only six to 13%. When found in the hand, the phalanges are the most frequent localisation followed by the carpals. The metacarpals are the least frequent site of location of OO in the hand.

We present a case of a 19-year-old male with characteristic symptoms of osteoid osteoma during a nine-month period. The patient presented with long-term pain at the tumor site with nocturnal worsening. Plain radiography and MR showed a characteristic nidus suggesting the diagnosis of osteoid osteoma.

Treatment of osteoid osteoma can be non-surgical treatment with the use of non-steroidal anti-inflammatory drugs. Since few reports have suggested a possible transformation of osteoid osteoma into malignant osteoblastoma, most patients are treated surgically with en-bloc resection either open or CT-guided depending on local resources.

Keywords

Osteoid osteoma; Metacarpal Bone; Rare Localisation

Introduction

Osteoid Osteoma (OO) accounts for approximately 10-12% of all benign bone tumors [1]. The tumors are most often localised in the long bone of the lower extremities. Localisation of the hand accounts for only 10%. Of these the phalanges are the most frequent localisation followed by the carpals. The metacarpals are the least frequent site of localisation in the hand.

We present a case of a very rare localisation of osteoid osteoma in the metacarpal bone of a young male.

Case

We present a case of osteoid osteoma localised in the first metacarpal bone of a 19-year old male initially examined in our ambulatory care unit in august 2019.

The patient presented with symptoms of long-term localised pain at the first metacarpal bone of the right hand. The patient reported increasing pain at night with intermittent awakenings due to pain. Pain had evolved during the past nine months. The patient noticed no swelling, tenderness or restricted range of motion. At the clinical examination neither swelling nor decreased range of motion was observed. There were no sensory disturbances and no reduction of strength or function. No history of trauma or family history of OO was present either.

Initially a plain radiography was obtained showing a characteristic nidus with periostal thickening raising a high suspicion of osteoid osteoma despite its rare localisation (see figure 1-2).

IJOT 19 - 129-Kristiansen LH-Fn1

Figure 1 and 2. Radiographies obtained initially showing an arrow pointing at the characteristic nidus.

An additional MR scan with contrast was obtained afterwards also suggesting the suspected diagnosis of osteoid osteoma. Final diagnosis is only possible to obtain after histological examination postoperatively.

In this case the nidus of the OO was obvious on the initial radiography and we decided to perform only an MR to exclude other malignant differential diagnosis (see figure 3-4)

IJOT 19 - 129-Kristiansen LH-Fn2

Figure 3 and 4. MR T1 sequences with intravenous contrast showing a characteristic nidus, approximately 4 mm in diameter. Thickening of the cortex in the distal 2/3 of the metacarpal bone.

The patient was discussed in a multicenter sarcoma conference and it was decided to offer the patient surgical removal of the ostoid osteoma by curretage in another hospital.

Discussion

Osteoid osteoma is a benign bone-forming tumor first described in 1935 by Jaffe [2]. Osteoid osteoma accounts for approximately 10-12% of all benign bone tumors [1]. There is an evident male predilection with a male: female ratio of 2:1. OO is most often diagnosed in the second decade of life, principally between 7 and 25 years of age, peaking around 15 years of age [3-5].

The far most common site of location for OO is the long bones of the lower extremities, particularly femur and tibia. These localisations account for approximately 50% of all osteoid osteomas [1]. 10% are localised in the spinal column [3].

Evaluation by a radiologist also suggests osteoid osteoma.

Localisation of OO in the hand is a rare finding accounting for only six to 13% of all osteoid osteomas [5]. When found in the hand, the phalanges are the most frequent localisation followed by the carpals. The metacarpals are the least frequent site of location of OO in the hand [1]. The tumor is most frequently localised in the cortical bone in the diaphysis or metaphysis [1].

The etiology for OO is unknown but some studies suggest familiar disposition and trauma as possible causes [6,8]. Exact pathogenesis of OO also remains unknown. Vasodilation and local inflammation at the tumor site is thought to be caused by prostaglandin E2 and prostacyclin found within the nidus [3,9] Former studies demonstrated bundles of nerve fibres within the nidus contributing to pain and local oedema stimulated by prostaglandins within the nidus [1].

First suspicion of OO most often occurs due to the characteristic symptoms including an initial plain radiography.

In plain radiography OO appears as an oval lytic lesions surrounded by bone thickening and sclerosis. However the central nidus is not always apparent [3]. Not all OO lesions can be diagnosed in radiography, but this is often the primary modality of choice. Further imaging modalities are necessary if there is a high suspicion of OO, although there is no finding on plain radiography [3].

Computed Tomography (CT) is considered the modality of choice in diagnosing OO to distinguish the lesion from other differential diagnosis. The nidus is visualised as a low-attenuated central zone with variable surrounding sclerosis. CT is an important imaging method when plain radiography does not reveal the lesion or with intraarticular lesions.

Visualisation of the OO lesion is very variable with MR diagnostics [1]. Compared to MR, CT is more specific in identifying a nidus [3]. MR benefits from its ability to detect soft tissue involvement. If the nidus is located close to the medullary zone MR has a greater role in diagnosing and visualising the lesion compared to CT. When using MR as the only imaging modality there is a potential of misdiagnosis or overseeing the lesion [3].

Other imaging modalities that can be used in diagnosing OO is bone scintigraphy and PET scans.

In this case the nidus of the OO was very obvious on the initial radiography and we decided to perform only an MR to exclude other malignant differential diagnosis.

Since the etiology of OO is non-malignant and the lesion has a history of spontaneous healing non-surgical treatment can be considered. Non-Steroidal Anti-Inflammatory Drugs (NSAID’s) are proven effective in relieving pain, according to the presence of prostaglandin production in the nidus. Side effects of NSAID’s are an important consideration in long time treatment. Knowledge according to prolonged medical use in treating OO lesions lacks. Studies recommend caution using NSAID’s due to lack of knowledge of long-time use [1,3].

Few reports have suggested that OO can progress to malignant osteoblastoma with prolonged NSAID use [10]. Non-surgical management is a justifiable treatment if the localisation of the lesions is for example intraarticular or difficult to remove or if the patient is not willing to go through surgery.

Surgical procedures are suitable for patients not responding to medical treatment, patients with severe pain or patients not willing to accept possible long-term effects of NSAID treatment. Children with remaining growth potential and open physes in risk of limb-length discrepancy scoliosis and osteoarthritis are also surgical candidates [3].

En bloc resection with complete resection of the total nidus is a frequently used surgical option. For complete pain relive and minimal risk of recurrence it is necessary to resect the entire nidus. Resection of the surrounding sclerotic bone is not required [3]. The use of this procedure may leave behind a bone defect possibly requiring bone grafting or internal fixation. Postoperative restrictions in activity and weight bearing are often recommended after en bloc resection [3]. Challenges in using this technique are difficulties of identifying the lesion perioperatively, possibly resulting in incomplete resection or removal of too much bone tissue [1].

CT guided percutaneous excision is an increasingly used alternative surgical procedure due to reduced morbidity. The procedures include cryoablation, radiofrequency ablation and laser thermocoagulation amongst others. The possibility of perioperative CT visualisation is a great advantage compared to the open en bloc resection. Several studies have shown good results with minimal relapses, low morbidity and few postoperative restrictions. The procedure is though not available in all hospitals [1,3].

Irrespective of what technique is used biopsies are always required to confirm the diagnosis.

This particular patient was offered open curretage of the lesion in another hospital with a sarcoma center. The patient has not yet decided whether to accept the offer of surgery.

Only a few other cases have presented OO localised in the metacarpal bone, which makes this case extraordinary. When patients present with the characteristic symptoms of localised pain and nocturnal worsening in the young male population it is important to remember that OO can present in upper extremity though very rare. Plain radiography is always a simple initial examination to perform.

The patient involved in this case report gave consent to the use of the patient history in this article.

References

  1. Atesok KI, Alman BA, Schemitsch EH, Peyser A et al. (2011) Osteoid osteoma and osteoblastoma. J Am Acad Orthop Surg 19: 678-689.
  2. JAFFE HL. Osteoid-osteoma. Proc R Soc Med 46: 1007-1012.
  3. Noordin S, Allana S, Hilal K, et al. (2018) Osteoid osteoma: Contemporary management. Orthop Rev (Pavia) 10: 7496.
  4. El Fatayri B, Djebara AE, Fourdrain A, Bulaid Y et al (2019) Resection of a rare metacarpal distal condyle osteoid osteoma. Case Rep Orthop 2019: 4542862.
  5. Brohard J, Tsai P (2019) Osteoid osteoma in the thumb of an adolescent patient. J Hand Surg Am 2019.
  6. Seker A, Unal MB, Malkoc M, Kara A et al. (2016) A rare localization of osteoid osteoma – presentation of two cases. Srp Arh Celok Lek 144: 553-556.
  7. Chronopoulos E, Xypnitos FN, Nikolaou VS, Efstathopoulos N et al. (2008) Osteoid osteoma of a metacarpal bone: A case report and review of the literature. J Med Case Rep 2: 285-1947-2-285.
  8. Kalil RK, Antunes JS (2003) Familial occurrence of osteoid osteoma. Skeletal Radiol 32: 416-419.
  9. Makley JT, Dunn MJ (1982) Prostaglandin synthesis by osteoid osteoma. Lancet 2: 42-6736(82)91174-6.
  10. Bruneau M, Polivka M, Cornelius JF, George B (2005) Progression of an osteoid osteoma to an osteoblastoma. case report. J Neurosurg Spine 3: 238-241.

Oxidative Stress and Haemolytic Anaemia In Dogs and Cats: A Comparative Approach

DOI: 10.31038/IJVB.2019331

Abstract

Oxidative stress contributes to Haemolytic Anaemia in many species including dogs and cats, as well as in humans. Red cells are exposed to a continual oxidant challenge, both endogenously from within the red cells themselves and also exogenously from other tissues, and from ingested or administered oxidants. When the oxidative challenge exceeds the antioxidant provisions of the red cell, damage occurs in the form of lipid and protein peroxidation, cytoskeletal crosslinking, oxidation of haemoglobin to methemolglobin, and precipitation of denatured sulphhaemoglobin as Heinz bodies. These deleterious sequelae produce fragile red cells with reduced lifespan, and result in poorer oxygen delivery to tissues, intravascular haemolysis, anaemia, haemoglobinuria and jaundice. A number of features increase the risk of oxidant damage in dogs and cats. Thus dog red cells have low levels of the antioxidant enzyme catalase. Cat haemoglobin has at least four times as many readily oxidizable thiol residues compared to most species, whilst their hepatic capacity for glucuronidation is much reduced, which can result in greater accumulation of oxidants. Like humans, both species may also be exposed to excess oxidants from systemic diseases such as diabetes mellitus, hepatic lipidosis, hypophosphatemia and neoplasias. Iatrogenic oxidants include drugs such as acetaminophen and other non-steroidal anti-inflammatory compounds. Ingested toxins include heavy metals, particularly important in dogs with their increased propensity for scavenging. Ingestion of feeds containing products from Allium species of plants has also long been associated with red cell oxidative damage and Heinz body formation in both dogs and cats. Though less common than in humans, there are occasional congenital enzyme deficiencies which reduce the enzymatic oxidant defence of the red cells in these species. Treatment usually relies on removal of the oxidant challenge or support against the resulting anaemia. Specific antioxidants currently lack efficacy but analogy with human medicine suggests that a range possible antioxidants may be potentially beneficial.

Key words

Antioxidant Defence, Dogs and Cats, Haemolytic Anaemia, Oxidative Stress

Introduction

Red cells occupy a unique position within the vertebrate body. When mature, they are enucleated and lack cytoplasmic organelles [1]. As such, they are therefore unable to carry out ribosomal protein synthesis or mitochondrial oxidative phosphorylation. They are dependent upon glycolysis (or the Emden-Meyerhoff pathway) for whatever ATP supply is required to maintain their osmotic integrity, through various ion pumps, and for other energy requiring events, like synthesis of reduced glutathione, one of their main antioxidant defences [2, 3]. All vertebrate red cells have the main task of carriage of blood gases, oxygen from respiratory tissues and carbon dioxide from metabolically active tissues. Notwithstanding, there are some surprising species differences in function, which are significant both physiologically and pathologically [1]. For example, most vertebrate red cells contain high levels of K+ and low levels of Na+, whose gradients are maintained through the functioning of the ATP-dependent Na+/K+ pump in the red cell membrane. This pump, together with a normally low passive “leak” to Na+ and K+ prevent osmotic swelling which would otherwise occur through the large cytoplasmic load of impermeable protein, especially haemoglobin (Hb), and other molecules, notably organic phosphates [4]. By contrast, dog and cat red cells are usually low in K+ and high in Na+. When mature – but not during development – their red cells lack Na+/K+ pumping capacity and rather they use combinations of Ca2+ pumps and Na+/Ca2+ exchange proteins to maintain osmotic equilibrium [5]. An exception is high K+-containing red cells of certain Asian breeds for example, the Japanese Shibas and Akitas [6] which retain Na+/K+ pumping capacity, and also high levels of the antioxidant reduced glutathione, throughout their lifespan. There are also other differences in physiology of dog and cat red cells pertinent to the subject of this review, and which are considered later.

Dog and Cat Red Cells

In the absence of shear stress, human red cells have the classic biconcave shape with a diameter of about 8 µm. Dog and cat red cells have a similar appearance but are somewhat smaller, at 7 µm and 5.5–6.3 µm, respectively [7]. Cat red cells, in particular, show a degree of anisocytosis and also tend to lack the central pallor which is easily recognizable in the more obviously biconcave shape of dog and human red cells. The oxygen-carrying pigment Hb is found in all vertebrates with the exception of a few species of Antarctic fish [8]. The latter live at subzero temperatures and thereby survive and carry out aerobic metabolism using only the additional oxygen dissolved in plasma at these low temperatures. There are species variations in Hb, however. In this context, cat Hb is noticeable in having 8–10 readily oxidizable sulphydryl groups [9, 10] whilst most other species including humans and dogs have only two main ones, represented by the highly conserved β93 cysteines [11, 12]. Cat Hb also readily dissociates from the usual tetrameric form to dimers [13] which have a greater tendency for autoxidation [14]. Heinz bodies, denatured, precipitated sulphHb, are a special feature of oxidative stress [14]. They are also found in the circulation of healthy cats, however, at up to 5–10 % red cells, presumably because of their greater number of oxidative sites in Hb and impaired red cell antioxidant defence, together with the poor ability of the non-sinusoidal feline spleen to remove Heinz body-containing red cells [15]. Cats also have two main Hbs A and B [9, 16]. HbA is most prevalent in domestic short- and long-haired cats have HbA (98 %) but a few breeds have greater levels of HbB (eg 10 % Persians and 14 % in Abyssinians, with as much as 50 % in Devon Rexs) and geographically to occur {eg [17]. The oxygen affinity of many species is reduced by organic phosphates, especially 2,3-diphosphoglycerate (2,3-DPG or 2,3-biphosphoglycerate), but cat HbA is less responsive to the reduction in P50 whilst HbB does not respond at all [18, 19]. Cat red cells also have low levels of 2,3-DPG [20] which is understandable if it has little regulatory effect on oxygen affinity. Dogs have also several Hbs and more than twelve blood groups [21] but react like human Hb to 2,3-DPG.

Red Cell Metabolism

Mature red cells lack mitochondria and are therefore dependent on anaerobic glycolysis for ATP synthesis [3]. Compared with the citric acid (Kreb cycle) of aerobic respiration this is relatively inefficient, producing two molecules of ATP per glucose moiety (compared with thirty six in mitochondrial aerobic respiration). Glycolysis comprises ten enzymatic steps [1], although the main rate limiting enzymes are hexokinase and pyruvate kinase, at the start and end of the chain, respectively. In addition to ATP, the pathway also syntheses reducing power in the form of NADH. NADH is necessary to reduce methaemoglobin (metHb) using methaemoglobin reductase (or cytochrome b reductase) – one of the main red cell antioxidant defences. An off-shoot of the glycolytic pathway called the pentose phosphate shunt (or hexose monophosphate shunt) is used to make the reducing compound NADPH, a substrate for glutathione reductase – a second main antioxidant enzyme – which reduces oxidised glutathione (GSSG) back to reduced glutathione (GSH). Under normal conditions, glycolysis uses the majority of glucose metabolised by the red cell, with the pentose phosphate shunt accounting for only about 10 % of the flux. Inhibition of the first enzyme of the pentose phosphate shunt, glucose-6-phosphate dehydrogenase, by high NADPH / NADP ratios is responsible and this enzyme normally operates at only a low level of its maximum capacity. Under conditions of oxidative stress, however, as NADPH / NADP ratios fall, glucose is preferentially channelled along the pentose phosphate shunt. Interestingly, deoxyHb which preferentially binds to the cytoplasmic tail of the anion exchanger (or Band 3) displaces glycolytic and other enzymes so that deoxygenated red cells carry out more glycolysis, oxygenated ones produce more NADPH [22, 23] providing a physiological switch to channel glucose through one or other pathways. In addition, the red cells of some species are less permeable to glucose, eg some fish and pigs [1, 24, 25]. In these cases, the pentose phosphate shunt pathways can be used as an alternative to glycolysis for synthesis of ATP, metabolising nucleosides, such as inosine and metabolites of ribose, which enter into the distal part of the glycolytic pathway.

The third red cell metabolic pathway of note is the Rapaport-Luebering shunt (1950s). This uses the enzyme biphosphoglycerate mutase to produce 2,3-DPG (2,3-BPG) – apparently confined to cells of the erythroid lineage and placental cells [26] and accounts for about 20 % of the glucose passing through glycolysis. There is a metabolic cost to this, as the Rapaport-Luebering shunt bypasses phosphoglycerate kinase with the loss of one ATP of the two molecules of ATP from metabolism of glucose. Congenital enzyme deficiencies in the red cell metabolic pathways have been well described in humans [2, 27]. Some genetic deficiencies have also been described in dogs and cats [Table 1]. Whilst oxidative threat is not the root of these conditions, a defect in antioxidant defences will accompany the inadequacies in glucose metabolism which underlie the loss of ATP, and which represents the main cause of red cell instability.

Table 1. Some inherited causes of haemolytic anaemia in dogs and cats.

Catalase

American foxhound, beagle [55]

Hereditary elliptocytosis

Band 4,1 deficiency [56]

Hereditary spherocytosis

Autosomal recessive trait in chondrodysplastic Alaskan malamute dwarf dogs

Hereditary stomatocytosis

Schnauzers [57,59]

Methaemoglobin redutase

Dogs (toy Alaskan Eskimo, miniature poodle, cocker/poodle cross) and cats – domestic short hair [60,61,62]

Osmotic fragility syndrome

Abyssinian, Somali, Siamese and domestic short hair cats [63–64]

Phosphofructokinase (PFK) deficiency

English springer spaniels, American cocker spaniels, whippets [65–66]

Pyruvate kinase (PK) deficiency

Basenjis, Cairn terrier, West Highland white terriers, beagles, cairn terriers, miniature poodles, dachshunds, Chihuahus, American Eskimo toy dogs, pugs, American Labrador retrievers; Abyssinian, Somali and domestic shorthaired cats [67]

Oxidative Challenge

Red cells are also subject to considerable oxidative stress throughout their lifespan. Oxidative challenges arise from several underlying conditions and sources [28, 29]. First, oxygen is potentially toxic and their function as the main oxygen-carrying cell of the body exposes them continually to the threat of oxygen damage. Whilst in other tissues, there is always some slippage of oxygen away from its mitochondrial function in aerobic respiration, which generates superoxide anion and other free radicals, in red cells, the iron-containing Hb is the major source of reactive oxygen species [29, 30]. The ferrous Fe2+ in heme groups is potentially unstable and liable to autoxidation to ferric Fe3+, generating superoxide and, through dismutation, hydrogen peroxide [31] which may be removed by one of the important red cell antioxidant enzymes, catalase. Heme iron is also able to take part in the Fenton and Haber-Weiss reactions to generate hydroxyl and other free radicals [2, 32]. Red cell NADPH oxygenase is a further source of endogenous oxidants [28, 33]. Around 0.5–3 % red cell haemoglobin is oxidized daily [34], producing a constant source of methaemoglobin, although levels are usually kept below 1 % through the reducing action of methaemoglobin reductase [35]. In addition, there is the threat from exogenous oxidants which may enter the circulation from other tissues, for example following ischaemia / reperfusion [36], or the action of xanthine oxidase on hypoxanthine [37] or also via ingested or iatrogenic oxidants [7]. Cat Hb more susceptible to oxidants (Harvey & Kaneko 1976), especially feline HbB cf feline HbA. Counterintuitively, dogs with red cells containing high levels of K+, and also high levels of the antioxidant reduced glutathione notably Japanese breeds [38] appear more susceptible to oxidative damage than the more common low K+ ones. A number of systemic diseases are associated. Some of these include diabetes mellitus, hepatic problems, hyperthyroidism (especially in cats), neoplasia, severe hypophosphataemia (eg refeeding syndrome in cats) and uraemic syndrome.

Oxidative red cell damage from ingestion of products from Allium species (onions, garlic and related plants – see [39] for a list of plants) are particularly heavily implicated in the case of dogs and cats. Onion poisoning in dogs has been recognised since the 1930s [40] and is due mainly to sulphur-containing organic compounds, which give the characteristic odour of these foods [39]. These compounds are not destroyed by cooking or spoilage. Metabolites particularly propylsulphides are implicated in onion-induced oxidant damage of red cells in dogs and cats [41]. Animals probably need to consume about 0.5 % of their body weight in onions to be affected [42], though of course the wet weight and the concentration of the active ingredient will be very variable between feedstuffs. Cats are less frequently affected by Allium spp. toxicity because of their dietary preferences though cases do occur, for example in ill animals fed on human baby food [43]. Ironically, the same sulphur-containing organic compounds which cause harm to dogs and cats are associated with the therapeutic benefits of Allium spp. in humans [44]. Cats also have low hepatic glucuronidation capacity. They lack many uridine diphosphate glucuronyltransferases (UGTs) which makes them particularly susceptible to a number of iatrogenic drugs. They thus have a very poor ability to metabolise compounds such as acetaminophen and salicylic acid [45], for which there is no safe dose. In both dog and cat, overdoses with acetaminophen leads to the accumulation of metabolites such as p¬-aminophenol (PAP) in their red cells, which lack N¬-acetyltransferase 2 (NAT2) to remove it. The result is methaemoglobinaemia [46]. Overdose in other species including humans, by comparison, is associated with hepatic toxicity induced by the metabolite N-acetyl-p-benzoquinoneimine (NADPQI) rather than oxidative damage to red cells. Heavy metals are also implicated in oxidative damage to red cells, particularly in dogs. Commoner causes include zinc toxicity (through ingestion of toys, bolts or coins containing high levels of zinc) [47] or iron overload. The latter is usually iatrogenic through iron injections or repeat transfusions. Some other common iatrogenic oxidants and toxins are listed in [Table 2], with a more complete list is provided in Haematology texts eg [7].

Table 2. Some toxins and iatrogenic oxidants causing haemolytic anaemia in dogs and cats.

Acetaminophen (paracetamol)

Acetylsalicylic acid (aspirin)

Allium spp.

Benzocaine

Carprofen and other non-steroidal anti-inflammatories

Copper

Iron overload

DL-methionine

Methylene blue

Phenylhydrazine

Propylene glycol

Vitamin K and vitamin K antagonists

Zinc

Red Cell Antioxidant Defence

Notwithstanding the potential oxidative peril and their limited capacity for repair by protein synthesis, red cells must survive for some one hundred and twenty days in the case of humans and dogs, and about seventy days in the case of cats. Although the red cell is well equipped with antioxidant defences, problems arise when oxidative challenge exceeds the red cell antioxidant capacity. The result is oxidative damage to membrane lipids and proteins, and to haemoglobin itself. Oxidised haemoglobin, methaemoglobin (heme Fe3+ instead of the normal Fe2+), is unable to carry oxygen and is also liable to denaturation and precipitation as insoluble sulphHb containing Heinz bodies, or to form eccentrocytes in which the Hb is restricted to one side of the cell [13]. Other changes include crosslinking of the cytoskeleton, thiol oxidation, depletion of reduced glutathione and cation imbalance. The result is a fragile red cells with impaired rheology liable to intravascular haemolysis with anaemia, haemoglobinuria and poor oxygen-carrying capacity [48].

Antioxidant provision of red cells is provided by both enzymatic and non-enzymatic pathways. Five enzymes are heavily involved: catalase which reduces hydrogen peroxide to oxygen and water, glutathione reductase uses NADH to reduce oxidised methaemoglobin, superoxide dismutase scavenges superoxide anions generating hydrogen peroxide and oxygen in the process, and glutathione peroxidase uses NADPH to remove both red cell hydrogen peroxide and organic peroxides [49], as does membrane-associated perioxiredoxin-2 which can be reduced via reduced glutathione, vitamin C or thioredoxin. Activities of these enzymes do vary between species [50–52]. Catalase activity in the red cells of difference species is very variable [50, 53, 54]. Expression in dog red cells occurs at about a tenth of the amount in humans whilst its specific activity is around a third that of human catalase [55]. As a result, overall catalase activity in dog red cells is a thirtieth that in humans [53, 55]. Non-enzymatic defence includes reduced glutathione, vitamin C and vitamin E. Therapeutic antioxidants include dosing with N-acetyl cysteine, vitamin C and E. None are particularly effective for rapid protection [39]. There is a need for more efficacious compounds. These must be effective in the short term and protect red cells from further oxidative damage and haemolysis without the requirement for prolonged metabolism. Some human compounds are listed in [Table 3].

Table 3. Antioxidants used in chemoprophylaxis of sickle cell disease in humans.

Therapy

Effect

References

Acetyl-L-carnitine

Protects red cells from peroxidative damage and maintains normal shape at lower oxygen tensions

[68]

N-Acetylcysteine

Increases levels of reduced glutathione and decreases haemolysis

[69,70]

Flavonoids (quercetin, rutin & morin

Show inhibitory effect on haemolysis due to thiol group oxidation

[71]

Glutamine

Increases NAD redox potential and NADH levels

[72,73]

Hydroxyurea

Reduces markers of oxidative stress, decreases lipid peroxidation and increases level of antioxidant enzymes

[74,75]

Iron chelators: deferiprone & deferasirox

Remove iron from the membrane of red cells, decrease lipid peroxidation and increase antioxidant capacity

[76,77]

α-lipoic acid

Protects red cells from peroxyl radical induced haemolysis, increases levels of reduced glutathione and increased antioxidant gene expression

[78,79]

Melatonin

Increases levels of antioxidants and reduces rate of haemolysis

[80]

Statins

Protects against oxidative damage by increasing nitric oxide metabolites and C-reactive protein

[81,82]

Vitamin C and E

Decreases production of reactive oxygen species, increases levels of reduced glutathione and reduces haemolysis

[83]

References

  1. Nikinmaa M (1990) Vertebrate red blood cells. Zoophysiology ed. S.D. Bradshaw. Berlin Heidelberg: Springer-Verlag.
  2. Arese P and E Schwarzer (2003) Metabolic disorders in Red cell membrane transport in health and disease, I. Bernhardt and JC Ellory, Editors. Springer: Berlin. Pg No: 525–548.
  3. Kaneko JJ, JW Harvey, ML Bruss (2008) Clinical Biochemistry of Domestic Animals. Academic Press: New York.
  4. Tosteson DC and JF Hoffman (1960) Regulation of cell volume by active cation transport in high and low potassium sheep red cells. Journal of general physiology 44: 169–194.
  5. Parker JC (1997) Solute and water movement in dog and cat red blood cells., in Membrane Transport in Red cells, JC Ellory and VL Lew, Editors. Academic Press: London. Pg No: 427–465.
  6. Fujise H (1997) K+-Cl- cotransport and volume regulation in the light and the dense fraction of high K+ dog red blood cells. American Journal of Physiology 273: R2991-R2998.
  7. Weiss D and J Wardrop (2010) Schalm’s Veterinary Hematology. Wiley-Blackwell: Iowa, USA.
  8. Sidell BD and KM O’Brien (2006) When bad things happen to good fish: the loss of hemoglobin and myoglobin expression in Antarctic ice fishes. Journal of Experimental Biology 209: 1791–1802.
  9. Taketa F, MR Smits, JL Lessard (1968) Hemoglobin heterogeneiry in the cat. Biochemical and Biophysical Research Communications 30: 219–226.
  10. Harvey JW and JJ Kaneko (1977) Mammalian erythrocyte metabolism and oxidant drugs. Toxicological and Applied Pharmacology 42: 253–261.
  11. Reischl E (2007) Distribution, adaptation and physiological meaning of thiols from vertebrate hemoglobins. Comparative Biochemistry and Physiology Part C 146: 22–53.
  12. Vitturi DA (2013) Antioxidant functions for the hemoglobin beta-93 cysteine residue in erythrocytes and in the vascular compartment in vivo. Free Radical Biology and Medicine 55: 1–23.
  13. Hamilton MN and SJ Edelstein (1973) Cat hemoglobin: pH dependence of cooperativity and ligand binding. Journal of Biological Chemistry 249: 1323–1329.
  14. Christopher MM, JG White, JW Eaton (1990) Erythrocyte pathology and mechanisms of Heinz body-mediated hemolysis in cats. Veterinary Pathology 27: 299–310.
  15. Blue JT, L Weiss (1981) Vascular pathways in nonsinusoidla red pulp: an electron microscope study of the cat spleen. American Journal of Anatomy 161: 135–168.
  16. Lessard JL and F Taketa (1969) Multiple hemoglobins in fetal, newborn and adult cats. Biochemical et Biophysical Acta 175: 441–444.
  17. Giger U (1991) Geographical variation of the feline blood type frequencies in the United States. Feline Practice 19: 21–27.
  18. Bunn HF (1971) Differences in the interaction of 2,3-diphosphoglycerate with certain mammalian hemoglobins. Science 172: 1049–1050.
  19. Mauk AG and F Taketa (1972) Effects of organic phosphates on oxygen equilibria and kinetics of -SH reaction in feline hemoglobins. Archives of Biochemistry and Biophysics 150: 376–381.
  20. Rapoport S and GM Guest (1941) Distribution of acid-soluble phosphorus in the blood cells of various vertebrates. Journal of Biological Chemistry 138: 269–282.
  21. Zaldivar-Lopez S (2017) Comparative genomics of canine hemoglobin genes reveals primary of beta subunit delta in adult carnivores. BMC Genomics 18: 141.
  22. Low PS, P Rathinavelu, ML Harrison (1993) Regulation of glycolysis via reversible enzyme binding to the membrane protein, band 3. Journal of Biological Chemistry 268: 14627–14631.
  23. Chu H (2016) Reversible binding of hemoglobin to band 3 constitutes the molecular switch that mediates O2 regulation of erythrocyte properties. Blood 128: 2708–2716.
  24. Kim HD and MG Luthra (1976) Pig reticulocytes: I. Transitory glucose permeability and metabolism. American Journal of Physiology 230: 1668–1675.
  25. Young JD, ARP Paterson, PJF Henderson (1985) Nucleoside transport and metabolism in erythrocytes from the Yucatan miniature pig. Evidence that inosine functions as an in vivo energy substrate. Biochimica et Biophysica Acta 842: 214–224.
  26. Pritlove DC (2006) Novel placental expression of 2,3-biphosphoglycerate mutase. Placenta 27: 924–927.
  27. Van Wijk R and WW van Solinge (2005) The energy-less red blood cell is lost: erythrocyte enzyme abnormalities of glycolysis. Blood 106: 4034–4042.
  28. Mohanty JG, E Nagababu, JM Rifkind (2014) Red blood cell oxidative stress impairs oxygen delivery and induces red blood cell aging. Frontiers in Physiology 5: 1–6.
  29. Fibach E (2014) Involvement of oxidative stress in hemolytic anemia, in Systems Biology of Free Radicals and Antioxidants, I. Laher, Editor. Springer-Verlag: Berlin Heidelberg 2499–2516.
  30. Sies H (1997) Oxidative stress: oxidants and antioxidants. Experimental Physiology 82: 291–295.
  31. Hebbel RP (1982) Spontaneous oxygen radical generation by sickle erythrocytes. Journal of Clinical Investigation 70: 1253–1259.
  32. Sadrzadeh SMH (1984) Hemoglobin: a biologic Fenton reagent. Journal of Biological Chemistry 259: 14354–14356.
  33. George A (2013) Erythrocyte NADPH oxidase activity modulated by Rac GTPases, PKC, and plasma cytokines contributes to oxidative stress in sickle cell disease. Blood 121: 2099–2107.
  34. Jaffe ER (1974) The formation and reduction of methemoglobin in human erythrocytes, in Cellular and molecular biology of erythrcoytes, H. Yoshikawa and S.M. Rapaport, Editors. University Park Press: Baltimore. 345–376.
  35. Edwards CJ and J Fuller (1996) Oxidative stress in erythrocytes. Comparative Haematology International 6: 24–31.
  36. Zweier JL and MA Talukder (2006) The role of oxidants and free radicals in reperfusion injury. Cardiovascular Research 70: 181–190.
  37. Balagopalakrishna C (1996) Production of superoxide from hemoglobin-bound to oxygen under hypoxic conditions. Biochemistry 35: 6393–6398.
  38. Yamoto O and Y Maede (1992) Susceptibility to onion-induced hemolysis in dogs with hereditary high erythrocyte reduced glutathione and potassium concentrations. American Journal of Veterinary Research 53: 134–137.
  39. Salgado BS, LN Monteiro, NS Rocha (2011) Allium species poisoning in dogs and cats. Journal of Venomous Animals and Toxins including Tropical Diseases 17: 4–11.
  40. Harvey JW and D Rackear (1985) Experimental onion-induced hemolytic anemia in dogs. Veterinary Pathology 22: 387–392.
  41. Zhao J (2017) Therapeutic effect of hydrogen injected subcutaneously on onion poisoned dogs. Journal of Veterinary Research 61: 527–533.
  42. Cope RB (2005) Allium species poisoning in dogs and cats. Veterinary Medicine Pg No: 562–566.
  43. Robertson JE, MM Christopher, QR Rogers (1998) Heinz body formation in cats fed baby food containing onion powder. Journal of the American Veterinary Medical Association 212: 1260–1266.
  44. Augusti KT (1996) Therapeutic values of onion and garlic. Indian Journal of Experimental Biology 34: 634–640.
  45. Court MH (2013) Feline drug metabolism and disposition: pharmacokinetic evidence for species differences and molecular mechanisms. Veterinary Clinics of North America Small Animal Practice 43: 1039–1054.
  46. McConkey SEM, DM Grant, AE Cribb (2009) The role of Para-aminophenol in acetaminophen-induced methaemogloinaemia in dogs and cats. Journal of Veterinary Pharmacology and Therapeutics 32: 585–595.
  47. Bexfield N, J Archer, M Herrtage (2007) Heinz body haemolytic anaemia in a dog secondary to ingestion of a zinc toy: a case report. Veterinary Journal 174: 414–417.
  48. Hasegawa S (1993) Impaired deformability of Heinz-body-forming red cells. Bio rheology 30: 275–286.
  49. Nagababu E, FJ Chrest, JM Rifkind (2003) Hydrogen-peroxide-induced heme degradation in red blood cells: the protective roles of catalase and glutathione peroxidase. Biochimica et Biophysica Acta 1620: 211–217.
  50. Maral J, K Puget, AM Michelson (1977) Comparative study of superoxide dismutase, catalase and glutathione peroxidase levels in erythrocytes of different animals. Biochemical and Biophysical Research Communications 77: 1525–1535.
  51. Stolk JN and RP Smith (1966) Species differences in methaemoglobin reductase activity. Biochemical Pharmacology 15: 343–351.
  52. Owen JL and JW Harvey (2012) Hemolytic anemia in dogs and cats due to erythrocyte enzyme deficiences. Veterinary Clinics of North America Small Animal Practice 42: 73–84.
  53. Richardson M (1952) Study of catalase in erythrocytes and bacteria. II. Catalase activity in erythrocytes from different species of normal animals and from normal humans. Archives of Biochemistry and Biophysics 42: 124–134.
  54. Allison AC, W Rees, GP Burn (1957) Genetically-controlled differences in catalase activity of dog erythrocytes. Nature 180: 649–650.
  55. Nakamura K (1998) A low catalase activity in dog erythrocytes is due to a very low content of catalase protein despite having a normal specific activity. International Journal of Biochemistry and Cell Biology 30: 823–831.
  56. Smith JE (1983) Hereditary elliptocytosis with protein band 4.1 deficient in the dog. Blood 61: 373–377.
  57. Fletch SM and PH Pinkerton (1973) Animal model for human disease: inherited hemolytic anemia in stomatocytosis in the Alaskan Malamute dog. Journal of Pathology 71: 477–480.
  58. Slappendel RJ, W Renooji, JJ de Bruijne (1994) Normal cations and abnormal membrane lipids in the red blood cells of dogs with familial stomatocytosis-hypertrophic gastritis. Blood 84: 904–909.
  59. Bonfanti U (2004) Stomatocytosis in 7 related standard Schnauzers. Veterinary Clinical Pathology 33: 234–249.
  60. Harvey JW (1991) Methaemoglobin reductase deficiency in dogs. Comparative Haematology International 1: 55–59.
  61. Harvey JW, M Dahl, ME High (1994) Methemoglobin reductase deficiency in a cat. Journal of the American Veterinary Medical Association 205: 1290–1291.
  62. Harvey JW (2006) Inherited methaemoglobin redutase deficiency in dogs and cats. Veterinary Clinical Pathology 35: 144–156.
  63. Kohn B, MH Goldschmidt, AE Hohenhaus (2000) Anemia, splenomegaly, and increased fragility of erythrocytes in Abyssinian and Somali cats. Journal of the American Veterinary Medical Association 217: 1483–1491.
  64. Tritschler C (2016) Increased erythrocytic osmotic fragility in anemic domestic shorthair and purebred cats. Journal of Feline Medicine and Surgery 18: 462–470.
  65. Giger U (1985) Inherited phosphofructokinase deficiency in dogs with hyperventilation-induced haemolysis: increased in vitro and in vivo alkaline fragility of erythrocytes. Blood 65: 345–351.
  66. Harvey JW and JE Smith (1994) Haematology and clinical chemistry of English springer spaniel dogs with phosphofructokinase deficiency. Comparative Haematology International 4: 70–75.
  67. Juvet F (2013) Erythrocyte pyruvate kinase deficiency in three West Highland white terriers in Ireland and the UK. Irish Veterinary Journal 66: 12.
  68. Ronca F (1994) Effect of L-proprionyl carnitine on in-vitro membrane alteration of sickle-cell anaemia erythrocytes. International Journal of Tissue Reaction 16: 187–194.
  69. Pace BS (2003) Effects of N-acetyl cysteine on dense cell formation in sickle cell disease. American Journal of Hematology 73: 26–32.
  70. Nur E (2012) N-acetyl cysteine reduces oxidative stress in sickle cell patients. Annals of Hematology 91: 1097–1105.
  71. Asgary S, G Naderi, N Askari (2005) Protective effects of flavonoids against red blood cell hemolysis by free radicals. Experimental Clinical Cardiology 10: 88–90.
  72. Niihara Y (2005) L-glutamine therapy reduces endothelial adhesion of sickle red blood cells to human umbilical vein endothelial cells. BMC Blood Disorders 5: 1–7.
  73. Niihara Y (2018) A phase 3 trial of L-glutamine in sickle cell disease. New England Journal of Medicine 379: 226–235.
  74. Ghatpande SS (2008) Pharmaco-proteomic study of hydroxyurea-induced modifications in the sickle red blood cell membrane proteome. Experimental Biology and Medicine 233: 1510–1517.
  75. Torres LdS (2012) The influence of hydroxyurea on oxidative stress in sickle cell anemia. Reviews of Brazilian Hematology and Hemoter 34: 421–425.
  76. Shalev O (1995) Deferiprone (L1) chelates pathologic iron deposits from membrane of intact thalassemic and sickle red blood cells both in vitro and in vivo. Blood 86: 2008–2013.
  77. Belini Jr E (2012) Oxidative stress and antioxidant capacity in sickle cell anaemia patients receiving different treatments and medications for different periods of time. Annals of Hematology 91: 479–489.
  78. Maragnon K (1999) Comparison of the effect of alpha-lipoic acid and alpha-tocopherol supplementation on measures of oxidative stress. Free Radical Biology and Medicine 27: 1114–1121.
  79. Vichinsky E (2012) Emerging ‘A’ therapies in hemoglobinopathies: agonists, antagonists, antioxidants, and arginine. ASH Education Programme 1: 271–275.
  80. da Silva DG (2015) Potential utility of melatonin as an antioxidant therapy in the management of sickle cell anemia. Journal of Pineal Research 58: 178–188.
  81. Hoppe C (2011) A pilot study of the short term use of simvastatin in sickle cell disease: effects on markers of vascular dysfunction. British Journal of Haematology 153: 655–663.
  82. Davnignon J (2004) Beneficial pleiotropic effects of statins. Circulation 15: 11139–11143.
  83. Amer J (2006) Red blood cells, platelets and polymorphonuclear neutrophils of patients with sickle cell disease exhibit oxidative stress that can be ameliorated by antioxidants. British Journal of Haematology 132: 108–113.

Akt Inhibitors and COL11A1 in Epithelial Ovarian Carcinoma: A Short Note

DOI: 10.31038/IGOJ.2019244

Short Commentary

Epithelial ovarian carcinoma (EOC) is the most lethal gynecologic malignancy. Currently, the treatment of patients with EOC usually includes surgery and chemotherapy [1]. The survival rate of patients with EOC remains low despite advances in surgical techniques and chemotherapy. One of the obstacles to the use of chemotherapy is drug resistance. To improve the survival rate, efforts must be made to overcome chemoresistance.

Akt, a key protein in the Akt/PI3K signaling pathway, is a serine/threonine protein kinase that, once activated by phosphorylation, plays an important role in the process of malignant transformation [2]. The phosphorylated form of Akt (p-Akt) has been implicated in the induction of signals that affect cell apoptosis and the promotion of cell proliferation and invasiveness through mammalian target of rapamycin (mTOR) activation [3]. Investigations have shown that overexpressed p-Akt is associated with a poor prognosis of human cancer [4–6] that includes ovarian cancers [7–9]. Our recent report showed that patients with tumors overexpressing p-Akt had a poorer survival rate, and the p-Akt overexpression was associated with high-grade tumors and cancer death [10]. In addition, more patients with high p-Akt levels were allocated to the group of clinically defined chemoresistance, although this difference did not achieve statistical significance [10]. Therefore, p-Akt overexpression may be a common prognostic factor shared by multiple types of human cancers, and thus has the potential to be a therapeutic target of clinical significance.

Collagen type XI alpha 1 (COL11A1) belongs to the collagen family, which is the major component of the interstitial extracellular matrix. We previously found that COL11A1 plays an important role in EOC. Our results indicated that COL11A1 promotes tumor progression by up regulating the transforming growth factor-β1 (TGF-β1)/matrix metalloproteinase-3 (MMP3) axis, through the involvement of the nuclear transcription factor Y subunit alpha (NF-YA) binding site in the COL11A1 promoter, and predicts a poor clinical outcome in ovarian cancer patients [11]. We also found that COL11A1 promotes cancer cell sensitivity to anticancer drugs via activation of the Akt/c/EBPβ (CCAAT/enhancer-binding protein beta) pathway and attenuates phosphoinositide-dependent kinase 1 (PDK1) ubiquitination and degradation [12]. In addition, COL11A1 reduced chemotherapy-induced apoptosis through up regulating Twist-related protein 1 (TWIST1)-mediated induced myeloid leukemia cell differentiation protein (Mcl-1) and growth arrest-specific 6 (GAS6) expression [13]. Our recent report indicated that SC66, an inhibitor of Akt and mTOR, inhibited COL11A1 expression and enhanced the sensitivity of cells to anticancer drugs through the dual suppression of c/EBPβ and NF-YA binding to the COL11A1 promoter [10].

A previous study [14] described that the Akt inhibitor MK-2206 enhances the efficacy of anticancer drugs in ovarian cancer cells. However, our results showed that COL11A1 mRNA expression and COL11A1 promoter activity were regulated by SC66, but not by MK-2206 [10]. We also found out that the expression of PDK1 was inhibited by SC66, but not by MK-2206 [10]. These results suggest that Akt inhibitors might exert their effect on Akt signaling through different mechanisms. Further investigation is required to explore the precise molecular mechanisms underlying Akt inhibitor-regulated Akt-related signaling.

Conclusion

The PI3K/Akt signaling pathway has become the focus of interest as a critical regulator of cancer cell survival, and a number of Akt pathway inhibitors with different efficacy and specificity have been identified. In our opinion, Akt inhibitors might exert their effect on Akt signaling through different mechanisms, and evaluation of PI3K/Akt/mTOR pathway inhibitors is required to confirm the patterns of sensitivity observed in preclinical studies before they can be applied in the clinic.

Keywords

Akt inhibitor, Chemoresistance, Cisplatin, COL11A1, Epithelial Ovarian Carcinoma, Paclitaxel

References

  1. Siegel R, Naishadham D, Jemal A (2012) Cancer statistics. CA Cancer J Clin 62:  10–29.
  2. Nicholson KM and Anderson NG (2002) The protein kinase B/Akt signaling pathway in human malignancy. Cell Signal 14: 381–395.
  3. Vivanco I and Sawyers CL (2002) The phosphatidylinositol 3-kinase AKT pathway in human cancer. Nat Rev Cancer 2: 489–501.
  4. Perez-Tenorio G, Stal O (2002) Group SSBC. Activation of AKT/PKB in breast cancer predicts a worse outcome among endocrine treated patients. Br J Cancer 86: 540–545.
  5. Massarelli E, Liu DD, Lee JJ, El-Naggar AK, Lo Muzio L, et al. (2005) Akt activation correlates with adverse outcome in tongue cancer. Cancer 104: 2430–2436.
  6. Yoshioka A, Miyata H, Doki Y, Yasuda T, Yamasaki M, et al. (2008) The activation of Akt during preoperative chemotherapy for esophageal cancer correlates with poor prognosis. Oncol Rep 19:1099–1107.
  7. Jia W, Chang B, Sun L, Zhu H, Pang L, et al. (2014) p-AKT over-expression may predict poor prognosis in ovarian cancer. Int J Clin Exp Pathol  7: 5940–5949.
  8. Huang J, Zhang L, Greshock J, Colligon TA, Wang Y, et al. (2011) Frequent genetic abnormalities of the PI3K/AKT pathway in primary ovarian cancer predict patient outcome. Genes Chromosomes Cancer 50: 606–618.
  9. Tanaka Y, Terai Y, Tanabe A, Sasaki H, Sekijima T, et al. (2011) Prognostic effect of epidermal growth factor receptor gene mutations and the aberrant phosphorylation of Akt and ERK in ovarian cancer. Cancer Biol Ther 11: 50–57.
  10. Wu YH, Huang YF, Chen CC, Chou CY (2019) Akt inhibitor SC66 promotes cell sensitivity to cisplatin in chemo resistant ovarian cancer cells through inhibition of COL11A1 expression. Cell Death Dis 10: 322.
  11. Wu YH, Chang TH, Huang YF, Huang HD, Chou CY (2014) COL11A1 promotes tumor progression and predicts poor clinical outcome in ovarian cancer. Oncogene 33: 3432–3440.
  12. Wu YH, Chang TH, Huang YF, Chen CC, Chou CY (2015) COL11A1 confers chemoresistance on ovarian cancer cells through the activation of Akt/c/EBPβ pathway and PDK1 stabilization. Oncotarget 6: 23748–23763.
  13. Wu YH, Huang YF, Chang TH, Chou CY (2017) Activation of TWIST1 by COL11A1 promotes chemoresistance and inhibits apoptosis in ovarian cancer cells by modulating NF-κB-mediated IKKβ expression. Int J Cancer 141: 2305–2317.
  14. Lin YH, Chen BY, Lai WT, Wu SF, Guh JH, et al. (2015) The Akt inhibitor MK-2206 enhances the cytotoxicity of paclitaxel (Taxol) and cisplatin in ovarian cancer cells. Naunyn Schmiedebergs Arch Pharmacol  388: 19–31.

Emergency in False-Electrical Storm in Patients with Implanted Cardioverter Defibrillator

DOI: 10.31038/JCCP.2019212

Abstract

The Electrical Storm (ES) indicates cardiac electrical instability manifested by several episodes of ventricular tachyarrhythmias within a short time. False-ES is defined as recurrent inappropriate Implantable Cardioverter-Defibrillator (ICD) discharges over 24 hours. Far from being a minor complication, False-ES is usually physical and psychological harmful and potentially lethal. The most common causes of inappropriate ICD shock include supraventricular tachycardia with high ventricular response and oversening of peaked T waves or R wave, myopotentials or electrical noise. Appropriate diagnosis and treatment are critical in Emergency Department. To approach these patients systematically, it is important to understand that in general, there are four causes of shock. Modern ICD incorporate sophisticated tachycardia detection algorithms within their programming designed to minimize detection mistakes by the device and ICD-related information can also be checked using remote home monitoring systems. They are often not utilized to their full benefit. Thus, careful attention should be paid to the programming of the device. Fine tuning of the detection and differentiation algorithms is critical, and best done by a practitioner who understands the subtle differences among the different manufacturers. The approach to this problems is reviewed.

Keywords:

False-Electrical Storm, Implanted cardioverter defibrillator, Inappropriate Shock

Background

Current definition of ES is the occurrence of three or more episodes of sustained VT or Ventricular fibrillation (VF) within 24 h requiring appropriate medical intervention. The same definition applies in ICD carriers in which ES is defined by three or more appropriate and separate (at least 5 min) device interventions in 24 h, either with Antitachycardia Pacing (ATP) or shock [1]. Current guidelines recommend ICD implantation for secondary prevention of Sudden Cardiac Death (SCD) in survivors of cardiac arrest with no correctable causes and in patients with sustained symptomatic VT of different etiology. They also recommend ICD implantation for primary prevention in patients with ischemic or non-ischemic dilated cardiomyopathy and ejection fraction equal or lower than 35 % after at least 3 months of optimized medical therapy [2] and in other less frequent inherited arrhythmogenic syndromes. For these reasons, ES is an increasingly frequent cause of access to Emergency Department (ED). It is estimated that about 25 % of ICD carriers experience at least one ES episode per year follow-up [3,4]. Sometimes multiple recurrent ICD discharges are not associated with ES but are due to device malfunctioning. False-ES is defined as recurrent inappropriate ICD discharges over 24 hours. Far from being a minor complication, False-ES is usually physical and psychological harmful and potentially lethal. The most common causes of inappropriate ICD shock include supraventricular tachycardia with high ventricular response, device oversensing and mechanical malfunctions. Recurrent ICD shocks can cause myocardial injury by direct electrocution cell injury and by activation of signaling pathways in the molecular cascade of Heart Failure (HF), the most important of all are adrenergic neurohormonal system. Adrenergic iperactivity may then synergize with recurrent ventricular arrhythmias in exacerbating ventricular dysfunction and worsening HF. Sweeney et al. [5] demonstrated that electrical shocks were associated with an increased risk of death independently of underlying ventricular arrhythmia. Authors esteemes that for every delivered shock, whether appropriate or not, the risk of death increases by 20%. On the other hand, no increased risk was associated with Antitachycardia Pacing (ATP) therapies. False-ES does not only cause myocardial damage, but can deplete a full device battery within hours, potentially leaving the patient unprotected from life-threatening arrhythmic events. False-ES should be treated by immediate intervention to suppress ICD shocks. Moreover, inappropriate discharges from ICD should be avoided at all cost by an optimal device programming [6].

Implantable Device

The ICD is a implantable device able to monitor cardiac rhythm and terminate potentially life-threatening arrhythmias. It consists of two main components: the generator that contains the battery, all the circuits that run the device, and the operator communicating system; the leads that reach heart chambers through the venous system and allow the device to monitor heart electrical activity and to deliver therapies. The ICD has a lead implanted in the right ventricle apex able to record ventricular activity and release therapies like pacing and/or direct current shock. In adjunct, some ICD has another lead implanted in the right atrium to record atrial electrical activity, improving discrimination between Supraventricular Arrhythmias (SVA) and ventricular arrhythmias and to pace the atrium (ICD-DR). ICD with Cardiac Resynchronization Therapy (CRT-D) has a third lead that paces the left ventricle (through the coronary venous system) synchronously to the right ventricle improving contractility. ICD uses mathematical algorithms defined by the manufacturer to discriminate life-threatening ventricular arrhythmias from supraventricular arrhythmias and to deliver appropriate therapy. Modern ICD stores information from various diagnostic features including intracardial ECG registrations during arrhythmia and can transmit these data using remote monitoring technology. Furthermore, the ICD can generate audible alarms in the case of device malfunction, low battery capacity and lead failure. Sometimes correct recognition fails and, in this case, the therapy delivered is defined inappropriate. In other cases the delivered therapy may not be able to terminate the ventricular arrhythmia, and it is defined ineffective. VT recognition is primarily based upon tachycardia cycle length and duration. Both of these parameters are tailored on the patient’s characteristics. Thus, ICD uses ventricular rate zones for rhythm classification. The boundaries between zones are defined by two main principles: the recognition of unstable fast VT/VF must be highly sensitive even at the cost of inappropriate rapid SVA treatment; the recognition of slower VT has to be more specific to avoid inappropriate therapies even at the cost of some delay in detection. The ICD treats ventricular tachyarrhythmias with two modalities: Antitachycardia Pacing (ATP) and Direct current shock. ATP is a brief ventricular pacing (6–8 beats) with a cycle length slightly lower (thus at a faster rate) of the arrhythmia, in the attempt of resetting the reentrant circuit and interrupting the arrhythmia; sometimes the paced cycle shortens from beat to beat and in this case it is referred as ATP ramp. Direct current shock is a biphasic electrical shock provided between the generator case and the coil localized on the right ventricular lead; the energy released may vary, reaching up to 41 J with the latest generation high-energy devices. Basing on several studies [8–19], ICD programming should empirically involve the use of three rate zones: a slow VT zone up to 320 ms cycle length (<188 bpm); a fast VT zone from 320 to 240 ms (188–250 bpm); a VF zone from 240 ms (>250 bpm). In VT zones a variable number of ATP attempts precedes the shocks delivery. In the slow VT zone, a greater number than in fast VT zone are usually programmed, as fast arrhythmias are usually less tolerated. In the VF zone, the hemodynamic instability of the arrhythmia and its high life-threatening potential require an immediate shock delivery. In modern devices an ATP during capacitor charging is delivered, avoiding the shock in the case of arrhythmic interruption. VT/VF detection isn’t only based on ventricular rate but also requires a programmable duration of the arrhythmia to avoid detection of non-sustained episodes. Usually a VT/VF is detected when a certain percentage of ventricular sensed beats meets cycle length criteria. The type of counting used varies between detection zones and between manufacturers. In order to improve sensibility, according to some manufacturers, the arrhythmia is detected when a certain percentage of beats falls in VF zone, while consecutive interval counting is required in the VT zone to increase specificity. The time to detection in the VT zone should be longer enough to allow spontaneous termination of non-sustained episodes.

Inappropriate Therapies Due To Supraventricular Tachycardia

Inappropriate therapies (especially shocks) are one of the main issues to be avoided because they cause patient discomfort, are potentially proarrhythmic and reduce battery life. The two main causes of inappropriate shock are failure in discriminating SVA and signal misinterpretation (Tab. 1) [11–20]. Frequently SVA are associated with a fast ventricular response leading ventricular rate to fall into VT/VF detection zone causing inappropriate therapy release. This problem occurs more frequently with single-chamber ICD that hasn’t atrial sensing capabilities. Current guidelines don’t provide a clear stepwise approach to managing patients at high risk for recurrent shock. Appropriate diagnosis and treatment are critical. Modern ICD incorporates sophisticated tachycardia detection algorithms inside their programming designed to minimize detection mistakes (Figures 1–5). Thus, careful attention should be paid the programming of the device. Fine tuning of the detection and differentiation algorithms is critical and best done by a practitioner who understands the subtle differences among the different manufacturers. Placing an atrial pacing lead and upgrading a single-chamber system to a dual-chamber system for improved SVT discrimination is sometimes necessary and points out the significance of carefully screening for any history of SVT prior to initial ICD implant. ICD uses a variety of algorithms to discriminate SVA from VT. Major ones are listed below: -Atrio ventricular rate comparison : applies only in dual-chamber ICDs; when the ventricular rate is faster, the diagnosis is VT. When atrial and ventricular rates are equal, additional criteria are required for discrimination. -Onset: useful for discrimination of gradually accelerating sinus tachycardia from sudden-onset VT; it applies when the RR interval shortens by a programmed percentage if compared with the average number of preceding beats. May fail in case of VT occurring during sinus tachycardia. -Stability: useful for discrimination of fast response Atrial Fibrillation (AF). When RR interval variability is greater than a programmed percentage, AF is supposed. It may fail in the case of very fast AF in which there is a pseudo-regularization of ventricular rate, in atrial flutter or in irregular VT. -Morphology: it compares endocavitary electrocardiograms recorded during sinus rhythm and during VT. It is useful in single-chamber ICD lacking of atrial information, but may fail in intraventricular conduction delays and in rate-dependent conduction delays. -Rate duration: it is an extreme lifesaving measure. It results in shock delivery after a programmable time interval even if the episode is classified as SVA; this algorithm is usually activated when there is a high risk of undertreatment of VT erroneously recognized as SVA, but it increases the risk of overtreatment.

JCCP_2019-Maurizio Santomaur_F1

Figure 1. SMART Algorithm- based reduction of inappropriate defibrillation shock

JCCP_2019-Maurizio Santomaur_F2

Figure 2. RHYTM ID Algorithm- based reduction of inappropriate defibrillation shock

JCCP_2019-Maurizio Santomaur_F3

Figure 3. PR Logic Algorithm- based reduction of inappropriate defibrillation shock Sorin: PARAD+Rhythm DiScrimination

JCCP_2019-Maurizio Santomaur_F4

Figure 4. Sorin: PARAD+Rhythm DiScrimination Algorithm- based reduction of inappropriate defibrillation shock

JCCP_2019-Maurizio Santomaur_F5

Figure 5. Rate Branch Algorithm- based reduction of inappropriate defibrillation shock

Inappropriate Shock Due To Oversensing

Signal misinterpretation is other big deal leading to inappropriate shocks. It may depend on some programmed easily editable variables and external and farfield interferences and lead fracture that usually requires an interventional approach [21–23] (Table 1). Major ones are listed below: -T wave oversensing: it happens when a high amplitude T wave is erroneously recognized as an R wave. It may happen because the low ventricular sensing threshold necessary to recognize even low-amplitude VF. This problem can be solved by increasing sensing threshold, lengthening refractory period or changing sensing decay parameters to suppress T wave detection. – Double-counted R waves: it may occur as a result of local ventricular delay in the baseline state or conduction delay caused by drugs or electrolyte abnormalities. It may also occur in patients with a double or triple lead ICD, long PR interval and loss of RV pacing capture. The ICD may count both the paced ventricular event and the spontaneous R wave conducted from the atrium. Finally, another common cause of double counting is loss of RV capture in CRT-Ds: the device counts both the paced ventricular event and the RV depolarization originating from the LV lead. R-wave double counting results in alternation of 2 ventricular cycle lengths. The second component of the R wave is usually sensed as soon as the blanking period terminates and is always classified in the VF zone. The classification of the first one depends on the programming of the tachy-zones and on the heart rate. The double counting can manifest during sinus rhythm, only during Precocious Ventricular Complex (PVC) or during slow VT with a misclassification as VF, the true rate being overestimated and possibly leading to shocks. Prolongation of the ventricular blanking period from the nominal value corrects ventricular double counting in the majority of cases and must be proposed as the first step when possible, keeping in mind that a common concern is true VF undersensing when the blanking period is over-extended. Similarly, decreasing the programmed ventricular sensitivity may resolve the problem in a certain number of cases but this option requires that reliable sensing of VF is confirmed at the reduced level of sensitivity. Moreover, lowering ventricular sensitivity may be dangerous and useless since the amplitude of the 2 signals may be as high. Programming of very high VF zone to solve the problem seems also inappropriate. Atrial far-field sensing: generated by inappropriately detecting an atrial paced event in the ventricular chamber related to the sensing of events from one chamber in another chamber. Cross-chamber blanking periods are an integral part of the ICD and CRT-D sensing systems. They are used to suppress detection of device-generated artifact as well as certain intrinsic signal artifacts. Events that occur during refractory and cross-chamber blanking periods are ignored for the purposes of pacing timing cycles and ventricular tachycardia detection. Each refractory and fixed cross-chamber blanking period includes a re-triggerable noise window, which helps to detect and classify persistent noise. Cross-chamber blanking periods are designed to promote appropriate sensing of in chamber events and prevent oversensing of activity in another chamber. Cross-chamber blanking periods are initiated by paced and/or sensed events in an adjacent chamber. Residual energy on the defibrillation lead after shock delivery can increase the likelihood of cross-talk / far-field sensing. As this residual energy dissipates with time after shock delivery, the potential for cross-talk / far-field sensing also decreases. To reduce oversensing after shock delivery, a longer fixed value is automatically applied for all cross blanking periods during the Post-Therapy Period. -Electromagnetic Interference (EMI): is fortunately fairly infrequent with bipolar leads, but still occurs. There are many causes of EMI, the most common of which include Magnetic Resonance Imaging (MRI), large magnetic fields, arc welding, improper copper wiring in a shower, carrying stereo speakers, working on a running car engine, and lingering in a store’s surveillance gating. To prevent shock from EMI often involves a certain amount of detective work. Once the cause of the EMI is identified, the patient must avoid the culprit, or in some cases, the device can be reprogrammed to prevent recognition of the EMI; -Pectoral Myopotentials: farfield myopotential recording may lead to inappropriate arrhythmic detection. This problem occurred in the past with unipolar leads using large sensing fields and is now largely avoided with the modern bipolar leads, recording more localized signals only. This high-frequency, variable amplitude signals are prominent on electrograms that include the ICD can, including shock electrograms and leadless ECG. They may be reproduced by pectoral muscle exercise. However, because ICD do not use these signals as primary sensing channels, pectoral myopotentials do not cause oversensing if the lead is intact. However, they may cause misclassification of exercise-induced sinus tachycardia as VT because algorithms that discriminate VT from SVT based on ventricular electrogram morphology use the RV coil-can vector as the default signal. Pectoral myopotentials might also interfere with algorithms that evaluate lead integrity by comparing near-field and far-field signals; -Diaphragmatic Myopotentials: these low-amplitude, high-frequency signals are more prominent on the sensing electrogram than the shock electrogram because the sensing bipole is closer to the source. Their amplitude varies with respiration, but not the cardiac cycle. Oversensing is most common with integrated bipolar sensing at the RV apex and rare with dedicated bipolar sensing or leads in the RV outflow tract. It occurs when sensitivity is maximal, after long diastolic intervals or ventricular paced events, and often ends with a sensed R wave, which reduces sensitivity abruptly. Thus, it commonly occurs in pacemaker-dependent patients, in whom inhibition of pacing maintains high ventricular sensitivity, resulting in persistent oversensing and inappropriate detection of VF. It may present as syncope because of inhibition of pacing followed by an inappropriate shock. With chronically implanted leads, oversensing may first occur after the dominant rhythm changes from ventricular sensed to ventricular paced, such as upgrade to CRT-D or AV junction ablation.Oversensing may be reproduced by monitoring real-time electrograms during deep breathing or straining in different positions, after programming VF detection off. -Lead failure: has many causes, but some of the most common include fractured leads, dislodged leads, loss of capture after ICD shock, redundant loops of endocardial leads, chatter in active fixation lead, loose set screew or adapter. Management of this category of shock involves fixing the implanted system, either with device reprogramming or reoperation. In these cases lead extraction and/or new lead insertion is the only choice. Modern devices usually provide alerts for lead integrity. The patient should be questioned about positional muscle twitching suggesting possible lead malfunction. If present, or if nonphysiologic noise is seen on the interrogation strips, active manipulation of the arm and device pocket should be performed while recording a rhythm strip with device channel markers through the interrogation box to determine if it is reproducible.

JCCP_2019-Maurizio Santomaur_F6

Figure 6. Stepwise algorithm for patients with frequent or repetitive ICD shocks

Table 1. Common Causes of Inappropriate Shock

Supraventricular tachycardia with rapid ventricular response rate

Atrial fibrillation

Atrial flutter

Atrial tachycardia

Sinus tachycardia

Device oversensing

Intracardiac signals

T-wave oversensing

R-wave double counting

Atrial far-field sensing

Extracardiac signals

Electromagnetic interference

Pectoral myopotentials

Diaphragmatic myopotentials

Mechanical malfunctions

Lead fracture

Insulation break

Lead dislodgement

Device Reprogramming

Several studies demonstrated that repeated ICD shocks are associated with increased mortality as well as a reduction of quality of life [4]. For these reasons optimization of ICD programming in order to avoid unnecessary shock is mandatory in patients experiencing False-ES. As stated above, arrhythmic detection and treatment by ICD is a step process including several variables such as heart rate threshold, number of intervals to detect, discrimination of SVA, and type and number of therapies released. Each of these steps can be tailored upon patient characteristics to avoid unnecessary treatment. A patient who receives multiple shocks is not difficult to identify by ispecting data stored in the ICD. They will present to an ED with the specific complaint that their ICD has fired several times. At that point in time, it is critical to define the etiology of the shocks. Perform initial evaluation as above. The device needs to be fully interrogated, with careful analysis of all of the stored EGM recorded from the recent therapies and performing specific troubleshooting (Fig 6). The single most important diagnostic test is interrogation of the patient’s device. If device malfunction is suspected, therapy (antitachycardia pacing and shock) can be immediately suspended by placing a magnet over the ICD can (Fig 6). Unlike a pacemaker, this will not alter the device’s pacing capabilities. Should a true ventricular arrhythmia subsequently declare itself, removing the magnet will immediately reactivate all device therapies. Subsequent treatment will depend on the determined underlying cause. Device safety alerts are fortunately a reality and are more common with ICD than pacemakers. Prophylactic removal or replacement of a generator or lead on alert is generally not recommended unless the patient is pacer dependent. All device manufactures with products on alert have published management guidelines to physicians, which should be updated as new data is collected. The response to a safety alert must be individualized to each patient and balance the patient’s risk of death from malfunction vs. the likelihood of malfunction and the known risk associated with going back in the pocket in terms of infection, perforation and bleeding.

Conclusion

The two main causes of False-ES are failure in discriminating SVA and signal misinterpretation. False-ES are a life-threatening syndrome and the appropriateness of acute management determines the patient’s survival. Despite the difficulties associated with a comprehensive evaluation of this critical condition, a diagnostic approach based on the type of arrhythmia and the signals of device malfunction facilitates the mechanism-directed of inappropriate shocks. Recent advances in ICD reprogramming algorithm have greatly improved the clinical outcomes.

References

  1. Pedersen CT, Kay GN, Kalman J, Borggrefe M, Della-Bella P, et al. (2014) EHRA/HRS/APHRS expert consensus on ventricular arrhythmias. Heart Rhythm 11: e166-96Sep.
  2. McMurray JJV, Adamopoulos S, Anker SD, Auricchio A, Böhm M, et al. (2012) ESC Guidelines for the diagnosis and treatment of acute and chronic heart failure 2012: The Task Force for the Diagnosis and Treatment of Acute and Chronic Heart Failure 2012 of the European Society of Cardiology. Developed in collaboration with the the Heart Failure Association (HFA) of ESC. Eur Heart J 33: 1787–847.
  3. Santomauro M, Duilio C, Tecchia LB, Di Mauro P, Auricchio L, et al. (2010) Management of electrical storm in implantable cardioverter-defibrillator recipients. G Ital Cardiol 11: S37-S41.
  4. Dorian P, Al-Khalidi HR, Hohnloser SH, Brum JM, Dunnmon PM, et al. (2008) Azimilide Reduces Emergency Department Visits and Hospitalizations in Patients With an Implantable Cardioverter Defibrillator in a Placebo-Controlled Clinical Trial. JACC 52: 1076–1083.
  5. Sweeney MO, Sherfesee L, DeGroot PJ, Wathen MS, Wilkoff BL, et al. (2010) Differences in effects of electrical therapy type for ventricular arrhythmias on mortality in implantable cardioverter defibrillator patients. Heart Rhythm 7: 353–360.
  6. Guerra F, Shkoza M, Flori M, Capucci (2012) A Electrical Storm. Cardiac Arrhythmias – New Considerations 2012: 377–394. Available : http://www.intechopen.com/books/cardiac-arrhythmias-new-considerations/electricalstorm
  7. Wathen MS (2004) Prospective randomized multicenter trial of empirical antitachycardia pacing versus shocks for spontaneous rapid ventricular tachycardia in patients with implantable cardioverter- defi brillators: Pacing Fast Ventricular Tachycardia Reduces Shock Therapies (PainFREE Rx II) trial results. Circulation. 110: 2591–2596.
  8. Cao J, Gillberg JM, Swerdlow CD (2012) A fully automatic, implantable cardioverter-defibrillator algorithm to prevent inappropriate detection of ventricular tachycardia or fibrillation due to T-wave oversensing in spontaneous rhythm. Heart Rhythm 9: 522–530.
  9. Wilkoff BL, Williamson BD, Stern RS, Moore SL, Lu F, et al. (2008) Strategic programming of detection and therapy parameters in implantable cardioverter-defibrillators reduces shocks in primary prevention patients. J Am Coll Cardiol. 52: 541–550.
  10. Gunderson BD, Abeyratne AI, Olson WH, Swerdlow CD (2007) Effect of programmed number of intervals to detect ventricular fibrillation on implantable cardioverter-defi brillator aborted and unnecessary shocks. Pacing Clin Electrophysiol. 30: 157–165.
  11. Tan VH, Wilton SB, Kuriachan V, Sumner GL, Exner DV (2014) Impact of programming strategies aimed at reducing nonessential implantable cardioverter defi brillator therapies on mortality: a systematic review and meta-analysis. Circ Arrhythm Electrophysiol 7: 164–170.
  12. Gasparini M, Proclemer A, Klersy C, Kloppe A, Lunati M, et al. (2013) Effect of long-detection interval vs standard detection interval for implantable cardioverter-defi brillators on antitachycardia pacing and shock delivery: the ADVANCE III randomized clinical trial. JAMA 309: 1903–1911.
  13. Martins RP, Blangy H, Muresan L, Freysz L, Groben L, et al. (2012) Safety and effi cacy of programming a high number of antitachycardia pacing attempts for fast ventricular tachycardia: a prospective study. Europace. 14: 1457–1464.
  14. Madhavan M, Friedman PA (2013) Optimal programming of implantable cardiac-defibrillators. Circulation 128: 659–672.
  15. Moss AJ, Schuger C, Beck CA, Brown MW, Josef Kautzner, et al. (2012) Reduction in Inappropriate Therapy and Mortality through ICD Programming. N Engl J Med 367: 2275–2283.
  16. Auricchio A, Schloss EJ, Kurita T, Meijer A, Steven Zweibel, et al. (2015) Low inappropriate shock rates in patients with single- and dual/triple-chamber implantable cardioverter-defibrillators using a novel suite of detection algorithms: PainFree SST trial primary results. Heart Rhythm. 12: 926–936.
  17. Saeed M, Hanna I, Robotis D, Styperek R, Polosajian L, et al. (2014) Programming implantable cardioverter-defibrillators in patients with primary prevention indication to prolong time to first shock: results from the PROVIDE study. J Cardiovasc Electrophysiol. 25: 52–59.
  18. Scott PA, Silberbauer J, McDonagh TA, Murgatroyd FD (2014) Impact of prolonged implantable cardioverter-defibrillator arrhythmia detection times on outcomes: a meta-analysis. Heart Rhythm 25: 52–59.
  19. Peterson PN, Greenlee T, Go A S, Magid DJ, Cassidy-Bushrow A, et al. (2017) Comparison of Inappropriate Shocks and Other Health Outcomes Between Single- and Dual- Chamber Implantable Cardioverter- Defibrillators for Primary Prevention of Sudden Cardiac Death: Results From the Cardiovascular Research Network Longitudinal Study of Implantable Cardioverter- Defibrillators. J Am Heart Assoc 6(11).
  20. Ruiz-Granell R, Dovellini EV, Dompnier A, Khalighi K, García-Campo E, et al. (2019) Algorithm-based reduction of inappropriate defibrillator shock: Results of the Inappropriate Shock Reduction wIth PARAD+ Rhythm DiScrimination–Implantable Cardioverter Defibrillator Study. Heart Rhythm in press 16: 1429–1435.
  21. Swerdlow CD, Asirvatham SJ, Ellenbogen KA, Friedman PA (2014) Troubleshooting Implanted Cardioverter Defibrillator Sensing Problems I Circulation: Arrhythmia and Electrophysiology. 7:1237–1261.
  22. Powell BD, Asirvatham SJ, Perschbacher DL, Jones PW, Cha YM, et al. (2012) Noise, artifact, and oversensing related inappropriate ICD shock evaluation: ALTITUDE noise study. Pacing Clin Electrophysiol 35: 863–869.
  23. Mozes A, DeNofrio D, Pham DT, Homoud MK (2011) Inappropriate implantable cardioverter-defibrillator therapy due to electromagnetic interference in patient with a HeartWare HVAD left ventricular assist device. Heart Rhythm 8: 778–780.

Bowel endometriosis treatment with robotic assisted laparoscopic resection – Is it a feasible alternative to laparoscopic approach?

DOI: 10.31038/NAMS.2019235

Introduction

Endometriosis is a gynecologic disorder defined by the presence of the endometrial gland and stroma outside the uterus. Deep infiltrating pelvic endometriosis with bowel involvement is one of the most aggressive forms and can cause infertility, chronic pelvic pain, pain at defecation, and altered quality of life.

Bowel endometriosis involvement is estimated to occur in 5.3% to 12% of women with endometriosis. In specialized centers, its prevalence can reach 35% among women with deep infiltrating endometriosis. The rectum and sigmoid together account for 70% to 93% of all intestinal endometriotic sites.

Rectovaginal and recto-sigmoid endometriosis are generally associated with severe progressively debilitating abdominal and pelvic pain, which markedly affects the quality of life in most the patients. Currently available medical approaches are equally effective in the treatment of endometriosis-associated pain, producing temporary relief of symptoms, but none has yet been shown to achieve a long-term cure. For these reasons, surgery needs to be considered the first treatment of choice [1].

Since the first case of laparoscopic sigmoid resection for endometriosis published by Redwine and Sharpe, few studies have confirmed the feasibility of laparoscopic colorectal resection for endometriosis.

The management of intestinal endometriosis depends on the depth of the bowel wall invasion [superficial, partial, or full-thickness invasion], leading to different surgical options [from disc excision to segmental resection]. It has been reported that the best results in terms of recurrence rates and improvement of symptoms are achieved by intestinal resection when the muscularis is compromised.

On the other hand, robotic technology and telemanipulation systems represent the latest developments in minimally-invasive surgery. They offer improved ergonomic position of the surgeon, three-dimensional visualization of the operating field, fine instrumentation and increased maneuverability of the instruments. These key features allow complex minimally invasive procedures to be performed more easily than with conventional laparoscopic surgery. The feasibility of a variety of robotic-assisted surgical procedures in gastrosurgery such as cholecystectomy, colorectal resection, cardiomyotomy, and even esophagectomy has been demonstrated in many papers in the last decade. Several limitations of conventional endoscopic tools, such as limited instrument mobility or decreased ergonomics, have been partially overcome with the use of robotics.

Results

From September 2009 to January 2019, we have selected 134 patients with colorectal endometriosis referred to our private clinic [Centro de Endometriose São Paulo, São Paulo, Brazil] for the robotic approach. All patients had clinical and imaging diagnosis of deep infiltrating colorectal endometriosis evolving at least the muscularis of rectum or sigmoid. All these women were submitted to a robotic assisted retosigmoidectomy with a mean operative time of 120 minutes. Regarding complications blood loss was insignificant [near zero] in all cases and there weren’t any intra-operative or post-operative complications [as pneumonia, anastomotic or rectovaginal fistula, abdominal collections, long term ileus, intestinal adhesions]. None of the patients had ileostomy or colostomy and mean hospital stay was 3 days.

Sixty one patients had infertility before surgery, with a mean infertility time of 2 years. After 12 months of follow-up period, 28 [46%] women conceived naturally, and in 120 [90%] women symptoms as dysmenorrhea, dyspareunia and dyschezia, intestinal cramping, diarrhea or constipation completely disappeared.

Discussion

Deep infiltrating endometriosis is a challenge for laparoscopic pelvic surgeons. This series demonstrates that deep infiltrating endometriosis is a condition that requires interdisciplinary approach in order to obtain optimal clinical and medical results.

Deep infiltrating endometriosis cases are difficult to manage and require specific skills in laparoscopic, robotic and colorectal surgery. These procedures are relatively safe and in the context of close collaboration between gynaecologists and surgeons, it presents low morbidity and mortality.

Important issue is that these procedures require adequate training and also short and long term results after the treatment of deeply infiltrating lesions are strictly operator-dependent. A multidisciplinary approach to manage deep pelvic endometriosis is mandatory in order to offer patients the best possible treatment using the combined skills of the colorectal and gynecologic surgical teams. [2]

As we know, the risk of complications depends on clinical conditions, vascular preservation, nerve preservation, the extension of endometriosis infiltration, and the surgeon’s experience.

The use of robotic assistance provided a very precise dissection of the pelvic area, allowing good visualization of the pelvic plexus nerves, thus providing resection without nerve injury. The stable camera and the freedom of movement allow a very delicate and accurate dissection, as well as identification and preservation of the superior hemorrhoidal artery, providing good irrigation to the rectal stump and diminishing the incidence of rectal fistula. We did not have any complications in this series, such as fistula, local pain, nerve injury, or fecal or urinary incontinence, due to our previous large series in laparoscopic treatment for endometriosis and the association of the robotic technology in these cases. [3]

The main concern about robotic surgery is the cost, including the capital and ongoing maintenance charges. Robotic rectal surgery is constantly increasing over the years. Previous reviews have already demonstrated its safety and feasibility [4-6], although there are not published studies demonstrating its superiority over the laparoscopic approach mainly due to the lack of randomized control trials. This lack of evidence about the effectiveness of robotic rectal surgery is in contrast with the overall opinion of surgeons that report an easier surgical approach especially to narrow and difficult anatomic spaces such as the pelvis [7].

Conclusions

In conclusion, results from the present study demonstrate that robotic surgery is as feasible and safe as conventional laparoscopy in the treatment of colorectal endometriosis. The magnified view, the improved ergonomics and dexterity might improve the diffusion of minimally invasive approach in the treatment of deep infiltrating endometriosis, mainly evolving recto sigmoid area.

Further randomized studies should address the role of robotics for the treatment of deep infiltrating endometriosis.

References

  1. Pierre Collinet , Pierre Leguevaque,  Rosa Maria Neme,  Vito Cela,  Peter Barton-Smith, et al. (2014) Robot-assisted laparoscopy for deep infiltrating endometriosis: international multicentric retrospective study. Surg Endosc 28: 2474–9.
  2. Sparić R, Hudelist G Keckstein J (2011) Diagnosis and treatment of deep infiltrating endometriosis with bowel involvement: a case report. Srp Arh Celok Lek139: 531–5.
  3. Neme RM, Schraibman V, Okazaki S, Maccapani G, Chen WJ, et al. (2013) Deep infiltrating colorectal endometriosis treated with robotic-assisted rectosigmoidectomy. JSLS 17: 227–34.
  4. Mirnezami AH, Mirnezami R, Venkatasubramaniam AK, Chandra­ kumaran K, Cecil TD, et al. (2010) Robotic colorectal surgery: hype or new hope? A systematic review of robotics in colorectal surgery. Colorectal Dis 12: 1084­–1093
  5. Scarpinata R, Aly EH (2013) Does robotic rectal cancer surgery offer im­ proved early postoperative outcomes? Dis Colon Rectum  56: 253­–262
  6. Mak TW, Lee JF, Futaba K, Hon SS, Ngo DK, Ng SS (2014) Robotic surgery for rectal cancer: A systematic review of current practice. World J Gastrointest Oncol 6: 184­–193
  7. Fabio Staderini, Caterina Foppa, Alessio Minuzzo, Benedetta Badii, Etleva Qirici, et al. (2016) Robotic rectal surgery: State of the art. World J Gastrointest Oncol 8: 757–771.

The Cognitive Economics of OTC Health: A Mind Genomics Exploration

DOI: 10.31038/JPPR.2019242

Abstract

Using the paradigms of Mind Genomics, consumers evaluated different combinations of brand, features, and performance of antacids, with the former elements combined into small, easy-to-read combinations (vignettes.) Each respondent rated a unique set of 63 vignettes on two attributes, interest in the product, and price that would be paid for a week supply of the product. The deconstruction of the vignettes into the contribution of components revealed large differences in the contribution of the components of the vignette to both interest and to price. The strongest performing elements dealt with the specific uses of the product.  Price covered with interest, with some anomalies, the most striking being the high price assigned to a well-known expensive brand, (brand) Zantac, which did not perform well in terms of interest. Respondent thus ‘know’ price from their experience, and do not simply assign higher prices to elements they like. The mind-set segments were complex, showing that even with as many as four mind-sets, consumer lump together product features, and performance.

Introduction

In 2012 author HRM was asked by the new owner of one of the old-brand antacids to help understand the ‘mind of the antacid user.’ The objective of the researcher was to uncover both the messages to which an antacid user would respond, and to understand the cognitive economics of these messages, specifically how much was each message worth in dollars and cents.  The objectives were both business and scientific. The business application was to refresh the messaging. The scientific application was to create a base of knowledge about the mind of the OTC consumer. Most of the information extant to date was either store-information from the ‘trade,’ or the data from a set of disconnected short reports from market researchers about the product, data that could easily be woven into a single coherent database.

The data reported here come from that study, owned in its entirety by author HRM, and thus available for publication. The importance of the paper is both substantive, revealing the mind of the consumer, and methodological, showing how to understand both what is important, and the value of that importance.

Anti-acid drugs, available on prescription by a physician, possess the potential to block gastric digestion of food allergens and consequently elevate the risk for food sensitization [1–4].

Over-The-Counter (OTC) antacids also increase the gastric pH, in turn increasing the risk for sensitization against food allergens, even to those that are usually digestion-labile [5]. The increasing medical concern with the widespread usage of antacids world-wide may be partly correlated with the recognition of the dramatic increase in food allergies during the past decades.  The broadest use of antacids is in the US. In the richer, more developed West European countries (Germany, Belgium, Italy and the UK) antacids also play a remarkable role. In Latin American countries, Mexico, Argentina, Brazil antacids are used less frequently. Furthermore, the antacids used in these Latin American countries are different brands and different formulations, versus the formulations and brands used by West Europeans [6] there are many similarities in preferences and patterns of antacids use between countries, but most antacids used are OTC, and most regular users keep a stock of them. National variations between Europeans and Americans partly explained by cultural differences that shape one’s perceptions regarding symptoms affecting their treatment needs, preferences and expectations [7].

In contrast to Europeans, Americans consume several brands that they freely obtain from drug stores reflecting a broad OTC market but. Furthermore, in the US antacids are used not only as a treatment for symptoms of gastro-esophageal reflux but for other disease with similar symptoms [8] The widespread use of antacids is not limited to those who report occasional heartburn, but rather antacids are used widely for other issues that the patient self-treats [9].

Furthermore, antacids have become the most commonly prescribed medication for patients with ISB (irritable bowel syndrome), rather than for the original use to treat reflux disease [10]. This popularity of antacids may be explained by patients’ expectations for a treatment to provide a quick, long lasting relief. As a consequence, the use of antacids may be expected to increase in the future because it drives patient satisfaction, may improve clinical outcomes, together the components for a useful medical intervention [11].

Studies on patient expectations from antacids and proper communication regarding their safe use are scarce. The ongoing, indiscriminate use of antacids for a broad range of abdominal diseases, increase the gastric pH and the risk for sensitization to food allergens. It is relevant at the psychological level to understand how people perceive antacids, what they expect from treatment with antacids and to what extent they are aware of long- term risks of its wide use for diseases other than gastro-esophageal, acid reflux.

This study focuses on mapping patient perceptions and expectations, uncover general trends for the total population, and searching for mind-set segments, different groups of individuals who perceive the use and benefit of antacids in different ways. The study is part of the effort of Mind Genomics, an emerging science, to drive better medical outcomes by understanding the ‘mind of the patient’ and the ‘mind of the health professional,’ in order to create better communications by the health professionals, and better outcomes for the patient.

Method

The approach we used is known by the rubric of Mind Genomics. Simply stated, Mind Genomics quantifies ideas on different dimensions, and uncovers new-to-the-world minds-sets of people, groups of individuals who are similar in the pattern of responses to the particular stimulus.  The methods of Mind Genomics derive from the statistical discipline of experimental design [12], wherein the independent variables are complete messages of ideas.  Applications of Mind Genomics have ranged from food to drugs to jewelry, and so forth [13].

Mind Genomics began as a topic in mathematical psychology, ‘Conjoint Measurement’ [14] The approach, experimental design of ideas, found ready interest in marketing, led by pioneer researcher Paul Green and his colleagues at the Wharton School of Business of the University of Pennsylvania [15,16]. The underlying science of conjoint measurement has thus almost a 60- year history, but it is during the past 25 years, that the approach has found wide use in applications, perhaps because the method migrated from a custom set up to an ad hoc, DIY (do-it-yourself) system [17,18].

Mind Genomics follows these steps to uncover what motivates people.

  1. Identify questions and their answers. The metaphor of questions and answers makes the task easier for those who are just beginning to explore the mind of people in this manner. People find asking questions to be easy. It is the specific questions which are hard. Once the questions are framed, it becomes easy to formulate answers.  This study used seven questions, each with five answers (a so-called 7×5 design). The questions (and answers) appear in Table 1.
  2. The questions tell the story. The answers provide the detail. It is the combination of answers from different questions which become the vignettes that the respondents will rate in the actual evaluation. As Table 1 shows, the answers are not specific permutations of the question, but rather different ‘snapshots.’ The questions become simply the means by which to elicit the answers in the preparatory portion of the research, ahead of the actual evaluations. The respondents never see the questions, but rather only see the answers.
  3. The specific choice of questions and answers addressed dual. The first objective was to understand the decision criteria of people regarding antacids. This was the scientific criterion. The second objective was to use these data to help reposition one of the antacids for the commercial market. The second objective, repositioning the antacid, required us to study brand as the first question, although the actual position of the brand name in the test vignettes (combinations of answers) could have been in any one of the different positions.
  4. The answers are combined by experimental design into vignettes, combinations comprising 2–4 answers. Each answer appeared six times across the 63 vignettes and was absent 57 times.  The experimental design thus creates incomplete vignettes. Although some practitioners using experimental design insist on having each vignette complete, with one answer from each of the seven questions, that approach is rife with problems, such as multi-collinearity (lack of independence of the answers as predictor variables in regression), and the sheer difficulty of reading 63 vignettes of seven elements each. The strategy used here ensures statistical independence, and reduces the onerousness of the task, an important consideration in this type of research.
  5. The respondents rated each vignette twice, first on interest, and second on price that they would pay.  We selected five price points and presented them in the same irregular order. The decision to present the prices in irregular order was based on the desire to make sure that there was no similar pattern in answers to the two rating scales, so that a respondent interested in a product description would ordinary select a higher price. The presentation in irregular order removes that possible bias.
  6. Figure 1 shows an example of a vignette comprising three answers, and the rating on the bottom for the first question. The same vignette was presented, but the question changed, this time instructing the respondent to select a price.
  7. The respondents were run with a panel company (Turk Prime, Inc.), specializing in on-line panels of this type. The respondents are already members of the panel, for which they receive incentives, distributed by the panel company. Figure 2 shows the orientation page sent to those respondents who agreed to participate. The orientation itself gives little information about the topic of the study, other than it deals with an antacid treatment. The rest of the orientation focuses on the time for the interview, the two questions, and the instruction to consider the entire screen (the full vignette) as one idea.
  8. At the end of the respondent’s evaluation of the 63 vignettes on the two rating questions, the respondent completed a detailed self-profiling classification, which instructed the respondent to profile WHO the respondent is, WHAT the respondent believes to be important in an antacid, what BEHAVIORS the respondent follows when taking an antacid (e.g., frequency), and finally, and from what MEDICAL conditions relevant to an antacid does the respondent suffer. This information provides the means by which to analyze the results provided by different, pre-defined groups of respondents. We focus our analysis on total panel, on gender (showing little difference), and on mind-set segment (showing far more differences.)

MIND GENOMICS-034_JPPR_F1

Figure 1. Example of three-answer vignette and the rating scale on the bottom for Question #1 (interest).

MIND GENOMICS-034_JPPR_F2

Figure 2. The orientation page shown to the respondent at the start of the web-based experiment.

Table 1. The seven questions and the five answers/question.

What is the brand name of the product?

A1

(brand) Zantac

A2

(brand) Tums

A3

(brand) Briosche

A4

(brand) Alka-Seltzer

A5

(brand) Mylanta

What is the form of the product?

B1

In pill form

B2

In liquid form

B3

In chewable tablets

B4

In fizzy tablets

B5

In capsules

What is unusual and/or special about the product?

C1

Faster … more complete absorption of this effervescent antacid versus conventional tablets

C2

All natural and aspirin free … It’s simply a great product!

C3

Some antacids contain aluminum hydroxide or calcium carbonate, which can cause constipation … NOT US!

C4

For over 125 years we provided heartburn treatment the world over

C5

Though over-the-counter antacids are considered safe & effective … not all antacids are for every “body”

How does the product taste?

D1

No taste betrays the fact that this is an antacid

D2

Available in three great tasting flavors: Smooth Lemon Creme, Smooth Mint Creme, and Smooth Cherry Crème”

D3

Tastes like a milk shake!

D4

Does not taste “pasty or chalky” like most popular antacids

D5

With its crisp, clean lemon taste, it’s a pleasure to take to relieve your symptoms!

How does it relieve your heartburn, and how then do you feel?

E1

Relieves your heartburn, acid indigestion, and upset stomach without unnecessary chemicals, ingredients, or preservatives

E2

Has 600 mg of calcium in each dose, which helps to treat osteoporosis … two benefits in one!

E3

Enjoy all of your favorite foods without the threat of heartburn holding you back

E4

Starts to work instantly

E5

It’s also great in relieving nausea, and helps with a hangover too

How do you get it and use it?

F1

Just pour a capful (or a foil pack) into 4oz of water and within 10 seconds relief is on its way!

F2

This antacid is available through most retail drug stores, food stores, or mass merchandisers

F3

The expiration date on our product is for 5 years!

F4

With 12 child friendly handy dandy foils … makes sure your child has relief close by whether they are at home, going to a friend’s or throwing an awesome birthday party!

F5

Dissolves in your mouth …  you don’t need water to swallow it

Who uses it, and for what?

G1

Antacids can provide fast, safe relief for your pregnancy heartburn

G2

Antacids are frequently given to babies to reduce the acidity of stomach contents which are refluxed into the food pipe

G3

The same medication in different forms … for people who need to have different methods to choose from

G4

For people with occasional, mild to moderate symptoms of heartburn, antacids are often all that is needed to control the symptoms

G5

Pain, gas, indigestion … relieve the symptoms and recover from overeating by taking an over-the-counter antacid

Creating the Data for Analysis

We follow a specific pattern of data analysis, one laid down over 35 years of research. The objective of the analysis is to use OLS (ordinary least-squares) regression to deconstruct the ratings into the contribution of the individual answers, i.e., the 35 elements. In the OLS regression, the 35 elements will become the independent variables, and the ratings, or more correctly the transformed ratings, will become the dependent variables.

We follow these steps:

  1. Transform the ratings from Question #1 (interest in buying) from a 9-point scale to a 2-point scale. Ratings of 1–6 are transformed to 0. Ratings of 7–9 are transformed to 100. A small random number (<10-5) is added to the newly created binary values in order to create some small variation in the transformed ratings, so that the regression modeling does not crash.  The transformation moves us from the consideration of responses as ‘degree of interest’ to no/yes, might or might not buy, would not buy (ratings 1-6), or would buy (ratings 7-9). The transformation is done in the interest of interpretability, because the reality is that it is easier to understand the meaning of no/yes than to understand the meaning of a scale value.
  2. Transform the selection of prices from Question #2 to the actual dollar value specified by the questionnaire. Again, add a very small random number (<10-5) to ensure that the regression model does not crash in those cases when the respondent selects the same price for all vignettes evaluated.
  3. Considering the data from Question #1 (interest), run a simple OLS regression model relating the presence/absence of the 35 elements to the binary ratings. The regression model is run at the level of the individual respondent, after the ratings have been transformed. The corresponding coefficients are averaged across all the relevant respondents in the subgroup.   The equation is written as follows:

    Binary Rating (Question #1) = k0 + k1(A1) + k2(A2)… k35(G5)

  4. Following the above-described approach and considering the data from Question #2 (price in dollars and cents), run a second, simple OLS regression relating the presence/absence of the 35 elements to the price paid.  The equation does not have an additive constant, because of the ingoing assumption that no one would pay any money without knowing about the product.  The equation is written as follows:

    Price Selection (Question #2) = k1(A1) + k2(A2) … k35(G5)

Results – Total Panel

Table 2 shows the summary statistics from the total panel.

Table 2. Coefficients for the additive models showing the contribution to interest and to price, respectively.


 Total Panel (n=201)

INT

Price

Additive constant

13

E5

It’s also great in relieving nausea, and helps with a hangover too

12

1.60

E2

Has 600 mg of calcium in each dose, which helps to treat osteoporosis … two benefits in one!

11

1.67

E1

Relieves your heartburn, acid indigestion, and upset stomach without unnecessary chemicals, ingredients, or preservatives

10

1.70

D2

Available in three great tasting flavors: Smooth Lemon Creme, Smooth Mint Creme, and Smooth Cherry Crème”

9

1.55

E4

Starts to work instantly

9

1.55

D3

Tastes like a milk shake!

8

1.49

G5

Pain, gas, indigestion … relieve the symptoms and recover from overeating by taking an over-the-counter antacid

8

1.15

A1

(brand) Zantac

8

1.61

E3

Enjoy all of your favorite foods without the threat of heartburn holding you back

7

1.37

G4

For people with occasional, mild to moderate symptoms of heartburn, antacids are often all that is needed to control the symptoms

6

1.22

G1

Antacids can provide fast, safe relief for your pregnancy heartburn

6

1.06

A2

(brand) Tums

6

1.04

B3

In chewable tablets

6

1.06

G3

The same medication in different forms … for people who need to have different methods to choose from

5

1.04

B5

In capsules

4

1.22

C4

For over 125 years we provided heartburn treatment the world over

4

1.32

D5

With its crisp, clean lemon taste, it’s a pleasure to take to relieve your symptoms!

3

1.27

B1

In pill form

3

1.18

C2

All natural and aspirin free … It’s simply a great product!

3

1.46

F1

Just pour a capful (or a foil pack) into 4oz of water and within 10 seconds relief is on its way!

2

1.35

C1

Faster … more complete absorption of this effervescent antacid versus conventional tablets

2

1.35

F2

This antacid is available through most retail drug stores, food stores, or mass merchandisers

2

1.11

C3

Some antacids contain aluminum hydroxide or calcium carbonate, which can cause constipation … NOT US!

2

1.28

G2

Antacids are frequently given to babies to reduce the acidity of stomach contents which are refluxed into the food pipe

2

1.05

D4

Does not taste “pasty or chalky” like most popular antacids

2

1.30

F5

Dissolves in your mouth …  you don’t need water to swallow it

2

1.26

B2

In liquid form

0

1.12

D1

No taste betrays the fact that this is an antacid

0

1.08

A4

(brand) Alka-Seltzer

0

0.94

F3

The expiration date on our product is for 5 years!

0

1.36

B4

In fizzy tablets

0

0.89

C5

Though over-the-counter antacids are considered safe & effective … not all antacids are for every “body”

0

1.10

A3

(brand) Briosche

-1

1.08

A5

(brand) Mylanta

-1

1.14

F4

With 12 child friendly handy dandy foils … makes sure your child has relief close by whether they are at home, going to a friend’s or throwing an awesome birthday party!

-2

1.12

The basic interest in the product is 13. This means that without any additional information about the antacid, only about 13% of the respondents would assign a rating of 7-9, a strong positive rating for interest. It is the answers, the elements of the vignette, which must do the work. By itself, the antacid is not of much interest, at least to the total panel.

The strongest elements or answers to questions for the respondents are those which talk about ‘relief’ or ‘treatment.’ It is the concrete claim which is convincing. These three are the following:

It’s also great in relieving nausea, and helps with a hangover too

Has 600 mg of calcium in each dose, which helps to treat osteoporosis … two benefits in one!

Relieves your heartburn, acid indigestion, and upset stomach without unnecessary chemicals, ingredients, or preservatives

There is a generally positive relation between the price one is willing to pay and the interest in the feature. Table 2 shows these part-worth dollar values. Figure 3 shows the scatterplot for the 35 answers, with the abscissa showing the interest in the element, and the ordinate showing the price that one is willing to pay. The OLS regression enables us to deconstruct the price into the part-worth contributions of the 35 answers or elements, just as OLS regression enabled us to deconstruct the binary rating into the part-worth contributions.  As we saw for the interest coefficients, the highest prices are associated with the direct benefits from usage (relieve nausea, treats osteoporosis, relieves heartburn.) There is one more high price, that associated with brand (brand) Zantac, not so much because of the interest in brand (brand) Zantac, but more likely because of the generally higher price one pays for brand (brand) Zantac.

MIND GENOMICS-034_JPPR_F3

Figure 3. Scatterplot showing the relation between the coefficient for the price model (ordinate) and the corresponding coefficient for the interest mode (abscissa). The equation is: Price = 1.106 + 0.04(Interest). The correlation is 0.67.

Gender Differences are Minor

One of the first questions asked by researchers is whether there are gender differences. With around 100 respondents of each gender, we can answer that question easily for the case of antacids. Table 3 shows that the additive constant is slightly higher for females than for males (16 versus 9), but both are very low.  For the most part, the coefficients are similar; except for a large difference in element E2 (Has 600 mg of calcium in each dose, which helps to treat osteoporosis … two benefits in one!).  Osteoporosis affects women far more than it affects men. The coefficient for this element among women is the highest (coefficient = 15).

Table 3. Comparing male and female coefficients for the strongest performing elements.


Total

Male

Female

Base Size

201

88

113

Additive constant

13

9

16

E5

It’s also great in relieving nausea, and helps with a hangover too

12

9

14

E2

Has 600 mg of calcium in each dose, which helps to treat osteoporosis … two benefits in one!

11

5

15

E1

Relieves your heartburn, acid indigestion, and upset stomach without unnecessary chemicals, ingredients, or preservatives

10

12

10

D2

Available in three great tasting flavors: Smooth Lemon Creme, Smooth Mint Creme, and Smooth Cherry Crème”

9

9

10

D3

Tastes like a milk shake!

9

10

8

E4

Starts to work instantly

9

9

8

G5

Pain, gas, indigestion … relieve the symptoms and recover from overeating by taking an over-the-counter antacid

8

8

8

A1

(brand) Zantac

8

7

8

G4

For people with occasional, mild to moderate symptoms of heartburn, antacids are often all that is needed to control the symptoms

6

8

5

Mind-Sets

One of the fundamental features of Mind Genomics is its establishment of so-called mind-sets, i.e., groups of ideas which naturally move together. These mind-sets are discovered by clustering together respondents based upon the pattern of their coefficients, in this case the 35 coefficients from the models created when we relate the presence/absence of the 35 elements to the rating of interest.

The method used to identify these mind-sets comes from the category of approaches known as cluster analysis [19]. Clustering is a well-accepted general approach to finding similar-behaving groups of objects, in our case similar-behaving groups of ideas or people. We use clustering, combining it with both people and with ideas, respectively.  When we cluster the people, we are really looking for combinations of ideas which naturally move together, discovering those combinations using the people (our respondents) as the natural ‘carriers of the ideas.’

The notion of dividing people by the way they think is not new. Pioneer research William Wells discussed psychographics in the early 1960’s, with psychographics turning into the clustering or division of people into like-minded groups, based upon how the way they perceive the world, and how they act in their everyday lives.  Psychographics works from the general to the particular, dividing people into general groups, such as those who are ‘ecology-oriented’ versus others who are ‘consumption oriented.’  In contrast, the approach espoused here, Mind Genomics, works from the specific up to the general, taking a ‘pointillist’ approach. That is, for Mind Genomics, there are no general groups of people, but simply groups emerging from specific situations, and specific topics [20].

The method of k-means clustering used allows us to divide our 201 respondents into as many groups as we want, with the property that the variability within a group or cluster is relatively small (the patterns of the coefficients are similar), whereas the variability across the means of the coefficients from cluster to cluster is large (the patterns of the coefficients are different from cluster to cluster.)

Cluster analysis can extract from 2-201 clusters for our data. The objective of the analysis is to minimize the number of clusters (parsimony) while making the clusters easy to understand (interpretability.)  Extracting too few clusters produces hard-to-understand, unclear results. Extracting too many clusters creates a mountain of results which makes it hard to comprehend the underlying structure of the different mind-sets.

Table 4 shows the strongest performing elements (answers) after the extraction of two mind-sets, the most parsimonious solution emerging from cluster analysis. Only the elements with coefficients of 8 or higher are shown. It is clear from Table 4 that although the cluster analysis emerges with the most parsimonious of solutions, the interpretability of the solutions is low. There are simply too many different types of elements performing well in the emergent mind-sets. One could always stretch one’s definition to make sense of the disparate elements, but the objective of clustering is to simplify, not to create new groupings that are difficult to comprehend. It is the sense of ‘intuitive simplicity’ that is important in clustering, not the creation of new-to-the-world combinations of ideas.

Table 4. Strong performing elements for antacids from the two-segment solution.


Total

Mind-Set 1

Mind-Set 2

Base Size

201

80

121

Additive constant

13

10

15

Mind-Set 1 – Focus on brand

A1

(brand) Zantac

8

20

-1

E5

It’s also great in relieving nausea, and helps with a hangover too

12

13

11

A4

(brand) Alka-Seltzer

0

11

-7

A2

(brand) Tums

6

11

3

A5

(brand) Mylanta

-1

8

-8

Mind-Set 2 – Focus on flavor, and on traditional uses

D2

Available in three great tasting flavors: Smooth Lemon Creme, Smooth Mint Creme, and Smooth Cherry Crème”

9

0

16

E2

Has 600 mg of calcium in each dose, which helps to treat osteoporosis … two benefits in one!

11

7

13

E1

Relieves your heartburn, acid indigestion, and upset stomach without unnecessary chemicals, ingredients, or preservatives

10

6

13

D3

Tastes like a milk shake!

9

3

12

G5

Pain, gas, indigestion … relieve the symptoms and recover from overeating by taking an over-the-counter antacid

8

3

11

G1

Antacids can provide fast, safe relief for your pregnancy heartburn

6

0

10

E4

Starts to work instantly

9

7

9

G4

For people with occasional, mild to moderate symptoms of heartburn, antacids are often all that is needed to control the symptoms

6

3

8

B3

In chewable tablets

6

2

8

G3

The same medication in different forms … for people who need to have different methods to choose from

5

2

8

We see a somewhat more reasonable result in Table 5, when we extract three clusters or mind-sets, instead of two. The mind-sets are still not quite ‘crisp,’ comprising as they do different types of messages.

Table 5. Strong performing elements for antacids from the three-segment solution.

Total

Mind- Set 1

Mind- Set 2

Mind- Set 3

Base Size

201

32

121

48

Additive constant

13

17

15

5

Mind-Set 1 – Focus on brand, purchase, and traditional use

A1

(brand) Zantac

8

24

-1

18

A4

(brand) Alka-Seltzer

0

12

-7

11

F2

This antacid is available through most retail drug stores, food stores, or mass merchandisers

2

12

1

-1

G4

For people with occasional, mild to moderate symptoms of heartburn, antacids are often all that is needed to control the symptoms

6

9

8

-1

E2

Has 600 mg of calcium in each dose, which helps to treat osteoporosis … two benefits in one!

11

8

13

6

Mind-set 2 – Focus on flavor, and on traditional uses

D2

Available in three great tasting flavors: Smooth Lemon Creme, Smooth Mint Creme, and Smooth Cherry Crème”

9

-3

16

2

E1

Relieves your heartburn, acid indigestion, and upset stomach without unnecessary chemicals, ingredients, or preservatives

10

1

13

10

D3

Tastes like a milk shake!

9

6

12

2

E5

It’s also great in relieving nausea, and helps with a hangover too

12

7

11

16

G5

Pain, gas, indigestion … relieve the symptoms and recover from overeating by taking an over-the-counter antacid

8

5

11

2

G1

Antacids can provide fast, safe relief for your pregnancy heartburn

6

6

10

-5

E4

Starts to work instantly

9

7

9

7

B3

In chewable tablets

6

-4

8

6

G3

The same medication in different forms … for people who need to have different methods to choose from

5

7

8

-2

Mind-Set 3 – Melange of assorted messages

C4

For over 125 years we provided heartburn treatment the world over

4

-4

2

14

A2

(brand) Tums

6

7

3

14

C1

Faster … more complete absorption of this effervescent antacid versus conventional tablets

2

-2

-1

12

C2

All natural and aspirin free … It’s simply a great product!

3

0

1

11

A5

(brand) Mylanta

-1

6

-8

10

B2

In liquid form

1

-9

-1

9

D5

With its crisp, clean lemon taste, it’s a pleasure to take to relieve your symptoms!

3

-3

3

9

A3

(brand) Briosche

-1

4

-6

9

E3

Enjoy all of your favorite foods without the threat of heartburn holding you back

7

3

7

8

C5

Though over-the-counter antacids are considered safe & effective … not all antacids are for every “body”

0

-7

-2

8

B5

In capsules

4

1

4

8

When we look at four mind-sets we see a slight ‘sharpening’ of the clusters, but there is still no hint that we are going to get one cluster focusing, say, on flavor, another on brand, another on usage, and so forth (see Table 6)

Table 6. Strong performing elements for antacids from the four-segment solution.

Total

Mind- Set 1

Mind- Set 2

Mind- Set 3

Mind- Set 4

Base Size

201

32

72

48

49

Additive constant

13

17

13

5

18

Mind-Set 1 – Focus on brand, purchase, and traditional use

A1

(brand) Zantac

8

24

-4

18

3

A4

(brand) Alka-Seltzer

0

12

-3

11

-13

F2

This antacid is available through most retail drug stores, food stores, or mass merchandisers

2

12

-2

-1

5

G4

For people with occasional, mild to moderate symptoms of heartburn, antacids are often all that is needed to control the symptoms

6

9

10

-1

5

E2

Has 600 mg of calcium in each dose, which helps to treat osteoporosis … two benefits in one!

11

8

16

6

9

Mind-Set 2 – Sensory seekers, focus on issues from eating

D2

Available in three great tasting flavors: Smooth Lemon Creme, Smooth Mint Creme, and Smooth Cherry Crème”

9

-3

28

2

-3

D3

Tastes like a milk shake!

9

6

27

2

-10

G5

Pain, gas, indigestion … relieve the symptoms and recover from overeating by taking an over-the-counter antacid

8

5

19

2

0

E5

It’s also great in relieving nausea, and helps with a hangover too

12

7

15

16

6

G1

Antacids can provide fast, safe relief for your pregnancy heartburn

6

6

14

-5

5

D4

Does not taste “pasty or chalky” like most popular antacids

2

-7

13

-1

-6

E1

Relieves your heartburn, acid indigestion, and upset stomach without unnecessary chemicals, ingredients, or preservatives

10

1

12

10

15

D5

With its crisp, clean lemon taste, it’s a pleasure to take to relieve your symptoms!

3

-3

10

9

-9

E4

Starts to work instantly

9

7

10

7

9

E3

Enjoy all of your favorite foods without the threat of heartburn holding you back

7

3

10

8

4

G3

The same medication in different forms … for people who need to have different methods to choose from

5

7

8

-2

7

Mind-Set 3 – Focus on brands and forms

C4

For over 125 years we provided heartburn treatment the world over

4

-4

2

14

1

A2

(brand) Tums

6

7

0

14

7

C1

Faster … more complete absorption of this effervescent antacid versus conventional tablets

2

-2

-1

12

0

C2

All natural and aspirin free … It’s simply a great product!

3

0

-1

11

4

A5

(brand) Mylanta

-1

6

-7

10

-9

B2

In liquid form

1

-9

5

9

-9

A3

(brand) Briosche

-1

4

-9

9

-1

C5

Though over-the-counter antacids are considered safe & effective … not all antacids are for every “body”

0

-7

-5

8

2

B5

In capsules

4

1

3

8

5

Mind-Set 4 – Miscellaneous

B3

In chewable tablets

6

-4

4

6

15

F3

The expiration date on our product is for 5 years!

0

5

-2

-8

8

From our efforts to divide the respondents into different mind-sets we see that in the case of antacids we have some elements or answers which emerge quickly, such as flavor and certain kinds of benefits (e.g., due to nausea.) Nonetheless, the mind-set segmentation for antacid remains puzzling, perhaps because the product combines brand, form, and function in a way that is hard to dissociate easily. Whether this continued mixing of different types of ‘messages’ in a cluster will continue as we continue to extract an increasing number of clusters is not relevant here. What is relevant is the discovery of a new type of product, where it appears difficult to dissociate form, function, and benefit.

How Does Brand Interact with the Different Answers to Drive Price?

The systematized permutation approach used by Mind Genomics assures that set of 63 x 201 vignettes (12,663) cover a wide number of combinations, rather than 63 combinations repeated 201 times, once for each respondent [21]. The strategy of Mind Genomics is insight through directly measuring much of the stimulus space. The strategy of conventional research is insight by covering just a little of the stimulus space, doing so with reduced variability in the estimation through replication or through reducing external ‘noise’ that could affect the results.

The strategy of massively increase coverage has a benefit, namely it allows the stratification of the vignettes by brand. That is, the 12,663 vignettes can be stratified into six sets of vignettes, one set for vignettes with each brand, including a set for vignettes with no brand. The full set of respondents contributes to each stratum, so the regression analyses must be run on a group basis. That is, the power of a ‘within-subjects design’ is sacrificed, but in its place is a sense of how the same elements perform in the presence of different brands.

Table 7 shows the nature of the interaction between brand and elements. The elements are sorted from high to low, based upon the price that is estimated for the element in the absence of brand. Thus, element E2 (Has 600 mg of calcium in each dose, which helps to treat osteoporosis … two benefits in one!) has the highest value ($1.62), whereas the ‘puffery’ statement (All natural and aspirin free … It’s simply a great product!) has the lowest value ($1.31).

Table 7. Scenario analysis of dollar value ascribed to each element, when the vignettes are stratified by brand. The table suggests an interaction of brand and message. The table shows cells shaded when the dollar value exceeds $2.00.


None

(brand) Zantac

(brand) Tums

(brand) Briosche

(brand) Alka-Seltzer

(brand) Mylanta

A0

A1

A2

A3

A4

A5

E2

Has 600 mg of calcium in each dose, which helps to treat osteoporosis … two benefits in one!

1.62

2.03

1.68

2.45

2.29

2.12

E1

Relieves your heartburn, acid indigestion, and upset stomach without unnecessary chemicals, ingredients, or preservatives

1.57

1.94

2.16

2.27

1.69

1.83

D3

Tastes like a milk shake!

1.56

1.65

1.63

1.56

1.67

2.01

G4

For people with occasional, mild to moderate symptoms of heartburn, antacids are often all that is needed to control the symptoms

1.50

1.40

1.32

1.68

1.47

1.92

E5

It’s also great in relieving nausea, and helps with a hangover too

1.45

1.99

1.93

1.90

1.53

2.05

F3

The expiration date on our product is for 5 years!

1.43

1.88

1.21

1.23

1.42

1.36

E4

Starts to work instantly

1.40

2.27

1.97

1.69

1.37

1.88

G5

Pain, gas, indigestion … relieve the symptoms and recover from overeating by taking an over-the-counter antacid

1.36

1.85

1.09

1.87

1.75

1.79

F1

Just pour a capful (or a foil pack) into 4oz of water and within 10 seconds relief is on its way!

1.35

1.68

1.54

1.78

1.75

1.34

G2

Antacids are frequently given to babies to reduce the acidity of stomach contents which are refluxed into the food pipe

1.35

1.32

1.41

1.45

1.59

1.23

C1

Faster … more complete absorption of this effervescent antacid versus conventional tablets

1.32

1.95

1.38

1.71

1.78

1.49

G1

Antacids can provide fast, safe relief for your pregnancy heartburn

1.32

1.65

1.30

1.46

1.72

1.49

C2

All natural and aspirin free … It’s simply a great product!

1.31

2.19

1.95

1.81

1.63

1.99

What emerges from Table 7 is the fact that some elements, such as the strong performer, E2, with 600 mg of calcium, can dramatically increase in dollar value in the presence of brands, whereas other elements such as element G2, with less cogent messages (Antacids are frequently given to babies to reduce the acidity of stomach contents which are refluxed into the food pipe) can increase price, but far less dramatically.

The results for this analysis further suggest that brands interact with messages in ways that must be measured. It is not that a specific brand name adds approximately the same amount to each element. Rather, there is a unique pattern of interactions between brand name and element, a pattern that must be empirically uncovered.

Finding Respondents in Order to Increase the Effectiveness of Messaging

An increasingly important topic in health is to get people to comply with the prescriptions from their doctors.  The problem of compliance is certainly very important in the case of prescription medicines, but it may be important as well for medicines that should be taken daily, if only as a precautionary measure. Antacids may be in the category of medicines which are for momentary symptomatic relief but may also be taken on an ongoing basis.

How does a physician or a company find the correct messages, especially for an OTC (over the counter) product that should be taken regularly? The world of today, as of this writing (spring, 2019) is individual targeting, individual messaging. The mind-sets emerging from this study represent different ways of responding to the messages about antacid.

Author Gere has developed a PVI, personal viewpoint identifier, by which a person can be assigned to one of a set of mind-sets, by answering six questions. Figure 3 shows the PVI for Mind-Sets 1,2, and 3 in Table 6. Mind-Set 4 is not relevant. The focus is on assigning a person to the most likely of these three mind-sets. As of this writing (June, 2019) the PVI for this study can be found at this website: http://162.243.165.37:3838/TT39/

Discussion and Conclusion

In previous years marketers have looked at the world of OTC in terms of how to communicate the product to the world of consumers.  The introduction of market segmentation using psychographics pushed the world of OTC marketing towards consumer claims, but at the same time claims having a ‘shade’ of medical efficacy. Indeed, efficacy claims for OTC are regulated, and the marketer is limited to what can be said.

The combination of a fundamental consumer product with medical aspects brings with it the special problem of just what to say, so that the messages are allowable, understandable to the consumer, and convincing.  In ordinary Rx medicines, the communication to the consumer need not ‘convince the consumer to purchase,’ but rather convince the patient to comply.  In OTC there is the fine line between convincing to purchase and convincing to use properly.

Mind Genomics as presented in this paper provides a wealth of information about what works in terms of messaging to convince. The ability to mix brands with messages about the product and about how the product works produces a realistic set of vignettes of the type that might be encountered in the ‘real world.’ The knowledge emerging from the mind-set segmentation shows how to find the most appropriate messaging, solving some of the marketing issues.

MIND GENOMICS-034_JPPR_F4

Figure 3. Welcome screen of the PVI presenting the six questions and the binary answer scales.

MIND GENOMICS-034_JPPR_F5

Figure 4. Feedback screens of the PVI. Each mind-set has its personalized feedback screen presenting the name of the mind-set along with a short description. The ‘say’ and the avoid ‘elements’ appear as part of the feedback. The use of the ‘brand’ name as part of the feedback is optional.

MIND GENOMICS-034_JPPR_F6

The novel introduction of price as a second component opens up a totally new area of research, ‘homo economicus, economic man, and the dollar value of the messaging.  The data from the total panel suggest that for the world of antacids, the interest in the product correlates quite well with the price willing to pay.  These are starting data. It will be interesting to see whether we continue to see the same high correlation between interest (emotional reaction) and price (economic decision).

Acknowledgement

Attila Gere thanks the support of the Premium Postdoctoral Researcher Program of the Hungarian Academy of Sciences.

The authors would like to acknowledge the assistance of Professor Gillie Gabay, School of Behavioral Science and Psychology, College of Management, Israel.

References

  1. Schöll I, Untersmayr E, Bakos N (2005) Antiulcer drugs promote oral sensitization and hypersensitivity to hazelnut allergens in BALB/c mice and humans. American Journal of Clinical Nutrition. 81: 154–160.
  2. Schöll I, Ackermann U, Ozdemir C (2007) Anti-ulcer treatment during pregnancy induces food allergy in mouse mothers and a Th2-bias in their offspring. Federation of Societies of Experimental Biology Journal 21: 1264–1270.
  3. Untersmayr E, Bakos N, Schöll I (2005) Anti-ulcer drugs promote IgE formation toward dietary antigens in adult patients. Federation of the Societies for Experimental Biology Journal 5: 656–858.
  4. Untersmayr E, Schöll I, Swoboda I (2003) Antacid medication inhibits digestion of dietary proteins and causes food allergy: a fish allergy model in BALB/c mice. Journal of Allergy and Clinical Immunology 112: 616–623.
  5. Pali-Schöll, Herzog R, Wallmann J, Szalai K, Brunner R, et al.  (2010) Antacids and dietary supplements with an influence on the gastric pH increase the risk for food sensitization. Clinical & Experimental Allergy 40: 1091–1098.
  6. Mueller-Lissner S, Quigley EM, Helfrich I, Schaefer E (2010) Drug treatment of chronic-intermittent abdominal cramping and pain: a multi-national survey on usage and attitudes. Alimentary pharmacology & therapeutics 32: 472–477.
  7. Faresjo A, Anastasiou F, Lionis C, Johansson S, Wallander MA, Faresjo T (2006) Health-related quality of life of irritable bowel syndrome patients in different cultural settings. Health and Quality of Life Outcomes 4: 21.
  8. Klauser AG, Schindlbeck NE, Mue;ler-Lissner SA (1990) Symptoms in gastrooesophageal reflux disease. Lancet 335: 205–208.
  9. Quigley EMM, Locke GR, Mueller-Lissner S (2006) Prevalence and management of abdominal cramping and pain: a multi-national survey. Alimentary pharmacology & therapeutics 24: 411–420.
  10. Hungin APS, Chang L, Locke GR, Dennis EH, Barghout V (2005) Irritable bowel syndrome in the United States: prevalence, symptom patterns and impact. Alimentary pharmacology & therapeutics 21: 1365–1475.
  11. Olden K, De Garmo RG, Jhingran P (2002) Patient satisfaction with alosetron for the treatment of women with diarrhea-predominant irritable bowel syndrome. American Journal of Gastroenterology 97: 3139–3146.
  12. Box GE, Hunter WG, Hunter JS (1978) Statistics for experimenters, New York, John Wiley.
  13. Moskowitz HR, Gofman A (2007) Selling blue elephants: How to make great products that people want before they even know they want them. Pearson Education.
  14. Luce RD, Tukey JW (1964) Simultaneous conjoint measurement: A new type of fundamental measurement. Journal of mathematical psychology 1: 1–27.
  15. Green PE, Rao VR (1971) Conjoint measurement for quantifying judgmental data. Journal of marketing research 8: 355–363.
  16. Green PE, Srinivasan V (1990) Conjoint analysis in marketing: new developments with implications for research and practice. The journal of marketing 54: 3–19.
  17. Moskowitz HR, Gofman A, Itty B, Katz R, Manchaiah M, Ma Z (2001) Rapid, inexpensive, actionable concept generation and optimization: the use and promise of self-authoring conjoint analysis. Food Service Technology 1: 149–167.
  18. Moskowitz HR (2012) Mind genomics’: The experimental inductive science of the ordinary, and its application to aspects of food and feeding. Physiology & Behavior 107: 606–613.
  19. Jubes R, Jain AK (1980) Clustering methodologies in exploratory data analysis. Advances in Computers 19: 113–238.
  20. Wells WD (2011) Chapter 13: Life Style and Psychographics: Definitions, Uses, and Problems. In: Wells WD (ed.), Life Style and Psychographics. Marketing Classics Press, Decatur, GA, USA.
  21. Gofman A, Moskowitz H (2010) Isomorphic permuted experimental designs and their application in conjoint analysis. Journal of Sensory Studies 25: 127–145.

The Minds and Mind-Sets of Younger and Older Investors Regarding Information: A Mind Genomics Cartography

DOI: 10.31038/ASMHS.2019354

Abstract

We present a new way to understand the mind of the investor, moving away from technical models of investing to determining in simple terms of type of information that the person feels to be important when deciding to invest. The experiment identifies the relative importance of different types and sources of information to which a person might pay attention. The approach, Mind Genomics, combines simple messages or elements to create vignettes, concepts which present several different aspects of the news and information. The respondent rates these different combinations in terms of the degree to which the combination reflects the respondent. Mind Genomics reveals three clearly different mind-sets of individuals, from those who focus on the source of the information, those who focus on the story and information, and those who focus on what their friends are saying and their own insights from mathematical models. Mind Genomics presents a new approach to understanding decision making under uncertainty, based upon the nature of the mind of the person.

Introduction

The world of investing combines a plethora of disciplines, some economic, some mathematical, most psychological, and a great deal of simple human behavior which constitutes the quotidian behavior of daily life. There is vast literature on what the person ‘might be doing,’ what type of information does the person take into account, predispositions riskiness, financial acuity, and comfort. Entire courses about Finance are devoted to the stock market, to the psychology of investing, and so forth. An excursion in the world of the psychology of investing usually begins with economics as the foundation, and the human player linked into the economics, either obeying the laws of rationality proclaimed by economic theory, or behaving as human beings filled with emotion and biases, proclaimed by the new discipline of behavioral economics. The focus may be on risk taking [1], on the nature of information [2], on the tonality of information provided by the corporation such as social conscientiousness [3], on gender [4, 5] even the susceptibility of the respondent investor to the messaging of others [6]. Yet, with all this information we do not get a sense of the mind of the investor as separate from the act of investing, although there are papers on ‘investor psychology’ [7, 8].

This study steps back from the increasingly sophisticated analysis to look at the simple presentation of investing behavior, the type of presentation that a person in psychology might find interesting, e.g., a brokerage. We look at how people respond to descriptions of investor behavior, to say ‘fits me’ or ‘doesn’t fit me.’ We are not looking for theoretical structures, but simply for a way to understand the way people think of themselves. We are acting as a psychologist, a doctor, a diagnostician of the mind, and not presenting a deep approach of what we believe are the theoretical bases for underlying behavior’.

Method

The research used the approach developed for the emerging psychological science of Mind Genomics, with origins in experimental psychology, experimental design, and marketing. The objective of Mind Genomics is to map out the decision rules for a topic, with that topic being familiar, such as eating a food, choosing a physician, selecting a product in a store, or in this study, investing in the stock market. In all of these topics, one either asks the respondent to describe her or his behavior through qualitative research (focus groups; discussions), observes the behavior, uses surveys, or following Mind Genomics, presenting the respondent with simulated situations, and observing the behavior. Mind Genomics produces a cartography of ideas or perhaps more appropriately, a listing of the relevant idea in a topic, and a metric associated with these ideas. The metric may be the linkage of the idea to oneself (fits me) or the degree to which the idea drives an expected action, such as choose to invest or choose to buy.

The origins of Mind Genomics in terms of psychology and philosophy comes from the method of induction, offered by philosopher Francis Bacon, combined with the Socratic Method for asking questions. In the simplest terms, a Mind Genomics exploration or cartography of a topic comprises the definition of the topic, the asking of four ideas, the creation of four answers for each question, the combination of these answers into vignettes, and finally obtaining respondent ratings of these combinations, followed by a statistical analysis of the ratings of combinations to show the ‘effect’ of each individual idea. The scientific history of Mind Genomics has its origins in the merger of experimental psychology to understand the ‘mind’ statistics using experimental design to create the necessary stimuli, and marketing research which focuses on the daily life of people. The necessary papers constituting the background can be found by looking at the introduction and references provided by [9, 10, 11] psychology, market research and Box [12] experimental design in the field of statistics. As described above, the Mind Genomics method may seem to be one of the many different forms of surveys, and one would not be totally wrong to conclude so. Yet, there is a difference between a survey and a Mind Genomics cartography. With a survey, one asks the respondent a question, and obtains one of several answers. The analysis shows which answers are linked with a question/ The analysis provides mind-sets as well, different patterns of answers to the same question. The analysis does not show causality, however, as might be the conclusion if one could link a response (invest) to a set of messages. In contrast to the intellectual history and applications of the survey method, Mind Genomics can be said to be an experiment. Mind Genomics creates a set of systematically created combinations with known elements in each combination, presents these combinations to the respondent, who integrates the information in each combination, and rates the combination on a scale defined by the researcher. The analysis links the response to the individual element, revealing the decision criteria of the respondent. The respondent need not explicate the criterion for decision; they emerge from the regression analysis.

For the world of investment, Mind Genomics works at the level of the conversation, not the level of technical. That is, the test elements, the stimuli, are mixed into vignettes, combinations of simple phrases describing the nature of the information that a person might obtain from everyday life. These elements are presented as key sources of information. The respondent is then instructed to read each vignette, i.e., combination of ‘information’ and say whether paying attention to that combination of information ‘describes me’ or does not describe me.

Explicating a Mind Genomics Experiment – What information is Perceived to be ‘Relevant’

A great deal of the informal talk about investment deals with the source of the information, and perhaps some surface specifics. This information can be gleaned from participating in the myriad conversations which occur in the morning in offices, at breakfasts among friends, and so forth. Mind Genomics captures this information through a Socratic process, comprising the requirement to generate four questions which tell a story, and then four answers to each question. The task is not particularly challenging but does require people to think in a critical manner. (Table 1) presents the four questions and the four answers to each question. If this study were to be a simple questionnaire, then the researcher would list the answers in some randomized order, present the 16 answers as 16 actual ‘questions’ and instruct the respondent to scale the importance of the answer in terms of how affects the respondent’s decision when thinking about an investment, whether the respondent is an actual investor or instructed to think in the way an investor would think. The important thing to keep in mind is that the survey forces an intellectual consideration of each answer ‘separately,’ and out of context. The task is difficult primarily because it is hard to think of just one idea at a time. Often the respondent attempts to give the researcher answers deemed to be politically correct and appropriate. Mind Genomics works in a different way.

Table 1. The four questions and the four answers to each question.


Question A: Where do you read the news of business that you follow?

A1

The news appears in the Wall Street Journal

A2

The news appears in Bloomberg

A3

The news appears in CNBC

A4

The news is given by your colleagues at your office


Question B: What is the major business news break of the morning?

B1

Story:   Imminent tariffs and how they will affect trade

B2

Story:  Structural problems in the vertical promise downstream trouble

B3

Story: Investors seem to be taking a big position in a vertical

B4

Story: Investors seem to be selling off more rapidly than expected


Question C: What are the details of the specific vertical that you follow?

C1

Follow the vertical because I’m heavily knowledgeable in it and feel it’s home

C2

Just got into the vertical because of recommendations from people I trust

C3

The mathematical models I use say ‘this vertical is hot’

C4

Everyone in the office is abuzz about something big happening here


Question D: What is the tonality of the story?

D1

The tone of the news is so clear that I feel I just have to do something

D2

I think I’ve discovered something really critical here that no one knows

D3

Everything I hear tells me no one knows exactly … what a chance for ME

D4

My experience tells me there’s money to be made here …  I just know it

The underlying premise is that people may not be able to tell an interviewer what they want, how they make a decision, and what they will do. At a conscious level the respondent may not even know the answers to the questions, but the social constraints of interviewing require an answer or permission to not guess. Yet, for the most part, people behave in a consistent manner, even though they might not be aware of just how consistent their behavior might be. The question is how to determine what people think when they cannot or will not reveal this in a directed questionnaire, despite their real-world consistent behavior. In the Mind Genomics experiment the researcher identifies messages which may be relevant. These are the 16 answers to the four questions in (Table 1). The role of the question is simply to set the story, and to elicit the answers. It is the answers which are relevant. Mind Genomics then combines these answers (elements) into small, easy to read vignettes, concepts, according to an experimental design. The design ensures that each of the elements appears an equal number of times in different vignettes and constitutes only part of the vignette. Other elements are present in the same vignette. The respondent’s task is to read the entire vignette as one idea and assign a rating. The respondent rates 24 such vignettes. The combination of different elements makes it impossible for the respondent to focus on one element. Rather, as in real life, the respondent must respond quickly, almost intuitively, to the combination. What emerges is a more valid response to the test stimuli, the vignettes. As will be explicated below, the experimental design allows the researcher to deconstruct the response to the mixture, the vignette, into the separate contributions of the 16 elements.

Creating the Test Combinations (Vignettes) by Experimental Design

People are accustomed to reading paragraphs or collections of disparate information, and making a decision on the combination. It is intellectual challenging when reading a combination to assign the relative importance of each piece of information in the combination, although when pressed to do so, the respondent can probably come up with a criterion. There are a number of methods which try to estimate the likely performance of a combination by the evaluation of single elements (self-explication of components), or the choice between pairs of elements [13]. These approaches are cognitively challenging, making the respondent move beyond sampling and rapidly evaluating the combination, but rather focus on the components of a mixture, an atypical situation.

In the Mind Genomics system, the 16 answers or elements are combined into a set of 24 vignettes, combinations, with the experimental design valid for a single individual. That is, all of the 16 elements are statistically independent of each other, each vignette comprises at most only one element or answer from any question, and there are vignettes in which answers from some questions are missing. Each vignette comprises 2–4 elements. This approach, the within-subjects design, is very powerful because it allows the data to be analyzed at the level of the individual respondent, a property very critical for mind-set segmentation. One other feature deserves mention. When only one set of 24 vignettes were to be tested, the researcher would have to be very careful about selecting the specific vignettes. Rather than forcing a lot of thinking about just what combinations to develop by the experimental design, Mind Genomics makes use of a patented technology, permuted experimental design [14] to systematically vary the specific elements that are combined in the vignettes. The mathematics of the design are maintained, but the combinations different for each person. Thus, it becomes possible to explore a topic area quickly, reduce most of the intellectual bias, and uncover the ‘mind of the respondent’. The set-up of the study has been automated (www.BimiLeap.com). The app allows the researcher to type in the questions, then the answers, and a rating scale. Afterwards, the researcher selects the panel, generally using an on-line panel provider. (Figure 1) shows the set of set up screens that the researcher would use to create the experiment. After the researcher has set up the study, the researcher launches the study. Usually the on-line panel providers generate the necessary, qualified respondents in about 2–3 hours. The data are analyzed automatically to generate summary models for total panel, gender, age, a third question (type of information), and emergent mind-sets (discussed later on.)

MIND GENOMICS-033_ASMHS_F1

Figure 1. The set-up of the study in the BimiLeap app prior to the experiment. The left panel shows the four questions, the middle panel shows the four answers to the first question, and the right panel shows the respondent orientation and scale.

The analytic approach for each subgroup (e.g., total panel, gender, age, third question, mind-set) is the same, comprising the assemblage of all the data for the relevant respondents for that subgroup (24 records for each respondent), and a linear regression model relating the presence/absence of the elements in a vignette (code 0=absent, 1=present) to the rating (1–5), or more generally to a binary transformation of the rating (1–3 ® 0 ; 4–5 ® 100). The binary transformation reflects legacy from consumer research and management needs. Consumer researchers often use category or Likert Scales, anchored at both ends (e.g., our 1–5 scale). Managers often prefer data presented in binary form, no/yes, no go/go, reject/accept, etc.

Building Models to Show How The Elements Drive The Binary Response (Top2Box) and response time (RT)

The experimental design created for each individual respondent produce 1200 individual vignettes or combinations of elements, most of which differ from each other. Thus, the Mind Genomics experiment covers a wide range of alternative combinations of elements. The experimental design created for each indivual, based as it is on a ‘kernel’ experimental design permuted for the respondents, ensures that the set of 16 elements are statistically independent of each other.

The data matrix comprises 1200 rows 24 rows for each respondent. Each respondent has a unique identification number, and a set of 16 columns to store the the independent variables. The independent variables, the 16 answers or elements, are coded 0 or 1, respectively. A 0 represents the fact that the element is absent from the vignette, whereas a 1 represents the fact that the element is present in the vignette. The three dependent variables are the original rating on a 5-point scale, the binary equivalent (Top2Box, 0/100) emerging from a recoding of the ratings, and finally the number of seconds showing the ‘response time’ (or reaction time), defined as the time between the appearance of the vignette and the respondent rating. (Table 2) shows part of the data set that will be used in the regression modeling (Table 2) shows the data structure. The experimental design comprises simply the listing of the different elements. The design must be translated into a series of 0’s (element absent from the vignette), and 1’s (the element present in the vignette.) The statistical modeling, OLS (ordinary least-squares) regression analysis, assigns a weight to each of the 16 predictor variables (A1-D4) so that by knowing what elements are in the vignette one can estimate the likely rating by simply summing up the coefficient [12].

Table 2. Structure of the first eight vignettes, and the ratings.

Respondent self-description from the self-profiling classification at the start of the experiment
Investor Type – Active, Reads the news Gender = Male

Test Order

1

2

3

4

5

6

7

8

Element (Answer)


Answer to Question A

A1

A1

A4

A2

A2

A3

A4

A4

Answer to Question B

B4

B3

B4


B3

B2

B3

B1

Answer to Question C

C1

 Absent

C1

C4

C2

C2

C4

 Absent

Answer to Question D

 Absent

D1

 Absent

D2

D4

D3

D3

D4

Binary expansion of design


A1

1

1

0

0

0

0

0

0

A2

0

0

0

1

1

0

0

0

A3

0

0

0

0

0

1

0

0

A4

0

0

1

0

0

0

1

1

B1

0

0

0

0

0

0

0

1

B2

0

0

0

0

0

1

0

0

B3

0

1

0

0

1

0

1

0

B4

1

0

1

0

0

0

0

0

C1

1

0

1

0

0

0

0

0

C2

0

0

0

0

1

1

0

0

C3

0

0

0

0

0

0

0

0

C4

0

0

0

1

0

0

1

0

D1

0

1

0

0

0

0

0

0

D2

0

0

0

1

0

0

0

0

D3

0

0

0

0

0

1

1

0

D4

0

0

0

0

1

0

0

1

Dependent variables


Rating

3

4

4

1

3

3

4

1

Top2Box

0

100

100

0

0

0

100

0

Response time

9.0

3.9

2.4

3.9

2.6

1.8

2.4

2.9

The actual study was run in the middle of August, 2019, using an on-line panel provide, Luc.id. The actual process of developing the study, running the respondents, and then analyzing the data, took approximately three hours, from start to finish, using the above-mentioned program www.BimiLeap.com. The program itself guides the user, from the start (specifying the topic, posing the questions, requiring four answers to each question) on through instructing the respondents, asking other questions beyond age and gender, and then requiring the researcher to write a short paragraph of WHY the study is being done. The latter requirement, a short paragraph about WHY, comes from the major use of the BimiLeap program to ‘teach critical thinking,’ and not just to be a survey tool. A great deal of consumer research can be made tortuous by forcing the researcher to create a questionnaire, call a panel service, and run the study. The approach of BimiLeap and other modern platforms is to dispense with the back and forth process of dealing directly with an on-line field service. The approach requires the research to specify the specifics of the respondent, assuming they are not overly specific, and then launch the study with a credit card. Everything else is automated. The process returns with a report in PowerPoint® and well as the raw data and relevant tabulations in Excel®. This automated set-up allows the entire process to be completed in 2–3 hours, with the set up of the study, e.g., thinking of the questions and answers, the critical thinking, coming to the fore as the rate-limiting step.

Modeling

For the OLS regression we use ALL the data from all relevant respondents in a defined subgroup. For example, with 50 respondents, and with 24 vignettes for each respondent the relevant data for the total panel is 50×24 or 1200 rows of data, also called ‘observations.’ The independent variables are the 16 elements, coded 1 or 0. The dependent variable is the so-called Top2Box (a term from consumer research). The Top2Box becomes 100 (plus a small random number) when the original rating is 4 or 5. The Top2Box becomes 0 (plus a small random number) when the original rating is 1,2 or 3, respedtively. In a second analysis, looking at response time as the dependent variable, the same structure of analysis holds, except that the dependent variable is simply the response time from the appearance of the vignette on the respondent’s screen until the rating. The response time is recorded to the nearest 10th of a second.

We inteprret the coefficient as the, probability that the respondent will assign a rating of 4–5 to a vignette when the eleent appears vignette. When we switch to the response time, the we intepret the coefficient as the number of seconds neede to process the element, i.e., to read it and move on. A benefit of the modeling is its ability to deconstruct the compound stimulus, the vignette, into the part-worth contributions of the individual elements. Researchers often believe that this decomposition can be done easily and with only a bit of attention. A strategy occasionally used is to circle the relevant elements if a vignette. This ‘strategu of highlight what seems to be important’ seems at first quite reasonable, but in light of the power of the regression analysis enabled by the experimental design, such manual circling appears to be inefficient, primitive, and unable to deal at all with response time and processing speed. (Table 3) presents the output of the regression analysis. Most regression packages present the regression results in the same fashion. The elements are presented at the left of the table, with abbreviation first, and then the text of the element. The elements are presented in descending order of magnitude, as shown by the column marked ‘Coeff.’

Table 3. Statistical output of the regression model for the Total Panel. The dependent variable is the binary transformation ‘describes me.’  The independent variables are the 16 answers or elements in the vignettes.


 Dep

Coeff

SE

t-stat

p-Val

C1

Follow the vertical because I’m heavily knowledgeable in it and feel it’s home

11.06

3.706

2.98

0.00

B3

Story: Investors seem to be taking a big position in a vertical

11.01

3.694

2.98

0.00

A2

The news appears in Bloomberg

10.21

3.757

2.72

0.01

A4

The news is given by your colleagues at your office

10.12

3.787

2.67

0.01

A3

The news appears in CNBC

9.87

3.757

2.63

0.01

D1

The tone of the news is so clear that I feel I just have to do something

9.09

3.739

2.43

0.02

A1

The news appears in the Wall Street Journal

8.83

3.712

2.38

0.02

B4

Story: Investors seem to be selling off more rapidly than expected

8.44

3.673

2.30

0.02

C2

Just got into the vertical because of recommendations from people I trust

8.00

3.739

2.14

0.03

B1

Story:   Imminent tariffs and how they will affect trade

7.75

3.654

2.12

0.03

D2

I think I’ve discovered something really critical here that no one knows

6.79

3.800

1.79

0.07

C4

Everyone in the office is abuzz about something big happening here

6.16

3.75

1.64

0.10

D4

My experience tells me there’s money to be made here …  I just know it

4.15

3.744

1.00

0.27

B2

Story:  Structural problems in the vertical promise downstream trouble

3.49

3.710

0.94

0.35

C3

The mathematical models I use say ‘this vertical is hot’

3.24

3.685

0.88

0.38

D3

Everything I hear tells me no one knows exactly … what a chance for ME

2.75

3.795

0.73

0.47

The regression model estimates the coefficients, k1-k16, for the simple linear equation:

Top2 or Number of Seconds = k1(A1) + k2(A2) … k16(D4)

For the Top2Box model, the coefficient (coeff), shows the expected number of binary points that would be added to a vignette if the element were inserted into the vignette. This can be interpreted as the incremental percent of respondents who would rate the vignette as 4 or 5 when the element is inserted into the vignette.

The element most describing the respondents in their own opinion, at least on average, is:

C1: Follow the vertical because I’m heavily knowledgeable in it and feel it’s home (coefficient of 11.06.)

The element least describing the respondents in their own opinion, at least on average, is:

D3 Everything I hear tells me no one knows exactly … what a chance for ME (coefficient of 2.75)

Next to the coeff (coefficient) is the column label SE. SE is the standard error of the coefficient, or the expected variability of the coefficient if the study were repeated. The coefficient is an estimated parameter for real data. As such, the variation in the data upon repeated studies may be expected to affect the estimated value of the coefficient. The lower the variation in the coefficient, i.e., the lower the value of SE, the more likely it is that we have value of the coefficient which is not truly 0. The likelihood of having a coefficient truly different from 0 is given by the t-stat (t-statistic, a measure of the signal/noise ratio), and the p-value, the probability that the t-statistic is really 0. We should look at all of the coefficients above 0.11 as being truly different from 0. Our data suggests most of the elements are really truly different from 0, i.e., probably are somewhat truly descriptive of the respondents as a group. The only elements which are probably 0 are these four, with coefficients lower than 5.

D4  My experience tells me there’s money to be made here … I just know it4.15

B2   Story: Structural problems in the vertical promise downstream trouble 3.49

C3  The mathematical models I use say ‘this vertical is hot’ 3.24

D3  Everything I hear tells me no one knows exactly … what a chance for Me 2.75

The user interpretation of the coefficients is different from the statistical interpretation. The coefficient shows the linkage between the person and the element. High coefficients mean that there is a strong linkage. In percentage terms, where 0 is no linkage and 100 is perfect linkages, i.e., 0=does not describe me … 100=describes me, the coefficient gives the additive percent towards the complete linkage. The elements are additive. That is, one can put up to four elements together, when they are answers to different questions and estimate the total degree of linkage.

The regression model does not have an additive constant for this study. The rationale for omitting the additive constant, i.e., forcing the regression model through 0, is that in the absence of elements there is no meaning to the additive constant. In contrast, were the rating scale to be ‘likelihood to purchase,’ and a 1–5 scale transformed in the same way, the additive constant would be meaningful. It would be the likely interest in purchasing the product or service in the absence of any information. That likelihood value is both relevant and truly informative.

Results From the Regression Analysis

The regression modeling was done with a variety of subgroups, as the respondents defined themselves. (Table 4) shows us the coefficients from the total panel, from genders, and from the two ages. It is clear from (Table 4) that many numbers are linked to the way the respondent feels about herself or himself. These are the elements which generate coefficients of 10 or higher, twice the standard error, and thus a coefficient whose t-statistic approaches or exceeding 2.0.

Table 4. Performance of the elements by key subgroups, defined by who the respondents say they ARE


Subgroups self-defined by who the respondent IS
Top 2 – Fits Me

Total

Male

Female

Age < 60

Age 60+

B3

Story: Investors seem to be taking a big position in a vertical

10

11

10

10

12

A2

The news appears in Bloomberg

11

16

10

13

8

A3

The news appears in CNBC

10

24

5

6

12

B4

Story: Investors seem to be selling off more rapidly than expected

11

21

7

6

9

B1

Story:   Imminent tariffs and how they will affect trade

10

17

7

8

7

C1

Follow the vertical because I’m heavily knowledgeable in it and feel it’s home

8

18

3

10

12

A1

The news appears in the Wall Street Journal

8

14

5

2

14

A4

The news is given by your colleagues at your office

8

7

9

11

10

C2

Just got into the vertical because of recommendations from people I trust

9

15

7

8

8

B2

Story:  Structural problems in the vertical promise downstream trouble

9

5

10

1

5

C4

Everyone in the office is abuzz about something big happening here

6

10

5

7

5

D2

I think I’ve discovered something really critical here that no one knows

3

2

4

2

12

D1

The tone of the news is so clear that I feel I just have to do something

3

-5

6

7

11

C3

The mathematical models I use say ‘this vertical is hot’

7

5

7

0

7

D3

Everything I hear tells me no one knows exactly … what a chance for ME

4

5

4

-4

8

D4

My experience tells me there’s money to be made here …  I just know it

3

8

2

-2

9

One way to look at these results might be to sort the elements by the number of subgroups which find the element to be important (i.e., the coefficient of 10 or higher). Whe we do this sort, we find that there are just two extraordinarily strong elements, elements whose strong performance is not surprising.

B3       Story: Investors seem to be taking a big position in a vertical

A2       The news appears in Bloomberg

Despite the presence of strong performing elements in each group, there is no easy story to be gleaned from the data. The data are statistically strong but suggest that either there is no pattern, or more likely, the pattern has little to do with who the respondents ARE in a geo-demographic sense. When we look at the respondents by their self-described attitudes towards investing, the picture becomes much clearer, as (Table 5) shows. Those who do not like investing feel that they are best described by elements which convey a ‘general feeling.’ Those who invest with advice feel they are best described by messages about the source of the information and described by their own research. Those who are active investors feel that they are described both by the source and by the ‘story.’

Table 5. Performance of the elements by key subgroups, defined by how the respondent describes her or his attitude towards investing


Subgroups self-defined by how the respondent defines her/his investing behavior
Top 2 – Fits ME

Do not like investing

Invest with advice

Active investor

D4

My experience tells me there’s money to be made here …  I just know it

14

0

7

D1

The tone of the news is so clear that I feel I just have to do something

13

3

11

A3

The news appears in CNBC

12

11

9

D3

Everything I hear tells me no one knows exactly … what a chance for ME

11

-2

5

A1

The news appears in the Wall Street Journal

6

13

6

C1

Follow the vertical because I’m heavily knowledgeable in it and feel it’s home

-6

12

15

A2

The news appears in Bloomberg

0

10

12

B3

Story: Investors seem to be taking a big position in a vertical

-1

0

28

B4

Story: Investors seem to be selling off more rapidly than expected

8

-5

23

B1

Story:   Imminent tariffs and how they will affect trade

-4

3

18

A4

The news is given by your colleagues at your office

7

7

11

B2

Story:  Structural problems in the vertical promise downstream trouble

-3

0

11

C2

Just got into the vertical because of recommendations from people I trust

0

7

10

D2

I think I’ve discovered something really critical here that no one knows

8

3

9

C4

Everyone in the office is abuzz about something big happening here

3

4

7

C3

The mathematical models I use say ‘this vertical is hot’

-5

4

5

Mind Sets

One of the tenets of the emerging psychological science of Mind Genomics is that for each topic of everyday experience (e.g., shopping, consulting a doctor, etc.) or even thinking (e.g., about issues of ethics and morality) there exist small, specific domains of the topic. Rather than the grand top of investing, for example, the domain might be limited to the ‘nature of the information to which I am exposed.’ That topic is the subject of this Mind Genomics cartography. Mind Genomics posits that in every domain of the topic, small or large, there may be several different patterns of information to which an individual might respond, rather than only one pattern. That is, individuals differ from each other in the nature of the information to which they respond, the messages which ‘inform their decision.’ Beyond simply positing these different groups of individuals, Mind Genomics provides the computational machinery both to identify these different groups, so-called Mind-Sets for a topic and then a way to assign any new person to one of the Mind-Sets, the method being called the PVI, the personal viewpoint identifier. Discovering Mind-Sets is a statistical process, objective in nature for its computations, but subjective in terms of decision-making about the nature of the revealed Mind-Sets. The approach is quite straightforward, following a statistical path comprising four steps:

Step 1 Select the basic data from which the Mind-Sets will be uncovered

The basic data comprises the 16 coefficients for each respondent. Each respondent generates 16 coefficients from the regression model relating the transformed binary response to the presence/absence of the element.

Step 2 Estimate the ‘distance’ between each pair of respondents

The distance may be defined in any number of ways, ranging from the Minkowski R metric (e.g., the mean squared differences along each of the 16 pairs of coefficients, for R = 2, the familiar Euclidean measure of distance), to the Pearson distance, a metric which looks at the similarity of patterns. The Pearson distance between any two objects e.g., people, is value (1-R), where R is the Pearson correlation between the two respondents, based upon the values of the 16 coefficients. The Pearson R has maximum of +1 when two variables are perfectly related to each other in a linear fashion, and thus show the same pattern. The distance is thus 0, because the two patterns are perfectly related. The value (1-R) is 0, when R = 1. The Pearson R has a minimum of -1 when two patterns are perfectly inversely related to each other. The distance is thus 2 (1- – 1 = 2).

Step 3 Place the respondents into either two or three mutually exclusive and exhaustive groups

This is called clustering [15] The objective of clustering is to minimize the distances within a Clustering this requires computation. The composition of the clusters, the emergent mind-sets, will vary somewhat depending upon the way the ‘distance’ is defined. This should not be worrisome since the clustering is simply meant to be a heuristic, to divide the respondents in a way that may be useful for other analyses.

Step 4 Interpret the clusters or mind-sets

The mind-sets, mutually exclusive and exhaustive, should ‘make sense’ (interpretable), and should be as few as possible (parsimonious.)

(Table 6) suggests three different mind-sets, as follows

Table 6. Performance of the elements by three mind-sets, subgroups, defined by similar patterns in the way people describe their attitudes towards investing. Mind-Set is abbreviated MS


Mind-Sets (MS) emerging from similar patterns of coefficients Top 2 – Fits ME

MS1

MS2

MS3


Mind-Set 1– Responds to where the news appears


A1

The news appears in the Wall Street Journal

19

4

2

A2

The news appears in Bloomberg

18

2

15

A3

The news appears in CNBC

17

13

1

A4

The news is given by your colleagues at your office

15

-5

18


Mind-Set 2 – Responds to the story


B2

Story:  Structural problems in the vertical promise downstream trouble

-2

18

7

B3

Story: Investors seem to be taking a big position in a vertical

9

17

1

B1

Story:   Imminent tariffs and how they will affect trade

10

14

4

B4

Story: Investors seem to be selling off more rapidly than expected

9

13

10

C1

Follow the vertical because I’m heavily knowledgeable in it and feel it’s home

7

12

5


Mind-Set 3 Responds to recommendations of friends & math models


C2

Just got into the vertical because of recommendations from people i trust

8

3

17

C3

The mathematical models i use say ‘this vertical is hot’

1

5

14

C4

Everyone in the office is abuzz about something big happening here

0

6

11


Does not seem important for any mind-set


D1

The tone of the news is so clear that i feel i just have to do something

2

-1

9

D2

I think I’ve discovered something really critical here that no one knows

9

-7

8

D3

Everything I hear tells me no one knows exactly … what a chance for ME

9

0

6

D4

My experience tells me there’s money to be made here.. i just know it

-1

8

4

Mind-Set 1 – Responds to where the news appears,

The news appears in the Wall Street Journal

The news appears in Bloomberg

Mind-Set 2– Responds to the story

Story: Structural problems in the vertical promise downstream trouble

Story: Investors seem to be taking a big position in a vertical

Mind-Set 3 Responds to recommendations of friends and appears to be intuition-driven

Just got into the vertical because of recommendations from people I trust

Finding the Mind-Sets In the Population

Respondents who differ in their attitudes in terms of the nature of information to which they respond may or may not realize that there are different groups, different mind-sets. (Tables 5, 6) show clear differences among the groups in terms of their responses to different types of information, which covary with the group to which they belong. Yet, if one subscribes to the belief that people want to hear messages which resonate with them, it might be a better strategy to work with mind-sets of investors, rather than relying upon how the investor defines herself or himself. What might happen if one were to know at the start of the conversation the mind-set to which a prospect belongs? One could then be more comfortable choosing the messages because many of these messages linked with the mind-sets show very high coefficients, 15 or higher. (Table 7) shows the distribution of the three mind-sets by total panel, gender, age group, and self-stated preferences for the type of information. There is no clear pattern.

Table 7. Distribution of the respondents by total and the three mind-sets.


Total

MS1

MS2

MS3


Where

Story

Friends & Tech

Total

50

14

19

17


Female

36

8

12

16

Male

14

6

7

1


Age < 60

22

8

7

7

Age 60+

28

6

12

10


Don’t like investing

9

2

2

5

Invest with advice

19

5

10

4

Active investor, study the news

17

5

5

7

Use technology, models

5

2

2

1

An alternative way uses an algorithm known as the PVI, the personal viewpoint identifier. The PVI asks the respond six questions derived from the experiment, and from the pattern of answers the PVI assigns the new person to the most likely mind-set. The PVI algorithm uses the coefficients to identify which combination of elements, posed as questions and answered with a 2-point scale (Not ME: Me) (Figure 2) shows the PVI questionnaire as presented to the respondent. The order of questions varies across the respondents. The PVI also allows the researcher to ask specialty questions as well, in order to gain more knowledge. The PVI takes about a minute to complete

MIND GENOMICS-033_ASMHS_F2

Figure 2. The PVI (personal viewpoint identifier) for the investing experiment.

Response Time and Engagement

Experimental psychology began with the systematic study of reaction time, the time between the presentation of a stimulus (e.g., our vignette), and the time when the respondent assigned a rating, or simply noted that she or he ‘detected’ the stimulus. There is the abiding, probably correct, belief that longer reaction times correspond to ‘more things going on in the mind.’ Shorter reaction times, therefore, suggest fewer things going on in the mind, or the fact that the respond ‘sees’ the message and discards it without consideration [16]. The Mind Genomics experiment itself lasts 3–4 minutes in the 5-minute interview. During that time the respondent is presented with 24 vignettes, and required to read the vignette (more likely glancing through it, grazing for information), and then responds. There is little time to read the entire vignette. The reaction must be almost automatic, namely see, rate, see, rate, etc.

(Table 8) presents the estimated response times for the 16 elements, by key self-defined group (gender, age, respectively). The respondents answer quickly, and are not at all aware of how much time they spend on each element. The OLS regression estimates the likely number of seconds required for each element to be read and processed. Those elements which generate coefficients of 2.0 (two seconds or longer) are shown in in shaded cells, and bold type. These are the elements to which the respondent attends, whether the attention reflects an emotional reaction, or an attempt to comprehend the meaning of the element. (Table 8) suggests that older respondents typically take longer to process then information than do younger respondents. Those over 60 show higher coefficients for response time than those respondents under 60. There is also the suggestion that the genders differ in what engages them. Female’s attention is engaged by other people (The news is given by your colleagues at your office), whereas male’s attention is engaged by technology (The mathematical models I use say ‘this vertical is hot’).

Table 8. Response time in seconds for each element. Data for total panel, gender, and age, respectively.


Estimated response times in seconds for each element by the total panel, gender, and age

Total

Male

Female

LT 60

GT 60

D1

The tone of the news is so clear that I feel I just have to do something

1.7

2.1

1.5

1.4

1.7

D2

I think I’ve discovered something really critical here that no one knows

2.3

2.0

2.4

1.4

1.2

C2

Just got into the vertical because of recommendations from people I trust

1.6

2.0

1.4

1.3

1.5

C3

The mathematical models I use say ‘this vertical is hot’

1.3

2.0

1.0

1.6

2.0

A4

The news is given by your colleagues at your office

2.0

1.3

2.4

1.6

1.7

A1

The news appears in the Wall Street Journal

2.1

1.8

2.2

1.5

1.7

A2

The news appears in Bloomberg

2.0

1.4

2.2

1.4

1.6

B2

Story:  Structural problems in the vertical promise downstream trouble

1.6

1.9

1.5

2.3

2.2

B4

Story: Investors seem to be selling off more rapidly than expected

1.7

1.8

1.7

2.1

2.0

B1

Story:   Imminent tariffs and how they will affect trade

1.6

1.6

1.6

2.0

2.1

B3

Story: Investors seem to be taking a big position in a vertical

1.6

1.7

1.6

1.9

2.1

A3

The news appears in CNBC

1.5

1.4

1.5

1.9

1.4

C4

Everyone in the office is abuzz about something big happening here

1.8

1.5

1.9

1.7

1.8

C1

Follow the vertical because I’m heavily knowledgeable in it and feel it’s home

1.4

1.4

1.5

1.7

1.7

D3

Everything I hear tells me no one knows exactly … what a chance for ME

1.6

1.8

1.5

1.5

1.9

D4

My experience tells me there’s money to be made here …  I just know it

1.8

1.7

1.9

1.3

1.8

When we move to self-defined groups in terms of how one invests (e.g., invests with advice, etc.), (Table 9) suggests clearly different patterns of engagement. Those who say that they do not like investment pay a great deal of attention to the story. Those who say that they invest with advice also pay attention to the elements dealing with the story, as well as pay attention to ‘clues’ about performance, typically given by others. Those who say that they are active investors pay attention to one element, ‘Story: Investors seem to be taking a big position in a vertical.’ When we move to the mind-sets defined by the pattern of coefficients, we see that there are differences as well, albeit not the strong differences that we saw for those who self-define themselves in different ways in terms of attitudes toward investing.

Table 9. Response time in seconds for each element. Data shown for three different self-descriptions of the respondent’s attitude toward investing.


Subgroups self-defined by how the respondent defines her/his investing behavior Response Time

Do not like investing

Invest with advice

Active investor

B4

Story: Investors seem to be selling off more rapidly than expected

2.9

2.4

1.6

B1

Story:   Imminent tariffs and how they will affect trade

2.7

2.2

1.8

B2

Story:  Structural problems in the vertical promise downstream trouble

2.3

2.5

1.9

B3

Story: Investors seem to be taking a big position in a vertical

2.0

2.0

2.2

C3

The mathematical models I use say ‘this vertical is hot’

0.6

2.5

1.5

C1

Follow the vertical because I’m heavily knowledgeable in it and feel it’s home

0.5

2.5

1.5

C4

Everyone in the office is abuzz about something big happening here

1.6

2.1

1.6

C2

Just got into the vertical because of recommendations from people I trust

0.6

2.0

1.1

A4

The news is given by your colleagues at your office

1.3

1.5

1.9

D3

Everything I hear tells me no one knows exactly … what a chance for ME

1.6

1.6

1.8

A1

The news appears in the Wall Street Journal

1.8

1.4

1.7

A3

The news appears in CNBC

1.8

1.7

1.5

D1

The tone of the news is so clear that I feel I just have to do something

1.3

1.8

1.4

D4

My experience tells me there’s money to be made here …  I just know it

1.4

1.7

1.4

A2

The news appears in Bloomberg

1.5

1.7

1.3

D2

I think I’ve discovered something really critical here that no one knows

1.6

1.7

0.9

Table 10. Response time in seconds for each element. Data shown for three Mind-Sets.


MS1

MS2

MS3


Where

Story

Friends

A1

The news appears in the Wall Street Journal

2.3

2.0

2.0

A4

The news is given by your colleagues at your office

2.2

1.8

2.2

D2

I think I’ve discovered something really critical here that no one knows

2.2

2.2

2.5

D4

My experience tells me there’s money to be made here … I just know it

2.1

1.7

1.8

D1

The tone of the news is so clear that i feel i just have to do something

2.0

1.6

1.5

A2

The news appears in Bloomberg

1.9

2.0

2.2

B4

Story: Investors seem to be selling off more rapidly than expected

1.8

2.0

1.4

C4

Everyone in the office is abuzz about something big happening here

1.8

1.7

1.9

B2

Story:  Structural problems in the vertical promise downstream trouble

1.1

1.7

1.9

B3

Story: Investors seem to be taking a big position in a vertical

1.4

1.4

1.9

B1

Story:   Imminent tariffs and how they will affect trade

1.8

1.4

1.6

C1

Follow the vertical because I’m heavily knowledgeable in it and feel it’s home

1.5

1.3

1.6

A3

The news appears in CNBC

1.4

1.3

1.6

D3

Everything I hear tells me no one knows exactly … what a chance for ME

1.6

1.7

1.5

C2

Just got into the vertical because of recommendations from people i trust

1.5

1.7

1.5

C3

The mathematical models i use say ‘this vertical is hot’

1.3

1.6

0.9

Those who fall into Mind-Set1, paying attention to news from different sources, pay attention to messages which promote some type of discovery, either from the news, from listening to friends and colleagues, or intuition.

Those who fall into Mind-Set 2, paying attention to the story, pay attention to the source (Wall Street Journal, Bloomberg) and to news about sell-offs, and to a sense of finding out something that no one else knows.

Those who fall into Mind-Set 3, paying attention to friends and their own intuition pay attention to the Wall Street Journal, to Bloomberg, to their own unique discovery, and to colleagues.

What is surprising here is that the response times, a measure of engagement, does not covary strongly with who the respondents are. That is, a respondent who feels strongly about something which defines her or him may not be engaged with that message if engagement is measured by response time.

Discussion

As we saw in the introduction, a literature search on investing behavior uncovers a vast range of issues, ranging from behaviors used, strategies adopted, and the inner mind of the investor. To a great degree studies about the psychology of investing have emerged, not unexpectedly, from the marriage of finance and psychology. The emphasis of these studies is on the financial implications of psychological states of mind and its co-variation with strategies. There is relatively little published dealing with the discourse between the investment specialist and the customer. The sheer issue of gaining versus losing deflects the focus from the purely psychological ‘attitude’ to the attitude of investing as an economic behavior What is missing is the person-to-person behavior, the social aspect of the investor, not the economic aspect. Knowledge of the mind of the investor provides us with a new avenue of understanding finance. The field of behavioral economics focuses on the nature of people’s decision making under uncertainty. Investing is in that class. We are often treated to interesting experiments on how people make their investment choices, on the ratiableonal approach to investment. We are less exposed to issues about the nature of information. The approach presented here provides a simple, easy-to-execute foundational study on the ‘mind of the investor,’ not so much dealing with rationality or irrationality, but rather dealing with the way the investigator navigates through opportunities, through information, through communication with others, respectively. Through Mind Genomics we use the economic aspects of the investing simply as a set of test stimuli, ‘assayed’ by the human mind. Our focus is on the mind anticipating economics-relevant behavior [17, 18] and not on the marriage of the mind and the theoretical underpinnings of economics [8].

Acknowledgement

Attila Gere thanks the support of Premium Postdoctoral Research Program of the Hungarian Academy of Sciences.

References

  1. Gervais S and Odean T (2001) Learning to be overconfident. Review of Finance Studies 14: 1–27.
  2. Mezick EM (2002) Investing wisely: Individual investors as information seekers. Journal of Business & Finance Librarianship 7: 3–23.
  3. Escrig-Olmedo E, Munoz-Torres MJ, Fernandez-Izquierdo MA (2010) Socially responsible investing: sustainability indices, ESG rating and information provider agencies. International Journal of Sustainable economy 2: 442–461.
  4. Barber BM and Odean T (2001) Boys will be boys: Gender, overconfidence, and common stock investment. Quarterly Journal of Economics 116: 261–292.
  5. Bengtsson C, Persson M, Willenhag P (2005) Gender and overconfidence. Economics Letters 86: 9–203.
  6. Barber BM and Odean T (2000) Too many cooks spoil the profits: Investment club performance. Financial Analysis Journal 56: 17–25.
  7. Hirshleifer D and Subahmanyam A (1998) Investor psychology and security market under- and overreactions. Journal of Finance 53: 1839–1886.
  8. Tversky A and Kahneman D (1974) Judgment under uncertainty: Heuristics and biases. Science. 185: 1124–1131.
  9. Moskowitz HR and Gofman A (2007) Selling blue elephants: How to make great products that people want before they even know they want them. Pearson Education.
  10. Green PE and Rao VR (1971) Conjoint measurement for quantifying judgmental data. Journal of Marketing Research 8: 355–363.
  11. Green PE and Srinivasan V (1990) Conjoint analysis in marketing: new developments with implications for research and practice. The Journal of Marketing 54: 3–19.
  12. Box GE, Hunter WG, Hunter JS (1978) Statistics for experimenters, New York, John Wiley.
  13. Louviere JJ, Flynn TN, Marley AAJ (2015) Best-worst scaling: Theory, methods and applications. Cambridge University Press.
  14. Gofman A and Moskowitz H (2010) Isomorphic permuted experimental designs and their application in conjoint analysis. Journal of Sensory Studies 25: 127–145.
  15. Dubes R and Jain AK (1980) Clustering methodologies in exploratory data analysis. Advances in Computers 19: 113–238.
  16. Boring EG (1929) A History of Experimental Psychology. The Century Company, NY.
  17. Cross F (1973) The behavior of stock prices on Fridays and Mondays. Financial Analysis Journal 29: 67–69.
  18. Menkhoff L, Schmidt U, Brozynski T (2006) The impact of experience on risk taking, overconfidence, and herding of fund managers: Complementary survey evidence. European Economic Review 50: 1753–1766.

Conferences about topics which pull at the heart: A Mind Genomics exploration

DOI: 10.31038/ASMHS.2019353

Abstract

The objective of this study was to understand how ordinary people react to information about conferences. The study is part of the Mind Genomics exploration of the world of the everyday. Respondents evaluated systematically created vignettes about conferences, with the elements of the vignettes presenting information about the topic of the conference, the way the material is presented to excite emotions, the way the facts are presented, and the after-conference activities, respectively. The study introduced the assessment of interactions between ideas in a vignette (scenario analysis). The results suggest three clearly different mind-sets; those who focus on the topic, those who focus on the nature of the presenter, and those who focus on the after-conference activities. These three mind-sets distribute similarly in the population. The study presents a PVI, personal viewpoint identifier, allowing a conference planner to understand the mind-set to which members of the prospective audience may belong, which knowledge may produce a more impactful conference.

Introduction

One need only look at the proliferation of non-governmental organization intent on solving key issues in the world to get a sense of an increasing social awareness. Beyond the world of the organization is the world of the meeting, where experts and others in the field come together, under one or another aegis or directorate, to discuss the problems, to formulate solutions, or simply to meet. The meetings are in the thousands, often by invitation, and limited, presumably to those attendees whose interest is established in the topic. Every organization attempts to validate its meaning, its raison d’etre, either by publications which communicate important information to the world, by publications of an academic nature which dissect the problem, or more typically in today’s world, by a ‘meeting.’ The meeting, formally titled ‘conference’ , assembles those who are involved in the topic. The conference may turn into a standard, periodic meeting, or become a one-off attempt to ‘solve a problem’ or at least to discuss how various experts would approach the problem. One needs only look at the announcements of such meetings to get a sense of how popular it is for people to get together for short, concentrated periods of time, be available to the public as the public face of those concerned, come up with recommendations, and then scatter back to their regular jobs. Our focus in this paper is to understand how the average person reacts to these types of conferences. To be sure, the topic of ‘meeting’ is not one of high interest to people, unless they are somehow involved. Despite the special nature of conferences, the notion of conferences is by now well known, especially due to the high-profile nature of conferences dealing with important issues. The emerging science of Mind Genomics, the study of the everyday, provides a perfect tool to understand how ordinary people respond to descriptions of these ‘meetings.’ We are not taking the pulse of people towards meetings in general, the points of satisfaction and dissatisfaction, but rather trying to understand the mind of the typical person confronted with special topic, issue-related conferences.

The world of public conferences

The topics of conferences vary dramatically. Most conferences are of minor importance, dealing with specific issues and relevant to a limited number of people, the organizers and the attendees. On the other hand, there are major conferences, often sponsored by world organizations such as the United Nations or by NGO’s (non-government organizations.) The participation of NGO’s continues to interest researchers [1–4], perhaps because the NGO’s are involved with high-profile topics. Conferences are also venues for professionals to meet, and especially for graduate students to introduce themselves to their colleagues, and present papers about their work [5,6] For the seasoned professional, conferences are a venue for promoting one’s work, and for developing a support system [7,8]. For the undergraduate student, an often-overlooked ground of nascent professionals, conferences can provide a launching pad to create a life-long professional [9] The focus of published research literature dealing with conferences is the topic itself, and secondarily a venue in which people interact [10]. In spirit the literature is sociology, the interact of people, and not psychology, the individual’s needs, wants, feelings, and behavior. There is some literature on the desires of conference attendees in terms of they want [11,12], and even papers dealing with people’s behaviors in conferences, such as tweeting [13]. The result of such investigations reveals the nature of people’s participation, and even prescriptions about creating good conferences [14]. They do not tell us about the inner feelings of people towards a conference as a part of their daily life.

This paper moves from the conferences as a topic of sociology, looking from the outside, to a topic of psychology, looking at the conference from the inside, focusing on the reactions of a respondent presented with vignettes, small descriptions, about conferences. Each description comprises different features of the conference; topic, speaker, nature of information, follow up activities. The objective of the Mind Genomics effort in general, and this study in particular, is to create the science of the everyday, using one’s knowledge of quotidian events like conferences, to understand the way people think about and make decisions about the ordinary events of their lives.

The Mind Genomics approach

When confronted with everyday situations, especially those which do not require much thinking, and where there is no real ‘risk,’ the typical person acts automatically, what Nobel Laureate Daniel Kahneman calls involving the System 1 mode of thought. System 1 is the emotion-driven, automatic system upon which virtually people rely most of the time. System 1rapidly processes the information, incorporates emotions, and drives a response, often on what seems to be ‘auto-pilot.’ Such a system is necessary to navigate a life in which many choices are required to be made each few minutes, ranging from where to move when walking, to how to eat a meal, and so forth [15]. The automatic responses and behaviors need to be limited to the very ordinary. For example, people who attend the meetings often form opinions in what seems to be an automatic fashion, talking freely about the different aspects of the meeting without much rehearsal. That is, people respond to the meetings, can dissect the different aspects of the meetings with great ease after the fact, and in the case of boring meetings, during the meeting as people talk with each other while ignoring the presenter. The set of tools to investigate the aspects of the everyday are housed in Mind Genomics. Mind Genomics is the emerging science of the everyday, created to look at the nature of the different patterns of reactions that people exhibit to descriptions of situations [16–18]. The intellectual history of Mind Genomics emerges from mathematical psychology [19], and the adaptation to market research with consumers [20, 21]. When applied to social issues such as meetings sponsored by NGO’s, Mind Genomics reveals what is important about the meeting versus what is unimportant, or how the presenter affects the credibility of the information being presented.

Raw materials

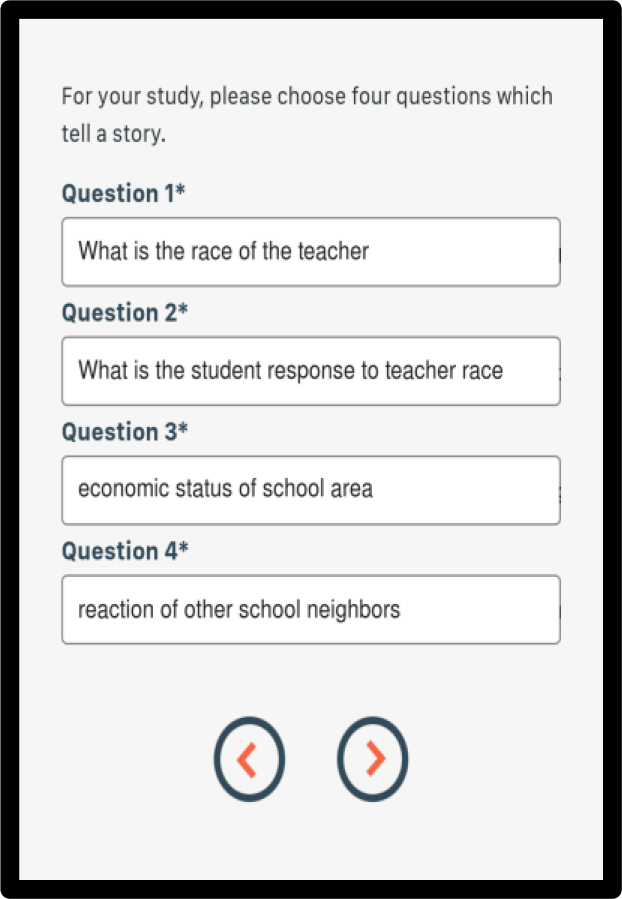
The input to Mind Genomics comprises a set of questions, and alternative answers to each question. Table 1 presents the four questions and the set of 16 answers. Typically, these questions ‘tell a story’, with the different answers providing the necessary material to ‘flesh out’ the story. The questions never appear in the actual experiment with respondents. Rather, the questions are used to elicit the answers, which will appear in combination.

Table 1 presents the information in a way which enables the respondent to ‘graze the vignette,’ and extract the relevant ideas. Each answer is prefaced by an introductory phrase, such as ‘conference topic,’ ‘presenter,’ ‘expert’ and ‘follow-up’ respectively. Although this format does not lead to grammatically elegant vignettes, the format makes it easy to present the respondent with the information necessary to make a decision. In studies using experimentally designed combinations of ideas, with individuals exposed to many combinations, it is becoming increasingly vital to shorten the interview. The time for elegantly written but dense paragraphs has passed, as researchers are forced to do increasingly shorter interviews and experiments. The design of the individual elements in this study (Table 1), and the design of the vignettes are done with the recognition that the entire Mind Genomics experiment should last no more than five minutes.

Table 1. The questions and answers about conferences.


Question A: What is the nature of the conference?

A1

conference topic: problems in world environment

A2

conference topic: problems teaching students to think critically

A3

conference topic: loss of respect and empathy of people towards each other

A4

conference topic: government actions and quality of life


Question B: How are the problems presented to excite emotions?

B1

presenter: talks about personal experiences and suffering

B2

presenter: video presentation narrated

B3

presenter: well-known social activist

B4

presenter: critical NGO (non-governmental organization)


Question C: How do experts present the facts?

C1

expert: well-known university professor with to-do list

C2

expert: well-known author on topic

C3

expert: panel of business people

C4

expert: high government official in topic area


Question D: How does the conference ensure its real value with post conference activities?

D1

follow-up: create workshops to teach how to solve

D2

follow-up: create workshops in schools

D3

follow-up: a stronger awareness thru media

D4

follow-up: create free groups to give meaning and motivation

The answers are combined according to an underlying experimental design, a prescription of what answers or ‘elements’ should be combined [22] The experimental design prescribes a set of 24 combinations for the array of four questions and four answers for each question. The underlying experimental design ensures that all 16 answers are statistically independent, permitting the analysis by OLS (ordinary least-squares) regression. The underlying experimental design ensures that some of the test combinations, called ‘vignettes’, are incomplete, lacking either one or two answers. This deliberate creation of incomplete vignettes is done so that the coefficients from the OLS regression have ‘absolute value,’ allowing them to be compared from study to study, even when the studies comprise other types of messages.

Each respondent evaluated a totally unique set of combinations of vignettes, created according to the same underlying experimental design, but ‘permuted’. This strategy enables the researcher to assess many different combinations of answers or elements [23] it is important to emphasize that this strategy of testing many different vignettes, with 1–2 evaluations of each vignette, means that we look for patterns by looking at the entire space of alternatives, rather than looking for patterns by canceling out the variability. Most research looks for patterns by suppressing the noise through replication. Mind Genomics does the exact opposite, discovering the pattern by looking at a lot of the space, even if the individual measures are ‘noisy.’

The rating 5-pooint rating scale combining understanding and action

Traditionally, Mind Genomics has worked with bipolar Likert scales, anchored at the top and at the bottom. The scales usually have focused on one dimension, whether that be ‘do not understand versus understand’ (what is), or ‘not motivated to do something versus motivated to do something’ (intended action.). When the two topics of ‘what is’ versus’ intended are investigated in the same study, they often have been separate questions, answered quickly in succession. The Mind Genomics experiment presented here represents the next generation, in which a single rating question is created to encompass two dimensions.

For this study, the five rating points appear below:

Here are conferences dealing with major problems. How do you feel about this specific conference as described? Choose one of the following five answers

1=tuned out immediately. ..waste of time

2=don’t understand facts & not motivated to solve problem

3=understand facts but not motivated to solve problem

4=don’t understand facts but motivated to solve problem

5=understand facts & motivated to solve problem

Analyzing the results at a surface level

The easiest way to understand the data, and to compare groups looks at averages. We create the following key dependent variables, and then compare them by group:

  1. Response time
  2. Rating 1 converted to binary (tuned out)
  3. Rating 5 converted to binary (understand facts & motivated to solve problems),
  4. Ratings 3&5 converted to binary, a so-called ‘netted variable’ that we call UNDERSTAND.
  5. Ratings 4&5 converted to binary, another ‘netted variable’ that we call MOTIVATED TO SOLVE PROBLEMS

Table 2 shows the average value for each of these five variables, for total panel, and key subgroups (gender, age, self-defined focus on the topic of these conferences, and finally two groups of mind-sets emerging from dividing the 50 respondents into complementary groups, based upon the pattern how motivated they are to solve problems

Table 2. Average ratings for response time (seconds), and binary variables, based upon the analysis of subgroups.


RT
SECONDS

R1
TUNED OUT

R5
YES UNDERTAND YES MOTIVATED

NET YES UNDERSTAND

NET YES

MOTIVATED

1

Total

5.1

14

23

51

48

2

Female

5.4

13

24

49

51

3

Male

4.7

16

23

54

45

4

Age 50+

7.0

25

23

49

42

5

Age 30–49

4.3

6

27

56

54

6

Age 15–29

2.7

12

16

45

47

7

Q3 Interested

5.0

6

28

56

57

8

Q3 Skeptic

5.9

32

15

43

30

9

Q3 Passionate

3.9

9

21

52

51

10

Q3 Turned off

5.7

46

5

26

19

11

Q3 Not applicable

5.5

22

22

53

31

12

Mind-Set 2A

4.0

14

27

51

54

13

Mind-Set 2B

6.1

15

19

51

42

14

Mind-Set 3C

4.1

13

20

46

53

15

Mind-Set 3D

5.9

12

18

51

45

16

Mind-Set 3E

5.3

19

32

57

45

The important lesson from Table 2 is that there are differences which manifest themselves in the response time, and in the pattern of ratings. We see the expected differences between the respondents who say that they are ‘tuned out’ versus those say they are passionate. Furthermore, some age differences emerge, few gender differences emerge, and so forth.

Table 2 lacks the cognitive dimension of the results. We see behaviors, but the averages have only meaning in a numerical way, telling us an external measure, a measure that we attempt to use as we search for an underlying pattern. The pattern lies within the mind of the researcher, not in the data. There is no cognitive richness in the data presented by Table 2, but only patterns, the meaning of which must be imposed on the data, and with any luck, will be perceived as appropriate for the data, not as imposed on the data.

Finally, in (Table 2) there is the story, but the story is general, not specific, not rich, and certain does not tell us of the inner workings of the mind of the respondent.

Linking messages to judgments

We undertook this Mind Genomic study to understand how people react to the different aspects of these NGO-sponsored conferences. We focused on five different responses that people might have, including absolutely no interest (Rating 1, R1), do not understand and not motivated to solve the problem (Rating 2, R2), understand but not motivated to solve the problem (Rating 3), do not understand but motivated to solve the problem (Rating 4, R4), and finally understand and motivated to solve the problem (Rating3, R3) or motivated to solve the problem (Rating5, R5). We also presented two net key variables; understand (Rating3 + Rating4, R3+R4), and motivated to solve the problem (Rating4 + Rating5, R4+R5).

The underlying experimental design enables us to relate the presence/absence of the 16 elements to either one of the responses (1–5), or any subset of the responses (e.g., those of men versus those of women). The approach used is known generically as regression analysis, occasionally referred to as ‘curve fitting.’ The objective is to deconstruct the dependent variable to the contribution of the 16 contributing elements the answers provided the four questions. The cases or observations for the regression analysis comprise the full set of 1200 vignettes, wherein one knows both the composition of the vignette, e.g., which of the answers were present,’ and the reaction, e.g., which rating or net rating was selected, and thus converted to 100. All rating variables will be presented after transformation to the binary values 0 (not chosen) or 100 (chosen) when the respondent evaluated the vignette. (Table 3) shows us the coefficients for six dependent variables; R1, R5, Net Not Understand, Net Not Motivated, Net Understand, Net Motivated. The model begins with the additive constant. The additive constant is the estimated value of the dependent variable when there are not elements or answers in the vignette, a hypothetical situation since all vignettes comprised at least two elements, and at most four elements. Nonetheless, the additive constant is a useful number, behaving as a baseline. When we look at the coefficients, we should keep in mind that the underlying statistics of the regression enable us to estimate the likelihood that the coefficient that we observe is not just a random occurrence from an underlying distribution of coefficients with a real average or mean of 0. That critical value is 8 or higher, or -8 and lower. Knowledge of that range (beyond +/- 8) helps us focus on those answers or elements which drive a strong positive or negative response. These strong performers are shown as number in bold font, and in shaded cells. Visual inspection suggests possible patterns in this otherwise daunting ‘wall of numbers.’

Table 3. Links between elements (answers, messages) in the vignettes and six dependent variables. The strong linkages are shown in bold font, and shaded cells.


Total

R1 TUNED OUT

R5 YES UND YE & SMOT

NET NOT UNDERSTAND

NET NOT MOTIVATED

NET UNDERSTAND

NET MOTIVATED


CONSTANT

24

20

26

40

50

36

A1

conference topic: problems in world environment

-2

-2

5

-4

-2

6

A2

conference topic: problems teaching students to think critically

-7

6

0

-3

8

11

A3

conference topic: loss of respect and empathy of people towards each other

-3

10

-3

-9

6

12

A4

conference topic: government actions and quality of life

-5

4

3

-4

2

9

B1

presenter: talks about personal experiences and suffering

-3

3

6

-6

-3

8

B2

presenter: video presentation narrated

0

2

4

-7

-4

7

B3

presenter: well-known social activist

-5

3

6

-3

-1

8

B4

presenter: critical NGO (non-governmental organization)

-1

2

9

-6

-8

8

C1

expert: well-known university professor with to-do list

-4

-2

6

7

-2

-3

C2

expert: well-known author on topic

-3

1

0

8

3

-5

C3

expert: panel of business people

1

-3

3

4

-4

-5

C4

expert: high government official in topic area

-3

-4

-1

7

4

-4

D1

follow-up: create workshops to teach how to solve

-6

2

3

1

3

5

D2

follow-up: create workshops in schools

-1

0

-1

-2

1

3

D3

follow-up: a stronger awareness thru media

0

-7

3

6

-3

-6

D4

follow-up: create free groups to give meaning and motivation

-3

2

-2

-1

5

4

We look now in a rapid fashion at the six response variables:

R1 – Tuned out: This response has a low additive constant, 24, meaning that in the absence of elements in the vignette, approximately one quarter of the responses will be ‘tuned out;’ There are no key drivers of ‘tuning out’, at least with the total panel.

R5 – Understand and motivated to make a change: This variable has the lowest additive constant, 20, meaning that in the absence of elements in the vignette, approximately one fifth of the responses will be this positive. It is the job of the elements, the answers, to drive understanding and motivation. Only one element is sufficiently powerful to drive this response, A3, conference topic: loss of respect and empathy of people towards each other. The strong response to A3 emerges because of the strong ‘pull’ of this idea.

Net Not Understand: This variable is constructed from the two response variables which feature ‘Do Not Understand’. They are rating choices R2 and R4. When either is selected, the newly constructed variable, Net Not Understand, is given the value of 100. When neither is selected, Net Not Understand is given the value of 0. Ironically, the only group which promotes a possible misunderstanding is the presenter being from a critical NGO (non-governmental organization.) This suggest that the role of NGO is not perceived as very instructive, at least by the average American respondent.

NET NOT MOTIVATED (to solve problems): This variable takes on the value 100 when the respondent chooses R2 or R3, both involving no motivation to solve problems. Otherwise, this variable takes on the value 0. The key destroyer of motivation to these respondents is the presenter being the well-known author on the topic. It is as if having the well-known author is a symbolic fulfillment of what has to be done. Metaphorically, the author is the ‘priest’ who atones for the congregation. An analogy may be made to modern corporations which send their employees to conferences on innovation, have walls of awards and certificates in their lobbies, but are prisoners to outdated processes, and believe that despite innovation, ‘process is king.’ As long as the employees listen to experts, the corporation may be said to fulfill its role to embrace innovation.

NET UNDERSTAND: This variable is constructed from R3 and R5. Both responses talk about understanding the facts. The additive constant is high. The key element driving this response is the conference dealing with teaching students to think critically. The respondents believe that they will understand the issues involved.

NET MOTIVATED: This variable is constructed from R4 and R5. Both responses talk about being motivated to change. The elements appear to connect with the human experience:

conference topic: loss of respect and empathy of people towards each other

conference topic: problems teaching students to think critically

conference topic: government actions and quality of life

presenter: talks about personal experiences and suffering

presenter: well-known social activist

presenter: critical NGO (non-governmental organization)

Does the topic of the conference affect how people judge the different vignettes?

The features or messages to which one responds are not independent of each other. That is, depending upon one part of the message, another part of the message may either make sense or not make sense. A good example is the price. For example, we can lay out prices for an object, and ask people to rate the degree to which the price is fair. Yet, none of the pricing data makes sense unless we know the object or service for which the price is designed. A $2.00 price for a loaf of bread is meaningful. A $2.00 price for an automobile makes no sense whatsoever.

The Mind Genomics system enables us to assess pairwise interactions answers from different questions (or elements from different silos.) This ability to address the issue of interactions emerges as a happy byproduct of the nature of the underlying experimental design, a structure which specifies the test combinations. The design remains the same for all respondents, but the actual combinations change from one respondent to another. The ensures a statistically robust set of combinations, with all the answers from one question appearing with all the answers in the other questions. In other words, the final set of combinations is sufficiently robust to allow us to pull out pairwise combinations.

The strategy to uncover pairwise interactions is straightforward both in computation and in meaning, respectively. We divide the set of 1200 vignettes into strata, based upon the answer in one question. In the analysis presented here we divide the 1200 vignettes into five strata, depending upon the specific question. We will focus on Question A, the topic of the conference. Our focus now is how the different elements or answers perform when the conference topic is held constant, focusing on problems in world environment, problems in teaching students to think critically, and so forth.

We first sort the data, creating five strata, depending upon the particular topic. We then run the OLS regression once again, this time running the data separately in each stratum. The OLS regression is run on 12 predictors, the four answers from Question B, the four answers from Question C, and the four answers from Question D. Thus, we have five parallel analyses, one for each topic, and one analysis where no topic is specified. Thus, the focus is not on the topics as separate, but the topics as guiding the performance of the remaining elements. This approach has been coined ‘scenario analysis’ [24]. The reason for the term ‘scenario’ is that the analysis operates with a specific type of meeting, the ‘scenario’ in which everything is judged.

What makes a respondent feel that he or she would tune-out, i.e., reject the conference

We begin our analysis of interactions by identifying those elements or answers which lead to the respondent ‘tuning out.’

  1. No topic (all vignettes lack the presence of A1-A4): These vignettes generate a fair amount of tune-out responses. The additive constant is 26, meaning that in the absolute of a topic, and just information about the presenter and the follow-up,, about one out of four responses will be ‘tuned out’ (R1). What really bores people, however, is a presenter with a video narration. The coefficient is +12, a really boring strategy.
  2. Problems in the world’s environment: This topic is also slightly boring, with an additive constant of 20. That 20 means that in the absence of answers or specific elements, just knowing that the conference is about problems in the world’s environment will generate about 20% responses of ‘tuned out.’ However, there are no elements which drive ‘tuned out.’ The elements themselves are interesting.
  3. Problems in teaching students to think critically: This topic of a conference is more interesting. The additive constant is 15, meaning only 15% of the responses are expected to be ‘tuned-out’ when the specific elements or messages are missing. Once again, we see that no elements or answers drive boredom and tune-out. The specifics are interesting.
  4. The loss of respect and empathy of people towards each other: This is also a fundamentally more interesting topic, with the additive constant of 14. There are three elements which drive the respondent feel that he or she would tune out, despite the fundamentally interesting nature of the topic:

    follow-up: create workshops in schools

    presenter: critical NGO (non-governmental organization)

    presenter: well-known social activist

  5. Government actions and the quality of life: This is perhaps the most likely topic to drive the response of ‘tuned out.’ The additive constant is 25. Beyond that, however, we find no elements which are turn-offs.
  6. We conclude from this analysis that there are interactions between the topic of the conference and the elements which can be found boring. Some interactions are dramatic. A narrated video presentation might be a turn off by itself when there is no topic specified, and a turn-off when the topic is loss of respect and empathy of people towards each other (coefficients of +12 and +6, respectively), but will be not a turn off when the topic is government actions and the quality of life (Table 4).

Table 4. Scenario analysis. How the nature of the conference (top row) drives the response R1 (tuned out).


Dependent variable = R1
(TUNED OUT)

no topic

 problems in world environment

 problems teaching students to think critically

 loss of respect and empathy of people towards each other

 government actions and quality of life


Additive constant

26

20

15

14

25

B2

presenter: video presentation narrated

12

-3

-3

6

-9

C2

expert: well-known author on topic

1

-5

0

-16

-1

C3

expert: panel of business people

1

-1

1

-4

7

D2

follow-up: create workshops in schools

0

0

-10

12

-2

B4

presenter: critical NGO (non-governmental organization)

-2

-2

-4

8

-7

D1

follow-up: create workshops to teach how to solve

-5

-8

-5

1

-5

D3

follow-up: a stronger awareness thru media

-5

1

4

7

-4

D4

follow-up: create free groups to give meaning and motivation

-6

-9

-2

3

-5

C1

expert: well-known university professor with to-do list

-7

4

3

-12

-9

C4

expert: high government official in topic area

-7

2

4

-7

-8

B1

presenter: talks about personal experiences and suffering

-8

3

-3

1

0

B3

presenter: well-known social activist

-11

-3

-4

8

-12

Getting the message across – what drives the response of ‘I understand the facts’?

Our second analysis looks at the drivers of ‘I understand the facts), which comprises responses R3 and R5, together. When a respondent selected R3 or R5, this new ‘net variable’ of ‘understand’ was assigned the value 100. When a respondent selected R1, R2 or R4, respectively, this new net variable ‘understand’ was assigned the value 0. The analysis then proceeded as did the previous analysis, considering five strata, based upon the topic of the conference. (Table 5) shows the detailed results.

Table 5. Scenario analysis. How the nature of the conference (top row) drives the ‘net response’ of understand the facts (combined Rating3 and Rating5).


Understand the facts
(R3 and R5)

No topic

 problems in world environment

 problems teaching students to think critically

 loss of respect and empathy of people towards each other

 government actions and quality of life


Additive constant

45

67

54

47

52

D4

follow-up: create free groups to give meaning and motivation

21

-1

-2

1

9

C4

expert: high government official in topic area

17

-7

0

9

8

C3

expert: panel of business people

15

-1

-13

5

-15

D2

follow-up: create workshops in schools

14

-3

1

0

-3

C2

expert: well-known author on topic

8

4

10

8

-2

C1

expert: well-known university professor with to-do list

7

-8

-15

18

-4

D1

follow-up: create workshops to teach how to solve

7

-13

9

-5

9

D3

follow-up: a stronger awareness thru media

7

-13

2

-3

-5

B3

presenter: well-known social activist

-9

-5

-4

4

-1

B1

presenter: talks about personal experiences and suffering

-12

-29

8

-4

3

B4

presenter: critical NGO (non-governmental organization)

-24

-17

0

-5

-4

B2

presenter: video presentation narrated

-36

-12

10

4

3

  1. The additive constants suggest that even without elements or answers, at least half of the responses are going to encompass some understanding. The most likely understanding will come from conferences dealing with problems in the world’s environment. The least likely understand will come from conferences dealing with loss of respect and empathy of people towards each other.
  2. No topic specified – strongest contribution to understanding comes from creating free groups to give meaning and motivation. Follow up here is important.
  3. Problems in world environment – basic understanding is very high (additive constant = 67), but no elements or answers increase understanding.
  4. Problems teaching students to think critically’

    expert: well-known author on topic

    presenter: video presentation narrated

  5. Loss of respect and empathy of people towards each other – expert: well-known university professor with to-do list
  6. Government actions and quality of life –

    Follow up: create free groups to give meaning and motivation

    expert: high government official in topic area

What makes the respondent feel that she or is motivated to make changes?

Our third analysis looks at the net rating of ‘yes, motivated to make changes.’ This net variable comprises the selection of rating 4 (do not understand the facts, motivated to make changes) or the selection of rating 5 (understand the facts, motivated to make changes).

The actual analysis is identical. The only difference is the choice of the dependent variable. (Table 6) presents the detailed results regarding what motivates the reader to believe that she or he will take action.

Table 6: Scenario analysis. How the nature of the conference (top row) drives the ‘net response’ of motivated to make changes (combined Rating4 and Rating 5).


Motivated to make changes (R4 and R5)

No topic

 problems in world environment

 problems teaching students to think critically

 loss of respect and empathy of people towards each other

 government actions and quality of life


Additive constant

51

31

36

59

47

C4

expert: high government official in topic area

4

-2

-13

-8

1

D3

follow-up: a stronger awareness thru media

3

4

-15

-19

-2

B1

presenter: talks about personal experiences and suffering

1

13

0

16

9

B4

presenter: critical NGO (non-governmental organization)

0

16

12

-4

16

B3

presenter: well-known social activist

-1

11

22

-6

2

C1

expert: well-known university professor with to-do list

-1

-14

4

2

-6

D1

follow-up: create workshops to teach how to solve

-5

15

-2

1

9

D2

follow-up: create workshops in schools

-5

7

17

-12

-3

B2

presenter: video presentation narrated

-6

20

19

0

0

C3

expert: panel of business people

-7

-15

9

-2

-11

D4

follow-up: create free groups to give meaning and motivation

-8

22

9

-4

9

C2

expert: well-known author on topic

-18

-4

10

1

-11

When we look at the additive constants, showing the expected likelihood of people saying ‘I am motivated to make changes,’ we find that the highest motivation emerges with conferences on loss of respect and empathy of people towards each other (additive constant = 59.) The lowest likelihood emerges with conferences regarding problems in the world’s environment (additive constant = 31), and problems teaching students to thinking critically (additive constant = 36).

The elements or answers which drive the motivation tell their own stories. The operating elements which ‘work’ must have a topic of the conference

Problems in the world’s environment – best to have a video presentation and follow-up groups.

Problems teaching students to think critically – best to have a social activist presenting, or a narrated video presentation, and then follow-up groups

Loss of respect and empathy of people towards each other – best to have a person with experience talking about the experience

Government actions and quality of life – best to have an NGO presenter

Gender differences

Often, genders do not differ dramatically from each other, except in topics that are gender-relevant, such as cosmetics. The data from the total panel (Table 3) can be deconstructed into the responses by gender (Table 7). When we look at males versus females for the net response of ‘understand’ (ratings 3 and 5 combined), we see that women are more likely to say that they ‘understand the fact’s (additive constant 55 for women, 43 for men), and that they are also more ‘motivated’ (additive constant 41 for women, 28 for men). Thus, the first observation is that women will be more likely to say that they are affected by the conference.

Table 7. Comparison of male versus female in their ratings of ‘understand the facts’ and ‘motivated to make a change.’ The numbers in the body of the table are the coefficients from the ‘net’ models (understand = R3 & R5; motivated = R4 & R5).


Understand

Understand


Motivated

Motivated


M

F


M

F


Additive constant

43

55


28

41

A1

conference topic: problems in world environment

5

-8


8

5

A2

conference topic: problems teaching students to think critically

19

-3


5

17

A3

conference topic: loss of respect and empathy of people towards each other

12

0


3

21

A4

conference topic: government actions and quality of life

2

2


5

13

B1

presenter: talks about personal experiences and suffering

1

-6


7

9

B2

presenter: video presentation narrated

2

-9


3

11

B3

presenter: well-known social activist

0

0


10

6

B4

presenter: critical NGO (non-governmental organization)

3

-16


13

3

C1

expert: well-known university professor with to-do list

2

-6


-1

-4

C2

expert: well-known author on topic

0

7


1

-9

C3

expert: panel of business people

-6

-2


4

-12

C4

expert: high government official in topic area

-2

9


2

-9

D1

follow-up: create workshops to teach how to solve

2

4


8

2

D2

follow-up: create workshops in schools

9

-6


8

-2

D3

follow-up: a stronger awareness thru media

0

-5


-4

-8

D4

follow-up: create free groups to give meaning and motivation

3

7


6

3

The real gender differences emerge when we look at the answers or elements. In terms of helping the person to understand the facts, men strongly feel that the conference will help them to understand two topics, problems teaching students to think critically and loss of respect and empathy of people towards each other. It may be that these are the only topics that men feel they will learn something new.

When it comes to the topic of motivation, (Table 7) shows dramatic differences by gender. Men are convinced by presenters from NGO’s and by social activists. Men start at a lower level (additive constant = 28), feeling that it will be harder to motivate them, and in turn feel that NGO’s and social activists will be effective. Women, in contrast, are far more likely to say that they will be motivated (additive constant = 41). The truly dramatic topics, those which women think will motivate them those dealing with loss of respective and empathy (coefficient = 21), teaching students to think critically (coefficient = 17), and government actions and the quality of life (coefficient = 13).

In search of different mind-sets

It has become increasingly clear during the past decades that people differ dramatically in what they find interesting. This variation across people in liking is not a new discovery. The old adage holds increasingly today: Of taste one does not dispute. Each person has his or her own pattern of preferences, these preferences ranging from the sensory experience one enjoys (e.g., different flavors), but moving on to experiences themselves (ways of being treated; activities to do on vacations.)

The notion of differences across people is obvious. One important question is to develop a way to measure the pattern of preferences, which has been done by Mind Genomics, and just demonstrated for data from the total panel versus from males versus females. The next question is to determine whether there are fundamental groups of people, so that the patterns of preference are similar within a group, but the patterns of the groups differ dramatically from each other?

Discovering different groups, mind-sets, can be formulated in terms of a statistical problem answerable by the technique of clustering [25]. Each respondent in this study generated a set of 16 coefficients, one coefficient for each of the 16 phrases. The coefficients we choose are those emerging out of Ratings 4 and 5, motivated to change. Clustering divides the set of 50 respondents into mutually exclusive groups, with the property that the patterns within a group are similar to each other, whereas the patterns of the averages of the groups are very different from each other. These groups, statistically developed, are called Mind-Sets in the parlance of Mind Genomics.

The clustering procedures works with a measure of ‘distance’ between pairs of respondents. The distance is defined as the quantity (1-R), where R is the Pearson correlation coefficient. Thus, the distance measure looks at how well the two patterns correlate. When the patterns of coefficients from two respondents correlate perfectly, they are really reacting in the same way to the answers or elements. The Pearson correlation is 1.0, and the distance should be minimal, which it is. The distance is (1-R), i.e., (1–1), or 0. In contrast, when the two respondents react in opposite ways, they are maximally different from each other. The Pearson correlation is -1, and the distance is maximal (1 – – 1 = 2.)

The clustering procedure is agnostic, not concerned with the meaning of the clusters, focusing only on satisfying the mathematical criteria of maximal distance between the averages of the two clusters on the 16 answers, and minimal distance between pairs of respondents within a cluster. The clustering must be augmented by some researcher input, specifically:

Parsimony – fewer clusters or mind-sets are better than more, both from an aesthetic point of view in research, as well as from an actionability point of view when the data are put to use.

Interpretability – the cluster must ‘make sense,’ i.e., tell a story

The two clusters based upon ‘Motivated’ (R4 and R5; converted to binary) were not interpretable. Too many different ‘stories’ emerged. The three clusters which emerged based upon ‘Motivated’ tell a more coherent story, and so we settle on the three clusters

The three-cluster solution is remarkably simple to interpret, suggesting three different ways to motivate the audience. There are those who are motivated by the topic, those who are motivated by the presenter, and those who are motivated by the after-conference opportunities to share ideas (Table 8).

Table 8. Comparison of three emergent Mind-Sets based on clustering the coefficients from ‘Motivated’ (R4 & R5). The numbers in the body of the table are the coefficients from the ‘net’ models (motivated R4 & R5; understand the facts R3 & R5.


Motivate (R4 & R5 as binary)


Understand (R3 & R5 as binary)


MS1

MS2

MS3


MS1

MS2

MS3


Additive constant

26

50

26


30

46

77


Mind-Set 1 – Responds to the topic


A3

conference topic: loss of respect and empathy of people towards each other

29

5

7


15

9

-6

A4

conference topic: government actions and quality of life

25

9

-6


9

1

-3

A1

conference topic: problems in world environment

24

4

-6


-4

-2

0

A2

conference topic: problems teaching students to think critically

23

1

12


21

7

-4

D2

follow-up: create workshops in schools

16

-19

12


2

3

-4


Mind-set 2 – responds to the type of presenter


B3

presenter: well-known social activist

-1

18

7


1

-1

-3

B2

presenter: video presentation narrated

-1

17

2


5

-2

-15

B4

presenter: critical NGO ( non-governmental organization)

6

16

-1


-10

-2

-12

B1

presenter: talks about personal experiences and suffering

4

14

3


-4

0

-5


Mind-set 3 – Responds to activities created for the after-conference


D1

follow-up: create workshops to teach how to solve

6

-19

30


5

2

1

D4

follow-up: create free groups to give meaning and motivation

5

-11

24


12

4

-3


Does not appeal to any of the three Mind-sets generated from Motivation


C2

expert: well-known author on topic

-11

3

-2


20

-3

-8

C4

expert: high government official in topic area

-21

5

2


12

-1

1

C1

expert: well-known university professor with to-do list

-9

-2

2


10

-9

-5

C3

expert: panel of business people

-9

0

-3


6

-10

-11

D3

follow-up: a stronger awareness thru media

6

-25

6


1

5

-19

Finding mind-sets in the general population for better conference design and effective messaging

Mind Genomics as we have just demonstrated begins to provide a corpus of information about the aspects of daily life. The issue beyond science and discovery is application. How can one apply these results in a way which makes the discoveries more than simply part of the knowledge base of sociology and human behavior? Can we learn more if we can expand the discovery of these three mind-sets beyond the limited confines of this study of 50 respondents? In other words, can we apply this information to create better conferences, or at least better understand the audience’s predispositions towards what they want in a conference?

It will be difficult, if not impossible, to assign a person to the proper mind-set simply by knowing who the person IS. (Table 9) shows the distribution of the three mind-sets by gender, by age, and by how the person describes herself or himself when it comes to issues about the world. The distribution is fairly flat, so any opportunity to find a specific group of people with a designated mind-set if probably going to end up in failure.

Table 9. Distribution of the three mind-sets across gender, age, and self-report attitude towards conferences.


Mind-Set 1 – Responds to the topic

Mind-set 2 – responds to the type of presenter

Mind-set 3 – Responds to activities created for the after-conference

Total

Total

16

18

16

50

Gender


Male

9

9

6

24

Female

7

9

10

26

Age


No Answer

0

1

0

1

Age 15 to 29

3

3

2

8

Age 30 to 49

5

9

7

21

Age 50 plus

8

5

7

20

Attitude towards
conferences


Turned Off

0

2

2

4

Skeptical

1

3

3

7

Interested in the world

10

11

8

29

Passionate

3

2

2

7

No answer

2

0

1

3

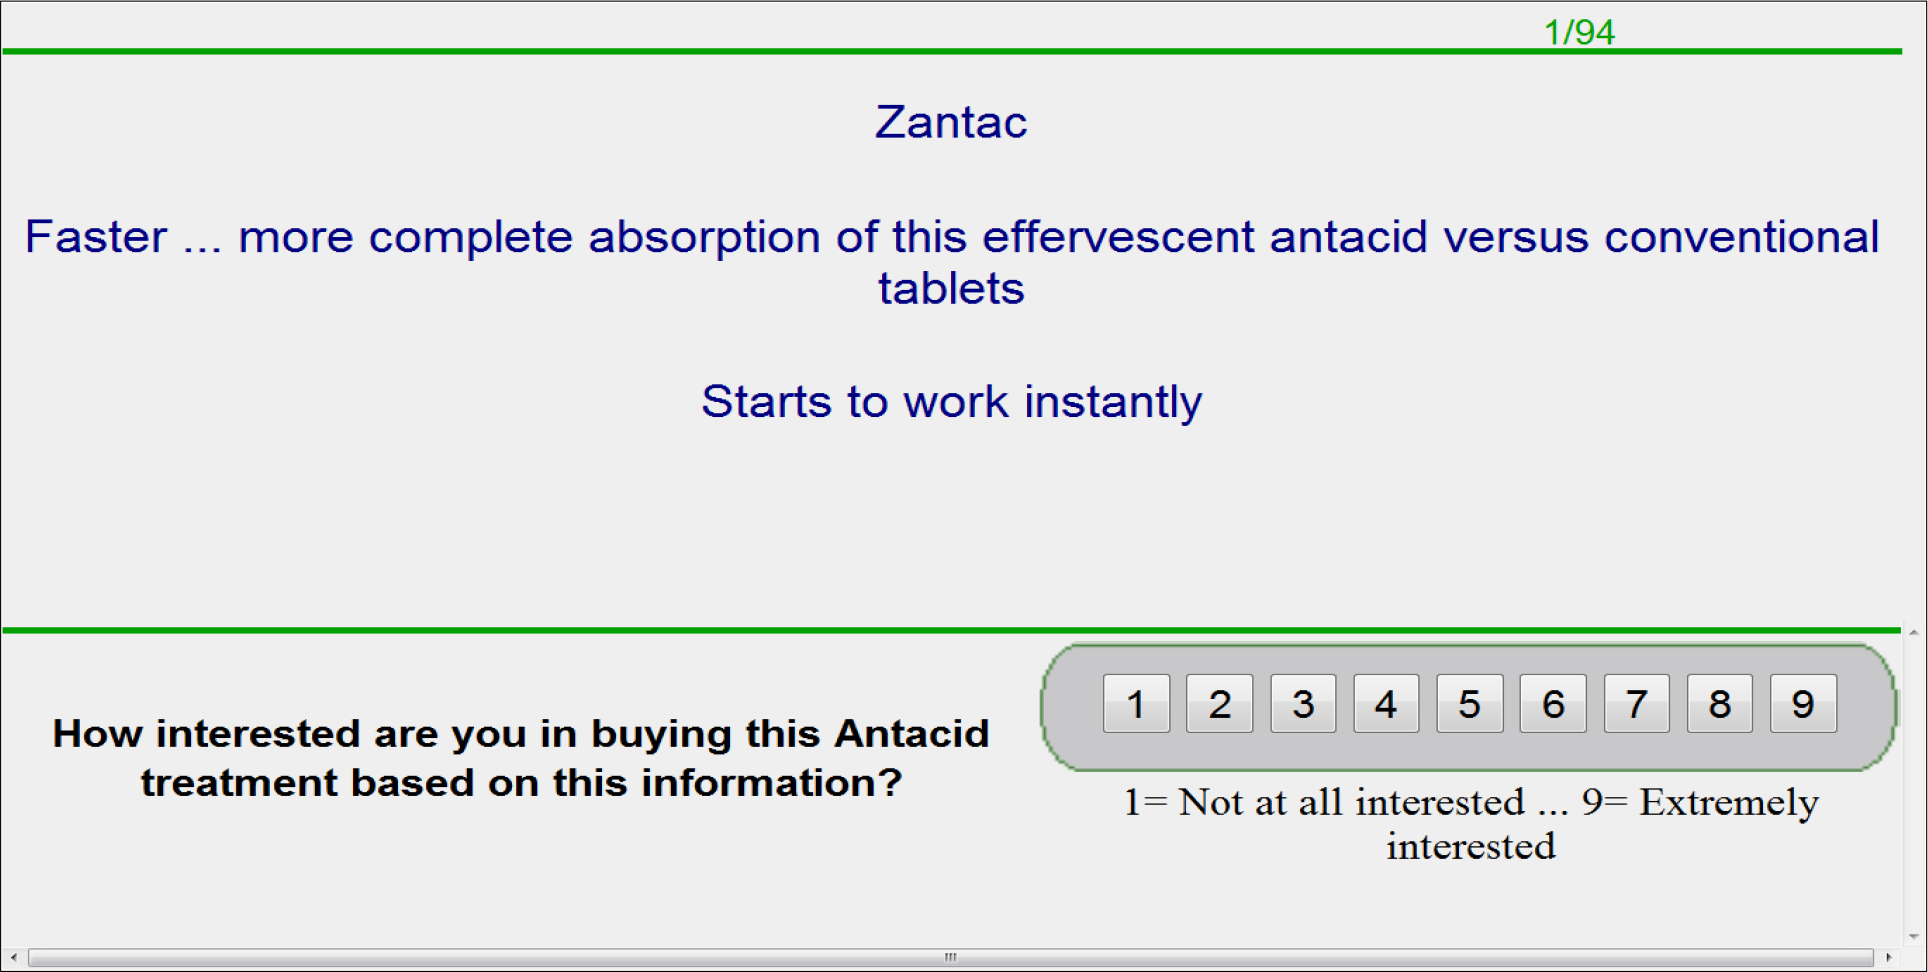
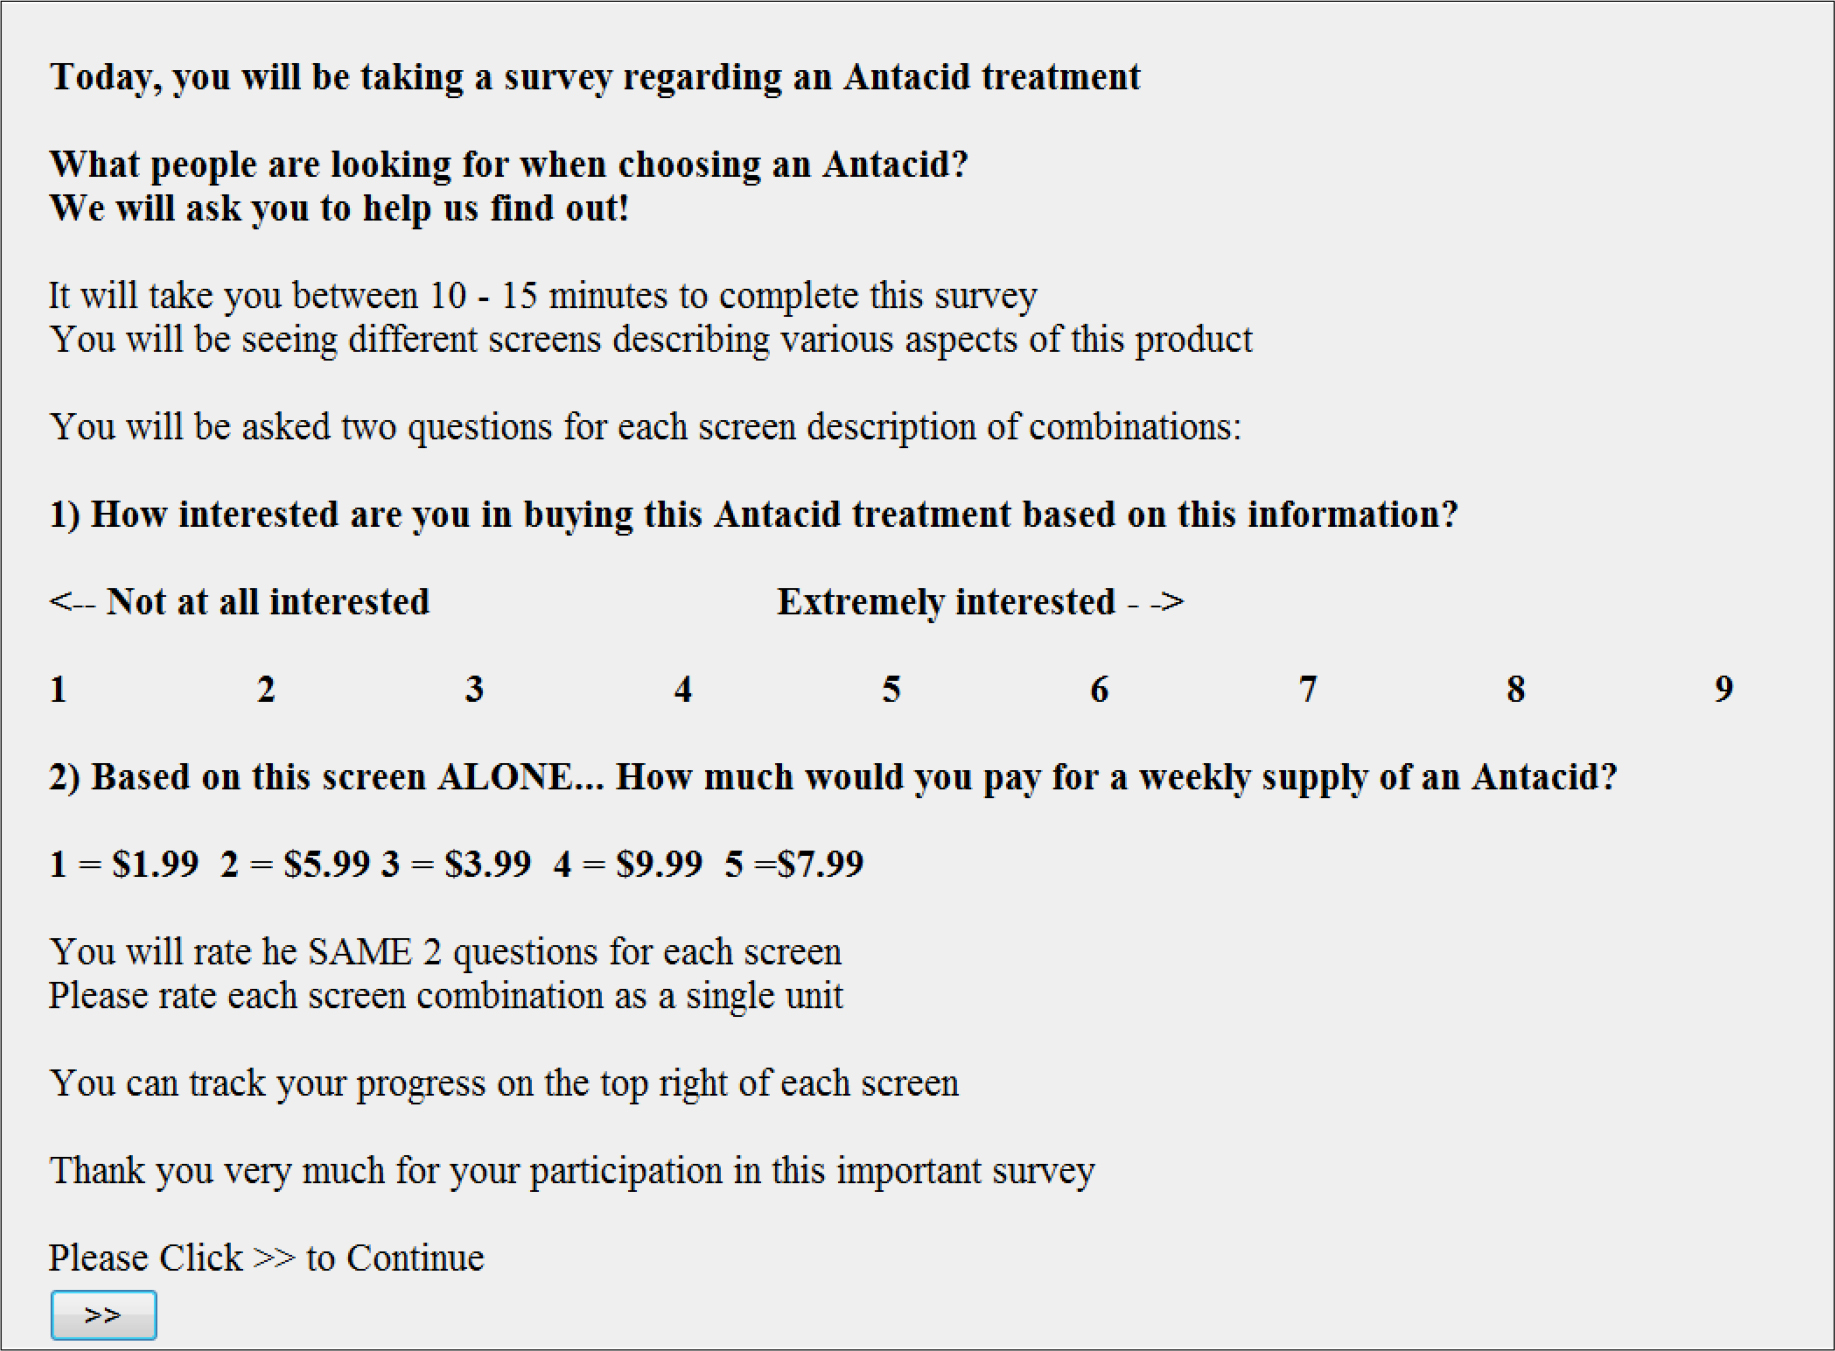
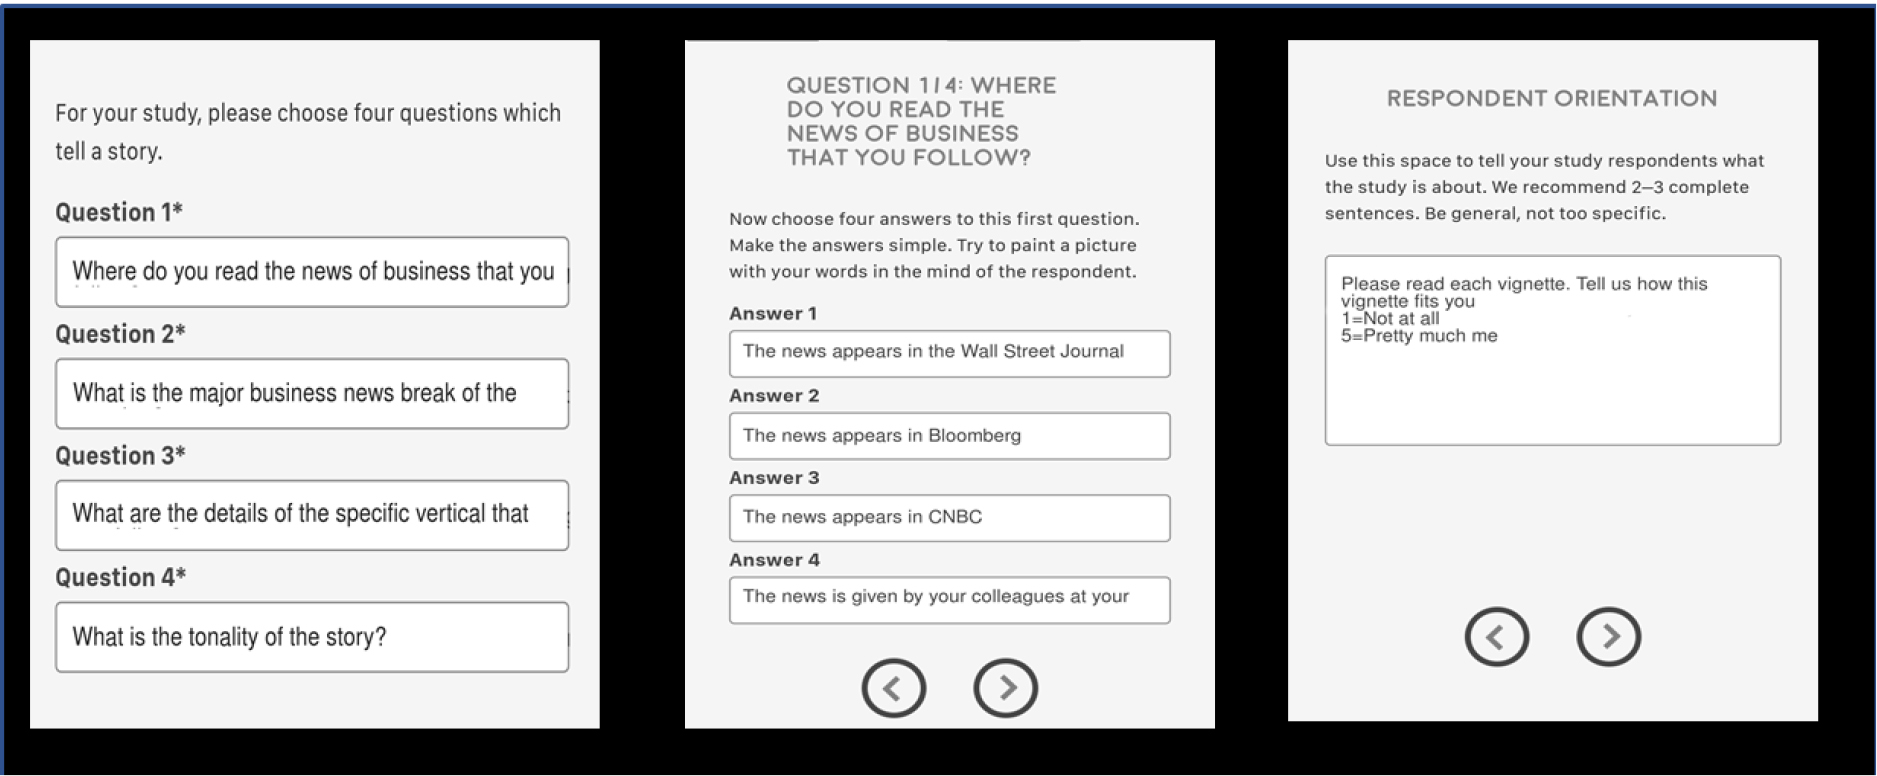
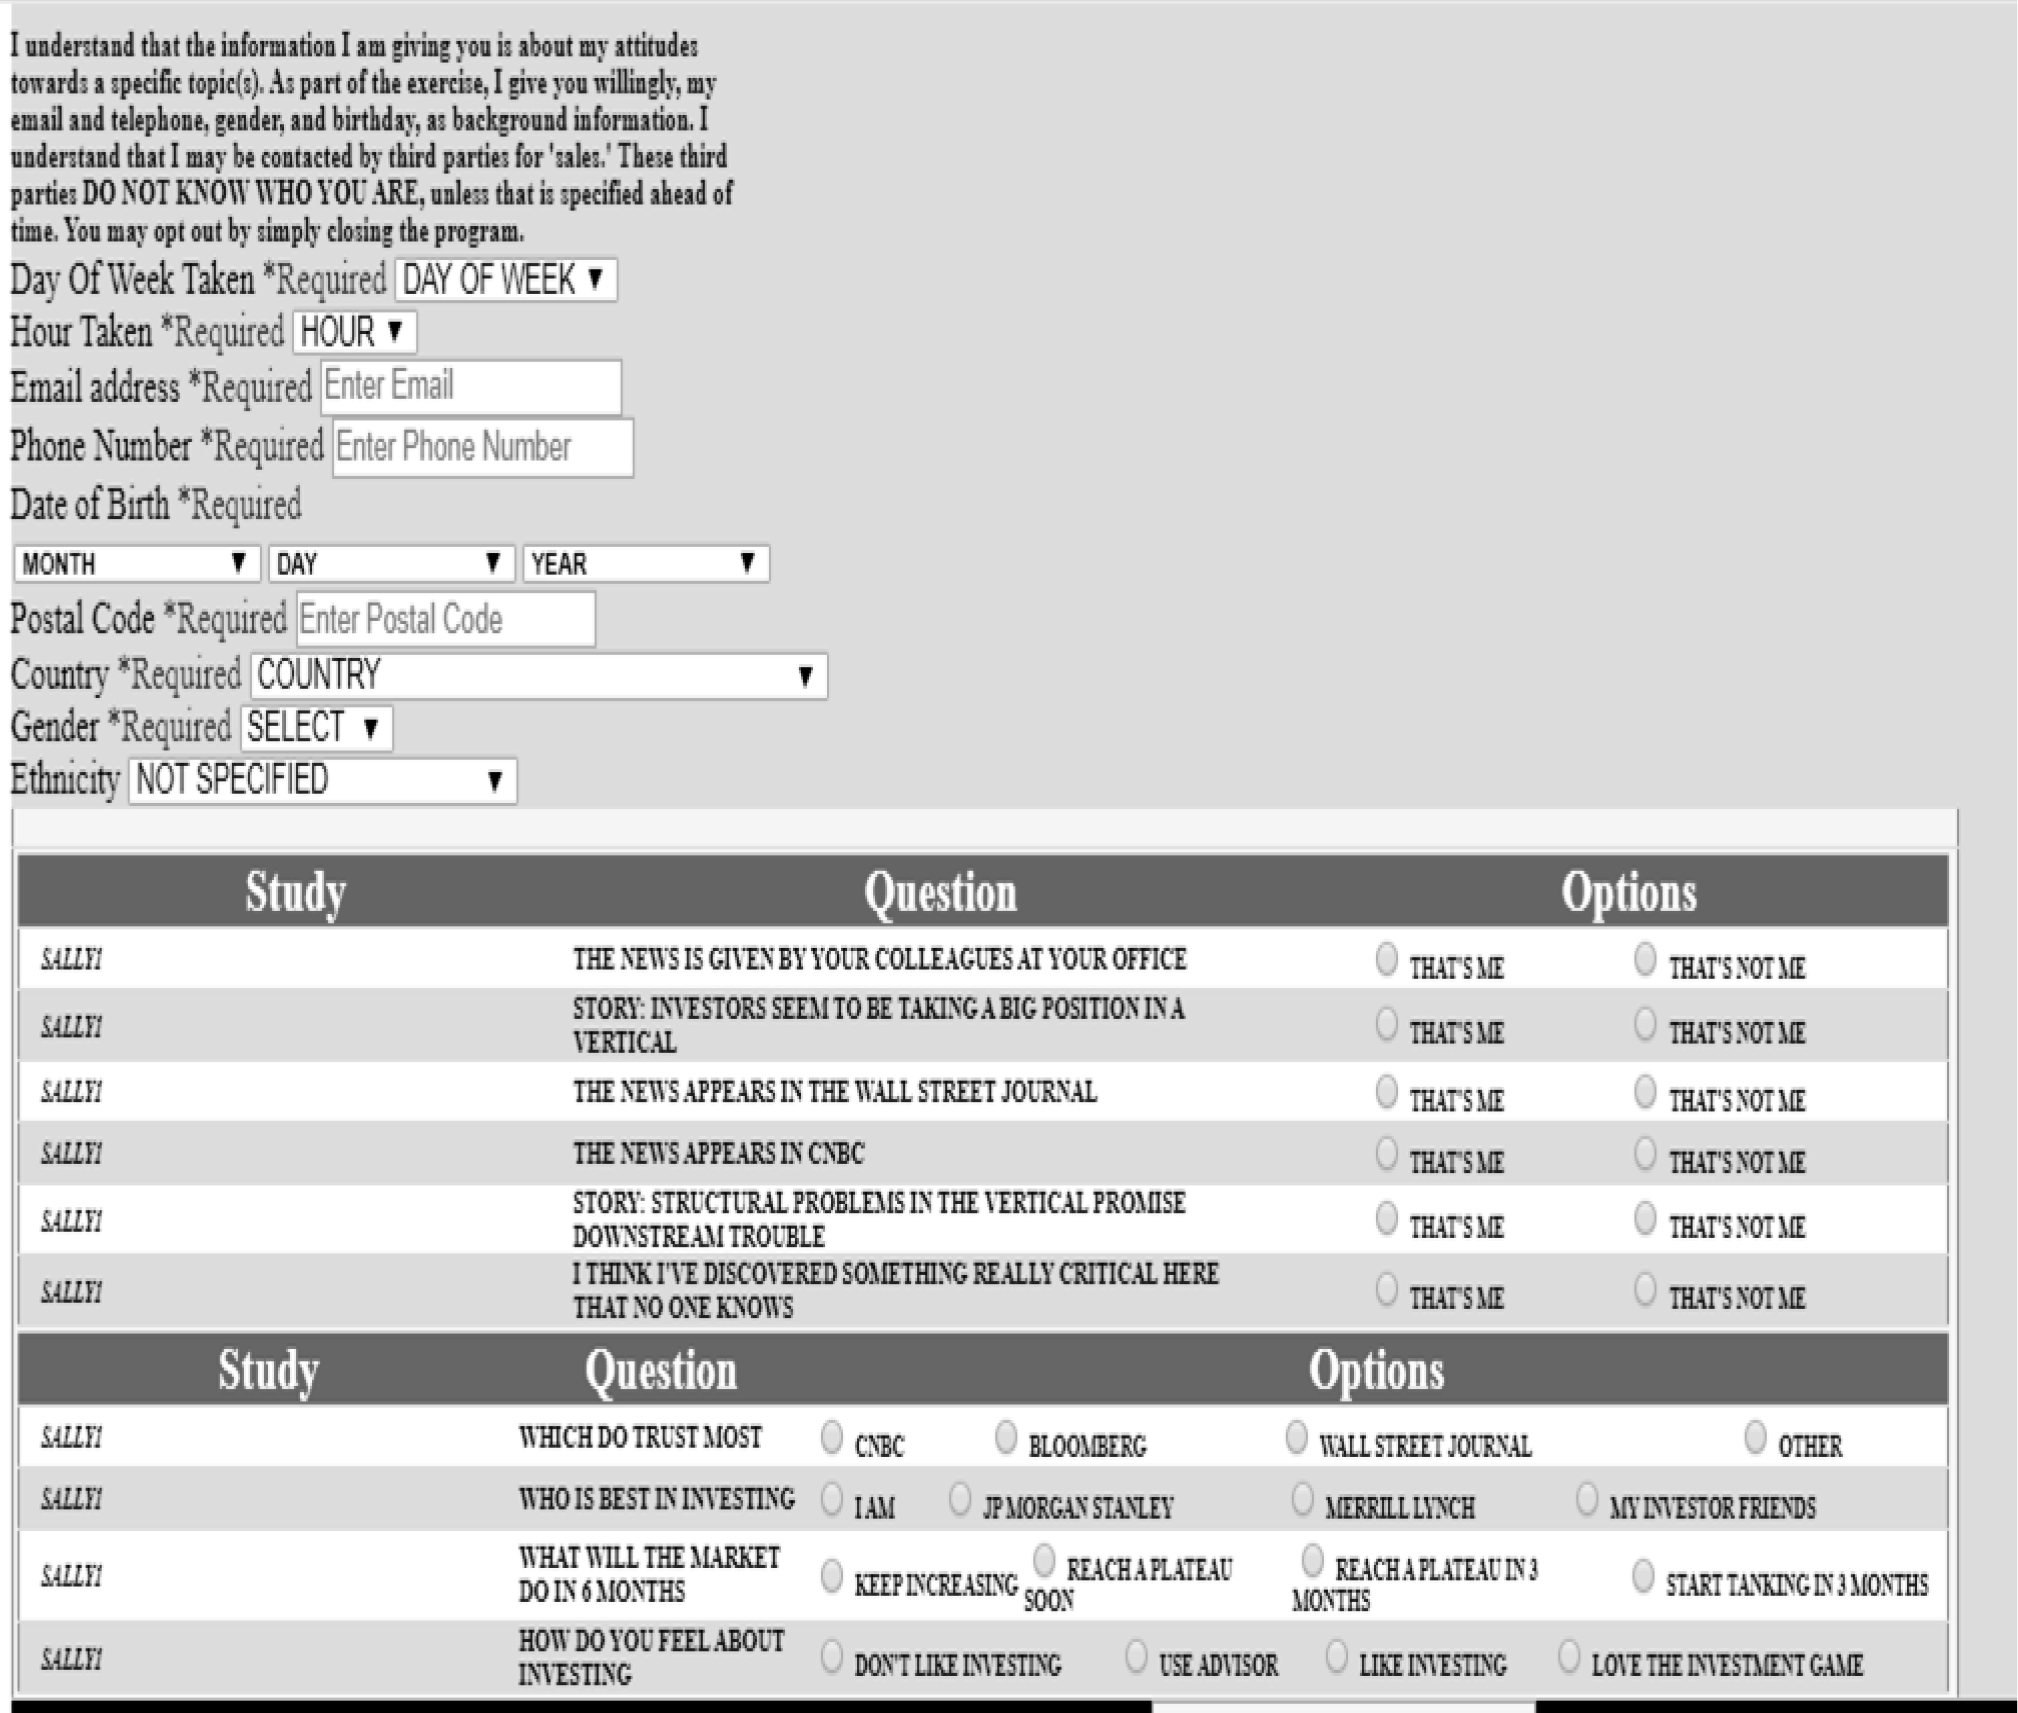
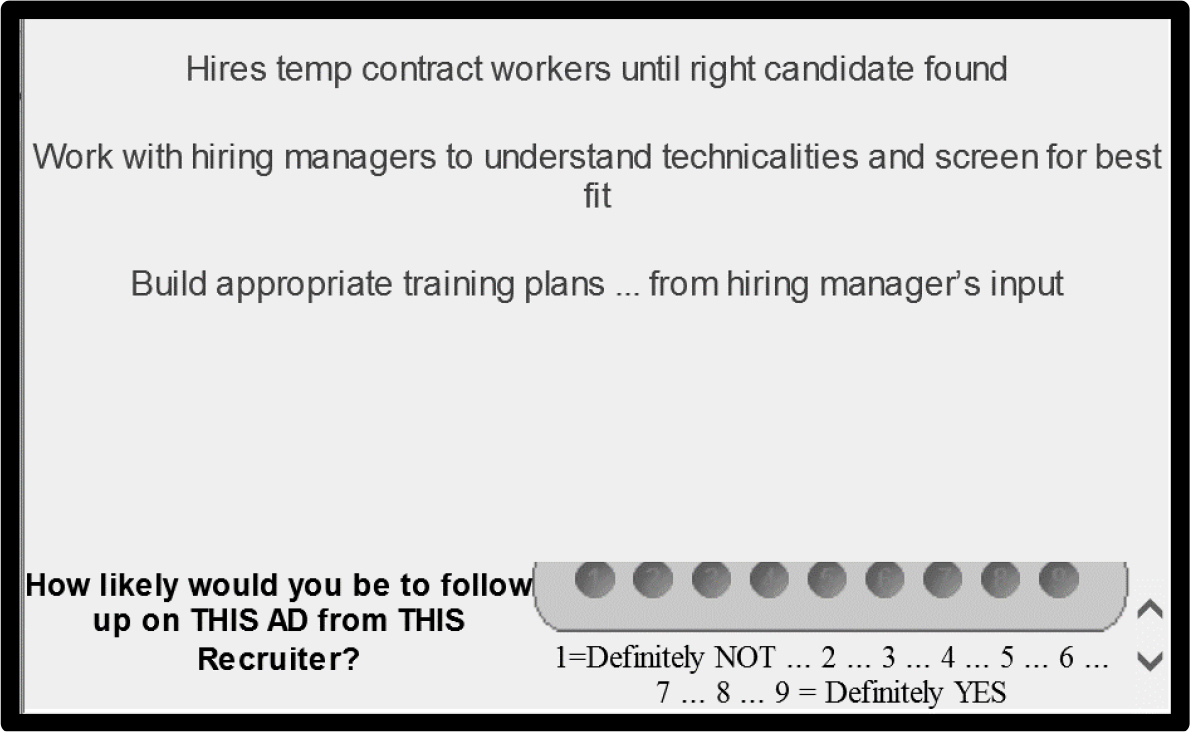
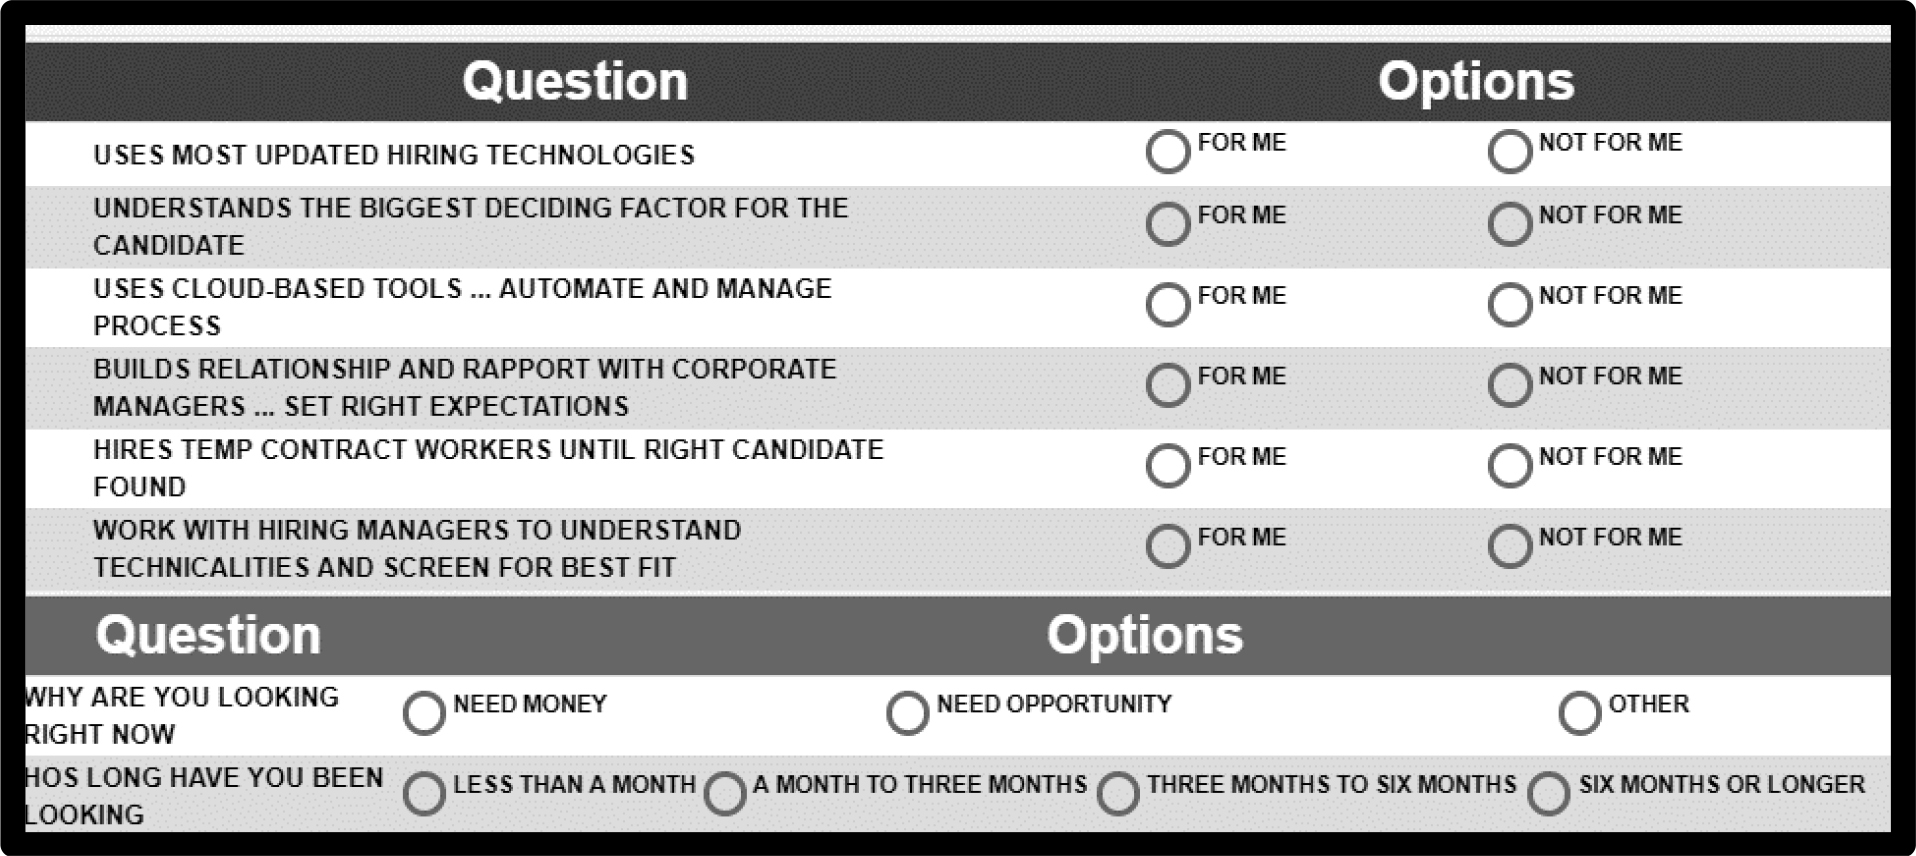
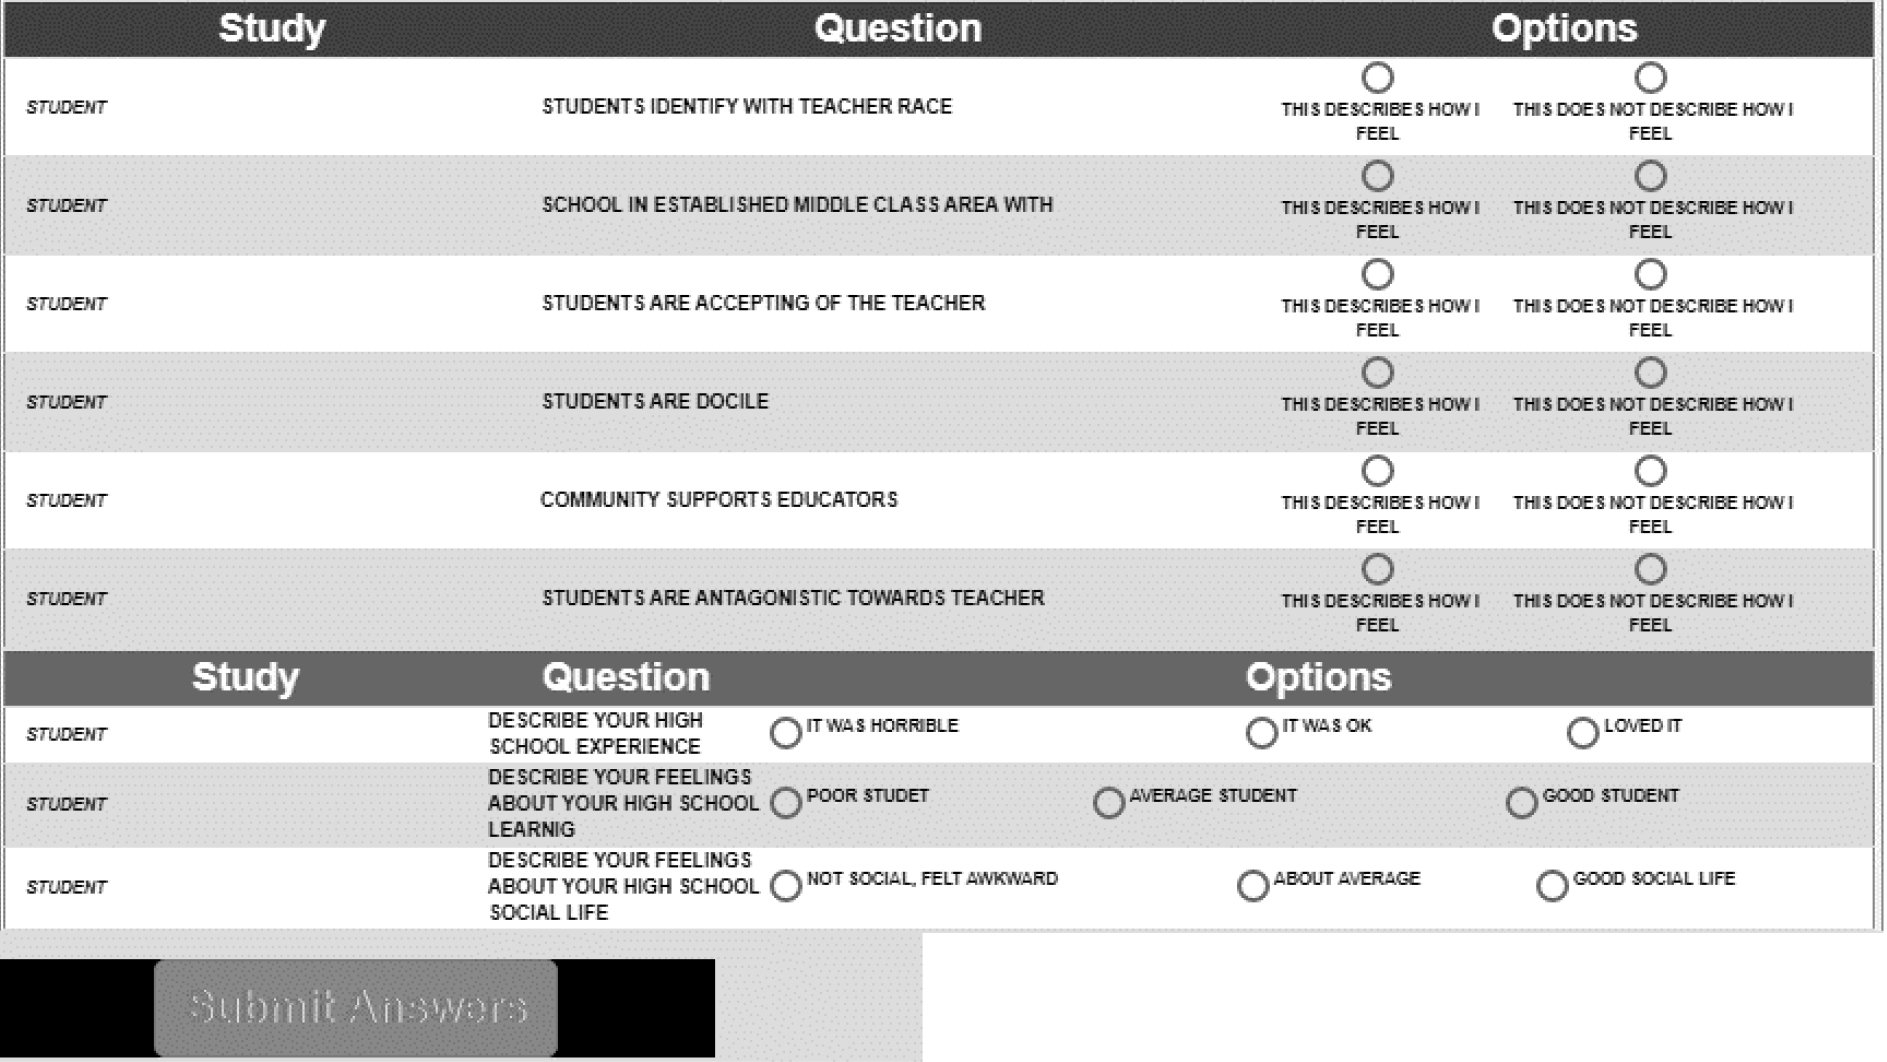
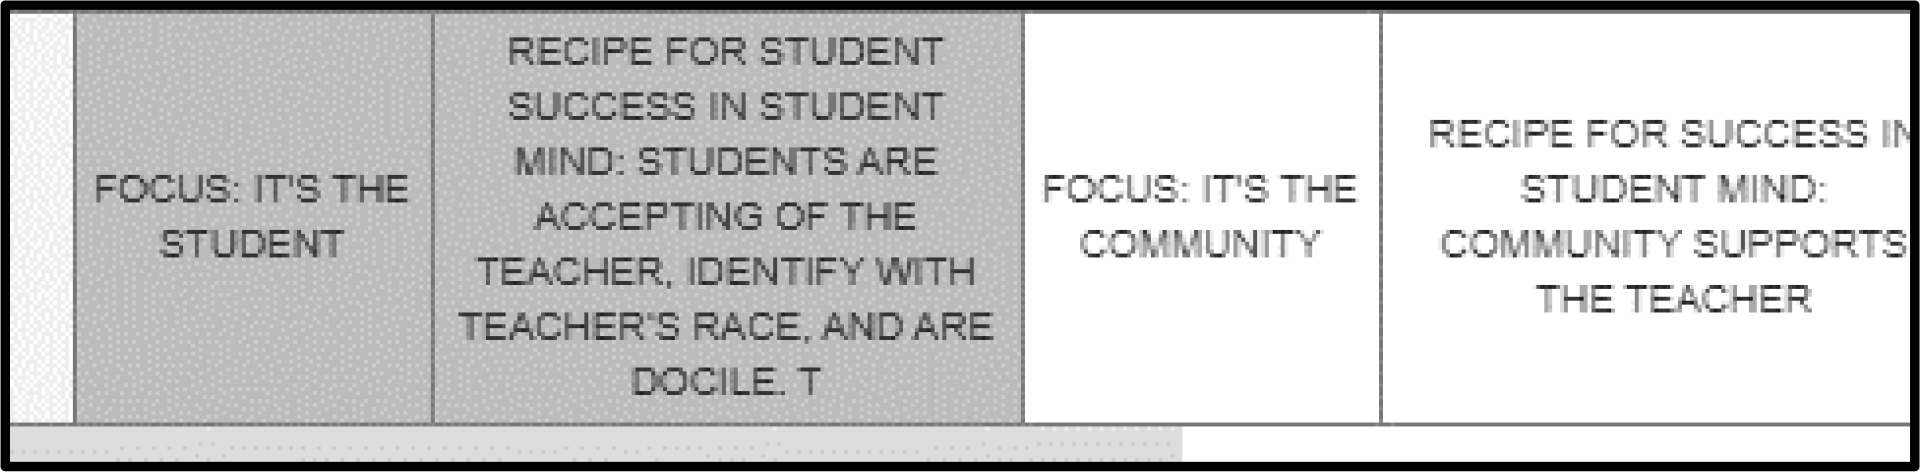
An alternative way to identify people comes from reducing the large-scale experiment to a set of questions, the PVI, the personal viewpoint identifier. The questions emerge from the actual experiment, the study described here. The PVI as currently designed, comprises a fixed number of six questions, with the questions themselves taken from the actual study, and thus varying from study to study. The respondent reads each question and chooses one of two answers. The total set of 64 patterns is mapped to the assignment to a mind-set. Thus, each of the possible patterns corresponds to the likely membership in one of the three mind-sets. The approach is empirical, based upon the actual study, with the PVI created shortly after the experiment.

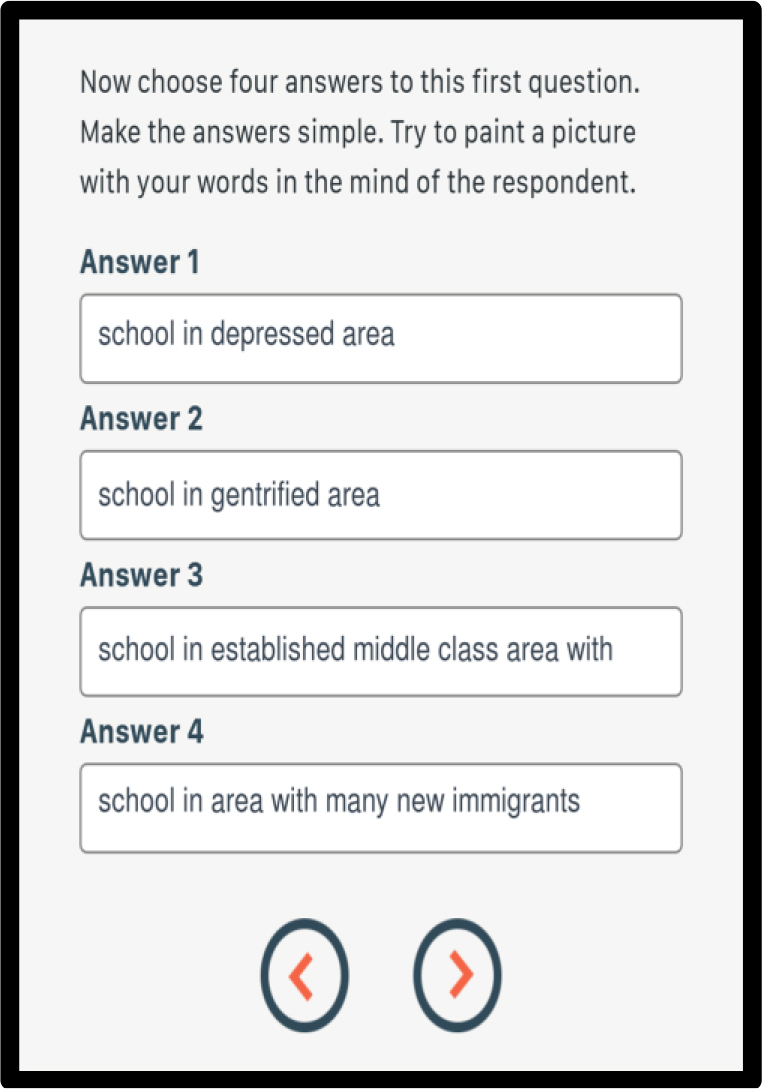
(Figure 1) shows the PVI as the respondent see it. It takes approximately 30–45 seconds to complete the PVI. The appropriate mind-set may either be returned in a report to the respondent as a motivating device to make the PVI fun, and in turn, the data may be store in a digital record. That record, obtained from thousands of people, may be used for marketing in the case of commercial events, and follow-up for other uses, e.g., for health when the topic is not conferences, but health-issues and concerns.

A parenthetical note: Without the knowledge of mind-sets, and the disturbing reality that these mind-sets distribute without any noticeable skew towards a specific group in the population, marketers, event planners and others continue to believe that who a person is co-varies with how a person thinks. That is, in the absence of such knowledge, one must use demographics and other variables. Rather than doing the simple Mind-Genomics experiment followed by a PVI for the topic, the strategy has evolved to using Big Data of low information density, coupled with very high-powered analytics. The metaphor is needing to rely upon powerful, expensive equipment in a mine where the gold is rare, rather than using simple equipment or even one’s own hands in a mine where the gold is abundant.

MIND GENOMICS-032_ASMHS_f1

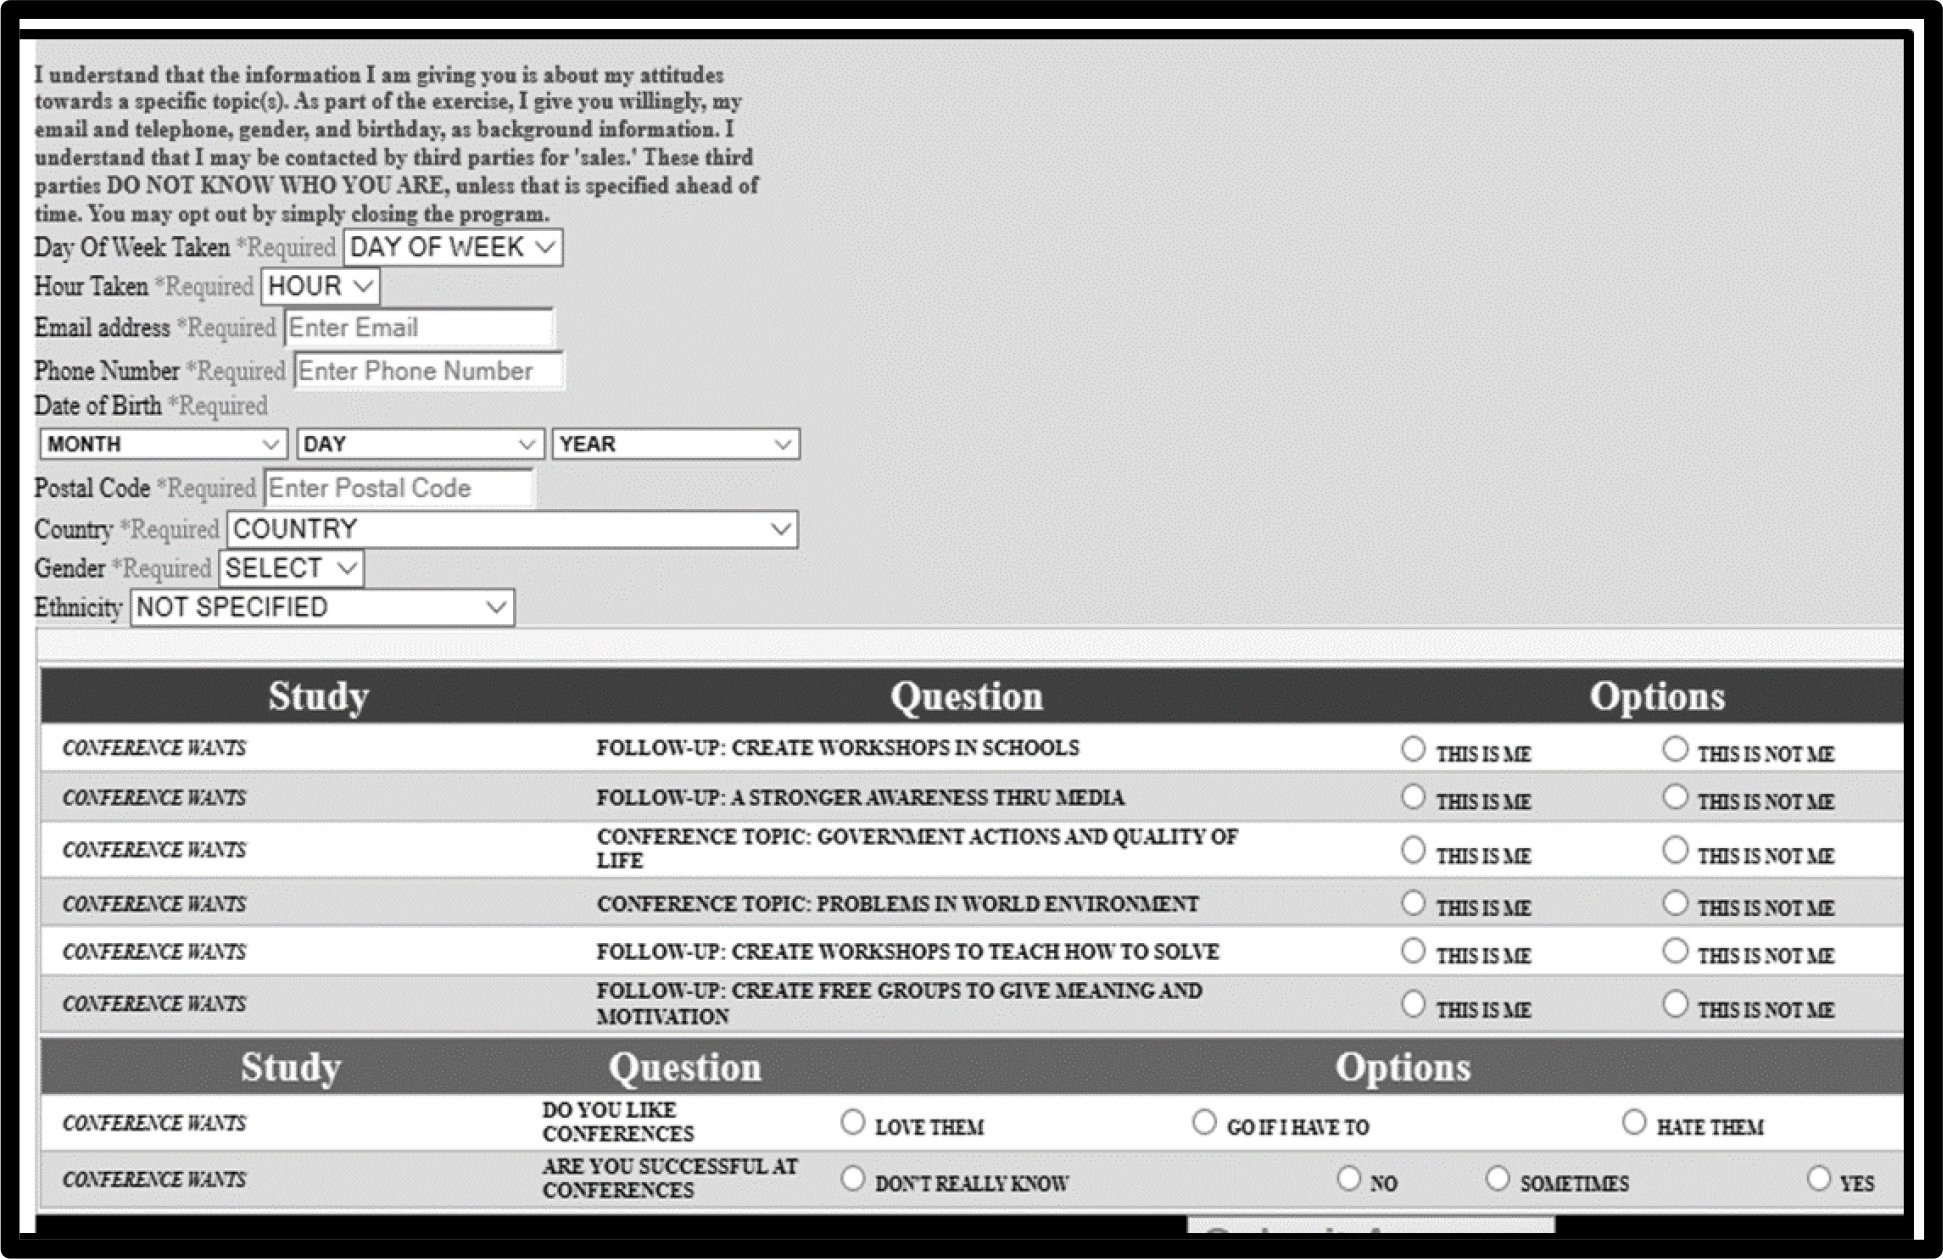
Figure 1. The PVI for conferences as the respondent would see it.

Response time

Beyond the aspect of what persuades at a cognitive level, aspects captured in the rating, lies a whole world of ‘processing,’ of psychological aspects to which the cognitive mind may not be privy. Experimental psychologists almost a century and a half ago recognized that beneath the surface responses to test stimuli lie many factors, such as attitudes, norms, and so forth. These factors govern the response but cannot be articulated.

Recent developments in Mind Genomics have focused on capturing the response time to vignettes, defined as the time between the appearance of the test stimulus and the response to the test stimulus. With the advent of today’s computer technology this information is readily available. The response times (often referred to in the literature as ‘reaction times’) become meaningful when they can be paired with specific stimuli, as they are in the Mind Genomics paradigm. That is, when the researcher can estimate the number of seconds that can be linked with each answer, it becomes possible to learn more about what engages the respondent. We don’t know what is happening, but we do know that some answers are processed more slowly (longer response times), and some elements are processed more quickly (shorter response times.)

The analysis of response times requires a slightly modified equation. The equation incorporates all the answers or elements as predictors, but there is no additive constant. The rationale is that in the absence of answers or elements in the vignette the response time is 0. We write the equation as follows:

Response time = k1(A1) + k2(A2) … k16(D4)

(Table 10) shows the response times for the three mind-sets generated from the mind-sets based upon ‘motivation’. The table shows the longest response times as shaded cells with bold font. What surprises in a delightful way is the observation that the different mind-sets pay attention in accordance with their mind-sets. The correspondence is not perfect, but there is a clear connection between what persuades/motivates and what people attend to. This is an area worth exploring in more detail.

Table 10. Estimated response times attributes to the different answers/elements, from each of the three mind-sets.


MS1

MS2

MS3


Most engaging – MS1 (responds to topic)


C4

expert: high government official in topic area

2.4

1.5

1.4

C1

expert: well-known university professor with to-do list

2.2

1.5

1.3

A4

conference topic: government actions and quality of life

2.1

1.6

1.7

A2

conference topic: problems teaching students to think critically

1.9

1.3

1.3

C2

expert: well-known author on topic

1.9

1.5

1.6


Most engaging – MS2 (responds to presenter)


B4

presenter: critical NGO .. non-governmental organization

1.0

2.0

1.2


Most engaging – MS3 (responds to after-conference activities)


D4

follow-up: create free groups to give meaning and motivation

1.7

0.9

2.2

D3

follow-up: a stronger awareness thru media

1.3

0.2

1.9


Less engaging


B3

presenter: well-known social activist

1.6

1.7

1.7

B1

presenter: talks about personal experiences and suffering

1.6

1.4

1.7

C3

expert: panel of business people

1.7

1.6

1.6

D2

follow-up: create workshops in schools

1.5

0.3

1.6

D1

follow-up: create workshops to teach how to solve

1.6

0.2

1.6

B2

presenter: video presentation narrated

1.3

1.4

1.5

A3

conference topic: loss of respect and empathy of people towards each other

1.7

1.0

1.3

A1

conference topic: problems in world environment

1.7

1.1

1.0

Discussion and conclusion

The literature of conferences is a growing one. The focus, however, is the nature of the specific conferences, from the point of view of the topic, and the influence of the topic. Few papers, if any, focus on the psychology of the listener, other than perhaps papers dealing with the role of conferences in the development of a person’s professional career. This paper introduces a new world of understanding conferences, not so much from the topic and the importance of the topic to the world, but rather conferences as a part of a person’s quotidian, daily life. As noted in the presentation of Mind Genomics, the world of the everyday presents us with a way to understand people. With the tools of Mind Genomics, we begin a new psychology of people, the psychology of the ordinary, of which conferences as a topic constitute one facet.

The results from the data should not surprise, although the reality is that were one to be asked about ‘what makes a good conference,’ one might not emerge with answers as clear as those provided by Mind Genomics. Nor, in fact, would there be the specifics provided by the cognitively rich stimuli used in Mind Genomics studies, specific, meaningful statements. The initial foray into ‘what interests a person in a conference’ shows the simplicity by which one can begin to create a detailed understanding of a person’s mind with regard to a topic. The call now should be for systematics, namely structured investigations. Should the topic of such investigations be ‘conferences,’ and the current study comprises, the next steps would be the way the conferences are organized, the nature of the material presented, the tonalities of the presentation, the venues, and so forth. Following this structured approach, it is likely that an entire “foundational knowledge infrastructure” (FKI) about conferences might be constructed within the period of a year, providing insight to the specific topic of conferences, but potentially greater insight into the nature of social interactions of a formal nature. The potential of a set of FKI’s, updated each year, and done cross-sectionally within a topic, across topics, within a country, and across countries, beckons, almost a ‘Wiki of the Mind.’

Acknowledgement

Attila Gere thanks the support of Premium Postdoctoral Research Program of the Hungarian Academy of Sciences.

References

  1. Clark AM, Friedman EJ, Hochstetler K (1998) The sovereign limits of global civil society: a comparison of NGO participation in UN world conferences on the environment, human rights, and women. World Politics 51: 1–35.
  2. Gordenker L (1995) NGO participation in the international policy process. Third World Quarterly 16: 543–556.
  3. Ritchie C (1995) Coordinate? Cooperate? Harmonise? NGO policy and operational coalitions. Third World Quarterly 16: 513–524.
  4. Van Rooy A (1997) The frontiers of influence: NGO lobbying at the 1974 World Food Conference, the1992 Earth Summit and beyond. World Development 25: 93–114.
  5. Gardner SK, Barnes BJ (2007) Graduate student involvement: Socialization for the professional role. Journal of College Student Development 48: 369–387.
  6. Jacobs N, McFarlane A (2005) Conferences as learning communities: some early lessons in using ‘back-channel’technologies at an academic conference–distributed intelligence or divided attention? Journal of Computer Assisted Learning 21: 317–329.
  7. Kowalsky M (2012) Networking at conferences: Developing your professional support system. Knowledge Quest 41: 60.
  8. Shoaff-Ballanger SM, Davis DJ (1992) Professional conferences for art educators: A pilgrimage to excellence. Art Education 45: 37–44.
  9. Carsrud AL, Palladino JJ, Tanke ED, Aubrecht L, Huber RJ (1984) Undergraduate psychology research conferences: Goals, policies, and procedures. Teaching of Psychology 11: 141–145.
  10. Gunawardena CN (1995) Social presence theory and implications for interaction and collaborative learning in computer conferences. International Journal of Educational Telecommunications 1: 147–166.
  11. Hines SS (2014) What do library workers want from professional conferences? In: Revolutionizing the development of library and information professionals: Planning for the future (1–16). IGI Global.
  12. López-Pastor VM, Monjas R, Manrique JC (2011) Fifteen years of action research as professional development: Seeking more collaborative, useful and democratic systems for teachers. Educational Action Research 19: 153–170.
  13. Reinhardt W, Ebner M, Beham G, Costa C (2009) How people are using Twitter during conferences. Creativity and Innovation Competencies on the Web. Proceedings of the 5th EduMedia Pg No: 145–156.
  14. Werner SE, Kenefick C (2005) A Primer for effective organization of professional conferences. Medical Reference Services Quarterly 24: 39–54.
  15. Kahneman D, Egan P (2011) Thinking, fast and slow. New York: Farrar, Straus and Giroux.
  16. Moskowitz HR, Gofman A, Itty B, Katz R, Manchaiah M, et al. (2001) Rapid, inexpensive, actionable concept generation and optimization: the use and promise of self-authoring conjoint analysis for the food service industry. Food Service Technology 1: 149–167.
  17. Moskowitz H, Gofman A, I novation Inc (2003) System and method for content optimization. U.S. Patent 6: 662,215.
  18. Moskowitz HR, Gofman A, Beckley J, Ashman H (2006) Founding a new science: Mind genomics. Journal of sensory studies 21: 266–307.
  19. Luce RD, Tukey JW (1964) Simultaneous conjoint measurement: A new type of fundamental measurement. Journal of mathematical psychology 1: 1–27.
  20. Green PE, Rao VR (1971) Conjoint measurement for quantifying judgmental data. Journal of marketing research 8: 355–363.
  21. Green PE, Srinivasan V (1990) Conjoint analysis in marketing: new developments with implications for research and practice. The journal of marketing 54: 3–19.
  22. Box GE, Hunter WG, Hunter JS (1978) Statistics for experimenters, New York, John Wiley.
  23. Gofman A, Moskowitz H (2010) Isomorphic permuted experimental designs and their application in conjoint analysis. Journal of Sensory Studies 25: 127–145.
  24. Moskowitz HR, Gofman A (2007) Selling blue elephants: How to make great products that people want before they even know they want them. Pearson Education.
  25. Dubes R, Jain AK (1980) Clustering methodologies in exploratory data analysis. Advances in Computers 19: 113–238.

Mind Genomics to Teach Critical Thinking and Prepare Job Candidates for Interviews

DOI: 10.31038/ASMHS.2019352

Abstract

We present a new approach to help students prepare for interviews. The approach applies a user-friendly app (BimiLeap) developed from the science of Mind Genomics. The app teaches students how to think critically and creatively, in a structured way, with feedback from panel respondents unknown to the student. From the viewpoint of the student as job applicant, the Mind Genomics approach can teach the applicant, a prospective employee to think better, and while learning to do so, help the applicant create an individual portfolio of studies that can be presented to the interviewer. The portfolio demonstrates the applicant’s ability to do independent research relevant to the company doing the hiring. From the viewpoint of the hiring company, the Mind Genomics approach provides a test of intellectual proficiency, either as a homework assignment before the interview or as a test given to the respondent with the topic chosen by the interviewing company.

Introduction

As of this writing, there is an increasingly competitive environment for jobs [1]. Many papers are appearing decrying the nature of education as not preparing a person for the job [2]. The popular press, especially the Internet is a treasure of Cassandra-like predictions of the world of jobs which faces us during the next ten years. The issues are legion; hyper-competition, automation will make many of today’s jobs irrelevant, and that the new work environment is making the world one of ‘gigs; rather than lifetime employment and corporate loyalty. The job applicant will no doubt face a different world. Coupled with the structural changes of competition and automation is the reality that in many any cases the applications for jobs are screened by machine. There may be dozens if not hundreds of applicants for the same job. The hyper-competition breeds frustration, demoralization, and at the worse, the conscious decision simply to drop out of the job world, and no-launch career. The foregoing is reflected both in the academic and in the popular literature [3,4]. The loss of hope is an emerging problem for many countries, and the foreshadows the specter of a country slowly depopulating as the young people flee the country to more opportunities elsewhere.

The World of Job Seeking Today

The popular as well as the academic literature are replete with advice about how to prepare for jobs. Indeed, in Google Scholar®, the phrase ‘preparing for a job interview’ generates approximately 744,000 hits as of this writing (Summer 2019.) Going one step further, the phrase ‘practical guide for job interview’ generated 944,000 hits. The number of hits in Google® itself is much greater, and the different facets of jobs as subtopics to search becomes overwhelming. There is a dual problem as well, the problem faced by the hiring group and by the interviewer. The problem is simply how to cut through the façade thrown up by the job seeker, to find out the who the job seeker ‘really is’ and what the job seeker can ‘really do.’ The issues facing the interviewer in the job interview range from understanding the true abilities of the candidate to avoiding emotional manipulation by the candidate. The notion of manipulation as a topic is widespread in the academic literature for the simple reason that the job interview is a critical event in the life of the job seeker [5]. It is not harder to understand that almost all job seekers will present themselves in the best possible light, taking credit for successes, and avoiding the very mention of a failure. The old adage works here ‘success has many fathers but failure is an orphan’. How then can the interviewer probe more deeply into the mind of the respondent, to understand the thinking capability of the respondent?

How Mind Genomics Works and its Application to the Interview Process

We present here a suggestion, based upon the developing research of Mind Genomics, and the now readily available app, www.BimiLeap.com. The basic idea is that the Mind Genomics approach, described below, becomes a tool, either to produce interesting, relevant knowledge which distinguishes the candidate from the other candidates by virtue of the effort, or its dual, a method to assess the thinking capabilities of the candidate at the time of the interview, thus avoiding the effort to deconstruct letters of reference in what’s true and what’s hyperbole. The spirit of using computers for interviews is not new but what is new is the use of the computer both to prepare the student and to test the student, using the same technology. The preparation is not ‘test preparation’ but rather education to think in a critical way. The test is not standard testing and performance, but rather demonstration of ability to solve a new problem, on demand, using critical thinking. Can experimentation increase both the likelihood of getting a specific job, but also the ability of the job applicant to ‘think’, preparing for a career where change is the only constant? In previous papers by this team of researchers, the notion has been offered that there is a structured way to think, one which can apply to the creation of a bank of knowledge about how we make everyday decision. The approach is Mind Genomics, a method which allows the researcher to combine different ideas according to experimental design [6], obtain responses from subjects, and then determine which specific ideas drive the decision. We present Mind Genomics from the viewpoint of preparing students, really applicants in general, an idea which goes back decades, and comprises a variety of approaches [7].

Mind Genomics has been used in areas ranging from politics to food to medicine to law and so forth [8]. The studies are serious, scientific studies, which form part of an emerging archive of knowledge about the world of the everyday and decision-making. It is the suggestion of the authors that the very same approach to knowledge might be well-used by the job seeker, both to train her or his mind, but also to provide material of immediate relevance and important to the interview. The remainder of this paper demonstrates the application, results which are of immediately interest to the interviewer as well as being a scientific contribution, and finally data which suggest a process to teach the job applicant, how to think. Mind Genomics traces its history to both mathematical psychology [9], and to marketing research [10,11]. These early studies investigated how people mentally ‘weight; different factors to arrive at a decision. The early studies worked on either simplistic problems with academic rigor but little practical application, or on large-scale problems in marketing. The early processes were cumbersome, requiring that respondent either choose one of two test stimuli of different combinations of features, or rate known combinations of features.

More recent efforts have focused on creating simpler, rapid, and user-friendly methods which can be adapted to an app (www.BimiLeap.com), and in turn widely used by those who are not academically oriented to publish papers, but rather need the information for practical decisions. The evolution of the science of Mind Genomics has expanded the applications, making them easy, archival, usable by anyone from age 8–9 and older. Mind Genomics follows these straightforward steps. Where relevant, the steps can be embedded in the interview process.

Step 1 – Define a Topic or A Problem

The interviewer can define a problem before or during the interview, or the job seeker can exercise initiative and define the problem. The problem selected for this study is: ‘What attracts a prospective job seeker to select a training/placement company?’

Step 2 – Create a Structure by Asking Four Questions Which ‘Tell a Story’

This is the Socratic approach, of asking and answering questions. Table 1 shows the four questions for this project.

Table 1. The topic, the four questions and the four answers to each question


Topic: What attracts a prospective job seeker to select a training/placement company?’


Question 1 – How does the company satisfy client needs for trained personnel?

A1

Uses multiple sourcing options…e.g., relationship-marketing, social media and advertising

A2

Hires temp contract workers until right candidate found

A3

Educational program to train potential candidate

A4

Willing to invest more for the right talent


Question B: How does the company customize the process for the client?

B1

Sound interview process, including direct contact with the hiring manager

B2

Understands the biggest deciding factor for the candidate

B3

Involves upper management in meetings

B4

Streamlines the process, beat competition by moving quicker in hiring process


Question C: What up-to-date technologies does the company adopt in order to be effective?

C1

Uses centralized data & analytics

C2

Uses most updated hiring technologies

C3

Uses cloud-based tools … automate and manage process

C4

Work with hiring managers to understand technicalities and screen for best fit


Question D: How does the company stay ‘close’ to its client to anticipate needs?

D1

Communicate with corporate managers … define needed skill sets

D2

Builds relationship and rapport with corporate managers … set right expectations

D3

Emphasizes why speed important … to find right candidate who fits

D4

Build appropriate training plans … from hiring manager’s input

Step 3 – Provide Four Answers for Each Question

Typically, these questions and answers are provided by the job candidate. To the degree that the candidate can provide clearly thought-out, relevant, and different answers, one may surmise that the candidate can think in a structured way. Table 1 shows the four answers provided by one job candidate. At this point it is important to note that the system enables the job candidate to demonstrate his or her proficiency and knowledge about the topic, about the company, or about a discipline in which the candidate has been involved.

The actual task of creating the material may be given to the job candidate in at least two ways:

  1. The candidate may receive the topic, but the candidate should provide both the questions and the answers. This entire sequence of events, from receiving the topic to providing the questions and answers, to executing the study could then reveal whether the candidate has the intellectual capability to follow instructions, yet think critically, and execute a study.
  2. The candidate may receive the topic at the time of interview and be give a fixed number of hours to run the actual study under supervision, as part of an interview. It would probably be a good idea for the candidate to ‘train’ on the mechanics of the process before the interview, doing so in a relaxed manner, in privacy, free to make mistakes. The actual test would be supervised, however.

Step 4: Combine The Elements (Answers) Into Vignettes According to An Experimental Design

The elements comprise single ideas. Mind Genomics combines these single ideas into vignettes, i.e., vignettes, comprising 2–4 ideas (elements, answers), with at most one element from each question, but often no elements or answers from a question. To the outsider looking at the 24 vignettes specified by the experimental design it might appear that the elements are thrown together at random. Nothing could be further from the truth. The experimental design is a planned set of vignettes with the property that each element appears an equal number of times against different backgrounds provided by the elements from the other questions. Furthermore, the 16 elements or answers are statistically independent of each other, allowing the ratings to be collected from individual respondents to be ‘linked’ to the presence/absence of the individual respondent ratings. Finally, and very important, is the feature that the set of specific test vignettes for each respondent different from the specific test vignette of every other respondent. This pattern, so-called permuted design [12], allows the research to cover a wide number of vignettes in the ‘design space.’ The metaphor here is the tightness of estimation by testing a lot of different vignettes, each with error but with the total pattern studied, rather than obtaining tight estimations by replicating the number of judgments on a small set of vignettes presumed to represent the larger array of vignettes. In a sense, Mind Genomics is an MRi of the mind, taking different pictures by responses to vignettes. Figure 1 shows an example of a vignette.

MIND GENOMICS-031_ASMHS-F1

Figure 1. Example of a vignette comprising three elements, and the rating scale on the bottom of the screen shot.

Step 5: Self-Profiling Classification

At the end of the evaluation, the respondent completed an extensive classification questionnaire, allowing the research to obtain more information about the respondent, in terms of who the respondent IS, what the respondent BELIEVES, and so forth. For this project we present only three of the questions, age, gender, and general response to the vignettes. The data appear in Table 2.

Step 6 – Transform The 9-Point Rating Scale Into A Binary Scale (0/100)

The transformation allows the use of the research results to better understand the meaning of the data. Although there is more precision in the 9-point scale than in the binary scale, simply because of the granularity of the results, most users of the research do not know how to work with Likert scales, the reason being that Likert scales do not promote decision-making. To make the data easy to interpret and easy to act upon, we transform the data, dividing the 9-point scale into two halves. The upper half comprises the ratings of 7–9, and ia recoded to 100 (plus a very small random number, for regression as explained below.) The recode to `100’ signifies ‘YES.’ The lower half comprises the ratings of 1–6, and is recoded to 0 (plus a very small random number), to signify ‘NO.’

Table 2. Self-profiling classification of the respondents who participated


N

%

Q1: Please indicate your gender.

Male

30

57%

Female

23

43%

Q2: Which of the following best describes your age?

Under 18

0

0%

18 to 24

2

4%

25 to 34

21

40%

35 to 44

14

26%

45 to 54

6

11%

55 to 64

6

11%

65 and older

4

8%

Q3: Based on all the ads that you saw, how interested would you be in applying for a new job at this type of company?

1 = Not interested

3

6%

2 = Maybe

36

68%

3 = For sure

14

26%

Step 7 – Use OLS (Ordinary Least-Squares) Regression To Relate The Presence/Absence Of Each Of The 16 Elements To The Binary Recoded Data

OLS regression deconstructs the rating into a simple linear model: Binary Rating = k0 + k1(A1) … k16(D4). Each element generates a unique coefficient. The additive constant, k0, is the estimated binary value in the absence of elements, a purely hypothetical situation. All vignettes by design comprised 2–4 elements, so the additive constant can be considered a baseline., i.e., the inherent predisposition to say ‘YES.’

Step 8 – Compute The Parameters Of The Model For Total Panel, For Key Subgroups As They Define Themselves, And For Mind-Sets (Explained Below)

Table 3 presents the summary of coefficients for total, gender, and age. All coefficients of 15 or higher are shown in shaded cells, and bold type. The additive constant tells us the likelihood of ‘following up with this recruiter.’ Since the ratings were transformed to their binary values, the additive constant tells us the likely percent of responses that would be ‘YES, I’d follow up with this recruiter,’ assuming the three highest ratings, 7–9, signify ‘YES.’ What emerges as fascinating is the lack of confidence without supporting evidence, with the only respondents ‘willing’ to believe the recruiter even at all are the older respondents, and not really (additive constant = 11.) It will be the individual elements which must do all the work.

Table 3. Performance of elements among total panel, genders, and ages


Total

Male

Female

Age 25–34

Age 35–44


Base Size

53

30

23

21

14


Additive constant

-1

-1

-1

-13

11

B2

Understands the biggest deciding factor for the candidate

21

29

10

16

29

B1

Sound interview process, including direct contact with the hiring manager

20

23

16

15

25

D4

Build appropriate training plans … from hiring manager’s input

19

14

25

20

14

C4

Work with hiring managers to understand technicalities and screen for best fit

18

15

21

17

16

A4

Willing to invest more for the right talent

17

16

19

22

11

A3

Educational program to train potential candidate

16

18

12

13

20

D2

Builds relationship and rapport with corporate managers … set right expectations

15

16

12

20

5

B4

Streamlines the process, beat competition by moving quicker in hiring process

15

17

12

15

24

C2

Uses most updated hiring technologies

14

11

17

22

2

D1

Communicate with corporate managers … define needed skill sets

13

10

16

12

16

B3

Involves upper management in meetings

11

19

1

6

20

A1

Uses multiple sourcing options…e.g., relationship-marketing, social media and advertising

10

11

9

10

20

D3

Emphasizes why speed important … to find right candidate who fits

8

6

11

9

3

C3

Uses cloud-based tools … automate and manage process

7

5

9

9

5

C1

Uses centralized data & analytics

7

7

6

12

-3

A2

Hires temp contract workers until right candidate found

0

1

-1

2

2

The 16 elements are sorted in descending order, based upon the total sample.

  1. Many of the elements perform very well. Previous studies and unpublished observations suggest that coefficients whose values are greater than +10 correspond to elements which drive positive decisions. These data reveal a cadre of elements which drive a strong positive reaction. Knowledge of these features should help the company and the prospective job candidate seeking to work with a training and recruiting company:

    Understands the biggest deciding factor for the candidate

    Sound interview process, including direct contact with the hiring manager

    Build appropriate training plans … from hiring manager’s input

    Work with hiring managers to understand technicalities and screen for best fit

    Willing to invest more for the right talent

    Educational program to train potential candidate

  2. Genders differ. Males dramatically respond more to these elements:

    Understands the biggest deciding factor for the candidate

    Involves upper management in meetings

  3. Ages differ as well. Younger respondents respond strongly to technology and are sensitive to the opinion of higher-level managers

    Uses most updated hiring technologies (22 for younger respondents, 2 for the older respondents)

    Builds relationship and rapport with corporate managers … set right expectations (20 for younger respondents, 5 for the older respondents)

Dividing Respondents By Their Decisions And By Their Mind-Sets, Respectively

The classification questionnaire, done at the end of the Mind Genomics experiment, allows the respondent to how she or he feels about the potential job. We first compare two out of the three self-defined groups, those who say that they may follow up with the company they liked most (n=36) and those who say that they are sure that they would follow up (n=14). Table 4 shows these results. Each group shows a very low additive constant, around 0. Those who are ‘sure’ about following up show eight very strong elements, with coefficients of 20 or higher. However, there is no pattern which makes us ‘smarter’ about the mind of those who say that they would follow up. We know what works, but we cannot generate a rule, although we get a sense of focus on the job seeker and on a relationship with the hiring manager.

Table 4. Performance of elements among total panel, self-stated likelihood to use a company which provides the messages they like the most, and emergent mind-sets based upon the pattern of coefficients


Total

Q3 Maybe

Q3 Sure

MS1 -People

MS2-Technology


Base Size

53

36

14

28

25


Additive constant

-1

1

-5

3

-5


Mind-Set 1 – Empathic and People Oriented


B2

Understands the biggest deciding factor for the candidate

21

19

23

29

13

D4

Build appropriate training plans … from hiring manager’s input

19

17

23

21

17

D2

Builds relationship and rapport with corporate managers … set right expectations

15

15

16

20

8

B1

Sound interview process, including direct contact with the hiring manager

20

18

24

18

21

A4

Willing to invest more for the right talent

17

17

17

18

16

A3

Educational program to train potential candidate

16

14

20

17

14


Mind-Set 2 – Technology Oriented


C4

Work with hiring managers to understand technicalities and screen for best fit

18

19

22

8

28

B4

Streamlines the process, beat competition by moving quicker in hiring process

15

13

20

10

20

C2

Uses most updated hiring technologies

14

11

26

7

20

C3

Uses cloud-based tools … automate and manage process

7

5

16

-3

17


Does not drive either mind-set


A2

Hires temp contract workers until right candidate found

0

-3

7

-12

14

A1

Uses multiple sourcing options…e.g., relationship-marketing, social media and advertising

10

5

23

7

13

D1

Communicate with corporate managers … define needed skill sets

13

12

13

13

12

B3

Involves upper management in meetings

11

7

17

11

11

C1

Uses centralized data & analytics

7

6

19

5

9

D3

Emphasizes why speed important … to find right candidate who fits

8

8

9

13

2

Uses most updated hiring technologies

Sound interview process, including direct contact with the hiring manager

Understands the biggest deciding factor for the candidate

Build appropriate training plans … from hiring manager’s input

Uses multiple sourcing options…e.g., relationship-marketing, social media and advertising

Work with hiring managers to understand technicalities and screen for best fit

Educational program to train potential candidate

Streamlines the process, beat competition by moving quicker in hiring process

Those say they ‘might’ follow up six strong elements, but all are lower than 20.

Understands the biggest deciding factor for the candidate

Work with hiring managers to understand technicalities and screen for best fit

Sound interview process, including direct contact with the hiring manager

Build appropriate training plans … from hiring manager’s input

Willing to invest more for the right talent

Builds relationship and rapport with corporate managers … set right expectations

It is important to note that with these data we see no interest in companies with technology as their focus. Rather, we sense that the general pattern is focus on the candidate, on the human aspect. We will see that this picture of the mind of the job seeker is only half-revealed by standard questions about interest. We will see in a moment that there is another mind-set, technology-oriented, comprising half the population of respondents, but hidden until revealed by the extraction of mind-sets. A far stronger approach to finding differences among people in the population looks at the pattern of their individual coefficients, with the attempt to identify groups of individuals with radically different ways of thinking about the same elements or messages. The segmentation method, clustering, has been well described in the statistics literature [13] and is a mainstay of the Mind Genomics armory. The key is to focus on a micro-area, such as the offerings of the technology personnel company, rather than focusing on a grand division of people. When the segmentation is done on the pattern of coefficients for this ‘micro-topic,’ the results are often dramatic, clear, and compelling. Table 4 shows the coefficients from the two mind-sets. It is clear from Table 4 that Mind-Set 1 comprises individuals who respond to a company which is empathic, and people oriented. Mind-Set 2 comprises individuals who respond to a company which is technology oriented. The differences between the two mind-sets is clear, dramatic, and easy to interpret.

Finding These Mind-Sets In The Population

The mind-sets distribute in the population in ways that cannot be easily predicted. In some occasions we might be sufficiently fortunate to find a co-variation between mind-set membership and some other easily defined. That happy event is not the usual case. Rather, the mind-sets might distribute in a slightly uneven pattern, but not a pattern upon which one could readily rely when assigning individuals to mind-sets for a topic. Except for very common topics it is quite unlikely that there will be either any data on a specific, newly discovered mind-set, such data dealing either with the nature of the mind-set, or the rules to discover individuals with the mind-set. The topics are too small, too focused, too specific, too ‘local’ for general studies of more ‘global’ mind-sets [14]. A different way is needed, one which is grounded in speed, ease, low-cost, and can be adapted quickly to any data set of the type found by Mind Genomics. Recent efforts by author Gere suggest that such a method can be created. The approach is based upon a Monte Carlo simulation of assignments to one of two or one of three mind-sets, based upon the mean coefficients by mind-set of six elements (here 6 of 16). The coefficients are perturbed by noise and searched to identify the elements which most strongly differentiate among the segments. The method creates a set of six ‘questions,’ using the text of the individual elements, creates two answers, and computes the 64 possible patterns. That approach, done 20,000 times in a Monte Carlo simulation, identifies the best six elements, and the most likely mind-set corresponding to each of the 64 possible binary patterns. Figure 2 shows an example of the PVI, the personal viewpoint identifier. The PVI expands the use of the study when the results are to be used to understand prospective clients of the customer. By knowing the mind-set to which each person belongs, one can tailor the appropriate program for the specific individual who has signed on as a client. Furthermore, by knowing the mind-set to which a prospect belongs, the company can send the appropriate messages to convert the prospect to a client.

Discussion – Technical Aids To Creating A Personal Portfolio

When one thinks about the strategies for interviewing, for getting a job, the notion of doing a ‘pilot study’ may seem strange as a way to ‘market oneself.’ Yet, such marketing may become necessary in the evolving world where the combination of critical thinking and ability to do data analytics could be a key part of self-marketing. As far back as 2003 the notion of ‘self-marketing’ was becoming increasingly relevant to students looking for jobs [1]. Fifteen years before, it was already an issue in the world of business schools [2]. The pilot study does not present an individual’s credentials, nor show the individual as a person. Or, in fact, does it? In the world of academics, one often does not proceed with research before one writes a proposal about the research. Quite frequently, it is necessary to buttress that proposal with some preliminary data to show that the approach proposed with come up with meaningful results. Indeed, it is often the case that one must do a study and complete it, doing so surreptitiously, presenting the findings in a proposal, in order to get funding for the study. That is, the study must be presented in proposal form, but with data guaranteeing the success of the project. We suggest here that the thinking of pilot projects as preliminaries to a big project be adopted for job seeking. What has been missing up to now may be an inexpensive, simple, rapid way to do these pilot projects, a way which can demonstrate the capabilities of the job applicant. We suggest that the approach presented here may be expanded to be of use to screen applicants. The screening might be done in two ways, as suggested in the introduction to this paper:

MIND GENOMICS-031_ASMHS-F2

Figure 2. The PVI (personal viewpoint identifier), created to assign a new person to one of the two mind-sets uncovered in this study

HOMEWORK: The Company presents the job applicant with a problem and gives the applicant a week to come up with the specific topic, the four questions, and the four answers to each question. If the job applicant appears to have provided an appropriate set of questions and answer, the company may decide to hire the candidate, even without running the study, simply on the basis of the homework done by the applicant.

ON-SITE PERFORMANCE TEST: This performance test may be done in a defined time period, e.g., five hours, from start to finish, either with the respondent at home, or in the corporate office. In a very strongly competitive market, he company may invite all candidates into a central test site, a room full of candidates with computers, give the candidates specific topic, instruct them to set up the study, run the study, each with 50–100 respondents (paid for by the company), get the results in perhaps two or three hours. The next step would be to measure the quality of the candidate’s thinking by looking at the performance of the elements, the performance of the elements by subgroup, and indeed whether or not the candidate’s actual study has been able to identify new, interesting, and potentially relevant mind-sets. Such a candidate would stand out as promising. The benefits are both a real-life test of abilities, and a possible crowd-sourced solution to a problem faced by the company, with the ‘crowd’ comprising the job applicants ‘doing the thinking’ and the respondents (unknown to anyone, but real people), providing evaluations of what to them are real and meaningful ideas involved with a problem.

Acknowledgement

Attila Gere thanks the support of Premium Postdoctoral Research Program of the Hungarian Academy of Sciences.

References

  1. Taylor KA (2003) Marketing yourself in the competitive job market: An innovative course preparing undergraduates for marketing careers. Journal of Marketing Education 25: 97–107.
  2. Buckley MR, Peach EB, Weitzel W (1989) Are collegiate business programs adequately preparing students for the business world? Journal of Education for Business 65: 101–105.
  3. Hansen K, Oliphant GC, Oliphant BJ, Hansen RS (2009) Best practices in preparing students for mock interviews. Business Communication Quarterly 72: 318–327.
  4. Krannich CR, Krannich RL (1990) Interview for Success. Impact Publications.
  5. Baron RA (1997) Impression Management, Fairness, & the Employment. Journal of Business Ethics 16: 801–810. 
  6. Box GE, Hunter WG, Hunter JS (1978) Statistics for experimenters, New York, John Wiley.
  7. Latham GP, Saari LM, Pursell ED, Campion MA (1980) The situational interview. Journal of Applied Psychology 65: 422–427.
  8. Moskowitz HR, Gofman A (2007) Selling blue elephants: How to make great products that people want before they even know they want them. Pearson Education.
  9. Luce, R.D. & Tukey, J.W., 1964. Simultaneous conjoint measurement: A new type of fundamental measurement. Journal of mathematical psychology 1: 1–27.
  10. Green PE, Rao VR (1971) Conjoint measurement for quantifying judgmental data. Journal of marketing research 8: 355–363.
  11. Green PE, Srinivasan V (1990) Conjoint analysis in marketing: new developments with implications for Research & practice. The Journal of Marketing 54: 3–19.
  12. Gofman A, Moskowitz H (2010) Isomorphic permuted experimental designs & their application in conjoint analysis. Journal of Sensory Studies 25: 127–145.
  13. Dubes RC, Jain AK (1988) Algorithms for Clustering Data. Prentice Hall.
  14. Weinstein A, Cahill DJ (2014) Lifestyle Market Segmentation. Routledge.

Prospects for students as students see them: A Mind Genomics Exploration

DOI: 10.31038/ASMHS.2019351

Abstract

To determine what young people (ages 13–27) feel about the prospects of students after they leave school, we investigated systematically varied vignettes about schools. The vignettes comprised statements (elements) about teachers, the students, the response of the community to the school, and the behavior of the students, respectively, the elements combined according to an experimental design. The data suggest that it is the specific messages, not the general categories of messages, which drive the expectations of good versus poor performance. There is evidence for at least two mind-sets, those focused on the teacher-student relationship versus those focused on the teacher-community relationship. We present the PVI, personal viewpoint identifier, to assign new students to one of the two mind-sets.

Introduction

The world of education is critical for the future of a nation. Educators realize that, and struggle with the appropriate way to educate the student. The issues are complex, the struggles to educate real, and the complexities baffling. The situation is made even more complicated by the realization that education is not just the role of the student and the teacher, but is influenced by society, local and national, by economics, and by the nature of the social matrix from which the student originates. Any introduction should stop there. The literature is too vast.

A cursory review of the truly vast literature reveals the deep concerns with the outcome of education, and the natural consequence, studies of what drives a good outcome. The factors can be as diverse as the nature of the teacher, and especially the preparation for teaching [1], the involvement of the community [2, 3, 4] and of course the nature of the student [5, 6, 7, 8]. The focus of these studies is on outcomes, with the search to discover what factors produce the best outcome. The studies are sociological in nature, however, and do not give a sense of the inner thinking and feeling [9] What is missing from most of these studies, if not all, is a study of the mind of the student, in terms of what motivates the student.

Author Moskowitz applied the approach presented here to study how students want to study mathematics [10]. The objective was to work from the inside of the mind of the student to the outside, to discover the granular features of experience to which a student attends when thinking about what she or he wants in when learning mathematics. This study follows the same approach, working from the inside of the mind of the student to the outside, to discover what a student thinks will drive success five years hence. The approach is psychological in nature, combining projective techniques [11] and applied experimental design (conjoint measurement; [12, 13, 14] a new synthesis embodied in the emerging science of Mind Genomics [15].

The topic of this paper is education, or more specifically the expectations of young paper (ages 13–27) of future success or failure as a function of reading about systematically constructed descriptions of ‘softer aspects’ of the educational situation, primarily dealing with emotions and relations, not on pedagogy. The education situations comprise systematically constructed combinations of answers to four questions, specifically:

The race of the teacher:

The response of the student to the teacher’s race

The economic status of the school area

The reaction of those in the community

Mind Genomics Method

Mind Genomics is a newly emerging science, dealing with the analysis of quotidian, everyday experiences, and how people judge the different aspects of these experiences [15] The objective of the Mind Genomics studies is to identify which aspects of a situation are most relevant to the individual. Mind Genomics uses small, easy-to-run, affordable, rapid, and manageable experiments to understand how a person evaluates the different aspects of experience to arrive at a judgment. Experiments mean that Mind Genomics ends up tracing responses to specific independent variables. For the case of education in the study reported here, the experiment allows us to trace how a person’s estimate of student performance in five years relates to a variety of independent variables,, such as the race of the teacher, the reaction of students to the teacher, the nature of the students, and the nature of the local community in which the school is located.

It should become obvious from the description above that Mind Genomics differs profoundly from the analyses of education appearing in the scientific literature. The traditional approaches to education focus on a description of ‘what happened’ (description) and ‘what should happen’ (prescription.) These approaches work in the world of the external. Mind Genomics moves insight, looking at how people think and feel about the everyday. Thus, Mind Genomics provides a new direction by which to understand education specifically in this paper, but a person’s thinking in general. Mind Genomics follows a series of well-defined steps, using a combination of raw materials developed by a Socratic approach, evaluation by respondents of vignettes comprising mixtures of these materials (field work), and then the deconstruction of the responses into the contributions of the individual elements (analysis.) The results reveal what the respondents feel to be the most important factors for future success. Mind Genomics works at the granular level, so the results can lead both to knowledge and to application.

Test stimuli

The test stimuli comprise a series of questions which tell a story. The questions never appear in the study but are only inserted into the Socratic process to give the test stimuli, the vignettes, a structure. (Figure 1) shows the screen shot of the program, giving a sense of how the researcher is guided in critical thinking. For each question the researcher is prompted to give four different answers, the answers being simple stand-alone phrases communicating different ideas appropriate for the question. (Figure 2) shows a screen shot of the program, showing how the researcher is guided to give the four answers to one question. The structure of the underlying technology is limited to four questions, each with four answers. That structure was designed to allow researchers to work in ‘real time,’ identify a topic, phrase the four questions, provide the answers, and launch the study, all within a period 30–45 minutes, with the answers coming back an hour or two after launch. Such speed and a process, which essentially constitutes a complete circle, can only be accomplished by following a simple template, such as the template followed here. The four answers comprise just enough text to convey the answer, and no more. The Mind Genomics system encourages the researcher to focus on the idea, not on an elegant, dense paragraph of information. The ingoing assumption is that the respondent will graze, rather than read each test stimulus, and so the answer must be simple and ‘punchy.

MIND GENOMICS-030_ASMHS_F1

Figure 1. The set-up program, requiring the respondent to create the four questions.

(Table 1) shows the four questions, and the four answers to each question. The objective of Mind Genomics studies of this type is to explore and map an area, either a large area in general with little detail, or very meticulously and great deal for a small, circumscribed, limited areas. It is vital, however, that researchers avoid the deadly ‘analysis paralysis’ which affects so much consumer research, wherein one has only one study to discover the answers. The Mind Genomics system is iterative, so that the set of questions and answers can be revised on a second iteration, and on further iterations, to achieve a granular understand of the problem.

Table 1. The four questions and the four answers to each question.

Question A: What is the race of the teacher

A1

teacher is black

A2

teacher is Caucasian

A3

teacher is Asian

A4

teacher is Hispanic

Question B: What is the student response to teacher race

B1

students are docile

B2

students are antagonistic towards teacher

B3

students identify with teacher race

B4

students are accepting of the teacher

Question C: economic status of school area

C1

school in depressed area

C2

school in gentrified area

C3

school in established middle class area

C4

school in area with many new immigrants

Question D: reaction of other school neighbors

D1

community supports educators

D2

community indifferent to educators

D3

community hostile to educators

D4

community embraces educators

Experimental Design:

Mind Genomics works by combining the answers (but not the questions) into short, easy-to-read combinations called vignettes or concepts. Each vignette comprises at most one answer from a question. The four questions need not contribute an answer to the vignette. The experimental design, really a ‘recipe book’ prescribes the specific set of 24 vignettes to be presented to a respondent. Some of the vignettes comprised four answers, one answer from each of the four questions. The experimental design also prescribes some vignettes to have three answers, with the answer from one of the questions absent. Some vignettes comprise only two questions. The creation of such ‘incomplete’ vignettes enables the 16 answers to be statistically independent of each other, and thus analyzable by OLS (ordinary least squares) regression. Each respondent evaluated a unique set of 24 vignettes. The underlying experimental design was maintained, but the specific combinations changed, doing so according to a permutation scheme which defined new combinations [16]. By permuting the combinations, the Mind Genomics experiment with its 50 respondents covers many alternative combinations, the so-called design space. The rationale for testing many combinations, each with about 1–2 ratings, rather than testing the same set of 24 vignettes with 50 ratings, emerges from the worldview of Mind Genomics, which is based in the notion of cartography of the mind. The objective is to explore different aspects of how we make decisions, rather than to explore one specific aspect using many replicate judgments to average out ‘noise.’

MIND GENOMICS-030_ASMHS_F2

Figure 2. Screen shot showing how the researcher is guided to assign four answers to one question.

The vignettes

The test stimuli comprised vignettes. The vignette presented a short orientation statement at the top, and then the requisite 2–4 answers or elements prescribed by the underlying experimental design. There was not effort to make the 2–4 answers or elements ‘flow together’, by constructing a paragraph. Rather, the 2–4 answers were presented as simple phrases, stacked one atop another, without concern for the ‘sense’ of the combination. This simple and austere structure makes the respondent’s job easier. The respondent simply inspects the vignette and assigns a rating. With 24 vignettes to rate it is important to make the experience pleasant, not onerous It is important to avoid the dense paragraphs, constructed with connectives, paragraphs which are grammatically correct but difficult to read, and increasingly aversive as the respondent ‘plows through’ paragraph after paragraph. The Mind Genomics layout, stark as it is, reduces the onerous task.

Rating Scale

The 5-point rating scale, shown in (Table 2), allows the respondent to tell the researcher how she or he feels about the student, after reading the vignette. In psychological terms, the study actually invokes aspects of a projective test, where the respondent looks at a picture and tells a story. This projective method enables the researcher to understand the mind of the respondent, since the respondent is given no specific information about the students in the vignette, other than what is presented about the school situation itself. The only way that the respondent can assign a rating to the vignette is by projecting her or his feelings onto the situation as described.

Table 2. The 5-point rating scale and the two anchors.

Rating question:

The student LIFE SKILLS in 3 years

Low Anchor: Rating question

1=remain the same

High Anchor: Rating question

5=big positive change

Running the Experiment

The on-line study was run with 50 respondents, ages 13–27, half 13–19, half 20–27. The respondents for these studies are members of a very large group of on-line panels, connected by Luc.id, Inc., the strategic partner of Mind Genomics. The respondents (more than 20 million in total in the United States alone) have agreed to participate in these studies, for ‘considerations’ which increase their motivation to participate. The respondent identity and terms of agreement to participate are not relevant to the effort. The respondents are invited by Luc.id on behalf of the research project. The financial incentives and the panel make the research process go smoothly, with the entire study complete within 1–2 hours, with the data ready to report, or available for reanalysis, as was done here. The study was completed early June 2019, in one afternoon.

Moving From the Ratings to A Binary Scale

Mind Genomics follows the general approach of consumer research in terms of working with scales. Consumer researchers who use Likert scales, such the 5-point scale featured here, do not necessarily know what the scale means, even when the scale is anchored at both ends. A strategy to circumvent the problem of lack of understanding yet keep the scale for subsequent analyses, transforms the 5-point scale to a binary scale, with the convention that ratings of 1–3 are transformed to 0, and ratings of 4–5 are transformed to 100, respectively. The transformation produces a binary scale, understandable by those who use the scale, and easy to communicate.

In this study we transformed the 5-point rating in two ways:

Good Outcome: Ratings of 1–3 are transformed to 0 to denote a ‘not good outcome.’ Ratings of 4–5 are transformed to 100 to denote a ‘good outcome.’

Poor Outcome: Ratings of 1–2 are transformed to 100 to a denote a ‘poor outcome’. Ratings of 3–5 are transformed to 0 to denote a ‘not poor outcome.’

Note that a ‘not good outcome’ is not the same as a ‘poor outcome,’ and a ‘not poor outcome’ is not the same as a ‘good outcome.’

Relating the Presence/Absence of the Answers/Elements to the Binary Rating 0/100

Once the ratings are transformed, one can use OLS (ordinary least-squares) regression to relate the presence/absence of the 16 elements to the binary rating. Each respondent tested a variant of the basic experimental design, with the design ensuring that all he 16 elements or answers were statistically independent of each other. The design itself, and the permutation on top of the basic design, ensures that the OLS regression will be working with data appropriate for OLS regression. (Table 3) shows the parameters emerging from the OLS models from the total panel, comprising 1200 observations or cases (50 respondents, 24 observations or datapoints for each respondent.)

Table 3. Coefficients from the total panel for the model relating the outcome to the presence/absence of the 16 elements.

MODEL FOR

 Total Panel

Good Outcome

Poor Outcome

 Additive constant

37

23

D1

community supports educators

11

-8

B4

students are accepting of the teacher

10

-8

D4

community embraces educators

9

-5

A2

teacher is Caucasian

7

-2

B3

students identify with teacher race

6

0

C2

school in gentrified area

6

-3

C4

school in area with many new immigrants

5

-4

C3

school in established middle class area

4

0

A1

teacher is black

2

-2

B1

students are docile

2

1

A3

teacher is Asian

1

-3

A4

teacher is Hispanic

1

-6

C1

school in depressed area

-5

7

D2

community indifferent to educators

-5

5

D3

community hostile to educators

-11

15

B2

students are antagonistic towards teacher

-17

22

Additive constant: Expected percent of the time that the response will be ‘good outcome’ or ‘poor outcome’ in the absence of elements. All 24 vignettes evaluated by a respondent comprised 2–4 elements by design, so that additive constant is a purely estimated parameter. Nonetheless, the additive constant gives a good sense of the likelihood of a positive or negative response, almost a ‘baseline’ likelihood. Coefficient: Each element generates its own coefficient from the OLS regression. The results do not surprise. The table shows the strong performing elements. Statistical tests as well as observations from real life using the data suggest that coefficients of 8 or higher are associated with strong outcomes, whether positive or negative.

Key elements driving a perceived likelihood of a good outcome:

community supports educators

students are accepting of the teacher

community embraces educators

Key elements driving a perceived likelihood of a poor outcome:

community hostile to educators

students are antagonistic towards teacher

Positive Outcomes – Models by Who The Respondent IS:

The support data for these observations come from (Table 4). When we look at the respondents by gender, we find that, to begin with, men are more optimistic than women (additive constant 44 for men versus 30 for women). Women respond to many of the specifics, however, whereas men do not. To the women, the most important element is that the community support educators, an element which is not particularly relevant to men. When we look at respondents by age, we again see differences. The younger respondents are less optimistic about a positive outcome than are the older respondents (additive constant 34 versus 44.) There are no dramatic differences by age, however, at least differences that can be explained easily. When we look at the neighborhood from which the respondent comes, we find that respondents from neighborhoods that they define as poor are less optimistic than the respondents from rich neighborhoods, and they, in turn, are less optimistic than respondents from up and coming neighborhoods (additive constant 31 vs 37 vs 42.) Respondents from the poor neighborhoods believe that it is both the student response to the teacher and the community response to the teacher which will generate a positive outcome for the student.

Table 4. Relation between the presence/absence of elements and the likelihood of a POSITIVE outcome for the student.  The columns refer to who the person IS.

Gender

Age

Neighborhood


Positive outcome

Male

Female

13–19

20–27

Poor

Up & coming

Rich

Additive constant

44

30

34

44

31

42

37

A1

teacher is black

-4

9

3

1

-15

1

14

A2

teacher is Caucasian

3

10

13

0

-7

8

12

A3

teacher is Asian

-14

15

-1

1

2

-3

4

A4

teacher is Hispanic

-7

9

4

-4

-6

-3

9

B1

students are docile

5

-2

1

2

19

-2

-3

B2

students are antagonistic towards teacher

-13

-20

-19

-15

-2

-17

-28

B3

students identify with teacher race

7

7

0

11

20

4

2

B4

students are accepting of the teacher

5

15

6

13

22

7

14

C1

school in depressed area

-1

-10

-3

-8

0

-5

-22

C2

school in gentrified area

5

5

1

9

8

5

2

C3

school in established middle class area

2

6

3

2

9

4

-5

C4

school in area with many new immigrants

4

5

7

1

3

3

5

D1

community supports educators

3

19

10

12

21

4

23

D2

community indifferent to educators

-7

-4

-10

-2

-3

-10

5

D3

community hostile to educators

-5

-16

-8

-14

1

-12

-14

D4

community embraces educators

5

14

11

6

15

8

14

Negative outcomes:

(Table 5) shows the results when we look at the scale in the opposite directions, with ratings of 1–2 (poor outcome) transformed to 100. The additive constants are all low, meaning that in general there is not an overwhelming negative feeling among the respondents. Yet there are some dramatic differences in baseline negativity among complementary groups. Females are more pessimistic than males (additive constant 31 for females versus 13 for males.) Younger respondents are more pessimistic than older respondents (additive constant 30 versus 14.) Those respondents coming from a self-defined poor neighborhood are more pessimistic than respondents coming from an up and coming neighborhood and a rich neighborhood (additive constant 38 vs 18 and 14)

Table 5. Relation between the presence/absence of elements and the likelihood of a NEGATIVE outcome for the student.  The columns refer to who the person IS.

Gender

Age

Neighborhood


Negative outcome

Male

Female

13–19

20–27

Poor

Up & coming

Rich

Additive constant

13

31

30

14

38

18

14

A1

teacher is black

1

-6

-3

-2

-4

0

0

A2

teacher is Caucasian

4

-8

-7

3

4

0

-6

A3

teacher is Asian

5

-10

-2

-4

-1

3

-9

A4

teacher is Hispanic

1

-13

-8

-4

-13

-1

-8

B1

students are docile

-2

4

1

2

-2

0

5

B2

students are antagonistic towards teacher

18

25

24

20

24

16

37

B3

students identify with teacher race

2

-3

-3

2

-10

-3

11

B4

students are accepting of the teacher

-4

-11

-8

-6

-20

-4

-5

C1

school in depressed area

7

9

4

11

6

8

11

C2

school in gentrified area

-6

1

3

-8

-4

-1

0

C3

school in established middle class area

1

1

-2

4

0

3

-1

C4

school in area with many new immigrants

-6

0

-5

-1

-7

-2

-11

D1

community supports educators

1

-16

-15

1

-19

-4

-5

D2

community indifferent to educators

11

0

4

7

10

7

1

D3

community hostile to educators

12

19

13

13

20

D4

community embraces educators

5

-14

-12

-3

-7

The keys to a poor future from the set investigated here are similar across groups)

students are antagonistic towards teacher

community hostile to educators

school in depressed area (except for those respondents coming from a self-described poor area)

Interactions between pairs of elements (scenario analysis)

A recurring question in the assessment of attitudes through experimentation is whether it is possible to identify interactions between ideas. We know from everyday life that changing the framework of a story from one venue to another may shift the way one evaluates the events in the story. Lawyers know the value of reframing to affect the nature of the facts of events, and perhaps affect the way a judge or jury evaluates the other facts. The foundations of Mind Genomics in permuted experimental design allowed for the evaluation of interactions when the design was constructed to account for those interactions. Conventional experimental design deals with a limited number of different variables, making it necessary to ‘build in’ the appropriate test stimuli in order to capture these interactions. The key is that the researcher must know the interactions to explore ahead of time, knowledge which guides the specific combination. The permutation algorithm of Mind Genomics creates many different combinations, a side benefit of which is the ability to test the interactions of pairs of elements in an efficient manner. The approach has been called scenario analysis [15].

In simple terms, one identifies a specific question (e.g., Question C; where the school is), and recodes every one of the cases with one of five numbers, depending upon the answer to the question as it appears in the vignette. Putting this into operation we sort the 1200 vignettes into five strata or groups, depending upon the value of the answer to Question C. There will be vignettes which lack any mention of the area of the school (C=0), vignettes which mention that the school is in a depressed area (C1), vignettes which mention that the school is in a gentrified area (C2), vignettes which mention that the school is in an established middle class area (C3), and finally vignettes which mention that the school is in an area with many new immigrants (C4). The foregoing stratification allows us to apply OLS regression to each stratum separately. The model comprises the additive constant, and 12 predictor variables, rather than the original 16. The model immediately shows how the mention of an area where the school IS affects the coefficients.

(Table 6) shows the results for the total panel, for the positive outcomes. (Table 7) shows the results for the total panel for the negative outcomes. The elements are sorted by the coefficient value when ‘no area mentioned.’ (Table 6) shows some noteworthy interactions When no area is mentioned, the additive constant is 83. Students are very positive. Without any information about the area, the expectation is almost 100% for a positive outcome when we talk about a positive community. Moving to mentions of areas generates far lower additive constants, at least half the magnitude of the additive constant when the fixed message is school in a depressed area, and a quarter the size of the additive constant when the fixed message is school with many new immigrants. When the school is in a depressed area, the respondents feel that it will be the community which can help. When the school is in a gentrified area, the respondents feel that a Caucasian teacher will be best for the student future. When the school is in an established middle-class area and when the school is in an area with many new immigrants, there will be many factors which drive an expectation of a positive future. When we look at the negative outcomes, we find that the expectations are low for negative outcomes, except for mentioning that the school is in an area with many new immigrants (high additive constant = 40.) There are only a few elements which are consistently problematic, and bode badly for the students:

students are antagonistic towards teacher

community hostile to educators

Table 6. How specifying the location of the school interacts with other elements of the vignette to drive a POSITIVE expected outcome for the student.

Positive Outcome

no area mentioned

school in depressed area

school in gentrified area

school in established middle class area

school in area with many new immigrants


Additive constant

83

42

42

35

21

D4

community embraces educators

18

5

4

-2

28

D1

community supports educators

12

12

5

8

21

D2

community indifferent to educators

6

-11

-1

-16

1

A2

teacher is Caucasian

-4

-2

14

9

17

A3

teacher is Asian

-6

-5

-4

13

10

D3

community hostile to educators

-13

-11

-22

-11

3

A1

teacher is black

-16

-2

6

10

14

A4

teacher is Hispanic

-18

-1

-2

12

10

B3

students identify with teacher race

-26

-6

7

19

11

B4

students are accepting of the teacher

-34

3

15

19

13

B1

students are docile

-47

8

5

4

9

B2

students are antagonistic towards teacher

-52

-18

-6

-17

-19

Table 7. How specifying the location of the school interacts with other elements of the vignette to drive NEGATIVE expected outcome for the student.


Negative Outcome

no area mentioned

school in depressed area

school in gentrified area

school in established middle class area

school in area with many new immigrants


Additive constant

22

17

8

27

40

B2

students are antagonistic towards teacher

15

33

21

19

17

D3

community hostile to educators

15

19

27

10

5

B1

students are docile

8

1

1

-2

0

A4

teacher is Hispanic

6

-4

-13

-6

-12

A3

teacher is Asian

3

-5

-3

-3

-12

A1

teacher is black

2

-1

5

1

-15

D2

community indifferent to educators

2

16

7

4

-5

A2

teacher is Caucasian

1

1

-10

9

-13

B3

students identify with teacher race

-1

7

7

-10

-4

B4

students are accepting of the teacher

-4

2

2

-19

-13

D1

community supports educators

-16

3

9

-16

-17

D4

community embraces educators

-18

-3

12

6

-22

Mind-Sets

One of the ongoing features of the emerging science of Mind Genomics is the search for mind-sets, defined as different ways of thinking about the same ideas. We are all familiar with different patterns of preferences for food. People may perceive food in the same way in terms of the sensory aspects, but some people love the food, whereas others may feel indifferent or even dislike the food. The same differences in opinion occur for ideas, such as one’s perception of the causes of positive versus negative outcomes for students, the topic studied here. Mind Genomics uncovers these different mind-sets, or viewpoints, by creating individual-level equations for each of the respondents, and then clustering the respondents using the pattern of the coefficients. Translating the approach to our data, the algorithm for uncovering mind-sets begins by creating 50 equations relating the presence/absence of the 16 elements or answers to the rating. Each respondent generates a unique set of coefficients, a straightforward process because the 24 vignettes evaluated by each respondent constituted an experimental design. The process then finds the ‘distance’ between each pair of the respondents, putting the respondents into two and then three non-overlapping groups so that the ‘distances’ are small between pairs of respondents within a group, and the distance is large between the averages of groups (different mind-sets).

Clustering is a well-accepted process in statistics [17]. The outcome of clustering is a set of different groups, created by mathematical, not intuitive criteria. The mind sets should be as few as possible (parsimony), so that they can lead to differential actions when the knowledge of the mind-sets becomes available (e.g., different messaging), and interpretable, so that the clustering makes sense. (Table 8) suggests two different mind-sets, focus on the teacher, and focus on the community. The mind-sets are named in accordance with the nature of the elements or answers to questions generating the highest coefficients. The radical difference between the relatively low values for the highest coefficients from the total panel (Table 4) suggest that within the population we end up with ‘damped’ or suppressed results because there are opposing forces that we cannot see, mutually contradicting each other. Knowing these mind-sets enables the researcher to assess the results from other studies, first by putting the students into the proper mind-set, and then determine whether the measured outcome co-varies with mind-set in a meaningful way.

Table 8. Mind-Set differences in the relation between the presence/absence of elements and the likelihood of both positive and negative outcomes.

Positive Outcome

Negative Outcome

Teacher – Student

Teacher -Community

Teacher – Student

Teacher -Community

Additive constant

28

44

29

17

Mind Set 1 – Focus on the teacher-student interaction

B4

students are accepting of the teacher

23

-1

-11

-4

B3

students identify with teacher race

21

-7

-7

6

C3

school in established middle class area

17

-8

-6

6

B1

students are docile

14

-8

2

1

C2

school in gentrified area

11

1

-5

-2

C4

school in area with many new immigrants

11

-1

-3

-4

A3

teacher is Asian

9

-7

-8

3

A2

teacher is Caucasian

8

5

-8

2

Mind Set 2 – Focus on the teacher-community interaction

D1

community supports educators

0

22

-6

-10

D4

community embraces educators

1

17

-6

-4

D3

community hostile to educators

-19

-1

17

12

C1

school in depressed area

6

-13

9

6

B2

students are antagonistic towards teacher

-6

-26

19

25

Not relevant to either Mind Set

A1

teacher is black

-1

5

-7

1

D2

community indifferent to educators

-15

4

5

5

A4

teacher is Hispanic

4

-3

-6

-5

Finding These Mind-Sets In The Population

A commonly held misconception is that WHO a person IS determines how the person thinks. That is, a great deal of marketing and policy behavior assumes that those who are similar on easy-to-measure variables are similar to each other in terms of the way they think. Sometimes this approach can generate an unduly number of clusters, or personas, in attempt to be general across many areas, yet sufficiently granular to be ‘actionable’ so that the recommendations are specific. The Mind Genomics ‘project’ continues to suggest that there are well-defined mind-sets, emerging not so much from who the person is as from the way the person responds to a specific set of messages. Membership in a mind-set for one topic area does not predict (as yet) membership in another mind-set created for a different topic area.

(Table 9) shows the breakdown of membership in the two mind-sets. It is very difficult to identify a variable which predicts mind-set membership in this newly discovered pair of complementary mind-sets. Furthermore, in the world of everyday experience, there are so many different types of experiences, and so much granularity that the effort to assign new people to the discovered mind-sets will probably not be very successful if the only data is WHO the person is, or WHAT the person does. A different approach is represented by the PVI, the personal viewpoint identifier. The PVI is constructed for a specific topic by identifying the elements which best differentiate between or among mind-sets, converting them to questions, with a binary response scale, and then computing the full set of possible patterns of responses, and the mind-set to which each pattern of response most likely belongs. (Figure 3) presents the PVI. The respondent and/or the group commissioning the study receive the feedback about the respondent, shown for example in (Figure 4). The same information can be sent to the respondent.

MIND GENOMICS-030_ASMHS_F3

Figure 3. The six question PVI for mind-sets in education. As of this writing (September, 2019) the PVI is located at this website: https://www.pvi360.com/TypingToolPage.aspx?projectid=91&userid=2018

MIND GENOMICS-030_ASMHS_F4

Figure 4. The feedback page to the respondent. The respondent, a new individual, is assigned to the mind-set that is shaded based upon the pattern of answers to the first six questions in Figure 3.

Table 9. Classification profiles of the total panel and the two mind-sets.


Total

Mind-Set Teacher

Mind-Set Community

Total

50

23

27


Male

25

10

15

Female

25

13

12

Age 13–19

24

10

14

Age 20–27

26

13

13


Total

50

23

27

Poor

10

8

2

Rich

11

2

9

Up-Coming

24

9

15

Messages Which Engage- Response Time and Attention

In the history of experimental psychology there has been a movement to measure non-cognitive variables, such as response time (reaction time), heart rate, and so forth, with the belief that these measures somehow ‘reveal’ other processes of decision-making, processes which are not under conscious control, and thus somehow ‘more true.’ [18] talks about the original efforts of experimenters such as Wilhelm Wundt, to understand these deep psychological processes by measuring the time between the presentation of a stimulus and the time needed for the observer (respondent) to react. The longer response or reaction times were assumed to be filled with unconscious decision processes. Following this worldview, we introduce the response time measure as a way to estimate the length of time required for a respondent to ‘process’ the information in a vignette. The approach follows the analytic structure done for the binary transformed ratings. The only differences are that the dependent variable is the response time in seconds (to the nearest tenth of a second), and the regression equation does not have an additive constant. The rationale for no additive constant comes from the reasoning that in the absence of any elements in the vignette the response time is 0 seconds. (Table 10) shows the estimated response time for total panel, gender, age, neighborhood, and finally the two mind-sets. To make discovery easier, we have sorted the response time from long to short (more engaged to less engaged) by the total panel and highlighted in shaded cells all response times of 1.3 seconds or longer for an element. The choice of 1.3 seconds is arbitrary, but represents quite a long processing time for an element, consistent with other research findings which show that studies of socially and personally relevant issues generate long response times, whereas studies of messaging about commercial products and services generate quite short response times, rarely longer than 0.5 seconds.

Table 10. Response time (in seconds) to the 16 elements, by Total Panel and key subgroup.

Gender

Age

Neighborhood

Mind-Set


Total

Male

Female

13–19

20–27

Poor

Up & Coming

Rich

Focus Teacher

Focus Community

B4

students are accepting of the teacher

1.3

1.2

1.3

1.4

1.1

0.8

1.6

1.2

1.0

1.5

B3

students identify with teacher race

1.3

1.1

1.4

1.2

1.2

1.1

1.2

1.3

1.3

1.2

D2

community indifferent to educators

1.1

0.9

1.4

1.5

0.8

1.4

1.0

1.3

1.0

1.3

B2

students are antagonistic towards teacher

1.0

1.0

1.0

1.3

0.8

0.6

1.1

1.0

0.8

1.2

D3

community hostile to educators

1.0

0.9

1.2

1.4

0.7

1.5

1.0

0.8

1.0

1.1

D4

community embraces educators

1.0

1.0

1.0

1.4

0.7

1.4

0.8

0.8

0.9

1.1

C2

school in gentrified area

1.0

1.1

1.0

1.1

1.0

0.8

1.2

0.7

1.2

0.9

C3

school in established middle class area

1.0

0.7

1.3

1.1

1.0

0.9

0.8

1.3

1.1

0.9

D1

community supports educators

0.9

0.9

0.8

1.5

0.2

1.1

1.1

0.4

0.5

1.2

C4

school in area with many new immigrants

0.9

0.6

1.2

1.0

0.7

0.3

1.1

0.5

0.9

0.8

C1

school in depressed area

0.9

0.5

1.3

1.1

0.7

1.2

0.7

0.4

1.2

0.6

B1

students are docile

0.8

0.7

0.8

0.9

0.6

0.3

0.9

0.9

0.5

1.0

A4

teacher is Hispanic

0.7

0.6

0.8

0.1

1.3

1.1

0.5

1.7

0.8

0.6

A2

teacher is Caucasian

0.6

0.3

0.9

0.3

1.0

0.4

0.6

1.5

0.5

0.7

A1

teacher is black

0.6

0.4

0.7

0.2

1.0

0.8

0.3

1.3

0.6

0.6

A3

teacher is Asian

0.4

0.5

0.4

-0.1

0.9

0.6

0.3

1.4

0.6

0.4

The patterns emerging can be summarized as follows:

Total panel – Only one element engages

students are accepting of the teacher

Males – No element engages attention for the requisite 1.3 seconds

Females – No clear pattern, but appear to read the material in greater depth than do males

students identify with teacher race

community indifferent to educators

students are accepting of the teacher

school in established middle class area

school in depressed area

Age 13–19 – Respond to many elements about the community

community indifferent to educators

community supports educators

students are accepting of the teacher

community hostile to educators

community embraces educators

students are antagonistic towards teacher

Age 20–27 – Only one element engages

teacher is Hispanic

Poor Neighborhood – Elements having to do with the community

community hostile to educators

community indifferent to educators

community embraces educators

Up & Coming Neighborhood

students are accepting of the teacher

Rich Neighborhood – Focus on the nature of the teacher

teacher is Hispanic

teacher is Caucasian

teacher is Asian

students identify with teacher race

community indifferent to educators

school in established middle class area

teacher is black

Mind-Set 1 – Focus on Teacher

students identify with teacher race

Mind-Set 2 – Focus on Community – no clear pattern

students are accepting of the teacher

community indifferent to educators

Discussion and Conclusions

As of this writing, there is an increasing focus on the educational system, in terms of its ability to prepare the students. There are those who believe that the education system is ‘fine,’ because it complies with specific government objectives, and therefore there is little to worry about. There are others who believe that the education system is, in fact, a mess, resulting from the teacher’s focusing on ‘performance of standardized tests,’ and not on real teaching. Almost sixty years ago, educator Dr. Banesh Hoffmann, mathematics professor at Queens College and education refeormer, called out the education establishment in his controversial book, ‘The Tyranny of Testing.’ [19]. (Full disclosure; Professor Hoffmann was the major mathematics professor of author Moskowitz in 1964–1965, and contributed to the thinking which appears in this chapter) Today, there is an opportunity to reform education, to improve. The world has changed dramatically, the availability of technical aids to education and to creative thought has never been greater. The students of everyday are becoming increasingly sophisticated with computer electronics and even with coding thanks first to the widespread use of smartphones, and the social approbation given to coding.

When we step back, from the specifics to the general, and work with young people ages 13–27, we see that we have two groups. One group of young people feel that success is due to the interaction between the teacher and the student. Another group, a bit larger, feels that the success of a student is due far more to the interaction between the teacher and the community, specifically the community actively supporting the teacher. From the point of view of policy, it might well be a good idea to use this type of information to craft a dual message, how the teacher is a key, positive support to the student, and the community is a key, positive support to the teacher and the student. This PR campaign needs the specific words to use, a next step in the research effort reported here.

Acknowledgement

Attila Gere thanks the support of Premium Postdoctoral Research Program of the Hungarian Academy of Sciences.

References

  1. Hollins ER (2011) Teacher preparation for quality teaching. Journal of Teacher education 62: 395–407.
  2. Epstein JL and Sheldon SB (2006) Moving forward: Ideas for research on school, family, and community partnerships. SAGE handbook for research in education: Engaging ideas and enriching inquiry Pg No. 117–138.
  3. Kuh GD (2001) Organizational culture and student persistence: Prospects and puzzles. Journal of College Student Retention: Research Theory & Practice 3: 23–39.
  4. Kuh GD (1995) The other curriculum: Out-of-class experiences associated with student learning and personal development. The Journal of Higher Education 66: 123–155.
  5. Berger JB (2001) Understanding the organizational nature of student persistence: Empirically-based recommendations for practice. Journal of College Student Retention: Research Theory & Practice 3: 3–21.
  6. Bickel R and Papagiannis G (1988) Post-high school prospects and district-level dropout rates. Youth & Society 20: 123–147.
  7. Jordan WJ and Cooper R (2003) High school reform and Black male students: Limits and possibilities of policy and practice. Urban Education 38: 196–216.
  8. Kao G and Thompson JS (2003) Racial and ethnic stratification in educational achievement and attainment. Annual review of sociology 29: 417–442
  9. Heath AF, Rothon C, Kilpi E (2008) The second generation in Western Europe: Education, unemployment, and occupational attainment. Annual Review of Sociology 34: 211–235.
  10. Moskowitz HR and Park B (2015) How students want to study mathematics. Unpublished observations.
  11. Steinman RB (2009) Projective techniques in consumer research. International Bulletin of Business Administration 5: 37–45.
  12. Box GE, Hunter WG, Hunter JS (1978) Statistics for experimenters, New York, John Wiley.
  13. Green PE and Rao VR (1971) Conjoint measurement for quantifying judgmental data. Journal of Marketing Research 8: 355–363.
  14. Green PE and Srinivasan V (1990) Conjoint analysis in marketing: new developments with implications for research and practice. The Journal of Marketing 54: 3–19.
  15. Moskowitz HR and Gofman A (2007) Selling blue elephants: How to make great products that people want before they even know they want them. Pearson Education.
  16. Gofman A and Moskowitz H (2010) Isomorphic permuted experimental designs and their application in conjoint analysis. Journal of Sensory Studies 25: 127–145.
  17. Dubes R and Jain AK (1980) Clustering methodologies in exploratory data analysis. Advances in Computers 19: 113–238.
  18. Boring EG (1929) A History of Experimental Psychology. The Century Company, NY.
  19. Hoffmann B and Barzun J (2003) The tyranny of testing. Courier Corporation.