Abstract
We present a new way to understand the mind of the investor, moving away from technical models of investing to determining in simple terms of type of information that the person feels to be important when deciding to invest. The experiment identifies the relative importance of different types and sources of information to which a person might pay attention. The approach, Mind Genomics, combines simple messages or elements to create vignettes, concepts which present several different aspects of the news and information. The respondent rates these different combinations in terms of the degree to which the combination reflects the respondent. Mind Genomics reveals three clearly different mind-sets of individuals, from those who focus on the source of the information, those who focus on the story and information, and those who focus on what their friends are saying and their own insights from mathematical models. Mind Genomics presents a new approach to understanding decision making under uncertainty, based upon the nature of the mind of the person.
Introduction
The world of investing combines a plethora of disciplines, some economic, some mathematical, most psychological, and a great deal of simple human behavior which constitutes the quotidian behavior of daily life. There is vast literature on what the person ‘might be doing,’ what type of information does the person take into account, predispositions riskiness, financial acuity, and comfort. Entire courses about Finance are devoted to the stock market, to the psychology of investing, and so forth. An excursion in the world of the psychology of investing usually begins with economics as the foundation, and the human player linked into the economics, either obeying the laws of rationality proclaimed by economic theory, or behaving as human beings filled with emotion and biases, proclaimed by the new discipline of behavioral economics. The focus may be on risk taking [1], on the nature of information [2], on the tonality of information provided by the corporation such as social conscientiousness [3], on gender [4, 5] even the susceptibility of the respondent investor to the messaging of others [6]. Yet, with all this information we do not get a sense of the mind of the investor as separate from the act of investing, although there are papers on ‘investor psychology’ [7, 8].
This study steps back from the increasingly sophisticated analysis to look at the simple presentation of investing behavior, the type of presentation that a person in psychology might find interesting, e.g., a brokerage. We look at how people respond to descriptions of investor behavior, to say ‘fits me’ or ‘doesn’t fit me.’ We are not looking for theoretical structures, but simply for a way to understand the way people think of themselves. We are acting as a psychologist, a doctor, a diagnostician of the mind, and not presenting a deep approach of what we believe are the theoretical bases for underlying behavior’.
Method
The research used the approach developed for the emerging psychological science of Mind Genomics, with origins in experimental psychology, experimental design, and marketing. The objective of Mind Genomics is to map out the decision rules for a topic, with that topic being familiar, such as eating a food, choosing a physician, selecting a product in a store, or in this study, investing in the stock market. In all of these topics, one either asks the respondent to describe her or his behavior through qualitative research (focus groups; discussions), observes the behavior, uses surveys, or following Mind Genomics, presenting the respondent with simulated situations, and observing the behavior. Mind Genomics produces a cartography of ideas or perhaps more appropriately, a listing of the relevant idea in a topic, and a metric associated with these ideas. The metric may be the linkage of the idea to oneself (fits me) or the degree to which the idea drives an expected action, such as choose to invest or choose to buy.
The origins of Mind Genomics in terms of psychology and philosophy comes from the method of induction, offered by philosopher Francis Bacon, combined with the Socratic Method for asking questions. In the simplest terms, a Mind Genomics exploration or cartography of a topic comprises the definition of the topic, the asking of four ideas, the creation of four answers for each question, the combination of these answers into vignettes, and finally obtaining respondent ratings of these combinations, followed by a statistical analysis of the ratings of combinations to show the ‘effect’ of each individual idea. The scientific history of Mind Genomics has its origins in the merger of experimental psychology to understand the ‘mind’ statistics using experimental design to create the necessary stimuli, and marketing research which focuses on the daily life of people. The necessary papers constituting the background can be found by looking at the introduction and references provided by [9, 10, 11] psychology, market research and Box [12] experimental design in the field of statistics. As described above, the Mind Genomics method may seem to be one of the many different forms of surveys, and one would not be totally wrong to conclude so. Yet, there is a difference between a survey and a Mind Genomics cartography. With a survey, one asks the respondent a question, and obtains one of several answers. The analysis shows which answers are linked with a question/ The analysis provides mind-sets as well, different patterns of answers to the same question. The analysis does not show causality, however, as might be the conclusion if one could link a response (invest) to a set of messages. In contrast to the intellectual history and applications of the survey method, Mind Genomics can be said to be an experiment. Mind Genomics creates a set of systematically created combinations with known elements in each combination, presents these combinations to the respondent, who integrates the information in each combination, and rates the combination on a scale defined by the researcher. The analysis links the response to the individual element, revealing the decision criteria of the respondent. The respondent need not explicate the criterion for decision; they emerge from the regression analysis.
For the world of investment, Mind Genomics works at the level of the conversation, not the level of technical. That is, the test elements, the stimuli, are mixed into vignettes, combinations of simple phrases describing the nature of the information that a person might obtain from everyday life. These elements are presented as key sources of information. The respondent is then instructed to read each vignette, i.e., combination of ‘information’ and say whether paying attention to that combination of information ‘describes me’ or does not describe me.
Explicating a Mind Genomics Experiment – What information is Perceived to be ‘Relevant’
A great deal of the informal talk about investment deals with the source of the information, and perhaps some surface specifics. This information can be gleaned from participating in the myriad conversations which occur in the morning in offices, at breakfasts among friends, and so forth. Mind Genomics captures this information through a Socratic process, comprising the requirement to generate four questions which tell a story, and then four answers to each question. The task is not particularly challenging but does require people to think in a critical manner. (Table 1) presents the four questions and the four answers to each question. If this study were to be a simple questionnaire, then the researcher would list the answers in some randomized order, present the 16 answers as 16 actual ‘questions’ and instruct the respondent to scale the importance of the answer in terms of how affects the respondent’s decision when thinking about an investment, whether the respondent is an actual investor or instructed to think in the way an investor would think. The important thing to keep in mind is that the survey forces an intellectual consideration of each answer ‘separately,’ and out of context. The task is difficult primarily because it is hard to think of just one idea at a time. Often the respondent attempts to give the researcher answers deemed to be politically correct and appropriate. Mind Genomics works in a different way.
Table 1. The four questions and the four answers to each question.
|
|
Question A: Where do you read the news of business that you follow? |
|
A1 |
The news appears in the Wall Street Journal |
|
A2 |
The news appears in Bloomberg |
|
A3 |
The news appears in CNBC |
|
A4 |
The news is given by your colleagues at your office |
|
|
Question B: What is the major business news break of the morning? |
|
B1 |
Story: Imminent tariffs and how they will affect trade |
|
B2 |
Story: Structural problems in the vertical promise downstream trouble |
|
B3 |
Story: Investors seem to be taking a big position in a vertical |
|
B4 |
Story: Investors seem to be selling off more rapidly than expected |
|
|
Question C: What are the details of the specific vertical that you follow? |
|
C1 |
Follow the vertical because I’m heavily knowledgeable in it and feel it’s home |
|
C2 |
Just got into the vertical because of recommendations from people I trust |
|
C3 |
The mathematical models I use say ‘this vertical is hot’ |
|
C4 |
Everyone in the office is abuzz about something big happening here |
|
|
Question D: What is the tonality of the story? |
|
D1 |
The tone of the news is so clear that I feel I just have to do something |
|
D2 |
I think I’ve discovered something really critical here that no one knows |
|
D3 |
Everything I hear tells me no one knows exactly … what a chance for ME |
|
D4 |
My experience tells me there’s money to be made here … I just know it |
The underlying premise is that people may not be able to tell an interviewer what they want, how they make a decision, and what they will do. At a conscious level the respondent may not even know the answers to the questions, but the social constraints of interviewing require an answer or permission to not guess. Yet, for the most part, people behave in a consistent manner, even though they might not be aware of just how consistent their behavior might be. The question is how to determine what people think when they cannot or will not reveal this in a directed questionnaire, despite their real-world consistent behavior. In the Mind Genomics experiment the researcher identifies messages which may be relevant. These are the 16 answers to the four questions in (Table 1). The role of the question is simply to set the story, and to elicit the answers. It is the answers which are relevant. Mind Genomics then combines these answers (elements) into small, easy to read vignettes, concepts, according to an experimental design. The design ensures that each of the elements appears an equal number of times in different vignettes and constitutes only part of the vignette. Other elements are present in the same vignette. The respondent’s task is to read the entire vignette as one idea and assign a rating. The respondent rates 24 such vignettes. The combination of different elements makes it impossible for the respondent to focus on one element. Rather, as in real life, the respondent must respond quickly, almost intuitively, to the combination. What emerges is a more valid response to the test stimuli, the vignettes. As will be explicated below, the experimental design allows the researcher to deconstruct the response to the mixture, the vignette, into the separate contributions of the 16 elements.
Creating the Test Combinations (Vignettes) by Experimental Design
People are accustomed to reading paragraphs or collections of disparate information, and making a decision on the combination. It is intellectual challenging when reading a combination to assign the relative importance of each piece of information in the combination, although when pressed to do so, the respondent can probably come up with a criterion. There are a number of methods which try to estimate the likely performance of a combination by the evaluation of single elements (self-explication of components), or the choice between pairs of elements [13]. These approaches are cognitively challenging, making the respondent move beyond sampling and rapidly evaluating the combination, but rather focus on the components of a mixture, an atypical situation.
In the Mind Genomics system, the 16 answers or elements are combined into a set of 24 vignettes, combinations, with the experimental design valid for a single individual. That is, all of the 16 elements are statistically independent of each other, each vignette comprises at most only one element or answer from any question, and there are vignettes in which answers from some questions are missing. Each vignette comprises 2–4 elements. This approach, the within-subjects design, is very powerful because it allows the data to be analyzed at the level of the individual respondent, a property very critical for mind-set segmentation. One other feature deserves mention. When only one set of 24 vignettes were to be tested, the researcher would have to be very careful about selecting the specific vignettes. Rather than forcing a lot of thinking about just what combinations to develop by the experimental design, Mind Genomics makes use of a patented technology, permuted experimental design [14] to systematically vary the specific elements that are combined in the vignettes. The mathematics of the design are maintained, but the combinations different for each person. Thus, it becomes possible to explore a topic area quickly, reduce most of the intellectual bias, and uncover the ‘mind of the respondent’. The set-up of the study has been automated (www.BimiLeap.com). The app allows the researcher to type in the questions, then the answers, and a rating scale. Afterwards, the researcher selects the panel, generally using an on-line panel provider. (Figure 1) shows the set of set up screens that the researcher would use to create the experiment. After the researcher has set up the study, the researcher launches the study. Usually the on-line panel providers generate the necessary, qualified respondents in about 2–3 hours. The data are analyzed automatically to generate summary models for total panel, gender, age, a third question (type of information), and emergent mind-sets (discussed later on.)
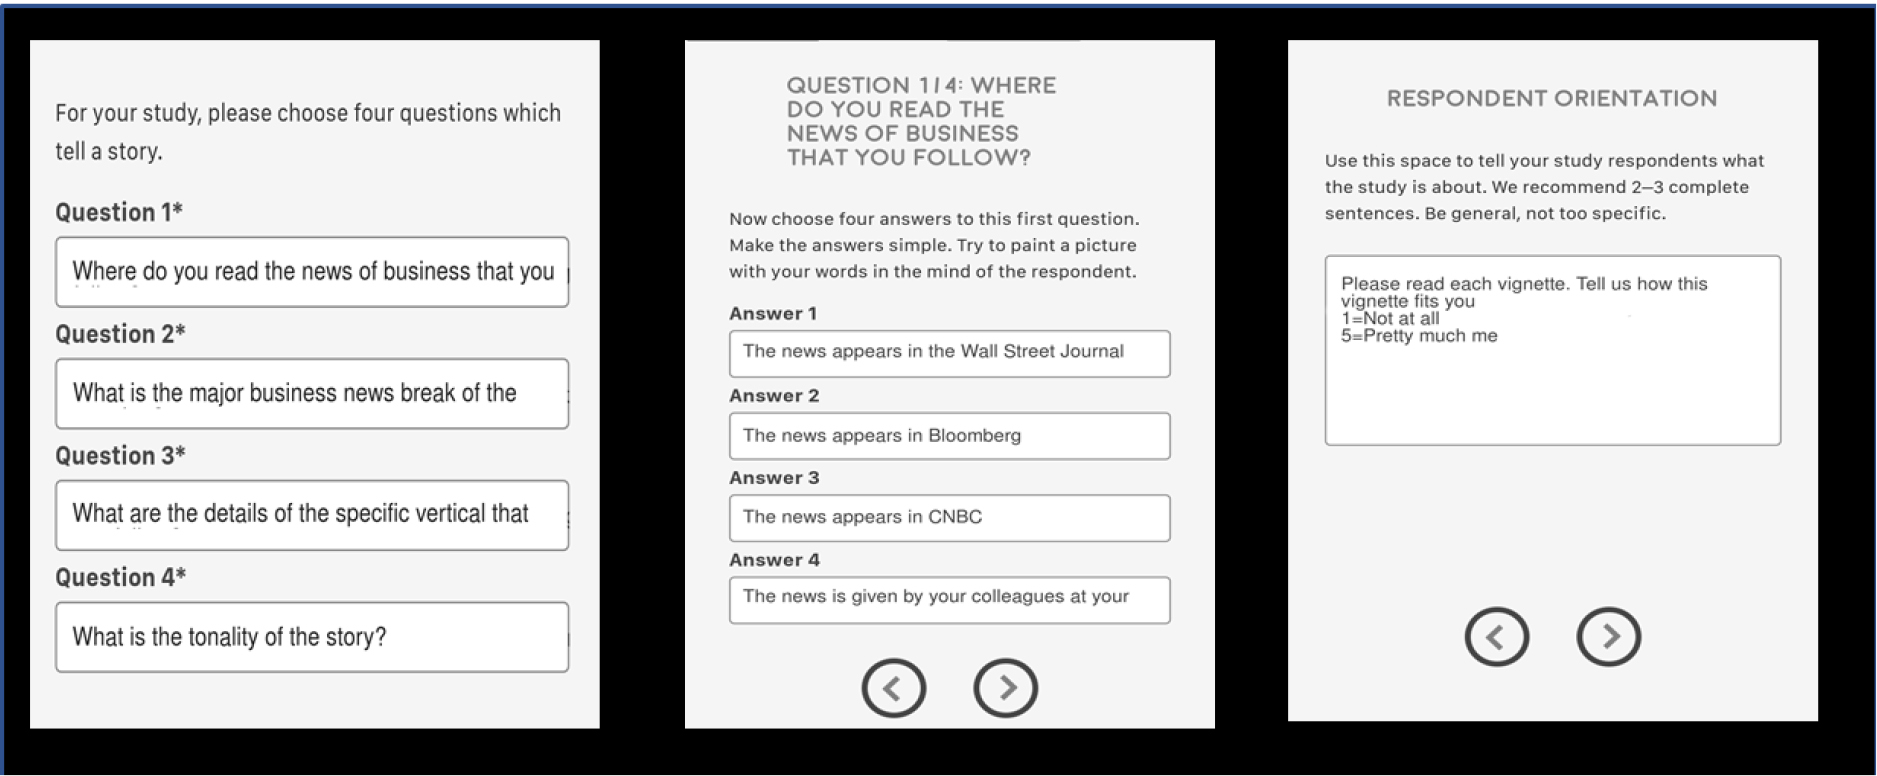
Figure 1. The set-up of the study in the BimiLeap app prior to the experiment. The left panel shows the four questions, the middle panel shows the four answers to the first question, and the right panel shows the respondent orientation and scale.
The analytic approach for each subgroup (e.g., total panel, gender, age, third question, mind-set) is the same, comprising the assemblage of all the data for the relevant respondents for that subgroup (24 records for each respondent), and a linear regression model relating the presence/absence of the elements in a vignette (code 0=absent, 1=present) to the rating (1–5), or more generally to a binary transformation of the rating (1–3 ® 0 ; 4–5 ® 100). The binary transformation reflects legacy from consumer research and management needs. Consumer researchers often use category or Likert Scales, anchored at both ends (e.g., our 1–5 scale). Managers often prefer data presented in binary form, no/yes, no go/go, reject/accept, etc.
Building Models to Show How The Elements Drive The Binary Response (Top2Box) and response time (RT)
The experimental design created for each individual respondent produce 1200 individual vignettes or combinations of elements, most of which differ from each other. Thus, the Mind Genomics experiment covers a wide range of alternative combinations of elements. The experimental design created for each indivual, based as it is on a ‘kernel’ experimental design permuted for the respondents, ensures that the set of 16 elements are statistically independent of each other.
The data matrix comprises 1200 rows 24 rows for each respondent. Each respondent has a unique identification number, and a set of 16 columns to store the the independent variables. The independent variables, the 16 answers or elements, are coded 0 or 1, respectively. A 0 represents the fact that the element is absent from the vignette, whereas a 1 represents the fact that the element is present in the vignette. The three dependent variables are the original rating on a 5-point scale, the binary equivalent (Top2Box, 0/100) emerging from a recoding of the ratings, and finally the number of seconds showing the ‘response time’ (or reaction time), defined as the time between the appearance of the vignette and the respondent rating. (Table 2) shows part of the data set that will be used in the regression modeling (Table 2) shows the data structure. The experimental design comprises simply the listing of the different elements. The design must be translated into a series of 0’s (element absent from the vignette), and 1’s (the element present in the vignette.) The statistical modeling, OLS (ordinary least-squares) regression analysis, assigns a weight to each of the 16 predictor variables (A1-D4) so that by knowing what elements are in the vignette one can estimate the likely rating by simply summing up the coefficient [12].
Table 2. Structure of the first eight vignettes, and the ratings.
|
Respondent self-description from the self-profiling classification at the start of the experiment |
||||||||
|
Test Order |
1 |
2 |
3 |
4 |
5 |
6 |
7 |
8 |
|
Element (Answer) |
|
|
|
|
|
|
|
|
|
Answer to Question A |
A1 |
A1 |
A4 |
A2 |
A2 |
A3 |
A4 |
A4 |
|
Answer to Question B |
B4 |
B3 |
B4 |
|
B3 |
B2 |
B3 |
B1 |
|
Answer to Question C |
C1 |
Absent |
C1 |
C4 |
C2 |
C2 |
C4 |
Absent |
|
Answer to Question D |
Absent |
D1 |
Absent |
D2 |
D4 |
D3 |
D3 |
D4 |
|
Binary expansion of design |
|
|
|
|
|
|
|
|
|
A1 |
1 |
1 |
0 |
0 |
0 |
0 |
0 |
0 |
|
A2 |
0 |
0 |
0 |
1 |
1 |
0 |
0 |
0 |
|
A3 |
0 |
0 |
0 |
0 |
0 |
1 |
0 |
0 |
|
A4 |
0 |
0 |
1 |
0 |
0 |
0 |
1 |
1 |
|
B1 |
0 |
0 |
0 |
0 |
0 |
0 |
0 |
1 |
|
B2 |
0 |
0 |
0 |
0 |
0 |
1 |
0 |
0 |
|
B3 |
0 |
1 |
0 |
0 |
1 |
0 |
1 |
0 |
|
B4 |
1 |
0 |
1 |
0 |
0 |
0 |
0 |
0 |
|
C1 |
1 |
0 |
1 |
0 |
0 |
0 |
0 |
0 |
|
C2 |
0 |
0 |
0 |
0 |
1 |
1 |
0 |
0 |
|
C3 |
0 |
0 |
0 |
0 |
0 |
0 |
0 |
0 |
|
C4 |
0 |
0 |
0 |
1 |
0 |
0 |
1 |
0 |
|
D1 |
0 |
1 |
0 |
0 |
0 |
0 |
0 |
0 |
|
D2 |
0 |
0 |
0 |
1 |
0 |
0 |
0 |
0 |
|
D3 |
0 |
0 |
0 |
0 |
0 |
1 |
1 |
0 |
|
D4 |
0 |
0 |
0 |
0 |
1 |
0 |
0 |
1 |
|
Dependent variables |
|
|
|
|
|
|
|
|
|
Rating |
3 |
4 |
4 |
1 |
3 |
3 |
4 |
1 |
|
Top2Box |
0 |
100 |
100 |
0 |
0 |
0 |
100 |
0 |
|
Response time |
9.0 |
3.9 |
2.4 |
3.9 |
2.6 |
1.8 |
2.4 |
2.9 |
The actual study was run in the middle of August, 2019, using an on-line panel provide, Luc.id. The actual process of developing the study, running the respondents, and then analyzing the data, took approximately three hours, from start to finish, using the above-mentioned program www.BimiLeap.com. The program itself guides the user, from the start (specifying the topic, posing the questions, requiring four answers to each question) on through instructing the respondents, asking other questions beyond age and gender, and then requiring the researcher to write a short paragraph of WHY the study is being done. The latter requirement, a short paragraph about WHY, comes from the major use of the BimiLeap program to ‘teach critical thinking,’ and not just to be a survey tool. A great deal of consumer research can be made tortuous by forcing the researcher to create a questionnaire, call a panel service, and run the study. The approach of BimiLeap and other modern platforms is to dispense with the back and forth process of dealing directly with an on-line field service. The approach requires the research to specify the specifics of the respondent, assuming they are not overly specific, and then launch the study with a credit card. Everything else is automated. The process returns with a report in PowerPoint® and well as the raw data and relevant tabulations in Excel®. This automated set-up allows the entire process to be completed in 2–3 hours, with the set up of the study, e.g., thinking of the questions and answers, the critical thinking, coming to the fore as the rate-limiting step.
Modeling
For the OLS regression we use ALL the data from all relevant respondents in a defined subgroup. For example, with 50 respondents, and with 24 vignettes for each respondent the relevant data for the total panel is 50×24 or 1200 rows of data, also called ‘observations.’ The independent variables are the 16 elements, coded 1 or 0. The dependent variable is the so-called Top2Box (a term from consumer research). The Top2Box becomes 100 (plus a small random number) when the original rating is 4 or 5. The Top2Box becomes 0 (plus a small random number) when the original rating is 1,2 or 3, respedtively. In a second analysis, looking at response time as the dependent variable, the same structure of analysis holds, except that the dependent variable is simply the response time from the appearance of the vignette on the respondent’s screen until the rating. The response time is recorded to the nearest 10th of a second.
We inteprret the coefficient as the, probability that the respondent will assign a rating of 4–5 to a vignette when the eleent appears vignette. When we switch to the response time, the we intepret the coefficient as the number of seconds neede to process the element, i.e., to read it and move on. A benefit of the modeling is its ability to deconstruct the compound stimulus, the vignette, into the part-worth contributions of the individual elements. Researchers often believe that this decomposition can be done easily and with only a bit of attention. A strategy occasionally used is to circle the relevant elements if a vignette. This ‘strategu of highlight what seems to be important’ seems at first quite reasonable, but in light of the power of the regression analysis enabled by the experimental design, such manual circling appears to be inefficient, primitive, and unable to deal at all with response time and processing speed. (Table 3) presents the output of the regression analysis. Most regression packages present the regression results in the same fashion. The elements are presented at the left of the table, with abbreviation first, and then the text of the element. The elements are presented in descending order of magnitude, as shown by the column marked ‘Coeff.’
Table 3. Statistical output of the regression model for the Total Panel. The dependent variable is the binary transformation ‘describes me.’ The independent variables are the 16 answers or elements in the vignettes.
|
|
Dep |
Coeff |
SE |
t-stat |
p-Val |
|
C1 |
Follow the vertical because I’m heavily knowledgeable in it and feel it’s home |
11.06 |
3.706 |
2.98 |
0.00 |
|
B3 |
Story: Investors seem to be taking a big position in a vertical |
11.01 |
3.694 |
2.98 |
0.00 |
|
A2 |
The news appears in Bloomberg |
10.21 |
3.757 |
2.72 |
0.01 |
|
A4 |
The news is given by your colleagues at your office |
10.12 |
3.787 |
2.67 |
0.01 |
|
A3 |
The news appears in CNBC |
9.87 |
3.757 |
2.63 |
0.01 |
|
D1 |
The tone of the news is so clear that I feel I just have to do something |
9.09 |
3.739 |
2.43 |
0.02 |
|
A1 |
The news appears in the Wall Street Journal |
8.83 |
3.712 |
2.38 |
0.02 |
|
B4 |
Story: Investors seem to be selling off more rapidly than expected |
8.44 |
3.673 |
2.30 |
0.02 |
|
C2 |
Just got into the vertical because of recommendations from people I trust |
8.00 |
3.739 |
2.14 |
0.03 |
|
B1 |
Story: Imminent tariffs and how they will affect trade |
7.75 |
3.654 |
2.12 |
0.03 |
|
D2 |
I think I’ve discovered something really critical here that no one knows |
6.79 |
3.800 |
1.79 |
0.07 |
|
C4 |
Everyone in the office is abuzz about something big happening here |
6.16 |
3.75 |
1.64 |
0.10 |
|
D4 |
My experience tells me there’s money to be made here … I just know it |
4.15 |
3.744 |
1.00 |
0.27 |
|
B2 |
Story: Structural problems in the vertical promise downstream trouble |
3.49 |
3.710 |
0.94 |
0.35 |
|
C3 |
The mathematical models I use say ‘this vertical is hot’ |
3.24 |
3.685 |
0.88 |
0.38 |
|
D3 |
Everything I hear tells me no one knows exactly … what a chance for ME |
2.75 |
3.795 |
0.73 |
0.47 |
The regression model estimates the coefficients, k1-k16, for the simple linear equation:
Top2 or Number of Seconds = k1(A1) + k2(A2) … k16(D4)
For the Top2Box model, the coefficient (coeff), shows the expected number of binary points that would be added to a vignette if the element were inserted into the vignette. This can be interpreted as the incremental percent of respondents who would rate the vignette as 4 or 5 when the element is inserted into the vignette.
The element most describing the respondents in their own opinion, at least on average, is:
C1: Follow the vertical because I’m heavily knowledgeable in it and feel it’s home (coefficient of 11.06.)
The element least describing the respondents in their own opinion, at least on average, is:
D3 Everything I hear tells me no one knows exactly … what a chance for ME (coefficient of 2.75)
Next to the coeff (coefficient) is the column label SE. SE is the standard error of the coefficient, or the expected variability of the coefficient if the study were repeated. The coefficient is an estimated parameter for real data. As such, the variation in the data upon repeated studies may be expected to affect the estimated value of the coefficient. The lower the variation in the coefficient, i.e., the lower the value of SE, the more likely it is that we have value of the coefficient which is not truly 0. The likelihood of having a coefficient truly different from 0 is given by the t-stat (t-statistic, a measure of the signal/noise ratio), and the p-value, the probability that the t-statistic is really 0. We should look at all of the coefficients above 0.11 as being truly different from 0. Our data suggests most of the elements are really truly different from 0, i.e., probably are somewhat truly descriptive of the respondents as a group. The only elements which are probably 0 are these four, with coefficients lower than 5.
D4 My experience tells me there’s money to be made here … I just know it4.15
B2 Story: Structural problems in the vertical promise downstream trouble 3.49
C3 The mathematical models I use say ‘this vertical is hot’ 3.24
D3 Everything I hear tells me no one knows exactly … what a chance for Me 2.75
The user interpretation of the coefficients is different from the statistical interpretation. The coefficient shows the linkage between the person and the element. High coefficients mean that there is a strong linkage. In percentage terms, where 0 is no linkage and 100 is perfect linkages, i.e., 0=does not describe me … 100=describes me, the coefficient gives the additive percent towards the complete linkage. The elements are additive. That is, one can put up to four elements together, when they are answers to different questions and estimate the total degree of linkage.
The regression model does not have an additive constant for this study. The rationale for omitting the additive constant, i.e., forcing the regression model through 0, is that in the absence of elements there is no meaning to the additive constant. In contrast, were the rating scale to be ‘likelihood to purchase,’ and a 1–5 scale transformed in the same way, the additive constant would be meaningful. It would be the likely interest in purchasing the product or service in the absence of any information. That likelihood value is both relevant and truly informative.
Results From the Regression Analysis
The regression modeling was done with a variety of subgroups, as the respondents defined themselves. (Table 4) shows us the coefficients from the total panel, from genders, and from the two ages. It is clear from (Table 4) that many numbers are linked to the way the respondent feels about herself or himself. These are the elements which generate coefficients of 10 or higher, twice the standard error, and thus a coefficient whose t-statistic approaches or exceeding 2.0.
Table 4. Performance of the elements by key subgroups, defined by who the respondents say they ARE
|
|
Subgroups self-defined by who the respondent IS |
Total |
Male |
Female |
Age < 60 |
Age 60+ |
|
B3 |
Story: Investors seem to be taking a big position in a vertical |
10 |
11 |
10 |
10 |
12 |
|
A2 |
The news appears in Bloomberg |
11 |
16 |
10 |
13 |
8 |
|
A3 |
The news appears in CNBC |
10 |
24 |
5 |
6 |
12 |
|
B4 |
Story: Investors seem to be selling off more rapidly than expected |
11 |
21 |
7 |
6 |
9 |
|
B1 |
Story: Imminent tariffs and how they will affect trade |
10 |
17 |
7 |
8 |
7 |
|
C1 |
Follow the vertical because I’m heavily knowledgeable in it and feel it’s home |
8 |
18 |
3 |
10 |
12 |
|
A1 |
The news appears in the Wall Street Journal |
8 |
14 |
5 |
2 |
14 |
|
A4 |
The news is given by your colleagues at your office |
8 |
7 |
9 |
11 |
10 |
|
C2 |
Just got into the vertical because of recommendations from people I trust |
9 |
15 |
7 |
8 |
8 |
|
B2 |
Story: Structural problems in the vertical promise downstream trouble |
9 |
5 |
10 |
1 |
5 |
|
C4 |
Everyone in the office is abuzz about something big happening here |
6 |
10 |
5 |
7 |
5 |
|
D2 |
I think I’ve discovered something really critical here that no one knows |
3 |
2 |
4 |
2 |
12 |
|
D1 |
The tone of the news is so clear that I feel I just have to do something |
3 |
-5 |
6 |
7 |
11 |
|
C3 |
The mathematical models I use say ‘this vertical is hot’ |
7 |
5 |
7 |
0 |
7 |
|
D3 |
Everything I hear tells me no one knows exactly … what a chance for ME |
4 |
5 |
4 |
-4 |
8 |
|
D4 |
My experience tells me there’s money to be made here … I just know it |
3 |
8 |
2 |
-2 |
9 |
One way to look at these results might be to sort the elements by the number of subgroups which find the element to be important (i.e., the coefficient of 10 or higher). Whe we do this sort, we find that there are just two extraordinarily strong elements, elements whose strong performance is not surprising.
B3 Story: Investors seem to be taking a big position in a vertical
A2 The news appears in Bloomberg
Despite the presence of strong performing elements in each group, there is no easy story to be gleaned from the data. The data are statistically strong but suggest that either there is no pattern, or more likely, the pattern has little to do with who the respondents ARE in a geo-demographic sense. When we look at the respondents by their self-described attitudes towards investing, the picture becomes much clearer, as (Table 5) shows. Those who do not like investing feel that they are best described by elements which convey a ‘general feeling.’ Those who invest with advice feel they are best described by messages about the source of the information and described by their own research. Those who are active investors feel that they are described both by the source and by the ‘story.’
Table 5. Performance of the elements by key subgroups, defined by how the respondent describes her or his attitude towards investing
|
|
Subgroups self-defined by how the respondent defines her/his investing behavior |
Do not like investing |
Invest with advice |
Active investor |
|
D4 |
My experience tells me there’s money to be made here … I just know it |
14 |
0 |
7 |
|
D1 |
The tone of the news is so clear that I feel I just have to do something |
13 |
3 |
11 |
|
A3 |
The news appears in CNBC |
12 |
11 |
9 |
|
D3 |
Everything I hear tells me no one knows exactly … what a chance for ME |
11 |
-2 |
5 |
|
A1 |
The news appears in the Wall Street Journal |
6 |
13 |
6 |
|
C1 |
Follow the vertical because I’m heavily knowledgeable in it and feel it’s home |
-6 |
12 |
15 |
|
A2 |
The news appears in Bloomberg |
0 |
10 |
12 |
|
B3 |
Story: Investors seem to be taking a big position in a vertical |
-1 |
0 |
28 |
|
B4 |
Story: Investors seem to be selling off more rapidly than expected |
8 |
-5 |
23 |
|
B1 |
Story: Imminent tariffs and how they will affect trade |
-4 |
3 |
18 |
|
A4 |
The news is given by your colleagues at your office |
7 |
7 |
11 |
|
B2 |
Story: Structural problems in the vertical promise downstream trouble |
-3 |
0 |
11 |
|
C2 |
Just got into the vertical because of recommendations from people I trust |
0 |
7 |
10 |
|
D2 |
I think I’ve discovered something really critical here that no one knows |
8 |
3 |
9 |
|
C4 |
Everyone in the office is abuzz about something big happening here |
3 |
4 |
7 |
|
C3 |
The mathematical models I use say ‘this vertical is hot’ |
-5 |
4 |
5 |
Mind Sets
One of the tenets of the emerging psychological science of Mind Genomics is that for each topic of everyday experience (e.g., shopping, consulting a doctor, etc.) or even thinking (e.g., about issues of ethics and morality) there exist small, specific domains of the topic. Rather than the grand top of investing, for example, the domain might be limited to the ‘nature of the information to which I am exposed.’ That topic is the subject of this Mind Genomics cartography. Mind Genomics posits that in every domain of the topic, small or large, there may be several different patterns of information to which an individual might respond, rather than only one pattern. That is, individuals differ from each other in the nature of the information to which they respond, the messages which ‘inform their decision.’ Beyond simply positing these different groups of individuals, Mind Genomics provides the computational machinery both to identify these different groups, so-called Mind-Sets for a topic and then a way to assign any new person to one of the Mind-Sets, the method being called the PVI, the personal viewpoint identifier. Discovering Mind-Sets is a statistical process, objective in nature for its computations, but subjective in terms of decision-making about the nature of the revealed Mind-Sets. The approach is quite straightforward, following a statistical path comprising four steps:
Step 1 Select the basic data from which the Mind-Sets will be uncovered
The basic data comprises the 16 coefficients for each respondent. Each respondent generates 16 coefficients from the regression model relating the transformed binary response to the presence/absence of the element.
Step 2 Estimate the ‘distance’ between each pair of respondents
The distance may be defined in any number of ways, ranging from the Minkowski R metric (e.g., the mean squared differences along each of the 16 pairs of coefficients, for R = 2, the familiar Euclidean measure of distance), to the Pearson distance, a metric which looks at the similarity of patterns. The Pearson distance between any two objects e.g., people, is value (1-R), where R is the Pearson correlation between the two respondents, based upon the values of the 16 coefficients. The Pearson R has maximum of +1 when two variables are perfectly related to each other in a linear fashion, and thus show the same pattern. The distance is thus 0, because the two patterns are perfectly related. The value (1-R) is 0, when R = 1. The Pearson R has a minimum of -1 when two patterns are perfectly inversely related to each other. The distance is thus 2 (1- – 1 = 2).
Step 3 Place the respondents into either two or three mutually exclusive and exhaustive groups
This is called clustering [15] The objective of clustering is to minimize the distances within a Clustering this requires computation. The composition of the clusters, the emergent mind-sets, will vary somewhat depending upon the way the ‘distance’ is defined. This should not be worrisome since the clustering is simply meant to be a heuristic, to divide the respondents in a way that may be useful for other analyses.
Step 4 Interpret the clusters or mind-sets
The mind-sets, mutually exclusive and exhaustive, should ‘make sense’ (interpretable), and should be as few as possible (parsimonious.)
(Table 6) suggests three different mind-sets, as follows
Table 6. Performance of the elements by three mind-sets, subgroups, defined by similar patterns in the way people describe their attitudes towards investing. Mind-Set is abbreviated MS
|
|
Mind-Sets (MS) emerging from similar patterns of coefficients Top 2 – Fits ME |
MS1 |
MS2 |
MS3 |
|
|
Mind-Set 1– Responds to where the news appears |
|
|
|
|
A1 |
The news appears in the Wall Street Journal |
19 |
4 |
2 |
|
A2 |
The news appears in Bloomberg |
18 |
2 |
15 |
|
A3 |
The news appears in CNBC |
17 |
13 |
1 |
|
A4 |
The news is given by your colleagues at your office |
15 |
-5 |
18 |
|
|
Mind-Set 2 – Responds to the story |
|
|
|
|
B2 |
Story: Structural problems in the vertical promise downstream trouble |
-2 |
18 |
7 |
|
B3 |
Story: Investors seem to be taking a big position in a vertical |
9 |
17 |
1 |
|
B1 |
Story: Imminent tariffs and how they will affect trade |
10 |
14 |
4 |
|
B4 |
Story: Investors seem to be selling off more rapidly than expected |
9 |
13 |
10 |
|
C1 |
Follow the vertical because I’m heavily knowledgeable in it and feel it’s home |
7 |
12 |
5 |
|
|
Mind-Set 3 Responds to recommendations of friends & math models |
|
|
|
|
C2 |
Just got into the vertical because of recommendations from people i trust |
8 |
3 |
17 |
|
C3 |
The mathematical models i use say ‘this vertical is hot’ |
1 |
5 |
14 |
|
C4 |
Everyone in the office is abuzz about something big happening here |
0 |
6 |
11 |
|
|
Does not seem important for any mind-set |
|
|
|
|
D1 |
The tone of the news is so clear that i feel i just have to do something |
2 |
-1 |
9 |
|
D2 |
I think I’ve discovered something really critical here that no one knows |
9 |
-7 |
8 |
|
D3 |
Everything I hear tells me no one knows exactly … what a chance for ME |
9 |
0 |
6 |
|
D4 |
My experience tells me there’s money to be made here.. i just know it |
-1 |
8 |
4 |
Mind-Set 1 – Responds to where the news appears,
The news appears in the Wall Street Journal
The news appears in Bloomberg
Mind-Set 2– Responds to the story
Story: Structural problems in the vertical promise downstream trouble
Story: Investors seem to be taking a big position in a vertical
Mind-Set 3 Responds to recommendations of friends and appears to be intuition-driven
Just got into the vertical because of recommendations from people I trust
Finding the Mind-Sets In the Population
Respondents who differ in their attitudes in terms of the nature of information to which they respond may or may not realize that there are different groups, different mind-sets. (Tables 5, 6) show clear differences among the groups in terms of their responses to different types of information, which covary with the group to which they belong. Yet, if one subscribes to the belief that people want to hear messages which resonate with them, it might be a better strategy to work with mind-sets of investors, rather than relying upon how the investor defines herself or himself. What might happen if one were to know at the start of the conversation the mind-set to which a prospect belongs? One could then be more comfortable choosing the messages because many of these messages linked with the mind-sets show very high coefficients, 15 or higher. (Table 7) shows the distribution of the three mind-sets by total panel, gender, age group, and self-stated preferences for the type of information. There is no clear pattern.
Table 7. Distribution of the respondents by total and the three mind-sets.
|
|
Total |
MS1 |
MS2 |
MS3 |
|
|
|
Where |
Story |
Friends & Tech |
|
Total |
50 |
14 |
19 |
17 |
|
|
|
|
|
|
|
Female |
36 |
8 |
12 |
16 |
|
Male |
14 |
6 |
7 |
1 |
|
|
|
|
|
|
|
Age < 60 |
22 |
8 |
7 |
7 |
|
Age 60+ |
28 |
6 |
12 |
10 |
|
|
|
|
|
|
|
Don’t like investing |
9 |
2 |
2 |
5 |
|
Invest with advice |
19 |
5 |
10 |
4 |
|
Active investor, study the news |
17 |
5 |
5 |
7 |
|
Use technology, models |
5 |
2 |
2 |
1 |
An alternative way uses an algorithm known as the PVI, the personal viewpoint identifier. The PVI asks the respond six questions derived from the experiment, and from the pattern of answers the PVI assigns the new person to the most likely mind-set. The PVI algorithm uses the coefficients to identify which combination of elements, posed as questions and answered with a 2-point scale (Not ME: Me) (Figure 2) shows the PVI questionnaire as presented to the respondent. The order of questions varies across the respondents. The PVI also allows the researcher to ask specialty questions as well, in order to gain more knowledge. The PVI takes about a minute to complete
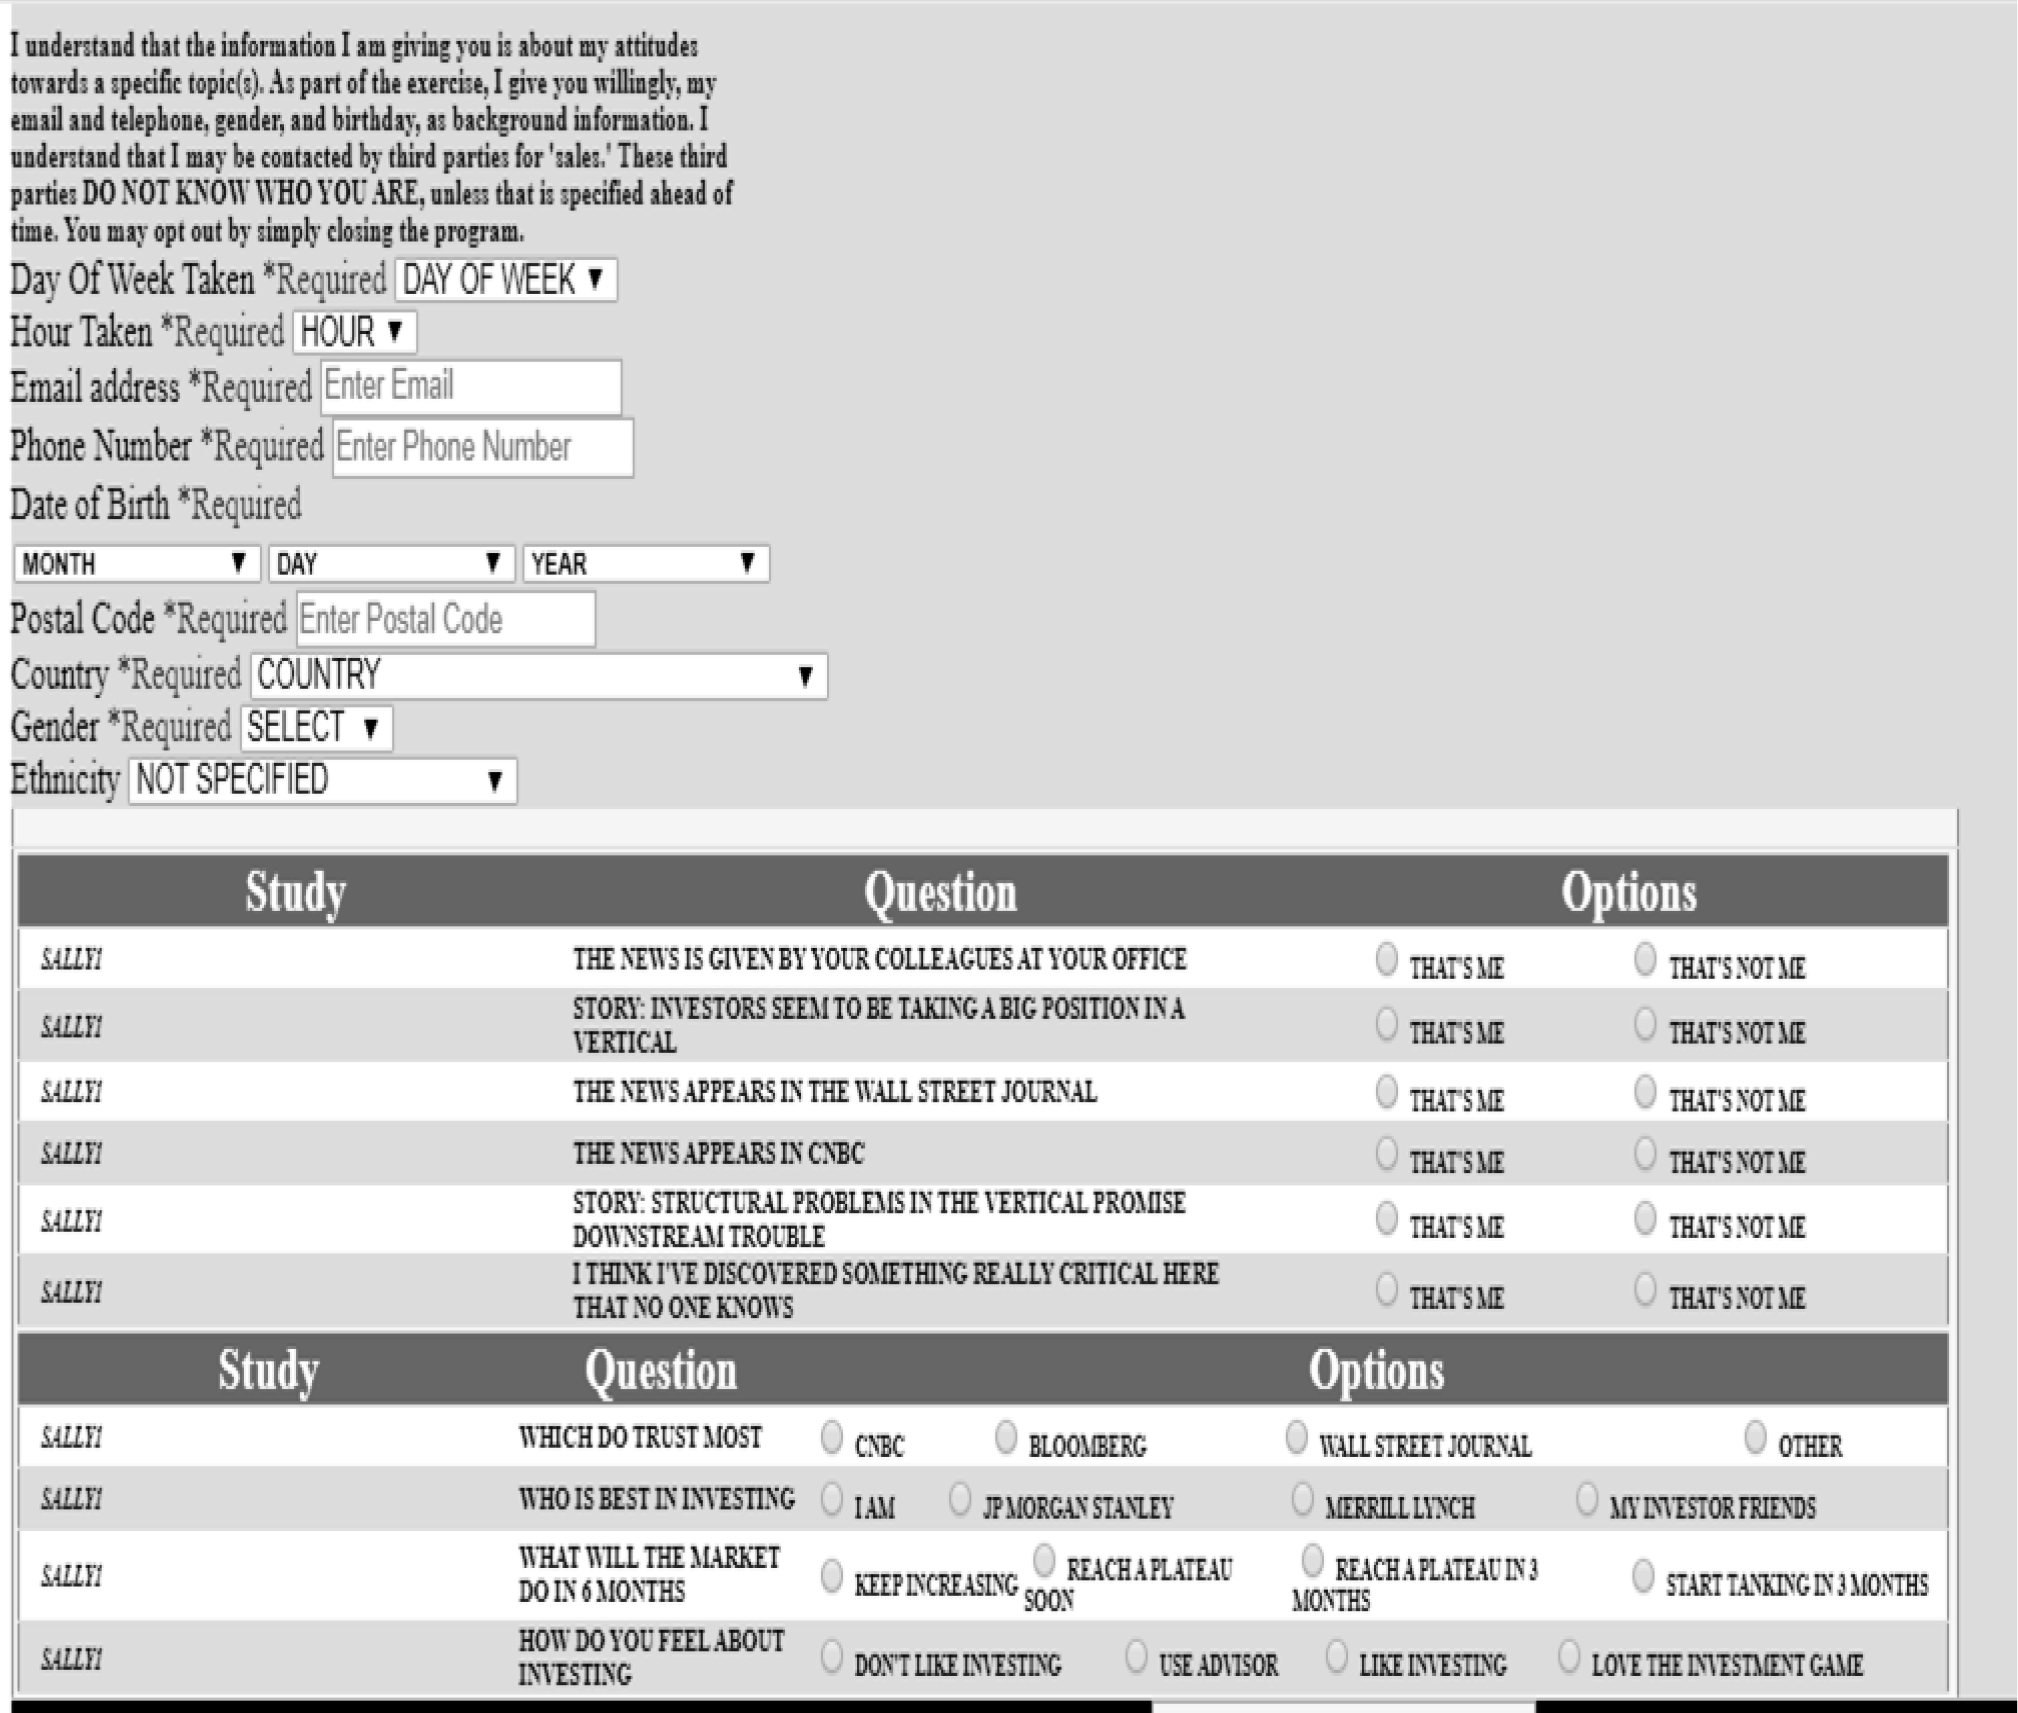
Figure 2. The PVI (personal viewpoint identifier) for the investing experiment.
Response Time and Engagement
Experimental psychology began with the systematic study of reaction time, the time between the presentation of a stimulus (e.g., our vignette), and the time when the respondent assigned a rating, or simply noted that she or he ‘detected’ the stimulus. There is the abiding, probably correct, belief that longer reaction times correspond to ‘more things going on in the mind.’ Shorter reaction times, therefore, suggest fewer things going on in the mind, or the fact that the respond ‘sees’ the message and discards it without consideration [16]. The Mind Genomics experiment itself lasts 3–4 minutes in the 5-minute interview. During that time the respondent is presented with 24 vignettes, and required to read the vignette (more likely glancing through it, grazing for information), and then responds. There is little time to read the entire vignette. The reaction must be almost automatic, namely see, rate, see, rate, etc.
(Table 8) presents the estimated response times for the 16 elements, by key self-defined group (gender, age, respectively). The respondents answer quickly, and are not at all aware of how much time they spend on each element. The OLS regression estimates the likely number of seconds required for each element to be read and processed. Those elements which generate coefficients of 2.0 (two seconds or longer) are shown in in shaded cells, and bold type. These are the elements to which the respondent attends, whether the attention reflects an emotional reaction, or an attempt to comprehend the meaning of the element. (Table 8) suggests that older respondents typically take longer to process then information than do younger respondents. Those over 60 show higher coefficients for response time than those respondents under 60. There is also the suggestion that the genders differ in what engages them. Female’s attention is engaged by other people (The news is given by your colleagues at your office), whereas male’s attention is engaged by technology (The mathematical models I use say ‘this vertical is hot’).
Table 8. Response time in seconds for each element. Data for total panel, gender, and age, respectively.
|
|
Estimated response times in seconds for each element by the total panel, gender, and age |
Total |
Male |
Female |
LT 60 |
GT 60 |
|
D1 |
The tone of the news is so clear that I feel I just have to do something |
1.7 |
2.1 |
1.5 |
1.4 |
1.7 |
|
D2 |
I think I’ve discovered something really critical here that no one knows |
2.3 |
2.0 |
2.4 |
1.4 |
1.2 |
|
C2 |
Just got into the vertical because of recommendations from people I trust |
1.6 |
2.0 |
1.4 |
1.3 |
1.5 |
|
C3 |
The mathematical models I use say ‘this vertical is hot’ |
1.3 |
2.0 |
1.0 |
1.6 |
2.0 |
|
A4 |
The news is given by your colleagues at your office |
2.0 |
1.3 |
2.4 |
1.6 |
1.7 |
|
A1 |
The news appears in the Wall Street Journal |
2.1 |
1.8 |
2.2 |
1.5 |
1.7 |
|
A2 |
The news appears in Bloomberg |
2.0 |
1.4 |
2.2 |
1.4 |
1.6 |
|
B2 |
Story: Structural problems in the vertical promise downstream trouble |
1.6 |
1.9 |
1.5 |
2.3 |
2.2 |
|
B4 |
Story: Investors seem to be selling off more rapidly than expected |
1.7 |
1.8 |
1.7 |
2.1 |
2.0 |
|
B1 |
Story: Imminent tariffs and how they will affect trade |
1.6 |
1.6 |
1.6 |
2.0 |
2.1 |
|
B3 |
Story: Investors seem to be taking a big position in a vertical |
1.6 |
1.7 |
1.6 |
1.9 |
2.1 |
|
A3 |
The news appears in CNBC |
1.5 |
1.4 |
1.5 |
1.9 |
1.4 |
|
C4 |
Everyone in the office is abuzz about something big happening here |
1.8 |
1.5 |
1.9 |
1.7 |
1.8 |
|
C1 |
Follow the vertical because I’m heavily knowledgeable in it and feel it’s home |
1.4 |
1.4 |
1.5 |
1.7 |
1.7 |
|
D3 |
Everything I hear tells me no one knows exactly … what a chance for ME |
1.6 |
1.8 |
1.5 |
1.5 |
1.9 |
|
D4 |
My experience tells me there’s money to be made here … I just know it |
1.8 |
1.7 |
1.9 |
1.3 |
1.8 |
When we move to self-defined groups in terms of how one invests (e.g., invests with advice, etc.), (Table 9) suggests clearly different patterns of engagement. Those who say that they do not like investment pay a great deal of attention to the story. Those who say that they invest with advice also pay attention to the elements dealing with the story, as well as pay attention to ‘clues’ about performance, typically given by others. Those who say that they are active investors pay attention to one element, ‘Story: Investors seem to be taking a big position in a vertical.’ When we move to the mind-sets defined by the pattern of coefficients, we see that there are differences as well, albeit not the strong differences that we saw for those who self-define themselves in different ways in terms of attitudes toward investing.
Table 9. Response time in seconds for each element. Data shown for three different self-descriptions of the respondent’s attitude toward investing.
|
|
Subgroups self-defined by how the respondent defines her/his investing behavior Response Time |
Do not like investing |
Invest with advice |
Active investor |
|
B4 |
Story: Investors seem to be selling off more rapidly than expected |
2.9 |
2.4 |
1.6 |
|
B1 |
Story: Imminent tariffs and how they will affect trade |
2.7 |
2.2 |
1.8 |
|
B2 |
Story: Structural problems in the vertical promise downstream trouble |
2.3 |
2.5 |
1.9 |
|
B3 |
Story: Investors seem to be taking a big position in a vertical |
2.0 |
2.0 |
2.2 |
|
C3 |
The mathematical models I use say ‘this vertical is hot’ |
0.6 |
2.5 |
1.5 |
|
C1 |
Follow the vertical because I’m heavily knowledgeable in it and feel it’s home |
0.5 |
2.5 |
1.5 |
|
C4 |
Everyone in the office is abuzz about something big happening here |
1.6 |
2.1 |
1.6 |
|
C2 |
Just got into the vertical because of recommendations from people I trust |
0.6 |
2.0 |
1.1 |
|
A4 |
The news is given by your colleagues at your office |
1.3 |
1.5 |
1.9 |
|
D3 |
Everything I hear tells me no one knows exactly … what a chance for ME |
1.6 |
1.6 |
1.8 |
|
A1 |
The news appears in the Wall Street Journal |
1.8 |
1.4 |
1.7 |
|
A3 |
The news appears in CNBC |
1.8 |
1.7 |
1.5 |
|
D1 |
The tone of the news is so clear that I feel I just have to do something |
1.3 |
1.8 |
1.4 |
|
D4 |
My experience tells me there’s money to be made here … I just know it |
1.4 |
1.7 |
1.4 |
|
A2 |
The news appears in Bloomberg |
1.5 |
1.7 |
1.3 |
|
D2 |
I think I’ve discovered something really critical here that no one knows |
1.6 |
1.7 |
0.9 |
Table 10. Response time in seconds for each element. Data shown for three Mind-Sets.
|
|
|
MS1 |
MS2 |
MS3 |
|
|
|
Where |
Story |
Friends |
|
A1 |
The news appears in the Wall Street Journal |
2.3 |
2.0 |
2.0 |
|
A4 |
The news is given by your colleagues at your office |
2.2 |
1.8 |
2.2 |
|
D2 |
I think I’ve discovered something really critical here that no one knows |
2.2 |
2.2 |
2.5 |
|
D4 |
My experience tells me there’s money to be made here … I just know it |
2.1 |
1.7 |
1.8 |
|
D1 |
The tone of the news is so clear that i feel i just have to do something |
2.0 |
1.6 |
1.5 |
|
A2 |
The news appears in Bloomberg |
1.9 |
2.0 |
2.2 |
|
B4 |
Story: Investors seem to be selling off more rapidly than expected |
1.8 |
2.0 |
1.4 |
|
C4 |
Everyone in the office is abuzz about something big happening here |
1.8 |
1.7 |
1.9 |
|
B2 |
Story: Structural problems in the vertical promise downstream trouble |
1.1 |
1.7 |
1.9 |
|
B3 |
Story: Investors seem to be taking a big position in a vertical |
1.4 |
1.4 |
1.9 |
|
B1 |
Story: Imminent tariffs and how they will affect trade |
1.8 |
1.4 |
1.6 |
|
C1 |
Follow the vertical because I’m heavily knowledgeable in it and feel it’s home |
1.5 |
1.3 |
1.6 |
|
A3 |
The news appears in CNBC |
1.4 |
1.3 |
1.6 |
|
D3 |
Everything I hear tells me no one knows exactly … what a chance for ME |
1.6 |
1.7 |
1.5 |
|
C2 |
Just got into the vertical because of recommendations from people i trust |
1.5 |
1.7 |
1.5 |
|
C3 |
The mathematical models i use say ‘this vertical is hot’ |
1.3 |
1.6 |
0.9 |
Those who fall into Mind-Set1, paying attention to news from different sources, pay attention to messages which promote some type of discovery, either from the news, from listening to friends and colleagues, or intuition.
Those who fall into Mind-Set 2, paying attention to the story, pay attention to the source (Wall Street Journal, Bloomberg) and to news about sell-offs, and to a sense of finding out something that no one else knows.
Those who fall into Mind-Set 3, paying attention to friends and their own intuition pay attention to the Wall Street Journal, to Bloomberg, to their own unique discovery, and to colleagues.
What is surprising here is that the response times, a measure of engagement, does not covary strongly with who the respondents are. That is, a respondent who feels strongly about something which defines her or him may not be engaged with that message if engagement is measured by response time.
Discussion
As we saw in the introduction, a literature search on investing behavior uncovers a vast range of issues, ranging from behaviors used, strategies adopted, and the inner mind of the investor. To a great degree studies about the psychology of investing have emerged, not unexpectedly, from the marriage of finance and psychology. The emphasis of these studies is on the financial implications of psychological states of mind and its co-variation with strategies. There is relatively little published dealing with the discourse between the investment specialist and the customer. The sheer issue of gaining versus losing deflects the focus from the purely psychological ‘attitude’ to the attitude of investing as an economic behavior What is missing is the person-to-person behavior, the social aspect of the investor, not the economic aspect. Knowledge of the mind of the investor provides us with a new avenue of understanding finance. The field of behavioral economics focuses on the nature of people’s decision making under uncertainty. Investing is in that class. We are often treated to interesting experiments on how people make their investment choices, on the ratiableonal approach to investment. We are less exposed to issues about the nature of information. The approach presented here provides a simple, easy-to-execute foundational study on the ‘mind of the investor,’ not so much dealing with rationality or irrationality, but rather dealing with the way the investigator navigates through opportunities, through information, through communication with others, respectively. Through Mind Genomics we use the economic aspects of the investing simply as a set of test stimuli, ‘assayed’ by the human mind. Our focus is on the mind anticipating economics-relevant behavior [17, 18] and not on the marriage of the mind and the theoretical underpinnings of economics [8].
Acknowledgement
Attila Gere thanks the support of Premium Postdoctoral Research Program of the Hungarian Academy of Sciences.
References
- Gervais S and Odean T (2001) Learning to be overconfident. Review of Finance Studies 14: 1–27.
- Mezick EM (2002) Investing wisely: Individual investors as information seekers. Journal of Business & Finance Librarianship 7: 3–23.
- Escrig-Olmedo E, Munoz-Torres MJ, Fernandez-Izquierdo MA (2010) Socially responsible investing: sustainability indices, ESG rating and information provider agencies. International Journal of Sustainable economy 2: 442–461.
- Barber BM and Odean T (2001) Boys will be boys: Gender, overconfidence, and common stock investment. Quarterly Journal of Economics 116: 261–292.
- Bengtsson C, Persson M, Willenhag P (2005) Gender and overconfidence. Economics Letters 86: 9–203.
- Barber BM and Odean T (2000) Too many cooks spoil the profits: Investment club performance. Financial Analysis Journal 56: 17–25.
- Hirshleifer D and Subahmanyam A (1998) Investor psychology and security market under- and overreactions. Journal of Finance 53: 1839–1886.
- Tversky A and Kahneman D (1974) Judgment under uncertainty: Heuristics and biases. Science. 185: 1124–1131.
- Moskowitz HR and Gofman A (2007) Selling blue elephants: How to make great products that people want before they even know they want them. Pearson Education.
- Green PE and Rao VR (1971) Conjoint measurement for quantifying judgmental data. Journal of Marketing Research 8: 355–363.
- Green PE and Srinivasan V (1990) Conjoint analysis in marketing: new developments with implications for research and practice. The Journal of Marketing 54: 3–19.
- Box GE, Hunter WG, Hunter JS (1978) Statistics for experimenters, New York, John Wiley.
- Louviere JJ, Flynn TN, Marley AAJ (2015) Best-worst scaling: Theory, methods and applications. Cambridge University Press.
- Gofman A and Moskowitz H (2010) Isomorphic permuted experimental designs and their application in conjoint analysis. Journal of Sensory Studies 25: 127–145.
- Dubes R and Jain AK (1980) Clustering methodologies in exploratory data analysis. Advances in Computers 19: 113–238.
- Boring EG (1929) A History of Experimental Psychology. The Century Company, NY.
- Cross F (1973) The behavior of stock prices on Fridays and Mondays. Financial Analysis Journal 29: 67–69.
- Menkhoff L, Schmidt U, Brozynski T (2006) The impact of experience on risk taking, overconfidence, and herding of fund managers: Complementary survey evidence. European Economic Review 50: 1753–1766.