Monthly Archives: November 2019

Urinary Prothrombin Fragment 1 + 2 as an Endogenous Marker of Venous Thromboembolism

DOI: 10.31038/IMROJ.2019424

Abstract

Hypercoagulability may lead to Venous Thromboembolism (VTE) which is a common and potentially fatal disease. The symptoms of VTE are often non-specific and imaging is needed to confirm the diagnosis. Clinical probability models together with a D-dimer test are used to reduce the number of unnecessary radiological procedures. Numerous assays to detect thrombin generation have been developed where D-dimer measured in plasma is regarded as the pretest gold standard. The aim of this manuscript is to outline the present knowledge of using urinary prothrombin fragment 1 + 2 (F1 + 2) as a marker to determine coagulation activation in patients at risk of Deep Vein Thrombosis (DVT) or Pulmonary Embolism (PE). Papers were identified by searching PubMed for studies in which F1 + 2 were measured in urine to determine coagulation activity in patients at risk of venous thromboembolism. Urinary F1 + 2 levels can be used to identify patients at risk of VTE after hip and knee replacement surgery. Further, it reflects thrombin generation in patients with imaging verified DVT. However, in patients with imaging verified PE, the F1 + 2 levels were not increased compared to those without PE. Compared to D-dimer and F1 + 2 measured in plasma, urinary F1 + 2 was inferior at discriminating VTE. Contrary to the mentioned results, in one study on patients undergoing total hip arthroplasty, urinary F1 + 2 did not reflect post-operative coagulation activation. Urine may be an attractive substrate to detect ongoing coagulation activation. However, tests specifically meant for urine analyses must be further developed.

Keywords

Venous thromboembolism, Prothrombin Fragment 1 + 2, Urine

Introduction

The major pathological determinants for venous thrombosis formation were postulated by Rudolph Virchow in 1856 and are known as Virchow`s triad. These factors include vessel wall damage, alterations of blood flow with stasis and abnormalities in platelet, coagulation and fibrinolytic pathways [1]. Venous thromboembolism (VTE), a common and potentially fatal disease which is mainly caused by hypercoagulability, can manifest as deep vein thrombosis (DVT) or pulmonary embolism (PE) [2,3]. Venous thrombi most often occur in the deep leg veins at sites of pathological blood flow or venous stasis, in areas of endothelial damage and in valve pockets [4]. If a clot originates in or propagates to the popliteal vein or more proximal veins, there is an increased risk of embolization to the pulmonary arteries with subsequent variable degrees of obstruction [3].

The precise incidence of VTE is unknown but it is estimated that it affects between 1 and 2 per 1000 of the population annually in the U.S. and that one third of these patients are diagnosed with PE [5]. In 2007, Cohen et al. estimated the number of non-fatal symptomatic VTE events and VTE related deaths in the European Union to be 684,019 DVT events, 434,723 PEs and 543,545 VTE related deaths in a total population of 454.4 million [6]. Venous thromboembolism is a rare condition in children younger than 15 years [7,8]. The incidence of DVT and PE increases with age. For those 65–69 years of age, the incidence per 1000 person years is 1.8. This increases to 3.1 per 1000 person years for those aged 85–89 years [9]. Due to increased use of sensitive imaging techniques which can detect smaller and often insignificant pulmonary emboli, the hospital admissions for this disease have doubled over the last decades [10].

Clinical signs and symptoms of VTE may be obscure. Calf pain, swelling, heat and tenderness are clinical signs of DVT while PE patients may present with dyspnea, chest pain, hemoptysis, hypotension and tachycardia [3]. However, the symptoms are non-specific and DVT can resemble, for example, cellulitis and PE may be indistinguishable from myocardial infarction [10]. Due to the non-specific symptoms, imaging is needed to confirm the diagnosis of DVT or PE. Compression Ultrasonography (CUS) has high diagnostic accuracy for DVT [11]. Computer Tomography (CT) and Magnetic Resonance Imaging (MRI) are alternative or complementary DVT modalities with accuracy similar to that of CUS [12,13]. The reference modality for PE diagnosis is CT angiography [14]. Ventilation-perfusion lung scanning combined with chest X-ray is an alternative in patients who cannot undergo CT angiography such as pregnant women [15]. In order to reduce the number of negative imaging investigations, models based on clinical signs and patient history have been developed to categorize the probability that a patient has VTE before a confirmatory test is performed. In those patients with an unlikely clinical probability and a negative D-dimer test, thrombosis can be excluded without additional imaging [16–18]. Over the years numerous thrombin generation biomarker tests have been developed as VTE pretests including prothrombin fragment 1 + 2 (F1 + 2), thrombin-antithrombin complex (TAT) and D-dimer levels measured in plasma. Tests such as thrombin generation, procoagulant phospholipid-dependent clotting time and soluble P-selectin are currently used in research to identify prothrombotic risk [19]. The aim of this manuscript is to outline the present knowledge related to the use of urine as a substrate to determine coagulation activity in patients with clinical risk of DVT and PE.

Methods

PubMed was searched using the terms prothrombin fragment 1 + 2, urine prothrombin fragment 1 + 2 and coagulation activation detection in urine. The resulting manuscripts that related to patients with risk of DVT or PE or both were selected for a manual review.

Prothrombin fragment 1 + 2

Prothrombin fragment 1 + 2 is a non-thrombotic polypeptide which is cleaved from prothrombin during its conversion to thrombin. F1 + 2 is released into the blood stream where it has half-life of approximately 90 minutes [20, 21]. Due to the low molecular weight of F1 + 2 (~31 kDa) it is excreted in the urine where it can be detected by Enzyme-Linked Immuno-Sorbent Assay (ELISA) [22,23].

Results of the Clinical Trials on Urinary F1 + 2 Measurement in Various Studies

Prothrombin fragments have been detected in urine for many years and been shown to correlate with clinical symptoms of coagulation system activation [23,24].

Prothrombin fragment 1 + 2 in urine as an indicator of sustained coagulation activation after total hip arthroplasty [25]

Patients undergoing Total Hip Arthroplasty (THA) were followed post-surgery to document the occurrence of Vascular Thrombotic Complication (VTC) events and deaths. Pre- and postoperative levels of urine F1 + 2 were measured. Increased urine levels of F1 + 2 were observed immediately after the surgery and reached a peak level on postoperative day 3 before decreasing toward day 7 and normalizing at follow-up on day 35±5. A Receiver Operator Characteristic (ROC) curve with Area under the Curve (AUC) of urinary F1 + 2 levels performed on postoperative day 5 showed that F1 + 2 levels in urine could accurately discriminate patients with and without increased risk of developing a VTC. Levels of F1 + 2 in urine were significantly higher in patients who developed a VTC or death compared to the event-free patients.

Differences in urinary prothrombin fragment 1 + 2 levels after total hip replacement in relation to venous thromboembolism and bleeding events [26]

 This study assessed whether urinary F1 + 2 measurements could be useful in identifying the risk of VTE or bleeding events in patients undergoing Total Hip Replacement (THR) surgery. Significantly higher levels of urinary F1 + 2 were observed on post-operative day 3 in the VTE group compared to the event-free patients. At the same time the urine levels of F1 + 2 in the bleeding group were significantly lower than in the event-free group. Finally, the urinary F1 + 2 levels were significantly higher on day 3 in the patients with VTE compared to those with bleeding events.

Urinary prothrombin fragment 1 + 2 in relation to development of non-symptomatic and symptomatic venous thromboembolic events following total knee replacement [27]

Urinary F1 + 2 were measured on consecutive days in patients undergoing Total Knee Replacement (TKR) surgery. Bilateral venography was performed postoperatively (day 5–9) and about half of the patients (140 of 282 patients) were diagnosed with a VTE. Compared to the event free patients, those diagnosed with VTE had significantly higher levels of urinary F1 + 2.

Thrombin split products (prothrombin fragment 1 + 2) in urine in patients with suspected deep vein thrombosis admitted for radiological verification [28]

This study evaluated urine F1 + 2 levels in patients with suspected DVT referred for radiological verification. Patients with imaging-verified DVT (CUS supplemented with unilateral venography when inconclusive) had significantly higher urinary F1 + 2 levels compared to those without, both in patients with, and without, known comorbidities. Although not statistically significant, levels of urine F1 + 2 were higher in patients with DVT symptoms of more than one week compared to those with shorter symptom duration.

Prothrombin fragment 1 + 2 in urine as a marker on coagulation activity in patients with suspected pulmonary embolism [29]

A study which measured prothromin fragment 1 + 2 levels in urine from non-selected patients with suspected PE referred for imaging confirmation with contrast enhanced CT pulmonary angiography. Patients with imaging-verified PE had increased, however, not statistically significant, levels of urinary F1 + 2 compared to the PE negative patients. Patients with high embolic burden, i.e. pulmonary artery obstruction index (PAOI) ≥ 25%, had two-fold higher, however not significant, levels of urinary levels of F1 + 2 compared to those with a lower burden.

D-dimer and prothrombin fragment 1 + 2 in urine and plasma in patients with clinically suspected venous thromboembolism [30]

D-dimer and F1 + 2 levels measured in plasma and urine from patients with suspected VTE were significantly higher in those with imaging confirmed VTE compared to those without. In addition, there was a significant and positive correlation between D-dimer and F1 + 2 levels in plasma and between F1 + 2 in plasma and urine. D-dimer had better predictive value for VTE than plasma F1 + 2 followed by urinary F1 + 2 and there was no overlap in the ROC curves. There was a large variation of F1 + 2 levels between the plasma and urine samples with about 10-fold higher levels in plasma.

Thrombin generation in patients with suspected venous thromboembolism  [31]

Patients with imaging confirmed VTE had markedly higher levels of D-dimer, plasma F1 + 2 and urine F1 + 2 compared to VTE negative patients. Similar findings were observed for the ex vivo measured Lagtime (LT) and Time to Peak (TTP) derived from a thrombin generation assay. There were similar associations between plasma and urine F1 + 2 and patient characteristics and the measured ex vivo biomarkers.

Prothrombin fragment F1 + 2 in plasma and urine during total hip arthroplasty [32]

A study evaluating peri-operative levels of plasma and urinary F1 + 2 in patients undergoing THA was performed. None of the included patients had VTE or serious bleeding events. Plasma and urine F1 + 2 levels were significantly increased post-operatively with normalization of plasma levels on post-operative day 1 while urine levels remained significantly increased. There was a poor statistical correlation between F1 + 2 levels in plasma and urine.

Discussion

Studies using urine as the matrix to determine or monitor the extent of coagulation activation are rather limited compared to the number of studies performed on plasma biomarkers. A study in 2007 indicated that urine can be used to monitor the postoperative coagulation activity after THA surgery and to identify in which patients thromboprophylaxis can be discontinued after the first week [25]. The following year a publication on VTE and bleeding events after THR surgery stated that measurement of urinary F1 + 2 could discriminate patients at risk of a VTE or major or clinically relevant, non-major bleeding [26]. In 2011 a study on TKR surgery patients found considerably higher urinary F1 + 2 levels in these patients compared to the previous THR study and the authors indicated that this was due to a more intense coagulation activation after TKR than THR surgery, probably due to more bone and soft tissue trauma [25,27]. Further, they concluded that by measuring F1 + 2 in urine it was possible to identify those patients in need of continued thromboprophylaxis due to persistent coagulation activation [27]. In a study on patients with clinically suspected DVT it was shown that measurement of urinary F1 + 2 had the potential to reflect thrombin generation in DVT positive patients and that a DVT per se was responsible for this increase in patients without known comorbidities. However, underlying procoagulant conditions tend to mask the thrombin formation caused by a DVT. The urinary F1 + 2 levels in the DVT positive patients showed a tendency to vary through the pathophysiological course of thrombus formation [28]. Pulmonary embolism, in contrast to a DVT, did not significantly increase the levels of F1 + 2 in the urine. A possible explanation for this observation was the vast number of underlying procoagulant conditions in the PE population that might have contributed to increased urine F1 + 2 baselines level and thus masked the additive coagulation event. In addition, with a short half-life, F1 + 2 was likely measurable at the time of initial clot formation but had cleared by the time the clot embolized. Although insignificant, a high embolic burden increased measured urine F1 + 2 levels indicating that thrombus burden did impact detected prothrombin fragment levels [29].

Compared to the gold-standard of biomarker pre-tests which is currently D-dimer, plasma F1 + 2 showed inferior ability to discriminate a VTE followed by F1 + 2 in urine. The F1 + 2 concentrations in urine were substantially lower compared to plasma, which might be due to urine dilution of F1 + 2 or chemical and bacterial differences that decreased the ELISA kit sensitivity on the urine samples [30]. Urinary F1 + 2 levels reflected procoagulant conditions in the same manner as F1 + 2 in plasma and had similar association with measured ex vivo biomarkers. However, urinary F1 + 2 levels did not exhibit identical analytic sensitivity [31].

Contrary to the previous studies, a study on THR surgery patients published in 2017 showed increased post-operative levels of F1 + 2 in plasma and urine, however, the correlation was poor and urinary F1 + 2 levels did not reflect coagulation activation post-operatively [32]. Thrombin measurements in urine have been reported for the diagnosis of crescenting glomerulonephritis [33]. Increased thrombin levels as measured by using amidolytic methods were associated with fibrin deposits in the kidney and other associated pathologic manifestations. Other biomarkers of thrombin generation including fibrin monomers, TAT and protein C cleavage peptide have been measured in plasma and may be of interest for urinary measurements [34]. Additionally, fibrinopeptide B measured in urine has shown promising results to identify patients at risk of VTE [35].

Conclusion

The levels of F1 + 2 in plasma were about 10-fold higher than corresponding urinary levels and plasma F1 + 2 clearly had superior ability to determine whether or not a DVT or PE was present. Measurements of F1 + 2 in urine was performed using ELISA kits designed for plasma analyses and the reason for its inferior performance may be that the sensitivity of the tests used is too low. However, we believe that with further development urine may be an attractive substrate to detect and determine ongoing coagulation.

References

  1. Virchow R (1856) Gesammelte Abhandlungen zur Wissenschaftlichen Medizin. Meidinger; Frankfurt.
  2. López JA, Kearon C, Lee AY (2004) Deep venous thrombosis. Hematology Am Soc Hematol Educ Program 2004: 439–456. [crossref]
  3. Tapson VF (2008) Acute pulmonary embolism. N Engl J Med 358: 1037–1052. [crossref]
  4. Nicolaides AN, Kakkar VV, Field ES, Renney JT (1971) The origin of deep vein thrombosis: a venographic study. Br J Radiol 44: 653–663. [crossref]
  5. Beckman MG, Hooper WC, Critchley SE, Ortel TL (2010) Venous thromboembolism: a public health concern. American journal of preventive medicine 38: 495–501.
  6. Cohen AT, Agnelli G, Anderson FA, Arcelus JI, Bergqvist D, et al. (2007) Venous thromboembolism (VTE) in Europe. The number of VTE events and associated morbidity and mortality. Thrombosis and haemostasis. 98: 756–764.
  7. Heit JA, Silverstein MD, Mohr DN, Petterson TM, Lohse CM, et al. (2001) The epidemiology of venous thromboembolism in the community. Thromb Haemost 86: 452–463. [crossref]
  8. Stein PD, Patel KC, Kalra NK, El Baage TY, Savarapu P, et al. (2002) Deep venous thrombosis in a general hospital. Chest 122: 960–962.
  9. Kniffin WD Jr, Baron JA, Barrett J, Birkmeyer JD, Anderson FA Jr (1994) The epidemiology of diagnosed pulmonary embolism and deep venous thrombosis in the elderly. Archives of internal medicine 154: 861–866.
  10. Tritschler T, Kraaijpoel N, Le Gal G, Wells PS (2018) Venous Thromboembolism: Advances in Diagnosis and Treatment. Jama 320: 1583–1594.
  11. Goodacre S, Sampson F, Thomas S, van Beek E, Sutton A (2005) Systematic review and meta-analysis of the diagnostic accuracy of ultrasonography for deep vein thrombosis. BMC medical imaging 5: 6.
  12. Sampson FC, Goodacre SW, Thomas SM, van Beek EJ (2007) The accuracy of MRI in diagnosis of suspected deep vein thrombosis: systematic review and meta-analysis. European radiology 17: 175–181.
  13. Thomas SM, Goodacre SW, Sampson FC, van Beek EJ (2008) Diagnostic value of CT for deep vein thrombosis: results of a systematic review and meta-analysis. Clinical radiology 63: 299–304.
  14. van Beek EJ, Brouwerst EM, Song B, Stein PD, Oudkerk M (2001) Clinical validity of a normal pulmonary angiogram in patients with suspected pulmonary embolism–a critical review. Clin Radiol 56: 838–842. [crossref]
  15. Sostman HD, Miniati M, Gottschalk A, Matta F, Stein PD, et al. (2008) Sensitivity and specificity of perfusion scintigraphy combined with chest radiography for acute pulmonary embolism in PIOPED II. Journal of nuclear medicine : official publication, Society of Nuclear Medicine 49: 1741–1748.
  16. van der Hulle T, Dronkers CE, Klok FA, Huisman MV (2016) Recent developments in the diagnosis and treatment of pulmonary embolism. Journal of internal medicine 279: 16–29.
  17. Wells PS, Anderson DR, Bormanis J, Guy F, Mitchell M, et al. (1997) Value of assessment of pretest probability of deep-vein thrombosis in clinical management. Lancet (London, England) 350: 1795–1798.
  18. Wells PS, Anderson DR, Rodger M, Forgie M, Kearon C, et al. (2003) Evaluation of D-dimer in the diagnosis of suspected deep-vein thrombosis. N Engl J Med 349: 1227–1235. [crossref]
  19. Riva N, Vella K, Hickey K, Bertu L, Zammit D, Spiteri S, et al. (2018) Biomarkers for the diagnosis of venous thromboembolism: D-dimer, thrombin generation, procoagulant phospholipid and soluble P-selectin. Journal of clinical pathology 71: 1015–1022.
  20. Lippi G, Cervellin G, Franchini M, Favaloro EJ (2010) Biochemical markers for the diagnosis of venous thromboembolism: the past, present and future. Journal of thrombosis and thrombolysis 30: 459–471.
  21. Páramo JA, Orbe J, Beloqui O, Benito A, Colina I, et al. (2004) Prothrombin fragment 1+2 is associated with carotid intima-media thickness in subjects free of clinical cardiovascular disease. Stroke 35: 1085–1089. [crossref]
  22. Lau HK, Rosenberg JS, Beeler DL, Rosenberg RD (1979) The isolation and characterization of a specific antibody population directed against the prothrombin activation fragments F2 and F1 + 2. J Biol Chem 254: 8751–8761. [crossref]
  23. Lind SE, Goldshteyn S, Barry CP, Lindquist JR, Piergies AA, et al. (1999) Assessment of coagulation system activation using spot urine measurements. Blood coagulation & fibrinolysis: an international journal in haemostasis and thrombosis 10: 285–289.
  24. Bezeaud A, Aronson DL, Menache D, Guillin MC (1978) Identification of a prothrombin derivative in human urine. Thromb Res 13: 551–556. [crossref]
  25. Borris LC, Breindahl M, Ryge C, Sommer HM, Lassen MR; uF1+2 study group (2007) Prothrombin fragment 1+2 in urine as an indicator of sustained coagulation activation after total hip arthroplasty. Thromb Res 121: 369–376. [crossref]
  26. Borris LC, Breindahl M, Lassen MR, Pap AF, Misselwitz F (2008) Differences in urinary prothrombin fragment 1 + 2 levels after total hip replacement in relation to venous thromboembolism and bleeding events. Journal of thrombosis and haemostasis: JTH 6: 1671–1679.
  27. Borris LC, Breindahl M, Lassen MR, Pap AF (2011) Urinary Prothrombin Fragment 1+2 in relation to Development of Non-Symptomatic and Symptomatic Venous Thromboembolic Events following Total Knee Replacement. Thrombosis 201: 150750.
  28. Wexels F, Haslund A, Dahl OE, Pripp AH, Gudmundsen TE, et al. (2013) Thrombin split products (prothrombin fragment 1 + 2) in urine in patients with suspected deep vein thrombosis admitted for radiological verification. Thromb Res 131: 560–563. [crossref]
  29. Wexels F, Dahl OE, Pripp AH, Seljeflot I, Borris LC, et al. (2014) Prothrombin fragment 1+2 in urine as a marker on coagulation activity in patients with suspected pulmonary embolism. Thrombosis research 134: 68–71.
  30. Wexels F, Seljeflot I, Pripp AH, Dahl OE (2016) D-Dimer and prothrombin fragment 1 + 2 in urine and plasma in patients with clinically suspected venous thromboembolism. Blood coagulation & fibrinolysis : an international journal in haemostasis and thrombosis 27: 396–400.
  31. Wexels F, Dahl OE, Pripp AH, Seljeflot I (2017) Thrombin Generation in Patients With Suspected Venous Thromboembolism. Clinical and applied thrombosis/hemostasis: official journal of the International Academy of Clinical and Applied Thrombosis/Hemostasis 23: 416–421.
  32. Borgen PO, Reikeras O (2017) Prothrombin fragment F1+2 in plasma and urine during total hip arthroplasty. Journal of orthopaedics 14: 475–479.
  33. Kitamoto Y, Arizono K, Fukui H, Tomita K, Kitamura H, et al. (2015) Urinary thrombin: a novel marker of glomerular inflammation for the diagnosis of crescentic glomerulonephritis (prospective observational study). PloS one 10: 0118704.
  34. Boisclair MD, Lane DA, Wilde JT, Ireland H, Preston FE, et al. (1990) A comparative evaluation of assays for markers of activated coagulation and/or fibrinolysis: thrombin-antithrombin complex, D-dimer and fibrinogen/fibrin fragment E antigen. British journal of haematology 74: 471–479.
  35. Morris TA, Marsh JJ, Burrows CM, Chiles PG, Konopka RG, et al. (2003) Urine and plasma levels of fibrinopeptide B in patients with deep vein thrombosis and pulmonary embolism. Thrombosis research 110: 159–165.
The Fatal Consequences of a Priori in the Natural Sciences, to be Replaced by Facts

DOI: 10.31038/GEMS.2019111


The conception of the universe through the ages

Let us first speak, in Astronomy, of the original conception of the Universe, based on appearances. Every man, sailing on the sea, far from the coast, in good weather, sees the sky horizontally, in all directions, and vertically. He speaks of “celestial vault,’’ an apparent sphere on which, by clear night, moves, together with the stars “carried” by it. That was what was described by Aristotle in his “De Coelo”. Four centuries later, the astronomer Claude Ptolémée, in his work “L’Almageste”, reporting on measurements of the positions of known planets he had compiled, consecrated the philosophical theory of Aristotle as a scientific theory, which were taught in Christian universities in the Middle Ages. However, in the 3rd century BC, Aristarchus of Samos, adopting also the existence of the sphere of the fixed stars, postulated that the sun was the center. There were then, in the time of Ancient Greece and Rome, two philosophical schools, which agreed on the existence of this sphere carrying the fixed stars, but opposed on which star was at the center, either the Earth or the sun. This quarrel would re-emerge in the midst of Christianity in the Middle Ages. Copernicus, canon and astronomer, wondering about the irregular orbits described by the planets around the Earth, completed the calculations of the positions of the planets of Ptolemy and “demonstrated” that they revolved around the sun; he, however, attributed to them, by his approximate calculations of their distance from the sun, circular orbits which Kepler soon showed to be ellipses whose sun was a focus. Copernicus reported his theory in the work “De Revolutionibus Orbium Caelestium”, published in 1543, which was sent after his death, by his friend Osiander, to Pope Paul III.

In his Preface, Copernicus, applying to the Earth the status of a planet, affirmed without proving that it revolved around the sun, and that, therefore, it was the sun that was the center of the world, quoting Trismegistus. who called the sun “visible god”. Pope Paul III and his successors did not react. Tycho Brahé, astronomer of the king of Denmark, made at this time many measurements of the position and distance of the planets in the solar system, that Kepler would use and supplement by the particular study of Mars, which would lead him to formulate his three Laws in “Astronomia Nova” and “Harmonices Mundi”. Tycho Brahé had just remarked that the apparent position of the sun and the planets, seen from the Earth, remained the same whether the sun revolved around the Earth or vice versa. But the temptation to consider the Earth as any other planet was too strong and Kepler adopted the Copernicus hypothesis.

Then came Galileo. The latter, a teacher at the University of Padua and persuaded of his success in astronomy, affirmed himself high and strong Copernican.

The Church then reacted by the decree of 1616, which condemned two Copernican propositions:

  1. The sun is the center of the world, and
  2. The Earth is not the center of the world and moves.

Despite this condemnation, Galileo wrote “Il Dialogo” which will have him condemned in 1633, by the Holy Office.

The first proposition of Galileo: “The sun is the center of the world and it is absolutely deprived of local movement”, was also condemned by the Tribunal of the Holy Office in the following terms: “it is absurd and false in philosophy and formally heretical as contrary to the Holy Scriptures “.

The second proposition: “The earth is not the center of the world and it moves not only in space but also diurnal movement on itself”, was also considered “absurd and false in philosophy and (to) be theologically considered at least erroneous in faith “.

Galileo did not demonstrate that the sun was the center of the world. But the condemnation of the second proposition results from the influence of Aristotle within the Church.

This condemnation created reactions among philosophers.

To start with, the “Discourse on the Method” of Descartes (1637), considered that a complete mathematization of science, made science no longer rest on facts, but first on clear and distinct ideas, making reason the natural light, hence the “philosophy of enlightenment”. This will not be without consequences on the other scientific disciplines, as we will see in geology, because rationalism reverses scientific reasoning, when, instead of relying on the observed and experienced facts from which hypotheses are induced, it privileges the a priori of reason as its foundation: principles, postulates, laws …, and retains only the facts, sometimes misinterpreted, which comfort them. Thus, from Descartes to Hegel, the rationalisms developed, first against the Church, as Voltaire is the example, then against the monarchy, in France, where the Revolution generated the terror of Robespierre and the wars of Napoleon.

Astronomy

In 1958, the journal of the Ecole Polytechnique published an article by Maurice Allais, X31, Nobel Prize in Economics, who was interested in gravimetry by making pendular experiments, showing that, besides the FOUCAULT effect, the result of the diurnal rotation of the Earth, an azimuthal displacement was manifested. In addition, pendulous experiments initiated by Maurice ALLAIS during solar eclipses also revealed an azimuthal displacement of the pendulum. This, according to Maurice ALLAIS questioned the law of Newton, which led me to read the book of Newton, the “Principia Mathematica”,  published in 1687, where he expressed his laws.

In his work, he writes in his PROPOSITION VI, page 82: “That the fall of the grave, takes place in equal times while ignoring, at least, the delay caused by a very weak existence of the air, others than me have observed it for a long time”. Newton then formulates new laws of motion.

Law 1: “All bodies persevere in their state of rest or of uniform movement, unless imprinted forces compel them to change”. This law does not define the effect of gravitation.

Law 2: “The change of movement is proportional to the imprinted motive force, and is affected along the line in which this force is imprinted”. The imprinted force is the weight, therefore proportional to the mass of each body, which does not correspond to the gravitation which imprints the fall of the grave in equal times.

Law 3: “The reaction is always contrary and equal to the action”. Newton refers to other actions than gravitation, such as pressure or pull or shock on another body, and a horse pulling a stone attached, forgetting the case where the galloping horse, drives the stone, in which case the action of the horse is not equal to the reaction of the stone. These examples are all alien to the action of gravitation, of which the only law, recalled by Newton, is expressed in Proposition VI.

This puts into question the reciprocal attraction between two orbital stars F = F ‘= G

 M M ´´

D² ,  where F and F ´´ express the mutual force of attraction, M and M ´´ the masses of the bodies, D their distance, and G a constant. It is this reciprocity that has determined the calculation of the masses of the sun and the planets. In February 2014, the Royal Society brought together the main specialists measuring the G constant, on the theme: “The Newtonian constant of gravitation, a constant too difficult to measure”, whose differences ranging from 6,672 to 6,676. Is the constant, constant or not?

Let us add that at present, we know the effect of gravitation, but not the cause.

I therefore concluded an experimental gravitation contract with the Royal Observatory of Belgium, directed by Professor Michel van Ruymbeke [1] .

GEMS-19-102_Kate Mariana_F

The experiment consists in subjecting a vertical pendulum to the attraction of masses of the same volume, copper, aluminum, Plexiglas, nonmagnetic, and magnetic iron, mounted on a pulley. The result of the measurements shows that the attraction does not depend on the material used, magnetic or not, but only on the attractive mass. The second experiment will consist in checking the Earth’s screen effect on solar attraction, measured by a pendulum, exposed or not to this attraction, according to the terrestrial rotation.

The other question concerns the interferometric experiments of Michelson (in 1881), Michelson and Morley (1887) and Morley-Miller (1902–1905) which did not evidence the speed of the Earth of 30 km/s in the ether which was supposed to be immobile. These results plunged the physicists into an enormous embarrassment, and led Einstein to state the two postulates of his special relativity in 1905. Such a theory was by no means necessary. The failure of these experiments implied that of the immobile ether hypothesis. It had to be admitted that the speed of the ether on the earth’s surface was, according to the interferometric experiments carried out to date, either null according to most of them, or weak according to Miller, as had justified Maurice Allais. Let’s come to the Big Bang. This is based on the fact that the spectrum of light emitted by distant galaxies has a red shift. Based on the Doppler effect, which is the apparent frequency variation of the sound of a whistle of a train that crosses the observer (higher as it gets closer, lower when it moves away), and in applying it to light, it has been shown that galaxies recede. In 1928, Hubble will formulate his law v = Hr, where v is the speed of recession of the galaxy, r its distance, H a constant. Georges Lemaitre then made the thesis of a recess of galaxies from a single explosion, called the Big Bang. This is not demonstrated with facts. But we can, with facts, explain the phenomenon differently. The sun is yellow at the zenith, red-orange at bedtime. The color is a function of the path in the atmospheric air of the rays that are observed. The rays emitted by distant galaxies cross the gaseous atmosphere of many galaxies, resulting in a red shift.

Geology

Let us come to the other great discipline, whose a priori has had as many implications: Geology.

Its founder, Nicolas Stenon, who intended to “walk in a very exact and orderly way, according to the method of Descartes”, defines the foundations in 1667 in his book “Canis Calchariae”, interpreting the superposition of strata as a succession of sedimentary deposits [2], lacked of underwater observations. He deduced in 1669, in “Prodromus”, the principles of stratigraphy, namely, superposition, continuity and original horizontality of strata, which are at the base of the relative scale of geological time. Charles Lyell defines from it absolute chronologies. In 1828 he traversed the Auvergne, and became interested in laminated deposits of fresh water. Noticing foliated strata of less than a millimeter that he attributed to an annual deposit, he realized that the whole (230 meters), took hundreds of thousands of years to form. In his “Principles of Geology” (1832), he noted that the fauna was renewed by 5% during the “ice age”. Assuming a constant rate of renewal (uniformitarian hypothesis), it will take twenty times longer for a “revolution” in wildlife to occur. But Lyell has had four revolutions since the end of the secondary era, and eight more for earlier times since the beginning of the primary era. And as his contemporary James Croll estimated, for astronomical reasons, that the ice ages lasted a million years, Lyell sets the primary base at 240 million years. Duration increased to 560 million years ago by radiometric dating in the 20th century.

It was this succession of species during a very long time that led Darwin to express, in 1859, his theory in his work “The Origin of Species”. It is that of the natural selection of species by the struggle for life, inducing their evolution over time. Two years later, Marx wrote to Lassalle: “Very significant is the work of Darwin, which suits me as a foundation in the natural sciences of the class struggle in history”. Engels on his side, in “Ludwig Feuerbach and the End of German Philosophy” acknowledged “Darwin’s overall demonstration made for the first time that all the products of nature that now surround us, including men, are the product of a long process of development from a small number of unicellular germs originally, and that the latter are, in turn, from a protoplasm or albuminoid body made by chemical means”. And he immediately deduced from Darwin’s “discovery” a law of evolution of societies: “But what is true of nature and also recognized as a process of historical development, is also true of history of society in all its branches and all of the sciences that deal with human and divine things “.

Scientific socialism thus derives from Darwin, as does National Socialism, which preached the supremacy of the Aryan race. Hence the Gulag, and the Shoah, which have claimed more than 60 million lives. As for the historical geology, based on the interpretation of Stenon, this one is not proved, because no one has witnessed stratification.

That is why I started an experimental program to study stratification in 1970. There exists in the sedimentary rocks, layers of slight thickness, millimetric, or “laminae”, which are similar to the “foliated strata” observed by Lyell, mentioned earlier. I took a sample of “Fontainebleau sand”, presenting these “laminae”, weakly cemented. I broke the cement and obtained heterogranular sand, that is to say composed of particles of different sizes.

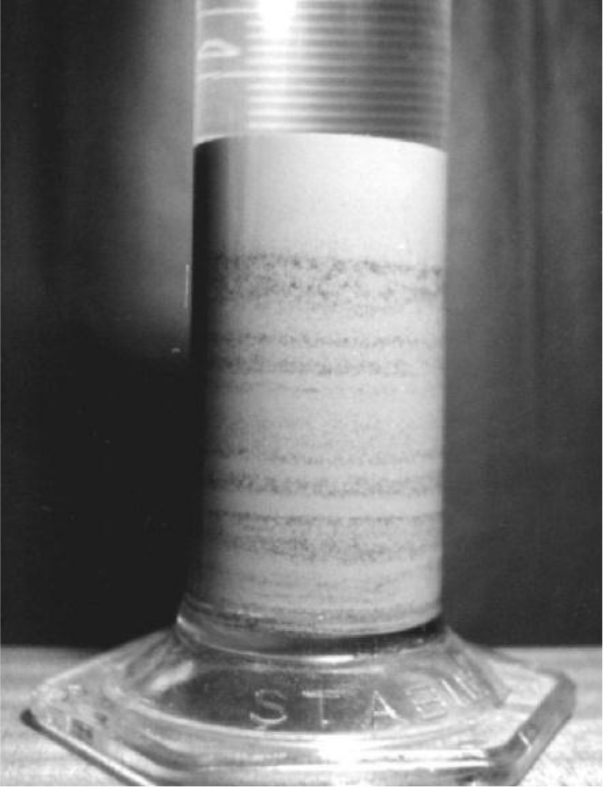
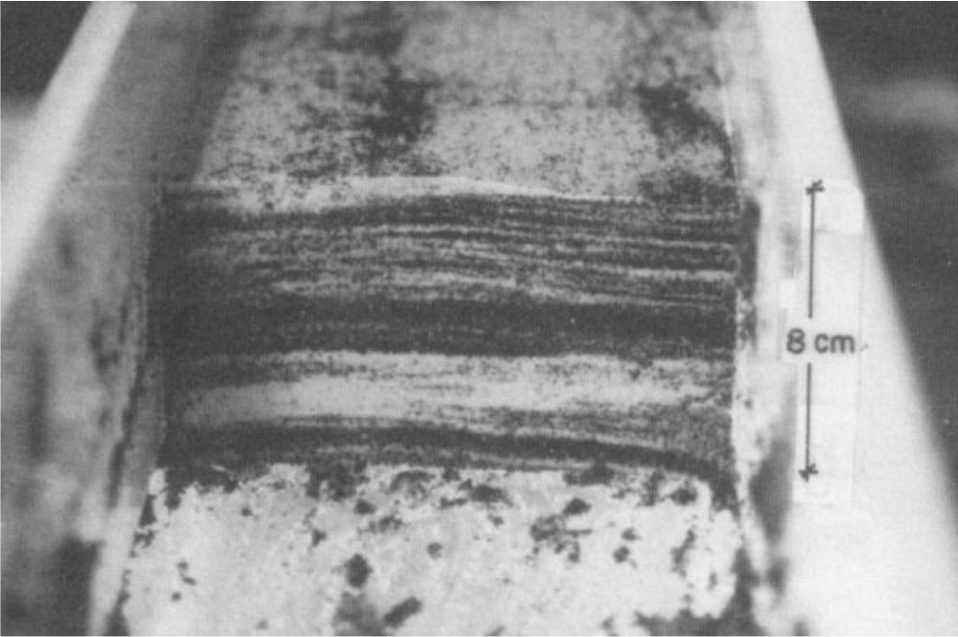
I dropped the sand into a glass tube, and saw the same lamination in the deposit similar to that of the sample, and this at whatever rate of sedimentation that I operated. As shown in the attached photos. I understood then that this phenomenon could result from sand being a powder whose mechanics is intermediate between that of liquids and solids. If, in a tube, three solid bodies are successively dropped, these bodies are arranged in the order of their succession. Whereas if three liquids of different densities, mercury, oil, water, are dropped, they will be superimposed in the order of decreasing densities, under the effect of gravity. Gravity could therefore be expected to cause repetitive granulation of the sand particles according to their size. Lamination is a mechanical phenomenon, not a chronological one. As a result, the thousands of “foliated strata” observed by Lyell do not correspond to hundreds of thousands of years (Figure1 and 2).

The report of my experiments was presented by Professor Georges Millot, Director of the Institute of Geology of Strasbourg, Dean of the University, member of the institute, then President of the Geological Society of France, at the Paris Academy of Sciences, which published it in its reports in 1986 [3]. Thereafter, the Professor admitted me to the Geological Society of France, as a sedimentologist. I then did the same experiment with a laminate sample containing fossils. The result was the same, and was also published by the Academy of Sciences in 1988, presented by Georges Millot [4].

GEMS-19-102_Kate Mariana_F1

Figure 1. Diatomite sample

GEMS-19-102_Kate Mariana_F2

Figure 2. Lamination resulting from dry run

What about thick stratification?

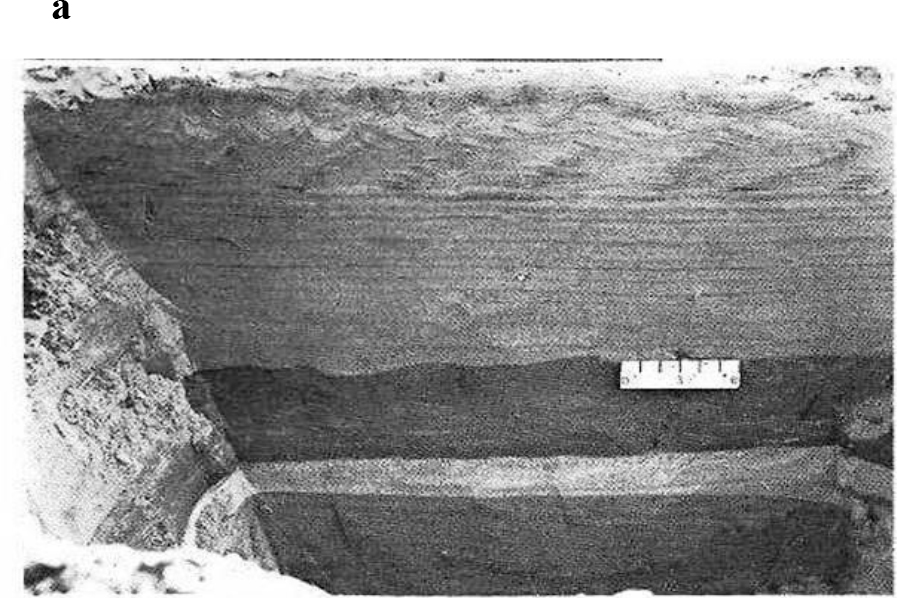
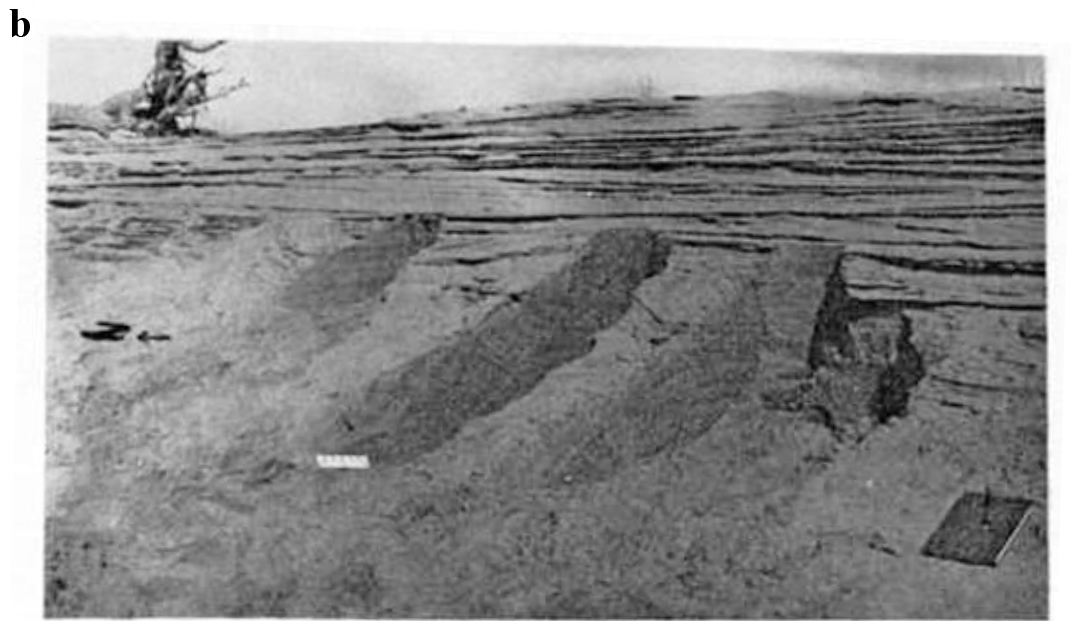
A report titled “Jewel Creek Flood” [5], published in the US, authored by American geologist Edwin Mac Kee, reported stratified deposits on the banks of “Bijou Creek” resulting from a flood of the river from the Rocky Mountains, due to snowmelt and increased by heavy rains. This phenomenon did not last more than 48 hours. Given the continuity of the flow, there was no question of supposing that a first stratum had become rock, before the second covered it, as the principle of superposition had affirmed. The strata were about 10 cm thick (see Figure 3a,b).

GEMS-19-102_Kate Mariana_F3a

GEMS-19-102_Kate Mariana_F3b

Figure 3. Sedimentary structures of the East Bijou stream flood in 1965
a) alternating strata of sand and muddy sand – b) stratification of deposits

To explain the phenomenon, it must be taken into account that the river in flood reached a velocity of 7 m/s in turbulent regime, and where, in each area of the river, the speed of the current varies alternately from the surface to the bottom. However, sedimentologists such as Hjulstrom and Lichstvan-Lebedev [6], have experimentally determined the critical rates of deposition of particles of different sizes. In a flood situation, the sediment transport capacity of the current is very high, and the speed variation in each area, when it becomes critical, causes the sedimentation of quantities of particles of different sizes, so that the gradation observed in calm water becomes thick “layers” of several centimeters. Similarly, in 2008, the Journal Sedimentology published an article on the 2004 tsunami in Southeast Asia, which presents photos of the tsunami’s deposit in a few hours, showing strata of 20 cm superimposed.

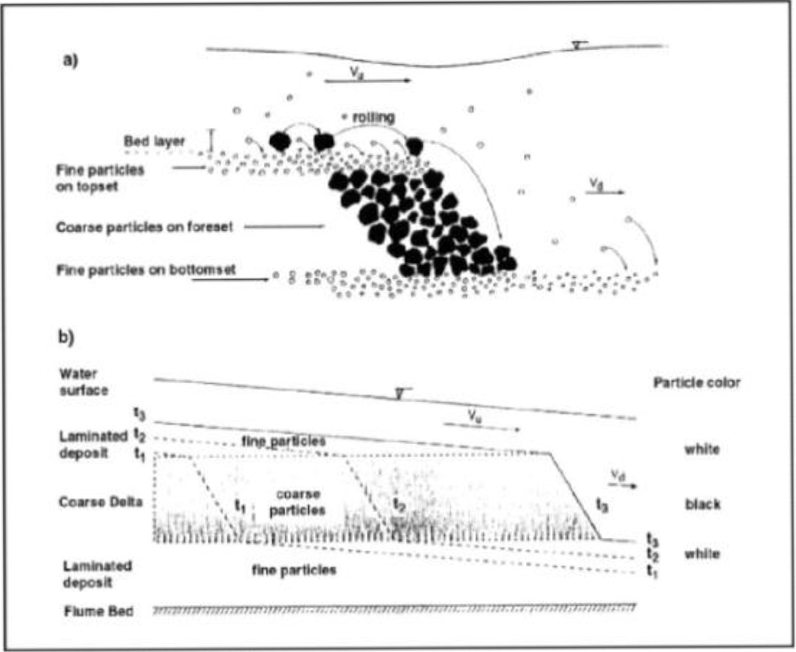
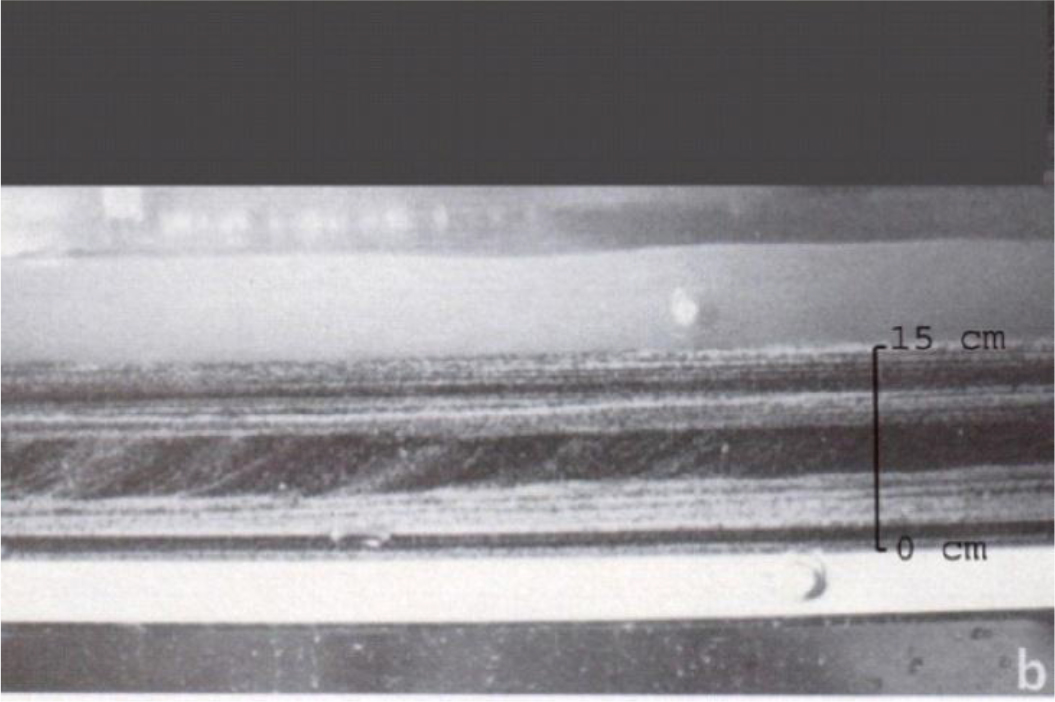
It seemed to me necessary to study stratification in the laboratory. An experimental report from a group of American sedimentologists operating at the University of Colorado Hydraulic Laboratory, of a flowing canal, showed the presence of strata in the deposit. I therefore proposed to study the causes, and went there for this occasion. I signed a contract with the University, and it was the group’s assistant, Pierre Yves Julien, a young Canadian hydraulist and sedimentologist, who carried out the experiences of the contract. In a canal, the water mixed with sand, whose large particles are black and the small white, is pumped in a circulating circuit. The color contrast of the particles allows the observation of the stratification in the sedimentary deposit which develops both laterally, in the direction of the current, and vertically as it thickens. The deposit is laminated and stratified. A lateral section of the deposit shows a superposition of layers several centimeters thick, as shown in the photos below. The report of this experiment was published in 1993 in the Bulletin of the Geological Society of France [7] (Figure 4–6).

GEMS-19-102_Kate Mariana_F4

Figure 4. Formation of granulated layers

GEMS-19-102_Kate Mariana_F5

Figure 5. Transverse section of the deposit

GEMS-19-102_Kate Mariana_F6

Figure 6. Longitudinal view of the deposit

To develop a chronology resulting from sedimentation, it is necessary to refer, as cause, to the marine movements, ascending or descending, which deposit stratified sets called “sequences”.

The book “Base of Sédimentologie” of the Association of French Sedimentologists, says: “Sedimentology studies how are formed the solid envelopes of the Earth and planets, subject to the action of water, wind and gravity “. Stenon’s a priori are no longer the basis. In the early 2000s, the time came for me to apply the lessons learned from my experiences, complemented by other sources on the ground. Being 75 years old, there was no way I could participate. But I was lucky when I went to Moscow at that time to meet a young geologist and sedimentologist, Alexandre Lalomov, who took a great interest in my published works. Thanks to him, I was able to publish in 2002, under the title “Analysis of the main principles of stratigraphy on the basis of experimental data”, in “Lithology and mineral resources”, journal of the Academy of Sciences and the Institute of Geology of Russia, a report of our work conducted in the USA [8].

In 2004, the same magazine published my, “Sedimentological Interpretation of the Tonto Group”, explaining that the facies of a geological series are both superimposed and juxtaposed on the deposit area, which is due to the current Sediment supply [9]. My work was also published in China [10].

Alexander Lalomov determined, in several regions of Russia, the hydraulic and sedimentary genesis of rock formations in Crimea, the Urals and the Saint Petersburg region [11].The most decisive of his works was the determination of the sedimentation time of rock formations, such as the Cambrian-Ordovician sandstone formations of the Saint Petersburg region. Sedimentary mechanics assess the sediment transport capacity of currents from critical paleo current velocities, as a function of particle size. The quotient of the volume of the rock formation studied by this capacity, per unit of time and volume, indicates the corresponding sedimentation times. This method is applied by many sedimentologists, names of which I would quote HA Einstein. The time determined by this method, applied to the aforementioned Cambrian-Ordovician sandstones, represents 0.05% of the time of the geological scale. The report of this study was published in 2011 in “Lithology and Mineral Resources”, journal of the Academy of Sciences and the Institute of Geology of Russia [12].

The sedimentary chronology is no longer based on stratification. This is why the stratigraphic chronology is belied by the aforementioned experimentation. In addition, sedimentary rocks are not radiologically dated, only igneous rocks can be.

Golovkinskii (Kazan-1868), on rocks, and Walther (1894), on marine sediments, established that: “Only facies and facies areas juxtaposed on the surface, could be superimposed originally” [13]. As it was shown, in my 2002 publication, facies, both superimposed and juxtaposed, constitute a sequence resulting from a transgression or marine regression. A succession of sequences included between a transgression followed by a final regression is a “series”. The data of the sequential stratigraphy and the experiments mentioned above, show that a series corresponds to a period. Therefore, the sequence should be considered as the base reference of the relative chronology, instead of the stage.

Today, sedimentologists, based on the results of their underwater observations and their laboratory experiments, have established relationships between hydraulic conditions, depth and particle size. This makes it possible to determine the critical transport speeds below which a particle of a given size is sedimented. The St. Petersburg Hydraulic Institute has carried out at my request an experimental program of erosion of sedimentary rocks by strong currents (v <27 m / s) to complete these relations [14]. Others will have to follow. For information, all our publications and experiences are on my website www.sedimentology.fr. By clicking on “Video”, you can see my experiences.

As a result, the geological time scale must no longer be based on the superposition of strata. It must be based previously on the sedimentary genesis, involving on the one hand gravitation, for the formation of the lamination, and on the other hand the turbulent flow velocity, for the formation of superimposed and juxtaposed stratified facies, constituting the sequences. As for absolute time, the foliated strata that Lyell observed, and taken for annual deposits, are mainly laminae which, as I have shown experimentally, do not characterize any absolute time. The same is true of his 240 million-year chronology, based on the biological “revolutions” that Professor Gohau has described as an “unproven, uniformitarian hypothesis”. Professor Gohau in his book “A History of Geology” [15] said, “What measures the time, these are the times of sedimentation and not those of orogens and “biological revolutions”. I add that the radiometric dating of rocks is questionable. As evidence, the potassium / argon dating of rocks, resulting from volcanic eruptions of known historical date, sometimes indicate millions of years. This results from an excess of argon largely from the lava that gave rise to the rock [16]. Christian Marchal, of ONERA, polytechnician also, published in 1996 in the “Bulletin of the Museum of Natural History of Paris” (completed by an erratum published in “Geodiversitas” – 1997), a study entitled “A probable cause of the large displacements of the terrestrial poles “ [17], showing that the uplift of a large mountain range like the Himalayas modifies by several million the moments of inertia of the Earth, which is enough to move the position of stable equilibrium of the poles by tens of degrees. This study indicates that these pole displacements, combined with the rotation of the Earth, result in large transgressions and regressions of the oceans, their amplitude being much greater than the variations of the level of the oceans due to the melting of the glaciers consecutive to cyclical variations of orbital parameters of the Earth. This may explain, in addition to the paleo-hydraulic analysis data, the existence of diluvian conditions in the geological past, generated by the orogeny of mountain ranges, in addition to those attributed to the fall of meteorites. As it is said in the Eocene Bulletin, the North Pole, before the Himalayan orogeny, was at the mouth of the Siberian Yenisei River at 72 degrees north latitude. After the orogenesis, he was in a position close to what it is today, after a shift of 18 degrees. The direction of the transgressions and regressions following each of the 19 orogeneses occurring since the beginning of the Primary era, corresponds to the succession of the resulting sequence facies, such as sandstone, clay, limestone. An example is the Tonto Group in the Cambrian. It proceeds from the Cadomian orogeny, at the beginning of the Cambrian, and results from a transgression from the Pacific Ocean to New Mexico. Other directions may be determined by other orogeneses that occurred elsewhere on Earth.

Contemporary marine fauna varies with depth, latitude and longitude, and such diversification exists in the geological timescale. The apparent change of fossilized marine organisms from one series to another following an orogenesis may result from different faunas transported by currents from different places resulting from successive orogenesis. What has been attributed to a biological change may be ecological in nature, explained by fauna from different orogeneses, taking into account the short time of sedimentation. It should be added that dating by radiocarbon (C14) is done nowadays on the collagen of fossil dinosaur bones, which reduces their calculated age from 65 million years to less than 40,000 years. But this C14 dating is based on the assumption that the C14 concentration of the atmosphere remained constant over time, which cannot be verified. Overall, the radiometric dates are not conclusive. In conclusion of the geological chapter, a relation can be established between cause and effect. Orogeny, that is, rising mountains, which is contingent on volcanic eruptions [18], is the cause of displacements of the axis of rotation of the poles, which causes marine series and creates deposits, thus sedimentary rocks. The duration of these deposits being much shorter than the time indicated by the geological timescale leads to its necessary revision. I expressed this causal relationship in “Towards a refoundation of historical geology” [19], published in “Georesources”, Journal of the Kazan University (12/2012), and in “Orogenesis, cause of sedimentary formations” [20], published in “Open Journal of Geology” at the International Conference of Geology and Geophysics held in Beijing (06/2013) [21].  I presented it at the Kazan Geology Conference in October 2014.

In his report, “Orogenesis of the Tertiary Age of the Ural Mountain System”, Alexandre Lalomov draws the following conclusions:

Based on the geomorphology and velocities generated by current surface movements, the time required for the uplift of the Ural Mountain system is much less (0.5 to 0.7%) than the corresponding time interval of the stratigraphic timescale.

Based on the sediment lithology and the geomorphology of the Ural valleys, the time required for the erosion of the valleys of most Ural rivers is much less (0.02 to 0.7%) than the corresponding time interval of the stratigraphic timescale.

The distribution of fossils in the Ural Orogeny deposits can be explained on the basis of ecological and facial zonings of the preogenic environment.

The report of “Reconstruction of Paleohydraulic conditions of deposition of the upper permian strata of the Kazan region” of A. Lalomov, G. Berthault, VG Izotov, LM Sitdikova, MA Tugarova was published in “Georesources” in 2017[22] and presented by Lalomov and myself on November 7, 2017 at the Kazan Geology Institute.

Conclusion

The fatal consequences of the a priori in natural sciences invites to base these on the observed and experienced facts, eliminating the a priori and errors of reasoning, which should be the subject of research by specialists of artificial intelligence. The history of the last centuries shows us well this sequence. Copernicus and Galileo affirmed, but without proof, that the sun was the center of the world. Had they merely spoken hypothetically, what Cardinal Bellarmin had asked Galileo to do, they would not have been condemned by the Holy Office, which, therefore, would not have denied the probable mobility of the Earth. There would have been no reaction against the Church. Similarly Descartes, if he had attached himself to the facts, he would not have based his judgments on the only clear and distinct ideas, persuasive ideas that led Stenon to his a priori, and Newton to his inexact laws set before the empirical evidence. Descartes thus engendered the philosophy of enlightenment, which, led the notoriously antireligious Voltaire to the revolution of 1789 and the fall of the monarchy of the Bourbons, replaced by Napoleon I and later Napoleon III, who unleashed wars. Objectively, these events should not have taken place. And without a historical geology based on an inexact a priori, Darwin would not have been led to write “The origin of species”, postulating this struggle for life between species which inspired Marx and Engels to advocate for the class struggle. So Stalin might have remained a seminarian and Hitler, a painter, which would have saved us the Second World War. Their a priori having been revealed, the previous incidences collapse. We cannot change history. But by becoming once again objective, we should be able to make history return to the path of Truth, from a scientific, political, metaphysical, moral and spiritual point of view. Man, having no proof of an evolutionary cause of the universe, must, as did ancient civilizations, ask himself the question : “Who created the universe?”. For believers, there is a spiritual response expressed by the Bible whose chronology has been challenged by the millions of years attributed to living species, including Man. Having challenged the foundations and chronology of historical geology, believers, freed from this geological challenge, can once again adhere to the credibility of the Bible, be it Jews, Christians or Muslims.

References

  1. van Ruymbeke M (1979) A horizontal pendulum with zero method makes it possible to measure the constant of the universal gravitation G. Thesis Annex phd UCL.
  2. Stenon N, Stensen N (1667) Canis Carchariae Dissectum Caput, KIU Aus., lat. u. engl. The earliest geological treatise.
  3. BG Sedimentology (1986) Experiments on Lamination of Sediments, Resulting from a Periodic Graded-Bedding Subsequent to Deposit. report of the Academy of Sciences 303.
  4. Berthault G (1988) Sedimentation of a Heterogranular Mixture. Experimental Lamination in Still and Running Water. report of the Academy of Sciences 306: 717–724.
  5. McKee ED, Crosby EJ, Berryhill HL Jr (1967) Flood Deposits, Bijou Creek, Colorado, June 1965. Journal of Sedimentary Petrology 37: 829–851.
  6. Lischtvan-Lebediev (1959) Gidrologia i gidraulika v mostovom doroshnom. Straitielvie. Leningrad.
  7. Pierre Y Julien, Yongqiang Lan, Guy Berthault (1993) Experiments on Stratification of Heterogeneous Sand Mixtures. Bulliten Of The Geological Society Of France 164: 649–660.
  8. Berthault G (2002) Analysis of Main Principles of Stratigraphy. Lithology and Mineral Resources 37: 509–515.
  9. Berthault G (2004) Sedimentological Interpretation of the Tonto Group Stratigraphy, Grand Canyon Colorado River. Lithology and Mineral Resources 39: 504–508.
  10. Berthault G (2002) Geological Dating Principles Questioned Paleohydraulics a New Approach. Journal of Geodesy and Geodynamics 22: 19–26.
  11. Lalomov A (2007) Reconstruction of Paleohydrodynamic Conditions during the Formation of Upper Jurassic Conglomerates of the Crimean Peninsula. Lithology and Mineral Resources 42: 268–280.
  12. Berthault G, Lalomov A, Tugarova MA (2011) Reconstruction of Paleolithodynamic Formation Conditions of Cambrian-Ordovician Sandstones in the Northwestern Russian Platform. Lithology and Mineral Resources 46: 60–70.
  13. Middleton GV (1973) Johannes Walther’s law of the correlation of facies. Geological Society of America 84: 979–988.
  14. Berthault G, Veksler AL, Donenberg VM, Lalomov A (2010) Research on Erosion of Consolidated and Semi-Consolidated Soils by High Speed Water Flow. Izvestia VMG 257: 10–22.
  15. Gohau G (1990) A history of geology. Paris Seuil Pg No: 277.
  16. Funkhauser JC, Naughton JJ (1968) Radiogenic helium and argon in ultramafic inclusions from Hawai. Journal Geological Research 73: 4601–4607.
  17. Marchal C (1997) Earth’s Polar Displacements of Large Amplitude. A Possible Mechanism. Bulletin of the National Museum of Natural History 19.
  18. Rampino MR, Prokoph A (2013) Are Mantle Plumes Periodic?. EOS Transactions American Geophysical Union 94: 113–120.
  19. Berthault G (2012) Towards a Refoundation of Historical Geology. Georesources Pg No: 4–36.
  20. Berthault G (2013) Orogenesis, cause of sedimentary formations. Open Journal of Geology 3: 22–24.
  21. Dilly R, Berthault G, Lalomov A (2015) Orogenesis, cause of sedimentary formations, 8ème conférence lithologique Evolution des processus sédimentaires dans l’histoire de la terre, Académie des Sciences et Université gouvernementale du pétrole et du gaz, Moscow.
  22. Lalomov A, Berthault G, Izotov VG, Sitdikova LM, Tugarova MA (2017) Reconstruction of Paleohydraulic conditions of deposition of the upper permian strata of the Kazan region. 19: 101–110.

Expectations and Attitudes Regarding Chronic Pain Control: An Exploration Using Mind Genomics

Abstract

We present the emerging science of Mind Genomics, to understand people’s responses to health-related issues, specifically pain. Mind Genomics emerge out of short, affordable, scalable, east-to-run experiments. The topic, here pain, is deconstructed into four questions, each with four separate answers (elements.) The answers are combined into vignettes, presented to respondents, who rate the entire vignette. Emerging from the study are the ratings and the response times to the vignettes, both of which are deconstructed into the contributions of the different underlying elements which the vignettes comprise. The answers cannot be gamed, and the data quickly reveal what is important to the individual, as well as revealing the existence of new-to-the-world mind-sets which differ in the pattern of elements that they find important. Mind Genomics  provides the opportunity to understand the person’s needs and wants for specific health as well as other experiential situations where human judgment is relevant.

Introduction

Pain is an inevitable companion in our life’s journey. Pain is defined through its association with actual or potential tissue damage, denoting it as a necessary characteristic of the experience, but also recognizing that events other than tissue damage can serve as determinants, consistent with a bio psychosocial model of pain [1,2]. This definition of pain denotes multiple causal factors underlying pain, beyond the issue pathology.

There is no dearth of studies on pain, whether these studies are report of pain from one’s everyday life [3], a topic dealt with in medicine [4], and a topic of scientific investigation [5]. When we talk about pain, can we probe into the mind of the person beyond simply the report, beyond a simplistic scale? Can we move beyond simple indicators, approaching a more detailed description of one’s pain but yet not forcing the respondent to become a scientist?

Pain, a highly subjective phenomenon, often refers to a sensory experience resulting from actual damage to the body or from non-bodily damage [6]. Pain may be influenced by psychological mechanisms such as: attention, emotion, beliefs and expectations [7].

In general, there are two different classifications of physical pain, visceral and somatic. Visceral pain originates in the internal organs whereas somatic pain stems from skin, muscle, soft tissue, and bone. There are many types of pain which fall under these categories. A person’s pain can also be classified as acute or chronic. Pain can be described as nerve pain, psychogenic pain, muscle pain, abdominal pain, back pain, pelvic pain, etc.

Subjective pain is influenced by its intensity and by interventions to treat the pain. Expectations and attitudes towards pain, may stem from psychological processes that are fundamental to learning across various sensory experiences and affect. Understanding expectations and attitudes towards pain may help us form communication messaging to help individuals deal more effectively with their chronic pain.

The subjective nature of pain makes it difficult to test the actual nature of perceived pain across populations, within a country, and in different countries. There are accepted methods of testing the actual perception of pain, specifically pain thresholds and pain tolerance, as well as psychophysical scaling of pain. One example is measuring the time one can submerge a limb in an ice bath, to test the ability of subjects to tolerate pain under varying conditions, most notable with the testing of analgesics of anesthetics. These methods give a measure of the all-or-none response to pain, and even the qualitative nature of the pain, but do not give a sense of the mind of the person who is undergoing the pain.

Increase in pain accompanies one’s beliefs that a certain treatment will cause pain or increase one’s symptoms overtime [7]. Negative beliefs regarding pain and its effects may occur in some types of chronic pains. To test whether expectations affect pain, studies tested the extent to which expectations influenced physiological responses among individuals. Placebo treatments truly reduced pain intensity [8–12]. These studies also indicated that short-term expectations varied and strongly affected perceptions of pain and pain-evoked responses [13].

Other studies linked differences in expectations regarding pain to the magnitude of responses to pain treatments [14]. Research on the relationship between expectations and pain experiences, showed that expectations about treatments and painful stimuli profoundly influenced behavioral markers of pain perception [7].

Pain treatments also bring positive changes in negative emotions [15]. Expectations affect pain through attention, executive functioning, value learning, anxiety and negative emotions [16]. Attitudes towards pain such as anxiety raised subjective pain. Pain is, thus a complex experience, involving sensory, motivational, and cognitive components. Affect any one of these components may change one’s attitudes towards pain [7].

Whereas studies indicate that beliefs influenced pain experience, it is unclear to what extent psychological processes such as attention, anxiety and emotions affect choice of treatments and what communication messages may mediate the effects of these psychological processes. This study tests communication messaging that affect emotion, attitudes towards pain and choice of treatment for pain.

In his book, Pain: The Gift Nobody Wants, author Paul Brand, MD describes his observations across cultures. Growing up as the child of missionaries in India and then moving to the US, Brand noted the difference in pain and suffering that existed in the East versus the West. He noted that, “as a society gained the ability to limit suffering, it lost the ability to cope with what suffering remains”. He stated that he believed that Easterners have learned to control pain at the level of the mind and spirit whereas, Westerners tend to view pain and suffering as an injustice or failure and an infringement on their right to happiness [17].

In the newly developing science of Mind Genomics we attempt to demonstrate a richer understanding of one’s inner life by presenting the respondent (or ill/healthy pain sufferer, here) with vignettes describing the inner experience, instructing the respondent to rate the fit of the vignettes, one at a time, and then estimating the degree to which each of the elements of the vignette ‘fits’ the respondent.

Method

Mind Genomics as an emerging science has been previously presented [18]. Mind Genomics works by presenting respondents with vignettes, combinations of statements which together tell a story. The respondent is instructed to judge the vignette, rating the vignette as a totality. The rating scale for this study is simply ‘How well does this describe you?’

The statements, elements in the language of Mind Genomics, present simple ideas. The approach requires the construction of four questions which ‘tell a story.’ For each question, the researcher is required to provide four answers, all expressed in simple language.  Table 1 presents the four questions, and the four answers to each question. Ideally, the questions and answers should deal with the topic, here pain, but need not mention pain directly. Rather, the questions and answers should be relevant to the topic.

Table 1. The four questions and the four answers to each question.

Question A: how would you describe the nature of pain you are feeling?

Pain bothers me all over my body

The pain is localized but intolerable

The pain radiates and makes it difficult to function

The pain is minor but frequent and annoying

Question B: Describe a situation that would make you feel more comfortable

The doctor explains to me how to deal with the pain

I try to deal with the pain to work through it

I’m happy when I can use a device that delivers therapeutic solution

I just like taking a pill that deals with the pain.

Question C: Describe how would you like to to avoid future pain

I would like to have a diet that is tailored to reduce my pain

I would like exercises and stretches that reduce pain

I would like regular therapy sessions to reduce my pain

I would like a prescription that gives me the medication I need to feel better

Question D: Describe what you would like the doctor to do

The doctor should give me advice

The doctor should give me a shot that delivers long term relief

The doctor should set me up with a system for me to follow

The doctor should give me a regular schedule of visits to treat my pain

The answers in Table 1 are combined by experimental design into a set of 24 vignettes, with each vignette comprising 2–4 elements. Table 2 shows an example of the first six vignettes. The elements appear an equal number of times. Each of the 16 elements is, by design, statistically independent of every other element.

Table 2. The first seven vignettes for the first respondent, created by the experimental design. The table shows the combinations, then the combinations transformed into binary, and then the ratings.

Vig1

Vig2

Vig3

Vig4

Vig5

Vig6

Vig7

A

4

0

4

3

1

0

0

B

3

2

1

2

1

1

3

C

4

2

0

0

4

4

3

D

2

3

4

0

3

1

4

Binary

A1

0

0

0

0

1

0

0

A2

0

0

0

0

0

0

0

A3

0

0

0

1

0

0

0

A4

1

0

1

0

0

0

0

B1

0

0

1

0

1

1

0

B2

0

1

0

1

0

0

0

B3

1

0

0

0

0

0

1

B4

0

0

0

0

0

0

0

C1

0

0

0

0

0

0

0

C2

0

1

0

0

0

0

0

C3

0

0

0

0

0

0

1

C4

1

0

0

0

1

1

0

D1

0

0

0

0

0

1

0

D2

1

0

0

0

0

0

0

D3

0

1

0

0

1

0

0

D4

0

0

1

0

0

0

1

Rating

7

8

4

7

9

7

9

Binary

100

100

0

100

100

100

100

RT (response time) in seconds

10

6

9

6

10

8

7

Each respondent evaluates a unique set of 24 vignettes. The underlying mathematical structure of the experimental design is maintained, but the specific combinations are changed, in a permutation scheme which preserves the mathematical properties of the design [19]. The permutation covers many more combinations of elements compared to the standard approach of creating one experimental design and presenting that design to many respondents.  The Mind Genomics achieves stability by testing many combinations, each a single time, but the expanded coverage ensures that a great of the ‘space of combinations’ is covered. It is difficult to be very ‘wrong’ with a Mind Genomics study because the scope. In contrast, traditional research works with a very small experimental design, e.g., equivalent to the combinations tested by one person, but the combinations are tested by many respondents in order to obtain a stable estimate of the value for each combination.

Mind Genomics and traditional statistics are on opposite sides in terms of what generates valid data. Is valid data obtained by sampling a few of the many possible combinations, albeit with stability for each point (traditional), or by sampling a great many of the combinations, albeit with less stability at any point. A good analogy to Mind Genomics is, metaphorically, the MRI, which discovers the configuration of tissue by taking different ‘snapshots’ and integrating them into one picture.  With the permuted experimental one need not ‘be sure’ that the limited number of combinations is the correct set to represent the total set of possible alternatives. With as few as 25 respondents, the number of respondents participating, generating a total of 720 different combinations has covered the space quite well.

Running the Mind Genomics experiment

The experiment is run on the web, typically with respondents from a specific population who have agreed to participate (e.g., those being treated for a condition), or more typically with respondents recruited from the general population, when the objective is a quick ‘scan’ of what is important.  The base sizes of these studies range from 25 for an exploration to 500 for a massive deconstruction of the population into different mind-sets.  The more typical base size of 25–50 respondents reveals quite a bit about the nature of people’s minds with regard to a particular issue.  This study shows the type of learning emerging from this small base size of respondents from the general population, and can be followed with many different studies to follow up on various interesting aspects.

The elements, answers to the questions, are created by experimental design [20]. The 16 elements are combined into 24 combinations or vignettes, similar in structure to the vignettes shown schematically in Table 2. The vignette can be presented on smartphones, tablets, or PC’s.

Although the respondent might feel that the vignettes are created in a random fashion, the reality is just the opposite. The vignettes are created within the framework of the design, which prescribe the exact combinations. The elements are placed one atop the other, centered, without any connectives, making the respondent’s task easier as the respondent ‘grazes for information’.

The experimental design ensures that the elements are statistically independent; appear several times against different backgrounds provided by the other elements in the vignette. Each respondent evaluates a unique set of 24 vignettes, permuted as noted above, so that the design structure is maintained but the specific combinations are new. The permutation system allows a great deal of the design space, or combinations, to be tested, and allows the information to emerge even when the researcher has absolutely no idea what will be important and what won’t. In other words, Mind Genomics is a discovery system, and not a confirmation system. One can learn quickly from a base of zero knowledge, simply by doing 1–4 easy studies of different facets of a topic.

The respondents who participated were US residents, members of a 10+ million world-wide panel of Luc.id Inc., who had previously agreed to participate in these studies for a reward administered by the panel provider. All respondents participated anonymously. The only information about the respondent was age, gender, and the answer to the third question about what type of pain they had.  There were five answers to the third question, three dealing with chronic pain of various sorts, and two saying either ‘no pain,’ or ‘not applicable.’  All respondents were classified by gender, age, and by either pain/yes versus pain/no.

Preparing the data for analysis

The respondent assigns a rating to assess ‘How much does this describe how you feel’. The low anchor, 1, is ‘not at all.’ The high anchor, 9, is ‘very much.’ The Mind Genomics program bifurcates the scale, dividing it into the lower part, ratings of 1–6, transformed to 0, plus a very small random number (<10–5), and a high part, ratings of 7–9, transformed to 100, plus a very small random number. The bifurcation comes from the decades of experience which suggest that managers and scientists alike do not ‘understand’ the meaning or use of the Likert or category scale, but they easily understand the meaning of a no/yes, binary scale.  The choice of where to bifurcate is left to the researcher. Thirty-five years of experiments suggest that a 2/3 vs 1/3 division seems to work well.  The small random number added to the binary transformed data ensures that when it is time to run the OLS (ordinary least-squares) regression on the data at the level of the individual respondent, there will not be a ‘crash’ of the regression program when the respondent confined the ratings to either the low range (1–6) or to the high range (7–9.) Either of those two cases produces all 0’s or all 1’s, crashing the regression. The small random number ensures that there is variability in the dependent variable, the binary transformed data.

How the different elements drive the binary transformed rating

Table 3 shows the parameters and relevant statistics for the additive model created from the ratings of the total panel, after transformation to a binary scale. The model itself is a simple linear equation of the form: Binary Rating = k0 + k1(A1) + k2(A2) … K16(D4). The experimental design allows us to create the model either at the level of the individual respondent or at the grand level, combining all of the data from the ‘relevant’ respondents, with relevant being

Table 3. Parameters of the model for ‘Fits Me’ after binary transformation. The data come from the Total Panel (720 observations, 24 tested vignettes from each of 30 respondents.) The table is sorted in descending order of coefficient for ‘describes me.’ At the right is the associated coefficient for response time.


Coeff Desc.

T-stat

P-Value

Coeff RT

Additive constant

46

4.68

0.00

C2

I would like exercises and stretches that reduce pain

6

0.95

0.34

0.9

D3

The doctor should set me up with a system for me to follow

2

0.39

0.69

2.1

B2

I try to deal with the pain to work through it

2

0.39

0.70

1.9

A1

Pain bothers me all over my body

1

0.23

0.82

1.3

A3

The pain radiates and makes it difficult to function

0

0.05

0.96

1.6

C3

I would like regular therapy sessions to reduce my pain

-2

-0.28

0.78

1.7

D2

The doctor should give me a shot that delivers long term relief

-3

-0.53

0.59

1.8

D4

The doctor should give me a regular schedule of visits to treat my pain

-3

-0.58

0.56

1.7

B3

I’m happy when I can use a device that delivers therapeutic solution

-4

-0.65

0.52

2.1

D1

The doctor should give me advice

-4

-0.69

0.49

1.5

B1

The doctor explains to me how to deal with the pain

-4

-0.73

0.47

1.8

A4

The pain is minor but frequent and annoying

-5

-0.90

0.37

2.1

A2

The pain is localized but intolerable

-6

-0.95

0.34

1.2

C4

I would like a prescription that gives me the medication I need to feel better

-7

-1.19

0.24

1.4

C1

I would like to have a diet that is tailored to reduce my pain

-7

-1.22

0.22

1.4

B4

I just like taking a pill that deals with the pain.

-8

-1.35

0.18

1.6

The analysis suggests the following:

  1. Additive constant, the expected binary value in the absence of elements: Without any elements, the likely response that the vignette will ‘describe me’ is about 46%. By design, all vignettes comprised 2–4 elements, so the additive constant is an estimated parameter.  Thus, the value of 46 for additive constant says that half the time respondents will answer that whatever appears will describe them. It is the elements which must do the work to move beyond this almost 50% agreement rate. It is worthwhile commenting here that this baseline of 46% is modest. When the topic is credit cards and the rating is ‘interested in acquiring this credit card,’ the additive constant plummets to about 10–15. When the topic is pizza and the rating is ‘interested in eating this pizza,’ the additive constant skyrockets to 60–70.
  2. There are no very strong elements for the total panel: That is, no element drives the description of ‘me.’ This weakness can either be the result of choosing the wrong elements, or the result of dealing with two or perhaps even three or more different populations, who describe their impressions by different terms, and who may live in quite different worlds of pain.
  3. The highest scoring element is C2, I would like exercises and stretches that reduce pain. This element generates a coefficient of only 6, and has a t-statistic of 0.95, with a probability of 0.34 that it came from a distribution with a true mean of 0. That is, it’s quite likely that were we to do this study again, we would come up with a coefficient much lower than 6, probably 0 or thereabouts.
  4. The remaining elements do not ‘fit’ the respondent:  It may well be that the elements are simply incorrect and others will fit the respondent better, or more likely that we are dealing with a segmented population of individuals, some of whom feel that an element ‘fits them,’ whereas others feel that the same element ‘does not fit them.’ In such a situation the responses cancel each other, and we are left with a coefficient around 0, denoting ‘no fit.’

Key subgroups

We know three additional things about the respondent based upon the self-profiling questions completed during the study. The first is gender, the second is age, and the third is whether or not they suffer pain on a regular basis. In this computerized application, the respondent is required to select one of two genders (male/female), and required to put in the year of birth, which provides age.  The third question is left to the discretion of the researcher. In this study is the selection of pain, with five options. Two options are defined as ‘no pain’ (actual selection of ‘no pain’ as an answer, selection of not applicable). The remaining three options as pain (i.e. pain in the limbs, back, etc.).  We will look at gender, age, and self-reported pain as the three self-defined subgroups. We will also explore two new subgroups, mind-sets inherent in the population but revealed by understanding patterns of responses, behavioral patterns, rather than self-classification.

The focus of interest in Mind Genomics studies is on the additive constant as the ‘baseline,’ and then on the ‘story’ told by the winning elements.  These elements are operationally defined as having a value of +6.51 or higher, which becomes 7 when rounded to the nearest whole number.

Gender

  1. Males show a higher additive constant than do females (57 vs 38). In the absence of elements, men are more likely to say that a vignette ‘describes ME.’  Women are less likely to say that, and require more specification.
  2. We get a good sense of what is important by looking at the elements which are most positive (most like me), and most negative (least like me)
  3. For men, the single phrase which most describes them is

    C2: I would like exercises and stretches that reduce pain

  4. For men, the single phrase which least describes them is

    C1: I would like to have a diet that is tailored to reduce my pain

  5. For women, the two phrases phrase which most describe them are

    B2: I try to deal with the pain to work through it,

    A1: Pain bothers me all over my body. The degree of fit is less, however, for these elements than the corresponding best fits for males.

  6. For women, the phrase which least describes them is

    B4: I just like taking a pill that deals with the pain.

Age: Under 50 versus 50+

Respondents provided the year of their birth. One respondent did not provide the year and was eliminated from this particular analysis by age.

  1. Surprisingly, the additive constant is much higher for the younger respondents versus the for the older respondents (48 vs 31.)
  2. For the younger respondents, there are no strong elements which fit them. The two elements which most describe them are those which suggest control over the pain:

    C2: I would like exercises and stretches that reduce pain

    D3: The doctor should set me up with a system for me to follow

  3. For the younger respondents, the two elements which least describe them are those which suggest passivity, and no control over the pain.

    B1: The doctor explains to me how to deal with the pain

    B4: I just like taking a pill that deals with the pain.

  4. For the older respondents, the two elements which most describe them are actual experience to reduce the pain, as well as a description of the experience.

    A3: The pain radiates and makes it difficult to function

    C2: I would like exercises and stretches that reduce pain

  5. For the older respondents, the three elements which least describe them is passivity

    D1: The doctor should give me advice

    C4: I would like a prescription that gives me the medication I need to feel better

    C1: I would like to have a diet that is tailored to reduce my pain

No pain versus pain

As part of the self-profiling classification, the respondents selected the type of pain, if any, afflicting them. The respondents who check any of the three types of pain assigned to the group saying YES. The remaining respondents were assigned to the group saying NO.

  1. The additive constant is virtually the same, 46 vs 48, meaning that in the absence of elements in the vignette; a little fewer than 50% of the responses will be ‘describes me.’
  2. For those with pain, the phrase which most describes them is

    C2:  I would like exercises and stretches that reduce pain.

  3. For those with pain, the element which least describes

    C1:  I would like to have a diet that is tailored to reduce my pain

  4. For those with no pain, virtually no element most describes them
  5. For those with no pain, many elements least describe. The strong element which least describes is

    C4: I would like a prescription that gives me the medication I need to feel better

Mind-Sets: Dividing respondents by the patterns of their coefficients for a specific topic

We have just seen that there are some differences in terms of ‘describes me’ across genders, and across those who define themselves as having pain versus no pain. These are ways that people describe themselves. People may differ in ways that the researcher cannot describe in simple terms, or even in way that they themselves don’t understand.

A major tenet of Mind Genomics is that within any topic area, such as the description of pain presented here, there are fundamental differences across people, differences that are obvious once demonstrated, but differences limited to a single topic area.  This is the case of the data here. Even within the small sample of 30 respondents we can extract two, possibly three different mind-sets. The method for extracting mind-sets has been previously described [21]. Quite simply, the technique is a matter of clustering the respondents into two or three groups based upon the pattern of their 16 coefficients. The statistical method of clustering is well accepted [22] All that remains is the clustering, extracting the small groups with the property that these mutually exclusive groups represent different ways of thinking about the topic.

Table 4 shows the results for the two mind-set segments emerging from the clustering of the 30 respondents. A base size of 25–30 suffices to reveal the nature of these different mind-sets, especially because the segments are so obviously different and interpretable.

Table 4. Coefficients for the binary-transformed scale ‘Describes me’ across gender, age, pain, and mind-set, respectively. Coefficients of +7 or more are presented in bold, and shaded.


Male

Female

Age<50

Age 50+

Pain Yes

Pain No

Mind Set 1: Wants a cure

Mind Set 2: Simplicity through the doctor

Additive constant

57

38

58

31

46

48

37

54

A1

Pain bothers me all over my body

1

4

-1

3

6

-9

10

-9

A2

The pain is localized but intolerable

-4

-4

-9

0

-3

-11

-2

-9

A3

The pain radiates and makes it difficult to function

1

1

-7

9

2

-4

10

-11

A4

The pain is minor but frequent and annoying

-11

2

-5

-2

-2

-12

-3

-8

B1

The doctor explains to me how to deal with the pain

-8

-1

-11

2

-7

1

3

-12

B2

I try to deal with the pain to work through it

-2

4

-1

4

4

-2

8

-3

B3

I’m happy when I can use a device that delivers therapeutic solution

-6

-3

-7

-1

-4

-2

1

-9

B4

I just like taking a pill that deals with the pain.

-9

-8

-12

-5

-7

-11

-16

1

C1

I would like to have a diet that is tailored to reduce my pain

-15

0

-5

-10

-10

-3

2

-17

C2

I would like exercises and stretches that reduce pain

13

-3

5

7

10

-5

9

3

C3

I would like regular therapy sessions to reduce my pain

-1

-3

-3

1

-2

-2

3

-7

C4

I would like a prescription that gives me   the medication I need to feel better

-11

-4

-4

-9

-5

-14

-9

-5

D1

The doctor should give me advice

-7

-5

-1

-9

-4

-3

-2

-4

D2

The doctor should give me a shot that delivers long term relief

-9

0

-1

-5

-3

-3

-6

3

D3

The doctor should set me up with a system for me to follow

-1

2

5

-1

4

-2

-4

10

D4

The doctor should give me a regular schedule of visits to treat my pain

-10

1

0

-5

-2

-6

-8

4

  1. Mind-Set 1 (wants a cure) begins with a low additive constant, 37. To them, it’s not the general response which ‘describes me’ but rather the specific phrase. Mind-Set 1 suffers pain, and wants a cure. Here are the elements which Mind-Set 1 feels best describes them:

    A1: Pain bothers me all over my body

    A3: The pain radiates and makes it difficult to function

    C2: I would like exercises and stretches that reduce the pain

  2. Mind-Set 1 do not want simple medical treatment which will alleviate their pain. Here is the element which is they feel least describes them:

    B4: I just like taking a pill that deals with the pain.

  3. Mind Set 2 (simplicity through the doctor) shows a higher additive constant, 54. Mind-Set 2 is less discriminating among elements. Mind-Set 2 wants simplicity. Here is the one element that they feel best describes them:

    D3: The doctor should set me up with a system for me to follow

  4. Mind Set 2 does not want to take responsibility. Here are the elements that they feel least describe them:

    C1: I would like to have a diet that is tailored to reduce my pain

    B1: The doctor explains to me how to deal with the pain

    A3: The pain radiates and makes it difficult to function

Response times as a measure of cognitive processing of information

At the same time that the respondents were reading the vignettes, the response time was being measured. Response time is operationally defined as the time between the appearance of the vignette and the assignment of the rating. The experiment was executed on the internet.

 The respondent was unaware of response time being measured, being instructed simply read the vignette and assign a ‘gut-level’ judgment. Occasionally, in about 10% of the cases, the response time was longer than 10 seconds, suggesting that the respondent was doing something as well, so-called multi-tasking. Those response times of 10 seconds or longer were recoded as 10 seconds. Figure 1 shows the distribution of the 720 response times (30 respondents, each evaluating 24 vignettes)

Mind Genomics-008 IMROJ Journal_F1

Figure 1. Distribution of response times for the total panel of 30 respondents, each rating 24 unique vignettes.

Response time patterns for different subgroups

The measurement of response times as a key feature of Mind Genomics began during the summer of 2019. In the studies run since that introduction, the response time data suggests that when the topic deals with an important health issue, the respondents spend a long time reading the vignette, and thus their response times are long, often 1.0 seconds or longer. When the topic deals with something commercial or ‘fun’ the response times are very short, around 0.2 – 0.7 seconds.

Table 5 presents the response time coefficients for the key subgroups. The model for response time is written in the same way as the model for the binary transformed rating, with the key difference being that that the model for response time does not have an additive constant. The ingoing assumption is that the response time is 0 when there are no elements in the vignette.

Table 5. The coefficients for the response time models. The models do not feature an additive constant.


Male

Female

Age <50

Age 50+

Pain YES

Pain NO

Mind-Set 1: Wants a cure

Mind-Set 2: Simplicity through the doctor

A1

Pain bothers me all over my body

1.3

1.1

1.0

1.6

1.0

2.0

1.3

1.3

A2

The pain is localized but intolerable

1.0

1.2

1.3

1.1

1.1

1.5

1.0

1.4

A3

The pain radiates and makes it difficult to function

1.7

1.5

1.8

1.4

1.8

1.2

1.6

1.7

A4

The pain is minor but frequent and annoying

2.5

1.7

1.9

2.5

1.9

2.7

1.8

2.6

B1

The doctor explains to me how to deal with the pain

1.8

1.9

1.2

2.6

1.9

1.6

1.8

1.7

B2

I try to deal with the pain to work through it

2.3

1.6

1.6

2.1

2.1

1.5

2.1

1.7

B3

I’m happy when I can use a device that delivers therapeutic solution

2.1

2.3

1.8

2.7

2.3

1.8

2.0

2.2

B4

I just like taking a pill that deals with the pain.

2.0

1.0

1.1

2.2

1.9

0.8

1.4

1.8

C1

I would like to have a diet that is tailored to reduce my pain

1.6

1.0

1.5

1.5

1.7

0.5

1.3

1.4

C2

I would like exercises and stretches that reduce pain

1.2

0.6

1.2

0.8

1.3

-0.1

0.9

1.0

C3

I would like regular therapy sessions to reduce my pain

1.9

1.5

1.7

1.9

2.0

0.9

1.4

1.9

C4

I would like a prescription that gives me the medication I need to feel better

2.1

0.6

1.7

1.6

2.0

0.0

1.2

1.7

D1

The doctor should give me advice

1.5

1.5

1.4

1.5

1.5

1.3

1.4

1.6

D2

The doctor should give me a shot that delivers long term relief

1.5

2.1

1.6

2.0

1.9

1.5

1.7

1.9

D3

The doctor should set me up with a system for me to follow

1.7

2.7

2.0

2.2

2.0

2.2

2.4

1.8

D4

The doctor should give me a regular schedule of visits to treat my pain

1.7

1.8

1.4

2.0

1.8

1.4

1.3

2.1

In Table, coefficients of 2.0 or higher are shaded and shown in bold. These are the elements to which the respondent pays attention.  There are some simple patterns which emerge from visual inspection of these elements that are processed ‘more slowly.’

  1. For gender, males focus on the description of symptoms.

    A4  The pain is minor but frequent and annoying

    B2   I try to deal with the pain to work through it

    B3   I’m happy when I can use a device that delivers therapeutic solution

    C4  I would like a prescription that gives me the medication I need to feel better

    B4   I just like taking a pill that deals with the pain.

  2. For gender, females want a relationship, or at least someone/something external to them.

    D3  The doctor should set me up with a system for me to follow

    B3   I’m happy when I can use a device that delivers therapeutic solution

    D2  The doctor should give me a shot that delivers long term relief

  3. For age, those under 50 focus on only one element:

    D3  The doctor should set me up with a system for me to follow

  4. For age, those 50+ focus on a number of phrases, most dealing with methods to assure pain reduction

    B3   I’m happy when I can use a device that delivers therapeutic solution

    B1   The doctor explains to me how to deal with the pain

    A4  The pain is minor but frequent and annoying

    B4   I just like taking a pill that deals with the pain.

    D3  The doctor should set me up with a system for me to follow

    B2   I try to deal with the pain to work through it

    D4  The doctor should give me a regular schedule of visits to treat my pain

    D2  The doctor should give me a shot that delivers long term relief

  5. For pain, those with PAIN YES, i.e., who say they suffer from one or another pain, the focus is on what stops the pain, i.e., assure pain reduction

    B3   I ‘m happy when I can use a device that delivers therapeutic solution

    B2   I try to deal with the pain to work through it

    D3  The doctor should set me up with a system for me to follow

    C3  I would like regular therapy sessions to reduce my pain

    C4  I would like a prescription that gives me the medication I need to feel better

  6. For pain, those with PAIN NO, i.e., who say that they do not suffer from pain, the focus is on descriptions of pain

    A4  The pain is minor but frequent and annoying

    D3  The doctor should set me up with a system for me to follow

    A1  Pain bothers me all over my body

  7. For Mind-Sets, Mind-Set 1 (Wants a cure)

    D3  The doctor should set me up with a system for me to follow

    B2   I try to deal with the pain to work through it

    B3   I’m happy when I can use a device that delivers therapeutic solution

  8. For Mind-Sets, Mind-Set 2 (Simplicity through the doctor)

    A4  The pain is minor but frequent and annoying

    B3   I’m happy when I can use a device that delivers therapeutic solution

    D4  The doctor should give me a regular schedule of visits to treat my pain

Finding the mind-sets in the population using a PVI (Personal Viewpoint Identifier)

The mind-sets reveal different ways of perceiving the nature of pain.  The mind-sets represent a way to divide what is likely a continuum of feelings and points of view into at least two distinct groups, a division which may provide further understanding, and certain a division that can be used to deal with patients in different, and possibly more appropriate fashion.

Table 6 shows, however, that it’s unlikely to identify mind-sets by their age and gender. It is also quite possible that there are no direct classifications of who a person ‘is’ or what a person ‘experiences’ which can easily assign a person to one of these two mind-sets.

Table 6. How the two emergent mind-sets for pain distribute on the self-profiling classification in terms of age, sex, and experience of pain.


Mind-Set1 Wants a cure

Mind-Set2 Simplicity through the doctor

Total

Male

6

10

16

Female

9

5

14

Total

15

15

30

Under 50

7

9

16

50+

7

6

13

Total

14

15

29

NOPAIN

6

3

9

YESPAIN

9

12

21

Total

15

15

30

An alternative way to assign new individuals to mind-set has been developed by author Gere. It is called the PVI, the personal viewpoint identifier. The PVI comprises a set of six questions, answered with one of two answers, no or yes.  The pattern of the answers to the six questions assigns the respondent to one of the two mind-sets.  Figure 2 shows the PVI questionnaire at the left, and the response emerging, given either to the physician and/or to the patient/client.  The questions themselves are taken from the actual study. These are the answers or elements, now turned into questions.

The PVI can be deployed along with additional information obtained during the questions. Thus, Figure 2 shows that the respondent, a new person not part of the previous study establishing the PVI, is asked for his or her email. Other questions can be asked, to relate mind-set membership to external variables, whether of a medical/health nature, or of a life-style nature.

Discussion & Conclusions

Since pain is a complex sensation involving sensory, motivational, and cognitive components, and affecting any one of these may change one’s attitudes towards pain [7]; we tested the effect of communication messaging, across mind-set segments towards pain. We tested how each min-set segment we identified emotionally responds to chronic pain, and which treatment choices are preferred by attitudinal mind-sets towards pain.

People who belong to the first mind-set segment feel the pain as radiating and challenging their daily functioning. The pain is very bothersome, but they choose to alleviate it by exercises and stretching. They chose to avoid medical treatment to simply deal with the pain and its ramifications.  People belonging to the second mind-set segment also view their chronic pain as radiating and challenging their daily functioning.  They, however, choose to simply take pain medication their doctor will prescribe.  They expect their doctor to also set them up with a system to follow.  In addition, they do not want to take responsibility for self-managing the illness which causes their pain. They prefer to avoid a diet that is tailored to reduce their pain.

Mind Genomics-008 IMROJ Journal_F2

Figure 2. The PVI created for the pain study. The link for the PVI as of this writing (Feb. 2019) is: http://162.243.165.37:3838/TT13/

This study also illustrated how a medical professional may easily identify the mind-set segment to which a patient belongs and accord communication messaging to patient choices and values. Identification of the mind-set to which a patient belongs may assist in building patient-physician trust resulting in higher patient adherence and better implementation of patient-centered care [21].

Mind Genomics provides the ability to segment out populations that share a common mind type and thereby help identify the possibility of determining the types of pain that a person is most likely to experience. It may help answer the question of why people with the same disease experience pain in profoundly different ways. By mind-typing patients who share ailments, Mind Genomics may aid in helping tailor a treatment plan best suited to that individual lying within a disease spectrum.

In light of the current opioid epidemic, it more important, now more than ever, to address how to customize pain treatments to individuals. There are many modalities to treat pain. In the West, pain medications are the first line of treatment. These medications include narcotics/opiates, Non-Steroidal Anti-Inflammatory Drugs (NSAIDs), acetaminophen, certain antidepressants, muscle relaxants, anticonvulsants, corticosteroids, local anesthetics, and most recently medical marijuana. Other modalities such as Transcutaneous Nerve Stimulation (TENS), implantable spinal cord stimulators, meditation and biofeedback are also used to help combat pain. Health care professionals who specialize in pain management use experience and training to try and help tailor treatment regimens to the individual patient. But a tool like Mind Genomics may help the practitioner go beyond the current protocols and prejudices of current practice. Mind Genomics may provide a “cheat sheet” to the patient’s mind and help provide a short cut to success by focusing on pathways that will more likely work for a given patient and eliminating the pathways that will waste time and resources.

References

  1. Hadjistavropoulos T, Craig KD, Duck S, Cano A, Goubert, L, et al. (2011) A biopsychosocial formulation of pain communication. Psychological bulletin 137: 9.
  2. Williams AC, Craig KD (2016) Updating the definition of pain. Pain 157: 2420– 2423. [crossref]
  3. Baker KS, Gibson S, Georgiou-Karistianis N, Roth RM, Giummarra MJ (2016) Everyday executive functioning in chronic pain: specific deficits in working memory and emotion control, predicted by mood, medications, and pain interference. The Clinical Journal of Pain 32: 673–680.
  4. Morrison RS, Maroney-Galin C, Kralovec PD, Meier (2005) The growth of palliative care programs in United States hospitals. Journal of Palliative Medicine 8: 1127–1134.
  5. Schug SA, Palmer GM, Scott DA, Halliwell R, Trinca J (2016) Acute pain management: scientific evidence, 2015. Medical Journal of Australia 204: 315–317.
  6. Loeser JD, Treede RD (2008) The Kyoto protocol of IASP Basic Pain Terminology. Pain 137: 473–477. [crossref]
  7. Atlas LY, Wager TD (2012) How expectations shape pain. Neurosci Lett 520:140–148. [crossref]
  8. Goffaux P, de Souza JB, Potvin S, Marchand S (2009) Pain relief through expectation supersedes descending inhibitory deficits in fibromyalgia patients. Pain 145: 18–23.
  9. Goffaux P, Redmond WJ, Rainville P, Marchand S (2007) Descending analgesia–when the spine echoes what the brain expects. Pain 130: 137–143. [crossref]
  10. Matre D, Casey KL, Knardahl S (2006) Placebo-induced changes in spinal cord pain processing. Journal of Neuroscience 26: 559–563.
  11. Price DD, Craggs J, Verne GN, Perlstein WM, Robinson ME (2007) Placebo analgesia is accompanied by large reductions in pain-related brain activity in irritable bowel syndrome patients. Pain 127: 63–72.
  12. Alkes L. Price, Arti Tandon, Nick Patterson, Kathleen C. Barnes, Nicholas Rafaels, et al (2009) Sensitive Detection of Chromosomal Segments of Distinct Ancestry in Admixed Populations. PLoS Genet 5: 1000519.
  13. Atlas LY, Bolger N, Lindquist MA, Wager TD (2010) Brain mediators of predictive cue effects on perceived pain. J Neurosci 30: 12964–12977. [crossref]
  14. Watson A, El-Deredy W, Iannetti GD, Lloyd D, Tracey I, et al. (2009) Placebo conditioning and placebo analgesia modulate a common brain network during pain anticipation and perception. PAIN 145: 24–30.
  15. Wager TD, Atlas LY, Leotti LA, Rilling JK (2011) Predicting individual differences in placebo analgesia: contributions of brain activity during anticipation and pain experience. Journal of Neuroscience 31: 439–452.
  16. Flaten MA, Aslaksen PM, Lyby PS, Bjørkedal E (2011) The relation of emotions to placebo responses. Philosophical Transactions of the Royal Society B: Biological Sciences 366: 1818–1827.
  17. Brand PW, Yancey P (1993) Pain: the gift nobody wants. New York, HarperCollins Publishers.
  18. Moskowitz HR, Gofman A, Beckley J, Ashman H (2006) Founding a new science: Mind genomics. Journal of sensory studies 21: 266–307.
  19. Gofman A, Moskowitz HR (2010) Isomorphic permuted experimental designs and their application in conjoint analysis. Journal of Sensory Studies 25: 127–145.
  20. Box GE, Hunter JS, Hunter WG (2005) Statistics for experimenters: design, innovation, and discovery (Vol. 2). New York: Wiley-Interscience.
  21. Gabay G, Moskowitz HR, Silcher M, Galanter E (2017) The New Novum Organum: Policies, Perceptions and Emotions in Health. Pardes-Ann Harbor Publishing.
  22. Moskowitz HR, Martin DM (1993) How computer aided design and presentation of concepts speeds up the product development process. Paper presented at the ESOMAR Congress, September, 1993, Copenhagen.
  23. Eippert F, Finsterbusch J, Bingel U, Büchel C (2009) Direct evidence for spinal cord involvement in placebo analgesia. Science 326: 404. [crossref]
  24. Moskowitz, HR (2012) ‘Mind genomics’: The experimental, inductive science of the ordinary, and its application to aspects of food and feeding. Physiology & behavior 107: 606–613.

The Impact of Accountable Care Units on Patient Outcomes

Abstract

Background: Effective hospital teams can improve outcomes, yet, traditional hospital staffing, leadership, and rounding practices discourage effective teamwork and communication. Under the Accountable Care Unit model, physicians are assigned to units, team members conduct daily structured interdisciplinary bedside rounds, and physicians and nurses are jointly responsible for unit outcomes.

Objectives: To evaluate the impact of ACUs on patient outcomes.

Design: Retrospective, pre-post design with concurrent controls.

Patients: 23,406 patients admitted to ACU and non-ACU medical wards at a large academic medical center between January 1, 2008 and December 31, 2012.

Measures: In-hospital mortality and discharge to hospice, length of stay, 30-day readmission.

Results: Patients admitted to ACUs were less likely to be discharged dead or to hospice (-1.8 percentage point decline [95% CI: -3.3, -0.3; p = .015]) ACUs did not reduce 30 day readmission rates or have a significant effect on length-of-stay.

Conclusions: Results suggest ACUs improved patient outcomes. However, it is difficult to identify the impact of ACUs against a backdrop of low inpatient mortality and the development of a hospice unit during the study period.

Keywords

quality improvement, teamwork, hospital medicine, care standardization

Introduction

Under the traditional model of inpatient staffing, hospitals nurses and allied health professionals are assigned to a unit, while hospital medicine physicians treat patients on multiple units. Care is delivered asynchronously. Physicians see patients when their schedules permit, usually early in the morning or in the late afternoon and update orders at those times. Nurses and other professionals care for patients separately. They may not see the physician during rounds, and their priorities for patient care may be different from those of the physician. In our experience, they often obtain information from second-hand sources or the often difficult-to-decipher notes in patients’ charts.

The traditional, physician-centric model of inpatient care poses significant coordination and incentive problems. Beginning in October 2010, Emory University Hospital re-organized two medical units into Accountable Care Units (ACU® units). In the ACU care model, hospital-based physicians are assigned to a home unit where they can focus on the patients in the unit and work with the same nurse team. By assigning physicians to home units with other unit-based personnel such as nurses and having teams engage in structured interdisciplinary bedside rounds, ACUs enable clinicians to recognize preventable hospital complications and signs of deterioration or diagnostic error that might otherwise have been missed and implement a coordinated response.

Previous publications on the ACU model have been mostly descriptive in nature [1–4]. Using electronic medical records and a pre-post study design with concurrent controls, we retrospectively evaluated the effect of ACUs on patient mortality, length of stay, and readmissions at Emory University Hospital.

Methods

Intervention

Emory University Hospital is a 500 bed teaching hospital in Atlanta, Georgia. Prior to the implementation of ACUs, hospital medicine physicians at Emory University Hospital treated patients in as many as eight units. In the first unit to be organized into an ACU, patients were divided between five physician care teams prior the re-organization. Beginning in October 2010, Emory University Hospital assigned two physician care teams to each of two newly-constituted ACU units. ACUs combine a number of interventions, some of which have been implemented at other hospitals [5–8] , into a single, cohesive bundle.

ACU physician teams were assigned to units and included one hospital medicine attending physician, one internal medicine resident, and three interns. Within an ACU, two teams rotated call schedules over a 24 hour period. The team on-call admitted every patient who arrived at the unit. The same nurse teams continued to staff each unit as before the reorganization.

ACUs standardize communication through a series of brief but highly scripted intra- and inter-professional exchanges to review patients’ conditions and care plans. Each shift change begins with a five minute huddle where the departing staff hands over the unit to the incoming staff. During the huddle, the departing staff alerts the incoming staff to patient- and quality-related issues. After the huddle, nurses hand over individual patients at the bedside using a structured format, highlighting patient-level factors that might indicate patient instability or are outside the expected range. Once a day, each patient’s care team meets for structured interdisciplinary bedside rounds. Structured interdisciplinary bedside rounds bring the bedside nurse, attending physician, and unit-based allied health professionals to the bedside every day with the patient and family members to review the patient’s current condition, response to treatment, care plan, and discharge plan collaboratively [5–8]. Evidence-based actions, such as “bundles” to prevent hospital acquired conditions, are embedded in structured interdisciplinary bedside rounds, and reported on by the patient’s nurse. A scripted, standard communication protocol reduces extraneous communication and focuses the structured interdisciplinary bedside round team’s attention on aspects of patients’ conditions that are responsive to staff attention and effort.

A unit leadership dyad, consisting of a nurse manager and senior physician, set explicit expectations for staff and manage unit process and performance. Physicians operating in the traditional model may be unaware of unit-level quality protocols and outcome measures. As part of the re-organization, a data analyst prepared quarterly unit-level performance reports describing rates of in-hospital mortality, blood stream infections, 30-day readmissions and patient satisfaction scores and length of stay. These reports are used by hospital administrators to set goals for the ACU leadership team and may figure into the performance evaluations of ACU administrators. Readers interested in additional details about the ACU model are urged to consult previous publications [1–4].

Following implementation of ACUs, physician teams assigned to ACUs saw patients on only 1.5 units, with 90% of their patients located in the ACUs, compared to non-ACU physician teams, which cared for patients spread across 6 to 8 units every day.1 The number of patient encounters per day for the ACU physician teams increased from 11.8 in the year before the ACUs (when the teams were not unit based) to 12.9 in the four years following implementation [1]. No changes were made to nurse staffing levels (1 to 4 or 5 nurses per patient).

During the study period, Emory University Hospital created two ACUs, but medical patients were also admitted to seven other units in the hospital. The units that became ACUs were selected because nearly all the patients were under the care of hospital medicine attending physicians so we could designate them as hospital medicine units. In other units, hospital medicine patients were mixed in with patients from other specialties (for example, cardiology). The assignment of patients to ACUs or other medical units was determined by bed control officers based on a mix of criteria that can include bed availability, relative patient wait times, and individual judgement. Bed managers know patients’ names, medical record number, and admitting diagnosis when they assign patients to units. They do not know have access to other prognostic indicators.

Study Sample

The study sample includes patients ages 18 and older admitted to the medical units of Emory University Hospital between January 1, 2008 and December 31, 2013. Following an intent-to-treat framework, we grouped patients who were transferred into ACUs during their hospital stay with non-ACU patients. Patients admitted to surgical, orthopedic, observation, or other specialty units (e.g. medical oncology) were excluded from the analysis, as were patients with cystic fibrosis who are treated only within one of the two ACUs. Patients in the control group were spread across 38 units, though 70% were in just 8 of these units.

Data and Outcome Variables

All study variables are captured in Emory’s internal electronic medical record and administrative data systems. We evaluated the impact of ACUs on in-hospital mortality, discharge to hospice, length of stay, readmission or emergency department visit to Emory University hospital within 30 days, and hospital-acquired urinary tract infection and deep vein thrombosis and pulmonary embolism. We counted a patient as having hospital-acquired urinary tract infection and deep vein thrombosis and pulmonary embolism if their records listed ICD-9 codes for these condition but not if they were among the present-on-admission ICD-9 codes.

Emory University Hospital opened an on-site hospice during the study period in November 2010, potentially reducing the barriers to transferring patients from the hospital to hospice care. While discharge to hospice is in many cases an indication of appropriate care, the opening of the inpatient hospice complicates efforts to measure trends in in-patient mortality. The opening of the unit may be responsible for changes in the site of death for patients admitted to the hospital over time. For this reason, we highlight the impact of ACUs on the combined outcome of in-hospital death or discharge to hospice.

Statistical Analysis

We compared patient characteristics between ACUs and control units using chi-squared tests. We estimated the impact of ACUs on these outcomes using a difference-in-difference study design (equivalently, a pre/post study with a concurrent control group). The pre period was January 1, 2008 to October 31, 2010. The post period was November 1, 2010 to December 31, 2012. We calculated the change in outcomes between the pre and post periods among patients admitted to the units that became ACUs and the change among patients in the control group. The difference of these changes is the difference-in-difference estimator. It assesses changes in outcomes in the units that became ACUs relative to changes in the control group. It assumes that absent any change in policy (i.e., the implementation of ACUs), trends in outcomes among patients admitted to the ACUs would have mirrored trends among patients in the control group. We calculated 95% confidence intervals for unadjusted estimates using z-tests. We used logistic regression with robust standard errors to estimate adjusted effects for in-hospital mortality and hospice discharges and readmissions. We used Poisson regression with robust standard errors to estimate adjusted effects for length of stay. We calculated standard errors and 95% confidence intervals for the difference-in-difference estimator using the Delta method [9].

In multivariable analysis, we adjusted estimates for patient age group, sex, race, primary payer, admission source (hospital or skilled nursing facility versus other), and Elixhauser comorbidities (based on all diagnosis codes) [10] that were present in at least 2.5% of patients in the sample. About one-third of the sample had missing values for admission source. We included each Elixhauser comorbidities as a separate variable in the model rather than collapsing the conditions into a count to avoid imposing unnecessary restrictions on the relationship between conditions and outcomes. Conditions are not mutually exclusive.

Estimates from difference-in-difference models may be biased if there are pre-existing trends in outcomes that differ between ACU and non-ACU units. We tested for pre-existing trends by estimating a model that included, in addition to the variables described above, indicators for the years in the pre-period (2008 to 2010) and these year indicators interacted with treatment group (ACU versus non ACU). We assessed the significance of the year-group interactions and used a likelihood ratio test to compare the model fit with a model that omitted the year-group interactions [11].

Estimates of the impact of ACUs on in-hospital mortality and hospice discharge rates may be biased by differences in length of stay. An intervention that reduces length of stay but does not affect mortality rates will reduce in-hospital mortality rates by shifting the place of death from the hospital to the community. In a sensitivity analysis we assessed the robustness of logistic regression estimates by estimating a Weibull survival model with robust standard errors of the time to hospice discharge or in-hospital death. Records for patients who were not discharged to hospice or dead are censored.

Results

There were 23,403 patients included in the study sample, of whom 10,639 were admitted to the ACU units (including patients admitted to the units before they became ACUs) and 12,764 patients in the control group. There are significant differences in some of the characteristics of ACU and control group patients in the pre and post periods (Table 1), but most differences are qualitatively small. There are some clinically meaningful differences in patients’ diagnoses. For example, in the pre-ACU period, 8.2% of patients in the control group had a solid tumor compared to 6.7% in the ACU group.

The unadjusted proportion of ACU patients discharged to hospice or dead declined from 7.7% to 5.8% (Figure 1) or -2.0 (95% CI: -2.9, -1.0) percentage points. The unadjusted proportion of patients discharged to hospice and dead both declined. A reduction in in-hospital mortality rates accounted for 70% of the decline (= [2.5–1.1] ÷ 2).

IMROJ 2019-105 - Jason Stein USA_figure1

Figure 1. Discharge destination in ACUs and control units

Table 1. Sample characteristics

  Pre

 Post


All


Control patients

ACU patients

P-value

Control patients

ACU patients

P-value

N (%)

N (%)

N (%)

N

23,403

6,219

5,499

6,545

5,140

Age

<0.001

.043

18–49

6,580

(28.1)

1,721

(27.7)

1,577

(28.7)

1,827

(27.9)

1,455

(28.3)

50–64

5,760

(24.6)

1,459

(23.5)

1,477

(26.9)

1,582

(24.2)

1,242

(24.2)

65–74

3,900

(16.7)

1,000

(16.1)

904

(16.4)

1,089

(16.6)

907

(17.6)

75–84

3,850

(16.5)

1,063

(17.1)

883

(16.1)

1,051

(16.1)

853

(16.6)

85+

3,313

(14.2)

976

(15.7)

658

(12.0)

996

(15.2)

683

(13.3)

White

11,719

(50.1)

3,314

(53.3)

2,796

(50.8)

.008

3,195

(48.8)

2,414

(47.0)

.047

Male

9,939

(42.5)

2,542

(40.9)

2,393

(43.5)

.004

2,746

(42.0)

2,258

(43.9)

.032

Insurance status

.024

.965

Medicare

12,079

(51.6)

3,144

(50.5)

2,728

(49.6)

3,470

(53.0)

2,737

(53.2)

Medicaid

2801

(12.0)

632

(10.2)

642

(11.7)

849

(13.0)

677

(13.2)

Self-pay

1598

(6.8)

416

(6.7)

400

(7.3)

439

(6.7)

343

(6.7)

Private/Other

2504

(10.7)

5,171

(83.1)

4,457

(81.1)

5,257

(80.3)

4,120

(80.2)

Admitted from facility

2504

(10.7)

798

(12.8)

503

(9.1)

<0.001

730

(11.2)

473

(9.2)

0.001

Diagnoses

Congestive heart failure

1,998

(8.5)

438

(7.0)

389

(7.1)

.948

653

(10.0)

518

(10.1)

.857

Pulmonary circulation disorders

1,211

(5.2)

331

(5.3)

252

(4.6)

.066

399

(6.1)

229

(4.5)

<0.001

Hypertension

719

(3.1)

148

(2.4)

179

(3.3)

.004

217

(3.3)

175

(3.4)

.790

Other neurological disorders

2,869

(12.3)

530

(8.5)

631

(11.5)

<0.001

867

(13.2)

841

(16.4)

<0.001

Chronic pulmonary disease

1,205

(5.1)

287

(4.6)

268

(4.9)

.511

352

(5.4)

298

(5.8)

.326

Diabetes

895

(3.8)

188

(3.0)

201

(3.7)

.057

258

(3.9)

248

(4.8)

.020

Renal failure

1,531

(6.5)

234

(3.8)

315

(5.7)

<0.001

473

(7.2)

509

(9.9)

<0.001

Liver disease

796

(3.4)

142

(2.3)

215

(3.9)

<0.001

211

(3.2)

228

(4.4)

.001

Metastatic cancer

694

(3.0)

248

(4.0)

170

(3.1)

.009

152

(2.3)

124

(2.4)

.750

Solid tumor

1,548

(6.6)

512

(8.2)

371

(6.7)

.002

365

(5.6)

300

(5.8)

.547

Fluid and electrolyte disorders

1,814

(7.8)

410

(6.6)

379

(6.9)

.519

506

(7.7)

519

(10.1)

<0.001

Deficiency anemias

672

(2.9)

150

(2.4)

176

(3.2)

.010

179

(2.7)

167

(3.2)

.104

The unadjusted proportion of patients in the control group discharged to hospice or dead declined from 7.9% to 7.1%, or -0.8 (95% CI: -1.7, 0.1) percentage points. A decline in the proportion of patients discharged dead was offset by an increase in the proportion discharged to hospice.

Adjusted estimates of the impact of ACUs are displayed in the last columns of Table 2. (Full regression results are available in the Appendix Table.) The adjusted estimate of the impact of ACUs on the composite outcome of discharged dead or to hospice is -1.8 (95% CI: -3.3, -0.3; p = .015) percentage points. The adjusted difference-in-difference estimate of the impact of ACUs on length of stay is negative but not statistically significant (-0.5 days [95% CI: -1.2, -0.3; p =.21]). The estimates for 30 day readmissions and hospital-acquired urinary tract infections are close to 0. The estimate of the impact of ACUs on the occurrence of pulmonary embolism/deep vein thrombosis was positive and borderline significant (0.6 percentage points [95% CI: -0.05, 1.3] p = .07).

Table 2. Changes in outcomes among ACU and non-ACU patients


Time period


Pre-ACU


Post-ACU


Unadjusted difference

P-value

Adjusted difference

P-value

In-hospital mortality (%)

ACU

2.5

(2.1,

2.9)

1.1

(0.8,

1.4)

-1.4

(-1.9,

-0.9)

Control

3.5

(3.0,

4.0)

2.0

(1.6,

2.3)

-1.5

(-2.1,

-1.0)

Difference

-1.0

(-1.6,

-0.4)

-0.9

(-1.3,

-0.4)

0.1

(-0.6,

0.9)

.765

-0.1

(-0.7,

0.8)

0.88

Hospice discharge (%)

ACU

5.2

(4.6,

5.8)

4.6

(4.1,

5.2)

-0.6

(-1.4,

0.3)

Control

4.4

(3.9,

4.9)

5.1

(4.6,

5.6)

0.7

(0.0,

1.5)

Difference

0.8

(0.1,

1.6)

-0.5

(-1.2,

0.3)

-1.3

(-2.4,

-0.2)

.023

-1.8

(-3.2,

-0.4)

0.013

In-hospital mortality and hospice discharge (%)

ACU

7.7

(7.0,

8.5)

5.8

(5.1,

6.4)

-2.0

(-2.9,

-1.0)

Control

7.9

(7.2,

8.6)

7.1

(6.5,

7.7)

-0.8

(-1.7,

0.1)

Difference

-0.1

(-1.1,

0.8)

-1.3

(-2.2,

-0.4)

-1.2

(-2.5,

0.2)

.083

-1.8

(-3.3,

-0.3)

0.015

Length of stay (days)

ACU

6.5

(6.3,

6.7)

6.4

(6.2,

6.6)

-0.1

(-0.4,

0.2)

Control

5.1

(4.6,

5.7)

5.4

(5.2,

5.5)

0.2

(-0.3,

0.8)

Difference

1.4

(0.8,

2.0)

1.0

(0.8,

1.3)

-0.4

(-1.0,

0.3)

.281

-0.5

(-1.2,

0.3)

0.21

30 day readmissions (%)

ACU

22.2

(21.1,

23.3)

21.0

(19.8,

22.1)

-1.2

(-2.8,

0.3)

Control

22.3

(21.3,

23.4)

20.9

(19.9,

21.9)

-1.4

(-2.9,

0.0)

Difference

-0.1

(-1.7,

1.4)

0.1

(-1.4,

1.5)

0.2

(-1.9,

2.3)

.852

0.3

(-1.8,

2.4)

0.80

Urinary tract infection (%)

ACU

5.2

(4.6,

5.8)

6.6

(6.0,

7.3)

1.4

(0.5,

2.3)

Control

5.5

(4.9,

6.0)

6.7

(6.1,

7.3)

1.3

(0.4,

2.1)

Difference

-0.2

(-1.1,

0.6)

-0.1

(-1.0,

0.8)

0.1

(-1.1,

1.4)

.819

0.01

(-1.2,

1.2)

0.99

Pulmonary embolism/Deep vein thrombosis (%)

ACU

1.8

(1.4,

2.2)

2.0

(1.7,

2.4)

0.2

(-0.3,

0.8)

Control

1.8

(1.5,

2.2)

1.6

(1.3,

1.9)

-0.2

(-0.7,

0.2)

Difference

0.0

(-0.5,

0.4)

0.4

(-0.1,

0.9)

0.5

(-0.2,

1.2)

.167

0.6

(-0.05,

1.3)

0.07

Models that included year-group interactions rejected the hypothesis of pre-existing trends for discharge status and readmissions (see Appendix for details). In the survival model estimating time to in-hospital death or discharge to hospice, the hazard ratio for the interaction of the ACU group indicator and the post period indicator was less than one but did not achieve significance at α = 0.05 threshold (0.80 [95% CI: .63 to 1.00]; p = .052).

Discussion

Results indicate that ACUs reduced the proportion of patients discharged dead or to hospice. Length of stay declined in ACUs relative to control units, but the effect was mostly driven by an increase in length of stay in control units rather than a decrease in ACUs. ACUs did not appear to affect readmission rates. The opening of an inpatient hospice unit coincided with the introduction of ACUs, making it more difficult to identify the discrete impact of ACUs. However, physicians in all units of the hospital could transfer patients to the inpatient hospice unit, and so it should not have differentially affected outcomes in ACU versus non-ACU patients. The proportion of patients discharged to hospice actually declined slightly in the units that implemented ACUs. This pattern may reflect mean-reversion (the hospice discharge rate was higher in ACU units in the pre-period).

Given the low rates of in-hospital mortality in this patient population and hospital-wide efforts to reduce in-hospital mortality, patient discharge status may not be particularly sensitive to the quality of care. The regular rotation of residents and movement of other unit staff through the hospital may have spread some of the features of ACUs and their processes, resulting in hospital-wide improvements in outcomes.

Consistent with our predetermined analysis plan, we evaluated trends in ACU units relative to trends in control units. However, there were baseline differences in mortality rates and length of stay.

ACUs did not reduce the occurrence of hospital-acquired urinary tract infections and pulmonary embolism/deep vein thrombosis, at least as measured from billing records. It is unclear whether these results reflect a failure of ACUs to improve care or whether they reflect “surveillance bias” [12] : ACU teams may be more likely to recognize and diagnose patients with these conditions. The hospital implemented an initiative to more accurately document patients’ conditions during the study period, which may account for the increase in urinary tract infection rates.

Lacking access to information about patient health after discharge, we were unable to determine the impact of being admitted to an ACU on long-term outcomes. Patients discharged too early may experience adverse outcomes. We found that readmission rates were similar between the ACU and control groups, suggesting that patients were not being discharged from ACUs prematurely.

Although we evaluated the impact of ACUs in a single, large academic medical center, there are no elements or features of the ACU model that would prevent it from being expanded to other care settings. ACUs have already been implemented in community hospitals in the US, Canada (see http: //www.rqhealth.ca/department/patient-flow/accountable-care-unit accessed April 19th 2019) and Australia (see http: //www.cec.health.nsw.gov.au/quality-improvement/team-effectiveness/insafehands accessed April 19th 2019).

Most prior studies on teams in inpatient and outpatient settings focus on single specialty teams (e.g. psychiatric care) and teams designed to address a specific quality issue (e.g., hospital acquired infections) [13,14].A recent report on the implementation of an Accountable Care Teams model, which shares many of the features of ACUs, at Indiana University Health Methodist Hospital found that implementation was associated with reductions in length of stay and costs but did not affect readmission rates or patient satisfaction [15].The assignment of hospitalists to units at Northwestern Memorial Hospital improved communication but did not increase physician-nurse agreement on patients’ care plans [16].

High risk industries with excellent safety records have recognized the value of teams to improving outcomes. ACUs, with their emphasis on patient-centered, interprofessional collaboration, were designed to address shortcomings of the traditional model of hospital organization. Our findings suggest that these and other features of the model were associated with reductions in the proportion of patients discharged dead or to hospice but did not affect other outcomes. Unfortunately, we were unable to assess the degree of fidelity of the study units to all features of the ACU model. Futures studies should include estimates of the extent to which units are implementing all four essential components of the model in estimating the effects of the model on distal outcomes.

Funding: Agency for Healthcare Research and Quality, R03 HS 022595-01

Conflicts of Interest: Dr Stein and Dr Chadwick are officers of 1Unit, a company that helps hospitals set up and run Accountable Care Units. Drs Howard, Shapiro, Murphy, and Ms Overton do not have any conflicts of interest.

References

  1. Stein J, Murphy DJ, Payne C et al. (2015) A Remedy for fragmented hospital care. Harvard Business Review-New England Journal of Medicine Online Forum: Leading Healthcare Innovation.
  2. Stein J, Payne C, Methvin A, et al. (2015) Reorganizing a Hospital Ward as an Accountable Care Unit. J Hosp Med 10: 36–40.
  3. Castle B, Shapiro S (2016) Accountable Care Units: A Disruptive Innovation in Acute Care delivery. Nurs Adm Q 40: 14–23.
  4. Shapiro S (2015) Accountable care at Emory Healthcare: Nurse-led interprofessional collaborative practice. VOICE of Nursing Leadership 13: 6–9
  5. Pronovost P, Berenholtz S, Dorman T, et al. (2003) Improving communication in the ICU using daily goals. J Crit Care 18: 71–75.
  6. O’Mahony S, Mazur E, Charney P, et al. (2007) Use of multidisciplinary rounds to simultaneously improve quality outcomes, enhance resident education, and shorten length of stay. J Gen Intern Med 22: 1073–1079.
  7. Cowan M, Shapiro M, Hays R, et al. (2006) The effect of a multidisciplinary hospitalist/physician and advanced practice nurse collaboration on hospital costs. J Nurs Adm 36: 79–85.
  8. Vazirani S, Hays RD, Shapiro MF, et al. (2005) Effect of a multidisciplinary intervention on communication and collaboration among physicians and nurses. Am J Crit Care 14: 71–77
  9. Dowd BE, Greene WH, Norton EC (2014) Computation of Standard Errors. Health Serv Res 49: 731–750.
  10. Elixhauser A, Steiner C, Harris DR, Coffey RM (1998) Comorbidity measures for use with administrative data. Med Care 36: 8–27.
  11. Volpp KG, Small DS, Romano PS (2013) Teaching hospital five-year mortality trends in the wake of duty hour reforms. J Gen Intern Med 28: 1048–1055.
  12. Bilimoria KY, Chung J, Ju MH, et al. (2013) Evaluation of surveillance bias and the validity of the venous thromboembolism quality measure. JAMA 310: 1482–1489.
  13. Bosch M, Faber M, Cruijsberg J, et al. (2009) Effectiveness of patient care teams and the role of clinical expertise and coordination: a literature review. Med Care Res Rev 66: 5S-35S.
  14. Pannick S, Davis R, Ashrafian H, Byrne BE, Beveridge I, et al (2015) Effects of Interdisciplinary Team Care Interventions on General Medical Wards: A Systematic Review. JAMA Intern Med. 175: 1288–98.
  15. Kara A, Johnson C, Nicely A, Neimeier MR, Hui SL (2015) Redesigning inpatient care: Testing the effectiveness of an Accountable Care Team model. Journal of Hospital Medicine 10: 773–779.
  16. O’Leary KJ, Wayne DB, Landler MP, et al. (2009) Impact of localizing physicians to hospital units on nurse-physician communication and agreement on the plan of care. J Gen Intern Med 24: 1223–1227.

Evaluation of a Direct Oral Anticoagulant Stewardship Program: Analysis of a Drug Consult Review Process and Population-Based Management Tool

DOI: 10.31038/JCCP.2019221

Abstract

Background: With the approval of Direct Oral Anticoagulants (DOAC), anticoagulation management has been transformed in both stroke prevention and venous thromboembolism prophylaxis and treatment. Despite evidence-based dosing guidance there has been large variation in prescribing practices that may lead to negative outcomes. The purpose of this two-part study is to evaluate the impact of a DOAC stewardship program on appropriate DOAC prescribing and use.

Methods: Patients were included in part one of the study if they were prescribed initial DOAC therapy from October 15, 2017 – October 15, 2018 with either a general or DOAC specific drug consult. A manual chart review was then conducted for data points including: anticoagulation indication, DOAC dose, serum creatinine, weight, age, consult approval or denial, and reasons for denial. Part two of the study included patients identified through a VA Population-Based Management Tool (PBMT) from January 1, 2018 – September 30, 2018. A manual chart review was then conducted for data points including: flag category, interventions made, and interventions accepted. Patients were excluded in both arms of the study if the duration of DOAC therapy was less than 20 days, incomplete chart review, or if DOAC therapy was prescribed by a non-VA provider.

Results: A total of 592 consults were included in the final analysis in part one of the study. Of the 233 general consults evaluated, 212 (91.0%) were deemed appropriate, 15 (6.4%) inappropriate, and 6 (2.6%) as clinical grey areas. Of the 233 DOAC specific drug consults evaluated, 218 (93.6%) were deemed appropriate, 1 (0.4%) inappropriate, and 14 (6.0%) as clinical grey areas. There was a significant difference in consults worked inappropriately (p=0.0004). A total of 317 PBMT interventions were included in the final analysis in part two of the study. Of those interventions that were actively acknowledged, 233 (95.9%) interventions were completed.

Conclusion: Implementation of a DOAC stewardship program in a healthcare system promotes appropriate and optimal use as well as safety monitoring of DOACs. A drug-specific consult review process improves inappropriate approval or denial of DOAC therapy while the utilization of a population-based management tool efficiently identifies critically important interventions necessary to ensure safe and appropriate use of DOACs.

Introduction

Two disease states that often require anticoagulation for either prophylaxis or treatment are nonvalvular atrial fibrillation (AF) and venous thromboembolism (VTE). Until recently, the primary option for oral anticoagulation was warfarin, a vitamin K antagonist. In 2010, the first Direct Oral Anticoagulant (DOAC), dabigatran, was FDA approved and since then, other DOACs have received FDA approval within the United States (rivaroxaban, apixaban and edoxaban) [1–4]. With the approval of these agents, anticoagulation management has been transformed in both stroke prevention and VTE prophylaxis and treatment. DOACs require no routine lab monitoring to assess anticoagulation effect due to their favorable pharmacokinetic and pharmacodynamic profile when compared with warfarin. However, DOACs are still associated with serious bleeding risks and possess characteristics different from warfarin, including: renal elimination, short duration of action, different drug-drug interactions, administration considerations, and dosing based off of appropriate indication.

Despite evidence-based dosing guidance, there has been large variation in prescribing practices that may lead to negative outcomes. Steinberg and colleagues were the first to analyze the association between DOAC doses and clinical outcomes in patients with nonvalvular AF. Their study, through the ORBIT-AF II Registry, concluded that off-label doses of DOAC therapy for prevention of stroke in nonvalvular AF are associated with increased risk for adverse events [5]. In addition to prescribing practices, adherence to anticoagulants effects patient outcomes. Shore, et al assessed the adherence component of DOAC therapy by specifically studying patients on dabigatran in Veterans Affairs (VA) hospitals. Their study found that one-quarter of patients demonstrated sub-optimal adherence to dabigatran and poor adherence was associated with an increased risk for stroke and all-cause mortality [6]. Dreijer and colleagues determined 8.3% of medication errors from the hospital and primary care settings were caused from anticoagulation agents, with most error reports concerning the prescribing phase of the medication process [7]. With these results and common practices today, it is imperative that prescribers are aware of the need for oversight of DOAC prescribing. Additionally, studies have shown that a pharmacist driven monitoring program improves appropriate prescribing and monitoring of DOACs used for FDA approved indications. Miele, et al. revealed that appropriate prescribing of DOAC therapy was improved after implementing a pharmacist driven monitoring program through a pre- and post-intervention study. They found that 32.4% of doses administered in the pre-intervention group were considered inappropriate, compared to 13.8% in the post-intervention group. Appropriate prescribing included FDA approved indications and appropriate doses of DOAC therapy based on renal function [8].

Tennessee Valley Healthcare System (TVHS) has pioneered a DOAC stewardship program that includes a DOAC drug specific consult to ensure appropriate prescribing at initiation and then long-term surveillance of patients on DOAC therapy by an ongoing population-based management tool. The goal of this stewardship program is to improve appropriate DOAC utilizations by streamlining the initial DOAC consult process along with ongoing management by utilizing anticoagulation clinical pharmacy specialists (ACC CPS) and a DOAC population-based management tool (PBMT). Previously, DOAC therapy was approved through a generic drug consult review process evaluated by a general clinical pharmacy specialist (CPS). This created a lack of consistency between DOAC approval on a patient to patient basis. The newly developed drug consult review process utilizes both a DOAC drug specific consult along with an ACC CPS. TVHS hopes to improve DOAC utilization with regards to appropriate indication, dosing, and safety through a more specific format of DOAC approval. The DOAC PBMT is used within the VA system to allow for continuous review of safety and compliance parameters for optimal care of patients who are prescribed DOAC therapy. The management tool identifies eight flags including: appropriate dosing, valve replacement, notable labs, overdue labs, critical drug interactions, active Non-Steroidal Inflammatory Drug (NSAID) use, overdue refill greater than 4 weeks and renewal due in next 30 days. It is the responsibility of the ACC CPS to actively review the PBMT daily. Upon review, if a flag is present, the ACC CPS will document their assessment in the patient’s electronic medical record; therefore, notifying the provider of a recommendation or change regarding the patient’s current DOAC therapy. In this study, we will evaluate the impact of a DOAC stewardship program on DOAC utilization at TVHS.

Methods

This multi-site, single center, retrospective cohort study was conducted at TVHS, which includes sites in Nashville and Murfreesboro, TN, as well as patients enrolled at any of the healthcare system’s 13 Community Based Outpatient Clinics (CBOCs) throughout Middle Tennessee, southern Kentucky, and northern Georgia.

Patients were included in part one of the study if they had an active DOAC prescription from October 15, 2017 to October 15, 2018 and 18 years of age or greater. Patients were excluded if the prescription was prescribed for short term therapy (inpatient use only and traveling veterans), written by orthopedics, there was an incomplete data set, or if a consult was denied based on criteria for use (CFU). Patients were included in part two of the study if they had an active DOAC prescription from January 1, 2018 to September 30, 2018 with a note title “Anticoagulation Eval and Mgt Secure Messaging” in the electronic medical record indicating an ACC CPS intervention and 18 years of age or greater. Patients were excluded if the prescription was prescribed for short term therapy (inpatient use only and traveling veterans), if the note title was used in error or the patient relocated to a different VA system. The primary endpoint of this study is to determine the appropriate use of DOAC therapy through a drug consult review process. The secondary endpoints are to determine how the drug consult review process and the utilization of a population-based management tool influences safety outcomes of initial and ongoing DOAC therapy including, concomitant antiplatelet therapy in part one and the PBMT flag categories in part two.

Patients who were prescribed direct oral anticoagulation therapy from October 15, 2017 – October 15, 2018 were identified through data warehouse extraction. A manual chart review was conducted for data points including: anticoagulation indication, DOAC dose at time of consult submission, initial or renewal consult, documented labs, documented weight, consult approval or denial, and rational for approval or denial. Evaluated consults were then categorized as appropriate, inappropriate, or clinical grey areas (Appendix 1). Patients followed by the PBMT from March 24, 2018 to September 24, 2018 were identified through data warehouse extraction using the note title “Anticoagulation Eval & Mgt Secure Messaging.” A manual chart review was conducted for data points including the PBMT flag categories (Appendix 2), interventions actively acknowledged and interventions completed. The sample size was calculated based on the primary objective to determine appropriate use of DOAC therapy through a drug consult review process. The sample included all patients who meet study criteria that received DOAC therapy during the pre-determined timeframe. We wanted to see at least a 15% difference regarding the number of appropriate approvals/denials between the generalized and the specialized consult review process. Using these two data points, the effect size was found to be 15% with alpha set at 0.05 and beta set at 0.20. The study required 133 patients in each arm to be adequately powered. Chi square and fisher exact were used to calculate the p-value for the categorical data presented.

Results

Table 1 displays the baseline demographics and clinical characteristics of the two cohorts. The two groups did not different significantly with respect to age, gender, and race. However, there was a statistically significant difference found in use of rivaroxaban and dabigatran between the two cohorts. The authors attribute this difference to the delineated questions of the drug-specific consult. (Table 1)

Table 1. Baseline characteristics for the consult review process

Generalized Consult
n = 233 (%)

DOAC Specific Consult
n = 233 (%)

P-value

Age

Average ± SD

70.9 ± 11

69.9 ± 12

0.3489

Male sex – no. (%)

231 (99.1)

227 (97.4)

0.2848

Race or ethnic group – no. (%)

White

194 (83.3)

204 (87.5)

0.2375

Black or African American

20 (8.6)

17 (7.3)

0.7323

Asian

0

1 (<1)

1.0000

Native Hawaiian or Pacific Islander

0

0 (0)

1.0000

American Indian or Alaska Native

1 (<1)

1 (<1)

1.0000

Unknown

18 (7.7)

10 (4.3)

0.1715

Direct Oral Anticoagulant (DOAC) – no (%)

Apixaban

85 (36.5)

82 (35.2)

0.8468

Rivaroxaban

56 (24)

78 (33.5)

0.0316

Dabigatran

91 (39.1)

65 (27.9)

0.0141

Edoxaban

1 (<1)

3 (1.3)

0.6156

No preference

0 (0)

5 (2.1)

0.0721

Indication for Use

Nonvalvular atrial fibrillation

162 (69.5)

177 (76)

0.1452

Venous Thromboembolism (VTE)

64 (27.5)

46 (19.7)

0.0637

Other

7 (3)

10 (4.3)

0.6212

*Indication for Use – “other” includes non-FDA approved indications

Part I: Drug consult review process

Primary Outcomes

Two thousand twenty-one unique patients were extracted from October 15, 2017 – October 15, 2018. Due to time constraints and sample size being met, after the initial data pull the date range was shortened to January 13, 2018 to July 13, 2018. All consults in the generalized cohort were evaluated (n=296) and consults in the specialized cohort were randomized to meet a matching sample size (n=296); therefore, a total of 592 DOAC consults were evaluated. In the generalized cohort, 233 consults were included for study evaluation with 63 excluded for various reasons (incomplete data set, orthopedic patients, denial based on CFU). In the specialized cohort, 233 consults for study evaluation with 63 excluded for various reasons (short term therapy, incomplete data set, orthopedic patient, denial based on CFU). Table 2 illustrates the number of evaluated consults deemed appropriate, inappropriate, and those classified as clinical grey areas. Of the 233 general consults worked, 212 were deemed appropriate, 15 inappropriate, and 6 as clinical grey areas. Of the 233 DOAC Specific Drug consults worked, 218 were deemed appropriate, 1 inappropriate, and 14 as clinical grey areas. Statistical significance was seen only in those consults worked inappropriately. (Table 2)

Table 2. Categorization of consult approval or denial

Process

Appropriate (%)

Inappropriate (%)

Clinical Grey Area (%)

Generalized (n=233)

212 (91)

15 (6.4)

6 (2.6)

Specialized (n=233)

218 (93.6)

1 (0.4)

14 (6)

P values

0.3859

0.0004

0.1075

Of the 15 consults worked inappropriately in the generalized process, inappropriate interventions identified included: non-FDA approved dosing, critical drug-drug interactions, non-FDA approved indications, no indication provided, and hepatic dysfunction. The one consult worked inappropriately in the specialized process, the inappropriate intervention identified was non-FDA approved dosing.

Secondary Outcomes

There were no interventions made in the generalized consult review process regarding concomitant antiplatelet use, however there were 29 recommendations made to either discontinue the P2Y12 inhibitor or discontinue/decrease the dose of aspirin in the DOAC specific consult process. Of the 29 recommendation that were made, 13 (45%) recommendations were completed, specifically 9 (69%) were discontinued and 4 (31%) doses were decreased.

Part II: Population Based Management Tool

One thousand fourteen notes with the title “Anticoagulation Eval and Mgt Secure Messaging” were extracted from March 24, 2018 to September 24, 2018 and randomized using Microsoft excel. Three hundred four notes were evaluated to collect the pertinent information as noted above in the “data collection” section. Two-hundred ninety-two notes were included as 12 notes were excluded for various reasons (orthopedic patient, use of wrong note title, relocation to another VA and no active DOAC prescription). Of the 292 notes that were evaluated, 267 notes only included interventions made on one flag, where as 25 notes included interventions on 2 flags resulting in a total of 317 interventions made.

Table 3 displays the number of interventions made regarding the flag category specified by the population-based management tool. By far, the intervention that was made most commonly was alerting the provider that the prescription needed to be renewed (30%), followed by overdue refill > 4 weeks (22%), overdue labs (15%) and inappropriate dosing (11%). From the 317 interventions that were made 242 (76.7%) interventions were actively acknowledged. Of those that were actively acknowledged, 233 (95.9%) interventions were completed (meaning a medication was renewed, refilled, labs were ordered, medications changed, etc.) with specific percentages regarding each flag noted in table 4. (Table 3, Table 4)

Table 3. Interventions made via the population-based management tool

Interventions made
n = 317 (%)

Overdue labs

49 (15)

Notable labs

19 (6)

Active NSAID use

35 (11)

Overdue refill > 4 weeks

69 (22)

Dosing

39 (12)

Critical drug-drug interactions

11 (3)

Valve replacement

1 (0.33)

Renewal due

95 (30)

P2Y12i use

2 (0.66)

Table 4. Interventions actively acknowledged and completed

Interventions actively acknowledged
n = 243

Interventions completed n = 233

Percent completed based on those actively acknowledge

Overdue labs

28

27

96.4%

Notable labs

12

10

83.3%

Active NSAID use

21

16

76.1%

Overdue refill > 4 weeks

53

52

98.1%

Dosing

31

24

77.4%

Critical drug-drug interactions

9

7

77.8%

Valve replacement

1

0

0%

Renewal due

87

87

100%

P2Y12i use

1

0

0%

Discussion

As the anticoagulation paradigm begins to shift from warfarin to DOAC therapy, the use of these medications should still be managed and monitored carefully to prevent unwanted harm. To our knowledge, this is the one of the first studies analyzing the implementation of an ACC CPS run DOAC stewardship program that includes a drug-specific consult and a continuous PBMT evaluated by ACC CPS. When using a generalized consult review process, more consults were deemed to be evaluated inappropriately compared to a specialized consult review process. The generalized process included a consult with minimal requirements for completion (drug, dose, and reason why patient was not candidate for preferred formulary agent, dabigatran) and was then reviewed by a general clinical pharmacy specialist. With the implementation of a DOAC stewardship program, a drug-specific consult was created and is now reviewed by an ACC CPS. For completion, the drug-specific consult must include: drug, dose, indication (as well as details associated with indication), appropriate baseline labs (Hgb/Hct, SCr, AST/ALT), bleeding history, antiplatelet use, NSAID use, and use of pillbox.

The results of this study are consistent with previous studies finding that implementing a pharmacist driven monitoring program reduced inappropriate prescribing of DOAC therapy in adult patients with an indication for nonvalvular AF and/or VTE prophylaxis and treatment [8]. In our study, the following inappropriate uses of DOAC therapy were identified: non-FDA approved indications (apical thrombus, cryptogenic stroke), critical drug-drug interaction (strong CYP3A4 and P-glycoprotein inducers), non-FDA approved dosing (lead-in dosing provided for AF, subtherapeutic use of apixaban, use of apixaban with CrCl75 years old or declining renal function, denial of dabigatran due to use of pillbox, and use of rivaroxaban for ease of compliance. By utilizing the PBMT, our study illustrates that continuous monitoring of DOAC therapy is necessary as patient’s clinical status has the potential to change while on DOAC therapy. The authors attribute the one-fourth of interventions not actively acknowledge as due to the lack of education provided to prescribers prior to the implementation of the DOAC stewardship program. However, almost 96% of the interventions that were actively acknowledge were completed, showing the importance of additional surveillance methods rather than relying on prescriber chart reviews. Moving forward, the authors plan to provide educational sessions to prescribers regarding the importance of the PBMT hoping to eliminate alert fatigue and engage providers in the ongoing efforts of the DOAC stewardship program.

There are a few limitations of this study to consider. First, when categorizing the evaluated consults, clinical grey areas have the potential to differ depending on the consult reviewer’s clinical interpretation of current literature. Second, throughout data collection, four reviewers were trained based on the derived protocol; however, due to the abundant number of unique patients and charts to be reviewed data could have been assessed differently between reviewers. Impacts of this study support the need for a DOAC stewardship program in a healthcare system to promote appropriate and optimal use as well as safety monitoring of DOACs. A drug-specific consult review process improves inappropriate approval or denial of DOAC therapy while the utilization of a PBMT efficiently identifies critically important interventions necessary to ensure safe and appropriate use of DOACs.

Appendix 1: Clinical Grey Areas

  • Use of apixaban due to age >75 years old
  • Denial of dabigatran due to use of pillbox
  • LV Thrombus (if failed or cannot take warfarin)
  • Weight (>120kg)
  • Labs not collected within 90 days
  • Use of DOAC versus heparin or enoxaparin for lead-in for treatment of VTE
  • Non-FDA approved use of DOACs per Landmark Clinical Trials
  • CrCl 15–25 mL/min for use of apixaban in A. Fib
  • CrCl 15–30 mL/min for use of rivaroxaban in A. Fib

Appendix 2: Population-Based Management Tool (PBMT) Flags

  • Overdue labs
    • Results include all patients where either their most recent hemoglobin OR most recent platelet OR most recent serum creatinine is overdue per patient’s monitoring frequency
    • Monitoring frequency defaults to 12 months for all labs except 6 months for serum creatinine for patients that are 75 years of age or more and/or have a CrCl of less than 60 mL/min
    • Once the overdue lab(s) are resulted (once daily in the morning) the patient will no longer appear in this column. In addition, after review of the patient, monitoring frequency (for serum creatinine) can be reset to 2 weeks, 1, 3, 6 or 12 months as determined clinically appropriate
  • Notable labs
    • Most recent platelets <100 x 109 /L if the second most recent value was above 100 x 109 /L OR any platelet value < 50 × 109 /L OR hemoglobin < 10 g/dL or AST/ALT > 135/120 U/L OR a hemoglobin drop > 2 g/dL since previous hemoglobin with resultant value < 13.1 g/dL for males and <11.0 g/dL for females
  • Active NSAID use
    • Patients with an active non-aspirin NSAID based on VA Drug Class MS101 and MS102
    • Active includes prescriptions with status ‘ACTIVE’, ‘SUSPENDED’, ‘PROVIDER HOLD’, ‘HOLD’, ‘PENDING’
    • This will include non-VA prescriptions
  • Valve replacement
    • Results include all patients with an ICD code for a prosthetic (bioprosthetic or mechanical) heart valve on their problem list, attached to two outpatient visits within the last 2 years, or as inpatient discharge diagnosis within the last two years
  • Dosing flag
    • Results include all patients whose renal function (by Cockcroft-Gault with actual body weight) falls above or below specified cutoffs based on agent, indication and if applicable selected drug interactions as per FDA approved package inserts
    • Results also include patients whose dose does not appear to match indication and duration or other non-renal dose modifying characteristics (e.g. high dose apixaban for PE/DVT > 6 months, low dose apixaban for PE/DVT within first 6 months, dose/indication mismatch based on age and body weight)
  • Overdue refill > 4 weeks
    • Results include patients for whom it has been more than 4 weeks since their day supply would be expected to run out (based on released date plus one additional week to allow for shipment)
    • Renewal due in next 30 days
    • Patients for whom the ordered days supply is scheduled to expire within the next 30 days
  • P2Y12i use
    • Antiplatelet therapy includes aspirin, clopidogrel (Plavix ®), ticagrelor (Brilinta®), prasugrel (Effient ®)
    • Critical drug-drug interactions

DOAC

Drug Interactions

Dabigatran

Flag if active warfarin, apixaban, edoxaban, rivaroxaban, rifampin, primidone, St. John’s Wort, phenobarbital, carbamazepime, phenytoin, dronedarone, cyclosporine, tacrolimus, itraconazole, ketoconazole, pasaconazole, voriconazole, rifampicin, saquinavir, ritonavir, indinavir, nelfinavir, amprenavir, lopinavir, fosamprenavir, atazanavir, tipranavir or darunavir

Rivaroxaban

Flag if active warfarin, apixaban, edoxaban, dabigatran, rifampin, primidone, phenobarbital, carbamazepime, phenytoin, itraconazole, ketoconazole, pasaconazole, voriconazole, rifampicin, saquinavir, ritonavir, indinavir, nelfinavir, amprenavir, lopinavir, fosamprenavir, atazanavir, tipranavir, darunavir or St. John’s Wort

Edoxaban

Flag if active warfarin, apixaban, rivaroxaban, dabigatran, rifampin, primidone, phenobarbital, carbamazepime, phenytoin, rifampicin, saquinavir, ritonavir, indinavir, nelfinavir, amprenavir, lopinavir, fosamprenavir, atazanavir, tipranavir, darunavir or St. John’s Wort

Apixaban

Flag if active warfarin, rivaroxaban, edoxaban, dabigatran, rifampin, primidone, phenobarbital, carbamazepime, phenytoin, itraconazole, ketoconazole, pasaconazole, voriconazole, rifampicin, saquinavir, ritonavir, indinavir, nelfinavir, amprenavir, lopinavir, fosamprenavir, atazanavir, tipranavir, darunavir or St. John’s Wort

  • Other critical drug interactions
  • Active cancer pharmacotherapy
  • Flag if: active VA cancer pharmacotherapy in a patient with diagnosis of DVT/PE ± atrial fibrillation or atrial flutter
  • Active includes prescriptions with status ‘ACTIVE’, ‘SUSPENDED’, ‘PROVIDER HOLD’, ‘HOLD’, ‘PENDING’ for any of the interacting drugs or cancer pharmacotherapy
  • Non-VA medications will be included in the analysis for critical drug-drug interactions. Patients with non-VA DOAC prescriptions will not be identified by this tool

References

  1. Eliquis [package insert]. New York, NY: Pfizer Pharmaceuticals, Inc; 2012.
  2. Xarelto [package insert]. Titusville, NJ: Janssen Pharmaceuticals, Inc; 2011.
  3. Pradaxa [package insert]. Ridgefield, CT. Boehringer Ingelheim Pharmaceuticals, Inc; 2011.
  4. Savaysa [package insert]. Tokyo, Japan. Daiichi Sankyo Company, Limited; 2017.
  5. Steinberg B, Shrader P, Thomas L, Ansell J, Fonarow GC, et al. (2016) Off-label dosing of non-vitamin K antagonist oral anticoagulants and adverse outcomes, The ORBIT-AF II Registry. JACC 68: 2597–2604.
  6. Shore S, Carey E, Turakhia M, Jackevicius CA, Cunningham F, et al. (2014) Aherence to dabigatran therapy and longitudinal patient outcomes: insights from the Veterans Health Administration. Am Heart J 167: 810–817.
  7. Dreijer AR, Diepstraten J, Bukkems VE, Mol PGM, Leebeek FWG, et al. (2019) Anticoagulant medication errors in hospitals and primary care: a cross-sectional study. Int J Qual Health Care 31: 346–352.
  8. Miele C, Taylor M, Shah A (2017) Assessment of direct oral anticoagulant prescribing and monitoring pre- and post-implementation of a pharmacy protocol at a community teaching hospital. Hosp Pharm 52: 207–213.

Water Heating By Solar Tile

DOI: 10.31038/NAMS.2019245

Introduction

The paper deals with the use of combination solar tiles-heat pump for domestic water heating. The paper presents testing of solar tile-heat pump combination. Black-coloured water which absorbs solar radiation flows through solar tiles made of transparent polymethyl methacrylate CH2C(CH3)COOCH3. At the same time, solar tiles are used as a roof covering and as a solar radiation collector. Hot water from solar tiles is led to the heat pump, which increases the temperature of water entering the boiler heating coil. The heat of water heated in solar tiles serves as a source of anergy for the heat pump. On that way Coefficient of Performance (COP) of heat pump is increased. Since we wanted to evaluate realistically the efficiency of combimation solar tiles-heat pump, we carried out extensive tests. The experiments were carried out in rainy, cloudy and clear weather.

Test rig

Conventionally, all types of collectors and heat pumps are used separately. In the paper, it is a suggestion to join both systems in a serial connection. Heated water that is coming from the solar tiles is led directly into the input side of a heat pump to gain the higher temperatures. This serial connection should ensure higher temperatures of heating as each heating system works independently.

To verify the effectiveness of the serial connection solar tiles – heat pump, a convenient test rig was built. Measurements of suitable quantities were carried out and analyzed. The test rig consists of a solar tiles, water-water heat pump, and boiler.

The tests were carried under various weather conditions in the summer and winter seasons. Inlet and outlet temperatures from the flat plate collector and heat pump were measured, as well as the ambient air temperature and the water temperature in the boiler.

Figure 1a shows a measurement diagram and Figure 1b the installation of solar tiles. The surface area of tiles was 2 m2. On the lower side, the tiles were insulated, resulting in a decrease by half of the contact surface of the air with the tiles in the case of cloudy weather and darkness, when convective heat transfer prevails. The insulation is appropriate when heat is generated from the radiant part of the heat transfer. The water/water heat pump had thermal power of 1.5 kW under standard conditions and it heated a 300 l boiler. The measured parameters included:

NAMS-2019_Milan Marčič_F1

Figure 1. a) Measurement diagram, b) Installation of solar tiles

  • outlet water temperature from a solar tile (T1);
  • boiler water temperature (T2);
  • inlet water temperature to a solar tile (T3);
  • outlet water temperature from a heat pump (T4);
  • inlet water temperature to a heat pump (T5);
  • ambient air temperature (T6);
  • water flow (Q).

Tests results

The measurements shown in Figure 2 were made in clear sunny and totally cloudy weather. The difference between temperatures T1 (outlet water temperature from a solar tile) and T6 (ambient air temperature) was as high as 20 °C. Between 13:00 and 15:30, it was totally cloudy, which is why the T1-T6 difference dropped to 0 °C. At 15:30, the sky was fully cleared and the temperature difference increased again to 8 °C. From an energy point of view, the solar tile-heat pump combination is certainly the best solution in clear weather for heating of residential  houses and domestic water.

NAMS-2019_Milan Marčič_F2

Figure 2. Temperature measurements – Weather: sunny and windy

References

  1. Dubey S and Tiwari GN (2009) Analysis of PV/T flat plate water collectors connected in series. Solar Energy 83: 1485–1498.
  2. Haložan H (2000) Heat-Pumping Technologies, Journal of Mechanical Engineering. 46: 2000: 445–453.

The social inequity across the smoking social costs

DOI: 10.31038/ASMHS.2019355

Abstract

Introduction: Tobacco consumption is a demonstrated cause of growing in morbidity and mortality between smokers. Because of that it influence hardly since the social and the economic context because of smoking social costs. Consequently these costs are determining a particular inequity according to the smoking impact.

Objective: To describe the main economics characteristics that identify to smoking like inequity cause.

Materials and methods was made a descriptive research about the main characteristics that identify to smoking as social inequity cause. Were utilized the inductive deductive like theoretical method and like empiric was utilized the bibliographic research.

Results: The inequity attributable to smoking is given by the social cost attributable to it. The direct cots by morbidity determine a socio epidemiologic inequity while the indirect cost by labor productivity loses condition a socio labor inequity. Both costs are determining a contextualized form of socioeconomic inequity.

Conclusion:The economic burden attributable to smoking is a main measurer for the socioeconomic inequity attributable to smoking. The indirect costs attributable to smoking are given mainly by labor productivity lose attributable to smoking. In these cases the labor time lose in each context is a main measurer for the social inequity attributable to smoking by this way.

Keywords

Cost, Inequity, Smoking

Introduction

Smoking is an accumulative, modifiable and socioeconomic risk factor. These classifications are a strong base to understand by the society and the fiscal authority particularly about smoking to control it. That’s why the analysis about smoking cost by cost type will contribute to apply more efficient fiscal policies for the smoking control [1]. Like socioeconomic risk factor smoking have two main variables given by the smoker number and the tobacco consumption. Then, the relation saved by these variables explicates the smoking behavior too [2]. The single variation in both carries to smoking variation in the same way. Consequently the smoking social costs are in direct relation to these variables and the smoking social inequity too. As consequence of the tobacco growing it produces high social cost irreversible at short time. These costs overcharge to no smokers and thus born the smoking social inequity. The smoking social inequity form will depend from the smoking impact over the population researched but generally is possible to determine an economic cost because of the smoking social inequity too [3]. The most evident case is the passive smokers who are exposed to tobacco smoke and because of that suffers the smoking consequences agree to the exposition rate. Then, each form to measure the smoking social inequity must include these main variables and must be agree to the smoking particularities too [4].

Social inequity across smoking social cost

Tobacco consumptions carry to health disequilibrium. This is because the smoking social impact over the health population and the real health services too. This disequilibrium determines the smoking social inequity by smoking direct cost [5]. Smoking like socioeconomic risk factor is close related with poorness and the human develop. WHO had pointed the close relation between tobacco consumption and the health services demand and the economic development because of labor productivity lose too. These are the bases for the smoking social inequity by labor productivity loses attributable to smoking [5, 6]. These arguments show how important is understand the smoking social inequity like untouchable smoking impact. That’s why the objective of this research is to describe the main characteristic that identify to smoking as social inequity cause.

Materials and methods

Was made a descriptive research about the main characteristics that identify to smoking as social inequity cause. Were utilized the inductive deductive like theorical method and like empiric was utilized the bibliographic research.

Results

The social inequity because of smoking is given by the disparities in the society because of the smoking social costs. The most important social cost attributable to smoking are the direct smoking cost related with morbidity and the health services and the indirect smoking cost related with the labor productivity lose related with morbidity and mortality because of smoking. Each of them has particular forms of social inequity attributable to smoking [6].

Inequity attributable to smoking in the consumption of health services

A significant part of the health budget is utilized attending morbidities causes attributable to smoking. Then, the no existence of smoking should mean an important social save that could able for other social objectives [7]. This disparity is given by the smoking impact over active and passive smokers. This social impact it shows by the effective demand of health services because of smoking, the smokers’ number and the morbidity attributable to smoking. That is why the economic burden is a main measurer rate for the social inequity attributable to smoking for the Public Health [7].

Socio-epidemiologic and socioeconomic social inequity across the direct social attributable to smoking

To understand the social inequity attributable to smoking since the direct social costs is necessary to difference between epidemiologic burden and economic burden attributable to smoking [8, 9]. The epidemiologic burden is given by the morbidity attributable to smoking like risk factor and represents the morbidity probability´s attributable to smoking. By other side the economic burden is given by the effective demand of health services attributable to smoking. It is equivalent to the health spend probability´s attributable to smoking [8, 9]. The morbidity attributable to smoking creates disparities in the incidence of morbidity causes related with smoking. This disparities are given by the smoking impact over the health and it show in the differences between smokers morbidity and no smokers morbidity. This type of disparity explicates the socio-epidemiologic inequity attributable to smoking, where the epidemiologic burden is the main explicative variable [8, 9]. The morbidity attributable to smoking carries to disparities accessing to the health services too. These disparities should be external or internal. The external are given by the exclusion of consumer from the health services market while the internal are given by the redistribution in the health services accessing attributable to smoking. These are the main socioeconomic inequities attributable to smoking across the direct social costs attributable to smoking.

Socio-labor and socioeconomic inequity because of the labor productivity lose attributable to smoking

The labor productivity lose attributable to smoking can be absolute or relative. The absolute is related with earlier death because of smoking while the relative is associated to the morbidity attributable to smoking [10]. The earlier death of smoker reduces the life expectative and this is an important social inequity given by the difference in life expectation between smokers and no smokers because of smoking. Also, is smoker death occur before retire age is present a socio-labor inequity because of the potential work time lose because of smoking and a socioeconomic inequity because of all economic benefits no obtained because of smoking given by the smoker earlier death [11]. The relative labor lose attributable to smoking can be by touchable absenteeism or untouchable absenteeism. The touchable absenteeism occur when the smoker worker isn´t physically present at workplace because of the morbidity attributable to smoking while the untouchable absenteeism occur when the smoker worker use part from the labor time to smoke although keep physically at workplace [10–12]. Each labor productivity lose will depend from the specific characteristic of the smoking impact. In general way can be identified two main social inequity form because of labor productivity lose attributable to smoking: a socio-labor inequity and a socioeconomic inequity. The socio-labor inequity is determined by the potential labor time lose because of smoking and the socioeconomic inequity is determined by all economic costs related to each social inequity form attributable to smoking by labor productivity lose. In general way, understand the social inequity attributable to smoking by all causes may adopt better social policies agree with the particular smoking impact. That’s why the smoking control is interesting for all societies but specially for the fiscal authorities [13, 14].

Conclusion

The smoking social costs are the best measure rate for the smoking social inequity. The direct social costs by morbidity determine the socio-epidemiologic and the socioeconomic inequity attributable to smoking by this way. In this case the epidemiologic burden and the economic burden are the main rate to explain the social inequity attributable to smoking by the smoking direct costs. By other side, smoking social costs by labor productivity lose attributable to smoking determine the socio-labor inequity and the socioeconomic inequity because of labor productivity lose attributable to smoking. In this case the potential labor time lose determines this social inequity.

References

  1. Toledo Curbelo GJ (2008) Fundamentos de Salud Pública. Segunda edición.  Pág La Habana: Ciencias Médicas Pg No: 184–186.
  2. Fernández Hernández F, Sánchez González E (2018) Algorithm to calculate the smoking economical burden in active and passive smokers. MOJ Toxicol 4: 373–375.
  3. Fernández Hernández F, Sánchez González E (2019) La carga económica del tabaquismo. España: Editorial Académica Española.
  4. Varona Pérez P, García Roche G, Willams Fogarty A, Britton J (2015) Mortalidad por cáncer de pulmón y cardiopatía isquémica atribuible al tabaquismo pasivo en Cuba – 2011. Rev Cubana HigEpidemiol 53.  Disponible en: http://www.revepidemiologia.sld.cu/index.php/hie/article/view/55.
  5. Fernández Hernández F, Sánchez González E (2019) Economic Inequity Attributable to Smoking Ratio’s for the Public Health. Health Econ Outcome Re Open Access 4: 161.
  6. Fernández Hernández F, Sánchez González E (2019) The socioeconomic inequity attributable to smoking.  Journal of Medical Practice and Review 3: 559–562. Disponible en http://jmpr.info/index.php/jmpr/index,
  7. Fernández Hernández F, Sánchez González E (2017) Impacto del tabaquismo en el presupuesto sanitario de Cuba 1997–2014. Revista del Hospital Psiquiátrico de La Habana 14. Disponible en: http://revhph.sld.cu/index.php/hph/article/view/31.
  8. Sánchez González E, Fernández Hernández F (2019) A view for the morbidity attributable to smoking since the microeconomic. Trends in Research 2: 1–2.
  9. Fernández Hernández F, Sánchez González E (2017) Carga epidemiológica vs carga económica del tabaquismo por morbilidad. Rev Ciencias Médicas 21: 60–66. Disponible en: http://scieloprueba.sld.cu/scielo.php?script=sci_arttext&pid=S1561-31942017000200009&lng=es,
  10. Sánchez González E, Fernández Hernández F (2016) La pérdida de productividad laboral atribuible al tabaquismo. Revista Cubana de Salud y Trabajo17: 57–60.
  11. Sánchez González E, Fernández Hernández F (2018) Costo social por pérdida absoluta de productividad laboral. Revista Cubana de Salud y Trabajo 19: 33–39.
  12. Fernández Hernández F, Sánchez González E (2017) Pérdida de productividad por el consumo de cigarrillos en la jornada laboral. Revista Cubana de Salud y Trabajo 18: 9–12.
  13. Sánchez González E, Fernández Hernández F (2018) La relación entre la política tributaria y el control del tabaquismo en Cuba. CCM 22: 238–249. Disponible en: http://scieloprueba.sld.cu/scielo.php?script=sci_arttext&pid=S1560-43812018000200005&lng=es.
  14. Sánchez González E, Fernández Hernández F (2017) El rol de las autoridades fiscales en el control del tabaquismo. Rev Ciencias Médicas 21: 62–67. Disponible en: http://scielo.sld.cu/scielo.php?script=sci_arttext&pid=S1561-31942017000300010&lng=es.

GPs should actively ask about Symptoms of Urinary or Faecal Incontinence in Ageing Female Patients

DOI: 10.31038/AWHC.2019264

Abstract

Objectives: To investigate how common incontinence problem is and how it could be detected in an unselected population.

Methods: Cross-sectional study in primary care population. A population survey of women born in 1948 or 1950 and living in a municipality with 19,535 inhabitants in south-western Finland in 2017. Main outcome measures were incidence of urinary or faecal incontinence.

Results: After analyzing the questionnaires and research findings, we found that urinary incontinence is a common phenomenon, reported by 50.3% of participants. According to the Urinary Incontinence Severity Score (UISS), 12.7% of them believed that the degree of disability was remarkable, and according to the Visual Analogue Scale (VAS), 18.3% considered the degree of disability to be difficult. In this study obesity was the most common feature affecting urinary incontinence.

Conclusion: Urinary incontinence is a common problem and will increase as the population ages. It can deteriorate a person’s quality of life, increase her need of care and involve considerable costs. Preventing the problem and treating it as early as possible in primary health-care is both reasonable and saves time and money.

Keywords

Conservative Treatment, Lifestyle, Medication, Quality of life, Urinary incontinence

Key message

Urinary incontinence is a common problem in the ageing female population. Many women are ashamed of their incontinence and do not even mention it during the GP’s consultation. Preventing the problem and treating it as early as possible in primary healthcare is important.

Introduction

The ageing of the population has changed morbidity rates. Part of this change can be explained by lifestyle, but part is connected only to ageing. Furthermore, some of the changes can impair one’s health related quality of life. Urinary or faecal incontinence affects many women. Based on a broad population survey, Norwegian researchers estimate that the prevalence of incontinence problems is about 25%. Estimating the extent of the problem is difficult due to the embarrassment connected with incontinence. Furthermore, diverse definitions of incontinence may complicate the estimation. According to the survey, 25% of participants experienced inconvenience that lessened their quality of life while 7% had significant incontinence problems. These women should be regarded as potential patients. Those with fewer problems should be offered information and advice on self-care [1]. Traditional predisposing factors for incontinence include ageing, childbearing, obesity and menopause [2]. Examples of lifestyle factors possibly associated with incontinence include smoking and a low level of physical activity [3]. Norwegian researchers have also found a strong association between diabetes and urinary incontinence, especially for urge incontinence and a severe degree of incontinence [4]. Many drugs can also cause incontinence, such as diuretics, cholinergics, sedatives or combinations of drugs.This pilot study aims to investigate how women needing medical treatment for their symptoms of incontinence might be detected in an unselected population. According to researchers, urinary incontinence may improve considerably through conservative treatment in general practice [5], and therefore it is important to find easy and cost-effective methods to relieve women’s symptoms.

Methods

Selection of study subjects

Information for women born in 1948 or 1950 and living in a municipality with 19,535 inhabitants (as of 31.8.2017) in south-western Finland was obtained from the Population Register Centre. The researchers mailed an information letter about the study and a consent form with a return envelope to all women in these age groups. Those who accepted the invitation and provided informed consent received questionnaires about pelvic-floor symptoms and were scheduled for an appointment during consulting hours at the gynaecological clinic of Turku University Hospital.

Questionnaires and measurements

Sociodemographic data including date of birth, marital status, education and occupation, were collected. Marital status was coded as solitary (single, divorced, widowed) or in a relationship (married, cohabiting). The participants were asked about smoking, alcohol use and medication (including systemic or local hormone treatment). Also, inquiries were made about parity and possible diseases. Height and weight were measured, and body-mass index (BMI) was calculated. BMIs were classified according to WHO criteria [6]. A trained research nurse measured blood pressure and checked the questionnaires with the examinees. Symptoms related to incontinence and their degrees of inconvenience were retrieved from the following validated questionnaires: the Urogenital Distress Inventory(UDI-6) [7], the Incontinence Impact Questionnaire (IIQ-7) [7], the Urinary Incontinence Severity Score (UISS) [8] and the Detrusor Instability Score (DIS) [9]. Quality of life was classified according to the Finnish 15-dimensional measure of health-related quality of life questionnaire (15D) [10]. We classified the results of UISS as follows: <25% indicated slight disability, 25–75% indicated clear disability and >75% indicated remarkable disability. The degree of disability with regard to incontinence was also evaluated using the Visual Analogue Scale (VAS) (10), with the degree of disability being classified from 0 to 10. We considered values 0–2 as insignificant disability, values 3–5 as remarkable disability and values 6–10 as difficult disability. A gynaecologist examined all participants and gynaecological vaginal ultrasound was performed. The cough stress test was performed with a comfortably filled bladder. In addition, general muscle condition was evaluated in this research according to the chair-stand 5 test. We used Finnish population norms for 60- to 69-year-old women. The norms are based on the Health 2000 health examination survey [11].

Statistical analysis

The research data were coded in Excel format without personal identifiers and statistical analyses were performed using the SPSS program. The data are presented as counts with percentages. Statistical comparisons of the baseline characteristics between groups were made by the χ² test. The significance level of P-values was set at 0.05.

Ethics

The research is registered with the Clinical Trials gov. ID: NCT02338726. The Ethics Committee of the Hospital District of Southwest Finland approved the study.

Results

The invitation to participate in the study was sent to 242 women, of whom 143 accepted, resulting in a participation rate of 59%. Urinary incontinence was a common phenomenon, with 72 women (50.3%) reporting that they suffered from it. The characteristics of the participants are presented in (Table 1). Faecal incontinence was suffered by 18 women (12.6%) and this had a correlation to urinary incontinence (P=0.013). According to the Finnish UISS questionnaire evaluating the degree of disability, 12.7% of the participants believed that the inconvenience of their incontinence was remarkable. One questionnaire of those that reported urinary incontinence was omitted because the answers were missing to all the questions concerning the subject at issue. According to the VAS, 41 participants (57.7%) who had reported having urinary incontinence believed that the inconvenience was insignificant, while 13 participants (18.3%) described the problem as difficult.

Table 1. Characteristics of the participants (n=143) in a population survey of Finnish women at menopause in order to detect urinary or faecal incontinence.

Women with urinary Incontinence
n = 72 (50.3%)

Women without urinary incontinence
n = 71 (49.7%)

P-value

Demographics

   solitary

19 (61.3%)

12 (38.7%)

0.17

   in a relationship

53 (47.3%)

59 (52.7%)

BMI

0.40

   normal weight

28 (46.7%)

32 (53.3%)

   overweight

25 (46.3%)

29 (53.7%)

   obese

12 (60.0%)

8   (40.0%)

   severely obese

5   (83.3%)

1   (16.7%)

   morbidly obese

1   (50.0%)

1   (50.0%)

Current smokers

9   (50.0%)

9   (50.0%)

0.98

Education

0.37

   comprehensive school

22 (47.8%)

24 (52.2%)

   vocational school

46 (54.1%)

39 (45.9%)

   college

RR systolic

   normal

   high

RR diastolic

   normal

   high

Parity

  nulliparous

  1–2parturitions

  3–5parturitions

4   (33.3%)

17 (54.8%)

55 (49.1%)

42 (49.4%)

30 (51.7%)

  5 (55.6%)

52 (53.1%)

15 (41.7%)

8   (66.7%)

14 (45.2%)

57 (50.9%)

43 (50.6%)

28 (48.3%)

  4 (44.4%)

46 (46.9%)

21 (58.3%)

0.57

0.79

0.48

Forty-two percent of the participants (n=60) were of normal weight. The combined proportion of obese, very obese or morbidly obese participants was 19.7% (n=28). Obese women reported significantly more severe urinary incontinence. In our data 4 from 60 women (8.2%) of normal weight and two from 54 overweight women (4.1%) believed that the inconvenience was extreme, while five obese women (31.3%) and two severely obese women (33.3%) estimated that the inconvenience was difficult (P=0.035). In the chair-stand 5 test measuring muscle strength, 69 women (50.0%) had a result that was better than average while 28 (20.3%) had a worse than average result. Muscle condition and urinary incontinence had no significant correlation in this population, and parity also had no influence on incontinence in this research. The number of current smokers was quite small and was equal in the group that suffered from incontinence and the group that did not, with nine (50%) found in each group. According to the AUDIT-C evaluation unhealthy alcohol use was rare. Only six women consumed more than five measures of alcohol per week which is estimated to be largest safe quantity for women [12]. Medications for hypertension, diabetes, hyperlipidaemia and thyroid insufficiency were the most commonly used: 29.6% of participants used no medication, and 54.9% used from one to four medications. No statistical correlation was found between urinary incontinence and multi-medication. The effects of hormone replacement therapy (HRT) on urinary incontinence was also studied. During the time of research, 49women (34.27%) used HRT: 26 of those women (53.06%) used vaginal oestrogen, 12 (24.49%) used systemic therapy and 11 (22.45%) used both. The use of any type of HRT did not have a statistically significant influence on urinary incontinence (P=0.81).

Discussion

This article aims to describe the problem of incontinence from the GP’s point of view. Urinary incontinence is known to be a common problem in the ageing female population. However, its assessment is complicated by the nature of the problem. Many women are ashamed of it and do not even mention their complaint if they are not asked about it during the GP’s consultation [13]. Even more hidden problem is faecal incontinence, which was quite rare in our material but was correlated to urinary incontinence. Participation rates in incontinence studies vary. In a large postal survey of 29,500 women in France, Germany, the United Kingdom and Spain, the response rate varied from 45–64% [14]. Strong evidential data suggest, however, the existence of a potentially high level of expressed but unmet need [15], so further research is needed to assess the knowledge and attitudes of primary-care staff [15]. The participation rate in our research was quite good. In a semi-urban population, such as ours, many women regularly visit their private gynaecologist and perhaps consequently might not want to participate in a study of this kind. However, better participation rates of 86% and 78% were reported in the Norwegian HUNT2 and EPINCONT studies, respectively, among women of corresponding age [1]. The complete HUNT 2 survey covered many topics, for example, mental health, cardiovascular diseases, asthma and urinary incontinence [1]. The EPINCONT study is part of a large survey (HUNT 2) where women answered a questionnaire concerning urinary incontinence [1]. The patients didn’t participate any clinical examination. The participants in our study were slightly more slender than the women in the FINRISKI 2012-study [16], but otherwise the participants were representative of the ordinary Finnish female population of corresponding age. The percentage of urinary incontinence problems was quite high in our material. This could be due to selection bias. Because we wanted to study urinary incontinence, it may be that women who suffered from the problem wanted especially to participate. On the other hand, the degree of problem can be considered quite insignificant in over half of the participants. Excess weight turned out to be a significant variable. According to international studies, obesity is the condition chiefly associated with urinary incontinence, and waist circumference is also a strong predictor for the incident of urinary incontinence [17]. Weight loss may be associated with improvement of the problem and also of the patient’s quality of life [18]. Public-health professionals should bring up the problem of incontinence when they are dealing with overweight and obese patients. People may feel that the risks of overweight are distant, particularly with regard to disease, but incontinence is often a practical concern and causes deterioration of health- related quality of life.

The benefits of sport for general health are well-known. Women should learn and practice exercises for the pelvic-floor muscles for the whole of their life, not only after giving birth. Overweight and diabetic women particularly, as well as pregnant women and those who exercise regularly for high-level athletics should remember the importance of training these muscles [19]. Although manual work is less common and working life has become easier, some occupations are still dominated by women. Lower urinary-tract symptoms are reported to be a significant concern among the female nursing workforce [20]. In our study, the participants were on average in good condition. Our research data offer much material for specialists, but the family doctor must remember the problem and ask about it. Initial diagnostic testing, such as the cough stress test, can be conducted by the general practitioner in addition to a gynaecological examination. However, this does not reveal women with an overactive bladder or urgency incontinence. There are helpful questionnaires available for this purpose. Patient education is the first step in the management of urinary incontinence. The patient can be sent to a physiotherapist for instructions in pelvic-floor muscle training. Anticholinergic medication or vaginal oestrogen therapy [21] can be initiated in general practice as well as mirabegron which is a beta-3-agonist and its efficiency on urge incontinence is like anticholinergics but side effects are different [22]. A simple questionnaire could be an easy and time-saving method for detecting patients with urinary incontinence who could be helped in primary healthcare. Correspondingly, there should be simple regional guidelines for referrals to specialist healthcare. In a recent Dutch study, it has been assumed that the prevalence and incidence of urinary incontinence will rise in an ageing population. It is therefore vital to address this problem in order to reduce it and improve the quality of life of the elderly and reduce the costs and time invested in healthcare [23]. Public health nurses play a key role in this work together with general practitioners. The weakness of our pilot study is the small size of the sample. On the other hand, the strengths of the study include the random group of population-based respondents, the fact that every participant was examined objectively and the fact that the questionnaires could be completed with the assistance of the research nurse when needed.

Conclusion

Urinary incontinence is a common problem, and it will increase with the ageing of the population, especially among those who have any other chronic problem. Urinary incontinence can lessen a person´s quality of life, increase her need of care and involve considerable costs. Preventing the problem and treating it as early as possible in primary healthcare is both reasonable and time and cost effective.

Funding support

Support was provided by Turku University Hospital EVO-funding and the Päivikki and Sakari Sohlberg Foundation.

References

  1. Hannestad Y, Rortveit G, Sandvik H, Hunskaar S (2000) A community-based epidemiological survey of female urinary incontinence: The Norwegian EPINCONT study.  J Clin Epidemiol 53: 1150–1157. [crossref]
  2. MacLennan A, Taylor A, Wilson DH, Wilson D (2000) The prevalence of pelvic floor disorders and their relationship to gender, age, parity and mode of delivery. BrJ Obstet Gynaecol 107: 1460–1470. [crossref]
  3. Hannestad YS, Rortveit G, Daltveit AK, Hunskaar S (2003) Are smoking and other lifestyle factors associated with female urinary incontinence? The Norwegian EPINCONT Study.  BrJ Obstet Gynaecol 110: 247–254. [crossref]
  4. Ebbesen M, Hannestad Y, Midthjell K, Hunskaar S (2007) Diabetes and urinary incontinence – prevalence data from Norway. Acta Obstet Gynecol Scand 86: 1256–1262. [crossref]
  5. Holtedahl K, Verelst M, Schiefloe A (1998) A population based, randomized, controlled trial of conservative treatment for urinary incontinence in women.  Acta Obstet Gynecol Scand 7: 671–7. [crossref]
  6. Global Database on Body Mass Index. BMI classification. WHO 2000.
  7. Uebersax J, Wyman J, Schumaker S, McClish DK, Fantl JA (1995) Short forms to assess life quality and symptom distress for urinary incontinence in women: the Incontinence Impact Questionnaire and the Urogenital Distress Inventory. Continence Program for Women Research Group. Neurourol Urodyn 14: 131–139. [crossref]
  8. Mäkinen J, Kujansuu E, Korhinen N, Penttinen J (1992) Evaluation and care of urinary incontinence in public health organisations. Finnish Medical Journal 47: 2372–2375.
  9. Kauppila A, Alavaikko P, Kujansuu E (1982) Detrusor instability score in the evaluation of stress urinary incontinence.  Acta Obstet Gynecol Scand 61: 137–141. [crossref]
  10. Stach-Lempinen B, Kujansuu E, Laippala P, Metsänoja R (2001) Visual analogue scale, urinary incontinence severity score and 15D-psychometric testing of three different health-related quality of life instruments for urinary incontinent women.  Scand J Urol Nephrol 35: 476–483. [crossref]
  11. Aromaa A, Koskinen S [2002] Health and functional capacity in Finland. Baseline results of the Health 2000 health examination survey. Publications of the National Public Health Institute. Helsinki 2002. The permanent address of the publication is
    http://urn.fi/URN:ISBN:951-740-262-7
  12. Kriston L, Hölzel L, Weiser AK, Berner M, Härter M (2008) Meta-Analysis: Are 3 Questions Enough to Detect Unhealthy Alcohol Use? Ann Intern Med 149: 879–888. [crossref]
  13. Shaw C, Das Gupta R, Bushnell D, Assassa P, Abrams P, et al. (2006) The extent and severity of urinary incontinence amongst women in UK GP waiting rooms. Fam Pract 23: 497–506. [crossref]
  14. Hunskaar S, Lose G, Sykes D, Voss S (2004) The prevalence of urinary incontinence in women in four European countries.  BJU Int 93: 324–330. [crossref]
  15. Shaw C, Das Gupta R, Williams K, Assassa P, McGrother C (2006) A survey of help-seeking and treatment provision in women with stress urinary incontinence. BJU Int 97: 752–757. [crossref]
  16. Männistö S, Laatikainen T, Vartiainen E. National Institute for Health and Wellfare. Finnish obesity before and now. The National FINRISK study 2012. The permanent address of the publication is http://urn.fi/URN:ISBN:978-952-302-054-2
  17. Matthews C (2014) Risk factors for urinary, fecal or double incontinence in women. Curr Opin Obstet Gynecol 26: 393–397. [crossref]
  18. Pomian A, Lisik W, Kosieradzki M, Barcz E (2016) Obesity and pelvic floor disorders: A review of the literature. Med Sci Monit 22: 1880–1886 [crossref]
  19. Newman D, Cardozo L, Siever, KD (2013) Preventing urinary incontinence in women. Curr Opin Obstet Gynecol 25: 388–394. [crossref]
  20. Pierce H, Perry L, Chiarelli P, Gallagher R (2016) A systematic review of prevalence and impact of symptoms of pelvic floor dysfunction in identified workforce groups.  J Adv Nurs 72: 1718–1734. [crossref]
  21. Keller IS, Brachlow JF, Padevit C, Kurz M, John H (2014) Urinary incontinence – what can be done by the family doctor and when is the urologist needed? Praxis 103: 1181–1189. [crossref]
  22. Duckett J, Balachandran A (2016) Tolerability and persistence in a large, prospective case series of women prescribed mirabegron. Int Urogynecol J 27: 1163–1167. [crossref]
  23. Franken M, Ramos I, Los J, Al M (2018) The increasing importance of a continence nurse specialist to improve outcomes and save costs of urinary incontinence care: an analysis of future policy scenarios. BMC Fam Pract 19: 31. [crossref]

Cone Beam Computed Tomography for Detection of Intranasal Foreign Bodies

DOI: 10.31038/JDMR.2019244

Abstract

Introduction: Intranasal foreign bodies are common among curious young children and include toys and toy parts (beads, marbles), food (corn, beans, peas, seeds, nuts, hamburger, gum), and other small items (paper wads, cotton, erasers, pebbles, screws, sponges button batteries).

Case presentation: A 13-year-old girl presented to our department with a 2-day history of painful swelling in relation to the tooth 26. Orthopantomography and Cone Beam Computed Tomography (CBCT), revealed a hyperdense material in the left nasal cavity. It was a foreign body of irregular morphology, segmented with dimensions of 93×52×38 mm. Under local anesthesia and by direct rhinoscopy a piece of a metal toy were removed.

Conclusion: Cone beam computed tomography is a reliable method for the diagnosis of nasal foreign bodies by providing the exact location and composition

Keywords

Cone Beam Computed Tomography, Metal, Nasal Foreign Body

Introduction

Intranasal Foreign Bodies (FBs) are common among curious young children, with the right nostril favoured by right-hand dominant patients [1]. They are classified as organic FBs (such as nuts, legumes, seeds, or chicken) or inorganic FBs (such as toys, pen tops, battery, or stones/shells). Overall, items of jewellery are the most common foreign bodies requiring removal in children, accounting for up to 40% of cases. In the nose, jewellery is followed by paper and plastic toys, whereas in the ears, cotton buds and pencils are the most likely culprits after jewellery [2]. Although most foreign bodies in the ears and nose can be easily removed, alimentary or respiratory FBs injuries can have a fatal outcome. In the children, the most common anatomical locations of FB injuries differed according to age. The mean ages of children with various FB injuries were as follows: ear FB injuries, 3.7 years; nose, 2.7 years; alimentary system, 2.2 years; and respiratory system, 2.9 years [3]. In a review of all Emergency Department visits in a 5-year span, there were 6418 (3.2% of all visits) visits nationwide for management of nasal foreign bodies, only 214 (0.1%) of which were adults [4]. French et al recommend in their work that increased efforts should be made to restrict child access to beads, pearls, marbles, button batteries, coins and nuts and seeds [5]. In adult patients, however, the mechanism and force of entry must be considered as there is a greater chance of violation of the skull base and possible cerebrospinal fistula [6].

Intranasal foreign bodies may cause complications such as pain, swelling, inflammation, septal perforation, infection and migration to compromised territories. To prevent these complications, FBs should be detected and extracted promptly. Considering the gap of information on the diagnostic sensitivity of Cone Beam Computed Tomography (CBCT), this study was aimed to assess CBCT’s ability to differentiate between metallic foreign bodies and batteries. The button battery should be treated as a life threatening foreign body due to its electrochemical content and rapid tissue damage.

Clinical Presentation

A 13-year-old girl presented to our department with a 2-day history of painful swelling in relation to the tooth 26. Orthopantomography showed caries in the first left upper molar, and incidentally the presence of a foreign body on the floor of the left nostril (Figure 1). CBCT (Planmeca ProMax 3D Mid) revealed a hyperdense material in the left nasal cavity. It was a foreign body of irregular morphology, segmented with dimensions of 93x52x38 mm (Figure 2–3). These images allowed the exact location of the foreign body and know that it was not a button battery. The girl did not remember history of foreign body insertion. He reported being asymptomatic, although he noticed a moderate left nasal obstruction for two years before orthopantomography. On examination, there was extensive edema with slough in the left side of the nasal cavity. In the operating room, under local anesthesia and by direct rhinoscopy a piece of a metal toy were removed. Septal perforation was not observed.

JDMR-19-130-Junquera_Spain_F1

Figure 1. Orthopantomography. Radiodense image of irregular contour on the floor of the left nostril.

JDMR-19-130-Junquera_Spain_F2

Figure 2. CBCT. Foreign body of irregular morphology, segmented with dimensions of 93×52×38 mm and without halo sign, common in button batteries.

JDMR-19-130-Junquera_Spain_F3

Figure 3. Three-dimensional reconstruction of the foreign body.

Discussion

Pediatric nasal obstruction is one of the most common problems seen in pediatric otolaryngologists. Typically, this is not an urgent diagnosis but is more commonly associated with reduced quality of life. Allergic rhinitis is one of the most common causes of pediatric nasal obstruction, which affects 8% to 16% of children and is immunoglobulin E mediated. In younger children, nasal foreign bodies must always be on the differential of nasal obstruction. Intervention is always needed for nasal foreign body removal in order to prevent further migration distally, potentially precipitating an airway emergency. The timing of removal is often based on the foreign body involved. Batteries are always considered an emergency because of the complications associated with prolonged exposure (septal perforation, saddle nose deformity, orbital injury, synechiae). However, nasal foreign bodies can often be removed without general anesthesia if the child is cooperative [7]. Alkaline batteries cause extensive necrosis and tissue destruction. Possible mechanisms include spontaneous electrolyte leakage with liquefactive necrosis and destruction of tissue, and generation of electrical current causing an electric burn [8–10].

In our case, unlike many other cases, the nasal foreign body may remain asymptomatic for a long time. Our patient had only a complaint of nasal stuffiness. This is an unusual case of a large chronic nasal foreign body with no known history of insertion. If the patient had indeed had symptoms for the previous two years, this suggests the foreign body was inserted when he was around age 11, which would be unusual in a child without learning disability. Identification and localization of foreign bodies are based on history, clinical and radiographic examinations. Various imaging modalities, including, periapical radiographs, plain radiography, Computed Tomography (CT), and ultrasonography, have been advocated for detecting FBs. Radiographs detected FBs generally considered radiopaque (gravel, glass, metal) in 98% of cases, but do not detected radiolucent (wood, plastic, cactus spine) bodies. The false-negative and false-positive rates for radiography are 50% and 1.6%, respectively [11,12]. Periapical radiographs are the primary diagnostic aid used in identifying the foreign bodies. However, these are not helpful in the identification of cases, in which foreign body sizes are <2 mm or in identifying the exact locations of the objects. These problems can be overcome by advanced diagnostic and imaging aids such as CT, and Cone Beam Computed Tomography. CBCT provides images at low dose with sufficient spatial resolution, which can be applied in diagnosis, treatment planning, and post-treatment evaluation. CBCT has higher spatial resolution and greater ability to detect high-density foreign bodies as small as 0.5 mm [13, 1 4]. In our case discarded the diagnosis of button batteries.

Conclusion

Within limits of this case report, Cone beam computed tomography is a reliable method for the diagnosis of nasal foreign bodies, by providing the exact location and composition.

References

  1. Grigg S, Grigg C (2018) Removal of ear, nose and throat foreign bodies: A review. Aust J Gen Pract 47: 682–685.
  2. Foltran F, Ballali S, Passali FM, Kern E, Morra B, et al. (2012) Foreign bodies in the airways: a meta-analysis of published papers. Int J Pediatr Otorhinolaryngol 14: 12–19.
  3. Park JW, Jung JH, Kwak YH, Jung JY (2019) Epidemiology of pediatric visits to the emergency department due to foreign body injuries in South Korea: Nationwide cross-sectional study. Medicine (Baltimore) 98: e15838.
  4. Svider PF, Sheyn A, Folbe E, Sekhsaria V, Zuliani G, et al. (2014) How did that get there? a population-based analysis of nasal foreign bodies. Int Forum Allergy Rhinol 4: 944–949.
  5. French MA, Lorenzoni G, Purnima, Azzolina D, Baldas S, et al. (2019) Foreign Body injuries in children in India: Recommendations for prevention from a comparative analysis with international experience. Int J Pediatr Otorhinolaryngol 124: 6–13.
  6. Gray ML, Kappauf C, Govindaraj S (2019) Management of an Unusual Intranasal Foreign Body Abutting the Cribriform Plate: A Case Report and Review of Literature. Clin Med Insights Ear Nose Throat 12: 1179550619858606.
  7. Smith MM, Ishman SL (2018) Pediatric Nasal Obstruction. Otolaryngol Clin North Am 51: 971–985.
  8. Bakshi SS (2019) A button battery in the nose. Intern Emerg Med 14: 185–186.
  9. Cheng SY, Shih CP (2018) Button battery insertion in nose manifested as infraorbital cellulitis. Ear Nose Throat J 97: 274.
  10. Dane S, Smally AJ, Peredy TR (2000) A truly emergent problem: button battery in the nose. Acad Emerg Med 7: 204–2006.
  11. Watanabe K, Hatano GY, Aoki H, Okubo K (2013) The necessity of simple X-ray examination: a case report of button battery migration into the nasal cavity. Pediatr Emerg Care 29: 209–211.
  12. Ryu CH, Jang YJ, Kim JS, Song HM (2008) Removal of a metallic foreign body embedded in the external nose via open rhinoplasty approach. Int J Oral Maxillofac Surg 37: 1148–1152.
  13. Demiralp KO, Orhan K, Kurşun-Çakmak E, Gorurgoz C, Bayrak S (2018) Comparison of Cone Beam Computed Tomography and ultrasonography with two types of probes in the detection of opaque and non-opaque foreign bodies. Med Ultrason 20: 467–474.
  14. Kaviani F, Javad Rashid R, Shahmoradi Z, Gholamian M (2014) Detection of foreign bodies by spiral computed tomography and cone beam computed tomography in maxillofacial regions. J Dent Res Dent Clin Dent Prospects 8: 166–171.

Sulfonylurea Use and Cardiovascular Safety Revisited

DOI: 10.31038/EDMJ.2019355

Abstract

Sulfonylurea use has been commonplace for the management of type 2 diabetes as an adjunct to metformin over the past decades.  Their effectiveness has been repeatedly demonstrated in terms of glycemic control in the short-term however, long-term sustainable control remains in question.  Over the years, FDA mandated cardiovascular safety trials have been completed involving most newer antidiabetic therapies to the market place however, the sulfonylurea class had not been studied until the recent head-to-head cardiovascular outcomes trial involving the comparison of linagliptin, an inhibitor of DPP-IV,  with glimepiride in the CARMELINA study where non-inferiority was demonstrated in both treatment groups.  While this finding seems to be reassuring, does it really confer safety of use of sulfonylurea drugs in the management of type 2 diabetes?

Keywords

Sulfonylurea, DPP-IV inhibitor, diabetes, cardiovascular disease, major adverse cardiovascular event, type 2 diabetes, hypoglycemia, arrhythmia

Guidelines

Since the evolution of the management of diabetes and hyperglycemia, respected societies globally have been providing guidance with respect to such management.  Since the availability of such drugs, the class of sulfonylurea was adapted and implemented.  After metformin was approved for use, the sulfonylurea was recognized as the second agent for intensification.  Over recent years and on the basis of newer agents which demonstrated safety that have become available, namely incretin agents and urinary SGL T2 inhibitors, the sulfonylurea class has found its way on the bottom of such algorithms, as per the American Association of Clinical Endocrinologists [1] on the basis of safety and efficacy, and as one of the executable options of those financially challenged, according to the joint consensus statement from the American Diabetes Association and European Association for the Study of Diabetes, recently revised in the first quarter of 2019 [2]. While these statements and guidelines are consensus or expert based, they are recommendations that are soundly based on their demonstrated safety and efficacy, but even then, the choice of not following such recommendations is routinely exercised.

Development of sulfonylurea

The first agents that were discovered in the sulfonylurea class was in 1942 where sulfonamides were noted to reduce blood sugar in non-human studies, leading way to the development of Carbutamide, which was very quickly withdrawn from the market place because of apparent hematologic disease, particularly on the bone marrow [3]. Second-generation sulfonylureas that became available differed from their first-generation counterparts because of differences in absorption and metabolism.  For this reason, the second-generation agents have been credited with fewer hypoglycemic events relative to their first-generation counterparts, but still differ greatly based on molecular formulation whereas glimepiride is noted to produce hypoglycemia in 2% to 4% patients compared to glyburide, noted to produce hypoglycemia in 20-30% of patients with the reason being  better preservation of prevention of insulin secretion and promotion of glucagon secretion [6].

Mechanism of action

The mechanism of action described as that of insulin secretion out of the pancreatic beta cell independent of what the blood glucose level in circulation may be in addition to having a decreased effect on hepatic insulin clearance.  This insulin secretory effect is largely as a consequence of blocking potassium inflow into the cells through a DPP dependent channel.  This leads to membrane repolarization leading to increase cellular inflow of calcium into these beta cells leading to filamentous contraction of actinomysin with subsequent secretion of large quantities of insulin from that beta cell.  While insulin is secreted in 2 phases largely, it appears that the effect of the sulfonylurea tends to be more so on the second phase of secretion.  However, review of the literature demonstrates that there might be down-regulation of sulfonylurea receptors on the surface of beta cells with long-term use, with increased expression of those very receptors after discontinuation of treatment with sulfonylurea over a certain period of time [3].

Sustainability

Large-scale clinical trials have been performed over the years to evaluate the development of microvascular and macrovascular complications associated with the management of patients with type 2 diabetes.  Amongst these were the United Kingdom Prospective Diabetes Study [4] and the ADOPT trial [5].  In both of these trials, different agents were studied that included insulin, the sulfonylurea group, and metformin.  The p-par gamma molecule, rosiglitazone, was also studied in the ADOPT trial.  It was interesting to note that in these 2 large-scale trials, the sulfonylurea class led to a rapid reduction in hemoglobin A1c that seemed to worsen by about the second year of therapy, or thereafter with a subsequent rise suggesting treatment failure.  Progressive dysfunction and worsening insulin secretion has been noted with sulfonylurea use despite better glycemic control in the short-term.  This phenomenon has been labeled as secondary failure and is an outcome shortly to be expected with chronic sulfonylurea use.  While not terribly well understood, and as mentioned above, is likely related to down-regulation of sulfonylurea receptors on beta cell surface membrane [3].  Thus there appears to be multiple factors that might be contributing to lack of sustainability in hemoglobin A1c control and these stem from increasing pressures that lead to accelerated apoptosis or cell death, and other mechanisms yet to be discovered that may perhaps be implemented in the future for beta cell preservation.  Thus on the basis of demonstrated lack of sustainability of hemoglobin A1c, one can assume that treatment with a sulfonylurea would offer very little on beta cell mass preservation or persistent improvement in beta cell function.

Safety

Use of any pharmacologic agent for management of chronic disease may have adverse events associated with them, even though they may be curtailing the natural history of the original disease state.  For the sulfonylurea class, however, the most worrisome challenges include progressive weight gain, as evidenced in numerous large-scale clinical trials, and the risk of developing significant hypoglycemia, which itself is challenging in diagnosing, particularly nocturnal hypoglycemia, which often goes unrecognized.  When reviewing the literature, there has been significant variability in nocturnal hypoglycemia listed ranging anywhere from 20-40% depending on which study was reviewed and with which sulfonylurea.  However, what is the cost of hypoglycemia?  From a physiologic standpoint, significant electrolyte aberrancies can occur including potassium shifting intracellularly as well as effect on the myocyte cycle with noted QT prolongation [7]. Such occurrences can lead to significant dysrhythmia and lethal arrhythmia.  It is thought that such unpredictable variability in glycemic control may have been part of the reason why an increased mortality may have been observed in the ACCORD Action to Control Cardiovascular Risk in Diabetes) trial where the forced titration hemoglobin A1c target was a value of less than or equal to 6%.  It is interesting to note that the majority of the cardiovascular events recorded were in the population of patients who is hemoglobin A1c did not change very much despite aggressive management, suggesting much glycemic variability [12].

Cardiovascular outcomes

Several studies have been published looking at particular cardiovascular adverse events with the use of sulfonylureas.  The data seems to be quite variable.  Data reviewing the UK Clinical Practice Research Data Link, published in 2017, reviewed short acting and nonspecific long-acting sulfonylurea with no significant increase in noted myocardial infarction, ischemic stroke or cardiovascular death between both long and short acting agents however, with significant risk of severe hypoglycemia in the long-acting agents [8].  In another study accepted for publication in June 2018 assessed whether adding or switching to sulfonylurea is associated with an increased risk of major adverse cardiovascular events including all-cause mortality.  This study did demonstrate an increased risk of myocardial infarction and all-cause mortality, with no differences in cardiovascular death or severe hypoglycemia [9].

As part of the management of diabetes, which is complex already to begin with, newer agents with lower hypoglycemic potential when used as monotherapy or combination therapy with metformin have gained significant traction on the basis of their safety record demonstrating no increased cardiovascular risk or reduction in cardiovascular risk.  Such therapies include DPP 4 inhibitors, GLP-1 receptor agonists, and urinary SGL T2 receptor blockers.  Only recently has a cardiovascular outcomes trial been completed where the DPP 4 inhibitor linagliptin was studied with the active comparator being the sulfonylurea glimepiride in the CAROLINA trial [10].  The purpose of this trial was to establish noninferiority between these 2 agents with respect to cardiovascular risk.  However, since no cardiovascular studies have been performed looking at glimepiride, cardiovascular safety was demonstrated with the DPP 4 Linagliptin versus placebo in the CARMELINA study where noninferiority was achieved [11]. In the active comparator CAROLINA (CARdiovascular Outcome study of LINAgliptin versus glimepiride in patients with type 2 diabetes) study, the primary endpoint defined as noninferiority of linagliptin versus glimepiride in time to first occurrence 3 point MACE was satisfied.  The study was an event driven trial involving 6979 patients with the median duration of the study being 2.2 years.  Population involved was on average 62 years of age with 34% having had established cardiovascular disease and 28.6% of those in the trial having been treated with a sulfonylurea agent for less than 5 years.  Noninferiority for major adverse cardiovascular events was indeed demonstrated, albeit with significantly greater hypoglycemia noted in the glimepiride treatment group (10.6% versus 37.7%).

Conclusion

Sulfonylurea use over the past decades has been welcomed by a sense of comfort and demonstrated rapid efficacy, although of limited benefit.  Weight gain and hypoglycemia still seems to be the most worrisome adverse events with these agents, and a myriad of physiologic effects as a consequence of those hypoglycemic events will pose significant challenges toward their continued use.  While electrolyte shifting and effects on QT intervals increase risk of cardiac arrhythmia, there was no increase in cardiovascular mortality that was noted in the glimepiride subgroup, treated to a maximum of 4 mg daily, in the CARMELINA study.  Of note was the fact that those enrolled in the clinical trial was a lower cardiovascular risk population, albeit older.  The fact that there was no increase in cardiovascular events noted in this clinical trial was reassuring but should not be translated to the sulfonylurea class in general as only glimepiride use was allowed by trial design.  The observed risk reduction cannot be and should not be extrapolated to other sulfonylureas, and while safety was demonstrated from a cardiovascular standpoint in this low risk population, there exists uncertainty of whether or not similar findings would be seen in a higher risk population.  Therefore, it’s important for the prescriber to be aware that differences in this class of agents need to be taken into consideration in order to avoid a false sense of reassurance.

List of abbreviations

UKPDS- United Kingdom Prospective Diabetes Study

ADOPT- A Diabetes Outcome Progression Trial

GLP-1 receptor agonist-glucagon-like peptide 1 receptor agonist

SGL T2 receptor inhibitor-sodium glucose transport protein 2 inhibitor

SU-sulfonylurea

DPP 4 or DPP IV-Dipeptidyl peptidase 4

MACE Major Adverse Cardiovascular Events

Declaration

Compliance with Ethics Guidelines

This article is based on previously conducted studies and does not contain any studies with human participants or animals performed by any of the offers of this publication

Consent for publication

The author has given his approval for the version of this manuscript to be published

Competing interests/Disclosures

Dr. Javier Morales is on the speakers Bureau of Novo-Nordisk, Eli Lilly and company, Boehringer Ingelheim, Janssen pharmaceuticals, Mylan pharmaceuticals, and Abbott Laboratories, and serves as consultant, as well as having participated in advisory board meetings for the above-named entities.

Authorship

The author meets the International Committee of Medical General Editors (ICMJE) criteria for authorship for this article, take responsibility for the integrity of the work as a whole

Availability of data and material

This article is based on previously conducted studies and thorough literature review was conducted during authorship of this manuscript

Funding

No funding or sponsorship was received for this publication or article processing charges

Acknowledgments

No editorial assistance was provided by any entity or company during the development of this manuscript.

References

  1. Alan J Garber, Martin J Abrahamson, Joshua I Barzilay, Lawrence Blonde, Zachary T Bloomgarden, et al. (2019) Consensus Statement By The American Association Of Clinical Endocrinologists And American College Of Endocrinology On The Comprehensive Type 2 Diabetes Management Algorithm – 2019 Executive Summary. Endocrine practice 25: 1
  2. Introduction: Standards of Medical Care in Diabetes (2019) Diabetes Care. 42: 1-2.
  3. Daniele Sola, Luca Rossi, Gian Piero Carnevale Schianca, Pamela Maffioli, Marcello Bigliocca, et al. (2015) Sulfonylureas and their use in clinical practice. Arch Med Sci 11: 840–848.
  4. UK Prospective Diabetes Study (UKPDS) Group (1998) Effect of intensive blood-glucose control with metformin on complications in overweight patients with type 2 diabetes (UKPDS 34).  The Lancet 352: 854–865.
  5. Giancarlo Viberti, Steven E. Kahn, Douglas A Greene, William H Herman, Bernard Zinman, Rury R Holman, et al. (2002) A Diabetes Outcome Progression Trial (ADOPT). Diabetes Care 25: 1737–1743.
  6. Mark T Keegan (2013) Pharmacology and Physiology for Anesthesia.
  7. Laitinen T, et al. (2008) Ann Noninvasive Electrocardiology 13: 97–105.
  8. Antonios Douros, Hui Yin, Oriana Hoi Yun Yu, Kristian B. Filion, Laurent Azoulay and Samy Suissa (2017) Pharmacologic Differences of Sulfonylureas and the Risk of Adverse Cardiovascular and Hypoglycemic Events. Diabetes Care 40: 1506–1513.
  9. Antonios Douros, Sophie Dell’Aniello, Oriana Hoi Yun Yu, Kristian B Filion, Laurent Azoulay, et al. (2018) Sulfonylureas as second line drugs in type 2 diabetes and the risk of cardiovascular and hypoglycaemic events: population based cohort study 362
  10. CAROLINA: Cardiovascular Outcome Study of Linagliptin versus Glimepiride in Patients with Type 2 Diabetes. ClinicalTrials.gov
  11. Rosenstock J, Perkovic V, Johansen OE, Cooper ME, Kahn SE, Marx N, et al. (2019) Effect of Linagliptin vs Placebo on Major Cardiovascular Events in Adults With Type 2 Diabetes and High Cardiovascular and Renal Risk: The CARMELINA Randomized Clinical Trial. JAMA 321: 69–79.
  12. Effects of Intensive Glucose Lowering in Type 2 Diabetes (2008) N Engl J Med 358: 2545–2559