Monthly Archives: May 2018

Distribution Pattern of Regulators: Uneven Distribution of ESEs in Genes and Their Extra Functions

DOI: 10.31038/JMG.2018112

Summary

Gene transcripts (human FMR1, chicken ovomucoid, human 25 vitamin D3 1-α-hydroxylase, hamster adenine phosphoribosyl transferase and human insulin) were scanned for ESE (Exonic Splicing Enhancer) by ESEfinder 3.0, CSHL. The ESE distribution is gene specific with a consensus pattern.

  1. The ESEs are more abundant in smaller genes.
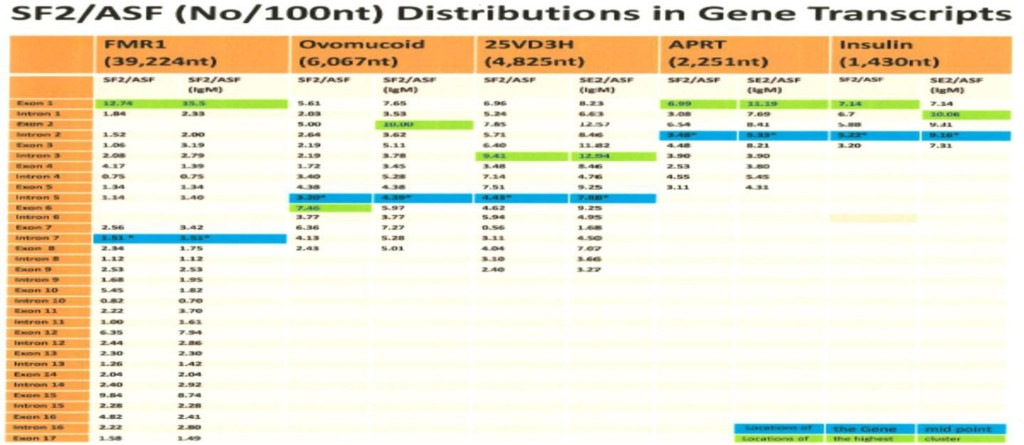
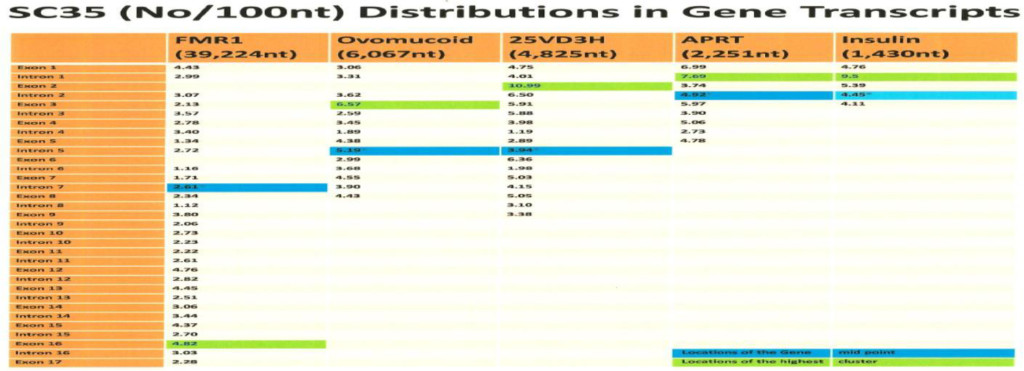
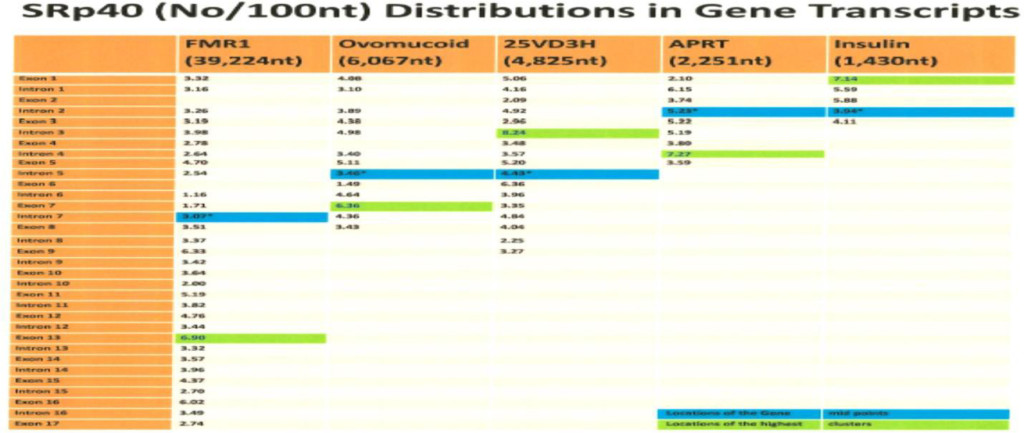
  2. Some of the consensus pattern includes (a) SF2/ASF is clustered  in the 1st exon in comparison with the last exon and, SRp55 and SRp40 are more in the last exon in comparison with 1st exon; (b) SC35 and SRp40 are in the central region of the gene body but SC35 is shifted toward the 5’ half of the transcript and SRp40 is shifted more toward the 3’ side; (c) The highest cluster of SF2/ASF (9/10) and SC35 (4/5) are in 5’ side of the molecule and the highest cluster of SRp40 (3/5) is in 3’ side.
  3. A consensus Alu sequence contains 15–17 ESEs (SF2 + SC35 + SRp40 + SRp55) and is enriched with SF2 with some variations in individual Alu elements.
  4. Satellite DNAs have more SF2  than other ESEs.
  5. DNA breakpoints and MALAT1 have more SRp40.
  6. Repeat sequences have specific ESE enrichment; SF2 in CGG repeats, SRp55 in CAG repeats, SC35 and SRp55 in CUG repeats and SF2 in CCUG repeats, suggesting that these repeat sequences may sequester around certain SR proteins leading to alteration in splicing and gene expression patterns.

1. Introduction

In the post genomic era after completion of the 3 × 10⁹ bp haploid human genome sequence, it is now possible to put it into perspective and assign gene function. With the breakthrough findings of discontinuous genes and splicing in eukaryotes, a mountainous number of factors have been reported to influence the splicing reactions. As the transcription, splicing and transport are intimately interconnected, overlapping functions of some of the factors are inevitable. In addition, mRNA expression in gene constituents ranges from 10 to 15% (hnRNA) and furthermore, lncRNA genes have been identified as often as coding genes or possibly more. The repeat genes comprise ~45% and remaining genes include satellite DNA, cetromeric DNA, telomeric DNA, rRNA genes, snRNA genes, tRNA genes, miRNA genes, 5SRNA genes and other housekeeping genes (Table 1). There are regional differences in the genes in these categories which are difficult to be delineated by base composition or nucleotide sequence. Oligonucleotide characteristics may differentiate some of the regional differences which may confer different functions. The ESEs (Exonic Splicing Enhancers) which were originally found to have roles in splicing and alternative splicing are further implicated in many other functions. These extra functions include (1) SF2/ASF and SC35 in alternative promoter selection and poly (A) site selection [1], and prevention of mutagenic R-loop formation [2], (2) SF2/ASF in translation and mRNA stability, (3) the SC35 in transcription elongation [3], and (4) SRp20 and 9G8 in the nuclear export of mRNA. The SF2/ASF binds to a purine rich element of chicken PKCI-r mRNA, induces instability and reduces its accumulation in the cell [4]. The SF2/ASF, SRp20 and 9G8 have been shown to shuttle between the cell nucleus and cytoplasm. This shuttling function requires RRM and SR motifs to be present in the molecule [5]. Moreover, SF2/ASF enhances translation of mRNA and the presence of ESE element in the mRNA enhances further more [6]. Those shuttling SR proteins (SF2/ASF, SRp20 and 9G8) also function as adaptor proteins for TAP/NXF1 mRNA export [7]. The splicing is carried out in spliceosomes, supra- spliceosomes containing pre-mRNA 5’ and 3’ splice sites, branch sites, enhancer sites, five snRNPs and ~150–300 protein factors mounting to MW 100 million Da. These include hnRNP proteins, snRNP proteins (U1 RNP, U2 RNP, U6 RNP, U4/U5 RNP), DEAD box helicase/ATPase (p68/prp28 etc), enhancer proteins (SF2/ASF, SC35, SRp40, SRp55, 9G8, SRp20, SRp75 etc.) and other proteins. The protein components are different depending on the sequence elements present at the splice site, cell type, developmental stages and pathologic conditions. The splicing codes can be divided into the following two groups: (1) consensus codes and (2) specific codes. In general, the consensus codes are applied to most splicing reactions which include a GU 5’ splice site, AG 3’ splice site, branch site, or five snRNP components. The specific codes may include ESE, ESS, ISE and ISS which regulate splicing patterns involving exon skipping/inclusion as well as defining pseudoexons/non-coding exons. The ESE components and their distributions are species specific and are particularly marked for ISE sequences and distribution in gene transcripts. It is interesting to see that some of the splicing mechanisms in fish transcripts are not applicable in mammalian cells [8]. The tissue specificity of ESEs are demonstrated in SRp55 in calcitonin/CGRP alternative splicing [9],  SRp40 in PPARγ1/PPARγ2 alternative splicing [10] in adipocyte differentiation and others. It has been reported that exons contain  more ESEs and introns contain more ISS [11]. The SF2/ASF was found to associate with U1–70K protein at the 5’ splice site. The last intron splice acceptor has been shown to influence on transcription termination by exon definition mechanism [12]. The SF2/ASF and 9G8 has been found to enhance splicing of the fibronecting ED1 exon inclusion in a promoter dependent manner [13]. The ESE functions are combinatorial and position dependent [14]. It is therefore of interest to find out whether splicing codes are distributed evenly throughout the genes or there are transitions in splicing code in gene structure as it is transcribed from 5’ initiation site to the elongation and 3’ termination. It has been reported, by chromatin cross-linking and immunoprecipitation (Chip) methods, that SR proteins bind to RNAs and SC35 not only binds to RNA but also crosslinks to DNA as well. The SR proteins are recruited from the pool during transcription and RRM plays an important role in nascent RNA binding. It was demonstrated that SRp20 binding was ~2X more in exon 1 compared to exon 4 and SRp55 binding was ~2X more in exon 4 than in exon 1 of the fos gene transcript [15]. The importance of ESE/ESS and ISE/ISS has been emphasized in pseudogene suppression and regulation of strong and weak exons [16]. Many factors influencing splicing reactions are splice site strength, presence and absence of ESE/ESS, ISE/ISS, regional RNA secondary structure, DEAD box RNA helicases/ATPases, presence and absence of Alu, LINE, PTC (premature termination codon), triplet repeats, dinucleotide repeats and others. In addition, transcription factors acting on initiation and elongation can impact splice site selection. The rate of elongation by RNA polymerase II has been shown to influence alternative splicing events [17]. In view of the fact, that diseases causing DNA mutations may be involved in alternative splicing in 50–62% of the cases [18,19], the importance of studying the regulations of splicing mechanisms cannot be overstated. Moreover, the characteristics of DNA breakpoints are not well defined and more rigorous analyses are needed for the understanding of cancer and other gene- based diseases.

Table 1. Genomic Constituents (3×10⁹bp)

Coding Genes (Protein)
25,000-30,000 Genes

Exons+Introns

1-2% coding

Introns; 9-13%

snoRNA

miRNA

10-15% of genome

Noncoding genes: 22,000

Pseudogenes; 13,000

Exons+Introns

snoRNA

miRNA

Σ~15-25%

Repeat genes (Retrotransposons; Alu, SVA, LINES, LTR, Dinucleotides repeats etc)

Alu: ~300 bp

L1: ~6kbp

SVA; 0.7-4 kbp

~106 copies (~10-15%)

~8.3% (~7-17%

~0.2%

Σ~45%

Satellite DNA(α, β, γ and III)

~1-5%

rRNA gene

rRNA

Gene 5SrRNA

~350-500 genes

(~15Mbp)

1-2%

~1-5%

SnRNA gene

U1,U2,U3,U4, U5,U6,U7,U8, etc

~1%

Many essential factors and regulators of gene expression exist at different levels of gene expression. At the level of splicing, a variety of ESE, ESS, ISE and ISS have been reported. These motifs not only function at the canonical splicing but also during alternative splicing, increasing the repertoire of the protein populations. These motifs exist in isolation or in clusters in many different combinations. Accordingly the presence of these motifs and binding proteins can regulate gene expression in a context dependent manner. The SR-proteins which binds to ESEs are found to stimulate splicing reaction in vitro.

In addition to ESE (Exonic Splicing Enhancer), ESS (Exonc Splicing Silencer), ISE (Intronic Splicing Enhacer) and ISS (Intronic Splicing Silencer) were found to enhance or silence splicing reactions in cell extracts with model splicing components as well as in the cells with knock in and knock out experiments. The SR-proteins bind to specific sequence elements in order to exert their functions. Some of the ESE consensus sequences included in this study are 1) SF2/ASF (SRSASGA), 2) SC35 (GRYYcSYR), 3) SRp40 (ACDGS), and 4) SRp55 (USCGKM); where P=Purines (A or G), Y=Pyrimidines (C or U), D=A, G or U, S=G or C, K=U or G and M=A or C [20,21,22]. The distribution of these motifs is essential for specific gene expression during developmental stages and in specific cell types.

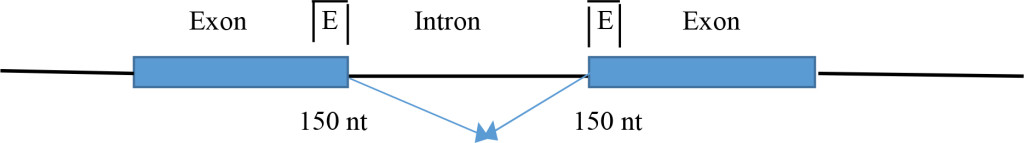
  1. Distribution in canonical splicing revealed the clustering of ESE at the splice sites for the correct splice site selection and enhancement [1]. The ESEs are clustered within 150 nt from the splice sites in exons.

    JMG2018-102-TaeSukRo-ChoiChina_F10

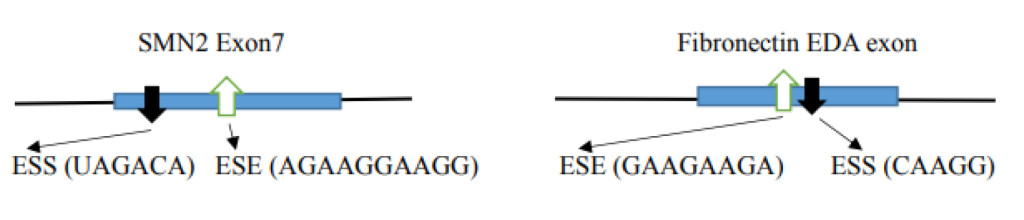
  2. Distribution of a silencer at the canonical splice site leads to alternative splicing. The example illustrates the SMN 1 gene where variation occurs in one nucleotide (C→U) in the SMN2 gene exon 7 creating a silencer motif (UAGACA; in SMN1 the sequence is CAGACA) and inhibiting a splice to exclude exon 7 in the final product [23]. Another example is in the case of the Fibronectin EDA exon where the presence of ESS excludes the EDA exon and the presence of ESE includes the EDA exon [24].

    JMG2018-102-TaeSukRo-ChoiChina_F11

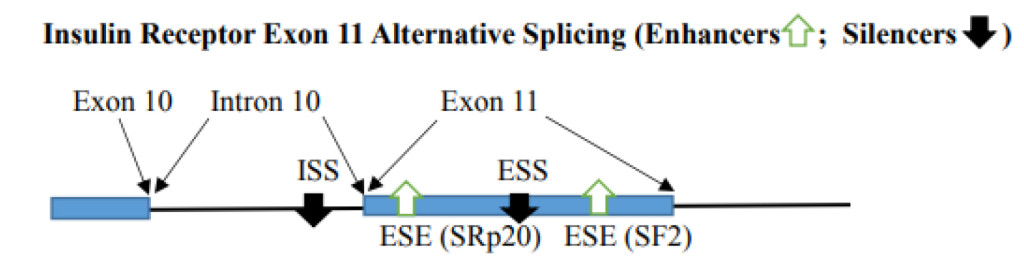
  3. Variation in Regulator numbers in exon and intron can impact alternative splicing. When inhibitory factors are multimers, the exon is excluded. With one high score ESE, the splicing at the correct site can be enhanced. This depends on the balance of enhancers and silencers. With the availability of binding SR proteins, the splicing can be altered to provide alternative splicing. For example, the Insulin receptor gene contains 2 ESEs [SRp20 (CUCUUCA) and SF2 (CGAGGA)] and ESS (CUGGUGCCG) in exon 11 and additional ISS (CCUCCAAGUGUC) in intron 10. ESE binds SF2 and SRp20 to enhance exon 11 inclusion. The silencers bind CUG-BP1 and cause exon 11 exclusion [25]. Mutation of any one of the ESEs will compromise exon 11 inclusion and the mutation of ESS or ISS result in causing the exon 11 inclusion.

    JMG2018-102-TaeSukRo-ChoiChina_F12

  4. Position dependent Regulators (ESEs) in non-splicing conditions such as in intron-less mRNA and non-coding RNA are of interest because they impose ESEs in extra functions other than in splicing. The specific ESE motifs are differentially distributed.

It has been widely observed that the extra activities include mRNA transport, localization, translation and metabolism by NMD (nonsense mediated decay). It is of interest to see whether or not different proteins function differently in other splicing reactions. Involved proteins in first and second step splicing reactions are different, and mRNA modifications and processing are different from 5’ initiation of transcription till 3’ end poly (A) formation. The different SR-protein binding sites are differentially distributed in the gene from the 5’ end to the 3’ end. The SF2/ASF is more clustered at the 5’ side of the gene whereas SRp55 tends to be clustered on 3’ side of the gene.

The abundance of ESE is inversely correlated with the size of the gene. The repeat elements have clustering of specific ESEs and clustering of ESEs in Alu elements in the FMR1 gene is observed.

2. Materials and Methods

Transcript sequences were obtained from NCBI and Ensemble release. The human insulin gene (NCBI; J00265), hamster APRT (adenine phosphoribosyltransferase) gene (NCBI; X03603), human 25-hydroxyvitamin D3 1-α-hydroxylase gene (NCBI; AB006987), chicken ovomucoid gene (Ensemble release 43, http://www.ensemble.org), and FMR1 (NCBI; L29074.1) gene sequences were downloaded from the Website. The analyses are made from transcription start sites to the poly A sites and beyond. When there are multiple TSSs, the farthest upstream TSS is included. In human insulin gene (NCBI; J00265) transcript, total 1,430 nucleotides are analyzed which is from the nucleotide 2,186 (TSS) to the nucleotide 3,615 including 465 nucleotides exons and 965 nucleotides introns.

In the hamster adenine phosphoribosyltransferase (APRT) gene (NCBI; X03603) transcript, total 2,251 nucleotides were analyzed which is from nucleotide 330 (TSS) to 2,580 including 881 nucleotide exons and 1,370 nucleotide introns.

In the 25 hydroxyvitamin D3 α-1-hydroxylase (25VD3H) gene (NCBI; AB006987) transcript, a total of 4,825 nucleotides were analyzed which is from nucleotide 285 (TSS) to nucleotide 5,109 including 2,551 nucleotide exons and 2,274 nucleotide introns.

In the ovomucoid gene transcript, a total of 6,067 nucleotides were analyzed which includes 1,424 nucleotide exons and 4,643 nucleotide introns. The sequence is from TSSII which is 85 nucleotides upstream from the major transcription start site (TSSI). The TSSI is 53 nucleotides upstream from the AUG translation initiation site. The ensemble release is 5,587 from ATG to the end of the 1st poly(A) site and beyond. Adding 342 nucleotides which contains 2nd poly(A) site and beyond (Gerlinger et al., 1982) adds up to 6,067 nucleotides (85 + 53 + 5,587 + 342 = 6,067). This sequence includes a 138 nucleotides 5’UTR, 633 nucleotide exons, 4,643 nucleotide introns and a 653 nucleotide 3’UTR.

In the FMR1 gene (NCBI; L29074.1) transcript, a total of 39,224 nucleotides were analyzed which is from nucleotide 13,652 (TSSIII) to nucleotide 52,875, including 4,456 nucleotide exons and 34,768 nucleotide introns.

ESEs have been screened by ESE finder 3, Cold Spring Harbor Laboratory [22] with a default threshold, otherwise stated. The default thresholds scores are SF2/ASF; 1.956, SF2/ASF (IgM-BRCA1); 1.867, SC35; 2.383, SRp40; 2.67 and SRp55; 2.676. The number of ESEs were analyzed in the total transcript, exon only, intron only and splice sites. The number of ESEs are expressed as the number of ESEs per 100 nucleotides in each categories. The number of ESEs in noncoding RNAs were analyzed accordingly. The noncoding RNAs analyzed are:

  1. The DNA breakpoint sequences are from the reference by Lui et al., 2011 [26].
  2. The NEAT 1 sequence is from NCBI Reference sequence NR_028272.1
  3. The MALAT 1 sequence is from NCBI Reference sequence NR_002819.3
  4. The α-satellite consensus sequence 1 and 2 are from reference by Waye and Willard [27] and consensus sequence 3, 4 and 5 are from Vissel and Choo [28].
  5. The Alphoid sequence (334 bp) is from GenBank S49988.1.
  6. The β-satellite sequence (955 bp) is from GenBank M81228.1.
  7. The γ-satellite DNA (1962 bp) is from GenBank X68546.1.
  8. The satellite III in chromosome 14 (1,404 bp) is from GenBank S90110.1.
  9. Alu Major, Alu Precise and AluPV (HS) from reference by Maraia et al., 1993 [29]
  10. Human Y RNAs from reference by Christov et al., 2006 [30]
  11. Sleeping beauty sequence from Hackett et al., 2004, von Pouderoyen et al., 1997 [31, 32].
  12. ESE clustering in short repeat sequences such as CAG, CUG, CCUG and CGG have been analyzed [33]

3. Results

3.1 ESE Distribution in Coding Gene Transcript

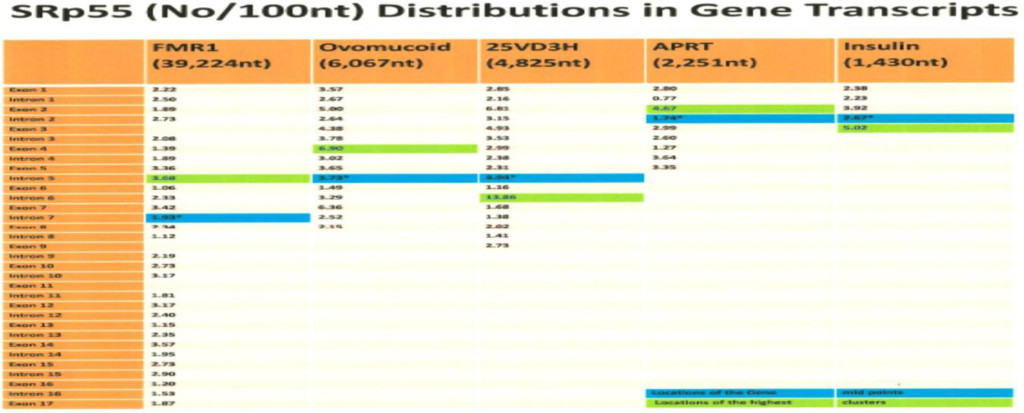
The computer screening of ESE distribution in pre-mRNAs revealed gene specific distributions as well as some consensus patterns of distribution. Using ESEfinder 3 (CSHL), the distribution of SF2/ASF, SC35, SRp40 and SRp55 have been screened. An example of ESE distribution is shown in Fig. 1. Table 2a, Table 2b and Table 2c  summarize the ESE distributions in five different gene transcripts. The total number of ESEs (SF2/ASF+SC35+Srp40+SRp55) in each gene showed an inverse correlation with the chain length of the gene transcript, where the shortest gene transcript of insulin gene has more ESEs than the longer gene transcript of FMR1 per 100 nucleotide bins (Table 2a). The clustering of ESEs at splice sites is evident in short gene transcript. However, in longer gene transcripts, like the FMR1 gene, no differences are found between splice sites and other regions in gene transcript (Table 2a). In overall counts [total length 53,797 nucleotides (FMR1+Ovo+25VD3H+APRT+Insulin)], SC35 and SRp40 are more abundant and SRp55 is the least abundant in 5 gene transcripts examined (Table 2b). Individual gene transcript have their characteristic content of ESEs where 25VD3H and insulin gene transcripts have SF2/ASF abundance (Table 2c). These ESEs are clustered at certain regions of the gene transcripts, for example the first exon has more abundance of SF2/ASF (Table 3a) whereas the last exon has relatively more SRp55 in comparison with other ESE motifs (Fig. 2, Table 3b). Overall, the ESEs are more abundant in first exons of all 5 genes tested (Table 3a) and ESEs are less abundant in  last exons (Table 3b). The SRp55 is a regulator of calcitonin/CGRP alternative RNA splicing [9].

Although there is focal regional clustering, 5’half and 3’half analyses do not reveal significant differences. Analysis of ESE distribution throughout the genes, exon by exon and intron by intron revealed the more clusterings of SF2/ASF at the 5’ region, SC35 in the 5’ side central region while the SRp40 was in the 3’ side central region and SRp55 in the 3’ region of the gene transcripts. Examples are illustrated in (Figures 3 a,b,c,d)

The role of ESEs is critical for the formation of specific gene products. The changes in gene structure by point mutations (SNP) or indel (insertion/deletion) leads to changes in ESE distribution which produces variant mRNA products. The insulin gene at chromosome 11 contains three exons and two introns (Figure 1). The translation initiation site is in the exon 2 which leaves exon 1 and part of exon 2 as a 5’ UTR. Even in normal pancreas β-cells, it was found that ~10% of the insulin mRNA contains extra 26 nucleotides in the 5’ UTR which is derived from alternative splicing at cryptic 5’ splice site at position 68 in intron 1 when compared with canonical splicing at position 42 (Figure 1). The proportion of the longer 5’UTR containing insulin mRNA increases markedly in prolonged hyperglycemic condition and has a higher efficiency of translational activity [34]. In African population, the variant gene with TTGC insertion at the position close to 5’ splice site of intron 1 (47–50) leads to attenuation of canonical splice site at the position 42, higher proportion of the mRNA is spliced at the cryptic site at position 72 (position 68+4 nt insertion=72) (Figure 4), and has a longer 5’UTR which is 30 nucleotides longer than normal insulin mRNA. The UUGC insertion also changes ESEs distribution, where extra SRp40 and SRp55 are created (Figure 5) which may also contribute to enhanced translation of a longer insulin mRNA [35, 36]. The activity appears to be more specific to SRp40 and SRp55, because other SR proteins such as SF2 have some promoting activity, but SRp40 and SRp55 have a significantly higher proportion of translation promoting activity with longer insulin mRNA.

It is known that SRp40 and SRp55 have promoting activity on HIV1 genomic translation [37]. Although the exact mechanism of action is not known, the presence of RRE (Rev Response Element) or CTE (constitutive transport element) in viral RNA and specific coding sequences is required for the enhanced translation. Moreover, the RRM2 motif and SR domain in SR proteins are required for the activity. RRM is an RNA binding motif and the SR domain interacts with other proteins, or also with other nucleic acids. The abundance of SR binding sites are present in RRE and CTE. The SF2 sites are the most abundant but a considerably higher proportion of SRp40 sites are also present (Table 4). The SRp40 and SRp55 also increase the proportion of un-spliced RNA for an in vitro splicing condition [37]. In the case of fibronectin (FN) EDA exon (one tissue specific alternative exon of FN mRNA; It is selectively excluded in hepatocytes and included in various extents in other cell types) containing a mRNA construct, the SF2/ASF is the most translation promoting SR protein and the enhancing translation is by increased mRNA utilization by polysomes, translation machinery. The mRNA in translating ribosomes is increased as well as SF2/ASF’s association with translating ribosomes [6].

3.1.1 Characteristics of Individual Gene Transcript

3.1.1.1 FMR1 Gene Transcript

The FMR1 gene has different gene structures from others in that it contains triplet (GGC ) repeats, eight Alu elements, one LINE sequence and four potential microRNA sequences. It has specific characteristics of ESE distribution.

  1. The triplet repeats in FMR1 contain clustered SF2/ASF (from nucleotide position 100–300) of 36 SF2/ASF motifs (18/100 nt).
  2. In intron 2, the nucleotides from 12,599 to 12,641 (43 nt) contain GU and AU rich sequences and a cluster of 19 SRp55 (44/100 nt).
  3. Alu and LINE elements which are jumping genes have more ESEs than exons in the FMR1 gene transcript (Table 5). Although there are consensus patterns such as higher abundance of SF2/ASF than other ESEs, in general, equal numbers of ESEs in total which is ~16 ESEs per 100 nucleotides. The Alu elements have been reported to be enriched in the gene-dense-chromosomes such as chromosome 19 and also more abundant in euchromatin areas than in heterochromatin areas [38]. In view of the fact that there are many exonizations of Alu and LINE elements during evolution [39, 40] it is interesting to observe the presence of high densities of ESEs in addition to 5’(+ oriented Alu) and 3’ (- oriented Alu) splice sites in these elements.
    The involvement of Alu and LINE elements in chromosomal inversion have been reported [41].
  4. The ESE densities in the FMR1 gene transcript are in the order of Alu (15.69/100 nt) > LINE (14.22/100 nt) > Exons (10.97/100 nt) > Introns (10.47/100 nt) > Splice sites (9.87/100 nt).
  5. It is interesting to observe that where there is alternative splicing in the FMR1 transcript, there are more ESEs; exon 10 has 12.73 ESEs/100 nt., exon 15 has 20.77 ESEs/100 nt. and exon 17 up to stop codon has 16.26 ESEs/100 nt in comparison with 10.53 ESEs/100 nt in the total sequence (39,224 nt) of FMR1. The whole exon 17 is 2,409 nucleotides and up to the stop codon is 160 nucleotides.

The FMR1 gene has more alternative spliced products among five genes studied. The alternative splicing is mostly located at the 3’ half of the molecule involved in exons 9, 10, 12, 14, 15 and 17 [42, 43]. Of these, exon 15 has three 3’ splice sites (Fig. 6 and 7). The ESEs appear to be clustered more around the exon 15 (Figure 6) and 3’ splice site strength are correlated with the amount of spliced products formed. The canonical splice product is the most abundant, and alternative splice site 2 and 3 usages is much less [43-46] (Figure 7). Although there are high strength 3’ splice sites in close proximity to alternative splice site 3, it is not operative in a splicing reaction. It is interesting to observe that there are more silencer motifs present in this region (Figure 8) which may counter-act the splice site operation.

3.1.1.2 Ovomucoid Gene Transcript:

The number of ESEs/100 nt (SF2/ASF + SC35 + SRp40 + SRp55) at splice sites (100 nt at GU containing region + 100 nt at AG containing region) are in the order of splice site 5 (20.5) > splice site 6 (18.0) > splice site 7 (17.3) > splice site 3 (13.0) > splice site 1 (12.5) > splice site 4 (12.0) > splice site 2 (11.0) which are consistent with the fact that intron 5 and 6 are removed earlier than other introns (Table 6). However the order of intron removal of the rest of the introns are not in accordance with the experimental order of intron removal of 5/6 > 7/4 > 2/1 > 3 [47]. The facts may indicate involvement of some other factors in splicing mechanisms such as thermodynamics of secondary structures, RNP stabilities and others [48].

3.1.1.3 25VD3H, APRT and Insulin Gene Transcripts

These genes are not typical hnRNA type pre-mRNA which is comprised of only 10–15% of coding region. Instead the 25VD3H has 52.9% exons, the APRT has 39.1% exons and the insulin gene has 32.5% of exons (Table 2a). In these genes, the shorter the gene the more ESEs content was observed. In addition, ESE densities are higher at the splice sites which were not observed in FMR1 and the ovomucoid genes. It is interesting that the average ESE of 5 genes are more abundant at 5’ splice sites than 3’ splice sites (Table 7) suggesting that the 5’ splice sites are the driving force for spliceosome formation.

In summary ESE screening revealed the following facts:

  1. The ESEs are more abundant in smaller gene products than large genes and more abundant in the order of splice sites (16.99/100nt)>exons (16.37/100 nt)> introns (15.86/100nt).
  2. The ESE distributions in transcription unit are gene specific with some consensus such as
    1. SF2/ASF is clustered more in 1st exon (prevents R-loop formation),
    2. SC35 is more clustered in 5’ half and the central region (elongation and maintenance of transcription by recruitment of pTEFb). The SC35 has active role in transcriptional elongation [3].
    3. SRp40 and SRp55 are more clustered in the central and 3’ half regions.
    4. Mutations including SNP and indel (insertion/deletion) change ESE distribution and produce variant mRNAs
    5. ESEs and 5’/3’ splice sites strength influence alternative splicing.
    6. ESS are also abundant in the genes which may counter-act to ESE and valance of ESE/ESS may become operational for successful splicing.

3.1.2 ESE Distribution in Non-Coding RNA Transcript

Abundant SR protein binding sites regulating splicing reactions are found not only in intron containing transcripts, but also found in non-intron containing pre-mRNAs as well as noncoding RNAs. Accordingly, it was found that ESEs have extra functions other than in splicing.

The multi-exonic and mono-exonic intergenic lncRNAs (long non-coding RNA) are identified in human which numbered 14,484 multi-exonic and 46,517 mono-exonic sites [49]. Although the intronic lncRNAs have less sequence conservation, the clustering of ESEs at the splice sites appear to be mirrored the protein coding genes. The exons have high GC content.

3.1.2.1 Repeat DNA Sequence Elements

This category of DNA is comprised of ~45% of the total genome and most of them are silent and a few of them are transcribed in normal condition. The changes in their expression (either increased or decreased) are observed under cellular stress conditions such as after heat shock treatment.

Of these genes, Alu (~10–15%) and LINE1 (~7-!7%) are predominant elements. The Alu repeat is composed of 281 nucleotides with the components of left half and right half. The LINE1 repeat is ~5–7 kb, mostly truncated and non-transcribed. Only ~30 to 100 copies are active in producing endonuclease and reverse transcriptase for retro-transposition (transposase). Other genes in this group include human YRNAs, SVA, di/tri-nucleotide repeats and others. The Alu RNA and hYRNAs are transcribed by RNA polymerase III and multiple dispersed loci are found to produce scRNA [29]. The hYRNA genes are clustered in chromosome 7 [50, 51]. Increased Alu expression has a multitude of effects on other gene expression. In general, these compartment of DNA sequences have approximately equal numbers of ESEs in total ~15 to 17 (SF2/ASF+SC35+SRp40+Srp55) per 100 nucleotides (Table 8).

(a) ESEs in Alu RNA:

The rat Novikoff hepatoma 4.5S RNAI, the first nuclear small RNA sequenced, is identified as a rodent repeat element of human Alu RNA homolog.

JMG2018-102-TaeSukRo-ChoiChina_F13

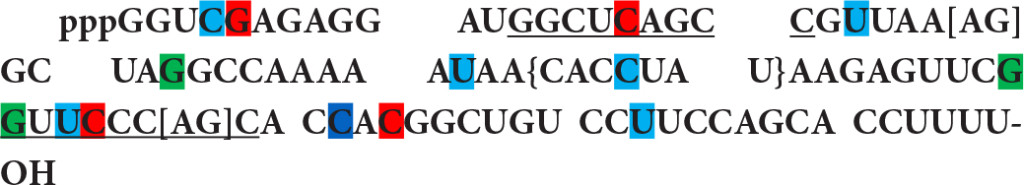
This RNA contains the RNA polymerase III promoter box A and box B like motifs (underlined) and shows interesting enhancer motifs resembling an Alu element transcript. There are 4 motifs of SF2/ASF (first nucleotide is marked in red), 3 motifs of SC35 (green), 6 motifs of SRp40 (bleu) and one motif of SRp55 (navy). It also exhibits 3’ splice sites, [AG] at nucleotide 27 and [AG] at nucleotide 67 as well as 10 branch sites with a highest score +3.15630 at nucleotide 45 {CACCUAU}. In comparison with known Alu elements in FMR1 gene, the resemblance of 4.5S RNA I in ESE, 5’ SS, BS (branch site), and 3’ SS distribution (Table 8) suggests that 4.5S RNA I is more likely an Alu gene expressed in Novikoff hepatoma cells.

Alu class transposons contain ~15–18 total ESEs (SF2+SC35+SRp40+SRp55) with some differences in dominant ESE clustering. Most of them (+ orientation) is dominated by SF2 and 5’ splice sites while Alu (-) has SC35 domination and branch site with 3’ splice sites. Human Y RNA and rat 4.5S RNA I have SRp40 clustering domination. The SRp55 is least abundant in all classes of Alu elements. The cytoplasmic human Y RNAs have been shown to be involved in chromosomal DNA replication [30].

The Alu element has been shown to have many different functions in DNA replication, transcription, splicing (canonical, altenative, exonization and others), gene insertions (transposons) and others [52]. It is interesting to observe that (+) oriented Alu sequences have more 5’ splice sites but the (-) oriented Alu sequences have more 3’ splice sites. It may suggest that exonization may occur from 5’ side of (+) Alu elements and 3’ side exonization from (-) Alu elements. The SRP RNA (7SL RNA) has Alu elements in the molecule [53]. The 7SL SRP (Signal Recognition Particle) is involved in nascent protein guidance into secretory vesicles. In addition, the Alu element in SRP RNA (7SL RNA) is involved in retroviral packaging such as in HIV-1. The retroviruses have been shown to contain host RNA packaged within it, especially the 7SL RNA by interaction with viral Gag protein [54]. It is estimated that there are ~3 to 4 fold molar excess 7SL over monomer of MLV genomic RNA and ~6 to 7 fold molar excess of 7SL over HIV genomic RNA in viruses.

3.1.2.2 ESEs in MALAT1, NEAT1 and DNA Breakpoints

The long non-coding RNAs such as MALAT1 (NEAT2) and NEAT1 are found in nuclear speckles and paraspeckles respectively in the nuclei [55]. The plethora of long non- coding RNAs are known to be synthesized in the enhancer region, intergenic region, intronic region, imprinting region, X-chromosome inactivation region, region of antisense transcription in the gene and others. They have different special functions in enhancer activity, chromatin interactions, transcription, processing/splicing, transport, stability of RNA transcripts, miRNA sequestration, translation and others.

(a) The MALAT1 (Metastasis Associated in Lung  Adenocarcinoma Transcript 1) RNA

The MALAT1 RNA is an lncRNA with a chain length of 8,758 nucleotides (NCBI; NR_002819.3) and the gene is located at the chromosome 11q13. The gene is expressed highly in lung, pancreas, prostate, ovary, colon and other normal organs.

The MALAT1 (Metastasis Associated Lung Adenocarcinoma Transcript 1), also known as NEAT2 (Nuclear-Enriched Abundant Transcript 2), is an abundant nuclear RNA. In association with SC35, it is localized in nuclear speckles (IGC; Interchromatin Granule Cluster) [55, 56]. It is expressed in NSCLC (Non-Small Cell Lung Cancer) and the MALAT- 1 expression is increased three-fold in metastatic NSCLC, and in some cases (6 cases from 23 cases) in association with loss or gain of the chromosome 11q region. The high expression of MALAT-1 is associated with a poor prognosis and worse survival [57]. The MALAT- 1 is upregulated in high Gleason score and castration resistant prostate cancer and the siRNA against MALAT-1 inhibited prostate cancer cell growth [58].

The MALAT1 RNA regulates splicing, alternative splicing, nuclear organization, epigenetic regulations; and is known to be involved in human diseases especially in cancer. In lung cancer, MALAT1 actively regulates metastasis associated gene expression and increases cell motility without an effect on splicing. The ASO (antisense oligonucleotide) to MALAT1 prevents metastasis after tumor implantation in mouse xenograft model [59]. The regulation of splicing is involved by sequestration and distribution of SR proteins. The nuclear speckles contain not only SC35 but also SF1, SF2, B”-U2 snRNP, PRP6, SON (SR-related protein) and others. The depletion of MALAT1 increases dephosphrylated form of SR-proteins (inactive) leading to alternative splicing [56]. The MALAT1 gene location at chromosome 11q13.1 is also associated with chromosome breakpoint in renal cell carcinoma [60]. The ESE distribution in MALAT1 has the same pattern as in the DNA break points reported in various genetic diseases [26]. The MALAT1 and DNA breakpoints have the SRp40 clustering domination and SRp55 is the least abundant. They have the smallest number of ESEs in total (Table 9). It is interesting to point out that SRp40 motif sequence is ACDGS (where D = A, G, or U and S = G or C) and one of the sequences can be ACUGG [20,21,22]. The CUGG motif is also present at the PSS (PGBD5-specific signal sequence; CTGGAATGCAGTG). The PGBD5 is a transposase elevated in pediatric solid tumors and responsible for the gene re-arrangement[61]. Low abundance of SF2 clustering is observed in MALAT1 and DNA breakpoints. The SF2 has been shown to prevent mutagenic R-loop formation [2]. The example of ESE screening in MALAT1 transcript is illustrated in Fig. 9. Although the MALAT1 RNA is processed by 3’ end cleavage by RNase P and the end is stabilized by triple helix, the transcript has numerous 5’ SS, BS, 3’ SS as well as poly (A) sites. The ESEs are clustered at 5’ and 3’ splice sites (marked by arrows in Figure 9). Whether these sites are operational or inactive is not known. There have been at least 10 alternatively spliced small isoforms reported.

This group of sequences have at least total ~11/100nt ESEs and SRp40 dominates over others. The less abundance of SF2 and SRp55 are observed in DNA fragile region of the genome.

(b) NEAT1

The NEAT1 RNA is transcribed from chromosome 11q13 region (multiple endocrine neoplasia locus) and overexpressed in many cancer cells. In prostate cancer cells and breast cancer cells, the NEAT1 expression is increased in ERα dependent manner and the increased NEAT1 changes the chromatin architecture at the promoter site, increasing transcription for the cancer progression. Knockdown of NEAT1 leads to inhibition of cancer progression in prostate cancer [62], and inhibition of growth and apoptosis in breast cancer cells [63].

The NEAT1 and MALAT1 are associated with active genes. The NEAT1 is present at both TSS (transcription start site) and TTS (transcription termination site) while the MALAT1 is present at the TTS and gene bodies (West et al., 2014). In the NEAT1, SF2/ASF is dominating while total number of ESEs (SF2+SC35+SRp40+SRp55) is nearly equal to MALAT1 (Table 9).

3.1.2.3    ESEs in Satellite DNA

Satellite DNA Gene Expression

The satellite DNAs are mostly located in the heterochromatin areas such as peri-centromeric area and sub-telomeric area. These include α-satellite, β-satellite, γ-satellite, satellite 1, 2, 3, 4, 5 and others. The α-satellite constitutes ~5% of total human genome and its monomer is ~171 base pairs. The tandemly repeated sequences are present at the heterochromatin and centromere forming kinetochores. A subfamily of α-satellites are present in acrocentric chromosomes 13, 14 and 21 [64]. The human β-satellite DNA, isolated by Waye and Willard [65] showed diverged ~68 base pair monomer repeats with base composition of G+C in a range of 39–51%. They cloned two β-satellites, pB3 and pB4, and characterized them. The pB3 β-satellites are present only in the human chromosome 9 centromeric region and the pB4 β-satellites are present more widely among acrocentric chromosomes 13, 14, 15, 21 and 22 and others. In acrocentric chromosomes, the β-satellites are present both proximal and distal to rRNA gene clusters [65]. The satellite I, II and III are present at the pericentromeric region of human chromosomes 3, 4, 9, 13, 14, 15, 21 and 22 [66]. The gamma satellite DNAs are present at the pericentromeric region of human chromosome 8, X and Y. It is composed of GC- rich 220 bp unit of tandem arrays [67]. The human gamma-satellite DNA arrays contain CTCF and Ikaros binding sites [68].

These compartments of DNAs are also rarely expressed and their marked changes can occur upon stress and other alterations in cellular condition. An example is demonstrated in HeLa cells upon heat shock at 42oC in comparison with the cells at 37oC. Under this condition, the transcription of sense RNA from satellite III increased >10 times above normal while antisense RNA transcription diminished 2-fold. The transcript remained associated at the transcription site at chromosome 9q12 forming stress granule. The transcription is by RNA polymerase II and HSF1 (heat shock transcription factor 1) is responsible for the increased transcription [69]. As detected by FISH (Fluorescent In Situ Hybridization) in transitional cell carcinoma of the urinary bladder, the pericentric satellite at 9q12 is often lost early in cancer progression [70]. The association of chromosomal fragility (chromatid breaks, chromosome break, chromosome arm loss and others) at the band 9q12 and triple A syndrome (alacrima, achalasia and adrenal insufficiency) is observed, although the AAAS gene is identified at the chromosome 12q13 [71].

Gamma Satellite DNA in mouse is transcribed in developmentally regulated manner. In mouse, cassini which belongs to the γ-satellite/major satellite is up-regulated in drug (Vincristine) or heat shock treated ALL (Acute Lymphoblastic Leukemia) cells [72].

Overall, in satellite DNA, the total number of ESEs vary widely in their distribution. However, SF2/ASF is dominating in all of the different satellite DNAs (Table 10). A different class of satellite DNA has a wide range of different numbers of ESE elements suggesting different satellites have different functions. However the consensus is the high incidence of clustering of SF2/ASF in all the satellite DNA. The SRp55 clustering is relatively high in this group of DNA.

3.1.2.4 ESEs in Short Repeat Sequences

The expanded CUG repeats or CAG repeats in untranslated regions of mRNA have profound effects on cellular metabolism by RNA foci formation. In myotonic dystrophy, the MBNL sequestration leads to aberrant splicing of pre-mRNAs [73]. It is interesting to see that CUG repeats have clustering of SC35 and SRp55 ESE elements which maybe involved in SR protein sequestration. The CAG expansion has the same effect as CUG expansion and CAG expansion has SRp55 clustering (Table 11).

The ESE distributions in non-coding RNAs are summarized as follows:

  1. The consensus Alu sequence contains 15–17 ESEs (SF2 + SC35 + SRp40 + SRp55) per 100 nucleotides. The SF2 dominates over other ESEs but there are variations in individual Alu elements. (Table 8).
  2. Satellite DNA has SF2 domination over other ESEs (Table 10)
  3. DNA breakpoints and MALAT 1 have lesser ESEs and SRp40 dominates over other ESEs (Table 9).
  4. Repeat sequences have specific ESE enrichment: SF2 in CGG repeats, SRp55 in CAG repeats, SC35 and SRp55 in CUG repeats, and SF2 in CCUG repeats (Table 11).

4. Discussion

The surprising finding of the discontinuous gene structure and the necessity of removing of intervening sequences led to the discovery of spliceosomes and their regulatory factors. A group of SR proteins (serine/arginine rich proteins) have been found to have critical impact on the precision of splicing reactions for correct protein production. This group of protein was found to have a role in splice site recognition and enhancement of splicing reactions at the given site. Additional surprising facts are the presence of these elements not only in intron containing pre- mRNA, but also in non-intron containing mRNA, as well as in non-coding RNA transcripts. Accordingly, the functions of SR-proteins were expanded not only in splicing reactions but also in extra functions in addition to splicing. In fact, SR proteins are involved in all the steps of RNA metabolism including, transcription, DNA stability, splicing, maturation, transport, and translation.

When transcription is activated, SR proteins are enriched around the transcription sites [74]. The SR proteins also bind to histone H3 tails in a dynamic manner [75]. They are directly involved in transcription at the initiation, elongation and termination sites. The SF2/ASF has been found to prevent R-loop formation [2, 76] at initiation as well as during transcription, thus leading to protection of DNA from cleavages. The SC 35 has a p-TEFb activation function facilitated by binding to ESE in nascent transcripts, recruitment of p-TEFb-7SK RNP complexs and release of p-TEFb from 7SK RNP [77].

4.1 ESE function in Splicing

The splicing reactions include (a) canonical splicing and (b) alternative splicing.

4.1.1 ESEs in canonical splicing

A large number of splice site analyses by SR protein binding by the CLIP method revealed the ESEs are clustered at the exons within ~150 nucleotides of the splice site [1]. The functions of ESE in constitutive splicing include:

(i) Correct splice site selection and enhancement in constitutive splicing, (ii) Enhancement of weak splice site splicing, and (iii) Enhancement or suppression of splicing in a context dependent manner. The ESE works as an individual SR protein or together with other proteins (SF2, SC35) at the site, and each ESE regulates a different group of splicing events.

The SF2/ASF has been shown to require first-step splicing and bimolecular ligation of 5’ and 3’ splice sites in the initial phase of a second-step splicing reaction. The SF2/ASF requirement is demonstrated in the IgM pre-mRNA M2 exon, Cis-splicing of HIV-tat exons 2 and 3, and β-globin exons 1 and 2 [78]. Different ESEs have differences in their activities in specific pre-mRNAs.

4.1.2 ESE in Alternative Splicing

Alternative splicing is one of the major causes of diversity in protein production from ~25,000 hnRNA coding genes. Errors in alternative splicing is also a dominant causes of diseases. Some of the factors involved in differences in splicing are the ESE (exonic splicing enhancer), ESS (exonic splicing silencer), ISE (intronic splicing enhancer) and ISS (intronic splicing silencer) regulators. The specific SR-proteins have specific alternative splice site selections in specific cells and during developmental stages. The mammalian gene construct with multiple introns confers more than 90 to 95% alternative splicing, producing expanded diversities of protein production. Alternative splicing is regulated by ESEs present in pre-mRNA sequences and single or multiple SR proteins which contain one or two RRMs at their N-terminal region with specific sequence element binding abilities. The knock down of certain ESE binding proteins revealed that ESEs not only enhance the splicing but also inhibit the splicing, and both depend on the specific context. The alternative splicing includes alternative 5’ selection, exon exclusion, intron inclusion, alternative splice site selection in the exon or intron, and alternative poly (A) site selection. One of the well worked out cases of disease, due to a splicing variation, is in SMA (spinal muscular atrophy). Humans have the SMN1 and SMN2 genes at chromosome 5q13.1. The SMN2 has one nucleotide difference at the position +6 in exon 7 from SMN1 where it is U in SMN2 and it is C in SMN1. This difference in SMN2 acts as an ESS (exonic splicing silencer) which causes the exclusion of exon 7 in the final product which is incompatible with a full length SMN1. This exclusion causes a disease SMA when homozygous loss of SMN1 is present [23].

i) Alternative Promoter Selection

These changes in promoter selection were most affected by downregulation of SRp54. Fewer changes occurred by Rbp1L downregulation among the following 8 ESE binding proteins: B52, SRp54, XL6, SF2, SC35, Rsf1, Rbp1L and Rbp1. Examples include the distal promoter usage being reduced in the Nfat gene when XL6 or B52 are reduced, while the proximal promoter usage is increased in the Indy gene when XL6 or B52 are reduced [1].

ii) Alternative Splice Site Selection

The mechanism of ESE effects on alternative splicing depends on the presence of ESE, ESS, ISE and ISS. The splicing stimulatory factor binds to ESE and stimulates correct splicing, while competitive splicing inhibitory factor binding to the same locus, or close proximity to it, leads to exon skipping.

An alternative splicing example occurs in the Fibronectin EDA exon (also called EIIIA or EDI). The alternative splicing is tissue specific in hepatocytes where EDA is always excluded. In other tissues varying proportions of EDA inclusion and exclusion are observed. Using minigene constructs containing a EDA exon in which ESE (GAAGAAGA) and ESS (CAAGG) were included, it was found that in the absence of ESE, EDA is excluded. However, in the absence of ESS, 100% of the transcripts included the EDA exon [24]. Another factor involved in alternative spicing is mRNA modification. The m6A is present most frequently close to the stop codon and ~50 nucleotides upstream from the cleavage site for polyadenylation [79]. The presence of m6A provides the binding site for YTHDC1 [nuclear m6A binding protein with YTH domain (Tyrosine, Threonine, Histidine)] and in collaboration with SRp20 (SRSF3), it enhances inclusion of an m6A containing exon. On the other hand, SRSF10 (SRp38) enhances exclusion of m6A containing exons in splicing. The YTHDC1 binds to SR-proteins of SRp20 and SRp38 but not other SR-proteins. It is dependent on SRp20 and SRp38 binding sites which act in close proximity to m6A in pre-mRNA [80].

iii) Alternative Poly(A) Site Selection

With regard to alternative poly (A) site selection (APA), the SR protein XL6 has largest number of CR-APA (coding region alternative poly (A) site selection) events and Rbp1 has least number of events. In most of the cases (either CR-APA or 3’UTR APA), reduction of SR proteins leads to preference of proximal site usage over the distal site usage except a few cases such as B52 and SC35 where many more events resulted in distal site usage. The CR-APA may interact with spliceosome components, but 3’UTR-APA acts independent of splicing events and may implicate SR protein interaction with the 3’ processing complex [1].

In our study, the ESE distributions are gene specific and the smaller the gene the more abundance of ESEs exists. The consensus patterns are the abundance of SF2/ASF in the 1st exon in comparison with the last exon and SRp40 and SRp55 are more shifted toward the 3’ side of the gene. These findings suggest that the functions of SF2/ASF and SRp40/SRp55 may be different from simple splicing enhancement. SF2/ASF has been reported to have suppressive effects on R- loop formation for the DNA stabilization.

4.1.3 ESEs on mRNA Export, Localization, Translation and Non-sense Mediated Degradation (NMD)

A subset of SR proteins shuttle between the cell nucleus and the cytoplasm. These include SF2/ASF, 9G8, SRp20 and others. These SR proteins bind to TAP, which is an mRNA export receptor, by its N-terminal domain and is involved in export of intron spliced mRNA as well as non-intron containing mRNA [7]. The SF2/ASF, in the cytoplasm, is associated with polysomes and stimulates translation. Using a gene construct containing EDA ESE, which is recognized by SF2/ASF and 9G8, it was observed that reporter gene expression is stimulated by SF2. On the other hand, in the gene constructs containing ESE motifs for SRp20 or SC35, there was no enhancement of translation by SRp20 or SC35 [6]. The SRp40 and SRp55 motifs have stimulatory effects on long insulin chain mRNA translation [35, 36].

The shuttling of SR proteins is regulated by phosphorylation of the SR domain in these proteins. The phosphorylated SR proteins enter the nucleus. On the other hand, the dephosphorylated SR proteins exit the nucleus [81]. Some shuttle freely and some carry mRNA with them into the cytoplasm. The SR proteins that function as export adapters include SRp20 and 9G8. These SR-proteins bind to the histone H2a mRNA export element and enhance mRNA export [82].

4.2 ESEs in Non-coding RNA

The cross-linking and immunoprecipitation by SR protein antibodies, followed by high-throughput sequencing (iCLIP-seq), revealed that the SR protein binds not only to intron containing pre- mRNA but also to diverse classes of RNAs including intronless pre-mRNA and non-coding RNAs which are snRNA, tRNA, snoRNA, lncRNA and others. These facts implicate the ESE’s function in extra biological reactions other than in splicing. The global landscape shows the clustering of ESEs in exons and introns of any intron containing pre-mRNAs more than 5’UTR, and the least is found in 3’ UTR. Among non-coding RNAs, the high ESE clustering is present in snoRNA and tRNA as well as other non-coding RNAs. The clustering of ESE in rRNA, snRNA and miRNA is low in comparison with other non-coding RNAs [1].

In addition, we examined the distribution of ESEs in lncRNA as well as DNA breakpoints regions. The distribution of specific ESEs in different ncRNAa was revealed where Alu RNA was high in abundance of ESEs with SF2/ASF domination. The cancer related lncRNA MALAT1 and DNA breakpoints have relatively less ESEs but shows SRp40 domination. The ESEs in satellite DNAs have a varying number of ESEs in the order of α (~12/100 nt) <β (~16.5/100 nt) <γ (~22/ 100 nt) in abundance.

Satellite III has ~ an equal number of ESEs as α-satellite. Whether the ESE has any role in transposon activity is not yet known but the abundance in small genes and Alu elements suggest that they may play a role. The presence of specific ESE motifs in triplet repeats is interesting in view of the alterations in splicing by sequestration of splicing factors and co-factors [73].

Some of the known extra activities of ESEs are as follows:

  1. SF2 and SC35 have a role in maintenance of DNA stabilities by preventing mutagenic R- loop formation, persistent R-loop, and hypermutation [2].
  2. SF2 and SC35 also enhance transcription by recruiting p-TEFb and other transcription factors to the transcription complex site. Depletion of SF2/ASF or/and SC35 decrease transcription activity and SC35 enhances transcriptional elongation in a gene specific manner. Deletion of SC35 leads to accumulation of pol II on gene bodies [3]
  3. Involved in export, localization, translation and nonsense mediated decay (NMD)
  4. Involved in miRNA biogenesis

SRSF1 (SF2/ASF) and SRSF3 (SRp20) are considered as oncogenes because they are expressed highly in tumor cells such as human U20S and in HeLa cells. Knock-down of these SR-proteins prevents cell proliferation of these cells [83]. These SR proteins work alone at one ESE as well as in combinations with ESEs. They also have inter-relations between SR-proteins. Overexpression of SRp20 increases SF2 expression and overexpression of SF2 increases SRp20 expression. The knock-down or overexpression of SRp20 affect many cell cycle control proteins in alternative splicing and expression.

In mice, the SRp20 gene has 7 exons and its exon 4 is alternatively spliced depending on the nutritional state of the cells. Under fed condition, exon 4 is skipped producing a full length protein and under starved condition, the exon 4 is included and produces a truncated protein without a SR domain at the C-terminus [84].

Satellite DNA is a component of heterochromatin at the centromere and telomere regions. Some of the sequences are well conserved and some have stochastic mutations which differ from species to species. The α-satellite is composed of ~170 nucleotides of repeat sequences or contains oligonucleotide (pentanucleotides) repeat elements. It has a specific protein binding domains such as the CENP A or CENP B binding domains. It is also transcriptionally active, producing siRNA precursors or ribozymes, as part of a 5’ or 3’ UTR mRNA transcript. Their transcriptional activity depends on development, cell types and stress conditions [85]. The inactive genes in heterochromatin have histone markers specific to that locus.

The Histone H3 lysine 9 methylation in C. elegans is generally a repressive modification on transcription. These H3K9me2 or H3K9me3 are enriched in tissue specific silent genes and repetitive elements. The H3K9me2 or H3K9me3 modifications stabilize and protect repeat rich genomes by suppressing transcription induced replicative stress. In met-2 set-25 double mutants, transposons and simple repeats are de-repressed in germline and somatic tissues, leading to increased repeat specific insertions, deletions, copy number variations, R loops and enhanced sensitivity to replicative stress [86].

Table 2a. ESEs in Gene Transcripts (Number of ESEs/100 nt)

FMR1

Ovomucoid

25VD3H

APRT (Hams)

Insulin

Total length

10.53

(39,224nt)

14.59

(6,067nt)

17.14

(4,825nt)

17.02

(2,251nt)

19.97

(1,430nt)

Exons

10.96

(4,456nt)

15.80

(1,424nt)

17.03

(2,551nt)

17.42

(881nt)

20.64

(465nt)

Introns

10.47

(34,768nt)

15.22

(4,643nt)

17.20

(2,274nt)

I6.75

(l,370nt)

19.64

(965nt)

Splice Sites

9.82

(3,226nt)

14.90

(1,400)

18.42

(1,569nt)

18.07
(800nt)

23.72

(392nt)

The ESE motifs are scanned by ESE finder 3 (Cold Spring Harbor Laboratory) and counting the number of ESEs above threshold score designated in the program. The threshold values are SF2/ASF (1.956); SF2/ASF (IgM-BRCA) (1.867); SC35 (2.383); SRp40 (2.67) and SRp55 (2.676).

The total number of ESEs is divided by the total number of nucleotides and multiplied by 100. The values in the Table represent the number of ESEs per 100 nucleotides in different gene transcripts.

Transcript sequences were obtained from NCBI and Ensemble release.

The human insulin gene (NCBI; J00265), hamster APRT (adenine phosphoribosyltransferase) gene (NCBI; X03603), human 25-hydroxyvitamin D3 1-α-hydroxylase gene (NCBI; AB006987), chicken ovomucoid gene (Ensemble release 43, http://www.ensemble.org), and FMR1 (NCBI; L29074.1) (see Materials and Methods).

The shorter the gene, the more ESE abundance is found. The Exons in FMR1 are 11.36%, in ovomucoid they are 23.47%, in 25 hydrxyvitamin D3 1-α hydroxylase they are 52.87%, in APRT they are 39.14% and in insulin they are 32.52%.

Table 2b. Total ESE counts in Gene Transcripts

SF2/ASF

SC35

SRp40

SRp55

FMR1

(Human) 39,224 nt

830

1,108

1,290

902

Ovomucoid (Chicken)

6,067 nt

227

230

237

190

25VD3αH

(Human) 4,825 nt

270

220

194

142

APRT

(Hamster) 2,251 nt

109

113

107

54

Insulin (Human)

1,430 nt

115

74

65

45

Total 53,797 nt

1,550

1,745

1,893

1,332

The numbers of ESEs are counted and summed up for the total number in all gene transcripts (53,797 nucleotides). Numbers in the SF2/ASF column represent an average of SF2/ASF (1.956) and SF2/ASF (IgM-BRCA) (1.867). Numbers in parenthesis are threshold values for each motif. Each individual gene has its characteristic ESE content but overall, the SRp40 is the most abundant and SRp55 is the least abundant in this group of coding genes.

Table 2c. Individual ESEs in Gene transcripts (Number of ESEs/100 nt)

Gene

SF2/ASF

SC35

SRp40

SR55

Σ

FMR1 (39,224 nt)

2.12

2.82

3.29

2.30

10.53

Exon   (4,456 nt)

3.18

2.60

3.21

1.97

10.96

Intron  (34,768 nt)

1.98

2.85

3.30

2.34

10.47

SS       (3,226 nt)

2.26

2.11

3.50

1.95

9.82

 Ovomucoid (6,067 nt)

3.76

3.79

3.91

3.13

14.59

Exon          (1,424 nt)

4.57

4.28

3.72

3.23

15.80

Intron         (4,643 nt)

3.52

4.64

3.96

3.10

15.22

SS              (1,400 nt)

4.47

3.36

3.57

3.50

14.90

25HVD3H (4,825 nt)

5.62

4.56

4.02

2.94

17.14

Exon          (2,551 nt)

5.47

4.78

3.80

2.98

17.03

Intron         (2,274 nt)

5.72

4.31

4.27

2.90

17.20

SS              (1,569 nt)

6.57

5.35

4.40

2.10

18.42

APRT   (2,251 nt)

4.84

5.02

4.75

2.40

17.02

Exon    (881 nt)

5.39

5.22

3.63

3.18

17.42

Intron  (1,370 nt)

4.49

4.89

5.47

1.90

16.75

SS        (800 nt)

5.32

5.00

5.50

2.25

18.07

Insulin (1,430 nt)

7.10

5.17

4.55

3.15

19.97

Exon    (465 nt)

6.45

4.73

5.16

4.30

20.64

Intron  (965 nt)

7.41

5.39

4.25

2.59

19.64

SS        (392 nt)

7.65

7.14

5.61

3.32

23.72

Av. 5 genes; Total

4.69

4.31

4.10

2.78

15.85

                       Exon

5.01

4.41

3.78

3.13

16.37

                       Intron

4.62

4.42

4.25

2.57

15.86

                       SS

5.25

4.59

4.52

2.62

16.99

The numbers of ESE in 100 nucleotides are calculated in total sequences, exons only, introns only and splice sites. The splice sites include 200 nucleotides at each splice site which include 100 nucleotides on the 5’ splice site and 100 nucleotides on the 3’ splice site. Numbers in the SF2/ASF column represent an average of SF2/ASF (1.956) and SF2/ASF (IgM-BRCA) (1.867).

ESE counts are made above the default threshold value stated in Table 2a. It is evident that splice sites have more ESE cluster than other sites in the order of SS>Exon>Intron. However, there are gene specific differences. It is interesting to note that SC35 and SRp40 are more abundant in introns than in exons.

Table 3a.  ESE Ratio 1st/last

Gene

SF2/ASF

SC35

SRp40

SRp55

Σ

Insulin

 1.36

1.16

1.74

0.47

1.16

APRT

 2.45

1.46

0.58

0.84

1.36

25VD3H

 2.68

1.41

1.55

1.04

1.66

Ovomucoid

 1.78

0.69

1.19

1.66

1.26

FMR1

 9.17

1.94

1.21

1.19

2.86

Σ

 2.62

1.27

1,27

0.91

1.52

Table 3b. ESE Ratio last/1st

Gene

SF2/ASF

SC35

SRp40

SRp55

Σ

Insulin

0.74

0.86

0.58

 2.11

0.8

APRT

0.41

0.68

 1.71

 1.20

0.74

25VD3H

0.37

0.71

0.65

0.96

0.60

Ovomucoid

0.5

 1.45

0.84

0.60

0.79

FMR1

0.11

0.51

0.83

0.84

0.35

Σ

0.38

0.79

0.79

 1.09

0.66

The numbers of ESEs are counted and calculated as numbers of ESEs per 100 nucleotides. The ratio of the first exon to the last exon is the product of division of numbers of ESEs in the first exon by the numbers of ESEs in the last exon.

The ratio of last to first is also calculated accordingly. It is evident that the ratio of 1st/last is highest in SF2/ASF and is above 1 in all cases, indicating clustering of SF2/ASF in first exons and an abundance of sum of ESEs (Σ column) in first exons are higher than in the last exons. The overall abundance of ESEs in last exons are fewer but the SRp55 is relatively more frequent than in the first exon.

Table 4. SR protein Binding Sites per 100 nucleotides in RRE and CTE

RNA

SF2/ASF

SC35

SRp40

SRp55

Σ

RRE (240 nt); Default

  5.42

  3.75

  3.75

  4.58

17.5

            Above 0

16.04

23.3

25.0

17.92

82.3

CTE (235 nt); Default

  6.17

  3.83

  5.53

  2.55

18.09

           Above 0

20.64

21.28

24.68

16.17

82.77

The SR protein binding sites are screened by ESEfinder 3 (CSHL). The default threshold values are: SF2/ASF (1.956); SF2/ASF (IgM-BRCA) (1.867); SC35 (2.383); SRp40 (2.67) and SRp55 (2.676). The numbers of SF2/ASF in the table are the averages of SF2/ASF and SF2/ASF (IgM- BRCA). Those above 0 were counted for each SR protein binding motif. At the default threshold, SF2 is the most abundant motif and above 0 counts the SRp40 is the most abundant motif. Accordingly, the translation promoting activity of introns containing genomic RNA are motif specific rather than being due to their abundance.

The RRE sequence is from Daugherty et al., [87]. The CTE sequence is from Rizvi et al., [88]

Table 5. ESE Distribution (ESE/100 nucleotides) in FMR1 Gene Transcript

FMR1 Gene

SF2/ASF

SC35

SRp40

SRp55

Σ

Total (39,224 nt)

2.12

2.82

3.29

2.30

10.53

Exons (4,456 nt)

3.18

2.60

3.21

1.97

10.96

Introns (34,768 nt)

1.98

2.85

3.30

2.34

10.47

SS (3,226 nt)

2.26

2.11

3.50

1.95

9.82

Alu (2,244 nt)

4.93

5.21

4.32

1.34

15.80

LINE (211 nt)

4.74

2.37

2.84

4.27

14.22

Σ

19.21

17.96

16.96

14.17

The FMR1 gene is typical of hnRNA with only 11.36% exons, but the ESE distribution is different from other shorter pre-mRNAs with high a proportion of exons. However, the Alu, LINE and other short repeating sequences are clustered with ESEs.

Table 6. ESEs /100 Nucleotides at Splice Sites

JMG2018-102-TaeSukRo-ChoiChina_F14

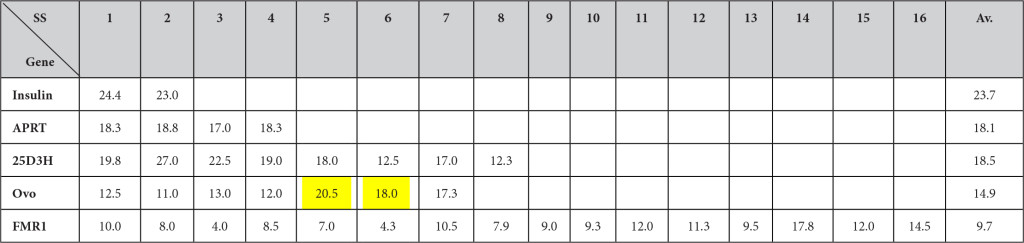
The numbers of ESEs at splice sites were counted 50 nucleotides upstream from GU and 50 nucleotides downstream from the G at GU for 5’ splice sites and 50 nucleotides upstream from G at AG and 50 nucleotides downstream from AG from the 3’ splice sites. If exons or introns were shorter than 50 nucleotides, they includde entire exons or introns without extending further. The numbers of ESEs then were calculated per 100 nucleotides. It is evident that the high clustering at splice sites is seen in shorter genes such as the insulin gene, but the trends are fading when genes become longer. The yellow highlighted sites in ovomucoid genes indicate where the splicing is taking place much faster (or earlier) than other sites.

Table 7. ESE Distribution at 5’ and 3’ Splice Sites, ESEs/100 Nucleotides at Splice Sites

Gene

SF2/IgM

(Average)

SC35

SRp40

SRp55

Insulin (Human)

5’ SS

3’ SS

5’ SS

3’ SS

5’ SS

3’ SS

5’ SS

3’ SS

  7.81 > 7.50

    7.29 > 7.00

7.81 > 3.50

2.08 < 4.50

APRT (Hamster)

5’ SS

3’ SS

5’ SS

3’ SS

5’ SS

3’ SS

5’ SS

3’ SS

   6.00 > 4.63

  4.50 < 5.50

4.50 < 6.50

3.00 > 1.50

25VD3H (Human)

5’ SS

3’ SS

5’ SS

3’ SS

5’ SS

3’ SS

5’ SS

3’ SS

 6.63 > 6.50

 5.88 > 4.81

4.13 < 4.68

1.88 < 2.34

Ovomucoid (Chicken)

5’ SS

3’ SS

5’ SS

3’ SS

5’ SS

3’ SS

5’ SS

3’ SS

 4.00 < 4.99

 3.71 > 3.00

 3.14 < 4.00

4.57 > 2.43

FMR1 (Human)

5’ SS

3’ SS

5’ SS

3’ SS

5’ SS

3’ SS

5’ SS

3’ SS

2.47 > 2.06

3.5 > 1.85

3.13 < 3.87

1.88 < 2.03

Average (5 genes)

5’ SS

3’ SS

5’ SS

3’ SS

5’ SS

3’ SS

5’ SS

3’ SS

5.38 > 5.14

4.98 > 4.43

4.54 > 4.51

2.68 > 2.56

The numbers of SESs were determined at the 5’ and 3’ splice sites. The 100 nucleotides at the 5’ splice sites include 50 nucleotides of exon and 50 nucleotides from G at GU extend into introns. The 100 nucleotides at the 3’ splice sites include intron 50 nucleotides up to AG and 50 nucleotides in exon. The clustering is close to even between 5’ splice sites and 3’ splice sites, but in most cases (average of all 5 genes combined), a little more is evident at the 5’ splice sites.

Table 8. ESEs in Alu Elements (Number of ESEs in 100 nucleotides)

RNA

SF2/ASF

SC35

SRp40

SRp55

Total

5’SS

3’SS

Brnc. S

FMR1

Alu(+)(1,371 nt)

Alu(-) (873 nt)

Average

5.30

4.31

4.93

4.62

6.19

5,21

3.89

5.04

4.32

1.17

1.61

1.34

14.98

17.11

15.80

3.61

2.20

3.08

2.97

4.58

3.58

9.51

13.8

11.1

Consensus Alu

Major (120 nt)

Precise (118 nt)

PV(HS) (118 nt)

∑ (356 nt)

9.2

7.6

6.8

7.6

4.2

5.1

5.1

4.8

3.3

4.2

4.2

3.9

0.8

0.8

0.8

0.8

17.5

17.8

16.9

17.1

3.3

3.4

3.4

3.4

1.7

0.8

0.8

1.1

5.8

5.1

5.1

5.3

hYRNA (389 nt)

3.6

4.3

5.6

1.0

14.7

1.5

1.0

9.0

Fish SB (696 nt)

4.3

3.6

3.7

2.6

14.2

1.7

1.1

8.9

Rat 4.5S RNA I (96 nt)

3.65

3.13

6.25

1.04

14.07

0

2.08

10.4

Σ Average

5.60

4.53

4.52

1.23

15.91

2.39

1.88

8.45

The numbers of individual ESEs are counted in total numbers of nucleotides in a class of Alu RNAs and calculated numbers of ESEs per 100 nucleotides. The consensus is the total number of ESEs which is in the range of 15–18 per 100 nucleotides The SF2/ASF appears to dominate most of the Alu elements (Σ Average) while SRp40 is dominating in YRNA and rat 4.5S RNAI. The Alu (-) has SC35 domination over SF2/ASF. The Alu (+) has more 5’ splice sites than 3’ splice sites.

  • The Alu in FMR1 is from NCBI GenBank; L29074.1
  • The Consensus Alu sequences are from Maraia et al., [29]
    The Y RNA sequences are from Christov et al., [30].
  • The sequences of SB (sleeping beauty) are from Hackett et al., [31], Ivics et al., [89] and van Pouderoyen et al., [32]
  • The 4.5S RNA sequence is from Ro-Choi et al., [90]

Table 9. ESEs/100 nt in DNA Breakpoints, MALAT1 and NEAT1

Nucleic Acids

SF2/ASF

SC35

SRp40

SRp55

DNA Breakpoints (total 5,020 nt)
(-) Strand               (1,694 nt)

(H) Hybrid             (1,610 nt)

(+) Strand              (1,716 nt)

2.6

2.6

2.9

2.5

2.9

2.8

2.7

3.2

 3.5

 3.4

 3.7

 3.5

2.0

2.4

1.9

1.7

11.0

11.0

11.0

11.0

NEAT1                    (3,756 nt)

 3.7

2.9

3.1

2.1

11.8

MALAT1                (8,758 nt)

2.7

2.9

 3.6

1.9

11.1

The numbers of ESEs were counted above the default thresholds which are:

SF2/ASF (1.956); SF2/ASF (IgM-BRCA) (1.867); SC35 (2.383); SRp40 (2.67) and SRp55 (2.676) and calculated for the numbers of ESEs per 100 nucleotides. In this group of sequences, the SRp40 is dominating over other ESE motifs.

  • The DNA break points are from Liu et al., [26] and Chen et al., [91].
  • The NEAT1 sequence is from NCBI; NR_028272.1
  • MALAT1 is from NCBI; NR_002819.3.

Table 10. ESEs in Satellite DNAs (Numbers of ESE per 100 nucleotides)

DNA

SF2/ASF

SC35

SRp40

SRp55

α-Satellite Consensus 1 (171 nt)

2 (170 nt)

3 (171 nt)

4 (171 nt)

5 (169 nt)

Average

2.92

2.94

5.26

5.26

3.55

3.99

0.58

1.18

1.75

1.17

1.18

1.17

2.92

1.76

5.85

2.34

3.37

3.05

3.51

3.51

2.92

4.09

3.55

3.52

9.93

9.39

15.78

12.86

10.65

11.73

Chromosome 17 α-Satellite
(718 nt)

 4.46

0.97

3.48

2.65

11.56

Alphoid (334 nt)

4.19

1.50

4.19

3.29

13.17

β-Satellite

Acrocentric chromosome (955 nt)

5.13

3.66

4.61

3.46

16.86

Chromosome 9p12 β-Satellite (69 nt)

7.25

2.90

2.90

2.90

15.95

γ-Satellite (1,962 nt)

8.46

5.86

5.15

2.09

21.56

Satellite III

Chromosome 14 (1,404 nt)

2.42

1.42

2.35

1.14

7.33

Satellite III Chromosome 9
(158 nt)

5.06

3.16

3.86

0.63

12.71

The counting and calculations are same as in other tables.

There are wide ranges of ESE motifs in different classes of satellite DNA. However, the SF2/ASF appears to dominate in its abundance.

  • The human α-satellite consensus 1 (chromosome 20) is from NCBI, GenBank L06776.1
  • The human α-satellite consensus sequences 1 and 2 are from Waye and Willard, (1987). [92]
  • The human α-satellite consensus sequence 3, 4 and 5 are from Vissel and Choo, (1987). [93]
  • The human α-satellite consensus 4 (chromosome 4) is from NCBI, GenBank S67971.1
  • The α-satellite repeat from human chromosome 17 (718 bp) is from NCBI GenBank; L08550.1 The human alphoid (334 bp) is from NCBI, GenBank S49988.1
  • The β-satellite sequence (955 nt) is from NCBI, GenBank M81228.1(Acrocentric chromosome)
  • The β-satellite sequence (69 nt) in chromosome 9 is from NCBI, GenBank M25748.1
  • The human γ-satellite sequence (1,962 nt) is from NCBI, GenBank; X68546.1 (Chromosome 8)
  • The satellite III sequence (1,404 nt) is from NCBI GenBank; S90110.1 (Chromosome 14)
  • The satellite III sequence (158 nt) in chromosome 9q11-q12 is from Jolly et al., [94]

Table 11. ESE Clusters in Repeat Sequences

Repeats

SF2/ASF

SF2/ASF(lgM)

SC35

SRp40

SRp55

CGG Repeats

34/100

34/100

0

0

0

CAG Repeats

0

0

0

0

34/100

CUG Repeats

0

0

34/100

0

34/100

CCUG Repeats

1.38/1.956

26/100

O

0

0

AUUCU Repeats

0

O

O

0

0

The repeat sequences are from Mirkin, S.M. [33]

Repeat sequences are subjected to the ESEfinder3 and the selected motifs are above default threshold values. Numbers of motifs are calculated in 100 nucleotide bins. The SF2/ASF in CCUG, the positive motifs are at the +1.38, while threshold value is +1.956. At the +1.38, there are 26 motifs of SF2/ASF.

JMG2018-102-TaeSukRo-ChoiChina_F1

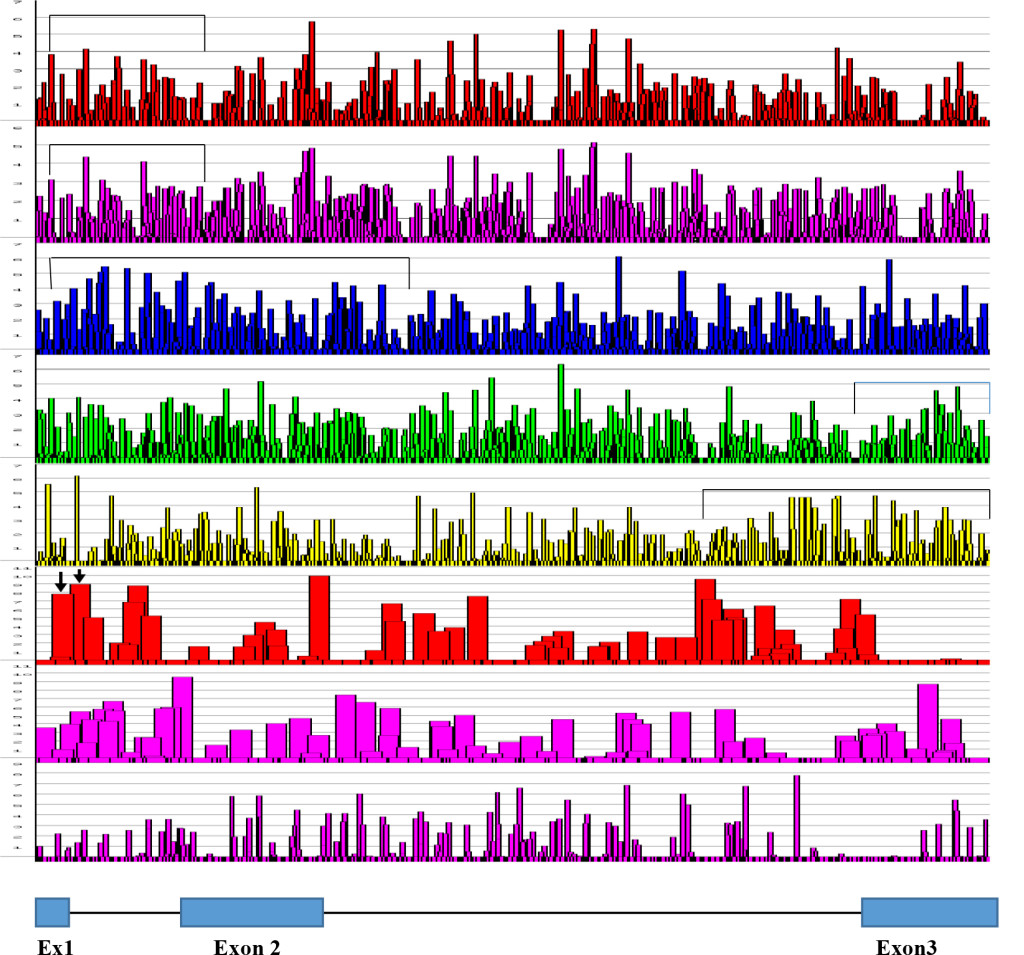
Figure 1: ESE Distribution in Human Insulin Gene Transcript [From the Top; SF2/ASF, SF2/ASF(IgM), SC35, SRp40, SRp55, 5’SS, 3’SS, Br. S]

The human Insulin gene sequence was retrieved from NCBI J00265 and subjected to ESE screening by ESEfinder 3, Cold Spring Harbor Laboratory.

Graphical presentation is from the ESE finder 3, CSHL and clustered regions are bracketed by JMG2018-102-TaeSukRo-ChoiChina_F15

SF2/ASF clustering is in the 5’ side of the gene, SC35 is more in the gene body with some on the 5’ side. SRp40 and SRp55 are clustered more on 3’ side of the molecule. Arrows in the 5’SS scan represent splice site at nucleotide position at 42 and alternative splice site at nucleotide position at 68.

The structural organization of insulin gene is as follows:

  • Exon 1 is from nucleotide 1 to 42 (42 nucleotides)
  • Intron 1 is from nucleotide 43 to 221 (179 nucleotides)
  • Exon 2 is from nucleotide 222 to 425 (204 nucleotides)
  • Intron 2 is from nucleotide 426 to 1,211 (786 nucleotides)
  • Exon 3 is from nucleotide 1,212 to 1,430 (219 nucleotides)

JMG2018-102-TaeSukRo-ChoiChina_F2

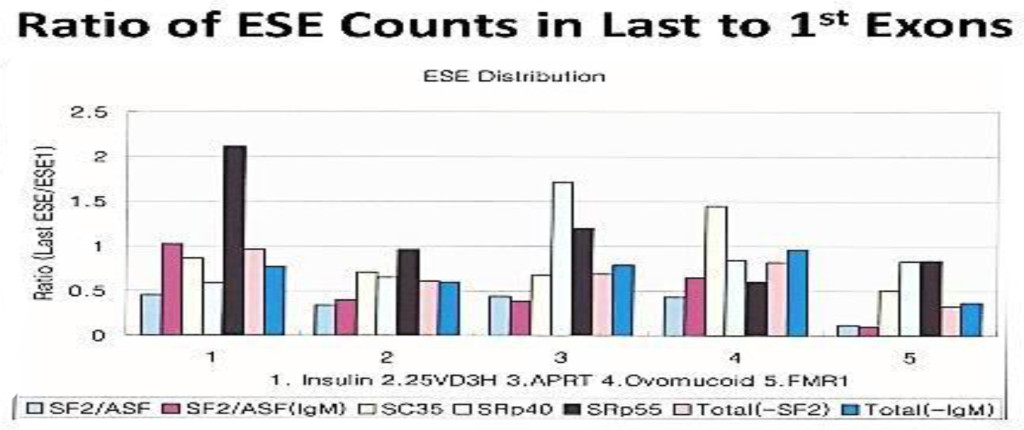
Figure 2. Ratio of ESE counts in last to 1st Exons

The distribution of ESEs are gene specific. However, there are some consensus patterns;

the SF2/ASF is clustered more at in the 1st exon than the last exon; SRp40 and SRp 55 are more clustered at the last exon than the 1st.

JMG2018-102-TaeSukRo-ChoiChina_F3a

Figures 3a

JMG2018-102-TaeSukRo-ChoiChina_F3b

Figures 3b

JMG2018-102-TaeSukRo-ChoiChina_F3c

Figures 3c

JMG2018-102-TaeSukRo-ChoiChina_F3d

Figures 3d

Figure 3. Distribution of ESE in Exons and Introns. The numbers of ESEs are presented in each 100 nucleotide bin. The blue marks represent the middle exon/intron and green marks represent the highest ESE containing exon/intron. The distribution appears to be even throughout the molecule with some focal clustering. The highest cluster of SF2/ASF (9 out of 10) and SC35 (4 out of 5) are in the 5’ side of the molecule and the highest cluster of SRp40 (3 out of 5) is in 3’ side of the molecule. However, the first exons contain the SF2 abundance; SC35 is more in the gene body; SRp40 and SRp55 are clustered toward to the 3’ side of the molecule.

JMG2018-102-TaeSukRo-ChoiChina_F4

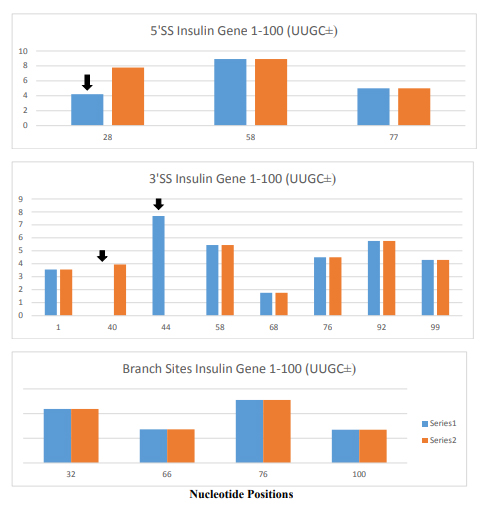
Figure 4. Changes in 5’ Splice Sites, 3’ Splice Sites and Branch Sites in Insulin Gene Variant (IVS-69). The insulin gene variant (IVS-69) has TTGC insertion at nucleotide position 47 to 50. The blue columns are the normal insulin gene and orange columns are for the insulin gene variant. The X- axis is the position of nucleotide in insulin gene and Y-axis is the score of strength at the splice sites.

The changes in 5’ splice site such as attenuation of 5’ splice site at the position 28 (marked by black arrow) alters 5’ splice site usage at position 58 producing 30 nucleotides longer 5’ UTR containing insulin mRNA. There are changes in 3’ splice sites (marked by black arrows) as well, but its significance is not known. Its close proximity to 5’ splice site suggests that it may interfere the formation of spliceosome at the canonical 5’ splice site. There was no change in branch site by the insertion of TTGC insertion.

JMG2018-102-TaeSukRo-ChoiChina_F5

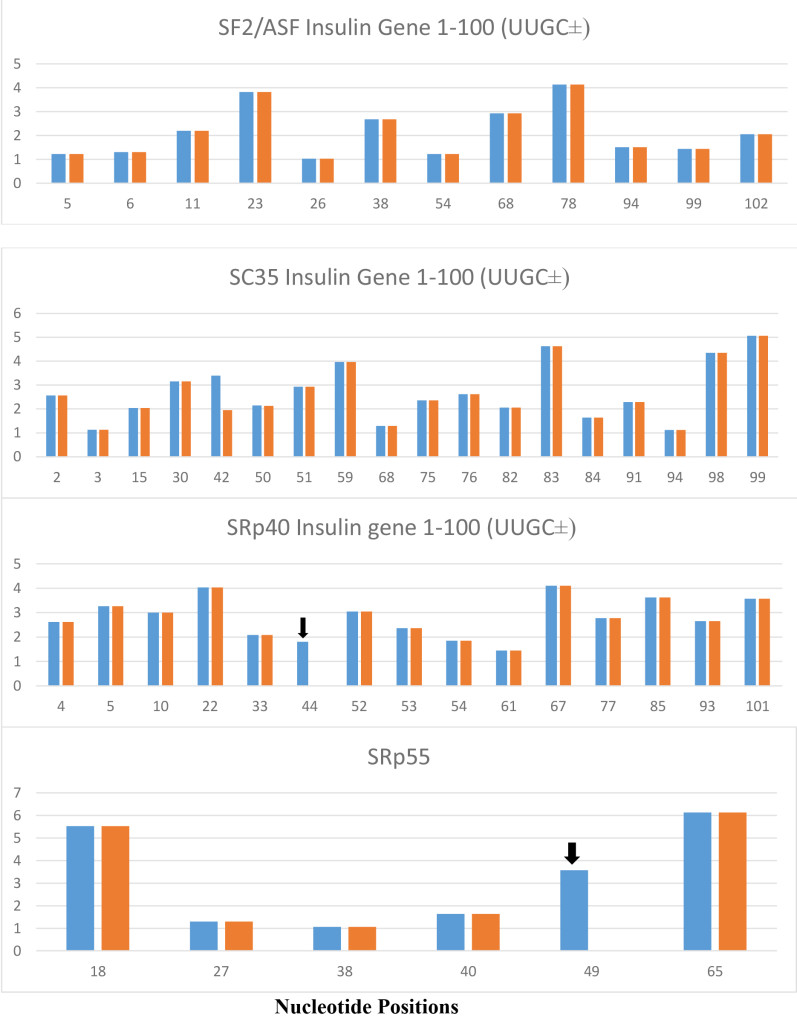
Figure 5. The variant insulin gene IVS-69, which contains UUGC insertion at a position 6 nt downstream from 5’ splice site of intron 1 (position 47–50 from TSS), is present exclusively in Africans and produces variant insulin mRNA with extended 5’ UTR. The UUGC insertion produces additional SRp40 at position 44 and additional SRp55 at the position 49 which are indicated by black arrows. The SRp40 and SRp55 co-expression with reporter insulin pre-mRNA construct increased the proportion of transcript retaining intron 1 and increased proinsulin level in the cell [35]. There are no changes in SF2/ASF and SC35.

The blue columns are from normal insulin gene and orange columns are from insulin gene variant (IVS-69). Numbers in X-axis represent the positions of nucleotide in insulin gene and the numbers in Y-axis represent the score of strength of ESE motifs.

JMG2018-102-TaeSukRo-ChoiChina_F6

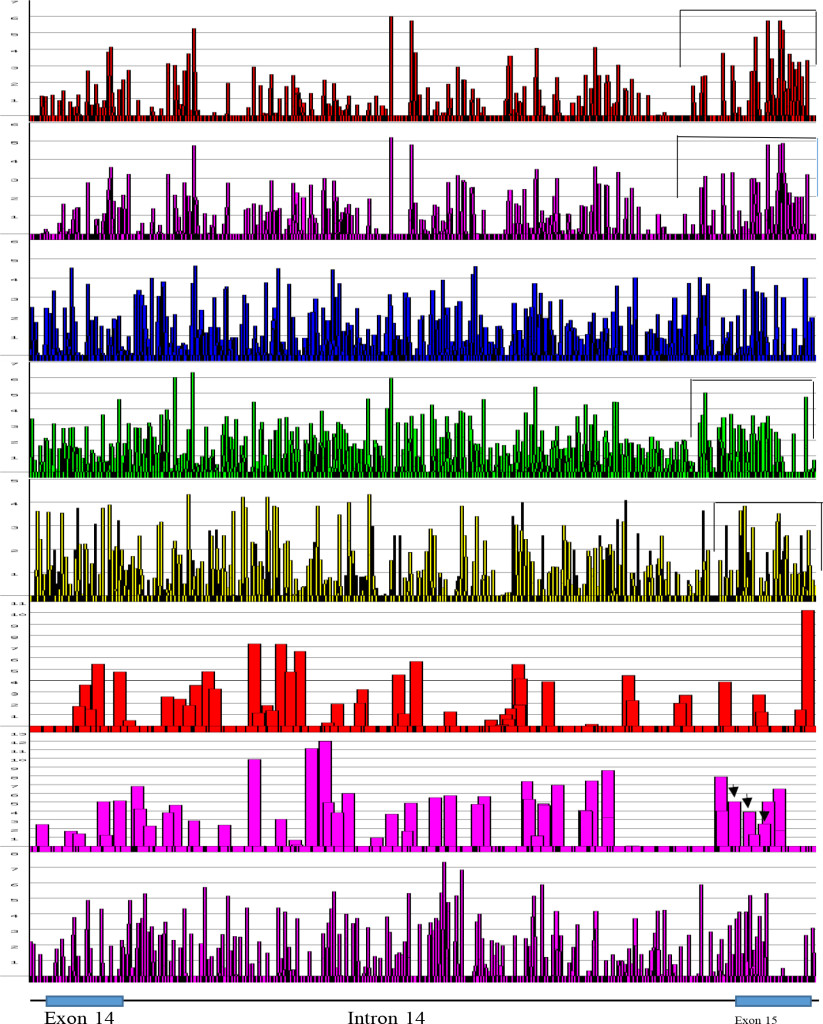
Figure 6. ESEs in FMR1 Exon 14 to Exon 15 at Alternative Splice Sites [From the Top; SF2/ASF, SF2/ASF(IgM), SC35, SRp40, SRp55, 5’SS, 3’SS, Br. S.]

The regions, where the alternative splicings occur were screened for their distribution of ESEs. The 5’ end of exon 15 (FMR1 gene) has two more alternative splice sites in addition to canonical splice site. It is evident, that at the 5’ side of exon 15, there are clustering of SF2/ASF, SRp40 and SRp55. Alternative splice sites are marked by black arrows

JMG2018-102-TaeSukRo-ChoiChina_F7

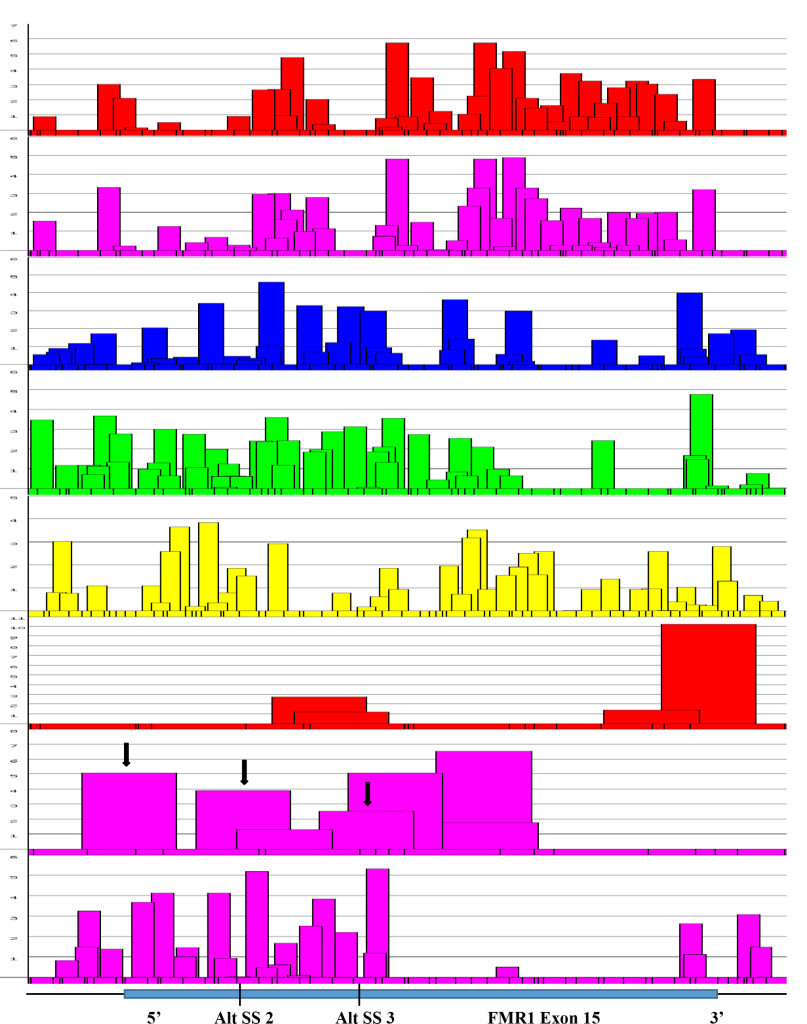
Figure 7. Focal Magnification of Alternative Splice Sites in Exon 15 (FMR1 Gene).

Figure 7. An expanded view of alternative splice sites at exon 15 of FMR1 gene. It was found that the presence of 3’ splice sites at the positions were also where alternative splicings were found (Black arrows). The score of 3’ splicing sites correlated well with the amount of spliced product formed. The canonical site splicing product is the most abundant; next is Alt. SS 2; the least is at the Alt. SS 3. The presence of high scored 3’ splice site next to Alt. SS 3 is not operational. The reason may be due to the presence of splicing silencers at the region (see Figure 8).

JMG2018-102-TaeSukRo-ChoiChina_F8

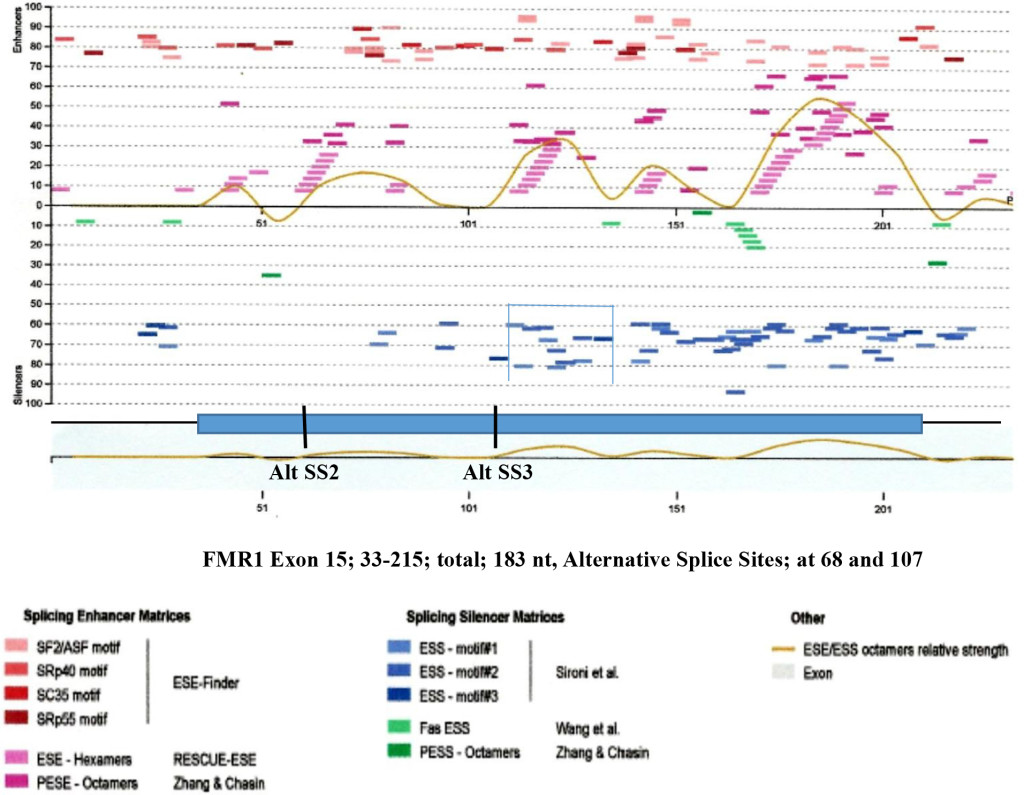
Figure 8. Enhancers and Silencers at Exon 15 (FMR1 Gene).

Figure 8. The splicing enhancers and silencers are scanned by HSF3 [95]. It is interesting to observe that where Alt. SS 2 and Alt. SS 3 are located, there are the least splicing silencer motifs. However in adjacent region, abundant silencer motifs are present (bracketed). The presence of silencer elements may effect enhancers by making them non-operational. Where the clustered silencers are present is marked by blue and green colors

JMG2018-102-TaeSukRo-ChoiChina_F9

Figure 9. ESE Distributions in MALAT1.

Figure 9. The transcript of the MALAT1 gene at chromosome 11q13.1 (NCBI; NR_002891) has 8,779 nucleotides and contains numerous ESEs and poly A sites. The ESE distributions are from the top to bottom, SF2/ASF, SF2/ASF (IgM-BRCA), SC35, SRp40 and SR55. As in other coding pre- mRNA, SF2/ASF is clustered around the 5’ region, SC35 around the central region and SR-40 and SRp55 are clustered toward the 3’ side. In this graph, ESEfinder 3(CSHL) was used to produce the figure. The 8,779 nucleotides is divided into two portions and a composite graph extending from nucleotide 1–8,779 was constructed.

Although, mature MALAT1 RNA contains a triple helix 3’ end, there are many 5’ and 3’ splice sites as well as poly (A) sites present in the sequence. According to NCBI AceView, the MALAT1 gene can produce at least an additional 10 RNA splices which may or may not have translation products. It is interesting to observe that some of ESE clusters are in correspondence with 5’ or 3’ splice sites present in the sequence.

Examples are

  1. In column 1, 2 and 4, SF2/ASF ( ) are in correlation with the high score 5’ splice sites ( ),
  2. In column 3, SC35 and SRp40 clusters are corresponding to high score 3’ splice sites and
  3. In columns 5 and 6, the SC35, SRp40 and SRp55 are at the region where 5’ and 3’ splice sites are.

These ESEs, splice sites and branch sites may not be operational in normal condition, but during degradation, stress or pathologic condition, they may become operational producing aberrant spliced products.

Acknowledgement: Authors are grateful to Dr. Lynn Yeoman for the English corrections.

Refernces

  1. Bradley T, Cook ME, Blanchette M (2015) SR proteins control a complex network of RNA-processing events. RNA 21: 75–92. [crossref]
  2. Li X , Manley JL (2005) Inactivation of the SR Protein Splicing Factor ASF/SF2 Results in Genome Instability. Cell 122: 365–378.
  3. Lin S, Coutinho-Mansfield G, Wang D, Pandit S, Fu X-D (2008) The Splicing Factor SC35 has an Active Role in Transcription Elongation. Nat Struct Molec Biol 15: 819–826.
  4. Lemaire R, Prasad J, Kashima T, Gustafson J, Manley, JL, Lafyatis R (2002) Stability of a PKCI-1-related mRNA is controlled by the splicing factor ASF/SF2: a novel function for SR proteins. Genes Dev 16: 594–607.
  5. Cáceres JF, Screaton GR and Krainer AR (1998) A specific subset of SR proteins shuttles continuously between the nucleus and the cytoplasm. Genes Dev 12: 55–66.
  6. Sanford JR, Gray NK, Beckmann K, C?ceres JF (2004) A novel role for shuttling SR proteins in mRNA translation. Genes Dev 18: 755–768.
  7. Huang Y, Gattoni R, Stévenin J, Steitz JA (2003) SR Splicing Factors Serve as Adaptor Proteins for TAP-Dependent mRNA Export Mol Cell 11: 837–843.
  8. Yeo G, Hoon S, Venkatesh B, Burge CB (2004) Variation in sequence and organization of splicing regulatory elements in vertebrate genes Proc Natl Acad Sci 101: 15700–15705.
  9. Tran Q, Roesser JR (2003) SRp55 is a regulator of calcitonin/CGRP alternative RNA splicing. Biochemistry 42: 951–957. [crossref]
  10. Cooper DR, Carter G, Li P, Patel R, Watson JE, Patel NA (2014) Long Non-Coding RNA NEAT1 Associates with SRp40 to Temporally Regulate PPAR?2 Splicing during Adipogenesis in 3T3-L1 Cells. Genes 5: 1050–1063.
  11. Fu XD (2004) Towards a splicing code. Cell 119: 736–738. [crossref]
  12. Dye MJ, Proudfoot NJ (1999) Terminal exon definition occurs cotranscriptionally and promotes termination of RNA polymerase II. Mol Cell 3: 371–378. [crossref]
  13. Cramer P, Cáceres JF, Cazalla D, Kadener S, Muro AF, Baralle FE, Kornblihtt AR (1999) Coupling of Transcription with Alternative Splicing: RNA Pol II Promoters Modulate SF2/ASF and 9G8 Effects on an Exon Splicing Enhancer. Mol Cell 4: 251–258.
  14. Goren A, Ram O, Amit M, Karen H, Lev-Maor G, Vig I, Pupko T, Ast G (2006) Comparative Analysis Identifies Exonic Splicing Regulatory Sequences-The Complex Definition of Enhancers and Silencers. Mol Cell 22: 769–781.
  15. Sapra A, Änkö M-L, Grishina I, Lorenz M, Pabis M, et al. (2009) SR Protein Family Member Display Diverse Activities in the Formation of Nascent and Mature mRNPs In Vivo. Mol Cell 34: 179–190.
  16. Wang Z, Rolish ME, Yeo G, Tung V, Mawson M, et al (2004) Systematic identification and analysis of exonic splicing silencers. Cell 119: 831–845. [crossref]
  17. Blencowe BJ (2006) Alternative splicing: new insights from global analyses. Cell 126: 37–47. [crossref]
  18. Cooper TA, Wan L, Dreyfuss G (2009) RNA and Disease. Cell 136: 777–798.
  19. López-Bigas N, Audit B, Ouzounis C, Parra G, Guigó R (2005) Are splicing mutations the most frequent cause of hereditary disease? FEBS Letter 579: 1900–1903.
  20. Liu, H-X, Zhang M, rainer AR (1998) Identification of functional exonic splicing enhancer motifs recognized by individual SR proteins. Genes Dev 12: 1998–2012.
  21. Liu, H-X, Chew SL, Cartegni L, Zhang MQ, Krainer AR (2000) Exonic Splicing Enhancer Motif Recognized by Human SC35 under Splicing Conditions. Mol Cell Biol 20: 1063–1071.
  22. Cartegni, , Wang J, Zhu Z, Zhang MQ, Krainer AR (2003) ESEfinder: a web resource to identify exonic splicing enhancers. Nucl Acids Res 31: 3568–3571.
  23. Kashima T and Manley JL (2003) A negative element in SMN2 exon 7 inhibits splicing in spinal muscular atrophy. Nature Genet 34: 460–463.
  24. Muro AF, Caputi M, Pariyarath R, Pagani F, Buratti E, et al. (1999) Regulation of Fibronectin EDA Exon Alternative Splicing: Possible Role of RNA Secondary Structure for Enhancer Display. Mol Cell Biol 19: 2657–2671.
  25. Sen, S, Talukdar, I and Webster, NJG (2009) SRp20 and CUG-BP1 Modulate Insulin Receptor Exon 11 Alternative Splicing. Mol Cell Biol 29: 871–880.
  26. Liu P, Erez A, Nagamani SC, Dhar SU, Kołodziejska KE, et al (2011) Chromosome catastrophes involve replication mechanisms generating complex genomic rearrangements. Cell 146: 889–903. [crossref]
  27. Waye JS. Willard HF (1987) Nucleotide sequence heterogeneity of alpha satellite repetitive DNA: a survey of alphoid sequences from human chromosomes. Nucl Acids Res 15: 7549–7569.
  28. Vissel B, Choo KH (1987) Human alpha satellite DNA-consensus sequence and conserved regions. Nucl Acids Res 15: 6751–6752.
  29. Maraia RJ, Driscoll CT, Bilyeu T, Hsu K, Darlington GJ (1993) Multiple Dispersed Loci Produce Small Cytoplasmic Alu RNA. Mol Cell Biol 13: 4233–4241.
  30. Christov CP, Gardiner TJ, Szüts D, Krude, T (2006) Functional Requirement of Noncoding Y RNAs for Human Chromosomal DNA Replication. Mol Cell Biol 26: 6993–7004.
  31. Hackett PB, Ekker SC, Largaespada DA, Mclvor RS (2004) Sleeping Beauty Transposone-Mediated Gene Therapy for Prolonged Expression In: “Non-viral Vectors for Gene Therapy” 2nd Edition (Eds; Huang, L, Wagner, E and Hung, M-C)
  32. van Pouderoyen G, Ketting RE, Perrakis A, Plasterk RHA, Sixma TK (1997) Crystal structure of the specific DNA binding domain of Tc3 transposase of C elegans in Complex with transposon DNA. EMBO J 16: 6044–6054.
  33. Mirkin SM (2007) Expandable DNA repeats and human disease. Nature 447: 932–940. [crossref]
  34. Shalev A, Blair PJ, Hoffmann SC, Hirshberg B, Peculis BA, et al (2002) A proinsulin gene splice variant with increased translation efficiency is expressed in human pancreatic islets. Endocrinology 143: 2541–2547. [crossref]
  35. Královicová J, Gaunt TR, Rodriguez S Wood PJ, Day INM, Vorechovský I (2006) Variants in Human Insulin Gene That Affect Pre-mRNA Splicing. Diabetes 55: 260–264.
  36. Minn AH, Lan H, Rabaglia ME, Harlan DM, Peculis BA, et al (2005) Increased insulin translation from an insulin splice-variant overexpressed in diabetes, obesity, and insulin resistance. Mol Endocrinol 19: 794–803. [crossref]
  37. Swanson CM, Sherer NM, Malim MH (2010) SRp40 and SRp55 Promote the Translation of Unspliced Human Immunodeficiency Virus Type 1 RNA. J Virol 84: 6748–6759.
  38. Bolzer A, Kreth G, Solovei I, Koehler D, Saracoglu K, et al (2005) Three-Dimensional Maps of All Chromosomes in Human Male Fibroblast Nuclei and Prometaphase Rosettes. PLoS Biology 3: 157
  39. Gal-Mark N, Schwartz S, Ast G (2008) Alternative splicing of Alu exons-two arms are better than one. Nucl Acids Res 36: 2012–2023.
  40. Meili D, Kralovicova J, Zagalak J, Bonafé L, Fiori L, et al. (2009) Disease-causing mutations improving the branch site and polypyrimidine tract: Pseudoexon activation of LINE-2 and antisense Alu lacking the poly(T)-tail. Human Mutation 30: 823–831.
  41. Lee J, Han K, Meyer TJ, Kim H-S, Batzer MA (2008) Chromosomal Inversions between Human and Chimpanzee Lineages Caused by Retrotransposons. PLos ONE 3: 4047.
  42. Warren S, Sherman SL (2001) In the Book “The Metabolic & Molecular Bases of Inherited Disease” Vol 1 Eighth Edition, Chapter 64, The Fragile X Syndrome, pg: 1257–1289.
  43. Ro-Choi, TS, Choi, YC (2007) A Modeling Study of Co-transcriptional Metabolism of hnRNP Using FMR1. Gene Mol Cells 23: 228–238.
  44. Ashley CT, Sutcliffe JS, Kunst CB, Leiner HA, Eickler EE, et al. (1993) Human and murine FMR-1: alternative splicing and translational initiation downstream of the CGG-repeat. Nat Genet 4: 244–251.
  45. Sittler A, Devys D, Weber C, Mandel JL (1996) Alternative splicing of exon 14 determines nuclear or cytoplasmic localisation of FMR1 protein isoforms. Hum Mol Genet 5: 95–102.
  46. Eichler EE, Richards S, Gibbs RA, Nelson DL (1993) Fine structure of the human FMR1 gene. Hum Mol Genet 2: 1147–1153.
  47. Lewin, B. (1994, 2008) RNS splicing and processing. Gene IX, Chapter 28, Pearson Prentice Hall, Pearson Education, Inc. pp 667–705.
  48. Ro-Choi TS, Choi YC (2009) Thermodynamic Analyses of the Constitutive Splicing Pathway for Ovomucoid Pre-mRNA. Mol Cells 27: 1010.
  49. Haerty W, Ponting CP (2015) Unexpected selection to retain high GC content and splicing enhancers within exons of multi-exonic lncRNA loci RNA. 21: 320–332.
  50. Maraia R, Sakulich AL, Brinkmann E, Green ED (1996) Gene encoding human Ro-associated autoantigen Y5 RNA. Nucleic Acids Res 24: 3552–3559. [crossref]
  51. Maraia RJ, Sasaki-Tozawa N, Driscoll CT, Green ED, Darlington GJ (1994) The human Y4 small cytoplasmic RNA gene is controlled by upstream elements and resides on chromosome 7 with all other hY scRNA genes. Nucl Acids Res 22: 3045–3052.
  52. Schwartz S, Gal-Mark N, Kfir N, Oren R, Kim E, et al. (2009) Alu Exonization Events Reveal Features Required for Precise Recognition of Exon by the Splicing Machinery. PLoS Computational Biology 5: e1000300
  53. Nagai K, Oubridge C, Kuglstatter A, Menichelli E, Isel C, et al. (2003) Structure, Function and Evolution of the Signal Recognition Particle. EMBO J 22: 3479–3485.
  54. Keene SE, Telesnitsky A (2012) cis-Acting determinants of 7SL RNA packaging by HIV-1. J Virol 86: 7934–7942. [crossref]
  55. Hutchinson JN, Ensminger AW, Clemson CM, Lynch CR, Lawrence JB, Chess A (2007) A screen for nuclear transcripts identifies two linked noncoding RNAs associated with SC35 splicing domains. BMC genomics 8: 39
  56. Tripathi V, Ellis JD, Shen Z, Song DY, Pan Q, et al. (2010) The Nuclear- Retained Noncoding RNA MALAT1 Regulates Alternative Splicing by Modulating SR Splicing Factor Phosphorylation. Mol Cell 39: 925.
  57. Ji P, Diederichs S, Wang W, Böing S, Metzger R, et al (2003) MALAT- 1, a novel noncoding RNA, and thymosin ß4 predict metastasis and survival in early-stage non- small cell lung cancer. Oncogene 22: 8031–8041.
  58. Ren S, Liu Y, Xu W, Sun Y, Lu J, et al (2013) Long Noncoding RNA MALAT-1 is a New Potential Therapeutic Target for Castration Resistant Prostate Cancer. J Urology 190: 2278–2287.
  59. Gutschner T, Hämmerle M, Eissmann M, Hsu J, Kim Y, et al (2013) The noncoding RNA MALAT1 is a critical regulator of the metastasis phenotype of lung cancer cells. Cancer Res 73: 1180–1189. [crossref]
  60. Kuiper RP, Schepens M, Thijssen J, van Asseldonk M, va den Berg E, et al. (2003) Upregulation of the transcription factor TFEB in t(6;11)(p21;q13)-positive renal cell carcinomas due to promoter substitution. Hum Mol Genet 12: 1661–1669.
  61. Henssen AG, Koche R, Zhuang J, Jiang E, Reed C, et al. (2017) PGBD5 promotes site-specific oncogenic mutations in human tumors. Nat Genet 49: 1005–1014.
  62. Chakravarty D, Sboner A, Nair SS, Giannopoulou E, Li R, et al. (2014) The oestrogen receptor alpha- regulated lncRNA NEAT1 is a critical modulator of prostate cancer. Nat Communications/DOI: 101038/ncomms6383.
  63. Ke H, Zhao L, Feng X, Xu H, Zou L, et al. (2016) NEAT1 is Required for Survival of Breast Cancer Cells Through FUS and miR-548. Gene Regulation and Systems Biology 10: 11–17.
  64. Trowell H, Nagy A, Vissel B, Choo KHA (1993) Long-range analyses of the centromeric regions of human chromosomes 13, 14 and 21: identification of a narrow domain containing two key centromeric DNA elements. Hum Mol Genet 2: 1639–1649.
  65. Waye JS, Willard HF (1989) Human ß satellite DNA: Genomic organization and sequence definition of a class of highly repetitive tandem DNA. Proc Natl Acad Sci 86: 6250–6254.
  66. Vissel B, Nagy A, Choo KH (1992) A satellite III sequence shared by human chromosome 13, 14 and 21 that is contiguous with alpha satellite DNA Cytogenet. Cell Genet 61: 81–86.
  67. Lin CC, Sasi R, Lee YS, Court D (1993) Isolation and identification of a novel tandemly repeated DNA sequence in the centromeric region of human chromosome 8. Chromosoma 102: 333–339.
  68. Kim J-H, Ebersole T, Kouprina N, Noskov VN, Ohzeki J-I, (2008) Human gamma-satellite DNA maintains open chromatin structure and protects a transgene from epigenetic silencing. Genome Research 19: 533–544.
  69. Jolly C1, Metz A, Govin J, Vigneron M, Turner BM, et al (2004) Stress-induced transcription of satellite III repeats. J Cell Biol 164: 25–33. [crossref]
  70. Bartlett JMS, Walters  AD, Ballantyne SA, Going JJ, Grigor KM, et al. (1998) Is chromosome 9 loss a marker of disease recurrence in transitional cell carcinoma of the urinary bladder? Br J Cancer 77: 2193–2198.
  71. Reshmi-Skarja S, Huebner A, Handschug K, Finegold DN, Clark AJL, et al. (2003) Chromosomal fragility in patients with triple A syndrome. Am J Med Genet 117: 30–36.
  72. Arutyunyan A, Stoddart S, Yi S-J, Fei F, Lim M, et al. (2012) Expression of Cassini, a murine gamma-satellite sequence conserved in evolution, is regulated in normal and malignant hematopoietic cells. BMC Genomics 13: 418.
  73. Mykowska A, Sobczak K, Wojciechowska M, Kozlowski P, Krzyzosiak WJ (2011) CAG repeats mimic CUG repeats in the misregulation of alternative splicing. Nucl Acids Res 39: 8938–8951.
  74. Champlin DT, Frasch M, Saumweber H, Lis JT (1991) Characterization of a Drosophila protein associated with boundaries of transcriptionally active chromatin. Genes Dev 5: 1611–1621.
  75. Loomis RJ, Naoe Y, Parker JB, Savic V, Bozovsky MR, et al. (2009) Chromatin binding of SRp20 and ASF/FS2 and dissociation from mitotic chromatin is modulated by histone H3 serine 10 phoshorylation. Mol Cell 33: 450–461.
  76. Li X, Manley JL (2006) Cotranscriptional processes and their influence on genome stability. Genes Dev 20: 1838–1847.
  77. Ji X, Zhou Y, Pandit S, Huang J, Li H, (2013) SR proteins collaborate with 7SK and promoter-associated nascent RNA to release paused polymerase. Cell 153: 855–868.
  78. Chew SL, Liu H-X, Mayeda A, Krainer AR (1999) Evidence for the function of an exonic splicing enhancer after the first catalytic step of pre-mRNA splicing. Proc Natl Acad Sci USA 96: 10655–10660.
  79. Meyer KD, Saletore Y, Zumbo P, Elemento O, Mason, et al. (2012) Comprehensive analysis of mRNA Methylation Reveals Enrichment in 3’ UTRs and near Stop Codons Cell. doi:101016/jcell201205003.
  80. Xiao, W., Adhikari, S., Dahal, U., Chen, Y.-S., Hao, Y.J., Sun, B.-F., Sun, H.-Y., Li, A.,
    Ping, X. -L., Lai, W. -Y., Wang, X., Ma, H.-L., Huang, C.-M., Yang, Y., Huang, N.,
    Jiang, G.-B., Wang, H.-L., Zhou, Q., Wang, X.-J., Zhao, Y.-L., and Yang, Y.-G. (2016)
    Nuclear m6A Reader YTHDC1 Regulates mRNA Splicing. Mol. Cell, 61, 507–519.
  81. Tenenbaum SA, Aguirre-Ghiso J (2005) Dephosphorylation shows SR proteins the way out. Mol Cell 20: 499–501. [crossref]
  82. Huang Y, Steitz JA (2005) SRprises along a messenger’s journey. Mol Cell 17: 613–615. [crossref]
  83. Ajiro M, Jia R, Yang Y, Zhu J, Zheng ZM (2016) A genome landscape of SRSF3- regulated splicing events and gene expression in human osteosarcoma U20S cells. Nucl. Acids Res 44: 1854–1870.
  84. Jumaa, H, Guénet, J-L and Nielsen, PJ (1997) Regulated Expression and RNA Processing of Transcripts from the SRp20 Splicing Factor Gene during the Cell Cycle. Mol Cell Biol 17: 3116–3124.
  85. Ugarkovic D (2005) Functional elements residing within satellite. DNAs EMBO Rep 6: 1035–1039. [crossref]
  86. Zeller P, Padeken J, van Schendel R, Kalck V, Tijsterman M, et al. (2016) Histone H3K9 methylation is dispensable for Caenorhabditis elegans development but suppresses RNA:DNA hybrid-associated repeat instability. Nat Genet 48: 1385–1395.
  87. Daugherty MD, Booth DS, Jayaraman B, Cheng Y, Frankel AD (2010) HIV Rev response element (RRE) directs assembly of the Rev homooligomer into discrete asymmetric complexes. Proc Natl Acad Sci 107: 12481–12486.
  88. Rizvi TA, Lew KA, Murphy EC, Schmidt  RD (1996) Role of Mason-Pfizer Monkey Virus (MPMV) Constitutive Transport Element (CTE) in the Propagation of MPMV Vectors by Genetic Complementation Using Homologous/Heterologous. env Genes Virology 224: 517–532.
  89. Ivics Z, Hackett PB, Plasterk RH, Izsv?k, Z (1997) Molecular Recognition of Sleeping Beauty, a Tc1-like Transposon from Fish, and its Transposition in Human Cells. Cell 91: 501–510.
  90. Ro-Choi TS, Reddy R, Henning D, Takano T, Taylor CW, et al. (1972) Nucleotide sequence of 45S RNA I of Novikoff hepatoma cell nuclei. J Biol Chem 247: 3205–3222.
  91. Chen W, Kalscheuer V, Tzschach A, Menzel C, Ullmann R, et al. (2008) Mapping translocation  breakpoints by next-generation sequencing. Genome Res 18: 1142–1149.
  92. Waye,J.S. and Willard, H.F. (1987) Nucleotide sequence heterogeneity of alpha satellite repetitive DNA: a survey of alphoid sequences from human chromosomes. Nucl. Acids Res. 15, 7549–7569
  93. Vissel, B. and Choo, K.H. (1987) Human alpha satellite DNA-consensus sequence and conserved regions. Nucl. Acids Res. 15, 6751–6752.
  94. Jolly C, Konecny L, Grady DL, Kutskova YA, Cotto JJ, et al. (2002) In vivo binding of active heat shock transcription factor 1 to human chromosome 9 heterochomatin during stress. J Cell Biol 156: 775–781.
  95. Desmet F-O, Hamroun D, Lalande M (2009) Human Splicing Finder: an online bioinformatics tool to predict splicing signals. Nucl Acids Res 37: 1–67.

Spanish Consumers’ General Understanding of Metabolic Diseases and how they may be Influenced by Diet and Novel Foods: a Preliminary Survey

DOI: 10.31038/NRFSJ.2018111

Abstract

This report introduces a simple and feasible questionnaire that attempts to explore the awareness and knowledge of consumers regarding some basic concepts on diet and health. The questions were designed to examine consumers’ general health concern and self-perceived health status, basic knowledge about metabolic disorders, how diet influences health, and knowledge and consumption of Functional Foods and Nutraceuticals. They were additionally inquired about their awareness of the inter-individual differences in response to diet. The survey revealed that the interviewed consumers subpopulation (N=253 Spanish participants) had good metabolic health and healthy lifestyle habits. Despite their concern about health and, awareness of the relevance of diet to health, their familiarity with chronic metabolic disorders or novel foods such as Functional Foods and Nutraceuticals was limited but they manifested interest in learning more about these issues. The concept of inter-individual variability in response to diet was familiar to some but generally poorly understood.

Keywords

Self-perceived health status; lifestyle habits; healthy diet; metabolic disorders; functional foods; nutraceuticals; questionnaire; inter-individual differences.

Introduction

An important wellbeing promoting strategy in westernized countries is the encouragement of a healthy life-style, including improved eating habits, as a means to prevent the development of metabolic chronic disorders associated with sedentariness and increased consumption of high-energy foods. In Spain, despite general efforts on the dissemination of information about healthy habits, the prevalence of some chronic non-communicable metabolic diseases: obesity [1], hypercholesterolemia [2], hypertension [3], type-2 diabetes [4] or metabolic syndrome (MetS) [5] remains high and constitutes a major medical and economy burden. It has been indicated that the incidence of these disorders is strongly associated with the individuals’ health behavior. In general, consumers with higher levels of health motivation and consciousness as well as greater knowledge of health and disease issues will exhibit greater levels of preventive health behaviors [6]. Nevertheless, adopting these behaviors is a complex process affected by different factors and thus, discrepancies may occur between an individual’s health perception, their true health status and the adoption of healthy habits.

It has been shown that awareness of cardio-metabolic risk factors is low in high-risk populations [7]. Consumers with unhealthy habits (smoking, sedentariness) may not perceive themselves as unhealthy since they may not be aware of the presence of these so-called ‘silent disorders’ such as hypercholesterolemia or hypertension and thus they are not inclined to adopt a healthier lifestyle [8, 9]. In a Polish study, 91% of patients with diagnosed MetS led a sedentary lifestyle and none followed cardio-protective diet recommendations [10]. Besides, an American study suggested that consumers diagnosed with both high cholesterol and hypertension, were the greatest users of nutrient information from the Nutrition Fact Panel [11], however, they did not find if their choice was affected by the nutritional information given. The lack of information about metabolic diseases can contribute to limit the adoption of healthier recommendations and thus, an increase in the awareness and knowledge of cardio-metabolic risk associated factors are believed to be significant for adopting healthy lifestyle behaviors.

Moreover, adopting healthy eating habits is one of the most important and commonly reported reasons for successful prevention of metabolic disorders. A general knowledge of a healthy diet is associated, to a certain extent, with an understanding of the overall recommendations for the consumption of a diversity of foods: vegetables and fruits, fats, olive oil, cereals, salt, refined and processed foods, meat [12–14]. Enhancing the level of awareness of the role of diet in health will influence individual’s food choices and quality and, consequently, the adoption of healthier eating habits [15].

In addition to the dietary recommendations, two new categories of foods and food products entered the healthy eating market some time ago: Functional Foods and Nutraceuticals. These food items are designed to contain a component or components scientifically linked with a health benefit beyond nutrition [16], and to help in the fight against the development of chronic diet-related disorders such as hypertension, hypercholesterolemia, type-2 diabetes and other inflammatory oxidative processes [17]. Functional Foods are foods that can be consumed as part of the usual diet (e.g. margarine enriched with cholesterol-lowering plant sterols) whereas Nutraceuticals are concentrated food extracts consumed as a pill, capsule or powder supplementary to the diet [18]. Several factors would influence the consumer acceptance of Functional Foods: knowledge or awareness of the concept, necessity, perceived reward, confidence or belief in the health benefits, taste or quality [19–21]. Knowledge and understanding of Nutraceuticals appear to be rather limited even in highly specialized subpopulations such as pharmacist students [22]. Increasing the knowledge and understanding of these products is important for their successful marketing and it might also contribute to reinforcing the adoption of behavioral changes towards a healthier eating.

It is conceivable that the perception by the Spanish consumers of the diet-related metabolic disorders and of the feasibility of their prevention by healthier behaviors remains insufficient [3, 5, 23]. Whether the general population has yet become fully aware of the relevance of adopting healthy dietary habits for the prevention of chronic metabolic diseases, has started applying these habits and has truly understood why they should do it, constitute critical points for the successful implementation of dietary and lifestyle recommendations to reduce the burden of these diseases. Nutritional awareness seems to remain low among the general public and understanding of dietary information remains difficult for many people [24]. Therefore, there is an emerging use of short and simple dietary questionnaires to investigate the association between healthy-eating attitudes and the development of chronic diseases. These questionnaires may be a useful tool for the prevention of these diseases [25].

All things considered, the aim of this pilot study was to attain a preliminary simple questionnaire designed to have an overview of people´s awareness and understanding of some basic issues in relation to diet and health in a Spanish subpopulation that will help in the future to develop health preventing programs. For this purpose we prepared a feasible and comprehensive simple questionnaire divided into 22 items that aimed at specifically assessing: i) self-perceived overall health status and health concern, ii) general knowledge about some highly prevalent chronic metabolic disorders, iii) perception of the influence of diet in health, and iv) awareness and consumption of Functional Foods and Nutraceuticals. In addition, we made an initial attempt to find out whether the participants had any understanding of potential differences in the effects of diet and food in different individuals. A last question of the survey was posed to identify the attitude of the participants about research in the area of food and health.

Methodology

Demographic Characteristics of the Participants and Anthropometric Measurements

Consumers were recruited during a science event (The week of Science) carried out in Spain at two separate places: CIAL-CSIC in Madrid and CEBAS-CSIC in Murcia, respectively. Finally, a total of 253 random attendants took part in the study: 123 participants (48.6%) in Madrid and 130 participants (51.4%) in Murcia. Distribution of the total sample population by the location, gender and age group (adolescents [11 to 17 years old], young adults [18 to 40 years old] and adults [41 to 65 years old]) is displayed in Table 1. The group was constituted by a 59.3% of women and a 40.7% of men with slightly higher proportion of young adults (40.3%) and, in particular of young adult women (46.7%). During the face-to-face interview, the participants were weighed (kg) using a digital weight scale (Medisana AG, Germany) and their height measured (cm) in erect position and bare feet with a portable stadiometer allowing standing-height measurement in metric values (Seca, Handover, Germany). These values were used to calculate the body mass index (BMI). We also measured their waist circumference (WC, cm) and hip circumference (cm) and calculated the waist-to-hip ratio (WHR). Systolic and diastolic blood pressure (SBP, DBP; mm Hg) were estimated using an automatic upper arm blood pressure monitor MTS (Medisana AG, Germany). The volunteers were allowed to sit down and relax for a few minutes before the monitoring. We additionally assessed their smoking, alcohol drinking and sport practicing habits. Each volunteer was given an alphanumeric code for identification and collected data were coded and processed anonymously.

Table 1. Socio-demographic characteristics of the sample population: distribution by location, gender and age group.

Characteristics

Total n (%)

Men n (%)

Women n (%)

Location

Murcia

130 (51.4)

49 (47.6)

81 (54.0)

Madrid

123 (48.6)

54 (52.4)

69 (46.0)

Total

253 (100)

103 (40.7)

150 (59.3)

Age group

Adolescents [11–17 y]

82 (32.4)

36 (35.0)

46 (30.7)

Young adults [18–40 y]

102 (40.3)

32 (31.1)

70 (46.7)

Adults [41–65 y]

69 (27.3)

35(34.0)

34 (22.7)

n= number of participants.

Questionnaire

Volunteers were asked to complete a self-administered questionnaire developed by the researchers involved in this project (Supplementary Material S1). The questionnaire was composed of 22 items divided into several sections. In the first section (items 1 to 6), participants were asked about their concern and perception of their health status and about their general knowledge on several metabolic chronic disorders (hypercholesterolemia, hypertension, type-2 diabetes and metabolic syndrome). In the second part of the survey, the participants were asked a series of knowledge and awareness questions regarding the association between food/diet and health (items 7 to 10). The third section (items 11 to 20) focused on new food and derived products with healthy effects: Functional Foods and Nutraceuticals and aimed at finding whether the participants had any knowledge of these products and whether they consumed or would consume them. Question 21 was focused on finding whether the volunteers were aware of the concept of ‘inter-individual variability’ by asking them whether they knew that diet could have different effects on different people and about the potential factors involved in these differences.

Data Analysis

Demographic, anthropometric data and questionnaire results were all entered into Excel spreadsheets and analysed through the calculation of summary statistics, frequencies and (or) percentages. Data normality was assessed using the Kolmogorov-Smirnov test. Since most of the variables examined did not fit a normal distribution, results are presented as the median and the 95% CI (lower and upper confidence limits for the median value) and statistical analyses were carried out applying non-parametric tests using the XLSTAT 19.03 software. Where indicated, differences among age and gender subgroups were carried out using the Kruskall–Wallis with Dunn’s post-testing. Analyses of the association between self-reported health concern and associated habits (smoking, alcohol drinking, physical activity) were carried out using a contingency table. The observed frequencies in each subgroup were compared using a Chi-Square test. P-values < 0.05 were considered significant.

Results and Discussion

Anthropometric Characteristics of the Participants

Table 2 summarizes the main anthropometric characteristics of the study participants distributed by age group and gender. In good agreement with previous reports [26, 27] the average BMI, WC, WHR, SBP and DBP values found in our sample population were slightly higher in men than in women and increased with age. A detailed distribution of these values taking into consideration the risk standards for cardio-metabolic disorders development established by the World Health Organization (WHO, 2011) is included in Supplementary Material S2. The results show that a substantial percentage of the participants were in the range of healthy or normal values for each of the markers examined and thus, a 51.5% of the men and a 62.7% of the women had a normal BMI (≥ 18.5–24.99 Kg/m2), 85.4% of men and 86.7% of women had a low risk associated WC (≤ 102 cm for men, ≤ 88 cm for women) and about 69% of men and women also had a good value for WHR (< 0.90 for men, < 0.80 for women). On the other hand, the total % of participants with weight excess (obese + overweight) was 41% of the men and 30% of the women, about 31% of the men and women were in the risk margin of WHR (≥ 0.90 for men, ≥ 0.80 for women) and 10 to 20% of the participants were in the high risk margin for WC. Overall, the % of participants with over-the-limit values for the risk factors examined was slightly inferior to those previously described for the Spanish population [1]. Distribution by age confirmed a BMI rise tendency with age as denoted by an increase in the total percentage of overweight and obese people in the adults as compared with the adolescents, both in men (from 22.2 to 57.1%) and in women (from 23.9 to 44.1%).The percentage of individuals with WC and WHR within the risk margin values was also slightly increased in the adult sample population, more clearly in men. Nevertheless, and in relation to obesity, only 12.6% of the men and 4.0% of the women taking part in the survey exhibited a BMI ≥ 30.0 against 22.8% for men and 20.5% for women reported for the average Spanish population [1]. These differences may be partially explained by the fact that the rate of obesity differs from one Spanish region to another and, in particular, the areas of Madrid and Murcia (where the study was carried out) appear to have slightly lower rates of obesity than other regions [27].

Table 2. Descriptive statistics (median and 95% CI) of the main anthropometric characteristics measured in the sample population: body weight, height, body mass index (BMI), waist circumference (WC), hip circumference, waist-to-hip ratio (WHR), systolic (SBP) and diastolic (DBP) blood pressure in men and women by group age.

Adolescents

[11–17 y]

Young adults

[18–40 y]

Adults

[41–65 y]


Median

(95% CI)

Median

(95% CI)

Median

(95% CI)

Men

Weight (kg)

64.3a

(60.9–72.4)

74.6b

(72.2–82.2)

79.0b

(76.3–86.0)

Height (cm)

1.73a

(1.7–1.8)

1.74a

(1.7–1.8)

1.75a

(1.70–1.80)

BMI

20.3a

(20.2–23.1)

24.6b

(23.8–26.8)

25.6b

(25.5–28.0)

WC (cm)

75.5a

(73.3–80.1)

83.0b

(80.3–89.2)

94.0c

(90.1–98.3)

Hip (cm)

94.5a

(91.9–99.5)

100b

(99.4–105.7)

104.0b

(101.9–107.1)

WHR

0.79a

(0.78–0.82)

0.82a

(0.49–0.88)

0.92b

(0.87–0.93)

SBP (mm Hg)

124.5ab

(121.6–130.2)

124.0a

(109.6–133.3)

135.0b

(129.5–141.7)

DBP (mm Hg)

76.5a

(70.7–78.9)

77.0a

(66.5–81.2)

86.0b

(82.8–89.5)

Women

Weight (kg)

56.15a

(54.2–60.7)

59.0a

(58.1–63.2)

66.5b

(64.1–71.5)

Height (cm)

1.60a

(1.60–1.64)

1.65a

(1.63–1.66)

1.60a

(1.62–1.67)

BMI

21.1a

(20.8–22.8)

21.0a

(21.4–23.3)

24.5b

(23.9–26.0)

WC (cm)

71.0a

(69.3–74.4)

74.0a

(72.7–76.9)

83.0b

(80.6–87.3)

Hip (cm)

95.0a

(91.3–97.0)

97.5a

(95.1–100.2)

102.0b

(100.2–104.8)

WHR

0.75a

(0.74–0.78)

0.75a

(0.75–0.78)

0.81b

(0.79–0.84)

SBP (mm Hg)

113.0a

(105.3–117.7)

119.0b

(108.7–122.3)

124.0b

(120.3–129.3)

DBP (mm Hg)

74.0a

(72.4–78.5)

78.0a

(71.1–81.9)

82.50b

(79.8–85.2)

Medians with different letters indicate significant differences between age groups (p<0.05); CI: Confidence Intervals.

Regarding blood pressure, the Spanish hypertensive population has been indicated to reach about 50% in men and 37% in women [3] whereas in our sample, approximately 87% of men and women had normal or optimum SBP values (< 140 mm Hg), 90.6% of women and 76.7% of men had also normal or optimum DBP values (< 89 mmHg) and only about 10–20% of the participants had high SBP and/or high DBP.

Overall, these results indicated that the participants that attended the science event and took part in the survey displayed healthy values for some well-established risk biomarkers (BMI, WC, WHR and blood pressure) suggesting a good metabolic health.

Healthy Consciousness and Lifestyle Habits

The first question (1) of the survey dealt with the self-reported health status. Overall, most participants considered to have a ‘normal’ health (41%) , ‘good’ health (46%) or a ‘very good’ health (9%). Only around 4% indicated to consider having a bad health status. In question 2, participants were asked about their health status. On average, a majority responded affirmatively with 77.3 % of the people marking statement 2 (‘generally concerned’). It has been repeatedly reported that women have in general a greater interest in health, are more worried about their health status and more prompt than men to adopt healthy habits [28]. We explored potential differences between sexes for their self-reported health status (Figures 1a-b) and self-reported health concern (Figure 2a-b) but we did not find significant differences between men and women, at any of the three age groups examined. The self-reported health status was predominantly distributed between normal and good categories for both genders and all age subgroups with only a slightly higher (but not significant) proportion of men than women within the ‘good’ category and a higher proportion of women than men in the ‘normal’ category (Figure 1a-b). Regarding health concern, the adult male participants constituted the largest group generally concerned about their health status whereas, in women, the young adults group was slightly superior to the adolescents and adult groups (Figure 2a-b), but again, this difference was not significant.

NRFSJ 2018-102 - Laura Laguna USA_F1

FIGURE 1. Gender and age distribution of the self-reported health status across the sample population.

NRFSJ 2018-102 - Laura Laguna USA_F2

FIGURE 2. Gender and age distribution of the self-reported health concern across the sample population.

In addition to a poor diet, physical inactivity, tobacco use and excessive alcohol consumption are the most relevant modifiable lifestyle habits that are associated with the development of chronic diseases (WHO, 1990). We asked the participants’ about their smoking, alcoholic drinking and sport practicing habits. In general, the consumers subpopulation examined here declared to have good lifestyle habits and was constituted by a majority of non-smokers (80.2%), almost equally divided between occasional/regular consumers of some alcoholic drinks (principally, beer and wine) (50.6%) and not consumers (49.4%). About 75% of the sample population also declared to be active and practiced some physical activity with weekly regularity, mostly aerobic exercise such as walking, cycling, dancing, running, football, gym, swimming, or martial arts. Using a contingency table and a Chi-Square test we investigated a possible relationship between the participant’s self-reported health concern and their consumption of tobacco, alcoholic drinking and physical activity but we did not find any significant relationship (data not shown).

This section of the survey confirmed that, globally, more than 80% of the participants had a positive perception of their health and were concerned about it. These values were higher than the overall 66.6% of positive SRH in the Spanish population [29] reinforcing the healthy orientation of the people who participated in the survey.

General Knowledge About Metabolic Disorders

Questions 3 to 6 of the questionnaire aimed at finding out whether the participants had any general knowledge about some common metabolic disorders, i.e. hypercholesterolemia and hypertension, as well as about type-2 diabetes and metabolic syndrome. The overall results are summarized in Figure 3a-d. Hypertension is a chronic disorder and major risk factor for cardiovascular diseases and has been classically defined as blood pressure readings above 140 and 90 mmHg thresholds for SBP and DBP, respectively [30]. A combination of dietary (high salt consumption), genetic and environmental factors determine a high inter-individual variability in blood pressure values [31]. Hypertension was the most familiar concept for the interviewed volunteers with 77.5% of them affirming to know what hypertension was. Of those, ~95% defined the term as having high blood pressure although very few participants mentioned specific limit values, identified the chronicity of the problem or related it to genetic factors and (or) salt consumption. The rest of affirmative participants (~5%) gave a wrong definition or none. Hypercholesterolemia is also a high prevalent metabolic disorder in the Spanish adult population which is associated with high levels of serum cholesterol and cardiovascular diseases development [2]. Nearly 60% of the participants were also able to recognize and define hypercholesterolemia as high levels of cholesterol in blood although only a few people mentioned limit values or established a link between hypercholesterolemia and bad dietary habits or other factors. In association with high blood pressure and high cholesterol, type-2 diabetes also shows a high prevalence in the Spanish adult population [4]. This complex metabolic disorder is characterized by high glucose levels in blood (hyperglycemia) associated with insulin resistance and pancreatic β-cells alterations [32]. Among the participants, knowledge of type-2 diabetes was slightly inferior to that of the previous disorders since only 47% of the interviewed people responded affirmatively to this question. A miscellaneous of definitions were given: around 37% of the people recognized diabetes as a problem of the pancreas and insulin, about 27% related it with high glucose/sugar levels in blood and nearly 24% defined it as a problem associated with weight and diet and with an excessive consumption of sugar. MetS has been defined as the concurrence of at least three of the following cardio-metabolic risk factors: central obesity, hyperglycemia, hypertension and dyslipidemia [33]. In contrast to the knowledge on some of the previous individual risk factors examined, most of the participants (~80%) have not heard or did not know about MetS, and from the remaining 20% who declared to know this syndrome, very few were able to give a proper or approximate definition with less than 20% describing it as a combination of several factors, i.e. high blood pressure, obesity, high glucose and lipids alteration or as a problem associated with bad dietary habits. A very limited awareness of MetS has been indicated for the general population in other countries such as Greece [34]. This is somehow not surprising since MetS is a very complex and multifactorial disorder. Even university students’ knowledge about MetS and conditions related has been reported to be susceptible to improvement and that raising awareness about MetS remains essential to enhance wellness [35].

NRFSJ 2018-102 - Laura Laguna USA_F3

FIGURE 3. Percentage distribution in the sample population of their general knowledge about some common cardio-metabolic risk factors or disorders: a) hypertension, b) hypercholesterolemia, c) type-2 diabetes and d) metabolic syndrome. Some of the definitions given by the participants are also summarized.

On the whole, it appears that the general population has insufficient knowledge about chronic diseases and their associated risk factors. This has important implications for the prevention of these diseases since a better knowledge and understanding of health and disease-related information will influence the health-related behavior and attitude [36].

Health and Diet

A very high proportion of the consumers taking part in this study (93.5%) agreed on that food has an important effect on our health (question 7). The next three questions of the survey referred to the general perception of what a healthy diet was. The distribution of choices selected by the participants is depicted in Figure 4a-c. The most voted responses to question 8 (how the quantity of food we eat affects our health) was number 2 (224 votes, 59.3% of the total votes) followed by number 1 (95 votes, 25.1% of the total votes) (Figure 4a) indicating that a considerable proportion of the participants were aware of the healthiness of eating less quantities of food rather than large quantities. With respect to question 9 (what was generally considered a healthy diet), the three most voted responses ranked in order were 3 (184 votes, 38.2% of the votes), 1 (159 votes, 33% of the votes) and 2 (127 votes, 26.3% of the votes) (Figure 4b) showing that about 57% of the participants were also aware of the importance of eating a diverse diet that included fruits, vegetables, cereals, nuts and olive oil vs. lower intake of meat, fat, salt, sugar and alcohol. Regarding whether the participants thought their habitual diet was healthy (question 10, Figure 4c), the two most voted responses were number 2 (142 votes, 47.8% of the total votes) and number 3 (97 votes, 32.7% of the votes) indicating that they believed to follow the general dietary recommendations. Nevertheless, an important proportion of the participants (~45%)  admitted that sometimes they would eat more than they should do. This last statement may be attributed to social and cultural behaviors that critically influence our eating choices and indicate that nutrition knowledge and awareness is necessary but not sufficient to change consumer´s food behaviors [37].

NRFSJ 2018-102 - Laura Laguna USA_F4

FIGURE 4. Distribution of choices selected by the participants in response to questions 8, 9 and 10 about the relationship between diet & health.

Overall, the participants in this study showed to be generally aware of the importance of diet in health. Previous studies have indicated that women are more health-conscious and more receptive and motivated to food and health issues than men [38]. We, however, did not find any significant differences between men and women’s awareness of the link between diet and health. Gender-related differences are based on a complex network of factors that need to be further investigated to fully understand the role of gender on the perception and adoption of healthy habits [28]

Perception of Functional Foods and Nutraceuticals

It is recognized that to combat the metabolic chronic disorders the use of Functional Foods and Nutraceuticals, both products placed in the interface between pharma and nutrition, may offer opportunities to reduce the risk of developing these diseases [16]. These products may be interesting for those consumers willing to move into healthier habits without making major changes in their food preferences [39]. Some of these products are currently available in the market. Nevertheless, their use is not always clearly stated and (or) regulated nor the general public is aware of or has a good knowledge about them. The results of our survey about the knowledge and consumption of Functional Foods and Nutraceuticals (questions 11 to 20 of the survey) are summarized in Table 3.

Table 3. Total distribution of the responses for questions 11 to 20 of the questionnaire related to the knowledge and consumption of Functional Foods and Nutraceuticals.

Summary of Responses to questions 11 to 20

Functional Foods

Nutraceuticals

Do you know what these products are?

49.6%

(yes)

48.1%

(no)

2.3%

(no reply)

12.9 %

(yes)

82.2%

(no)

4.9%

(no reply)

Are you a consumer?

25.8%

(yes)

47.3%

(no)

26.9%

(no reply)

4.7%

(yes)

65%

(no)

30.4%

(no reply)

If your answer was ‘yes’:

Total votes

% of total

Total votes

% of total

  • You take them because your doctor recommended to you (1)

10

13.9

2

14.3

  • You take them because it was recommended to you by the pharmacist or in the herbalist’s shop (2)

5

6.9

2

14.3

  • You take them because someone recommended to you or you saw it on TV (3)

12

16.7

0

0

  • You take them because you like it although you think they are not very useful (4)

3

4.2

0

0

  • You take them although you are not sure if they really have an effect (5)

14

19.4

2

14.3

  • Other responses

24

33.3

5

35.7

  • No reply

4

5.6

3

21.4

If your answer was ‘no’:

Total votes

% of total

Total votes

% of total

  • I have no intention of consuming these products since I do not believe they work (1)

1

0.5

1

0.6

  • I will not consume these products because I do not know what they are (2)

12

5.8

23

13.7

  • I would only take them it they were recommended to me by the doctor (3)

36

17.5

24

14.2

  • I would start eating them only if they were tasty (4)

4

1.9

4

2.4

  • Maybe, I will start taking them in the future if they really work (5)

38

18.5

19

11.2

  • Other responses

98

47.6

11

6.5

  • No reply

17

8.3

87

51.5

Nearly half of the volunteers (49.6%) declared to know what Functional Foods were and from these ones, about 90% attempted to give a description of these products. Nevertheless, among the responses, only ~45% were considered to have some degree of agreement with the general definition: Foods that are beneficial for health and (or) foods that have some extra added components with a benefit on health [16]. Of those participants that gave a definition, only 46% also included an example of these products with the three top examples being: ϖ-3 or dairy products with ϖ-3 (23.5% of all the examples), dairy products with plant sterols (22.1%) and dairy products with probiotics (11.8%). They were all mostly referred as to the commercial brand. Regarding the consumption of Functional Foods only 25.8% of the participants declared to consume or to have consumed these products. The predominant reason given was that they liked them and thought they were good for health (as generally stated in the designated Other responses box). In addition, they also took these products: but they were not really sure if they had any effect (5), and because someone recommended to them or saw them on television (3) or were recommended by a doctor (1).

Concerning Nutraceuticals, only 12.9% of the participants affirmed to know them and, from those, about 79% included also a description of these products but very few definitions were considered to have some agreement with the general concept of Nutraceuticals: Food formulations with components that are beneficial for health [17]. Regarding the consumption of Nutraceuticals, only 4.7% of the participants declared  to consume or to have consumed them. Some of the main reasons for taking them were also: recommended by a doctor (1), recommended by the pharmacist or in the herbalist shop (2) or they take them but they were not sure if they really have any effect (5).

Among those individuals who stated not to consume Functional Foods, only 18.5 % declared that they would start taking them in the future if they really worked (response 5) and 17.5% would only take them if they were recommended by the doctor (response 3). About 48% of the participants wrote other various reasons such as I don’t eat them because I believe that healthy food and sports are sufficient to keep us healthy, Perhaps I would try them if I needed them and/or if I learnt more about them. From the participants that stated not to consume Nutraceuticals, only 14.2% would only take them if they were recommended by the doctor and 13.7% would not consume these products due to a lack of knowledge and information about these products.

Overall, the sample subpopulation had poor knowledge about Functional Foods or Nutraceuticals, although they appeared to be more familiar with Functional Foods, especially with commercially available brands. Further, the consumption of these products was also very limited among the sample population. It has been suggested that European consumers may be more critical towards novel foods and food-related information than the USA population [20]. Along these lines, it has been hypothesized that, in particular, Spanish consumers interested in health may not consider necessary to eat this type of foods and they are more prone to consume natural foods on a balanced diet [40]. The success and future of the Functional Food category has been shown to depend on the consumer acceptance of the concept of this type of product and that some important factors to be considered for this are: the taste, the belief in the health benefits and the knowledge and awareness of the concept [20]. The results of our preliminary survey also support the notion that overcoming the lack of knowledge and understanding of these products probably by means of specialized recommendations (doctors, pharmaceutics, herbalists) and increasing the evidence of their health benefits will contribute to increase their consumption and future use by the consumers for health maintenance.

Although the prevention of chronic diseases by natural approaches has increased the focus of attention to Nutraceuticals as an alternative to the classic pharmaceutical approach, the concept of Nutraceuticals remains very confusing among the consumers due to insufficient clinical proofs of their benefits and the lack of proper information to the general public [17]. Our results of the survey also support a very limited knowledge and use of these products in the sample population. In general, it appears that despite the growing evidence of the health-promoting effects of many functional ingredients and Nutraceuticals, most of them are still unknown to most consumers. In support of this statement, recently it was shown that consumers in Denmark had little interest and knowledge about resveratrol, an ingredient already present in some Nutraceuticals and that has been widely and intensively investigated for its potential health benefits [41].

Perception of the Differences Between Individuals and Interest in Research on Diet and Health

Prevention of cardiometabolic chronic disorders by healthy foods and (or) by novel foods and products enriched in healthy components, is still lacking conclusive proof and understanding of their benefits in humans. The evidence is still limited and contradictory, partly due to differences between individuals in their metabolism and in their response regarding cardiometabolic health outcomes. Understanding these differences and identifying the factors implied is an important current area of research in diet and health [42]. It is also equally important that consumers are aware and understand these differences. Question 21 of the questionnaire was designed to attain a first impression of whether the participants had any knowledge of the potential differences between individuals in response to diet as well as of some of the factors that may influence this response. The distribution of answers among the sample population is represented in Figure 5. The two most voted responses were number 2 (145 votes, 33.3% of the total votes) and number 3 (145 votes, 33.3% of the votes) showing that a proportion of the participants were aware of the existence of differences between people in the way they were affected by the diet and, importantly, that the genetic factor was involved in these differences. Overall, knowledge of other potential factors was limited and fragmented as shown by the spread of the choices. Nevertheless, it is worth mentioning that approximately 15% and 8% of the votes pointed at life style and microbiota, respectively, as other potential factors involved in the differences between individuals.

NRFSJ 2018-102 - Laura Laguna USA_F5

FIGURE 5. Distribution of choices selected by the participants in response to question 21 of the questionnaire about the differences between individuals in response to diet and some of the factors that may influence these differences.

Study Limitations and Main Conclusions

This preliminary study aimed to explore by means of a simple questionnaire, the knowledge and awareness of the participants about several important general issues of the binomial ‘diet and health’. Data were collected from a valid although limited sample of 253 participants who attended the public science event and, in particular, our stand and thus, we acknowledge that the study may be biased towards people with a higher interest in the subject than the general Spanish population.

The survey has confirmed that our sample population had a general good health, was generally concerned about health issues and had reasonably good habits. Although they were generally aware of the relevance of diet to health, their familiarity with chronic metabolic disorders was limited. Further, their knowledge of novel Functional Foods and Nutraceuticals was scarce but they manifested some interest in attaining more information about these products and their efficacy. The concept of inter-individual differences in response to diet was familiar to some but further knowledge of the factors involved was very limited and fragmented.

The results of this survey support the importance and general need to continue providing more and updated information to the population about metabolic health and how to improve it. We should use all possible means (school, university, health centers, consumer’ associations) to expand the information to as many people as possible, both to those that may be more interested and knowledgeable as well as to those who are not so interested on diet and health. It is definitively needed to enhance the understanding about Functional Foods and Nutraceuticals, especially those already freely available in the market. The community of doctors, pharmacists and herbalists also need to be well informed about their advances and applicability so that they can contribute to improve the recommendations and use of these novel food products. Understanding the inter-individual differences in response to diet and, in particular, in response to the beneficial foods and derived products in relation with metabolic disease prevention is an essential area of research. Most participants in the survey agreed on the need to continue these investigations. The results of which need to be translated to the general population to: i) increase their understanding and awareness of the role of diet in health and ii) to contribute further to the prevention of metabolic diseases.

Acknowledgements: BB, MVMA, and MTGC are participants to the European COST Action FA1403 POSITIVe: ‘Interindividual variation in response to consumption of plant food bioactives and determinants involved’. L.L. would like to thank the Spanish “Juan de la Cierva” program for her contract (Ref. FJCI-2014–19907).

References

  1. Lecube A, et al., (2017) Prevention, diagnosis, and treatment of obesity. 2016 position statement of the Spanish Society for the Study of Obesity. Endocrinología, Diabetes y Nutrición (English ed.) 64: 15–22.
  2. de la Sierra A, et al. (2015) Prevalence, Treatment, and Control of Hypercholesterolemia in High Cardiovascular Risk Patients: Evidences from a Systematic Literature Review in Spain. Advances in therapy 32: 944–961.
  3. Menéndez E, et al. (2016) Prevalence, diagnosis, treatment, and control of hypertension in Spain. Results of the Di@ bet. Es study. Revista Española de Cardiología 69: p. 572–578.
  4. Ena J, et al. (2016) Management of patients with type 2 diabetes and multiple chronic conditions: A Delphi consensus of the Spanish Society of Internal Medicine. European journal of internal medicine 27: 31–36.
  5. Gavrila D, et al. (2011) Prevalence of metabolic syndrome in Murcia Region, a southern European Mediterranean area with low cardiovascular risk and high obesity. BMC public health 11: 562.
  6. Jayanti RK, Burns AC (1998) The antecedents of preventive health care behavior: An empirical study. Journal of the Academy of Marketing Science 26: 6.
  7. Tchicaya A, et al. (2013) Social inequality in awareness of cardiovascular risk factors in patients undergoing coronary angiography. European journal of preventive cardiology 20: 872–879.
  8. Hsieh CR, Lo TF (2017) Are smokers too optimistic about their health status: Ex ante perception versus ex post observation. China Economic Review 43: 169–183.
  9. Loprinzi PD (2015)Factors influencing the disconnect between self-perceived health status and actual health profile: implications for improving self-awareness of health status. Preventive medicine 73: 37–39.
  10. Piotrowicz K, et al. (2015) Self-reported health-related behaviors and dietary habits in patients with metabolic syndrome. Cardiology journal 22: 413–420.
  11. Cook LA, Burton S, Howlett E (2011) Health risk factors and their effect on consumers’ use of nutrition facts panels. Journal of Consumer Affairs 45: 516–527.
  12. Parmenter K, Wardle J (1999) Development of a general nutrition knowledge questionnaire for adults. European Journal of Clinical Nutrition 53: 298–308.
  13. Mingioni M, et al. (2016) Fruit and vegetables liking among European elderly according to food preferences, attitudes towards food and dependency. Food Quality and Preference 50: 27–37.
  14. Kollajtis-Dolowy A, Zamojcin K (2016) The level of knowledge on nutrition and its relation to health among Polish young men. Roczniki Panstwowego Zakladu Higieny 67: 155–161.
  15. Alkerwi A, et al, (2015) Association between nutritional awareness and diet quality: evidence from the observation of cardiovascular risk factors in Luxembourg (ORISCAV-LUX) study. Nutrients 7: p. 2823–2838.
  16. Eussen SR, et al. (2011) Functional foods and dietary supplements: products at the interface between pharma and nutrition. European journal of pharmacology 668: S2-S9.
  17. Santini A, Tenore GC, Novellino E (2017) Nutraceuticals: A paradigm of proactive medicine. European Journal of Pharmaceutical Sciences 96: 53–61.
  18. El Sohaimy S (2012) Functional foods and nutraceuticals-modern approach to food science. World Applied Sciences Journal 20: 691–708.
  19. Urala N, Lähteenmäki L (2004) Attitudes behind consumers’ willingness to use functional foods. Food quality and preference 15: 793–803.
  20. Verbeke W (2005) Consumer acceptance of functional foods: socio-demographic, cognitive and attitudinal determinants. Food quality and preference 6: 45–57.
  21. Krystallis A, Maglaras G, Mamalis S (2008) Motivations and cognitive structures of consumers in their purchasing of functional foods. Food Quality and Preference 19: 525–538.
  22. Axon DR, et al. (2017) Dietary Supplement Use, Knowledge, and Perceptions Among Student Pharmacists. American Journal of Pharmaceutical Education 81: 92.
  23. Zubeldia Lauzurica L, et al. (2016) Prevalence of Hypertensión and Associated Factors in Population Aged 16 to 90 Years Old in Valencia Region, Spain. Revista espanola de salud publica.
  24. Ahmed NU, Delgado M, Saxena A (2016) Trends and disparities in the prevalence of physicians’ counseling on diet and nutrition among the US adult population, 2000–2011. Preventive medicine 89: 70–75.
  25. Santiago S, et al. (2017) Healthy-eating attitudes and the incidence of cardiovascular disease: the SUN cohort. International journal of food sciences and nutrition 68: 595–604.
  26. Gutiérrez-Fisac J, et al. (2012) Prevalence of general and abdominal obesity in the adult population of Spain, 2008–2010: the ENRICA study. Obesity reviews 13: 388–392.
  27. Aranceta-Bartrina J, et al. (2016) Prevalence of general obesity and abdominal obesity in the spanish adult population (aged 25–64 years) 2014–2015: The ENPE study. Revista Española de Cardiología (English Edition) 69: 579–587.
  28. Varì R, et al. (2016) Gender-related differences in lifestyle may affect health status. Annali dell’Istituto Superiore di Sanità 52: 158–166.
  29. Girón, P (2010) Determinants of self-rated health in Spain: differences by age groups for adults. The European Journal of Public Health 22: 36–40.
  30. Currie G and Delles C (2016) Use of biomarkers in the evaluation and treatment of hypertensive patients. Current hypertension reports 18: 54.
  31. Iatrino R, Manunta P, Zagato L (2016) Salt sensitivity: challenging and controversial phenotype of primary hypertension. Current hypertension reports, 18: 70.
  32. Zaccardi F, et al. (2015) Pathophysiology of type 1 and type 2 diabetes mellitus: a 90-year perspective. Postgraduate medical journal, 2015: p. postgradmedj-2015–133281.
  33. Grundy S (2005) Metabolic syndrome: therapeutic considerations, in Atherosclerosis: Diet and Drugs. Springer. 107–133.
  34. Athyros V, et al. (2005) Awareness, treatment and control of the metabolic syndrome and its components: a multicentre Greek study. Hellenic J Cardiol 46: 380–386.
  35. Yahia N, et al. (2014) Assessment of college students’ awareness and knowledge about conditions relevant to metabolic syndrome. Diabetology & metabolic syndrome 6: 111.
  36. Webster R, Heeley E (2010) Perceptions of risk: understanding cardiovascular disease. Risk Management and Healthcare Policy 3: 49.
  37. Worsley A (2002) Nutrition knowledge and food consumption: can nutrition knowledge change food behaviour? Asia Pacific journal of clinical nutrition 11.
  38.  Andrade L, Zazpe I, et al. (2017) Ten-Year Changes in Healthy Eating Attitudes in the SUN Cohort. J Am Coll Nutr 36: 319–329.  Williamson AR, Hunt AE, Pope JF, Tolman NM (2000) Recommendations of dietitians for overcoming barriers to dietary adherence in individuals with diabetes. Diabetes Educ 26: 272–279.  
  39. Küster-Boluda I, Vidal-Capilla I (2017) Consumer attitudes in the election of functional foods. Spanish Journal of Marketing-ESIC 21: 65–79.
  40. Aschemann-Witzel J, Grunert KG (2015) Resveratrol and health from a consumer perspective: perception, attitude, and adoption of a new functional ingredient. Annals of the New York Academy of Sciences 1348: 171–179.
  41. Manach C, et al (2017) Addressing the inter-individual variation in response to consumption of plant food bioactives: Towards a better understanding of their role in healthy aging and cardiometabolic risk reduction. Molecular nutrition & food research 61.

Supplementary Material S1.- Self-administered questionnaire.

Diet & Health: What’s Your Opinion?

Age:

Sex:

Measurements taken on the day of the questionnaire

Weight (Kg):

Height (m):

BMI:

Waist circumference (cm):

Hip circumference (cm):

Waist-to-hip ratio:

Sistolic blood pressure (mm Hg):

Diastolic blood pressure (mm Hg):

Do you…

Smoke? YES / NO (indicate cigarettes consumption, daily or weekly)

Drink alcohol? YES / NO (indicate consumption, daily or weekly, quantity and type of drink)

Practice sport? YES / NO (indicate what activities/sports you do/practice and frequency)

Please, mark the categories that best describe your situation

1. HOW DO YOU CONSIDER YOUR HEALTH STATUS?

Very good, even better than the average status for people of my age (1)

Good (2)

Normal (3)

Bad (4)

Very bad, worse than the average status for people of my age* (5)

* Please, indicate if, at present, you suffer from any chronic/acute disease:

2. ARE YOU CONCERNED ABOUT YOUR HEALTH STATUS?

Yes, I am very much concerned. I dedicate quite some time to the health issue and I often search for information about forefront related topics (1)

I am generally concerned about my health and I try to follow a healthy style of life (2)

Generally, I do not worry about my health (3)

I am not in the least concerned about my health. I simply do not worry about it at all (4)

Other responses (Please, indicate them in the box below)

3. Do you know what ‘hypercholesterolemia’ is?

NO / YES (Please, use your own words definition)

4. Do you know what ‘hypertension’ is?

NO / YES (Please, use your own words definition)

5. Do you know what ‘Type-2 diabetes’ is?

NO / YES (Please, use your own words definition)

6. Do you know what ‘metabolic syndrome’ is?

NO / YES (Please, use your own words definition)

7. How much do you agree with the next statement?

‘FOOD HAS AN IMPORTANT EFFECT ON MY HEALTH’

I totally agree (1)

I agree (2)

I don´t agree or disagree (3)

I disagree (4)

I totally disagree (5)

8. DO YOU KNOW, IN GENERAL, HOW THE QUANTITY OF FOOD AFFECTS OUR HEALTH?

(please, mark the statement(s) you agree with)

To eat a lot is not, generally, recommended (1)

To eat a little bit of everything is the best option to maintain a good health (2)

The quantity of food is not relevant at all (3)

To eat very little is not generally recommended (4)

9. DO YOU KNOW WHAT IS CONSIDERED, IN GENERAL, A ‘HEALTHY DIET’?

(please, mark the statement(s) you agree with)

A diet rich in fruits, vegetables, cereals, nuts and olive oil is good for health (1)

A high intake of red/processed meat, fats, salt, sugar and alcohol is not, in general, good for health (2)

A diverse diet rich in fruits, vegetables and cereals with occasional consumption of meat is good for your health (3)

Diet has nothing to do with health (4)

Other responses (Please, indicate them in the box below)

10. DO YOU BELIEVE YOUR HABITUAL DIET IS ‘HEALTHY’?

(please, mark the statement(s) that best describe your situation)

I always eat and drink as much as I feel like and I do not care about if this affects my weight or if it is good or bad for my health (1)

I try to follow some of the general dietary recommendations and to moderate the quantity of food I eat but very often I eat more than I should do (2)

I like to follow the general recommendations to have a healthy diet and I usually consume quite a lot of fruits and vegetables and very little fat (3)

I follow a rather strict and controlled diet (4)

Other responses (Please, indicate them in the box below)

11. DO YOU KNOW WHAT FUNCTIONAL FOODS ARE?

YES / NO

12. If yes, HOW WOULD YOU DESCRIBE THEM? Can you quote a few examples? Please, indicate them in the box below

13. ARE YOU A CONSUMER OF SOME OF THESE PRODUCTS?

YES / NO

14. If your answer was ‘yes’:

You take them because your doctor recommended to you (1)

You take them because it was recommended to you by the pharmacist or in the herbalist’s shop (2)

You take them because someone recommended to you or you saw it on TV (3)

You take them because you like it although you think they are not very useful (4)

You take them although you are not sure if they really have an effect (5)

Other responses (Please, indicate your own opinion about these foods in the box below)

15. If your answer was ‘no’:

I have no intention of consuming these functional foods since I do not believe they work (1)

I will not consume these functional foods because I do not know what they are (2)

I would only take them it they were recommended to me by the doctor (3)

I would start eating them only if they were tasty (4)

Maybe, I will start taking them in the future if they really work (5)

Other responses (Please, indicate your own opinion about these foods in the box below)

16. DO YOU KNOW WHAT NUTRACEUTICALS ARE?

YES/NO

17. If yes, HOW WOULD YOU DESCRIBE THEM? Can you quote a few examples? Please, indicate them in the box below

18. ARE YOU A CONSUMER OF SOME OF THESE PRODUCTS?

YES / NO

19. If your answer was ‘yes’:

You take them because your doctor recommended to you (1)

You take them because it was recommended to you by the pharmacist or in the herbalist’s shop (2)

You take them because someone recommended to you or you saw it on TV (3)

You take them because you like it although you think they are not very useful (4)

You take them although you are not sure if they really have an effect (5)

Other responses (Please, indicate your own opinion about these products in the box below)

20. If your answer was ‘no’:

I have no intention of consuming these nutraceuticals since I do not believe they work (1)

I will not consume these nutraceuticals because I do not know what they are (2)

I would only take them it they were recommended to me by the doctor (3)

I would start eating them only if they were tasty (4)

Maybe, I will start taking them in the future if they really work (5)

Other responses (Please, indicate your own opinion about these foods in the box below)

21. DO YOU THINK THAT THE DIET HAS THE SAME EFFECTS ON EVERYBODY?

(please, mark the statement(s) that best describe your opinion)

The diet affects equally to everyone. In general, the foods that are damaging or unhealthy are so to all and, those that are beneficial have a benefit for everyone (1)

The diet does not affect everybody in the same manner. There are people who eat anything they like and do not put on weight or develop any disease whereas others have a tendency to put on weight, or develop high cholesterol or high levels of blood sugar even if they do not eat very much (2)

Genetics has a lot to do with the differences between people and the way they are affected by what they eat (3)

The diet affects differently to people depending on their life style. If you do sports and look after yourself, food does not have an effect on your health (4)

The diet has an effect depending on the microflora/microbiota inhabiting each ones gut (5)

The diet affects health only in elderly and/or people suffering some disease(s)(6)

Other responses (Please, indicate your own opinion about these foods in the box below)

Supplementary Material S2. Distribution of the anthropometric characteristics of the sample population taking into consideration the values established by the World Health Organization (WHO) to differentiate between low risk and high risk for cardio-metabolic disorders development.

Total sample population

n (%)

Adolescents [11–17 y]

n (%)

Young adults [18–40 y]

n (%)

Adults [41–65 y]

n (%)

Men

BMI (Kg/m2)

< 18.5 (low weight)

8 (7.8)

8 (22.2)

0 (0.0)

0 (0.0)

≥ 18.5–24.99 (normal weight)

53 (51.5)

20 (55.5)

18 (56.3)

15 (42.9)

≥ 25.0–29.99 (overweight)

29 (28.2)

7 (19.4)

9 (28.1)

13 (37.1)

≥ 30.0 (obesity)

13 (12.6)

1 (2.8)

5 (15.7)

7 (20.0)

WC (cm)

≤ 102 cm (low risk)

88 (85.4)

33 (91.7)

27 (84.3)

28 (80.0)

> 102 cm (substantially increased risk)

15 (14.6)

3 (8.3)

5 (15.7)

7 (20.0)

WHR

< 0.90 (good)

71 (68.9)

25 (69.4)

23 (71.9)

23 (65.7)

≥ 0.90 (substantially increased risk)

32 (31.1)

11 (30.6)

9 (28.2)

12 (34.3)

SBP (mm Hg)

≤ 120 mm Hg (optimum)

37 (35.9)

20 (55.5)

11 (34.4)

6 (17.1)

121–139 mm Hg (normal)

53 (51.5)

14 (38.9)

13 (40.7)

26 (74.3)

≥140 mm Hg (high)

13 (12.6)

2 (5.6)

8 (25.0)

3 (8.6)

DBP (mm Hg)

≤ 80 mm Hg (optimum)

42 (40.8)

26 (72.2)

12 (37.5)

4 (11.4)

81–89 mm Hg (normal)

37 (35.9)

6 (16.7)

13 (40.7)

18 (51.4)

≥ 90 mm Hg (high)

24 (23.3)

4 (11.1)

7 (21.9)

13 (37.1)

Women

BMI (Kg/m2)

< 18.5 (low weight)

13 (8.7)

6 (13.0)

7 (10.0)

0 (0.0)

≥ 18.5–24.99 (normal weight)

94 (62.7)

29 (63.0)

46 (65.7)

19 (55.9)

≥ 25.0–29.99 (overweight)

37 (24.7)

10 (21.7)

14 (20)

13 (38.2)

≥ 30.0 (obesity)

6 (4.0)

1 (2.2)

3 (4.3)

2 (5.9)

WC (cm)

≤ 88 cm (low risk)

130 (86.7)

37 (80.4)

64 (91.4)

29 (85.3)

> 88 cm ( substantially increased risk)

20 (13.3)

9 (19.6)

6 (8.6)

5 (14.7)

WHR

< 0.80 (good)

103 (68.7)

31 (67.4)

50 (71.4)

22 (64.7)

≥ 0.80 (substantially increased risk )

47 (31.3)

15 (32.6)

20 (28.5)

12 (35.3)

SBP (mm Hg)

≤ 120 mm Hg (optimum)

70 (46.7)

24 (52.2)

33 (47.1)

13 (38.2)

121–139 mm Hg (normal)

60 (40.0)

18 (39.1)

27 (38.6)

15 (44.1)

≥ 140 mm Hg (high)

20 (13.3)

4 (8.7)

10 (14.3)

6 (17.6)

DBP (mm Hg)

≤ 80 mm Hg (optimum)

89 (59.3)

32 (69.6)

46 (65.7)

11 (32.4)

81–89 mm Hg (normal)

47 (31.3)

11 (23.9)

19 (27.1)

17 (50.0)

≥ 90 mm Hg (high)

14 (9.3)

3 (6.5)

5 (7.1)

6 (17.6)

Therapeutic Modalities for Management of Hemolysis in Pediatric Extracorporeal Membrane Oxygenation (ECMO)

DOI: 10.31038/JCRM.2018121

Introduction

Hemolysis, defined as a rise in plasma-free hemoglobin (pfHb), lactate dehydrogenase (LDH), or total bilirubin (TB) is a common complication of extracorporeal life support (ECLS) and results in increased morbidity and mortality. It has an incidence of 7.8–13% in pediatric patients on extracorporeal membrane oxygenation (ECMO) [1–3]. Contributing factors to hemolysis include presence of thrombi within the circuit, high negative inlet pressure, excessive pump speed and sheer stress on the red blood cells [4–6]. Furthermore, factors related to the oxygenator such as cavitation [7] and pressure changes within the oxygenator [8, 9], along with longer duration of ECMO support [10], are also known factors.

The major contributors of morbidity from hemolysis are its byproducts, specifically pfHg. pfHg has been reported to rise by as much as 10–25 fold during ECMO [11] and is known to be cytotoxic to cells leading to tissue hypoxia, and ultimately cell death [12, 13]. High pfHg levels have been associated with multi-organ failure [12, 14], including direct kidney injury and are predictors of acute renal failure for patients on ECMO [15, 16]. Furthermore, pfHg consumes vascular nitric oxide, leading to inappropriate vasoconstriction and platelet activation [12], further exacerbating already existing ischemic injury and potential for thrombi formation.

As a result of the above injury, hemolysis can result in increased blood product support, need for renal replacement therapy (RRT), prolonged ECMO, longer ICU and hospital stays, and higher mortality [17–19]. There have been several modifications and refinements to ECMO circuitry to mitigate the risk of hemolysis, but it nevertheless remains a significant source of morbidity [3, 6]. In this mini-review, we discuss potential therapeutic modalities for management of hemolysis in ECMO.

Exchange Transfusion

Exchange transfusion (ET) has been an established treatment for neonatal hyperbilirubinemia, immune and non-immune red cell hemolysis, and severe sepsis [20]. The basic principle of an exchange transfusion is to remove the patient’s red cells, in pre-determined aliquots while transfusing back equal amounts of donor whole blood. This process not only removes circulating pfHb and TB but also draws out these byproducts that are deposited in tissue. Several variations exist in protocols for conducting ET in the neonatal population; including the size of aliquots (single vs double volume exchange) [20], route (peripheral vs. umbilical) [21], and method of exchange (continuous vs. push-pull) [22]. The primary aim of this therapy is remove bilirubin in the serum as well as partially hemolyzed an/or antibody-coated red blood cells. This therapy can be expanded to ECLS patients in an effort to reduce not just TB, but also PFHg to avoid secondary organ injury from hemolysis.

There is very little in the literature regarding ET for ECLS-related hemolysis with the exception of case reports [23]. Access points on the ECMO circuitry can be utilized for the removal and infusion of blood products, negating the need for additional access [23]. Mortality directly attributable to ET is estimated to be approximately 1% with described complications including cardiac arrhythmias due to acute electrolyte derangements, cardiac arrest, hemodynamic instability, or air embolism [24]. Frequent arterial blood gases (ABGs) should guide the clinician in electrolyte replacement or sweep adjustment to maintain normal physiologic parameters [23].

There is no established consensus or guidelines on bilirubin, PFHg, or LDH threshold or signs of secondary organ for initiation of ET. Currently, the decision to perform ET is based on institutional experiences at the discretion of the ICU/ ECMO teams. Given that the development of complication such as acute kidney injury (AKI) and need for RRT, are associated with worsening outcomes and decreased survival in both adult and pediatric populations [25–27], we argue for earlier implementation of ET prior to development of secondary organ injury.

Plasma Exchange

Plasma exchange (PE) is performed by selectively removing plasma and replacing with either human serum albumin or fresh frozen plasma, chosen on the basis of the indication for PE and pathogenic factors contributing to a patient’s specific disease process [28, 29]. Similar to ET, PE can significantly reduce PFHg and TB and its early use has been shown to prevent acute renal failure [30–33]. Utilization of PE has been reported for severe intravascular hemolysis [34], severe hemolysis during cardiopulmonary bypass [35], antibody mediated rejection after heart transplant on ECMO [36], and thrombocytopenia-associated multi-organ failure on ECMO [37].

Similar to ET, the plasma filtration device can be connected in-line to the ECMO circuit [38] with an aim to exchange 1.5–2 times the estimated plasma volume. Complications of PE on ECMO include access malfunction, circuit complications including clotting, hypotension, and/or hypocalcemia [38]. PE can also cause a severe coagulopathy if replacement is with albumin and not FFP. Close monitoring of PT/PTT is needed. A single center study reported that 27.6% of patients undergoing PE on ECMO, experienced citrate-associated hypocalcemia and 34.2% developed hypotension [39]. Cortina et al reported 50% survival to discharge in patients requiring CRRT and ECMO who underwent PE [38]. Despite these findings, the authors concluded that simultaneous ECMO and PE is both tolerable and feasible in children and adults. However, it cannot be emphasized enough that continuous hemodynamic and ABG monitoring still remains essential during the procedure regardless of whether an ET or PE is being performed.

Circuit Exchange

Prolonged ECMO can also result in ECMO circuit induced fibrinolysis, oxygenator thrombosis, or pump head thrombosis. All of which contribute to development of hemolysis as red cells undergo microangiopathic destruction due to injury from microthrombi [40]. Circuit induced fibrinolysis typically occurs in circuits that are at least one week old with associated laboratory findings of rising D-dimer and decreasing fibrinogen levels with or without abnormal bleeding and increased blood product requirements. Oxygenator thrombosis can manifest as increased transmembrane pressures, visible clots on the pre- or post-oxygenator membrane, and/or decreasing oxygenator function manifesting as low post-oxygenator PaO2. Lastly, pump head thrombosis results in a rise in PFHg and inefficient revolutions per minute (RPM) to flow ratios [40].

Pan et al examined the reason for ECMO circuit changes with respect to PFHg [40]. The most common reasons were clinically significant thrombosis or hemolysis, occurring in 14/27 (52%) runs requiring an exchange. The authors also found an association between higher PFHg value and CRRT requirements, longer time on ECMO, and higher mortality rates. The decision to perform a circuit exchange is nearly always driven by clinical status of the patient and discussion between the ICU and ECMO teams rather than any singular laboratory value or circuit finding. The obvious risks to undergoing circuit exchange is a transient withdrawal of ECLS support, exposure to new foreign surfaces with risk of activation of the coagulation cascade, and platelet dysfunction [41]. Balancing these risks with ongoing hemolysis should be made on a case by base basis.

Summary

Hemolysis is a common complication of ECMO therapy, due to its associated morbidities and affect on mortality. Hemolysis may be managed by ET, PE, and/or circuit exchange. However, each of these procedures is accompanied by substantial risks. The patients are typically physiologically frail and have minimal reserve to tolerate accumulating complications, especially those relating to secondary organ injury from hemolysis. There is a paucity of literature on the indications, outcomes, and complications from performing these interventions. Furthermore, there is no data comparing these different approaches. A concerted effort by the medical community is needed to systematically appraise these procedures and to standardize the techniques utilized to perform them in the setting of ECMO in order to minimize their associated risks, while optimizing the benefit.

References

  1. Ichiba S, Bartlett RH (1996) Current status of extracorporeal membrane oxygenation for severe respiratory failure. Artif Organs 20(2): 120–3. [Crossref]
  2. Haines NM, Rycus PT, Zwischenberger JB, Bartlett RH, Undar A (2009) Extracorporeal Life Support Registry Report 2008: neonatal and pediatric cardiac cases. ASAIO J 55(1): 111–6.[Crossref]
  3. Masalunga C, Cruz M, Porter B, Roseff S, Chui B, Mainali E(2007) Increased hemolysis from saline pre-washing RBCs or centrifugal pumps in neonatal ECMO. J Perinatol 27(6): 380–4.[Crossref]
  4. Leverett LB, Hellums JD, Alfrey CP, Lynch EC (1972) Red blood cell damage by shear stress. Biophys 12(3): 257–73. [Crossref]
  5. Shimono T, Makinouchi K, Nose Y (1995) Total erythrocyte destruction time: the new index for the hemolytic performance of rotary blood pumps. Artif Organs 19(7): 571–5. [Crossref]
  6. Barrett CS, Jaggers JJ, Cook EF, Graham DA, Yarlagadda VV, Teele SA, et al. (2013) Pediatric ECMO outcomes: comparison of centrifugal versus roller blood pumps using propensity score matching. ASAIO J 59(2): 145–51. [Crossref]
  7. Wielogorski JW, Cross DE, Nwadike EV (1975) The effects of subatmospheric pressure on the haemolysis of blood. J Biomech 8(5): 321–5. [Crossref]
  8. Williams DC, Turi JL, Hornik CP, Bonadonna DK, Williford WL, Walczak RJ, et al. (2015) Circuit oxygenator contributes to extracorporeal membrane oxygenation-induced hemolysis. ASAIO J 61(2): 190–5. [Crossref]
  9. Lequier L, Horton SB, McMullan DM, Bartlett RH (2013 )Extracorporeal membrane oxygenation circuitry. Pediatr Crit Care Med 14(5 Suppl 1): S7–12. [Crossref]
  10. Steinhorn RH, Isham-Schopf B, Smith C, Green TP (1989) Hemolysis during long-term extracorporeal membrane oxygenation. J Pediatr 115(4): 625–30. [Crossref]
  11. Skogby M, Mellgren K, Adrian K, Friberg LG, Chevalier JY, Mellgren G (1998) Induced cell trauma during in vitro perfusion: a comparison between two different perfusion systems. Artif Organs 22(12): 1045–51.
  12. Rother RP, Bell L, Hillmen P, Gladwin MT (2005) The clinical sequelae of intravascular hemolysis and extracellular plasma hemoglobin: a novel mechanism of human disease. JAMA 293(13): 1653–62. [Crossref]
  13. Cappellini MD. (2007 )Coagulation in the pathophysiology of hemolytic anemias. Hematology Am Soc Hematol Educ Program 74–8. [Crossref]
  14. Vermeulen Windsant IC, Hanssen SJ, Buurman WA, Jacobs MJ (2011) Cardiovascular surgery and organ damage: time to reconsider the role of hemolysis. J Thorac Cardiovasc Surg 142(1): 1–11. [Crossref]
  15. Lyu L, Long C, Hei F, Ji B, Liu J, Yu K, et al. (2016) Plasma Free Hemoglobin Is a Predictor of Acute Renal Failure During Adult Venous-Arterial Extracorporeal Membrane Oxygenation Support. J Cardiothorac Vasc Anesth 30(4): 891–5. [Crossref]
  16. Neal JR, Quintana E, Pike RB, Hoyer JD, Joyce LD, Schears G (2015) Using Daily Plasma-Free Hemoglobin Levels for Diagnosis of Critical Pump Thrombus in Patients Undergoing ECMO or VAD Support. J Extra Corpor Technol 47(2): 103–8. [Crossref]
  17. Lou S, MacLaren G, Best D, Delzoppo C, Butt W (2014) Hemolysis in pediatric patients receiving centrifugal-pump extracorporeal membrane oxygenation: prevalence, risk factors, and outcomes. Crit Care Med 42(5): 1213–20. [Crossref]
  18. Gbadegesin R, Zhao S, Charpie J, Brophy PD, Smoyer WE, Lin JJ (2009) Significance of hemolysis on extracorporeal life support after cardiac surgery in children. Pediatr Nephrol 24(3): 589–95. [Crossref]
  19. Villa G, Katz N, Ronco C (2015) Extracorporeal Membrane Oxygenation and the Kidney. Cardiorenal Med 6(1): 50–60. [Crossref]
  20. Thayyil S, Milligan DW (2006) Single versus double volume exchange transfusion in jaundiced newborn infants. Cochrane Database Syst Rev (4): CD004592.
  21. Merchant RH, Sakhalkar VS, Rajadhyaksha SB (1992) Exchange transfusions via peripheral vessels. Indian Pediatr 29(4): 457–60.
  22. Schober PH. (1990) [Automated exchange transfusion in premature and newborn infants with hyperbilirubinemia using a peripheral arteriovenous vascular access device]. Wien Klin Wochenschr 102(16): 471–5. [Crossref]
  23. Shakoor A, Svetlana S, Brewer MP, Okochi S, Neunert CE, Cheung EW, et al. (2018) Continuous double volume exchange transfusion is a safe treatment for ECMO-induced hemolysis. Journal of Pediatric Surgery Case Reports 32: 75–8.
  24. Boggs TR, Westphal MC (1960) Mortality of Exchange Transfusion. Pediatrics 26(5): 745–55.
  25. Kielstein JT, Heiden AM, Beutel G, Gottlieb J, Wiesner O, et al. (2013) Renal function and survival in 200 patients undergoing ECMO therapy. Nephrol Dial Transplant 28(1): 86–90. [Crossref]
  26. Elella RA, Habib E, Mokrusova P, Joseph P, Aldalaty H, et al.(2017) Incidence and outcome of acute kidney injury by the pRIFLE criteria for children receiving extracorporeal membrane oxygenation after heart surgery. Ann Saudi Med 37(3): 201–6. [Crossref]
  27. Gupta P, Beam B, Schmitz ML. (2015) Outcomes associated with the use of renal replacement therapy in children receiving extracorporeal membrane oxygenation after heart surgery: a multi-institutional analysis. Pediatr Nephrol30(6): 1019–26. [Crossref]
  28. Wright E (2004) Therapeutic plasma exchange in children. Paediatr Nurs 16(9): 39–42.
  29. Puppe B, Kingdon EJ (2014) Membrane and centrifugal therapeutic plasma exchange: practical difficulties in anticoagulating the extracorporeal circuit. Clin Kidney J7(2): 201–5. [Crossref]
  30. Grobety M, Venetz JP, Genton CL, Nicod P (1995) [Malfunction of a mitral bioprosthesis, hemolysis and acute renal insufficiency]. Schweiz Med Wochenschr 125(36): 1679–83. [Crossref]
  31. Couzi L, Morel D, Deminiere C, Merville P (2004) An unusual endocarditis-induced crescentic glomerulonephritis treated by plasmapheresis. Clin Nephrol 62(6): 461–4. [Crossref]
  32. Hayes C, Shafi H, Mason H, Klapper E (2016) Successful reduction of plasma free-hemoglobin using therapeutic plasma exchange: A case report. Transfus Apher Sci 54(2): 253–5. [Crossref]
  33. Raval JS, Wearden PD, Orr RA, Kiss JE (2012) Plasma exchange in a 13-year-old male with acute intravascular hemolysis and acute kidney injury after placement of a ventricular assist device. J Clin Apher 27(5): 274–7. [Crossref]
  34. Fredlund H, Berseus O, Bjorsell-Ostlilng E, Filbey D(1989) A retrospective study of acute plasma exchange in severe intravascular hemolysis. Eur J Haematol 43(3): 259–61. [Crossref]
  35. Hei F, Irou S, Ma J, Long C (2009) Plasma exchange during cardiopulmonary bypass in patients with severe hemolysis in cardiac surgery. ASAIO J 55(1): 78–82. [Crossref]
  36. Jhang J, Middlesworth W, Shaw R, Charette K, Papa J, et al. (2007) Therapeutic plasma exchange performed in parallel with extra corporeal membrane oxygenation for antibody mediated rejection after heart transplantation. J Clin Apher 22(6): 333–8. [Crossref]
  37. Chong M, Lopez-Magallon AJ, Saenz L, Sharma MS, Althouse AD, et al. (2017) Use of Therapeutic Plasma Exchange during Extracorporeal Life Support in Critically Ill Cardiac Children with Thrombocytopenia-Associated Multi-Organ Failure. Front Pediatr 5: 254. [Crossref]
  38. Cortina G, McRae R, Chiletti R, Butt W (2018) Therapeutic Plasma Exchange in Critically Ill Children Requiring Intensive Care. Pediatr Crit Care Med 19(2): e97-e104. [Crossref]
  39. Dyer M, Neal MD, Rollins-Raval MA, Raval JS (2014) Simultaneous extracorporeal membrane oxygenation and therapeutic plasma exchange procedures are tolerable in both pediatric and adult patients. Transfusion 54(4): 1158–65. [Crossref]
  40. Pan KC, McKenzie DP, Pellegrino V, Murphy D, Butt W. (2016) The meaning of a high plasma free haemoglobin: retrospective review of the prevalence of haemolysis and circuit thrombosis in an adult ECMO centre over 5 years. Perfusion 31(3): 223–31. [Crossref]
  41. Peek GJ, Firmin RK (1999) The inflammatory and coagulative response to prolonged extracorporeal membrane oxygenation. ASAIO J 45(4): 250–63. [Crossref]

Challenges and Successes in Research Work

DOI: 10.31038/IJVB.2018231

Short communication

After working for ten years as the municipality veterinarian in Ostrobothnia, I took up a job at the College of Veterinary Medicine (Eläinlääketieteellinen korkeakoulu), which is now the Faculty of Veterinary Medicine at the University of Helsinki. Although I was only able to devote a fraction of my working time to science, I recall this time as both interesting and challenging. Most of my university career of 27 years was spent in teaching and administrative work. Over the years, I would find out that carrying out clinical research on small animals is difficult. During my entire career, I only got one period of research leave from my routine work. This was in 1990 when I spent a year in the USA. I could not get a research grant even for my doctoral dissertation. I wrote my synopsis during sick leave after meniscal surgery. The Academy of Finland, Tekes or Sitra all refused to grant funding for research on small animals. In those early days I was somewhat lacking in certain technical skills needed for research work. For example, I did not learn to type before I was 50 years old. Before that, I wrote everything by hand, and my wife typed out the texts. We adopted the same procedure with my doctoral dissertation.

The topics of my research were the consequence of a multitude of coincidences. Much of my research work started without any detailed plan. Often, at the start of the research work I only had a sketchy idea of who might provide funding, who would perform the research work and what the schedule would look like. Improvisation has played a very significant role in almost all my research work.

Despite this, I have successfully guided through eight doctoral dissertations and several other interesting research projects. In total, I have published almost 100 articles in international publications and written chapters in seven international textbooks.

I worked at the university for 13 years as a clinic veterinarian. The post did not include research work. In fact, research was prohibited. It was only after a vote among the teachers’ collegium that I was granted permission to do research work on the condition that it would not interfere with my other duties. During this period of time, I carried out most of my research at nights and weekends.

During the first few years I received support from Markus Sandholm, who was four years younger than me but was already a professor of pharmacology and had worked as a researcher in the United States. He was the only other person who was also interested in studying pets. He was a veritable treasure trove of ideas, and his knowledge of animal diseases and their treatment was exceptionally extensive. Markus was involved in a research project assessing how levels of pancreatic enzymes could be measured by means of agar gel diffusion, and whether the method could be used in the diagnosis of canine exocrine pancreatic insufficiency (EPI), a relatively common disease in dogs. Dogs with this disease do not secrete sufficient amounts of pancreatic enzymes into their intestines, resulting in maldigestion. These dogs eat large amounts of food but still lose weight.

At that time, there was no definitive method for diagnosing EPI. The agar gel diffusion method became my first research topic and later expanded to become the subject of my doctoral dissertation. I collected hundreds of stool samples from dogs to be analysed by Matti Järvinen in our laboratory. The results showed that there were no protease enzymes found in stool samples from dogs with EPI, whereas in healthy dogs, these enzymes were present, although not in every case. Thus, the problem was now how to differentiate healthy enzyme-secreting dogs from healthy dogs that did not secrete these enzymes. We called the latter ones “pseudo-EPI dogs”. Markus came up with the idea of giving the dogs crude soya meal, which contains antiproteases. His thinking was that the antiproteases would inactivate the proteases present in the dogs’ intestines, thus causing the pancreas to react by secreting large amounts of proteases into the intestines. In dogs with EPI, no proteases are found in stool samples even after they have been fed soya; however, they are found in both pseudo-EPI dogs and normal dogs. We developed the “crude soya test”, in which crude soya was added to dog food, after which the dogs’ stool samples were checked for proteases. The test was performed on more than one thousand dogs suspected of having EPI. Based on the results, we were able to state and based on this research it could be stated that the crude soya test is a reliable method for diagnosing EPI.

A few years after the publication of the crude soya test, the Englishmen developed the “TLI test”, which allowed the proteases to be determined from blood samples. This test is as reliable as the crude soya test, but much easier to perform and therefore now widely used. I carried on with the EPI studies in two breeds in which EPI is a common disease, namely German Shepherds and Collies. Based on information extracted from the registers of the dogs with the disease I was able to state that EPI is possibly an autosomal, recessively inherited disease. However, it could also be a multi-gene disorder, in which case developing gene tests would be almost impossible.

In 1987, Alice Skonbäck contacted me and said that her German Shepherd, Dolly, had symptoms suggestive of EPI. Dolly’s diagnosis was confirmed with the crude soya test. I told Alice that EPI is a hereditary disease and that dogs with it need treatment for the rest of their lives. Alice replied that she could not afford continuous medication. Surprisingly, she offered to give her dog to us in the hope that this would promote research into EPI. I thanked her and told her that we would have to make her donation the subject of a written agreement. Although I did not have any research ideas for Dolly at first, after thinking the matter over I came to the conclusion that we could use the dog in studies on medicines for the treatment of pancreatic disorders.

I had already been studying for some time with Professor Martti Marvola how differently sized tablets and capsules containing pancreatic enzymes are carried into the small intestine with food. For successful digestion, it is very important that the enzymes and the food are in the intestines at the same time. I decided to insert a fistula into Dolly’s small intestine in order to obtain samples of bowel contents. There were no suitable fistulas for sale, but a precision engineer promised to make one out of stainless steel. The fistula was installed and it worked well. Throughout the study, we fed the dog the same food, adding different pancreatic enzyme medicines one at a time. After feeding the dog, we sampled her bowel contents via the fistula for eight hours. The lipase, amylase and protease concentrations in the samples were determined using the agar gel diffusion method. The results showed that the medication was most effective when the enzymes were added to the food in powdered form, or when raw pancreas was added to the dog’s food. Commercially available tablets and capsules were considerably less effective.

After the study, I contacted Alice and told her that Dolly was in good health and had gained several kilograms. I suggested we would pay for Dolly’s medicines for one year if she would take the dog back home. I told Alice that if we want to find out how EPI is inherited, we should cross two dogs with the disease and then see whether the puppies get ill. If the disease’s inheritance follows the autosomal pattern, all the puppies would develop EPI. However, if the inheritance of EPI is controlled by several genes, only a few of the puppies would get sick. After a few days, Alice called me to say that she was willing to cross Dolly with a male with EPI, and she already had a promising candidate in mind. The offer sounded tempting but also frightening, because I had no funding or assistance for this kind of project. However, at the end of our discussion we decided to start the project and try to solve any problems as we went along.

I asked Maria Wiberg to participate in the Dolly project, and this marked the start of our collaboration. At that time, Maria was a fifth-year student, doing her advanced studies on the inheritance of EPI. Our collaboration lasted for a total of 15 years, during which time we published together 14 studies on EPI and Maria wrote her doctoral dissertation on EPI.

Dolly was crossed with a male dog with EPI and gave birth to five puppies. Alice was ready to take one of the puppies. She also knew two people who had previously had a dog with EPI, and two people who had had a German Shepherd. These people were potentially willing to participate in the study. After some discussion, all the people suggested by Alice promised to take a puppy. I explained to them both orally and in writing the nature of EPI and also told them that the dogs they were to take were highly likely to develop the disease. The owners were also given details about the purpose of the study and the kinds of tests that the dogs would undergo in the future. We also agreed that if the dogs were to develop EPI, their treatment would be free for the rest of their lives. The owners were not compensated for the upkeep costs of the dogs. Before giving the puppies to their new owners, Maria and I performed a laparotomy on each puppy, i.e. they were anaesthetised, their abdominal cavities were opened and a pancreas sample was obtained by ligation. During the next ten years, we performed this procedure 26 times. We did most of the operations on weekends, as the operating rooms were quieter then, and the dog owners had more time to bring their dogs in for surgery. The procedures were performed without any complications. Blood and stool samples were also taken from the dogs every few months. I stayed in close contact with the owners, and we gathered together for meetings quite often. During the entire study, which went on for 12 years, none of the owners ever asked for compensation for the dogs’ transportation or other costs.

Based on our studies we were able to conclude that EPI is not a congenital disease. All the dogs had a normal pancreas when the laparotomies were first performed. One dog’s pancreas began atrophying around the age of one, and after a few months, the dog showed the typical symptoms of EPI. After this, the dog spent the rest of its life on pancreatic enzyme medication, though its quality of life was fairly normal. Another dog’s pancreatic atrophy began at the age of six. However, the atrophy halted when its pancreas was down to about one third of its original size. The dog had none of the clinical symptoms of the disease during its whole life, but tissue samples taken from its pancreas, as well as blood and stool samples, revealed partial pancreatic atrophy. The other dogs’ pancreases remained completely normal. The samples taken during the study were cut into sections for histological and immunohistochemical tests. This meant that, for the first time, changes in the pancreas could be monitored as the atrophy progressed. These study results were an essential part of Maria’s dissertation, in which she showed that EPI is an autoimmune disease. The point of the study was to determine the inheritance pattern of EPI in German Shepherds. Because only two of the dogs got ill, EPI could not be a single-gene disease. Instead, it had to be classified as a polygenic disease, requiring mutations in more than one gene and potentially also contributions from some environmental factors. The inheritance of EPI was also being intensively studied in the US during our Dolly project. Companies and researchers experienced in genetic research published three articles in which they stated that they were unable to find any specific gene that could cause EPI. Thus, they came to the same conclusion as that shown by our field test.

After giving birth, Dolly was healthy for six months, but suddenly her abdomen swelled up and her condition deteriorated. I got Dolly to the clinic, where she was immediately made surgery. We saw that the entire small intestine had twisted 180 degrees. After the surgery, Dolly only lived for a few hours. Volvulus of the small intestine was not unfamiliar to us. During the previous five years, we had had eight similar cases. All had been German Shepherds with EPI, and the condition proved fatal in all of them. Volvulus of the small intestine has not been reported anywhere else in the world, and textbooks mention that this condition is only found in Finland.

Together with Maria, we also performed several studies to determine the most suitable and beneficial diet for dogs with EPI. This was of particular interest to dog food manufacturers, who had launched several special diets for dogs with EPI. However, our studies showed that none of the special foods were better than food meant for healthy dogs. We also found that there is great individual variation in dogs’ reactions to foods, which means that the most suitable food must be determined by trial and error.

The first of my doctoral students to defend her dissertation was Irmeli Happonen. Her topic was to assess whether Helicobacter species were responsible for chronic vomiting symptoms in dogs. In human studies, research showing that H. pylori causes gastric and duodenal ulcers had attracted much attention. Several articles had also presented findings of Helicobacter species in dogs, but no detailed studies of their significance in dogs had been performed. Irmeli’s studies showed that Helicobacter species occurred in practically all dogs, whether sick or healthy. There were several different species of the bacterium, but they were not the same as those found in humans. Marja-Liisa Hänninen identified the Helicobacter species and also isolated a new species about which nothing had previously been published.

The field tests performed by Irmeli showed that if the vomiting dogs were treated with medicines indicated for Helicobacter eradication, these bacteria were no longer seen immediately after the treatment. However, the lesions in the gastric mucosa remained unchanged, as did almost all the clinical symptoms. A few months after the medication had been discontinued, Helicobacter species were again found in the gastric mucosa. It was thus concluded that if Helicobacter species are found in a vomiting dog, it is not worthwhile to eradicate them.

In the 1980’s, a molecular genetic method was developed for bacteria identification. Using this method, it was found that the intestinal microbiota contains an enormous number of different bacteria that could not be seen using culture methods. The microbiota is believed to influence a person’s health and to cause intestinal disorders. This method also aroused interest in the treatment of pets, and Jan Suchodolski, working at Texas A&M University, became the most famous researcher of this method. Researchers in Finland were also interested, but we had no plans about how to start canine studies. I came across an article by Maria Wilsson-Rahmberg describing how the pharmaceutical company Astra performs permanent small intestine fistula operations in dogs. The operation is rather complicated. A segment of the small intestine, about 15 cm, is separated while maintaining its blood circulation. The segment is then invaginated, one end is attached to the small intestine and the other is taken through the abdominal wall and attached to the skin. This fistula does not require any metallic parts, and it can be used to drain bowel contents or to inject substances into the intestines via a tube. I phoned Maria in Sweden and invited her to Finland to teach how to perform fistula operations. Maria suspected that her employer would not allow this. However, after a while she notified me that she was in fact able to come and teach us some weekend. I asked Jaana Harmoinen and Minna Rinkinen to assist in the operations. Maria performed successful fistula operations on two test dogs. We monitored the dogs for a few weeks and found that the fistulas were functioning perfectly and the dogs did not react to them at all. Over the following years, Jaana and Minna successfully performed fistula operations on at least twenty dogs. The dogs lived with their fistulas for several years without any problems. I have not found any mention in the literature of the use of such fistulas in test dogs. We used the fistulated dogs in studies to find out how the antibiotic tylosin and changes in feeding influenced the microbiota of the small intestine. We fasted the dogs for five days and took samples of their bowel contents before, during and after the fast. We sent the bowel content samples to Texas for Jan to analyse.

In 1998, Lauri Jalkanen, representing a small, recently founded company, came to see me. He said they had a fantastic business idea but did not know how to implement it. At first, I did not understand what kind of idea this was and why he had come to see specifically me. Finally it became clear that the company, called Ipsat, was trying to develop a new form of treatment to decrease hospital-acquired infections caused by antibiotics. Some hospital-acquired infections develop because antibiotics change the intestinal microbiota so that it is no longer able to resist the growth of harmful bacteria. Antibiotic treatments are also responsible for the development of antibiotic-resistant bacterial strains in the intestinal flora. During intravenous antibiotic treatment, some of the antibiotics always end up in the bowel contents, causing changes in the intestinal flora. Hospital-acquired infections could be prevented by stopping antibiotics from entering the gut during parenteral antibiotic treatment. The idea developed by Ipsat was to administer oral beta-lactamase enzyme concomitantly with a parenteral antibiotic injection to break down antibiotics entering the intestines, thus preventing changes in the intestinal microbiota. Lauri Jalkanen asked me to suggest ways to study the use of their idea in dogs. I told him about our fistula dogs and suggested that it could be tested in them. After this meeting, Ipsat’s CEO Kai Lindevall invited me for talks, which were to mark the beginning of collaboration lasting some ten years. I asked Jaana Harmoinen to join the project, and some years later it became the subject of her doctoral dissertation. The talks held with Ipsat were very frequent and full of challenges in spite of the collaboration working smoothly. We formed a plan to give the dogs intravenous ampicillin antibiotics shortly after oral beta-lactamase. We would sample bowel contents through the fistula for a few hours. The first thing to test was the form and the dose of beta-lactamase. We had also to assess when and how frequently to sample and when to feed the dogs. The results of the first series of tests showed that a certain beta-lactamase concentration could completely prevent ampicillin from entering the intestines. We were also able to show that beta-lactamase did not decrease circulatory ampicillin concentrations. No adverse effects of the enzyme were seen. For the second series of tests, we acquired 18 dogs and divided them into three groups. The first group received both the antibiotic and the enzyme, the second group was given only the antibiotic, and the dogs in the third group received neither. The test went on for two weeks, and the dogs were fed and given the medicines four times daily. We found that the dogs on antibiotics only experienced changes in their intestinal flora together with increases in ampicillin-resistant E. coli strains as well as strains with TEM genes, which contribute to resistance. The dogs in the other groups did not experience any changes in their microbiota. The dogs in our study showed that ampicillin-induced changes in the intestinal flora can be prevented with beta-lactamase. Ipsat continued with the research and showed that beta-lactamase also acts similarly in humans. The company also developed a lactamase enzyme that prevents changes caused by many other antibiotics besides ampicillin. The lactamase project was expensive, and although Tekes and Sitra provided over ten million euros of funding, there was not enough money to start clinical studies in humans. Ipsat went bankrupt and sold the lactamase patent to a Swiss company for €20,000. This company sold it again to an American company, Synthetic Biologics, which at the moment (in 2015) has a market value of €145 million.

Tylosin belongs to the group of macrolide antibiotics. Millions of kilograms of tylosin have been used annually to promote the growth of pigs and cattle. The use of tylosin for this purpose was banned in Europe around 20 years ago. In Finland, it has been possible to purchase tylosin in tablet form for canine medication, although it has no official indications or dosing instructions. No studies on the efficacy of tylosin to treat canine diarrhoea had been published in the literature. Many Finnish dog owners were, however, convinced that tylosin is an efficient anti-diarrhoea agent for dogs. At the turn of the century, I began my first study on the efficacy of tylosin in the treatment of canine diarrhoea symptoms. I was assisted by two very hard-working students in the advanced stage of their studies, and the three of us performed the field study part, which lasted a few months. Fourteen dog owners, whose dogs had had diarrhoea problems for at least one year, participated in the study. I delivered freezers to the owners’ homes in my car, and the students took many kinds of samples at specified intervals. The dog owners’ patience was admirable, considering that during the study the dogs would quite often defecate in the owner’s car or on the living room carpet. The study results showed that tylosin ends the diarrhoea symptoms within no more than three days, and the symptoms do not return as long as the medication is continued. However, in very many cases the symptoms return within one month of stopping the medication. Corticosteroid medication did not stop the diarrhoea symptoms within three days, and probiotics did not help prevent the recurrence of diarrhoea symptoms. We started calling the dogs in which tylosin did stop the diarrhoea symptoms as tylosin-responsive dogs (TRD). During the study, several different samples were taken from the dogs, but none of them explained why these dogs had diarrhoea symptoms.

The next tylosin study began unplanned. A dog called Paavo, who had continuous diarrhoea, had been with us for tests for over a year. Tests had failed to identify the cause of the diarrhoea, and the dog’s general health was otherwise normal. Within a short period, six dogs in Paavo’s section also got diarrhoea, and the symptoms persisted for over a month. At this point we started giving tylosin to all the dogs with diarrhoea. The symptoms lessened, but the stools did not become completely normal. We then stopped the medication and the diarrhoea symptoms worsened. The next step was to give the dogs three different antibiotics and corticosteroids each in turn, but these had no influence on the symptoms. After this, we changed the dogs’ diets, which lessened but did not end the diarrhoea symptoms. Then we gave the dogs tylosin again for a week, and the diarrhoea symptoms stopped. The stools were monitored for three months, during which they remained normal in all dogs. What the study showed was that tylosin and diet have a synergistic effect. Pirkko Nokkala-Wahrman, an animal attendant, had a very large role in the performance of this study. She used a pictorial assessment table to estimate the consistency of every dog’s every bowel movement throughout the study.

After this, I decided it was necessary to perform a double-blind study to show the efficacy of tylosin. No reports of double-blind studies in canine intestinal diseases had at that time been published in the literature. After lengthy discussions, the Finnish pharmaceuticals company Vetcare promised to start funding this study. It was a big decision for a smallish company. We agreed that Vetcare would pay a researcher’s salary for three years, as well as a lot of other study-related costs. Susanne Kilpinen started as a doctoral student at this point, and she defended her doctoral dissertation on tylosin in the treatment of chronic canine diarrhoea seven years later. In order to achieve baseline characteristics as similar as possible for both the dogs on medication and the dogs on placebo in our double-blind study, we decided to only include dogs that had previously been treated successfully with tylosin for diarrhoea symptoms. To qualify for the registration phase, the dogs either had to be currently on tylosin or had had tylosin medication stopped within the last month. Almost fifty dog owners enrolled their dogs for the study. These dogs were taken off tylosin medication and monitored for any reappearance of diarrhoea symptoms. If the symptoms reappeared, the dogs were given either tylosin or placebo for one week. As a result, the symptoms disappeared in 79% of the dogs given tylosin vs. 28% of those given placebo. Dogs in which tylosin caused the diarrhoea symptoms to disappear then participated in a follow-up study to determine the recommended dose for the treatment of diarrhoea symptoms. It was found that dogs need considerably smaller amounts of tylosin than those recommended in the literature. During these two studies, several different samples were taken from the dogs to try to determine the basis of the efficacy of tylosin in the treatment of diarrhoea symptoms. Results from stool samples showed that tylosin significantly increased the levels of lactic acid bacteria and enterococci. It is possible that these bacteria have probiotic characteristics that have a positive effect in decreasing intestinal inflammation and diarrhoea symptoms.

My doctoral students Mairi Speeti, Minna Rinkinen and Rafael Frias conducted their dissertation work very independently. My role was simply that of an advisor. Their research was carried out in laboratories to a great extent and did not involve any clinical field studies.

The greatest source of joy in my studies has been the very competent doctoral students that I have been lucky enough to have. Even though study protocols tended to be very sketchy at the start of projects, the students always believed progress would be made. The many failures and changes to study protocols never discouraged them. Common to all my doctoral students has been their devotion to their research work and the fact that they contributed a lot of their own ideas and suggestions for improvements. We all worked together extremely well and over the years we became close friends.

Another great source of help in my research work has been my advanced studies students. Several students contributed so significantly that they were cited among the authors of articles.

I would also like to thank the animal attendants and laboratory animal attendants who assisted me in sampling and carrying out other practical work.

Validity of Lithuanian Version of the Child Perceptions Questionnaire Among Adolescents up to the Ages of 18

DOI: 10.31038/JCRM.2018113

Abstract

Background: The Child Perceptions Questionnaire (CPQ) is the most commonly used measure of Oral Health-Related Quality of Life (OHRQoL) and its validity and reliability have been tested among children/adolescents aged 11 to 14 years in many languages and populations. This innovative study was aimed to validate the CPQ among adolescents aged 15 to 18 in the population survey of orthodontic anomalies in Lithuania.

Methods: Representative samples of adolescents aged 11–14 years (N=307), 15–16 years (N=721) and 17–18 years (N=563) were selected from public schools of Lithuania. The CPQ including four domains, namely oral symptoms (OS), functional limitations (FL), emotional well-being (EWB), and social well-being (SWB), was used to measure OHRQoL. A self-reported malocclusion and orthodontic examinations were used to assess malocclusion.

Results: The distributions of individual items and sum scores of the CPQ and its domains did not differ significantly between 11–14, 15–16 and 17–18 age groups of adolescents. Across all age groups, Cronbach’s alpha for the total CPQ was approximately equal to 0.90 indicating good internal consistency reliability; the total CPQ and all domains significantly correlated with oral health, oral well-being and global life satisfaction. Discriminant validity analysis revealed that adolescents with severe malocclusion suffered a greater impact on their emotional and social well-being than those without malocclusion, however, this relationship was more engaging in group of adolescents aged 15–18 than in 11–14-year-olds. A moderate agreement between child and parental reports was found for OS and FL domains.

Conclusions: The Lithuanian version of the CPQ for measuring OHRQoL among adolescents aged 15 to 18 years seems to be as valid and reliable as for adolescents aged 11 to 14 years.

Keywords

Oral health-related quality of life, Child Perceptions Questionnaire, validity, reliability, orthodontics, adolescents, Lithuania

Introduction

Oral health-related quality of life (OHRQoL) is a holistic concept which determines the subjective functional and psycho-social impacts of oral disease on overall well-being.[1–3] Measuring OHRQoL provides essential information when making clinical decisions for individuals and helping public health actions and policies to uncover the needs of the society in prevention and treatment of oral disorders.[3–5] Hence, OHRQoL has been widely studied over the past two decades and many tools have been developed, but mostly for adults.[6, 7]

Recently, increasing attention has been also paid to OHRQoL in children and adolescents. The OHRQoL instruments designed to assess the impact of oral conditions on the daily lives of children and adolescents have been developed ranging from measurement of patient-reported oral functional and psychosocial problems to subjective well-being relating to oral health. Systematic reviews [8, 9] identified at least three validated instruments to measure OHRQoL in children and adolescents: Child Oral Impact of Daily Performances index,[10] Child Oral Health Impact Profile,[11] and Child Perceptions Questionnaire.[12]

The most commonly used OHRQoL questionnaire is the Child Perceptions Questionnaire (CPQ). It was developed by Jokovic et al. [12] as the CPQ11–14 for children aged from 11 to 14 and was originally validated in children with caries, malocclusion and craniofacial anomalies.[12] In terms of cognitive development, age specific versions of this tool have been produced.[13] The CPQ does also have an analogous Parental CPQ which can be used as a proxy to Child CPQ.[14] The original item pool of the CPQ consists of 37 items, but the authors have also determined the psychometric properties of its shortened forms.[15] All variations of the CPQ evaluate the frequency of oral and orofacial impacts on children OHRQoL at symptomatic, functional, emotional and social levels whereas other questionnaires focus on severity of oral impacts. To date, the CPQ has been translated, validated and adapted to suit a number of languages and socio-cultural contexts demonstrating its applicability and perfect psychometric properties on numerous clinical and epidemiological occasions.[16–22]

OHRQoL research among children and adolescent in Lithuania is still nascent and no measures have been validated to date. Given the positive CPQ properties and its high applicability for both clinical assessments and large-scale population studies we have chosen this instrument for measure of OHRQoL in our research. It was also considered that the original long form (37 items) of this instrument is more sensitive to changes in oral conditions rather than its short forms,[15] hence, the original questionnaire was taken in focus. As it is well known that every time as the measurement scale is used in a new context or with a different population group, it is necessary to test its psychometric properties.[23] Therefore, our recent study, like most other similar studies, has been focused on adaptation and validation of the CPQ11–14 in Lithuanian adolescents aged 11–14 years. A detailed examination of psychometric characteristics including factorial analysis of the Lithuanian version of CPQ with a modified item of the oral pain showed that the instrument is valid to be used in further studies for measuring OHRQoL among 11–14-year-old adolescents in Lithuania (Kavaliauskienė A, Šidlauskas A, Zaborskis A., 2018. Manuscript under review).

This study is a part of a large research project aimed to examine extend of orthodontic anomalies and OHRQoL among children and adolescents aged from 11 to 18 years in Lithuania. Hence, there was a problem to choose an appropriate instrument to measure OHRQoL among adolescents up to the ages of 18. We hypothesized that the association between severity of oral disorders and OHRQoL in older adolescent samples (e.g. in 15–16- or 17–18-year-olds) is possibly more evident than in sample of adolescent aged 11–14 years. Therefore, the CPQ instrument to measure OHRQoL among older adolescents could be as much valid as it was valid for adolescents aged 11–14 years. Only a few relevant studies were conducted among adolescents over the age of 14 but none in population older than 16 years of age [24–27].

As a consequence, the aim of the present study was to validate the CPQ among adolescents aged from 15 to 18 in the population survey of orthodontic anomalies in Lithuania.

Methods and Material

The study followed a cross-sectional design and was a part of a larger research project aimed to examine OHRQoL among children and adolescents in Lithuania. It was conformed to the principles outlined in the Declaration of Helsinki. Ethical approval for the study was granted by the Kaunas Regional Biomedical Research Ethics Committee (reference number BE-2–27) and was in line with local practice for school survey distribution. Written informed consent for child’s participation in the study was sought from both parents prior to his/her participation in the research.

Target population was adolescents aged 11–18 years. The sample being studied was made up of students from 26 randomly selected public schools using random cluster (school, class) sampling and included approximately 2000 students. School authorities were contacted by researchers and informed about all aspects of the study. Parents were then asked to provide permission for their child to participate in the study.

Data was collected using both questionnaires and dental examinations. The self-completed questionnaires for students were administrated in school classrooms before dental examination by the classroom teaching staff to ensure a familiar and consistent environment. Confidentiality and anonymity of respondents was ensured. A total of 1591 students (80% of initial sample and 94% of those who had parents’ permission) presented correctly completed questionnaires. Those parents who gave consents were also asked to complete a self-report questionnaire about child’s oral health and well-being. The number of correctly completed parents’ questionnaires was 1365 (67% of invited parents).

The orthodontic examination was a part of the dental examination. It was carried out in randomly selected 20 of 26 schools. Students’ examination was performed according to the methodology of oral status evaluation recommended by the WHO under standardized conditions in the school’s medical offices using portable equipment for dental examination [28]. The orthodontic examination of all students was undertaken by one orthodontist (A.K.) who was trained and tested in reliability of accessing orthodontic status (U.K. Cardiff University School of Dentistry, 2012) and her assistant.

In the end, 911 students participated both in the questionnaire and dental surveys, and 1365 parents provided their completed questionnaires to students who participated in the questionnaire survey. The size of studied sample was adequate to the minimum calculated as necessary (N=969). Figure 1 presents flow diagram of data collection and also illustrates the sample structure by age of adolescents.

JCRM2018-105-ZaborskisItaly_F1

Figure 1. Flow-diagram of the data collection process and distribution of participants in three age groups.

Before the main study, a pilot test was carried out with a sample (N=48) of students in one school. It confirmed the feasibility of the methodology with only minor modification of questionnaire wording and confirmed the organization of data collection procedures.

The originally created self-reported questionnaires for students and parents consisted of items assessing oral health and OHRQoL as well as demographic and social aspects of adolescent health.

The Lithuanian version of the of CPQ11–14, cross-culturally adapted and validated for Lithuanian adolescents aged 11–14 years (Kavaliauskienė A, Šidlauskas A, Zaborskis A., 2018. Manuscript under review), was employed to evaluate the impact of oral conditions on the quality of life of adolescents of all ages. This questionnaire, as originally proposed by Jokovic et al.,[12] was a 37-item scale consisting of four health domains (subscales), namely oral symptoms (OS, 6 items), functional limitations (FL, 9 items), emotional well-being (EWB, 9 items), and social well-being (SWB, 13 items). The items of the OS and FL domains were also included into the parents’ questionnaire in order to test their agreement with their child’s report on his oral health troubles (the domains EWB and SWB were not included into the parents’ questionnaire as parents may not know so well the feelings of their children). The items are scored on a 5-point Likert scale ranging from 0 (“never”) to 4 (“every day or almost every day”). In the analysis, the scores for each item were added together to obtain a sum scores of each sub-scale as well as the total CPQ scale. Then, the sum scores were standardized to a percentage score scale of 0 – 100% by dividing the sum score by the maximum score and multiplying by 100. Note that higher sum/percentage scores refer to worse OHRQoL.

The students were also asked to rate their oral health and the extent to which it affected their well-being. For each of these dimensions five sub-items were worded in the following way: “How would you describe health status of the following oral parts: – teeth; – lips; – gum; – oral mucosa; – jaws or joints?” and “Over the last three months, how much your overall life was affected by the conditions of the following oral parts: – teeth; – lips; – gum; – oral mucosa; – jaws or joints?” The responses were scored in the following way: with regard to an oral health rating: 0=excellent, 1=very good, 2=good, 3=fair and 4=poor; with regard to well-being: 0=not at all, 1=very little, 2=somewhat, 3=a lot and 4=very much. The final score computed the maximal score on all the sub-items of each dimension.

The global life satisfaction, or well-being, of adolescents was rated using the measurement technique from the Health Behaviour in School-aged Children (HBSC) study [28]. Children were asked to take a look at the drawn ladder, with steps numbered from zero (“0”) at the bottom to ten (“10”) at the top, with the instruction to suppose the top of the ladder represented the best possible life, and the bottom of the ladder represented the worst possible life. Then they were asked to indicate the step of the ladder at which they would place their lives at present. Thus, the response was scored from 0 to 10.

In the questionnaires, the respondents were asked to rate their malocclusion experience by answering to the question, whether they had ever noticed that their teeth were irregularly grew/situated or they had malocclusion. The answer categories were: 1-yes, I noticed just myself; 2-yes, this was confirmed by dentist; 3- no, I don’t have such disorders. In analyses, the first two categories were combined, thus, two sub-groups of respondents , correspondingly ‘not healthy’ and ‘healthy’, were selected.

During the orthodontic examination, the Index of Orthodontic Treatment Need (IOTN) and the Index of Complexity, Outcome and Need (ICON) were recorded according to the methodology by Richmond (2008).[30] The IOTN measure categorizes the severity of malocclusion based on the relative effect of the various deviant occlusal traits on the longevity of the dentition. The five grades were outlined. Grade 1 recorded small deviations from normal and was categorized as ‘no need of orthodontic treatment’. The deviant occlusal anomalies become more severe in Grades 2, 3 and 4, while grade 5 represented the most severe malocclusion (e.g., impacted teeth, large overjet greater than 9 mm, defects of cleft lip and palate) and was categorized as ‘very great need of orthodontic treatment’. Grade 4 and 5 were regarded as clinical need for treatment. The another indicator of malocclusion, ICON, is based on five components, which are incorporated into calculation of the ICON value by a following regression equation: ICON = (Aesthetic assessment ×7) + (Upper arch crowding/Upper spacing × 5) + (Crossbite × 5) + (Incisor open bite/Incisor overbite ×4) + (Bucal segment antero-posterior ×3). An ICON value of > 43 corresponds to severe malocclusion with a fundamental treatment need [30].

The statistical analysis was performed using the Complex Samples module of the SPSS statistical package (version 21; IBM SPSS Inc., Chicago, IL, 2012) which adjust for the complex cluster-stratified sampling method (schools, classes).[31] All reported p values were from two-sided statistical tests and p values ≤ 0.05 were considered statistically significant.

Missing data of the CPQ items was replaced with the personal mean if a health domain had not more than half blank items, otherwise the record was excluded from analysis. The distributions of the sum score of the CPQ and its domains were examined and found not to be normally distributed. Therefore, median and Interquartile Range (IQR) were used to describe these distributions and to test the null hypothesis that there is no difference in the CPQ scores between the malocclusion and non-malocclusion groups. Due to the same reasons, binary associations between variables were evaluated with non-parametric Spearman correlation coefficient.

A set of test was used for examination of psychometric properties of the CPQ.[32–34] The Cronbach’s alpha was used as measure of internal consistency reliability of the total instrument and its domains. Their values ≥ 0.70 were considered acceptable.[33, 34] Furthermore, other tests of internal reliability (inter-item and item-total correlations) were also investigated. Construct validity of the instrument was tested using Spearman correlation coefficient to assess the association between the scores of total scale as well as its domains and the respondents’ rating of their oral health, oral health related well-being, and global life satisfaction. Discriminant validity was tested by comparing the medians of scores between groups defined by malocclusion traits.

Test-retest reliability test of the instrument was not employed. Instead of this, we assessed agreement between children’s and their parents’ answers to the same questions of the OS and FL domains. The association between child and parental sum scores was assessed by Spearman correlation coefficient, and agreement between two groups of raters was evaluated by the Intra-class Correlation Coefficient (ICC) using two way mixed consistency method and the quadratic weighted kappa.[34] The quadratic weighted kappa was used due to high range of sum scores.

Results

In this study, the sample consisted of 1591 adolescents recruited in the questionnaire survey, among which 911 adolescents were examined by an orthodontist. Participants were divided into three groups by age: 11–14 years (N=307), 15–16 years (N=721) and 17–18 years (N=563) (see Figure 1). In this paper, we looked into the validity of the CPQ scale among adolescents 15–16- and 17–18-year-old, so these groups were more numerous than the reference group of 11–14-year-olds. A total of 927 (58.3%) individuals in the sample were female. The respondents represented both the urban area (68.5%) and rural area (31.5%).

The response rate to the items of the CPQ varied by domains and age groups from 97.1% to 100% with the highest rate (2.9%) of blanks in responses to the items of the SWB domain among 11–14-year-old adolescents. All unanswered questions were restored according to the accepted rules of methods.

The impacts, that is the items scored from 1 (‘1 or 2 times’) to 4 (‘every day or almost every day’), were reported most frequently in the OS domain (“Pain in teeth, lips, jaws or mouth” – 68.8%; “Food stuck in or between teeth” – 62.0%; “Bleeding gums” – 53.6%; “Bad breath” – 45.2%) and in the EWB domain (“Worried that he/she is not as good looking as others” – 38.3%; “Worried that he/she is not as healthy as others” – 28.8%). Comparing three age groups, there were insignificant differences in prevalence of answers to separate items.

Descriptive statistics of the total CPQ and its domains are presented in Table 1. Sum scores were found to be highly skewed and not to be normally distributed in all the health domains with a very noticeable floor effect, especially in the SWB domain. Out of the theoretical range of 0–100% of relative scores, their mean (except OS domain) and median did not exceed 20%. The distributions of individual items and sum scores of the CPQ and its domains did not differ significantly between adolescents of different age groups. In all age groups, the female adolescents than the male tended to report higher scores of the CPQ (poorer OHRQoL). The significant gender difference was observed for the EWB domain (in all age groups) and for the FL domain (in 17–18-year-olds) (data not presented).

Table 1. Summary statistics of the Child Perceptions Questionnaire and its domains, by age groups

Age group

CPQ

Domain

Relative scores

p

Mean

(95% CI)

Skewness

Median

(IQR)

11–14

CPQ

9.7

(8.6–10.9)

1.78

6.3

(2.7–13.5)

0.509

(N=307)

Domain OS

20.9

(19.0–22.7)

1.23

16.7

(11.1–27.8)

0.206

Domain FL

7.7

(6.4–9.1)

2.10

3.7

(0–11.1)

0.895

Domain EWB

12.6

(10.4–14.7)

2.66

7.4

(0–18.5)

0.129

Domain SWB

4.0

(2.9–5.1)

4.54

0

(0–2.6)

0.330

15–16

CPQ

9.1

(8.5–9.8)

1.86

6.3

(2.7–12.6)

(N=721)

Domain OS

21.6

(20.4–22.8)

1.02

16.7

(11.1–33.3)

Domain FL

7.1

(6.3–7.9)

2.32

3.7

(0–11.1)

Domain EWB

11.2

(9.9–12.5)

2.52

3.7

(0–14.8)

Domain SWB

3.3

(2.7–3.9)

4.74

0

(0–2.6)

17–18

CPQ

9.3

(8.5–10.1)

2.04

6.3

(2.7–12.6)

(N=563)

Domain OS

23.1

(21.7–24.6)

0.81

22.2

(11.1–33.3)

Domain FL

6.9

(5.8–7.6)

2.64

3.7

(0–7.4)

Domain EWB

11.9

(10.4–13.4)

2.18

3.7

(0–14.8)

Domain SWB

2.9

(2.3–3.5)

4.21

0

(0–2.56)

CPQ: Child Perceptions Questionnaire, OS: Oral Symptoms, FL: Functional Limitations, EWB: Emotional Well-Being, SWB: Social Well-Being, CI: Confidence Interval, IQR: Range from 1th to 3rd quartile, p: test to compare medians across age groups.

Assessments of internal consistency reliability of the CPQ and individual domains are displayed in Table 2. Cronbach’s alpha for the total CPQ was approximately equal to 0.90 in all three age groups indicating good internal consistency reliability. Despite the adolescent age, the lowest values of Cronbach’s alpha were observed in the OS and FL domains being acceptable value of internal consistency reliability. For the domains EWB and SWB, the coefficient ranged from 0.82 to 0.88, indicating good internal consistency reliability in all three age groups. There was a large range of inter-item correlation and inter-total correlation in all domains, but no noticeable difference in these figures was seen comparing age groups of respondents.

Table 2. Internal consistency of the Child Perceptions Questionnaire and its domains, by age groups

Age group

CPQ/Domain

IIR range

ITR range

Cronbach’s alpha

11–14

CPQ

–0.04–0.83

0.17–0.59

0.90

(N=307)

Domain OS

0.01–0.50

0.22–0.55

0.66

Domain FL

0.05–0.56

0.30–0.47

0.72

Domain EWB

0.01–0.76

0.18–0.67

0.82

Domain SWB

–0.01–0.83

0.34–0.63

0.87

15–16

CPQ

–0.05–0.78

0.14–0.70

0.90

(N=721)

Domain OS

0.16–0.73

0.32–0.69

0.73

Domain FL

0.00–0.57

0.12–0.56

0.71

Domain EWB

0.17–0.73

0.40–0.80

0.88

Domain SWB

0.02–0.78

0.29–0.71

0.86

17–18

CPQ

0.01–0.76

0.20–0.63

0.91

(N=563)

Domain OS

0.18–0.74

0.28–0.70

0.71

Domain FL

0.02–0.51

0.22–0.54

0.71

Domain EWB

0.05–0.72

0.17–0.78

0.85

Domain SWB

0.07–0.76

0.41–0.67

0.86

CPQ: Child Perceptions Questionnaire, OS: Oral Symptoms, FL: Functional Limitations, EWB: Emotional Well-Being, SWB: Social Well-Being, IIR: Inter-Item Correlation, ITR: Item-Total Correlation.

Table 3 displays the correlation between the CPQ sum scores and overall ratings of oral health and well-being, as well as with global life satisfaction indicating construct validity of the instrument. Across all age groups, total CPQ and all domains were found to be significantly (p<0.01) and positively correlated with oral health and oral well-being. The correlations between the global life satisfaction and the domains were significant too (a negative correlation value indicates that higher life satisfaction is related to lower rating of oral problems).

Table 3. Spearman correlation of the Child Perceptions Questionnaire and its domains with rating of oral health, oral well-being and global life satisfaction, by age groups

Age group

CPQ/Domain

Oral

health

Oral

well-being

Global

life satisfaction

11–14

CPQ

0.36**

0.49**

–0.33**

(N=307)

Domain OS

0.33**

0.48**

–0.26**

Domain FL

0.24**

0.36**

–0.17**

Domain EWB

0.31**

0.38**

–0.32**

Domain SWB

0.18**

0.28**

–0.17**

15–16

CPQ

0.46**

0.52**

–0.33**

(N=721)

Domain OS

0.36**

0.49**

–0.23**

Domain FL

0.33**

0.41**

–0.21**

Domain EWB

0.37**

0.39**

–0.29**

Domain SWB

0.26**

0.29**

–0.23**

17–18

CPQ

0.49**

0.58**

–0.27**

(N=563)

Domain OS

0.44**

0.58**

–0.22**

Domain FL

0.28**

0.47**

–0.15**

Domain EWB

0.42**

0.42**

–0.23**

Domain SWB

0.28**

0.34**

–0.17**

CPQ: Child Perceptions Questionnaire, OS: Oral Symptoms, FL: Functional Limitations, EWB: Emotional Well-Being, SWB: Social Well-Being, ** p < 0.01.

Discriminant validity of the instrument was tested assessing CPQ scores in regard to the orthodontic treatment need (Table 4). Malocclusion traits were recorded in the orthodontic examination and were self-reported in the questionnaire survey. According to the ICON>43 criterion, the need for orthodontic treatment was established in 31.6%, 28.0% and 26.1% (p>0.05) of adolescents aged 11–14, 15–16 and 17–18 years respectively, and, according to the IOTN>3 criterion, the need for orthodontic treatment was established in 29.2%, 33.0% and 36.6% (p=0.049) of adolescents by corresponding age groups. Subjectively orthodontic anomalies (but not necessarily to be treated) were reported by 55.6%, 56.8% and 57.7% (p>0.05) of adolescents in corresponding age groups. Across age groups, there was seen a variation in the gradient of overall CPQ and domain sum scores by malocclusion traits. Adolescents with severe malocclusion (ICON>43 or IOTN>3) suffered a greater impact on their emotional and social well-being than those without malocclusion, however, this relationship was more engaging in groups of adolescents aged 15–16 years and 17–18 years than in 11–14-year-olds. Adolescents who subjectively reported malocclusion in comparison with their ‘healthy’ counterparts indicated significantly greater scores for all domains in the 15–16 age group and for the OS, EWB and SWB domains in the 17–18 age group, while only for the single EWB domain in 11–14 age group.

Table 4. Discriminant validity of the Child Perceptions Questionnaire and its domains for clinically recorded and self-reported malocclusion, by age groups

Age group

Dental health

malocclusion

N

Median (IQR) of relative scores

CPQ

Domain OS

Domain FL

Domain EWB

Domain SWB

11–14

Records from orthodontic examination:

ICON≤43

121

5.4 (2.7–12.4)

16.7 (11.1–27.8)

3.7 (0–7.4)

3.7 (0–16.7)

0 (0–2.6)

ICON>43

56

6.3 (3.2–33.3)

16.7 (11.1–27.8)

3.7 (0–7.4)

7.4 (0–18.5)

0 (0–2.6)

p

0.245

0.872

0.946

0.307

0.753

IOTN≤3

138

5.4 (2.7–11.7)

16.7 (11.1–27.8)

0 (0–9.3)

3.7 (0–14.8)

0 (0–2.6)

IOTN>4

57

6.3 (2.7–11.9)

16.7 (11.1–27.8)

3.7 (0–7.4)

7.4 (0–18.5)

0 (0–2.6)

p

0.738

0.375

0.461

0.046

0.931

Self-reported malocclusion:

‘healthy’

136

5.4 (2.7–9.9)

16.7 (5.6–27.8)

3.7 (0–10.2)

3.7 (0–11.1)

0 (0–2.6)

‘not healthy’

170

8.1 (5.6–27.8)

22.2 (11.1–33.3)

3.7 (0–14.8)

9.3 (0–22.2)

0 (0–5.1)

p

<0.001

0.009

0.119

<0.001

0.076

15–16

Records from orthodontic examination:

ICON≤43

293

5.4 (2.7–12.6)

16.7 (11.1–27.8)

3.7 (0–11.1)

3.7 (0–14.8)

0 (0–2.6)

ICON>43

114

8.1 (3.6–16.2)

22.2 (11.1–33.3)

3.7 (0–14.8)

7.4 (0–19.4)

2.6 (0–5.1)

p

0.011

0.240

0.290

0.082

0.013

IOTN≤3

280

5.4 (2.7–13.5)

16.7 (11.1–27.8)

3.7 (0–11.1)

3.7 (0–14.8)

0 (0–2.6)

IOTN>4

138

6.3 (2.7–13.7)

19.4 (11.1–33.3)

3.7 (0–11.1)

7.4 (3.7–34.3)

2.6 (0–5.1)

p

0.463

0.250

0.720

0.038

0.039

Self-reported malocclusion:

‘healthy’

311

4.5 (1.8–9.0)

16.7 (5.6–27.8)

3.7 (0–7.4)

0 (0–7.4)

0 (0–2.6)

‘not healthy’

409

7.2 (3.6–15.3)

22.2 (11.1–33.3)

3.7 (0–11.1)

7.4 (0–18.5)

2.6 (0–5.1)

p

< 0.001

< 0.001

0.048

< 0.001

0.001

17–18

Records from orthodontic examination:

ICON≤43

210

6.3 (2.7–10.8)

16.7 (11.1–33.3)

3.7 (0–8.3)

3.7 (0–11.1)

0 (0–2.6)

ICON>43

74

9.0 (5.2–18.5)

22.2 (11.1–38.9)

3.7 (0–11.1)

14.8 (3.7–34.3)

2.6 (0–5.1)

p

0.018

0.499

0.910

< 0.001

0.045

IOTN≤3

189

6.3 (2.7–10.8)

16.7 (11.1–27.8)

3.7 (0–7.4)

3.7 (0–11.1)

0 (0–2.6)

IOTN>4

109

9.0 (5.4–17.1)

22.2 (11.1–38.9)

3.7 (0–11.1)

11.1 (0–25.9)

2.6 (0–5.1)

p

0.030

0.095

0.260

<0.001

0.024

Self-reported malocclusion:

‘healthy’

237

4.5 (1.8–9.9)

16.7 (8.3–27.8)

0 (0–7.4)

0 (0–7.4)

0 (0–0)

‘not healthy’

323

8.1 (3.6–14.4)

22.2 (11.1–38.9)

3.7 (0–11.1)

7.4 (0–22.2)

2.6 (0–2.6)

p

< 0.001

0.011

0.096

< 0.001

0.007

CPQ: Child Perceptions Questionnaire, OS: Oral Symptoms, FL: Functional Limitations, EWB: Emotional Well-Being, SWB: Social Well-Being, IQR: Range from 1th to 3rd quartile, p: Test to compare medians across groups (significant values are in bold).

It was possible to compare records of 1365 parents with records of their children who independently each from other assessed items of the OS and FL domains of child OHRQoL (Table 5). Across all age groups of adolescents, positive significant correlations between parental and children assessments were observed for sum scores of both domains whereas these correlations were evaluated as a moderate level. The moderate values of kappa and ICC also confirmed agreement between child and parental reports. These results suggest on reliability of two subscales of the CPQ in respect of repeatability by two different raters.

Table 5. Agreement between child and parental reports about oral symptoms and functional limitations

Age groups

Domain

Number of compared pairs

Spearman correlation coefficient

Quadratic weighted kappa

Intraclass correlation coefficient

(95% CI)

11–14

Domain OS

255

0.42**

0.40**

0.56 (0.43–0.65)

Domain FL

255

0.31**

0.33**

0.43 (0.27–0.55)

15–16

Domain OS

630

0.32**

0.32**

0.53 (0.46–0.60)

Domain FL

637

0.34**

0.40**

0.58 (0.51–0.64)

17–18

Domain OS

469

0.39**

0.32**

0.56 (0.47–0.63)

Domain FL

473

0.34**

0.38**

0.56 (0.47–0.63)

OS: Oral Symptoms, FL: Functional Limitations, CI: Confidence Interval, ** p<0.01.

Discussion

This innovative study was aimed to validate the CPQ among adolescents aged from 15 to 18 in the population survey of orthodontic anomalies in Lithuania. As a reference age group was chosen a group of adolescents aged 11–14 years. The main findings of our study showed that the CPQ instrument is valid to adolescents aged 15–18 years as well as it is valid for adolescents aged 11–14 years.

According to the literature review, most of the OHRQoL studies has focused on 11–14-year-old adolescents rather on older teens. This fact is not surprising because OHRQoL is often the key motive for seeking orthodontic treatment and can considered the measurement for orthodontic treatment need and outcome.[35–37] It also relates to the fact that children of this age group make up the majority of orthodontic patients. During this age period, the whole body, including the jaws, develops intensively. So the orthodontic anomalies that has arisen in this age period can be successfully corrected, even it is assumed that it is not possible to complete a full course of orthodontic treatment before the premolars and second permanent molars have erupted at dental age 12 or 13 years.[38] Therefore, it increasingly recognized that more and more teenagers and young adults are seeking correction of their malocclusion, if this could not be done in early adolescence. Thus, orthodontists should be aware that such patients might expect orthodontic treatment to provide not only improved oral functioning and health but also enhancement of aesthetics, self-esteem and social life.[39]

More recently, a number of tools to measure OHRQoL has been developed and used in assessing an association between severity of malocclusion and patients’ perception of their oral health status. The standard CPQ11–14 was developed to measure the OHRQoL among adolescents between the ages of 11 and 14 years in Canada [12] and soon validated in many languages and cultures, including such as China,[40] India,[16] Korea,[21] Saudi Arabia,[22] and others. The questionnaire was also adapted to Lithuanian adolescents (Kavaliauskienė A, Šidlauskas A, Zaborskis A., 2018. Manuscript under review). After examination its psychometric properties, the Lithuanian version of CPQ11–14 showed good internal consistency, discriminant validity and acceptable agreement between children and parental responses to the same items. However, there are few studies in which the well-known CPQ would be used to measure OHRQoL in adolescents over the age of 14 years.[24–27] So we felt the lack of an instrument suitable for measuring OHRQoL throughout all adolescence period as the investigation of orthodontic anomalies among adolescents of Lithuania was targeted to the population aged from 11 to 18 years.

Adolescence is marked as a transitional period of rapid developmental changes and often perceived as a time of changing trajectories and health across the life course.[29, 41] It is reasonable that adolescents of the older stage are very different from those of the younger age stage. Older teen like young adults are capable of abstract thinking, reasoning about the past events and relating them with good or bad consequences in health.[41] Based on this assumption, we hypothesised that the CPQ instrument to measure OHRQoL among 15–18-year-old adolescents could be as much valid as it was valid for adolescents aged 11–14 years. The hypothesis was confirmed by all tests traditionally employed in questionnaire validation procedures.

Initially, it was found that the distribution of CPQ sum scores and its ratio between males and females did not differ significantly across age groups of adolescents. This may suggest that the impact of malocclusion over all adolescence does not decrease as age increases. However, our study was limited to adolescents up to 18 years, while other studies among adolescents and young adults demonstrated a negative association between age and impact on quality of life due to malocclusion.[42] Exploring gender differences, regardless of age, girls were found to be more emotionally concerned with their teeth aesthetic or, alternatively, boys may be less self-conscious about their appearance. Similar findings were reported by Peres et al.[43] who found females adolescents having greater dissatisfaction with their dental appearance (Peres et al., 2008) but in the other studies the gender difference was not established significant.[44]

Next, a good internal consistency reliability of the total CPQ with Cronbach’s alpha equal to 0.90 was established in both 15–16 and 17–18 age groups and was as high as in the 11–14 age group presented in our study or reported by other authors.[12] Despite the adolescent age, the alpha coefficient for the EBW and SWB domains was also greater than 0.80. Similarly to the other CPQ validation studies,[16,17] the lowest values of Cronbach’s alpha were observed for the OS and FL domains. Many methodologists[33, 34] recommend a minimum alpha coefficient between 0.65 and 0.8 (or higher in many cases), thus the obtained values that varied from 0.66 to 0.73 could be considered acceptable for these domains in all age groups.

The correlation coefficients in the construct validity analysis were significant in all age groups. So construct validity of the questionnaire in survey of older adolescents was in any case as high as that found among the youngest adolescents. Compared with other studies,[17, 20] which considered the CPQ valid for the population being assessed, the correlations between the respondents’ global rating of oral health and well-being and the CPQ sum scores outlined in our study were higher in many cases. The construct validity of the questionnaire for all age groups was also confirmed by the significant relationship between CPQ of sum scores and the adolescent’s global life satisfaction that is an essential dimension of young people well-being.[45] The relationship indicated that adolescents, regardless of their age, were more likely to report lower global life satisfaction when they felt any oral health-related complaints.

A discriminant validity of the CPQ was examined comparing the distribution of the CPQ scores between groups of adolescents with regard to their subjectively perceived and objectively measured orthodontic status. We found that malocclusion experience has a negative impact on the adolescents’ perceptions but its strength (difference in the CPQ distribution) differed by the method of definition of severity of malocclusion and the age of adolescents. Adolescents who reported malocclusion complaints themselves (were ‘not healthy’ in respect to orthodontic status) were more likely to provide greater perceptions of oral health-related problems than adolescents with clinically defined need for orthodontic treatment. This finding shows that a malocclusion can be perceived differently by the affected person, and a person’s degree of awareness of their malocclusion might not be related to its severity.[42] The findings of the study also suggest that young adolescents when evaluating their malocclusion by orthodontist mainly suffer emotional problems, as their OHRQoL might not be related so much with severity of malocclusion. Previous studies examining the impact of malocclusion on children (young adolescents) oral health-related perceptions have been also equivocal. Systematic reviews of literature on this issue reported studies that claimed evidence for a clear inverse association of malocclusion with OHRQoL.[46–48] At the same time, they reported studies with no clear relationship indicating that the strength of the association differed depending on the age of studied sample and cultural environment. In part, our findings confirmed this suggestion indicating that in older adolescents clinically defined need for orthodontic treatment may have a significant effect on perceived OHRQoL in more domains. Therefore, in respect of discriminant validity, the CPQ had no disadvantages both in the younger and older adolescents groups.

Finally, test-retest reliability of the CPQ instrument was not assessed due to organizational and logical reasons. With regard to organizational reasons, a retest appeared problematic as organizing another dental examination session at all of the schools participating in our study would have a complex endeavour. With the respect to logical reasons, a retest of the same students was replaced with an alternative analysis that included comparison of children’s and their parents’ answers to the same questions of the OS and FL sub-scales. Such comparison was not performed for the EWB and SWB sub-scales, because some parents may have limited knowledge about their children’s OHRQoL, particularly the impact on social and emotional well-being.[49]. As in other similar studies in this field,[49–51] findings of the present study confirmed an agreement between child and parental reports suggesting on reliability of the PCQ in respect of its repeatability by two different raters.

As an advantage of this study may be the fact that data were collected in cross-sectional population survey of representative adolescents’sample but not within sample of patients attending dental treatment as in several studies.[12, 24,52] The adolescents completed their questionnaires at school anonymously without any influence of their parents’ and dentist’s opinion, thus, adolescents could express their own feelings towards their QoL. That was an important condition comparing children’s and their parent responses, as well as their perceptions and orthodontic measures. This is the first study on OHRQoL among adolescents ever to be carried in Lithuania.

In terms of the limitations of our study, we conducted oral examination with respect to orthodontic disorders without assessing of dental cariousness and periodontal conditions that would have a considerable impact on OHRQoL in adolescence.[53–55] The sample was not also homogenous with respect to previously conducted orthodontic treatment. So, the possible confounding effects of these conditions on the participants’ OHRQoL were not considered in the analysis. Another limitation of the research is that we worked on the “long form” (37 items) of the original CPQ11–14 together with other scales, including such as eating behaviour and self esteem. Our experience from the HBSC study [29] showed that an increase of number of items in the questionnaire may affect respondent’s accuracy providing inaccurate answers, which may, consequently, reduce reliability of the tested scale. Finally, test-retest reliability of the CPQ instrument was replaced with an alternative analysis that included comparison of children’s and their parents’ responses to the same questions of the OS and FL domains. This approach is not free from limitations, especially in relation to its accuracy because children and parents may not share the same views about illness and health.[56]

Conclusions

The Lithuanian version of the CPQ showed good internal consistency and construct and discriminant validity in all age groups of adolescents, consequently, it seems to be a valid instrument for measuring OHRQoL among adolescents aged 15 to 18 years as well as among adolescent aged 11 to 14 years.

Acknowledgements: The authors would like to thank all reviewers for their thoughtful comments in the manuscript. A gratitude is also expressed to the schoolchildren and their parents for their participation in this study as well as to the teachers for their help during fieldwork.

Competing interests: The authors declare that they have no competing interests.

Funding: This study was funded by the Lithuanian University of Health Sciences.

Abbreviations

CI

Confidence Interval

CPQ

Child Perceptions Questionnaire

DHC

Dental Health Component

EWB

Emotional Well-being

FL

Functional Limitations

HBSC

Health Behaviours in School-aged Children

ICC

Intraclass Correlation Coefficient

ICON

Index of Complexity Outcome and Need

IIR

Inter-Item Correlation

IOTN

Index of Orthodontic Treatment Need

IQR

Interquartile Range

ITR

Item-Total Correlation

OHRQoL

Oral Health-Related Quality of Life

OS

Oral Symptoms

SD

Standard Deviation

SWB

Social Well-being

References

  1. Inglehart MR, Bagramian RA (2002) (Eds.) Oral health-related quality of life. Chicago: Quintessence Publishing Co Inc [Crossref]
  2. Sischo L, Broder HL (2011) Oral health-related quality of life: what, why, how, and future implications. J Dent Res 90(11): 1264–70. [Crossref]
  3. Bennadi D, Reddy CV (2013) Oral health related quality of life. J Int Soc Prev Community Dent 3(1): 1–6. [Crossref]
  4. Cunningham SJ, O’Brien C. Quality of life and orthodontics. Semin Orthod 2007;13,96–103.
  5. Gherunpong S, Sheiham A, Tsakos G ( 2006) A sociodental approach to assessing children’s oral health needs: integrating an oral health-related quality of life (OHRQoL) measure into oral health service planning. Bull World Health Organ 84: 36–42. [Crossref]
  6. Murray Thomson W (2014) Epidemiology of oral health conditions in older people. Gerodontology 31 Suppl 1: 9–16. [Crossref]
  7. Lu HX, Wong MC, Lo EC, McGrath C (2015) Oral health related quality of life among young adults. Appl Res Qual Life 10(1): 37–47.
  8. Genderson MW, Sischo L, Markowitz K, Fine D (2013). An overview of children’s oral health-related quality of life assessment: from scale development to measuring outcomes. Caries Res 47 Suppl 1: 13–21. [Crossref]
  9. Gilchrist F, Rodd H, Deery C, Marshman Z (2014) Assessment of the quality of measures of child oral health-related quality of life. BMC Oral Health 2014;14: 40. [Crossref]
  10. Gherunpong S, Tsakos G, Sheiham A (2004) Developing and evaluating an oral health-related quality of life index for children; the CHILD-OIDP. Community Dent Health 21: 161–9.[Crossref]
  11. Broder HL, Wilson-Genderson M (2007) Reliability and convergent and discriminant validity of the Child Oral Health Impact Profile (COHIP Child’s version). Community Dent Oral Epidemiol 35 Suppl 1: 20–31. [Crossref]
  12. Jokovic A, Locker D, Stephens M, Kenny D (2002) Validity and reliability of a questionnaire for measuring child oral-health-related quality of life. J Dent Res 81: 459–63. [Crossref]
  13. Jokovic A, Locker D, Tompson B, Guyatt G (2004) Questionnaire for measuring oral health-related quality of life in eight- to ten-year-old children. Pediatr Dent 26: 512–8. [Crossref]
  14. Jokovic A, Locker D, Stephens M, Kenny D (2003) Measuring parental perceptions of child oral health-related quality of life. J Public Health Dent 63: 67–72.[Crossref]
  15. Jokovic A, Locker D, Guyatt G (2006) Short forms of the Child Perceptions Questionnaire for 11–14-year-old children (CPQ11–14): Development and initial evaluation. Health Qual Life Outcomes 4: 4. [Crossref]
  16. Kumar S, Kroon J, Lalloo R, Johnson NW (2016) Psychometric Properties of Translation of the Child Perception Questionnaire (CPQ11–14) in Telugu Speaking Indian Children. PLoS One 11(3): e0149181.[Crossref]
  17. Goursand D, Paiva SM, Zarzar PM, Ramos-Jorge ML (2008) Cross-cultural adaptation of the Child Perceptions Questionnaire 11–14 (CPQ11–14) for the Brazilian Portuguese language. Health Qual Life Outcomes 6: 2. [Crossref]
  18. Gururatana O, Baker S, Robinson PG (2011) Psychometric properties of long and short forms of the Child Perceptions Questionnaire (CPQ11–14) in a Thai population. Community Dent Health 28(3): 232–7. [Crossref]
  19. Bekes K, John MT, Zyriax R, Schaller HG (2012) The German version of the Child Perceptions Questionnaire (CPQ-G11–14): translation process, reliability, and validity in the general population. Clin Oral Investig 16(1): 165–71. [Crossref]
  20. Olivieri A, Ferro R, Benacchio L, Besostri A (2013) Validity of Italian version of the Child Perceptions Questionnaire (CPQ11–14). BMC Oral Health 13: 55. [Crossref]
  21. Shin HS, Han DH, Shin MS, Lee HJ (2015) Korean version of child perceptions questionnaire and dental caries among Korean children. PLoS One 10(2): e0116011. [Crossref]
  22. Brown A, Al-Khayal Z (2006) Validity and reliability of the Arabic translation of the child oral-health-related quality of life questionnaire (CPQ11–14) in Saudi Arabia. Int J Paediatr Dent 16(6): 405–11.[Crossref]
  23. Streiner D, Norman G (2000) Health Measurement Scales. A practical guide to their development and use. 2nd edition. New York, Oxford University Press.
  24. De Baets E, Lambrechts H, Lemiere J, Diya L (2012) Impact of self-esteem on the relationship between orthodontic treatment need and oral health-related quality of life in 11- to 16-year-old children. Eur J Orthod 34: 731–7. [Crossref]
  25. Paula JS, Cruz JND, Ramires TG, Ortega EMM (2017) Longitudinal impact of clinical and socioenvironmental variables on oral health-related quality of life in adolescents. Brazilian Oral Res 31,e70. doi: 10.1590/1807–3107BOR-2017.vol 31.0070 [Crossref]
  26. Ahuja V (2013) Oral health related quality of life among Iowa adolescents. Master thesis. Iowa City: The University of Iowa.
  27. Sun L, Wong HM, McGrath CPJ (2018) The factors that influence oral health-related quality of life in 15-year-old children. Health Qual Life Outcomes 16,19. [Crossref]
  28. WHO. Oral Health Surveys: Basic Methods. 5th ed. Geneva: World Health Organization. 2013.
  29. Inchley J, Currie D, Young T, Samdal O, et al. (Eds.) Growing up unequal: gender and socioeconomic differences in young people‘s health and well-being. Health Behaviour in School-aged Children (HBSC) study: International report from the 2013/2014 survey. Copenhagen: World Health Organization Regional Office for Europe, 2016.
  30. Richmond S (2008) Evaluating effective orthodontic care. 1st ed. Cardiff Medicentre. First Numerics Ltd.
  31. IBM Corp. IBM SPSS Complex Samples 21. Armonk, NY, USA: IBM Corp, 2012.
  32. Streiner D, Norman G. Health Measurement Scales. A practical guide to their development and use. 2nd edition. New York, Oxford University Press, 2000.
  33. Pakalniškienė V. Tyrimo ir įvertinimo priemonių patikimumo ir validumo nustatymas. Metodinė priemonė. (Evaluation of validity and reliability for examination and assessment tools.) Vilnius: Vilniaus universiteto leidykla, 2012 (in Lithuanian).
  34. Aldridge V. Reliability Assessment Using SPSS. University of York, Centre for Applied Statistics Courses, UCL Institute of Child Health, 2015. Available: http: //www.spssusers.co.uk/Events/2015/ALDRIDGE2015.pdf.
  35. Kiyak HA. (2008) Does orthodontic treatment affect patients’ quality of life? J Dent Educ 72(8): 886–94. [Crossref]
  36. Feu D, de Oliveira BH, de Oliveira Almeida MA, Kiyak HA(2010) Oral health-related quality of life and orthodontic treatment seeking. Am J Orthod Dentofacial Orthop 138: 152–9 [Crossref]
  37. Masood M, Masood Y, Saub R, Newton JT (2014) Need of minimal important difference for oral health-related quality of life measures. J Public Health Dent 74: 13–20. [Crossref]
  38. Bennett JC (2006) Orthodontic management of uncrowded class II division 1 malocclusion in children. London, UK: Elsevier.
  39. Chen M, Feng ZC, Liu X, Li ZM (2015) Impact of malocclusion on oral health-related quality of life in young adults. Angle Orthod 85(6): 986–91. [Crossref]
  40. McGrath C, Pang HN, Lo EC, King NM (2008) Translation and evaluation of a Chinese version of the Child Oral Health-related Quality of Life measure. Int J Paediatr Dent 18: 267–74. [Crossref]
  41. Sawyer SM, Afifi RA, Bearinger LH, Blakemore SJ (2012) Adolescence: A foundation for future health. The Lancet 379(9826): 1630–40. [Crossref]
  42. Masood Y, Masood M, Zainul NN, Araby NB (2013) Impact of malocclusion on oral health related quality of life in young people. Health Qual Life Outcomes 11: 25. [Crossref]
  43. Peres KG, Barros AJ, Anselmi L, Peres MA (2008) Does malocclusion influence the adolescent’s satisfaction with appearance? A cross-sectional study nested in a Brazilian birth cohort. Community Dent Oral Epidemiol Apr;36(2): 137–43.
  44. de Oliveira CM, Sheiham A (2004) Orthodontic treatment and its impact on oral health-related quality of life in Brazilian adolescents. J Orthod 31(1): 20–7; discussion 15. [Crossref]
  45. Kavaliauskienė A, Šidlauskas A, Zaborskis A (2017) Association between Global Life Satisfaction and Self-Rated Oral Health Conditions among Adolescents in Lithuania. Int J Environ Res Public (
  46. Zhang M, McGrath C, Hagg U (2006) The impact of malocclusion and its treatment on quality of life: a literature review. Int J Paed Dent 16: 381–7. [Crossref]
  47. Liu Z, McGrath C, Hägg U (2009) The impact of malocclusion/ orthodontic treatment need on the quality of life. A systematic review. Angle Orthod 2009;79: 585–91. [Crossref]
  48. Kragt L, Dhamo B, Wolvius EB, Ongkosuwito EM (2016) The impact of malocclusions on oral health-related quality of life in children-a systematic review and meta-analysis. Clin Oral Investig 20(8): 1881–94. [Crossref]
  49. Barbosa TS, Gavião MB (2015) Validation of the Parental-Caregiver Perceptions Questionnaire: agreement between parental and child reports. J Public Health Dent Fall 75(4): 255–64. [Crossref]
  50. Barbosa TS, Gavião MB (2008) Oral health-related quality of life in children: part III. Is there agreement between parents in rating their children’s oral health-related quality of life? A systematic review. Int J Dent Hyg 6(2): 108–13. [Crossref]
  51. Li YJ, Gao YH, Zhang Y (2014) The impact of oral health status on the oral health-related quality of life (OHRQoL) of 12-year-olds from children’s and parents’ perspectives. Community Dent Health 31(4): 240–4. [Crossref]
  52. O’Brien C, Benson PE, Marshman Z (2007) Evaluation of a quality of life measure for children with malocclusion. J Orthod 34(3): 185–93; discussion 176. [Crossref]
  53. Naito M, Yuasa H, Nomura Y, Nakayama T (2006) Oral health status and health-related quality of life: a systematic review. J Oral Sci 48(1): 1–7. [Crossref]
  54. Barbosa TS, Gavião MBD, Castelo PM, Leme MS (2016) Factors Associated with Oral Health-related Quality of Life in Children and Preadolescents: A Cross-sectional Study. Oral Health Prev Dent 14(2): 137–48. [Crossref]
  55. Martins MT, Sardenberg F, Bendo CB, Abreu MH (2017) Dental caries remains as the main oral condition with the greatest impact on children’s quality of life. PLoS One 12(10): e0185365. doi: 10.1371/journal.pone.0185365. [Crossref]
  56. Jokovic A, Locker D, Stephens M, Kenny D (2003) Measuring parental perceptions of child oral health-related quality of life. J Public Health Dent 63(2): 67–72. [Crossref]

The Effect of Ketorolac on Postoperative Hemoglobin Level after Vaginal Reconstructive Surgery

DOI: 10.31038/IGOJ.2018113

Abstract

Objectives: Ketorolac is an appealing alternative to narcotics in postoperative pain management, however, there is concern for postoperative bleeding.  We sought to evaluate and compare the effect of ketorolac on postoperative bleeding and to assess its impact on postoperative pain control in patients undergoing vaginal reconstructive surgery.

Methods: This is a retrospective cohort study of women who had vaginal reconstructive surgery at Christiana Care Health System between January 1, 2014-December 31, 2014. Data on preoperative and postoperative hemoglobin levels as well as total narcotic use (defined as 1mg of intravenous hydromorphone) was collected for each patient.  Data analysis was performed using a chi- square test and unpaired t-tests. Multiple regression and linear regression analyses were performed to assess the effect of ketorolac use on hemoglobin and total narcotic use.

Results: 129 vaginal surgery cases were identified in the study period. 54 (41.9%) patients received ketorolac and 75 (58.1%) patients did not receive ketorolac. There was no statistically significant difference in mean narcotic use between the ketorolac group and the no ketorolac group (3.85mg vs 3.0mg, p= 0.194). Total ketorolac use was not associated with an increase in estimated blood loss. Among patients who received ketorolac, there was no significant difference in pre-operative and post-operative hemoglobin when adjusting for estimated blood loss.

Conclusion: This study found that that there was no difference in change in hemoglobin with the use of ketorolac. The total amount of narcotic use was not decreased in patients given ketorolac postoperatively for additional pain control.

Introduction

Pain control in the postoperative period has been studied extensively in the gynecological literature. Currently, standard postoperative pain control includes a combination of narcotics and non-steroidal anti-inflammatory drugs (NSAIDs). Narcotic medications have well documented side effects including nausea, vomiting, constipation, dizziness, somnolence and a decreased respiratory drive. NSAIDs such as ketorolac have become an attractive option for pain control as an alternative to opioid medications. The effectiveness of ketorolac on postoperative pain control has been well established [1–3]. There is, however, a concern with the effect of ketorolac use on postoperative bleeding [4].

Ketorolac like other NSAIDs can prolong bleeding time by inhibiting platelet aggregation and thromboxaneA2 production [4, 5]. Early studies on the hemostatic effects of ketorolac have shown prolongation of bleeding time as well as an increased risk for gastrointestinal bleeding in the postoperative period [6,7]. Nevertheless, there are conflicting reports in the literature. A recent meta-analysis [8] of 27 randomized controlled trials examining postoperative bleeding with ketorolac use did not show a significant increase in bleeding compared to controls.  Additionally, the meta analysis also showed superior pain control with ketorolac compared with controls, and equally effective pain control when compared to opiates.

Postoperative bleeding after vaginal reconstructive surgery is a well established complication and can present in one of two ways. First, with vaginal bleeding noted several hours after the procedure that may be caused by bleeding from the vaginal cuff or vascular pedicles.  Secondly, with little or no vaginal bleeding but deteriorating vital signs, indicating a possible retroperitoneal hematoma.

Materials and Methods

This is an IRB approved retrospective cohort study of women who had vaginal reconstructive surgery at Christiana Care Health System between January 1 2014-December 31 2014. Patients were identified through the institutional perioperative database using CPT codes for various vaginal procedures.  All patients that underwent a vaginal reconstructive procedure done by a board certified Female Pelvic Medicine and Reconstructive Surgery surgeon were included in the data set.  A sequential retrospective chart review of patients who underwent vaginal reconstructive surgeries was then conducted. Data was collected through manual review of electronic and hand written paper charts. Patients who underwent additional laparoscopic procedures were excluded. Additionally, patient with a history of chronic narcotic use, history of chronic pain and a history of bleeding disorders were excluded. Inclusion criteria included patients over the age of 18 years who underwent a vaginal reconstructive procedure requiring at least an overnight hospital stay. Patient age, BMI, ethnicity, indication, length of procedure, and length of stay were recorded. Administration of Ketorolac was determined by both the surgeon or the anesthesiologist. Ketorolac use, timing of dosage, and total dosage were recorded. For each patient, the 24 hour and 48-hour postoperative narcotic requirement were recorded. Postoperative complications such as blood transfusions, return to the operating room, ileus, were also recorded.

One of the secondary outcomes was to analyze the use of narcotic medications in those patients that received ketorolac in comparison to those that did not. As a variety of narcotic medications were used depending on surgeon preference, narcotic medications were converted to 1mg IV hydromorphone using an online opioid conversion calculator [9]. The conversion was based upon standard dosing preparations. The time period of 24 hours began upon admission to the post anesthesia care unit.

Data was analyzed using chi-square test for categorical variables and t-test of continuous variables.  Linear regression analyses were used to compare ketorolac use with narcotic usage and hemoglobin levels. The latter analysis was adjusted for estimated blood loss during the surgery.

Results

There were 176 vaginal reconstructive surgery cases were identified during the study period. Based on the exclusion criteria, 47 cases were excluded.   Of the remaining 129 vaginal cases, 54 (41.9%) patients received ketorolac and 75 (58.1%) patients did not receive ketorolac. The group that received ketorolac were younger (56.0 vs 66.1, p=0.003). A large proportion of the study population was Caucasian (n=113, 87.6%).  There was no difference in body mass index in both groups.  There was no difference in length of stay between the two groups (Table 1). Estimated blood loss (EBL) during the surgery was significantly different in both groups, with the ketorolac group having a lower volume (84.5 mL vs. 117.1 mL, p = 0.049).  The difference in preoperative hemoglobin levels and postoperative hemoglobin levels were not significantly different between the two groups (Table 2). Additionally, there was no significant difference in hemoglobin when comparing the total dose of ketorolac with the decrease in hemoglobin level postoperatively (p=0.81).  One patient required a postoperative blood transfusion. This patient, who did not receive ketorolac, had a hemoglobin >7, but had clinical symptoms for acute blood loss anemia.

There was no difference in the mean narcotic use between the two groups (Table 3). The total amount of ketorolac used did not have a significant difference in narcotic usage (p=0.75). No significant difference was seen in narcotic use on postoperative day (POD) #1 or POD#2 in the ketorolac group. However, when adjusted for age, there was a significant decrease in narcotic use in the ketorolac group on POD#0 (p=0.045). Nineteen patients did not receive any postoperative analgesia, of which nine belonged to the ketorolac group and ten belonged to the no ketorolac group.

Table 1. Demographics


Ketorolac Use


no ketorolac

ketorolac

p-value

Age (yrs)

66.10 (13.3)

56.02 (14.3)

<0.001

BMI (mean SD)

29.9 (6.45)

28.69 (5.20)

0.30

Race/Ethnicity  (n%)

0.46

Caucasian

68 (90.7)

45 (83.3%)

African American

3 (4%)

6 (11.1%)

Hispanic

2 (2.7%)

1 (1.9%)

Other

2 (2.7%)

2 (3.7%)

Length of Stay  (days)

1.04 (0.20)

1.08(0.27)

0.39

Estimated Blood Loss (EBL) (mL)

117.1

84.47

0.05

Table 2. Ketorolac use and Hemoglobin Level

Ketorolac use

no ketorolac

ketorolac

p-value

Pre-op Hb

12.92

12.68

0.36

Post-op Hb

10.89

10.79

0.68

Difference in Average Pre and Post-op Hb

-2.14

-1.89

0.20

Table 3. Ketorolac and Narcotic use


Ketorolac Use

Mean Difference

p-value


no ketorolac
(n = 75)

ketorolac
(n = 54)

Any Narcotic Use (n%)

0.981

No

11 (14.67)

8 (14.81)

Yes

64 (85.33)

46 (85.19)

Total Narcotics (mg)

Mean (SD)

3.00 (2.95)

3.85 (4.04)

-0.846

0.194

Median (IQR)

2.00 (0.90, 4.60)

2.50 (0.85, 6.15)

Narcotic Dosage POD #0 (mg)

Mean (SD)

1.83 (1.80)

2.17 (2.25)

-0.347

0.3505

Median (IQR)

1.20 (0.30,2.90)

1.25 (0.50, 3.50)

Narcotic Dosage POD #1 (mg)

Mean (SD)

1.18 (1.41)

1.68 (2.27)

-0.499

0.157

Median (IQR)

0.80 (0.00, 1.60)

0.85 (0.00, 2.45)

In order to account for a potential confounder of increased pain leading to the addition of ketorolac to the regimen, a subanalysis comparing narcotic use in patients who received ketorolac on POD#0 was conducted. Patients who did not receive ketorolac on POD#0 were removed from the analysis. There was no difference in narcotic use in this group of patients (p=0.70)

Discussion

Our findings show that there was no difference in hemoglobin level postoperatively between the ketorolac and no ketorolac group.  Additionally, there was no difference in narcotic use between the two groups. There was no difference in narcotic use on POD#0 or POD#1. When adjusting for age, however, there was a significant decrease in narcotic use on POD#0 (p=0.045).

The current literature on whether there is a significant increase in bleeding with ketorolac is conflicting [10–13]. Strom et al (1996) reported a 50% increase in bleeding time in healthy subjects four hours after administration of Ketorolac [10]. They also showed that there was a 10% postoperative hemorrhage rate compared to 2% in patient who only received opioids. Another study showed an increase in bleeding time by 1 minute and 46 seconds in patients that were treated with IM Ketorolac [7]. Conrad et al. showed that bleeding time increased from 4.9 minutes to 7.8 minutes in patients who received IM ketorolac four times a day for five days.  An important distinction to make between these studies is the use of bleeding time as the indicator of abnormal bleeding. Bleeding time has been shown to be a reliable marker of abnormal bleeding in patients who receive antiplatelet agents [7].  However, it is unclear if bleeding time could predict clinically significant compromise in hemostasis in the postoperative period [14].  Importantly, there was no association noted between dosage of ketorolac and an increase in bleeding (p=0.1692). This is a different finding from the literature where there was dose dependent relationship with an increase in bleeding [14].

The effect of ketorolac on pain is well established. Studies in both surgery and gynecology literature have shown a morphine sparing effect with the use of ketorolac in the postoperative period.  In this study, unadjusted analyses showed no difference in narcotic usage based on if patient received ketorolac. There was also no dose dependent decrease noted in opiate usage noted. Interestingly, the mean narcotic use was slightly higher in the group that received ketorolac (3.86mg vs. 3.52mg), but not significant. A reason that could account for this finding is that ketorolac was given postoperatively to patients who had higher narcotic requirements.  When this was accounted for, by eliminating all patients who did not receive ketorolac on POD#0 from the ketorolac group, the mean narcotic use was lower in the ketorolac group. This finding was not significant. However, the sample size became significantly smaller (n=38) when these patients were removed from analysis. Adjusted analysis showed a significant decrease in narcotic use on POD#0, but not on POD#1. Additionally, there was no difference shown when comparing the total dosage of ketorolac with total narcotic use. These findings are not consistent with the literature which has shown a decrease in narcotic use with the use of ketorolac postoperatively.

The narcotic use overall was noted to be low in both groups. A study by Crisp et al. (2017) [15]  comparing PCA to nurse administered analgesia postoperative in patients who underwent vaginal reconstructive surgery noted similar dosage of IV hydromorphone, with total hydromorphone use as 3.56mg, and 1.803mg and 1.770mg on POD#0 and POD#1 respectively. Narcotic usage postoperative after abdominal hysterectomies are significantly higher as noted in a study by Moon et al (2011) [16] with a 24 hour consumption of 4.2mg ±2.3mg. An alternative hypothesis is that these surgeries may not be painful enough to show a true difference in narcotic consumption, and may require a larger study group to show a difference.

A strength of this study is that this question as not been answered in current literature specifically in Urogynecology. We also attempted to adjust for any confounders with linear regression analyses. All surgeries were preformed by board certified FPMRS surgeons at this institution who provide a consistent level of care. The limitations of the study include that it is a retrospective analysis. Additionally, the sample size is relatively small, and is potentially not large enough to show a true difference between hemoglobin change. Bleeding was assessed through a comparison of preoperative and postoperative hemoglobin. As ketorolac is a prostaglandin inhibitor, its effects are primarily on platelet function and a better parameter to study may be coagulation studies. These parameters were not available in our retrospective analysis but should be included in any prospective studies examining this question.  Future directions should include a comparison of ketorolac with IV Tylenol on narcotic use.

References

  1. Brown CR, Moodie JE, Wild VM, Bynum LJ (1990) Comparison of intravenous ketorolac tromethamine and morphine sulfate in the treatment of postoperative pain. Pharmacotherapy 10: 116S-121S. [crossref]
  2. Parker RK, Holtmann B, Smith J, White PF (1994) Use of ketorolac after lower abdominal surgery: effect on analgesic requirement and surgical outcome. Anesthesiology 80:6–12.
  3. Sevarino FB, Sinatra RS, Paige D, et al. (1992) The efficacy of intramuscular ketorolac in combination with intravenous PCA morphine for postoperative pain relief. J Clin Anesth 4:285–8.
  4. Buckley MM, Brogden RN (1990) Ketorolac: A review of its pharmacodynamic and pharmacokinetic properties, and therapeutic potential. Drugs 39:86–109.
  5. Greer IA (1990)  Effects of ketorolac tromethamine on hemostasis. Pharmacotherapy10:71S–76S.
  6. Rogers JE, Fleming BG, Macintosh KC, et al. (1995) Effect of timing of ketorolac administration on patient-controlled opioid use. Br J Anaesth 75:15–8.
  7. Singer AJ, Mynster CJ, McMahon BJ (2003) The effect of IM ketorolac tromethamine on bleeding time: A prospective, interventional, controlled study. Am J Emerg Med 21:441–443
  8. Gobble RM, Hoang HL, Kachniarz B, et al. (2014) Ketorolac does not increase perioperative bleeding: a meta-analysis of randomized controlled trials. Plast Reconstr Surg 133:741–55.
  9. McCauley, David (2017) Opioid Analgesic Converter
  10. Strom BL, Berlin JA, Kinman JL, et al. (1996) Parenteral ketorolac and risk of gastrointestinal and operative site bleeding: A postmarketing surveillance study. JAMA 275: 376–382.
  11. Gallagher J, Blauth J, Fornadley JA (1995) Perioperative Ketorolac tromethamine and postoperative hemorrhage in cases of tonsillectomy and adenoidectomy. Laryngoscope 105: 606–609
  12. Gobble RM, Hoang HL, Kachniarz B, et al. (2014) Ketorolac does not increase perioperative bleeding: a meta-analysis of randomized controlled trials. Plast Reconstr Surg 133:741–55.
  13. Conrad KA, Fagan TC, Mackie MJ, et al. (1988) Effects of ketorolac tromethamine on hemostasis in volunteers. Clin Pharmacol Ther 43:542–546.
  14. Lind SE (1991) The bleeding time does not predict surgical bleeding. Blood 77: 2547–2552
  15. Moon YE, Lee YK, Lee J, Moon DE (2011) The effects of preoperative intravenous acetaminophen in patients undergoing abdominal hysterectomy. Arch Gynecol Obstet 284:1455–60
  16. Crisp CC, Bandi, S; Kleeman, SD, et al. (2012) Patient-controlled versus scheduled, nurse-administered analgesia following vaginalreconstructive surgery: a randomized trial. Am J Obstet Gynecol 207:433.e1–6