Monthly Archives: January 2018

The Effect of Norepinephrine and Caffeic Acid on Cytokines and Nitric Oxide Production by Granulocytes is Age-Dependent

DOI: 10.31038/ASMHS.2018212

Abstract

There is a large increase in the number of elderly people in modern societies. This demographic phenomenon has been paralleled by an epidemic of chronic diseases and inflammatory process usually associated with advanced age. In this work we seek to fill a gap that still exists in the process of immunoregulation “old guy’ looking to narrow the knowledge regarding their correlation with the immune system and the nervous system. The Nitric Oxide (NO) and Interleukins productions were studied in healthy subjects in age ranging from 20 to 80 years divided in three age groups: (20-39), (40-59) and (60-80) years. NO production was quantified in a Griess reaction. The results were expressed through the nitrite concentration calculated by linear regression using a standard curve obtained from a solution of sodium nitrite and 1mM RPMI. Interleukins 8, 10 and 4 (IL-8, IL-10 and IL-4) productions were measured by sandwich ELISA. Ours results demonstrated that Norepinephrine (NoAD) can no longer modulate the inflammatory cytokine profile and that there is a significant decay of the contribution of Caffeic Acid (CA) as an antioxidant and / or anti-inflammatory age-related. Thus, our results showed a lack of NoAD and CA modulation in human granulocyte in ageing dependent process.

Keywords

Aging, Granulocytes, Caffeic acid, Nitric oxide, Cytokines

Significance Statement

In view of the population aging, it is necessary to seek alternatives to improve the quality of life, as well as ways to ameliorate the diseases and pathologies associated with the increase of chronic inflammation and the drop in adaptive immunity inherent in the elderly. Thus, this work introduces the study on the modulating effect of caffeic acid and noradrenaline on the synthesis of nitric oxide and interleukins in human granular cells in different age groups. Following a widely accepted concept that peripheral cells may be a “window” within the central nervous system, correlating it simply to the immune system.

Introduction

Senescence is the natural ageing process, which progressively compromises physical and cognitive. According to World Health Organization (WHO), the elderly begins between 60 and 65 years. However, this is an old established for research purposes, since the aging process depends on three main factors classes: biological, psychological and social factors [1].

Ageing is a complex phenomenon that is still not completely understood. Age-related pathologies generally rise with approximately exponential kinetics beginning at approximately the mid-point of the species-specific life span (e.g., 50–60 years of age for humans) [2,3].

Progressive deterioration of innate and adaptive immune functions, a status termed ‘immunosenescence’, is associated with the higher frequency and severity of diseases in the elderly, such as chronic infections, cancer and autoimmune disorders. Age-related immunosenescence can be characterized by a decrease in adaptive immunity and increase in low-grade chronic inflammation, also referred to as ‘inflammaging’ [4]. Another significant aspect is the marked increase in oxidative stress generated during the aging process [5].

Studies by according to Chaves et al. demonstrated, in granulocytes, increased reactive oxygen species (ROS) after 40 years and nitrogen (RNS) from the age of 50. Concomitant with this increase, was observed a significant decrease in antioxidant power, suggesting an imbalance in cellular metabolic aging [6-8].

Currently, it is known that many stimuli from the central nervous system are capable of modulating an immune response. The hypothalamic-pituitary-adrenal (HPA)-is one of those responsible for several of the links between these two systems. This communication is bidirectional because cytokine activates neuronal axis and neurotransmitters may be produced by cells from immune system. Endorphins, thyrotropin, prostaglandins, growth hormone, and catecholamines are also part of this type of neuroimmunoendocrine response [9].

Norepinephrine (NoAD) is produced in response to physiological stress trigger and a broad spectrum of biochemical and physiological alterations including modulation of immunity [10]. It is believed that Caffeic acid (CA) able to prevent the neuroinflammation-induced acute, probably the long term neurodegenerative changes and attenuates lipopolysaccharide-induced sickness behaviour and neuroinflammation in mice [11].

 It has also been suggested that cytokines have a pivotal role in ageing. Studies by according to Minciullo et al. [12] demonstrated that morbidity and mortality is associated with high level of IL-1, IL-6,TNF- an IFN-Y in older people . The authors suggest that longevity depends on the balance between pro and anti-inflammatoy cytokines. Several therapeutic approaches have been suggested to modulate both inflammation and oxidative stress. Among them, caffeic acid (3,4-dihydroxycinnamic acid) is considered a compound with anti-inflamatory and antioxidant properties. CA is believed to be able to prevent the neuroinflammation-induced acute and probably the long term neurodegenerative changes [13].

Catecholamines (CAs), including Norepinephrine (NoAD), is produced are the first hormones in response to physiological stress trigger and a broad spectrum of biochemical and physiological alterations including hyperglycemia and modulation of immunity [10] The Norepinephrine, major sympathetic neurotransmitters, modulates the immune system through interaction with adrenergic receptors G protein-coupled (α1, α2, β1, β2, β3). Thus, the occupation of these receptors stimulates or inhibits adenylate cyclase, which will influence the role of cytokines [14,15].

Herein, we investigate in the present paper we study the effect of NoAD and CA in inducing the production of Nitric Oxide, IL-8, IL-4 and IL-10 in human granulocytes from different age range.

Results

NoAD and CA lose the ability to modulate the production of NO during aging process

Our results (Figure 1-panel A) showed that in the age group from 20-39 years showed a significant increase in the production of NO by granulocytes, when they were incubated with NoAD or CA, compared to the control group (RPMI + granulocytes) (p<0.05). The values expressed as millimolar (mM) were 11,51 for NoAD and 14,66 for CA in comparison with 5,87 for control group.

For group from 40-59 only CA was able to induce the increase in secretion of NO by granulocytes. (Figure 1-panel B). Both NoAD and CA were not able to activate the production of NO in granulocytes from age group of 60-80 years (Figure 1-panel C).

ASMHS2018-101-RaquelCunhaLaraBrazil_F1

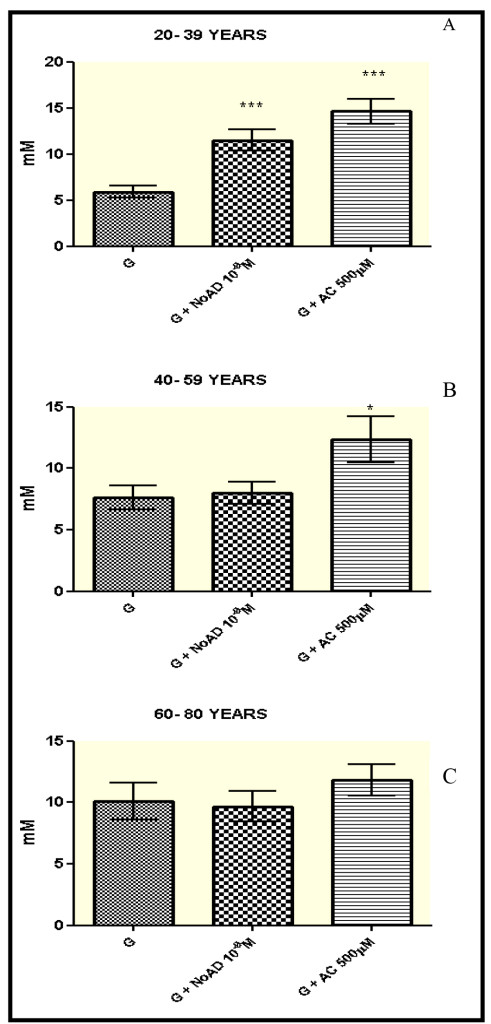
Figure 1. Norepinephrine and Caffeic Acid lose the ability to modulate the production of Nitric oxide during aging process. The values represent the mean ± S.E. Nitric Oxide (NO) production was expressed as mM. G = granulocyte, NoAD = Norepinephrine, CA = Caffeic Acid. *Significant (p<0,05) when compared with control (G) by ANOVA and Tukey post-test.

Effect of NoAD and CA on the production of IL-8: pro-inflammatory profile

Our results in the age group 20-39 years showed a significant difference (p<0.05) in IL8 production by granulocytes when they were stimulated by CA compared to the control group (RPMI + granulocytes) (p<0.05). The IL-8 production decreased 88%. But NoAD activates the secretion of proinflammatory cytokine (IL-8) in 32% (Table 1, 2).

Table 1. Effect of Norepinephrine and Caffeic Acid on the production of IL-8 (pro- inflammatory profile) and IL-4 and IL-10 (anti-inflammatory profile)

Protocols

20-39 years

IL-8 (pg/ml)

IL-4 (pg/ml)

IL-10 (pg/ml)

G

991 ± 89

172 ± 19

178 ± 16

G+NoAD

1.313 ± 120 *

 289 ± 20 *

169 ± 10

G+CA

 120 ± 95 **

 163 ± 17

164 ± 18

40-59 years

IL-8 (pg/ml)

IL-4 (pg/ml)

IL-10 (pg/ml)

G

193 ± 14

159 ± 12

117 ± 14

G+NoAD

246 ± 17*

165 ± 14

107 ± 9

G+CA

132 ± 11*

153 ± 16

 65 ± 4 *

60-80 years

IL-8 (pg/ml)

IL-4 (pg/ml)

IL-10 (pg/ml)

G

75 ± 3

113 ± 10

94 ± 5

G+NoAD

75 ± 4

130 ± 12

84 ± 4

G+CA

 58 ± 2*

104 ± 5

 64 ± 3 *

The values represent the mean ± S.E. Interleukin production was expressed as pg/ml. G = granulocyte, NoAD = Norepinephrine , Ac = Caffeic Acid. (*) and (**) was Significant (p<0.05) and (p<0.01) respectively, when compared with control (G) by ANOVA and Tukey post-test

Table 2. Demographic characteristics of the studied groups.

Subjects

30 Male

30 Female

Parameters

Values (mean ± S.D.)

Values (mean ± S.D.)

Age groups (years)

20-39

32.3 ± 6

ns

29.8 ± 5

40-59

52.1 ± 4

ns

50.2 ± 5

60-80

76,3 ±7

ns

66.9 ± 6

MEDIUM

53,6 ± 6

ns

48.9 ± 5

Body Mass Index (kg/m2)

20-39

22.4 ± 2

ns

21.8 ± 3

40-59

28.8 ± 3

ns

27.5 ± 3

60-80

24.4 ± 3

ns

28.5 ± 4

MEDIUM

25.2 ± 3

ns

25.9 ± 3

Glycohemoglobin (GHb%)

20-39

4.0 ± 0,1

ns

3.9 ± 0,3

40-59

5.4 ± 0,3

ns

5.5 ± 0,3

60-80

5.5 ± 0,4

ns

5.6 ± 0,2

MEDIUM

4.9 ± 0,3

ns

5.0 ± 0,3

Triglycerides (mg/dL)

20-39

102.4 ± 38

ns

101.8 ± 29

40-59

130.0 ± 57

ns

127.7 ± 43

60-80

164.3 ± 20

ns

153.5 ± 23

MEDIUM

132.2 ± 38

ns

127.7 ± 32

Serum creatinine (mg/dL)

20-39

0.979 ± 0,161

ns

0.821 ± 0,161

40-59

0.921 ± 0,152

ns

0.800 ± 0,152

60-80

0.994 ± 0,176

ns

0.900 ± 0,170

MEDIUM

0.965 ± 0,163

ns

0.840 ± 0,161

ns= non-significant by the Mann-Whitney test.

Body Mass index: Normal range= 18,5 – 24,99kg/m2 (World Health Organization, 2000)

Glycohemoglobin: Normal value ≤ 5,7% (American Diabetes Association, 2011)

Triglycerides: Normal range< 150mg/dL (American Heart Association, 2009)

Serum creatinine: Normal range: 0,5-1,5 mg/dL for males and 0,6 – 1,2 mg/dL for females (NCCLS, 2000)

Our results in the age group 40-59 years showed difference (p<0.05) in the production of IL-8 by granulocytes when they were stimulated by NoAD (increase of 27%) or CA decrease of 31%) (Table 1).
In the age group of 60-80 years found no significant difference (p>0.05) was observed for the production of IL-8 when granulocytes were incubated with NoAD. But, CA inhibited IL-8 secretion 22% (p<0.05) in relation the control group.

Effect of NoAD and CA on the production of IL-4 and IL-10: anti-inflammatory profiles

Our results in the age group from 20-39 years, NoAD induced an IL-4’s secretion (68%) by granulocytes in relation to the control group (RPMI + granulocytes) (p<0.05). CA was not effective on IL-4’s secretion. The secretion of IL-10 by granulocytes showed no significant difference (p>0.05) when that cells were stimulated by NoAD or CA (Table 1).

Our results showed age group from 40 to 80 years showed that IL-4 production by granulocytes stimulated by in the presence of NoAD or CA was not affected (p>0.05) (Table 1). Similar results were observed the production of for IL-10 was not significant (p>0.05) granulocytes were incubated with NoAD (Table 2). In the contrast, we observed a significant decrease in IL-10’s secretion by granulocytes (p<0.05) incubated with CA (44% and 32%) in the age group from 40-59 and 60-80 years respectively.

Inhibitory effect of CA on the action of NoAD: process aging dependent?

Our findings clearly show a decrease of CA action on stimulatory effect of NoAD on NO production by human granulocytes during the aging process. We observed in the group from 20-39 years (49% activation), 40-59 years (34% inhibition) and 60-80 years (38% inhibition) effect of CA on NoAD in human granulocytes (Figure 2).

When evaluating the profile of interleukin pro and anti-inflammatory found that a decrease in the running action of CA on the stimulatory action of NoAD in the production of IL-8 by human granulocytes during aging 91% (20-39 years) 54% (40-59 years) and 16% (60-80 years) (Figure 3 and panel A). Evaluating the anti-inflammatory interleukins also found the same profile. IL-4 ranges of 20-39 years (22%), 40-59 years (17%) and 60-80 years (3%) inhibition (Figure 3 and panel B). Our findings with IL-10 showed range of 20-39 years (16% activation), 40-59 years (18% inhibition) and 60-80 years (16% inhibition) effect of CA on NoAD in human granulocytes. (Figure 3 and panel C).

ASMHS2018-101-RaquelCunhaLaraBrazil_F2

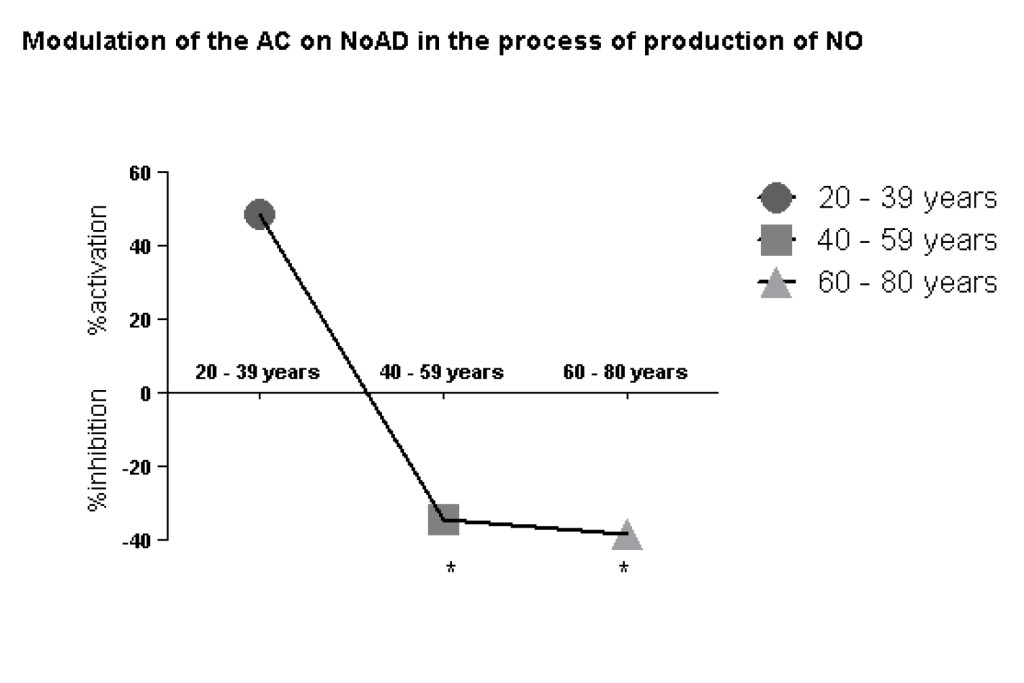
Figure 2. Lack modulating effect of Caffeic Acid on the action of Norepinephrine in Nitric Oxide production: process aging dependent. The values represent the mean ± S.E. Nitric Oxide (NO) production was expressed as mM*Significant (p<0,05) when compared with control (G) by ANOVA and Tukey post-test.

ASMHS2018-101-RaquelCunhaLaraBrazil_F3

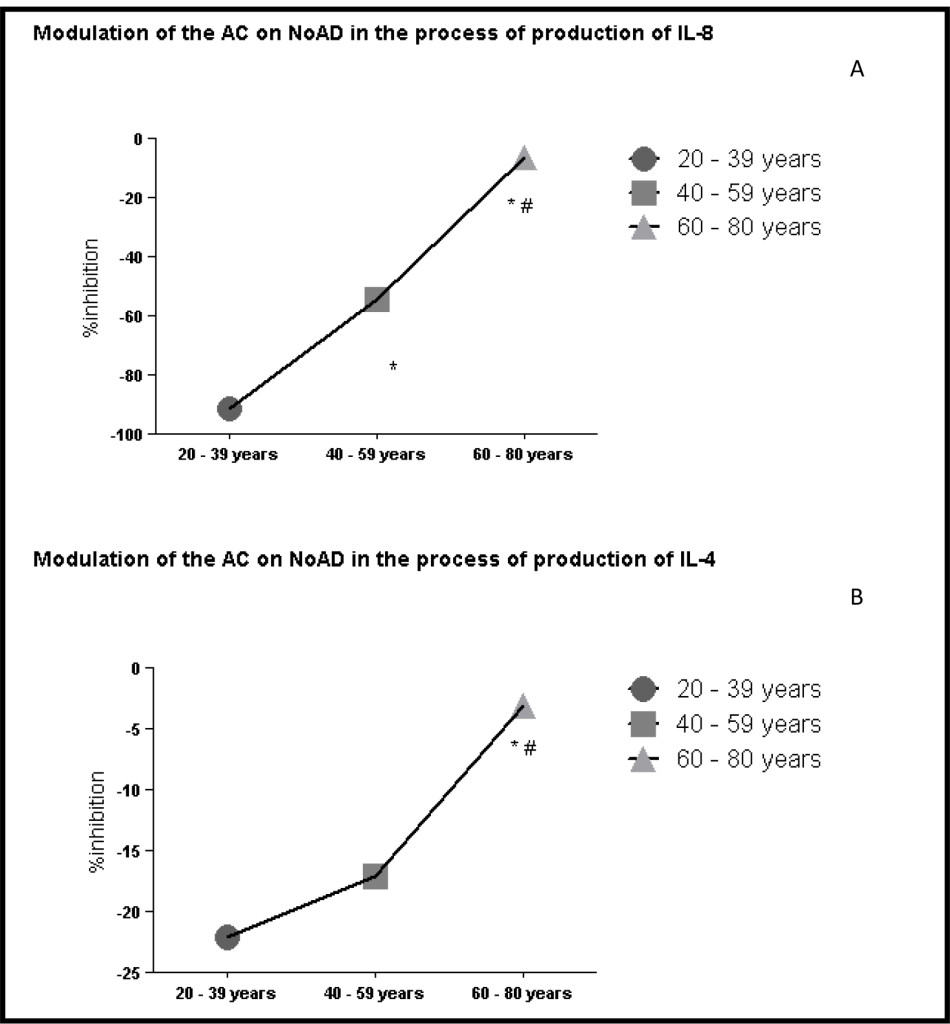
Figure 3. Lack modulating effect of Caffeic Acid on the action of Norepinephrine in Interleukins production: process aging dependent. *Significant (p<0,05) when compared with control (G) by ANOVA and Tukey post-test.

Discussion

The immune system undergoes profound transformations with age, and response patterns to immunological challenges are therefore highly age dependent. Changes that occur in humans after the age of 50 years have received particular attention because of their clinical impact. Such changes have been globally called ‘immunosenescence’. The most widely appreciated consequence of advanced age is diminished effectiveness of the immune system. However, immunosenescence is multifaceted and also includes an enhanced susceptibility to autoimmunity that is conceptually difficult to reconcile with the impaired responsiveness of the adaptive immune system as well as constitutive low-grade inflammation that may contribute to a plethora of degenerative diseases, including cardiovascular disease, neurodegenerative syndromes and age-specific ailments such as frailty [16].

In this context, the immune system has many properties of great importance for survival. The various stimuli captured by the brain during different situations can act beneficial or detrimental on the immune system, triggering a series of reactions with important consequences. Among these stimuli stress deserves [17].

NO is a key signaling molecule in the cardiovascular, immune and central nervous systems (CNS), and crucial steps in the regulation of NO bioavailability in health and disease are well characterized [18]. The generation of NO by neutrophils is involved in its antimicrobial function. This molecule has been identified as a modulator of various signaling cascades that regulate various functions such as adhesion, chemotaxis, phagocytosis, and respiratory burst, modulation of apoptosis and generation of free radicals [19]. Furthermore, NO has a complex physiological role in the CNS and regulating neuroendocrine functions. It has a substantial capacity to affect dopaminergic, serotonergic and noradrenergic neurotransmission [20].
Studies demonstrated that CA modulates endothelial NO production in a dose-dependent manner. In experimental model, kidney ischemia-reperfusion injury, CA in which this compound significantly reduced tubular cell apoptosis and granulocyte infiltration [21]. Our results (Figure 1-panel A) demonstrate that CA is able to activates NO releasing from granulocytes in 20-39 age group.

We also found that there was a significant increase (p<0.05) in the production of NO in the age group from 20-39 years when granulocytes were incubated with NoAD (Figure 1-panel A). Gadek-Michalska and Bugagiski have reported that NoAD increases the in vitro synthesis of NO in the medial basal hypothalamus through α 1-adrenergic receptors [20].

CA increased NO releasing by granulocytes in 20-39 and 40-59 ages groups in similar manner (Figure 1-panel B). CA was able to increase NO levels, thus demonstrating its continuing role as a cell protector, mainly neuroprotective in this age group.

However, when we analyze the in the presence of effect of NoAD verified that this was not significantly (p>0.05), the production of NO was not significantly found in younger individuals (Figure 2-Panels A and B). Here we try to identify some things that may be guiding this failure: 1- failure of the regulatory mechanisms of the HPA axis, 2- a possible inefficiency in awareness receptor α 1-adrenergic stimulation, 3- a deficiency in the NoAD on NO synthase (the enzyme responsible for the synthesis NO).
In the Age group from 60-80 years showed that NoAD and CA were not able to change (p>0.05) the production of NO (Figure 1-panel C). These results may signal that during the aging process there is a reduction of the sympathetic response that may be justified mainly by the decrease in sensitization of adrenergic receptors α 1- adrenergic. It is suggested that changes in the production of NO leads to activation of iNOS (induced NO synthase) generating a pro-inflammatory response that may be one of the factors that contribute to aging and neurodegenerative diseases [22].

Neuroendocrine hormones are considered to play major roles in the regulation of homeostasis under stressful environments. Catecholamines (CAs) including NoAD are the first hormones in response to physiological stress trigger a broad spectrum of biochemical and physiological alterations including hyperglycemia and modulation of immunity. Researchers by Zhang, et al. demonstrated the inhibited immune responses and resistance against bacterial infection were observed in both Litopenaeus vannamei and M. rosenbergii received NoAD by injection [11]. These results illustrate the importance of the sympathetic nervous system in modulating immunological pathological and non-pathological conditions.

Our results showed aged group from 20-39 years increased (p<0.05) the production of IL-8 (proinflammatory cytokine) when granulocytes were stimulated with NoAD (Table 1). When evaluating the production of anti-inflammatory cytokines we observed an increased (p<0.05) the production of IL-4 but not IL-10 (Table 1). These results show that at this age the IL-4 is who participates in these anti-inflammatory mechanisms and that really CAs may modulate the inflammatory profile in young individuals which realize a balance between cytokines pro and anti-inflammatory. These results demonstrate possibly efficient communication between the immune system and the regulation of the HPA axis by neurohormones such as NoAD to maintain balance pro and anti-inflammatory.

Oxidative stress can increase cytokine production via several different mechanisms. Therefore, during the inflammatory process, oxidizing molecules increase the production of interleukins (IL-8 and IL-6) and TNF-alpha in response to inflammatory stimuli and cytokines increase the production of oxidants setting up a vicious cycle [23,24]. In addition to antioxidant defense acts directly or indirectly protecting the body from attacks of cytokines and oxidizing. It is believed that the antioxidants protect indirectly by reducing the activation of signaling pathways, preventing therefore the stimulation of cytokine oxidants [25].

Our results showed that CA significantly decreased (p<0.05), the production of IL-8 in the age group of 20-39 years (Table 1). However we did not observe significant results (p>0.05), when evaluating the production of IL-4 and IL-10. These results showed that CA can act as a potent anti-inflammatory phenolic acid as this could reduce by more than 90% the production of IL-8 in young individuals (Table 1).

Assessing the age group of 40-59 years found that NoAD increased (p<0.05), the production of IL-8 but did not change (p>0.05) the production of both IL-4 and IL-10 (Table 1). The results for CA have shown that this did not affect the production of IL-4, but decreases the production of IL-8 and IL-10 (Table 1).

Aged 60-80 years found that NoAD did not change (p>0.05) the production of IL-8 and neither of the cytokines (p>0.05), IL-4 and IL-10 (Table 1). The results for CA have shown that this did not affect the production of IL-4 but decreases the production of IL-8 and IL-10, as seen in the age group 40-59 years (Table 1).

Our results are reinforce previous results Chaves et. al. on deficiency of IL-10 during the aging process. Moreover, this reduced production of IL-8 by CA may be related to antioxidant mechanisms that are deficient in aging and which is a potent anti-oxidant contribute to the reduction of the framework [6,7].Thus, our results showed here a profile change where we find a framework favoring the balance pro-inflammatory and oxidative signs of senescence, which is characterized as a chronic inflammatory process and stress.

Aging results in a progressive decrease and general functions of the body, decreasing the ability to react to adaptive changes, and maintain homeostasis. Evidences show that the immune system can initiate state oxidative and inflammatory uncontrolled factors which are linked to the aging process and affect all cells of the body but especially neuroimmunoendocrine system cells [26]. Another aspect is that the antioxidant systems may exert a neuroprotective role by protecting the nervous tissue degeneration caused by ischemia or as a result of chronic neurodegenerative diseases [27]. Endogenous antioxidant defenses can be both non-enzymatic (uric acid, glutathione, bilirubin, thiols, albumin, vitamins and phenols) and enzymatic (superoxide dismutases, glutathione peroxidase and catalase) [28]. The levels of glutathione and these antioxidant enzymes are much lower in the CNS as compared to erythrocytes and peripheral tissues [29,30].

Next context to evaluate the modulating effect of CA on the action of NoAD in the production of NO found that aged group from 20-39 years there is an upregulation (increased production of nitric oxide) which can configure the protective action of NO in this age group (Figure 2). However, when we analyzed the age groups from 40-80 years found an inhibition (p<0.05) NO production when CA was incubated with NoAD compared with the age group from 20-39 years (Figure 2). This table denotes a loss of antioxidant CA in these age groups which can cause systemic and nervous damage.

In evaluating the modulating action the CA on NoAD aged group from 20-39 years found that it is able to increase the production of cytokines both pro and anti-inflammatory setting a balance between these systems (Figure 3 – panels A, B and C). When we evaluated the age group from 40-59 years observed a significant decrease (p<0.05) the production of IL-8 and IL-10 and one did not change (p>0.05) the production of IL-4 when compared to age group from 20-39 years (Figure 3-panels A, B and C). In the age group 60-80 years observed a decrease (p<0.05) marked production of both interleukins pro (IL-8) as anti-inflammatory (IL-4 and IL-10) (Figure 3-panels A, B and C). In establishing this framework we realized that NoAD can no longer modulate the inflammatory cytokine profile and that there is a significant decay of the contribution of CA as an antioxidant and / or anti-inflammatory.

Therefore, our findings aid in the elucidation of important metabolic points that are part of neuroimmunoendocrine regulation. The aging reflects the sum of many changes that occur in humans during life. The association between age and decreased function of the immune system increases susceptibility to several neurodegenerative diseases. Within this context our work raised several questions in which demonstrated that there is need for further study the molecular mechanisms that are involved in neuroimmunoendocrine systems especially with regard to the adrenergic pathway because it proved to be important in maintaining homeostasis between the immune endocrine and nervous systems.

Experimental Procedure

Reagents

The concentrations of Interleukin 8 (IL-8), Interleukin 4 (IL-4), and Interleukin 10 (IL-10) were measured by sandwich ELISA using kit supplied by Assay Designs (Ann Arbor, MI, USA).

Subjects

The Ethical Committees of Federal University of Minas Gerais (UFMG) approved this study (CAAE 0663.0.203.000-11). A detailed medical history, physical examination and laboratory data for each subject were recorded four weeks before entering the study. Appropriate informed consent was obtained from each participant. According to the Senior protocol for the study of immune function in the elderly, [31], 45 people were excluded from a total of 105 because they showed conditions which were not suitable for the admission criteria (i.e. smokers, infections, inflammation, malignancy, lymphoproliferative disorders, arteriosclerosis, cardiac insufficiency, hypertension, dementia, pregnancy, alcoholism and drug abuse) and/or were taking known drugs that directly influence the immune function. Subjects were divided into three age groups with 10 males and 10 females in each, aiming equality in the number of subjects from each group, and selected by authors ENM and MTGC (Reference Center of Age – Professor Caio Benjamin Dias from Hospital das Clínicas-UFMG). These subjects live in Belo Horizonte, Brazil. The demographic characteristics of the population are shown in Table 2.

Cell separation

The granulocytes were purified from 10 ml of heparinized venous blood from subjects distributed into tree age groups: 20-39 years, 40-59 years and 60-80 years. The cells were isolated by Ficoll-Hypaque gradient according to Bicalho et al. [32] with slight modifications. Briefly, the neutrophils were separated through the centrifugation of cells over two gradients with density of 1.08 and 1.13 in order to obtain, simultaneously, the separation of mononuclear cells and granulocytes, respectively. The purity of the preparation of granulocytes was 95-100%. The viability of each sample was always greater than 98% as determined by the Trypan Blue exclusion test.

Dose-response curve

A dose-response curve was obtained by adding increasing concentrations of NoAD(10-12 M, 10-11 M, 10-10 M, 10-9 M, 10-8 M, 10-7 M) and CA (13 μM, 32 μM, 80 μM, 200 μM, 500 μM, 1250 μM). The best concentration of NoAD was (10-9 M) and CA (500 μM), which reflected a lower cell death (5% and 7% respectively) and a greater biological effect.

Nitric Oxide (NO) production-Griess reaction

The quantification of nitric oxide was carried out by measuring nitrite second studies by Griess [33]. 100 μL granulocytes were incubated in the presence or absence of NoAD (10-9 M) and CA (500 μM). In all experiments the final volume was adjusted to 300μl with RPMI pH 7.4. Granulocytes were maintained in cell culture plates of 24 wells, incubated at 37° C and 5% CO2 for 16 h. After these 16 hours, the granulocytes were centrifuged at 2500 rpm for 15 minutes. The supernatant was collected and used for determination of nitrite. The pellet was resuspended in 200μl of RPMI pH 7.4 and immediately subjected to cell viability analysis. For measurement of nitrite, 100 μL of supernatant was used, which were placed in 96-well plates. To the supernatant was added 100 μL of a solution Griess, which is formed sulfanilamide 1% in 2.5% phosphoric acid and 0.1% naphthylethylenediamine in 2.5% phosphoric acid in a 1: 1 ratio. The contents of the plate were analyzed by ELISA reader at 540 nm. The nitrite concentration was calculated by linear regression using a standard curve obtained from a solution of sodium nitrite and 1mM RPMI.

Determination of IL-8, IL-4 and IL-10 in the supernatant of Granulocytes

Aliquots (3 mL) of the suspension of granulocytes (1 x 10⁶ cells/100 µL RPMI-1640 medium) were incubated in the presence or absence of NoAD or CA under 5% CO2 for 16 hours at 37oC. Following incubation, the cells were centrifuged and the supernatant, collected. The concentrations of IL-8, IL-4 and IL-10 were measured by sandwich ELISA using kit supplied by Assay Designs (Ann Arbor, MI, USA) according to supplier instructions. The levels of cytokine were determined using standard curves for IL-8, IL-4 and IL-10, respectively.

Statistical analysis

All results were analyzed by ANOVA and Tukey post-test using GraphPad Prism version 5.00 for windows (San Diego, CA). p<0.05 was considered to indicate statistical significance.

Conflict of interest: The authors confirm that this article content has no conflict of interest.

Acknowledgements: The authors thank Gláucia A.A. Carvalho for excellent technical assistance. FAPEMIG CNPq and IVC Health- testes em saúde humana LTDA supported this paper.

References

  1. Pereira A, Freitas C, Mendonça C, Marçal F, Souza J, et al. (2004) Aging, stress and society: a psychoneuroendocrine view. Science and Cognition 1: 34–53.
  2. Vitale G, Salviole S, Franceschi C (2013) Oxidative stress and the ageing endocrine system, Nature Rev Endocrinol 9: 228–240. [crossref]
  3. Campisi J (2013) Aging, Cellular Senescence, and Cancer. Annu Rev Physiol 75: 685–705. [crossref]
  4. Hoffmann J, Spyridopoulos I (2015) Senescent cytotoxic T cells in acute myocardial infarction: innocent bystanders or the horsemen of apocalypse? Cell Mol Immunol 12: 510–512. [crossref]
  5. Harman D (1981) The aging process. Medical Science Proc Natl Sci US 78: 7124–7128. [crossref]
  6. Chaves MM, Costa DC, Oliveira BF, Rocha MI , Nogueira-Machado JA (2009) Role PKA and p38 MAPK on ROS production in neutrophil age-related: Lack of IL-10 effect in older subjects. Mech Ageing Dev 130: 588–591. [crossref]
  7. Chaves MM, Rocha-Vieira E, Lima e Silva R, Machado-Nogueira JA (1998) Host defenses in aged: evaluation of the balance between oxidizing species generation and reducing power in phagocyting human granulocytes. Mech Ageing Dev 104: 103–109.
  8. Chaves MM, Rocha-Vieira E, Reis AP, Lima e Silva R, Gerzstein NC, et al. (2000) Increase of reative oxygen (ROS) and nitrogen (RNS) species generated by phagocyting granulocytes related to aged. Mech Ageing Dev 119: 1–18.
  9. Alves GJ, Palermo J (2007) Neuroimmunomodulation: the cross-talk between the nervous and immune system. Rev Brasil Psiquiatr 29.
  10. Chang CC, Tsai WL, Jiang JR, Cheng W (2015) The acute modulation of norepinephrine on immune responses and genes expressions via adrenergic receptors in the giant freshwater prawn, Macrobrachium rosenbergii. Fish Shellfish Immunol 46: 459–467. [crossref]
  11. Zhang M, Zhou J, Wang L, Li B, Guo J, et al. (2014) Caffeic Acid Reduces Cutaneous Tumor Necrosis Factor Alpha (TNF α),IL-6 and IL-1β Levels and Ameliorates Skin Edema in Acute and Chronic Model of Cutaneous Inflammation in Mice. Biol Pharm Bull 37: 347–354. [crossref]
  12. Minciullo PL, Catalano A, Mandraffino G, Casciaro M, Crucitti A, et al. (2015) Inflammaging and Anti-Inflammaging: The Role of Cytokines in Extreme Longevity. Arch Immunol Ther Exp (Warsz) 64: 111–126. [crossref]
  13. Mallik SB, Mudgal J, Nampoothiri M, Hall S, Dukie SA, et al. (2016) Caffeic acid attenuates lipopolysaccharide-induced sickness behaviour and neuroinflammation in mice. Neurosci Lett 632: 218–223. [crossref]
  14. Tracey KJ (2009) Reflex control of immunity. Nat Rev Immunol 9: 418–428. [crossref]
  15. Szelényi J, Vizi ES (2007) The catecholamine cytokine balance: interaction between the brain and the immune system. Ann N Y Acad Sci 1113: 311–324. [crossref]
  16. Goronzy JJ, Weyand CM (2013) Understanding immunosenescence to improve responses to vaccines. Nat Immunol 14: 428–436. [crossref]
  17. Bauer ME (2005) Stress, glucocorticoids and ageing of the immune system stress. Stress 8: 69–83. [crossref]
  18. Lundberg JO, Gladwin MT, Weitzberg E (2015) Strategies to increase nitric oxide signalling in cardiovascular disease. Nat Rev Drug Discov 14: 623–641. [crossref]
  19. Kobayashi SD, Deleo FR (2009) Role of neutrophils in innate immunity: a systems biology-level approach. Wiley Interdiscip Rev Syst Biol Med 1: 309–331. [crossref]
  20. Gadek-Michalska KA, Bugajski G (2008) Nitric oxide in the adrenergic-and crh-induced activation of hypothalamic-pituitary-adrenal axis. J Physiol Pharmacol 59: 365–378. [crossref]
  21. Migliori M, Cantaluppi V, Mannari C, Bertelli AA, Medica D, et al. (2015) Caffeic Acid, a Phenol Found in White Wine, modulates Endothelial Nitric Oxide Production and Protects from Oxidative Stress-Associated. Endothelial Cell Injury. PLoS One 10. [crossref]
  22. Navarro A, Boveris A (2008) Mitochondrial nitric oxide synthase mitochondrial brain dysfunction in aging and mitochondrial-targed antioxidants. Adv Drug Deliv Rev 60: 1534–1544. [crossref]
  23. Elmarakby AA, Sullivan JC (2012) Relationship between Oxidative Stress and Inflammatory Cytokines in Diabetic Nephropathy. Cardiovasc Ther 30: 49–59. [crossref]
  24. Bianca VD, Dusi S, Bianchini E (1999) Beta- amyloide activates the o-2 forming NADPHoxidase in microglia, monocytes,neutrophils. A possible inflammatory mechanism of neuronal damage in Alzheimer’s disease. J Biol Chem 274: 15493–15499. [crossref]
  25. Grimble RF (1994) Nutritional antioxidants and the modulation of inflammation: theory and practice. New Horiz 2: 175–185. [crossref]
  26. De La Fuente M, Miquel J (2009) An update the oxidation-inflammation theory of aging: the involvement of the immune system in oxi-inflamm-aging. Curr Pharm Des 15: 3003–3026. [crossref]
  27. Rafii MS, Aisen PS (2009) Recent developments in Alzheimer’s disease therapeutics. BMC Med 7: 7. [crossref]
  28. Fusco D, Colloca G, Lo Monaco MR, Cesar M (2007) Effects of antioxidant supplementation on the aging process, Clin Interv Aging 2: 377–387. [crossref]
  29. Floyd RA , Hensley K (2002) Oxidative stress in brain aging. Implications for therapeutics of neurodegenerative diseases. Neurobiol Aging 23: 795–807. [crossref]
  30. Chalimoniuk M, Jagsz S, Sadowska-Krepa E, Chrapusta SJ, Klapcinska B, et al. (2015) Diversity of endurance training effects on antioxidant defenses and Oxidative damage in different brain regions of adolescent male rats. J Physiol Pharmacol 66: 539–547. [crossref]
  31. Ligthrt GJ, Corberand JX, Fournier C, Galanaud P, Hijmans IN, et al. (1984) Admission criteria for immunogerontological studies in man the senieur protocol. Mech Ageing Dev 28: 47–55. [crossref]
  32. Bicalho HMS, Gontijo MC, Nogueira-Machado JA (1981) A simple techinique for simultaneous human leockocytes separation. J Immunol 40: 115-116.
  33. Griess P (1864) One a new of bodies in which nitrogen is substituted for hydrogen. Philos Trans R Soc Lond 154: 667–723.

Osteosarcoma of Eighth Rib: A Case Report

DOI: 10.31038/CST.2018313

Abstract

In children and adolescents, primary osteosarcoma is one of the most common malignant bone tumors. It principally affects the long bones, especially in the distal femur, proximal tibia and proximal humerus. Osteosarcoma rarely arises from flat bone, and as in this patient’s case, osteosarcoma of the rib is very infrequent.  To the best of our knowledge, this is the first reported case of rib osteosarcoma in our country. Here we report a case of conventional rib osteosarcoma presenting as chest pain and mass that successfully had complete pathologic response with clear margins after four cycles of neoadjuvant therapy.

Introduction

Osteosarcomas principally originate in the metaphysis of the long bones. Approximately 10% of osteosarcomas originate in the flat bones, with the pelvis being the main site. Roughly 1 – 2% of osteosarcoma occur in the thoracic bones inclusive of the ribs, sternum, and clavicle [1].  The prevalence of osteosarcoma is in the second decade of life with another spike in older individuals after radiation or Paget’s disease [2]. Osteosarcoma of the rib have been reported in older children ranging from 7 to 13 years of age [3].  Diagnosis of osteosarcoma of the rib is a challenge for most physicians since the commonest presentation is pain and a palpable chest wall mass. The lesion is usually observed on a chest radiograph as a soft tissue mass. Limiting factors for its diagnosis is the difficulty visualizing typical periosteal reaction, rib destruction and calcifications within the mass in a chest radiograph compared to the site of the tumour if it were in a long bone. We present rare location of an osteosarcoma which posed a diagnostic challenge to both the pathologist and the physician in a young male.

Case Report

This is a case of an 18 year old Filipino male, apparently well until two months before consult, noted intermittent right upper quadrant pain. He later palpated a pea sized firm, movable, non-tender mass at the right upper quadrant area. Neither medications nor consult done until two months later noted gradual progression of the mass. It was approximately 3 x 3 cm in size with intermittent pain and occasional dyspnea. Consult done to a local hospital where chest radiograph was done revealing right pleural effusion. Underwent chest thoracostomy tube insertion was cytology negative for malignancy. Chest Computed tomography (Figure 1) done June 2016 revealed lobulated heterogenously enhancing mass lesion in antero-inferior aspect of right hemithorax measuring 5.3x 5.4 x 5.01 cm. Right paratracheal subcentimeter lymph nodes. Abdominal CT scan was unremarkable. Patient underwent excision biopsy of the mass at eighth rib revealed conventional osteosarcoma, osteoblastic type high grade
(Figures 2 and 3). Tumor size of 3.5 cm, no definite vascular invasion with tumor invasion into extra-osseous soft tissues and present in inked tissue edges. Diaphragmatic tumor was also noted to be high grade osteosarcoma.

CST2018-102-AmabelleTrinaGeronaPhilippines_F1

Figure 1. lobulated heterogeneously-enhancing mass lesion in the antero-inferior aspect of the right hemithorax measuring 5.3 × 5.4 × 5.01 cm   in cranio-caudad, transverse and antero-posterior diameters. Mass cannot be separated from the expanded and lytic change anterior aspect of the right 8th rib with associated overlying soft tissue swelling and indentation into the superior-anterior margin of right hepatic lobe

CST2018-102-AmabelleTrinaGeronaPhilippines_F2

Figure 2. Low power field magnification

CST2018-102-AmabelleTrinaGeronaPhilippines_F3

Figure 3. High power field magnification several highly atypical spindle cells producing tumor osteoid. The cells have enlarged, hyperchromatic nuclei with prominent nucleoli. Brisk mitotic activity is seen.

He was referred to a Medical Oncologist where he underwent four sessions of neoadjauvant chemotherapy from June 23-August 29, 2016 with Doxorubucin (25mg/m2) and Cisplatin (50mg/m2) days 1-3 every 21 days. He tolerated the therapy well, no adverse events. Re-evaluation scans done September 27, 2016 showed Interval resolution of right sided pleural effusion. Right 7th anterior rib is surgically absent with stable post interventional change in right serratus anterior muscle. He was then referred to Thoracic Surgeon for surgery. Pre-operative pulmonary function test was unremarkable. He underwent video-assisted thoracic surgery, right converted to thoracostomy with chest wall reconstruction using bone cement for four hours and 26 minutes. Post-operative findings were dense pleural adhesions from apex down to diaphragm, no gross tumor noted along chest wall, diaphragm and pleura. Resection extended one rib above and one rib below (6th and 8th ribs). Specimen was sent to histopathology laboratory with later findings of fibrosis, haemorrhage and negative for tumor of pleural nodule and right lateral chest wall (Figures 4, 5 & 6).  No residual tumor and negative lines of resection for the 6th and 8th ribs.

CST2018-102-AmabelleTrinaGeronaPhilippines_F4

Figure 4. Pleural Nodule, Right, Lateral Chest Wall, Diaphragm: Fibrosis, Old haemorrhage. No tumor present

CST2018-102-AmabelleTrinaGeronaPhilippines_F5

Figure 5. Ribs 6-8th, chest wall resection: No residual tumor, fibrosis, granulation tissue

CST2018-102-AmabelleTrinaGeronaPhilippines_F6

Figure 6. Pleural Nodule, Diaphragm, Right, Parietal Pleura: fibrosis and granulation tissue formation. Negative for tumor

Surveillance studies done on the 3rd, 6th and 9th month post-surgery were unremarkable. Chest CT scan (Figure 7) done did not show discrete enhancing mass in the anterolateral chest wall to suggest tumor recurrence and enlarged lymph nodes. Latest CT scan done July 21, 2017. Patient is back to school with no symptoms.

CST2018-102-AmabelleTrinaGeronaPhilippines_F7

Figure 7. Surveillance chest CT scan: The RIGHT antero-lateral 6th to 8th ribs are surgically absent. No pulmonary mass or nodule.

Discussion

Chest computerized tomography examination is useful for identification and characterisation of the mass. Invasion to deeper structures like the muscles, pleura and lungs can also be accurately assessed with the aid of a CT scan as compared to plain radiograph. CT would be a more cost effective modality for evaluating the tumour since a magnetic resonance imaging (MRI) may not offer any additional information.3  Therefore, accurate diagnosis is an essential component in survival of these patients. Histopathological diagnosis is imperative in instituting a definite therapy. The classic feature of a ramifying osteoid matrix laid down by the neoplastic cells clinches the diagnosis and enables one to exclude all the other possible differentials.

Conventional osteosarcomas are the most aggressive osseous neoplasms. The overall prognosis of osteosarcoma in flat bones remains poor because of the difficulty of complete excision. The guidelines for management and the prognosis and survival rates in rib primary OS is not clear due to the small number of cases studied. However, there is documentation of better survival in patients who have had a complete resection of their tumor at the time of surgery [4]. A local wide excision with removal of the involved ribs and subsequent reconstruction using a mesh followed by adjuvant chemotherapy and radiotherapy may improve survival in these patients. Although osteosarcoma of flat bones is rarely associated with metastasis, it is still advised to include a CT scan of the thorax, chest x-rays, and bone scans as part of the diagnostic tool in order to look for metastasis.

The treatment of osteosarcoma generally consists of local excision with a wide margin [5]. It still remains to be unresolved exactly what size of margin is optimal. Palliative chemotherapy or radiotherapy may also be considered for those who undergo a palliative surgery since >80% of patients, local recurrence appears in the absence of a wide resection.

Conclusion

This case highlights the importance of including the diagnosis of osteosarcoma, although rare, as a differential diagnosis of primary malignant neoplasm of the rib. Point tenderness in the young also warrants further investigation for it may just be the sole manifestation of a treatable case as morbid as malignancy.

References

  1. Mirra JM, Gold RH, Picci P (1989) Osseous tumors of intramedullary origin. In: Mirra JM, editor. Bone Tumors: Clinical, Radiological, and Pathological Correlations. Philadelphia: Lea and Febiger; 143–438.
  2. Burt M,  Fulton M, Wessner-Dunlap S, Karpeh M, Huvos AG, et al. (1992) Primary bony and cartilaginous sarcomas of chest wall: results of therapy. Ann Thorac Surg 54: 226–232. [crossref]
  3. Deitch J,  Crawford AH, Choudhury S (2003) Osteogenic sarcoma of the rib: a case presentation and literature review. Spine (Phila Pa 1976) 28: E74–77. [crossref]
  4. Xu, J. and Yao, Q. and Hou, Y. and Xu, M. and Liu, S. and Yang, L. and Zhang, L. and Xu, H (2013) MiR-223/Ect2/p21 signaling regulates osteosarcoma cell cycle progression and proliferation. Biomedicine and Pharmacotherapy. 67: 381–386
  5. Funovics PT, Bucher F, Toma CD, Kotz RI, Dominkus M (2011) Treatment and outcome of parosteal osteosarcoma: biological versus endoprosthetic reconstruction. J Surg Oncol 103:782–9.

Cushing’s Disease (Micro-Adenoma) Associated with Sudden Blindness in a Dog

DOI: 10.31038/CST.2018312

Abstract

An overlap clinical and biochemical can occur between dogs with sudden acquired retinal degeneration syndrome (SARDS) and those with blindness by hyperadrenocorticism (HAC). A 13-year-old, cross-breed female dog showing recent signs of polyphagia, swollen abdomen and sudden blindness was examined. The flat electroretinography was consistent with bilateral retinal damage. The biochemical tests for the diagnosis of HAC were inconclusive when the blindness was established. However, HAC was confirmed two months after through the urine cortisol: creatinine ratio (UCCR: 69.4 × 10⁻⁶, RV: <10), plasmatic cortisol 1-hour post-ACTH (21.7 µg/dl, RV: <17) and 8-hour post-low dose dexamethasone suppression test (LDDST: 2.9 µg/dL, RV: <1.5). A basophilic microadenoma of the adenohypophysis (2.3 x 1.3 mm) with immunopositivity for ACTH was identified by histopathology. The final diagnosis was pituitary-dependent hyperadrenocorticism (PDH). This report, demonstrates through histopathology the association between a corticotropinoma and the sudden blindness by retinal damage in a dog with Cushing’s syndrome. In addition, it highlights the importance of timely use of the various hormonal tests for the correct diagnosis of HAC.

Keywords

ACTH, electroretinography, hyperadrenocorticism, pituitary, SARDS

Introduction

Sudden blindness with normal ophthalmoscopy and absence of electroretinography (ERG) response may be seen in dogs with PDH, but also with SARDS [1-4]. Likewise, dogs with SARDS may display systemic signs of HAC such as polyphagia (PF), polyuria (PU), polydipsia (PD), weight gain and biochemical changes (e.g., increase in serum alkaline phosphatase [SAP], total cholesterol [TChol]) in more than 80% of cases [3,4]. In the light of these arguments, there is a clear clinical and biochemical overlap between these two entities where blindness is irreversible [4]. In PDH cases, non-treatment may lead to the onset of numerous comorbidities (e.g., diabetes mellitus, hypertension, dyslipidemia) that can dramatically decrease survival [3, 5]. The confirmation or exclusion of its diagnosis is therefore essential.

This case offers the first histopathological evidence of the connection between a functional corticotropinoma (micro-adenoma) and sudden blindness caused by retinopathy.

Case report

A 13-year-old, cross-breed, neutered female dog weighing 12.5 Kg was referred for evaluation for sudden blindness. Additionally, it suffered from PF (two weeks before blindness), muscle atrophy in limbs, swollen abdomen and excessive panting (Figure 1). Negative response to threat test, slightly mydriatic pupils, photomotor reflex negative response, normal fundus with intraocular normotension and a flat ERG were consistent with retinal injury (Figure 2). Increased SAP (450 UI/ml, RV: < 250), TChol (250 mg/dl, RV: < 220) and decreased urine density (1022, RV: > 1030) were the only changes in the biochemistry and the hemogram (Table 1). Slightly increased UCCR with plasmatic cortisol suppression 8 hours post LDDST and normal adrenal glands in the ultrasonography ruled out HAC on the first examination (Table 1).

Table 1. Biochemical diagnosis and follow-up of Cushing disease

Parameter

Day

Reference

1

60

120*

 Values

Adrenal axis evaluation

UCCRa/b

13.7

69.4

42.3

<10

Coa

5.2

1.0-4.5

Co4h-LDDSTa

<1.0

<1.5

Co8h-LDDSTa

1.4

2.9

< 1.5

Co1h-ACTHa

21.7

<17

pACTHa

48

5-60

SAPb

450

498

309

<250

BAW

6.8

7.7

9.1

< 7.4

Metabolic profile

TCholb

250

322

221

< 220

Tgb

77

173

102

< 120

Gb

73

96

89

< 125

SP/DP

145/90

160/95

150/80

<150/<90

W

12.4

13.6

13.0

UPC

0.2

0.7

0.3

< 0.3

UCCR: urine cortisol/creatinine ratio (x10-6); Co: plasma cortisol (µg/dl); Co4h-LDDST: Co at 4 hours post LDDST; Co8h-LDDST: Co at 8 hours post LDDST; Co1h-ACTH: Co at 1 hours post ACTH; pACTH: plasma adrenocorticotropic hormone (pg/ml); SAP: seric alkaline phosphatase (UI/l); BAW: bilateral adrenal width (mm); TChol: total colesterol (mg/dl); Tg: triglycerides (mg/dl); G: glucose (mg/dl); SP/DP: systolic and diastolic pressure (mmHg); W: weight (Kg); UPC: urinary protein creatinine; a: chemiluminescence; b: spectrophotometry; *: under treatment with Cabergoline and ketoconazole (0.07 mg/Kg PO q72h and 10 mg/kg PO q24h, respectively).

Two months later, in view of the development of PU, PD, compounded with weight gain, a second examination on the adrenal axis was performed, and the plasmatic cortisol 1-hour post-ACTH and 8-hour post-LDDST was found to be consistent with HAC (Table 1). Plasmatic ACTH (pACTH: 48 pg/ml, RV: 5-60) was found to be improperly high vis-a-vis the UCCR (69.4×10⁻⁶, RV: <10). Unlike the findings of the first examination, an increase in triglycerides (Tg), systolic pressure, diastolic pressure and the urine protein: creatinine ratio became evident (Table 1).

Based on the previous findings, PDH was deduced and cabergoline was then administered as treatment (0.07mg/Kg PO q72h) [6] and Ketoconazol (10 mg/kg PO q12h, tolerated dose) [3]. The biochemical and clinical follow-up performed two months later revealed a reduction of clinical signs (PU, PD and PF), the normalization of TChol, Tg, blood pressure, and a reduction of SAP and UCCR (Table 1). Likewise, hyperplasia of both adrenal glands was observed in the ultrasonography. Shortly afterwards, an accidental fall, favored by the blindness, resulted in a hip fractured that precipitated the humanitarian euthanasia of the animal. The owners authorized a transsphenoidal extraction of the pituitary and both adrenal glands by celiotomy. The extracted pituitary showed normal appearance and a whitish nodule on its outer edge (Figure 3), and both adrenal glands evidenced a size increase.

 Normal adenohypophysis, in histological sections stained with hematoxylin-eosin (HE), consisted of a chain of globose-polyhedric cells arranged on a delicate fibrovascular stroma (Figure 4). In the periphery of the adenohypophysis, a proliferation of polyhedral cells organized in three to four rows of dense trabeculae of delicate fibrovascular stroma was found, which presented low pleomorphism, broad basophilic cytoplasm and a nucleus rounded with an evident nucleolus (Figure 5). These cells were organized in a larger, well-circumscribed, unencapsulated lobe, corresponding to an adenoma (2.34 x 1.3 mm) (Figure 6). The cells that make up the adenoma demonstrated intense positive cytoplasmic staining with the anti-ACTH antibody (mouse monoclonal, sc-52.980, Santa Cruz Biotechnology, Santa Cruz, CA, USA [1: 400 in PBS]) (Figure 7). Hiperplasia of the fascicular and reticular zones was found in both adrenal glands (Figure 8).

CST2018-101-VictorCastillo_F1

Figure 1. External aspect, bitch with pituitary-dependent hyperadrenocorticism and sudden blindness.

Figure 2. Electroretinography record showing flat waves in both eyes.

CST2018-101-VictorCastillo_F2

Figures 3-7. Pituitary, dog.

Figure 3. Macroscopic aspect of the pituitary and micro adenoma (arrows) after being fixed in 10% formaldehyde. n: neurohypophysis. a: adenohypophysis.

Figure 4. Microphotography normal adenohypophysis. A chain of globose-polyhedral cells, arranged in a delicate fibrovascular stroma. Hematoxylin-Eosin (H-E).

Figure 5. Microphotography basophilic adenoma composed of polyhedric cells with ample basophilic cytoplasm, arranged in thick trabeculae. H-E.

Figure 6. Microphotography pituitary with a basophilic adenoma of 2.3 x 1.3-mm (arrows) in adenohypophysis (a). ih: intermediate hypophysis. n: neurohypophysis. H-E.

Figure 7. Microphotography corticotropinoma cells with intense positive cytoplasmic staining with anti-ACTH antibody. Immunohistochemistry, Avidin-Biotin-peroxidase complex.

Figure 8. Microphotography adrenal cortex, diffuse hyperplasia fascicular zone (fz) and reticular zone (rz) with normal glomerular zone (gz). m: adrenal medulla (H-E).

Discussion

In this case, the sudden blindness, the absence of structural damage in both eyes, the integrity of optic chiasma (necropsy), the abolished ERG, the presence of systemic clinical signs (PF, PU, PD, weight gain) and the changes in biochemistry (SAP and TChol) were findings consistent with PDH, but also with SARDS [1,7]. The confirmation of PDH two months later the first evaluation using the same endocrine tests (LDDST and UCCR) was a peculiar finding. This fact highlights the advisability of performing a second endocrine evaluation in dogs with HAC signs and sudden blindness with inconcluse tests diagnostic, where a stimulation test should also be performed with ACTH [7], prior to reaching to any incorrect diagnosis of SARDS.

Images of the pitutary gland through computed tomography or magnetic resonance were no realizated; but the pituitary origin was deduced in view of plasma ACTH levels in connection with the increased UCCR and the absence of neoplastic injury to the adrenal glands. Additionally, it must be noted that even when using the CT and the MRI, pituitary tumors may not be detected in 28% to 37% of dogs with PDH [8,9]. Subsequently in the histopathology was confirmed the corticotropinoma. The basophilic staining characteristics obtained with the hematoxylin-eosin in the adenoma were compatible with the thyrotropic, gonadotropic or corticotropic cells, but the only cells ones of these that are immunopositive to anti-ACTH antibody are the corticotropic [10,11].

Like the blind dogs with PDH reported by Blatter [1], hypertriglyceridemia and hypercholesterolemia were found in this bitch in the second biochemical evaluation, but not at time of the onset of blindness. Other metabolic alterations mentioned in the retinopathy of dogs with Cushing’s disease are the increase in concentration of insulin, interleukin 6, and decrease in nitric oxide and adiponectin [2]; all of these except for insulinemia are not routinely used in the daily clinic, so their contribution to the development of blindness in this case could not be proven.

A limitation of this report is the retinal histopathological examination that could not be done due to conditions established by the owners in light of the need to extract both eyes.

Although the mechanism by which HAC induces sudden blindness in the dog is not well clarified, it is important to emphasize that its correct diagnosis and management of various comorbidities is fundamental to improve the survival of those dogs.

Finally, in dogs with sudden blindness, hypertension and dyslipidemia but with inconclusive diagnostic tests for HAC, it is recommended to carry out a timely medical and pharmacological management of each of the comorbidities, as well as a subsequent reevaluation of the adrenal axis.

References

  1. Cabrera Blatter MF, Del Prado B, Gallelli MF, D´Anna E, et al. (2012) Blindness in dogs with pituitary dependent hyperadrenocorticism: relationship with glucose, cortisol and triglyceride concentration and with ophthalmic blood flow. Res Vet Sci 387–392.
  2. Cabrera Blatter MF, Del Prado B, Miceli DD, Gomez N, et al. (2012) Interleukin-6 and insulin incrase and nitric oxide and adiponectin decrease in blind dogs with pituitary-dependent hyperadrenocorticism. Res Vet Sci 1195–1202.
  3. Feldman EC. Canine Hyperadrenocorticism (2015) In: Feldman EC, Nelson RW, Reusch CE, Scott-Moncrieff JCR, Behrend E. Canine & Feline Endocrinology, 4th ed. St. Louise, Missouri, USA: Elsevier, 377–451.
  4. Komáromy AM, Abrams KL, Heckenlively JR, Lundy SK, et al. (2016) Sudden acquired retinal degeneration syndrome (SARDS)–a review and proposed strategies toward a better understanding of pathogenesis, early diagnosis, and therapy. Vet Ophthalmol 19 : 319–31.
  5. Miceli DD, Pignataro OP, Castillo VA (2017) Concurrent hyperadrenocorticism and diabetes mellitus in dogs. Res Vet Sci 115: 425–431. [crossref]
  6. Castillo VA, Gómez NV, Lalia JC, Cabrera Blatter MF, García JD (2008) Cushing’s disease in dogs: cabergoline treatment. Res Vet Sci 85: 26–34. [crossref]
  7. Carter RT, Oliver JW, Stepien RL, Bentley E (2009) Elevations in sex hormones in dogs with sudden acquired retinal degeneration syndrome (SARDS). J Am Anim Hosp Assoc 45 : 207–14.
  8. Wood FD, Pollard RE, Uerling, Feldman EC (2007) Diagnostic imaging findings and endocrine test results in dogs with pituitary- dependent hyperadrenocorticism that did or did not have neurologic abnormalities: 157 cases (1989–2005). J Am Vet Med Assoc 231: 1081–1085.
  9. Auriemma E, Barthez PY, Van der Vlugt-Meijer RH, Voorhout G (2006) Computed tomography and low-field magnetic resonance imaging of the pituitary gland in dogs with pituitary-dependent hyperadrenocorticism: 11 cases (2001–2003). J Am Vet Med Assoc 235: 409–414.
  10. Jaime MN, López FIA, Cabrera GP (2003) Patología de los adenomas hipofisarios. Rev Esp Patol 36: 357–372.
  11. Thomas JR, Gröne A (2016) Pituitary glands. In: Jubb KBF, Kennedy PC, Palmer NC. Pathology of domestic animals, 6th ed. St. Louise, Missouri, USA: Elsevier 276–290.

A Case of T-Cell Lymphoma in a Wild-Caught Female Chacma Baboon (Papio Ursinus)

DOI: 10.31038/IJVB.2018212

Abstract

A wild-caught adult female Chacma baboon (Papio ursinus) developed weight loss, general weakness, and anorexia. Clinical examination revealed numerous firm subcutaneous nodules and generalized lymphadenomegaly. Biopsies were taken for histopathology and sections were processed with immunoperoxidase staining for CD3 (T-cell) and CD20 (B-cell) markers. There was strong and widespread positive staining for CD3. Based on the clinical and histopathologic findings, and the positive immunocytochemical results, the diagnosis was T-cell lymphoma and the animal was euthanized. Although the type of T-cell was not established, this case resembled human T-cell lymphoma (HTLV) with similarities in the clinical onset and histopathology resembling simian T-cell (STLV) as previously reported in two Vervet monkeys from the same facility.

Keywords

leukaemia, human lymphoma, T-cell lymphoma, Primate T-lymphotropic virus, Simian T-lymphotropic virus, non-human primates, Chacma baboon

Introduction

Human T-cell lymphotropic virus (HTLV) has been implicated in several diseases. Four HTLV sub-types have been identified. HTLV-1, a C-type retrovirus, and associated with adult T-cell leukaemia/lymphoma (ATL) [1], is characterized by the malignant proliferation of CD4 + T lymphocytes. The symptoms include hypercalcemia, lymphadenopathy, subcutaneous nodules [2] and the involvement of the liver or the spleen [3]. The HTLV-1, human T-cell lymphotropic virus type II (HTLV-II) and simian T-cell lymphotropic virus type I (STLV-1) belong to a group of viruses that have been classified as primate T-cell lymphotropic virus type I (PTLV-1) [4].

Antibodies against HTLV antigens have been found in several Old World primate species such as Japanese macaques [5], rhesus macaques, crab-eating macaques [6] and baboons [7]. Miyoshi [8] reported 10-50% of macaque species are seropositive for HTLV. Additionally, antibodies against HTLV-1 were also described in an African green monkey (Vervet monkey) and baboons [9, 10]. Several reports indicate that many, but not all, troops of Old World primates in Asia and Africa, both in the wild and in captivity, have antibodies to HTLV-1. There is evidence of transmission of HTLV-1 between human and non-human primates [9] and cross-species transmission among primates such as between Vervet monkeys and Chacma baboons [10].

Simian T-cell lymphotropic virus (STLV) is a C-type member of the coronavirus subgroup of retroviruses and was identified shortly after the initial isolation of HTLV-1 [11]. As the case with HTLV-1, many Old World primates from Asia and Africa also harbour STLV-1 that is closely related to HTLV-1 [12]. STLV-1 can cause an ATL-like pathology in infected monkeys. The former was found in several wild-caught baboon species [12, 13, 14] and Vervet monkeys [4]. One study reported an infection rate of 40% in a captive baboon population from the Southwest Foundation for Biomedical Research (SFBR) [12]. Furthermore, cross-species transmission of STLV-1 from wild-caught Chacma baboons and Olive baboons have been reported [14] as has interspecies transmission of Rhesus macaques to Hamadrya baboons after an outbreak of malignant lymphoma in the baboons of Sukhumi Primate Centre [15]. The author suggested the possibility that the transmission episodes occurred after capture and it remains unclear whether natural STLV-1 isolates exist in the wild. Most studies in New World primates have failed to find STLV.

Whilst some infected animals remain in a stage of latency and asymptomatic, there are some reports of malignant lymphoma cases in non-human primates such as baboons [11, 16] and Vervet monkeys [17, 15, 9, 18]. The Sukhumi outbreak was the largest outbreak of a malignant disease described in non-human primates [16]. By 1992, more than 300 baboons had died of malignant lymphoma and in a later investigation by Voevodin [15] [20], it was suggested that the Rhesus type STLV-1 was the most likely etiologic agent of this malignancy. The intrinsic need for the virus to replicate through clonal expansion of lymphocytes, and the tax gene’s effects on cellular transcriptional regulation, presumably accounts for its lymphomagenic potential [13]. Malignant lymphomas in non-human primates are remarkably similar to non-Hodgkin’s lymphomas (NHLs) found in humans. The most common findings are weight loss, overall weakness, and dyspnea and generalized lymphadenopathy [13, 19].

We previously reported on T-cell lymphoma from two Vervet monkeys [20] and since then, four additional cases have emerged. This report describes T-cell lymphoma in a Chacma baboon with comparable symptoms and pathology previously described and reported in the two Vervet monkeys from the same holding facility.

Humane Care Guidelines

This 16-year-old wild-caught female Chacma baboon was a member of a colony of ninety individuals maintained outdoors at the Delft Animal Centre of the Medical Research Council, Cape Town, South Africa. Individuals were housed in single cages with full visual, olfactory and auditory contact with conspecifics. Grooming with adjacent individuals was possible through wire mesh grooming panels.

The animals were maintained on a standard diet of special monkey cubes (Equifeeds, Cape Town, South Africa) and supplemented with seasonal fruit and vegetables. Additional enrichment devices were provided daily and water was available ad libitum. All animals were housed and maintained in accordance with the South African National Standard for the Care and Use of Animals for Scientific Purposes (The SANS 10386: 2008). The use of wild-caught baboons for scientific purposes has since been discontinued.

Case history

The clinical signs presented were a general weakness, loss of appetite and weight loss. Physical examination revealed conspicuous enlargements of several superficial lymph nodes in the right pre-scapular, sub-mandibular and bilateral inguinal areas. Additionally, there appeared to be a focal area of superficial skin ulceration on the thorax. A biopsy was taken under Ketamine (Biopharm, Cape Town, South Africa) at 10mg/kg bodyweight from the right inguinal lymph node for histopathology. The sections were prepared for immunoperoxidase staining with CD3 (T-cell) and CD20 (B-cell) markers. There was strong and widespread positive staining for CD3 and limited positive staining for CD20. T-cell lymphoma was diagnosed and the animal was euthanized.

Macroscopic observations during necropsy

The carcass was moderately emaciated. There was marked enlargement of the following lymph nodes, with some presenting focal areas of necrosis: left and right axillary, left and right inguinal, left and right renal, left and right retropharyngeal, and several intra-abdominal lymph nodes as well as nodes embedded along the thoracic aorta (Figure 1). Enlarged intra-thoracic lymph nodes caused compression of the adjacent vertebral bodies (T2 and T11), with possible infiltration of lymphocytes (Figure 2). The spleen contained prominent lymphoid follicles and the liver was friable with an uneven surface. The left kidney was moderately enlarged and pale as a result of nephrosis, with multifocal retention cysts in the cortex, and the right kidney showed focal subacute to chronic infarction.

Histopathology

For histopathological examinations, tissue samples containing lesions were fixed in 10% neutral buffered formalin for 24 hours. After tissue dehydration, paraffin embedding (Paraplast Plus, Monoject Scientific Inc.), 4-micron tissue sections were stained with hematoxylin and eosin. All sections were evaluated under a light microscope using 10x and 40x objective.

IJVB2018-101-CharondeVilliersSA_F1

Figure 1. Intra-thoracic lymph nodes (arrow) embedded along the thoracic aorta

IJVB2018-101-CharondeVilliersSA_F2

Figure 2. Vertebral infiltrations of intra-thoracic lymph node

The normal architecture of the lymph nodes (Figure 3a), tonsils and lymphoid tissues of the spleen was effaced as a result of the infiltration of sheets of medium to large lymphocytes and lymphoblasts (Figure 3b), sometimes arranged in distinct follicles. Numerous mitotic figures were present and multifocal areas of necrosis were visible with infiltration of mild to moderate numbers of neutrophils. The necrotic foci were surrounded by a thin layer of macrophages. Lesions in the other organs reflected the macroscopic findings.

Immunohistochemical analysis of neoplastic lymph nodes was performed using antibodies to CD3 and CD20 antigens. The positive staining for CD3 confirmed the biopsy findings reported earlier (Figure 3c).

Discussion

In this case study of an adult female Chacma baboon, common symptoms such as weight loss, generalized lymphadenopathy, fatigue, and dyspnea were reported. The onset of these clinical symptoms is in agreement with our previous findings on the two Vervet monkeys [20] and other reports of lymphoma in non-human primates [13, 17, 2].

Visceral lymph nodes were noted with an accumulation of neoplastic lymphocytes in multiple organs. As previously reported for the Vervet monkeys, this individual also presented an enlarged liver and spleen. Histological examination revealed infiltration of lymph nodes with sheets of neoplastic lymphocytes. These lymph nodes had a homogeneous, white coloured, fleshy appearance with some hemorrhagic or necrotic foci. Neoplastic cells were pleomorphic, with convoluted or lobulated nuclei, and there was bone marrow involvement. These findings are similar to those described in humans. HTLV-1 is characterized by dermal neoplastic involvement, hepatomegaly, lytic bone lesions with associated hypercalcemia, and enlarged neoplastic lymph nodes with infiltration of neoplastic cells [2].

IJVB2018-101-CharondeVilliersSA_F3

Figure 3. (a) Inguinal lymph node mass (b) The lesions are composed of small lymphoid cells. (c) Most neoplastic cells stain positively for CD3.

Infection rates of <25% with HTLV-1 have been previously reported in Chacma baboons and African green monkeys [10]. Likewise, for STLV-1, 29% of wild Vervet and 33% of wild baboons in South Africa are also seropositive [9]. Higher rates are seen in females than males and there is a gradual increase in seroprevalence with age. A relatively low prevalence of infection is found in younger individuals [13, 10] . Furthermore, non-human primates are usually diagnosed late in their illness, so lymphocytosis of frank leukemia may already be present that would grade the majority of these animals as either suffering from chronic or acute forms of lymphosarcoma.

In both HTLV and STLV age and gender plays a critical role. Higher rates of HTLV infection were seen in adult females than males and in Japanese macaques, more than 70% were reported to be seropositive for HTLV [6]. In the case of STLV, it was found that the infection rate approached 80% in an aged baboon population at the Southwest Foundation [12].

As opposed to endogenous retroviruses, which are spread vertically in the germline, HTLV-1 is an exogenous retrovirus which spreads horizontally. Therefore infection and consequently the incidence of antibodies can be expected to increase with age [12, 9] and sexual behaviour have been reported to be the important factor in establishing the prevalence of infection [10]. With reference to our previous report on the Vervet monkeys, we speculated sexual transmission to be the cause of infection as these animals formed part of a breeding program [20]. An alternative source reported, is interspecies transmission in the wild [9, 10] [3, 4] and in captivity [14, 15, 12] and data suggest that STLV-1 transmission only occurs after capture [14]. However, the scenario of transmission in captivity might not be applicable to this case as this female baboon was never utilized as a breeding animal in captivity.

Conclusion

The adult female Chacma baboon described in this report was diagnosed with T-Cell lymphoma resembling human T-cell lymphoma (HTLV). Even though the type of T-cell was not determined, the prevalence of seropositive STLV reported in wild populations of African non-human primates, such as the Chama baboon, renders the possibility that this individual was naturally infected with STLV in the wild.

Primary screening and surveillance tests are essential to identify individuals infected with simian retroviruses. Management practices in non-human primate breeding colonies need to take into account the possible presence of STLV-1 and aim to reduce transmission by preventing sexual contact between positive and negative animals. Lymphoma has to be considered as one of the more common causes of wasting and death in non-human primates used in biomedical research.

Acknowledgements: We thank Dr. Tertius Gous for conducting the necropsy, histopathological examinations and immunohistochemistry.

Declaration of Conflicting Interests: The author declares no potential conflicts of interest with respect to the research, authorship, and/or publication of this article.

Funding: The author received no financial support for the research, authorship, and/or publication of this article.

References

  1. Poiesz BJ, Ruscetti FW, Gazdar AF, Bunn PA, Minna JD, et al. (1980) Detection and isolation of type C retrovirus particles from fresh and cultured lymphocytes of a patient with cutaneous T-cell lymphoma. Proc Natl Acad Sci U S A 77: 7415–7419. [crossref]
  2. Jayo MJ, Laber-Laird K, Bullock BC, et al. (1990) T-cell Lymphosarcoma in a female African Green monkey (Cercopithecus aethiops). Lab Anim Sci 40: 37–41.
  3. Stewart SA, Poon B and Chen ISY (1994) Mechanisms of HTLV leukaemogenisis. In “Viruses and Cancer”. A. Minson, J. Neil and M. McCrae (eds), Cambridge Univ. Press, Cambridge, UK. 189–212.
  4. Engelbrecht S, van Rensburg EJ and Robson BAN(1996) Sequence variation and subtyping of Human and Simian T-cell Lymphotropic Virus Type I Strains from South Africa. J Acq Im Def Syn Hum Retro 12: 298–302.
  5. Miyoshi I, Yoshimoto S, Fujishita M, Taguchi H, Kubonishi I, et al. (1982) Natural adult T-cell leukemia virus infection in Japanese monkeys. Lancet 2: 658. [crossref]
  6. Miyoshi I, Fujishita M, Taguchi H, Matsubayashi K, Miwa N, et al. (1983) Natural infection in non-human primates with adult T-cell leukemia virus or a closely related agent. Int J Cancer 32: 333–336. [crossref]
  7. Guo GG, Wong-Staal F and Gallo RC (1984) Novel viral sequences related to human T-cell leukaemia virus in T-cells of a seropositive baboon. Science 223: 1195–1196.
  8. Miyoshi I, Fujishita M, Taguchi H, Matsubayashi K, Miwa N, et al. (1983) Natural infection in non-human primates with adult T-cell leukemia virus or a closely related agent. Int J Cancer 32: 333–336. [crossref]
  9. Becker WB, Becker MLB, Homma T, et al (1985) Serum antibodies to human T-cell leukaemia virus type I in different ethnic groups and in non-human primates in South Africa. S Afr Med J 67: 445–449.
  10. Botha MC, Jones M, de Klerk WA and Yamamoto N (1985) Spread and distribution of human T-cell leukaemia virus type I-reactive antibody among baboon and monkeys in the northern and eastern Transvaal. SAMJ 67: 665–668.
  11. Lerche NW (2005) Common Viral Infections of Laboratory Primates. In “The Laboratory Primate” Sonia Wolfe-Coote (ed), Elsevier Academic Press, Amsterdam 78–79.
  12. Moné J, Whitehead E, Leland M, Hubbard G, Allan JS (1992) Simian T-cell leukemia virus type I infection in captive baboons. AIDS Res Hum Retroviruses 8: 1653–1661. [crossref]
  13. Allan JS, Leland M, Broussard S, et al. (2001) Simian T-cell lymphotropic viruses (STLVs) and lymphomas in African non-human Primates. Cancer Inves 19: 383–395.
  14. Mahieux R, Pecon-Slattery J, Chen GM and Gessain A (1998) Evolutionary inference of novel Simian T Lymphotropic virus type I from wild-caught Chacma baboons (Papio ursinus) and Olive baboons (Papio anubis). Virology 251: 71–84.
  15. Voevodin A, Samilchuk E, Schätzl H, et al. (1996) Interspecies transmission of Macaque Simian T-cell leukaemia/lymphoma virus type I in baboons resulted in an outbreak of malignant lymphoma. J Virol 70: 1633–1639.
  16. Lapin B (1988) Baboon lymphoma viruses. In “Virus Diseases in Laboratory and Captive Animals. Darai g. (ed). Nijhoff Publishers, Boston. 135–151.
  17. Sato Y, Matsuura S, Kadota K and Miyazawa I (1999) T-cell lymphoma in a Savanna monkey (Cercopethicus aethiops) probably related to Simian T-cell leukaemia virus infection. J Vet Med. Sci 61: 49–52.
  18. Tsujimoto H, Noda Y, Ishikawa K, et al. (1987) Development of adult T-cell leukaemia-like disease in African green monkey associated with clonal integration of simian T-cell leukaemia virus type I. Cancer Res 47: 269–274.
  19. Hubbard GB, Mone JP, Allan JS, et al. (1993) Spontaneously generated non-Hodgkin’s lymphoma in twenty-seven simian T-cell leukaemia virus type I antibody-positive baboons (Papio species). Lab Anim Sci 43: 301–309.
  20. de Villiers C, Seier JV (2011) Weight loss, weakness and lymphadenopathy in two vervet monkeys (Chlorocebus spp.). Lab Anim (NY) 40: 177–178, 180–2. [crossref]

Low Power Digital Comparator Designed Using Different Logic Styles

DOI: 10.31038/NAMS.2018111

Abstract

The rapid integration of VLSI circuit is due to the increased use of portable wireless systems with low power budget and microprocessors with higher speed. To achieve high speed and lower power consumption, the fabrication technology and power supply must be scaled down simultaneously. In this article, the digital circuits with low power, high speed and small size was designed with different method. The major goal of this paper is to design and implement of digital comparator using different logic techniques and compared in terms of different electric parameters. The results are simulated on the tanner-EDA tool realized in 90-nanometer technology at 1.3v supply voltage.

Keywords

Digital Comparator, Transmission Gate Logic Technique, Half Adder Logic Technique, Power Dissipation, Propagation Delay

Introduction

As the demand for higher performance CMOS VLSI processors is increasingly complicated, we need to improve the performance, area efficiency, and functionality of arithmetic circuits [1]. One of the challenges in VLSI processor design today is to structure low power digital comparator [2-3] circuits specifically for the 8-bit digital comparator circuits without limiting the functional flexibility. The major tradeoff of these prior gigahertz logic circuits is the high power consumption due to the unavoidable power consumption even in a standby condition, which is not a tolerable price to pay in recent mobile technologies. Since the usage of the digital comparator principle for high speed arithmetic units remains dominant, much effort has been focused on the improvement of low power digital comparator design [4]. A low power high performance circuit technique has been proposed previously [5] for reducing power dissipation and diminishing propagation delay by feeding through dynamic CMOS logic structure. In this paper, digital comparator is designed using different techniques with the low power consumption and higher packing densities in 90-nanometer technology at 1.3v supply voltage.

Two-bit digital comparator

The traditional method in digital logic of two variable A (A0, A1) and B (B0, B1) of a two-bit binary number is a logical operation that figures out whether A is less than B, A is greater than B and A equal to B [6-7]. Therefore, the digital comparator is such type of logic circuit that thinks about the relative magnitudes of these two variables. The block diagram of digital comparator appears in Figure 1. The result of digital comparator is determined by three variables that demonstrate whether A>B, A<B, or A=B. These also described by their logic function as

NAMS2017-101-China_F10

NAMS2017-101-China_F1

Figure 1. Block diagram of digital comparator.

The gate implementation of a two-bit digital comparator appears in Figure 2.

NAMS2017-101-China_f2

Figure 2. Gate implementation of a two-bit digital comparator.

Two-bit digital comparator design using cmos logic style

Since CMOS consumes less power and provides high speed, therefore it is considered as the best alternative design process in the digital circuit. The CMOS circuit consists of two networks, one NMOS pull-down network, which connects the output to the ground and another PMOS pull-up network, which connects the output to supply, as shown in Figure 3. The two-bit digital comparator using the CMOS logic technique is shown in Figure 4[8].

NAMS2017-101-China_f3

Figure 3. CMOS logic techniques.

NAMS2017-101-China_f4

Figure 4. Two-bit digital comparator using the CMOS logic technique.

Two-bit digital comparator using the transmission gate logic style

The transmission gate logic gives high speed and less power dissipation than conventional CMOS for the reason that of the small transistor stack height, the least number of transistors and no complementary input signals are required. The transmission gate comprises of one NMOS and one PMOS transistor, which are associated in parallel. The graphical symbol of the transmission gate appears in Figure 5.

However, the existing transmission gate logic based two-bit magnitude comparator is shown in Figure 6 which consists of 66 transistors [9]. The large number of transistors, the more power consumption and lower packing density.

NAMS2017-101-China_f5

Figure 5. Graphical symbol of the transmission gate.

NAMS2017-101-China_f6

Figure 6. Schematic of the existing two-bit digital comparator using the transmission gate logic.

The proposed two-bit digital comparator using gdi gate and half adder logic style

In order to decries the transistor number of circuits, we are proposed two-bit comparator with transmission gate logic and half adder logic with 19 and 20 transistors, respectively, as shown in
Figure 7 and Figure 8.

NAMS2017-101-China_f7

Figure 7. Schematic of the two-bit digital comparator using transmission gate logic technique.

In this proposed designed technique a digital comparator has been designed using half adder and basic logic gates. Implementation of the design procedure using hardware requires two sub-block one is half adder block and another is GDI gate comparison block.

NAMS2017-101-China_f8

Figure 8. Two-bit digital comparator based GDI AND/OR gate and half adder logic technique.

Simulation results

The simulation result is measured by the EDA Tanner tool in 90 nanometer technology using various inputs A0=110011, A1= 001111; B0=111100, B1= 001111 at 1.3v supply voltage. The Layout(portion) design and wafer fabrication(SEM photo) of the proposed two-bit digital comparator using half adder logic is shown in Figure 9. The power consumption of this half adder logic based 2-bit digital comparator is 0.12 microwatt. The simulation result is listed in Table 1.

NAMS2017-101-China_f9

Figure 9. Layout(portion) design and wafer fabrication(SEM photo) of the optimized half adder logic based two-bit digital comparator.

Table 1. Performance comparison of two-bit digital comparator

Parameters

Conventional

Transmission Gate logic [9]

Proposed Transmission Gate logic

Proposed Half adder logic

Number of transistor 54 74 19 20
Power consumption (μW) 0.62 0.47 0.28 0.12
Propagation delay (n-sec) 8.39 8.47 7.59 6.74
Power delay Product(μ-nJ) 5.19 3.87 2.12 0.79

Conclusions

Our proposed two bit digital comparator with modified transmission gate logic and half adder logic which verified with condition of on 90-nanometer technology at 1.3v supply voltage based on the tanner-EDA tool. After consider of all kinds of outline strategies, the simulation results are gotten for Power Consumption, Delay and Power Delay Product. Power consumption of the proposed half adder logic based two bit digital comparator is 1.12μW which is almost 65.83% less than existing transmission gate logic based two-bit digital comparator[9]. Also the transistor count of our proposed transmission gate logic circuit is almost 69.69% less than existing transmission gate logic based two-bit digital comparator, subsequently our chip area overall is minimized.

Funding

This research is supported partly by the National Natural Science Fund Committee of China (NSFC) (no.51377025, 20171BAB202037)

References

  1. Kang and Y. Leblebici : CMOS Digital Integrated Circuit, Analysis and Design (Tata McGraw-Hill, 3rd Ed, 2003). 295–302.
  2. Bellaouar and Mohamed I. Elmasry, Low Power Digital VLSI Design: Circuits and Systems (Kluwer Academic Publishers, 2nd Ed, 1995).
  3. Kathirvelu, T.Manigandan, ‘Design and Implementation of High speed ALU using Optimized PDP adder and Multiplier’, Journal of Applied Sciences Research, 8(4) (2012) 2100–2108.
  4. Victor Navarro-Botello and Juan A. Montiel-Nelson, Saeid Nooshabadi and Mike Dyer, ‘Low Power Arithmetic Circuits in Feedthrough Dynamic CMOS Logic’, MWSCAS ‘06. 49th IEEE International Midwest Symposium on Circuits and Systems, 1 (2006) 709–712.
  5. Saeid Nooshabadi, and Juan A. Montiel-Nelson, ‘Fast Feedthrough Logic: A High Performance Logic Family for GaAs, IEEE Trans. on Circuits and Systems-I: Regular papers, 51(11) (2004) 2189–2203.
  6. Mariano Aguirre-Hernandez and Monico Linares-Aranda, CMOS Full–Adders for Energy-Efficient Arithmetic Applications, IEEE Transaction on Very Large Scale Integration (VLSI) System, Vol. 19, no. 4, pp. 718–721, April. 2011.
  7. Wairya, R. Kumar Nagaria, and S. Tiwari, Compartive performance analysis of XOR-XNOR function based high peed CMOS full adder circuits for low voltage VLSI design, International Journal of VLSI Design & Communication Systems(VLSICS), Vol.3,no.2,pp.221-242, Apr. 2012.
  8. Mukherjee D. N., Panda S., Maji B., OPTIMIZATION OF DIGITAL COMPARATOR USING TRANSMISSION GATE LOGIC STYLE, International Journal of Advanced Research in Engineering and Technology (IJARET), Volume 7, Issue 4, July-August 2016, pp. 06–16
  9. Anjuli, Satyajit Anand, two-bit Magnitude Comparator Design Using Different Logic Styles, International Journal of Engineering Science Invention, ISSN (Online): 2319 – 6734, ISSN (Print): 2319 – 6726 www.ijesi.org Volume 2 Issue 1 PP.13–24, January. 2013.

Reduced Burden of Chemotherapy Side-Effects in Patients Receiving Inositol Hexakisphosphate Alone or In Association with Myo-Inositol

DOI: 10.31038/CST.2018311

Abstract

Background: Thanks to the increased effectiveness of the three pillars of cancer therapy i.e. early diagnosis, targeted surgery and chemotherapy, physician are now aiming at a now goal: improve quality of live of patients during and after cancer therapy

Objectives: This review article aims to identify clinical evidence of the effectiveness that MI and IP6 might have on QoL in cancer patients.

Methods: literature search was performed on MEDLINE, EMBASE, PubMed, Research Gate and Google scholar for studies published in English up to November 2017. We used the following combination of medical subject headings, terms and free text words: ‘inositol’, ‘quality of life’, ‘cancer’.

Conclusions: In conclusion, literature data seams to demonstrate that IP6 and MI are effective in improving QoL of patients undergoing chemotherapy due to breast cancer.

Keywords

Breast cancer, Quality of live, inositol, IP6, phytic acid

Introduction

Nowadays taking advantage of the three main tools that physicians are using to fight cancer, i.e. early diagnosis, targeted surgery and medical treatments (chemotherapy, hormonotherapy, immunotherapy) survival rate has reached a remarkable goal of roughly 65% (ranging from 25% for lung cancer to 87% for prostate cancer) [1, 2].

Such success rate has, with time, forced physicians to face a new challenge: how to improve patients’ quality of life (QoL) without reducing survival rate. Indeed, it has been demonstrated that QoL is an independent predictor with respect to life expectancy [3].

What is for sure is that we cannot simply ask for a reduction in chemo-radiotherapy so to improve QoL, indeed Bonadonna and coworkers demonstrated that as soon as patients receive less than 85% of the planned dose intensity the survival rate significantly decrease [3].

It is worth noting that the relative dose reduction might refer to both an actual reduction in the dosage of the drug used or to a delay in the therapy [4].

Having this in mind, several research groups worldwide are committed in improving patients QoL and therefore, eventually increase cancer treatment effectiveness too.

In this scenario, a major role has been played for several years by inositol(s), mainly myo-inositol (MI) and inositol hexakisphosphate (IP6) [4-6].

In this systematic review, we aim to identify clinical evidence of the effectiveness that MI and IP6 might have on QoL in cancer patients.

M&M Search strategy and data sources

We performed a literature search of MEDLINE, EMBASE, PubMed, Research Gate and Google scholar for studies published in English up to November 2017. We used the following combination of medical subject headings, terms and free text words: ‘inositol’, ‘quality of life’, ‘cancer’. Only clinical trials evaluating the effects of IP6 or IP6+MI as study group in women undergoing radio/chemotherapy for breast cancer were considered eligible.

In addition, reference lists of additional manuscript published were reviewed in order to identify additional eligible studies.

We followed the PRISMA checklist for meta-analysis [7].

Inclusion and exclusion criteria

Articles were critically reviewed for their eligibility in the meta-analysis. Among all the collected articles, clinical trials were identified by reading titles, abstracts and study design to select relevant studies according to inclusion/exclusion criteria.

Inclusion criteria restricted the search to: (a) the population of interest was made of women undergoing radio/chemotherapy due to breast cancer, (b) the intervention was IP6 with or without MI, (c) clear quantitative assessment of both quality of life (QoL) and blood counts. Exclusion criteria were: (a) duplicate publications, and duplicates on different database, (c) review papers and (d) animal studies.

Outcomes of interest

Primary outcomes: Quality of life, Functional status and Symptomatic scale based on the EORTIC questioner. Secondary outcomes: white blood cell and platelet counts.

Data extraction and quality evaluation

The following data were extracted from the selected studies and independently cross-checked by two investigators: general characteristics of the study (first author’s name, country where the study was conducted, study design, number of cases and controls, inclusion/exclusion criteria, type and duration of treatment) and results (means and S.D. for each outcome after intervention from treatment vs control). The quality of reports was evaluated according to the methods recommended by the Cochrane Handbook 5.0.2 [8]. including assessments of the randomization process, allocation concealment, blinding, selection criteria, baseline characters and withdrawal/dropouts.

Statistical analysis

The effect size was measured as the mean difference (MD) between the two treatment groups. A MD less than 0 was considered as a positive size effect for symptomatic scales; MD greater than 0 was considered as a positive size effect for Quality of life, Functional status, with blood cell counts and platelet counts. The heterogeneity analysis of intervention was performed by the Cochran’s Q test and the I2 statistic, using a P value = 0.10. In order to account for heterogeneity across studies, the Der Simonian and Laird random effect model was used to obtain the pooled estimates and their 95% confidence intervals (CIs). Forrest plots were used to visually show the results of the analyses performed.

Meta-analysis was performed by means of OpenMeta [Analyst] software developed by The School of Public Health at Brown University USA. Results were considered statistically significant when the two-sided P value was <0.05.

Results

The flow diagram of the meta-analysis is presented in Figure 1 [7]. Based on the search 11 records were identified. After the screening 6 articles were assessed for eligibility. Following the screening 2 out of 4 papers were included in the analysis.

Notes on copy editing of PRISMA E&E paper (Liberati et al)

Figure 1.

A brief description of the manuscript matching the inclusion criteria is reported in Table 1.

Table 1.

Reference

Tumor Status

Chemotherapy

groups

outcomes

Bacić I et al., 2010 Ductal invasive BC 5 fluorouracilepirubicincyclophosphamide Experimental group IP6+MIControl group Vit C QLQ30 e QLQ-BR23[28, 29]
Proietti et al., 2017 Ductal BC Stage II-III cyclophosphamide methotrexato5 fluorouracil Experimental group IP6 in gelControl group hyaluronic acid in gel QLQ30 e QLQ-BR23[28, 29]

Studies were conducted in Croatia [9] or Italy [10] and were published between 2010 and 2017.Treatments administered were IP6 +MI per OS at the dosage of 1.4g twice a day[9] or 5g of a 4% IP6 gel twice a day [10]. Noteworthy both treatments result in the same pharmacokinetic profile [11, 12].The duration of the treatment was 6 months for both studies.

The overall methodological study quality is summarized in Table 2.

Table 2.

Study Randomization Allocation concealment Blinding Selection criteria described Comparable baseline Withdrawal dropout described
BACIC M Unclear N Y Y Y
PROIETTI M Unclear Y Double blind Y Y M

Evaluation according to the methods recommended by the Cochrane Handbook 5.0.2.

M, the method was mentioned, but there was not detailed description;

N, the method was not used in the study;

Unclear, no relevant information was found in the study;

Y, the method was reported with detailed description.

The meta-analysis

In the two selected studies, a total of 17 women received IP6 alone or in combination with MI, and 17 women received control treatments (i.e. Vit-C, Hyaluronic acid gel).

The overall MD estimated from two studies showed a significant improvement for the patients treated with IP6 (+MI) after chemotherapy of the QoL (MD=36.167; 95%CI: 22.047 to 50.288 P= < 0.001) (Figure 2).

Additional improvements were highlighted for the Functional status (MD=33.261; 95%CI: 22.727 to 43.795 P= < 0.001) (Figure 3) and Symptoms Scale (MD= -28.577; -95%CI: 41.476 to -15.678; P= < 0.001) (Figure 4).

In addition to the data obtained from the EORTIC QLQ-C30 and QLQ-BR23 the blood counts results showed that IP6, eventually in association with MI, was able to reduce WBC drop after chemotherapy (MD= 3.579; -95%CI: 2.083 to 5.074 P= < 0.001) (Figure 5).

CST2017-243-GianfrancoCarlomagnoItaly_F2

Figure 2. Forest plot showing effect sizes (mean difference (MD), 95% confidence interval (CI)) for QoL in women undergoing chemotheraphy for breast cancer treated with IP6 (+MI).

CST2017-243-GianfrancoCarlomagnoItaly_F3

Figure 3. Forrest plot showing effect sizes (mean difference (MD), 95% confidence interval (CI)) for Functional Status in women undergoing chemotheraphy for breast cancer treated with IP6 (+MI).

CST2017-243-GianfrancoCarlomagnoItaly_F4

Figure 4. Forest plot showing effect sizes (mean difference (MD), 95% confidence interval (CI)) for Smptoms Scale in women undergoing chemotheraphy for breast cancer treated with IP6 (+MI).

CST2017-243-GianfrancoCarlomagnoItaly_F5

Figure 5. Forrest plot showing effect sizes (mean difference (MD), 95% confidence interval (CI)) for WBC in women undergoing chemotheraphy for breast cancer treated with IP6 (+MI).

Regarding platelet counts the analysis revealed considerable heterogeneity (Q(df=1)=7.870; Het. p-Value=0.005; I2=87.294). Nevertheless, it is worth to mention that in both studies, authors demonstrated that both treatments (either IP6 or IP6+MI) were able to prevent the drop of the platelet count.

Discussion

In the present review, we tried to highlight both new issues in the management of the oncological patient and new approaches in improving quality of life of patients undergoing chemotherapy.

In particular, literature data point at inositol(s), namely IP6 and MI, as an effective treatment able to improve patients QoL.

Indeed, literature data suggest that to improve cancer cure physicians have to improve cancer therapy effectives also by improving patients QoL, both during chemotherapy and afterwards.

MI as reaffirmed in a recent meta-analysis, is a well-known insulin sensitizer [13] nowadays hyperinsulinemia is considered a risk factor in cancer development. Indeed, in the majority of the tumors insulin regulated pathways are increased at both gene expression and activity of PI3K and Akt [14]. Evidence suggesting a positive role of Inositol (s) in cancer have been recently reviewed [4, 5, 15, 16]. Notably several authors have demonstrated that inositol phosphates and MI, in cancer cells, are able reduces PI3K expression (at both mRNA and protein level) [17] and Akt activation by inhibiting its phosphorylation [15, 18]. IP6 induce the impairment of the activity several signaling proteins such as: PI3K; PI3K-dependent activation of the tumor promoter induced AP-1; the phosphorylation-dependent activation of ERK [18]. Inhibition of PI3K activity, the protein kinase C (PKC) and the mitogen activated kinases (MAPK) have been documented by several studies both in vitro, [18-21] as well as in vivo, in particular, the in vivo studies were studies aiming to investigate inositol(s) chemo-preventive properties [22, 23].

In addition to the above described evidence that IP6 alone inhibits the growth of breast cancer cells, data by Tantivejkul et al., showed that IP6 synergistically acts with adriamycin or tamoxifen [24]. Noteworthy authors also manage to demonstrate that IP6 particularly effective when co-administerd with adriamycin or tamoxifen in ERα -negative cells and adriamycin resistant cell lines [24].

The clinical use of IP6+MI has been hampered by two main factors: bioavailability and palatability.

Human studies have demonstrated that dietary phytate is dephosphorylated during the digestion process by both plant phytases and phytases produced by human microbiota [25, 26].

Furthermore, several studies, aiming to investigate inositol phosphates solubility, have demonstrated that solubility in the stomach chyme negative correlates with the phosphorylation grade, i.e. the more phosphate group are attached to the inositol ring the less soluble and therefore bioavailable [27].

To solve this issue a transdermal gel has been used in the study by Proietti et al., indeed, instead of administering 1,4g of IP6 in powder, [9] researchers used a 5g of a 4% IP6 gel (200mg of IP6) [10].

In conclusion, literature data seams to demonstrate that IP6 and MI are effective in improving QoL of patients undergoing chemotherapy due to breast cancer.

References

  1. Siegel RL, Miller KD, Jemal A (2015) Cancer statistics. CA Cancer J Clin 65: 5–29.
  2. Ferlay J, Soerjomataram I, Dikshit R, Eser S, Mathers C, et al. (2015) Cancer incidence and mortality worldwide: sources, methods and major patterns in GLOBOCAN 2012. Int J Cancer 136: E359–386. [crossref]
  3. Bonadonna G, Valagussa P, Moliterni A, Zambetti M, et al. (1995) Adjuvant cyclophosphamide, methotrexate, and fluorouracil in node-positive breast cancer: the results of 20 years of follow-up. N Engl J Med 332: 901–6.
  4. Bizzarri M, Dinicola S, Bevilacqua A, Cucina A (2016) Broad Spectrum Anticancer Activity of Myo-Inositol and Inositol Hexakisphosphate. Int J Endocrinol 5616807.
  5. Bizzarri M, Dinicola S, Cucina A (2017) Modulation of both Insulin Resistance and Cancer Growth by Inositol. Curr Pharm Des.
  6. Dinicola S, Minini M, Unfer V, Verna R, et al. (2017) Nutritional and Acquired Deficiencies in Inositol Bioavailability. Correlations with Metabolic Disorders. Int J Mol Sci 18.
  7. Moher D, Liberati A, Tetzlaff J, Altman DG, et al. (2009) Preferred reporting items for systematic reviews and meta-analyses: the PRISMA Statement. Open Med 3: e123–30.
  8. Collaboration TC (2011) Cochrane Handbook for Systematic Reviews of Interventions Version 5.1.0 5.1.0 ed.
  9. Bacic I, Druzijanic N, Karlo R, Skific I, et al. (2010) Efficacy of IP6 + inositol in the treatment of breast cancer patients receiving chemotherapy: prospective, randomized, pilot clinical study. J Exp Clin Cancer Res 29: 12.
  10. Proietti S, Pasta V, Cucina A, Aragona C, et al. (2017) Inositol hexaphosphate (InsP6) as an effective topical treatment for patients receiving adjuvant chemotherapy after breast surgery. Eur Rev Med Pharmacol Sci 21: 43–50.
  11. Grases F, Simonet BM, Vucenik I, Prieto RM, et al. (2001) Absorption and excretion of orally administered inositol hexaphosphate (IP(6) or phytate) in humans. Biofactors 15(1): 53–61.
  12. Grases F, Isern B, Perelló J, Sanchis P, et al. (2006) Absorption of myo-inositol hexakisphosphate (InsP6) through the skin in humans. Pharmazie 61: 652.
  13. Unfer V, Facchinetti F2, Orrù B3, Giordani B3, Nestler J4 (2017) Myo-inositol effects in women with PCOS: a meta-analysis of randomized controlled trials. Endocr Connect 6: 647–658. [crossref]
  14. Pedrero JM, Carracedo DG, Pinto CM, Zapatero AH, Rodrigo JP, et al. (2005) Frequent genetic and biochemical alterations of the PI 3-K/AKT/PTEN pathway in head and neck squamous cell carcinoma. Int J Cancer 114: 242–248. [crossref]
  15. Dinicola S, Fabrizi G, Masiello MG, Proietti S, et al. (2011) Inositol induces mesenchymal-epithelial reversion in breast cancer cells through cytoskeleton rearrangement. Exp Cell Res 345: 37–50.
  16. Bizzarri M, Cucina A (2014) Tumor and the microenvironment: a chance to reframe the paradigm of carcinogenesis? Biomed Res Int 934038.
  17. Liu G, Song Y, Cui L, Wen Z, et al. (2015) Inositol hexaphosphate suppresses growth and induces apoptosis in HT-29 colorectal cancer cells in culture: PI3K/Akt pathway as a potential target. Int J Clin Exp Pathol 8: 1402–10.
  18. Huang C, Ma WY, Hecht SS, Dong Z (1997) Inositol hexaphosphate inhibits cell transformation and activator protein 1 activation by targeting phosphatidylinositol-3’ kinase. Cancer Res 57: 2873–8.
  19. Gu M, Roy S, Raina K, Agarwal C, et al. (2009) Inositol hexaphosphate suppresses growth and induces apoptosis in prostate carcinoma cells in culture and nude mouse xenograft: PI3K-Akt pathway as potential target. Cancer Res 69: 9465–72.
  20. Dong Z, Huang C, Ma WY (1999) PI-3 kinase in signal transduction, cell transformation, and as a target for chemoprevention of cancer. Anticancer Res 19: 3743–7.
  21. Bozsik A, Kökény S, Olah E (2007) Molecular mechanisms for the antitumor activity of inositol hexakisphosphate (IP6). Cancer Genomics Proteomics 4: 43–51.
  22. Gustafson AM, Soldi R, Anderlind C, Scholand MB, et al. (2010) Airway PI3K pathway activation is an early and reversible event in lung cancer development. Sci Transl Med 2: 26ra5.
  23. Han W, Gills JJ, Memmott RM, Lam S, et al. (2009) The chemopreventive agent myoinositol inhibits Akt and extracellular signal-regulated kinase in bronchial lesions from heavy smokers. Cancer Prev Res (Phila) 2: 370–6.
  24. Tantivejkul K, Vucenik I, Eiseman J, Shamsuddin AM (2003) Inositol hexaphosphate (IP6) enhances the anti-proliferative effects of adriamycin and tamoxifen in breast cancer. Breast Cancer Res Treat 79: 301–12.
  25. Sandberg AS, Andersson H (1988) Effect of dietary phytase on the digestion of phytate in the stomach and small intestine of humans. J Nutr 118: 469–473. [crossref]
  26. Schlemmer U, Jany KD, Berk A, Schulz E, et al. (2001) Degradation of phytate in the gut of pigs–pathway of gastro-intestinal inositol phosphate hydrolysis and enzymes involved. Arch Tierernahr 55: 255–80.
  27. Schlemmer U, Jany KD (2003) Proceedings of the Society of Nutritional Physiology; 57th conference. In: Breves G, editor: DLG-Verlag, Frankfurt (Main) 29.
  28. Aaronson NK, Ahmedzai S, Bergman B, Bullinger M, et al. (1999)The European Organization for Research and Treatment of Cancer QLQ-C30: a quality-of-life instrument for use in international clinical trials in oncology. J Natl Cancer Inst 85: 365–76.
  29. Fayers P, Aaronson NK, Bjordal K, Groenvold M, et al. (2001) EORTC QLQ-C30 Scoring Manual (3rd edition). 3rd ed. Brussels: European Organisation for Research and Treatment of Cancer.

Concentrated and Fixed-Dose Insulin Formulations can Improve Outcomes in Patients with Type 2 Diabetes

DOI: 10.31038/EDMJ.2018212

Introduction

The risk of developing long-term diabetes related complications (retinopathy, nephropathy, neuropathy, cardiovascular disease and stroke) increases as glycated hemoglobin (A1C) levels exceed 6.5% [1,2]. All patients with diabetes should be provided with an individualized target A1C based on factors such as age, duration of disease, risk of hypoglycemia, existing comorbidities, available resources, life expectancy and cardiovascular risk [3]. A delay of therapeutic intensification of just 2 years from the time of diagnosis, can expose a patient to “glycemic burden” and a 61% increased risk of cardiovascular complications [4]. Recent data from the 2011-2014 National Health and Nutrition Examination Survey (NHANES) indicate the just 51 % of American adults with diabetes are achieving A1C levels <7%. Despite the approval and marketing of multiple new agents for diabetes (GLP-1 receptor agonists, SGLT2 inhibitors, longer acting basal insulins, and disposable insulin pumps), improvement of A1C nationally has actually declined since NHANES 2007-2010 when 52 % of patients achieved their targeted A1C [5]. Randomized clinical trials which are conducted with FDA guidance in order for a study drug to gain regulatory approval consistently demonstrate success in achieving A1C levels <7% and even 6.5 %. However, real world studies suggest that patient adherence to prescribe medications may mitigate one’s ability to achieve glycemic targets [6]. Patients in the real world may be concerned about drug side effects, complexity of treatment regimens, potential weight gain, or risk of hypoglycemia. TV advertisements which mention thyroid cancer, amputation risk and hypoglycemia may hinder one’s desire to initiate a new drug.

Former US Surgeon General, C. Everett Koop once said, “Drugs don’t work if patients who don’t take them [7]. This article will address concentrated insulin and combination fixed dose insulin + GLP-1 receptor agonists which reduce risk of hypoglycemia, weight gain, and cardiovascular disease. The use of these agents within the primary care setting may improve adherence and allow patients to safely and efficiently achieve their prescribed glycemic targets.

Insulin Action, Variability and Recommended Glycemic Targets

Insulins are formulated to bind to and activate receptors located with target organs (liver, muscles, kidneys, adipose tissue). The resultant pharmacologic action ultimately lowers plasma glucose levels to the desired range. The fact that not all insulins are created equally allows practitioners to customize their treatment protocols for each patient.

The American Association of Clinical Endocrinologists recommends the use of insulin when the endogenous insulin-secreting capacity of pancreatic beta cells has been exceeded. Insulin should be initiated in any patient with an A1C > 8.5 % who has symptoms suggestive of chronic hyperglycemia (thirst, weight loss, blurry vision, distal sensory neuropathy, weight loss and frequent urination). Patients with A1C >9% should also be considered insulin candidates [8]. Basal insulin reduces hepatic glucose production in the fasting state whereas rapid acting insulin preparations are used to minimize post prandial glucose excursions. The American Diabetes Association recommends targeting fasting glucose levels to 70-130 mg/dL and 2-hour post meal glucose of <180 mg/dL [9].

Early initiation of insulin can prove beneficial for patients with T2DM. The anti-inflammatory and antioxidant effects (ie, reduction of oxidative stress) may offer protection against vascular endothelial dysfunction and subsequent vascular disease. Insulin induces endothelial nitric oxide synthase in endothelial cells resulting in increased production of nitric oxide and the promotion of vascular dilatation [10]. Insulin is thought to preserve β-cell mass and function in patients with T2DM. Glycemic burden destroys β-cells. Reducing hyperglycemia in patients with diabetes can facilitate β-cell rest allowing for more efficient and timely production and secretion of endogenous insulin [11].

Although elevated A1C is a surrogate marker for long-term diabetes-related complications, glycemic variability (dysglycemia) can induce oxidative stress favoring the induction of complications [12]. Patients who experience dysglycemia become frustrated with their inability to efficiently regulate blood glucose levels. These patients experience wide glycemic swings throughout the day resulting in hypoglycemia and sustained hyperglycemia. Efficient pharmacotherapy for patients with type 2 diabetes must address both the effects of prolonged exposure to hyperglycemia as well as acute daily excursions of glucose levels. Elevated glucose levels promote the appearance of acute glycated end products (AGEs) which can increase one’s likelihood of developing complications. Glycemic excursions exacerbate the process of oxidative stress, a metabolic state favoring the progression of microvascular and macrovascular complications [13].

Ideal basal insulins should be simple to initiate and titrate, result in minimal glycemic variability, provide prolonged duration of action, while reducing one’s risk of hypoglycemia and weight gain. In addition, insulins should not increase one’s risk of cardiovascular disease, especially in patients who have already experienced a stroke or myocardial infarction. Table 1 lists the coefficients of variability of available basal insulins. The lower the variability, the less likelihood of developing treatment emergent hypoglycemia as noted in Figure 1 a and 1 b.

EDMJ2017-116-JeffUngerUSA_F1

Figure 1a. Emergent hypoglycemia.

EDMJ2017-116-JeffUngerUSA_F2

Figure 1b. Dysglycemia.

Table 1. Basal Insulin Coefficients of Variability.

Insulin

Within Subject Variablity*

NPH

68

Glargine U-100

48

Detemir

27

(Concentrated) Glargine U-300

34.8

Degludec

20

* Percentage within subject variability based upon glucose infusion rates and area under the curve. Patients receive 4 single subcutaneous doses of 0.4 U/kg under euglycemic glucose clamp conditions on 4 study days [14-16].

A patient is using an insulin with a high coefficient of variability. Glucose levels demonstrate “dysglycemia (Figure 1 a).” Increasing the basal insulin further is likely to increase the risk of hypoglycemia which will reduce adherence to the prescribed treatment regimen (Figure 1 b). The use of basal insulin formulations with low glycemic variability will allow patients to achieve their fasting blood glucose targets more efficiently with less fear of hypoglycemia.

New Insulin Formulations

Advances in basal insulin formulations have provided clinicians and patients with options that provide favorable pharmacokentic (insulin absorption) and pharmacodynamic (glucose lowering) properties. Newer insulins have flatter, peakless action profiles, demonstrate less variability and a longer duration of action allowing for flexible dosing. The risk of nocturnal and diurnal hypoglycemia is subsequently reduced. Insulin preparations do not appear to increase one’s cardiovascular risk [17,18]. Patients may also safely combine a GLP-1 receptor agonist as either a separate injection or as a component of a fixed-ratio drug. The use of fixed drug combinations may improve adherence and allow patients to achieve their metabolic targets [19].

Glargine U-300

Glargine U-300 (Toujeo) is a long-acting insulin containing 300 units/mL of insulin glargine. As a concentrated insulin, Glargine U-300 contains 3 times as much insulin per mL as glargine U-100 allowing for a lower volume of injected insulin. Glargine U300 was detectable at 32 hours post injection with 0.4 units/kg dosing compared with 28 hours with glargine U100 dosing [20]. At 0.4 u/kg, U300 has 14 % less variability than U100, allowing clinicians to titrate the insulin to target lower fasting glucose levels without risking hypoglycemia [21].

Degludec U100 and U300

Within the insulin pen, insulin degludec (Tresiba) is formulated as “insulin diheximers.” Once injected, the diheximers form multiheximer chains within the subcutaneous depot held together by zinc and phenol. As the zinc dissociates, the multiheximers form insulin monomers which pass into the capillaries and are carried via albumin to insulin receptors at target organ sites. Degludec U200 contains as much insulin as degludec U100 in just ½ the injection volume. The two insulins are bioequivalent and lower glucose levels at the same rate. Degludec appears to have the lowest coefficient of variability of all insulins allowing ambitious dosing to targeted fasting glucose levels with less likelihood of nocturnal and overall hypoglycemia when compared with insulin glargine [22]. Due to the prolonged duration of action (42 hours), degludec may be dosed at any time of the day, which may improve adherence for patients who are shift workers, travel frequently, or have difficulty remembering to dose their basal insulin [23].

U-500 Regular Insulin

Regular insulin U-500 (Humulin R U-500 insulin) is structurally identical to human insulin. Because the drug is formulated as 500 units/mL, this insulin is five times as potent as regular insulin U-100 [24]. U-500 is indicated for patients with type 1 or type 2 diabetes requiring more than 200 units of insulin daily. The concentrated insulin is delivered in a lower injection volume which improves the drug’s absorption from the subcutaneous depot. U-500 has a slower onset of action (60 min) when compared with rapid acting prandial insulins. The peak onset of action is 2-4 hours post injection and the duration of action is 4-6 hours [25]. U-500 can be dosed as prandial insulin using a pen injector 30-45 minutes prior to eating.

Lispro U-200 Insulin

Prandial insulin lispro U-200 (Humalog U-200) contains 200 units of rapid acting insulin per mL compared with insulin lispro U-100 which contains 100 units/mL. Thus, U-200 is twice as concentrated as U-100 allowing patients requiring > 20 units of insulin per meal to inject less volume [26]. The pharmacokinetic and pharmacodynamic effects of both Lispro U-200 and Lispro U-100 are equivalent [27].

Table 2 suggests which concentrated insulin or fixed insulin combination might be appropriate for patients with type 2 diabetes.

Table 2. Rationale Use of Concentrated Insulins.

Condition

Rationale

Product of Choice

Nocturnal hypoglycemia Needs peak-less (flat) basal insulin profle

Insulins with lower glycemic variability will allow safer titration to fasting glucose levels without risk of hypoglycemia

Glargine U300

Degludec U100 or U200

Severe insulin resistance requiring the use of > 200 units of insulin daily High potency concentrated insulin can result in a low volume subcutaneous insulin depot

U500 insulin is 5 times as potent as U100 insulin with 1/5 the injection volume

Insulin resistance requires high dose insulin

Regular U500 insulin )
Patient requires > 80 units of basal insulin per injection Concentrated insulin formulations have been developed to address the need for higher dose insulin delivery of a single daily injection Degludec U-200

Glargine U-300

Patient requires flexible daily dosing due to work schedule or frequent travel Degludec can be administered daily at any time of day, with injection timing varied without compromising glycemic control or safety Insulin degludec U100 or U200
Patient requires > 20 units of prandial insulin Lowers cost. Low volume insulin reduces the number of pen requirements monthly Lispro U-200
Post-prandial and fasting glucose coverage is needed Fixed-dose combination therapy with insulin +GLP-1 receptor agonist can reduce total daily dose of insulin, risk of weight gain associated with insulin use, and provide coverage for postprandial excursions Insulin degludec + liraglutide (IDegLIra- Xultophy 100.3.6)

Insulin glargine + lixisenatide (100/33) (Soliqua)

Fixed Dose-Combinations (Basal insulin and GLP-1 Receptor Agonists)

The combination of basal insulin analogues with a glucagon-like peptide receptor agonist (GLP-1 RA) is intriguing. Basal insulin essentially targets hepatic glucose production which is excessive in patients with type 2 diabetes However, the use of basal insulin may result in weight gain and/or hypoglycemia which affects adherence [28]. GLP-1 RAs, typically target post prandial glucose excursions by decreasing the excretion of endogenous glucagon, a counter regulatory hormone with induces hepatic glucose production [29]. Patients using GLP-1 RAs tend to lose weight. Because this class of drugs is “glucose dependent, “ the glucose lowering effect in patients with lower blood glucose levels is reduced. Thus, patients tend to experience less hypoglycemia. Liraglutide, a GLP-1 RA, has demonstrated a 22% reduction in cardiovascular mortality [30]. However, extrapolation of CV outcomes in fixed dose combinations cannot be inferred without having trials specific to the dual therapy option.

Table 3 lists the features of basal insulin plus GLP-1 RAs which makes their combination therapies attractive in patients with type 2 diabetes.

Table 3. Combination of Basal Insulin and GLP-1 Receptor Agonists.

Metabolic Target

Basal Insulin

GLP-1 RA

Combination Therapy

Beta Cell Function Rests beta-cells, relieves glucotoxicity Improves beta-cell function. May restore beta-cell mass Additive improvement in prandial and post prandial glucose levels with lower total daily dose of insulin required
Alpha cell function Reduces glucagon Reduces glucagon Additive improvement in glucagon secretion results in lower fasting and postprandial glucose levels. Diabetes is a bi-hormonal disorder…too much glucagon produced by the alpha cell and too little insulin secreted by the beta cell.
Glucose control Targets fasting blood glucose Targets primarily postprandial glucose Lower fasting and postprandial glucose levels. Improved A1C
Weight Tends to increase Tends to decrease Less weight gain noted with combination
Hypoglycemia risk Increase risk Lower risk Lower risk due to reduced insulin dose requirements when combined with a GLP-1 RA
Cardiovascular risk Insulin does NOT increase CV risk, nor is the risk reduced Liraglutide* and Semaglutide** reduce CV risk. Other GLP-1 RAs are neutral at reducing risk Studies have not been performed assessing the CV risk in fixed dose combination therapies, only as individual interventions

* = Marso et al. [31]; ** Marso et al., [32]

Summary

The treatment of type 2 diabetes is complicated by not only the chronic progressive nature of the disease, but the multiple “core” defects which much be addressed. Patients with diabetes experience beta cell failure, increased insulin resistance due to hepatic glucose production and a reduced glucose uptake in the muscle and fat cells. The kidneys absorb excessive amounts of glucose in the face of hyperglycemia, and even produce glucose in the form of gluconeogenesis. Due to the reduction in circulating insulin, fat cells produce excessive amounts of free fatty acid which further increases hepatic glucose production. Feelings of satiety are reduced in patients with type 2 diabetes resulting in over-consumption of nutrients and weight gain. Native GLP-1 (a gut hormone released in response to a carbohydrate load) is either reduced or its action compromised at the receptor site resulting in a reduction in prandial insulin production and excess glucagon production from the pancreatic alpha cells. The use of concentrated insulins as well as new insulins with more favorable pharmacokinetic and pharmacodynamic profiles may profoundly improve glycemic control in patients with diabetes. Fixed dose combinations which employ basal insulin plus a GLP-1 RA appears to be a rationale choice for patients who require better postprandial glucose coverage.

Patients who are non-adherent to a treatment regimen, may benefit from concentrated or combination therapies. Adherence is likely to improve fasting and postprandial glucose control allowing patients to successfully achieve their targeted A1C and reduce their “glycemic burden.” Using insulins with less variability and risk of hypoglycemia will also improve adherence. Because 90 % of all patients with diabetes are managed within the primary care setting, the treatment of diabetes must be intensified within our environment. Early and successful treatment of these complex individuals will likely improve long-term outcomes and the quality of life of our patients.

The author thanks the staff at Vindico Medical Education for their assistance in the preparation of this manuscript.

Acknowledgements:  Dr. Unger would like to thank Vindico CME for providing assistance with the editing of this manuscript.

References

  1. Selvin E, Ning Y, Steffes MW, Bash LD, Klein R, et al. (2011) Glycated hemoglobin and the risk of kidney disease and retinopathy in adults with and without diabetes. Diabetes 60: 298–305. [Crossref]
  2. Selvin E, Steffes MW, Zhu H, Matsushita K, Wagenknecht L, et al. (2010) Glycated hemoglobin, diabetes, and cardiovascular risk in nondiabetic adults. N Engl J Med 362: 800–811. [Crossref]
  3. Inzucchi SE, Bergenstal RM, Buse JB (2015) Management of hyperglycemia in type 2 diabetes, 2015: a patient-centered approach. Update to position statement of the American Diabetes Association and the European Association for the Study of Diabetes. Diabetes Care 38: 140–149. [Crossref]
  4. Paul SK, Klein K, Thorsted BL, et al. (2015) Delay in treatment intensification increases the risks of cardiovascular events in patients with type 2 diabetes. Cardiovascular Diabetology 14: 100.
  5. Edelman SV, Polonsky WH (2017) Type 2 Diabetes in the Real World: The Elusive Nature of Glycemic Control. Diabetes Care 40: 1425–1432. [Crossref]
  6. Rothwell PM (2005) External validity of randomised controlled trials: “to whom do the results of this trial apply?”. Lancet 365: 82–93. [Crossref]
  7. Lindenfeld J, Jessup M (2017) ‘Drugs don’t work in patients who don’t take them’ (C. Everett Koop, MD, US Surgeon General, 1985). Eur J Heart Fail 19: 1412–1413. [Crossref]
  8. Rodbard HW, Jellinger PS, Davidson JA (2009) AACE/ACE Consensus Statement. Statement by an American Association of Clinical Endocrinologists/American College of Endocrinology consensus panel on type 2 diabetes mellitus: an algorithm for glycemic control. Endocr Pract 15 (1): 540–559. [Crossref]
  9. American Diabetes Association (2016) 5. Glycemic Targets. Diabetes Care 39 Suppl 1: S39–46. [Crossref]
  10. Owens DR (2013) Clinical evidence for the earlier initiation of insulin therapy in type 2 diabetes. Diabetes Technol Ther 15: 776–785. [Crossref]
  11. Turner RC, McCarthy ST, Holman RR, Harris E (1976) Beta-cell function improved by supplementing basal insulin secretion in mild diabetes. Br Med J 1: 1252–1254. [Crossref]
  12. Unger J (2008) Reducing oxidative stress in patients with type 2 diabetes mellitus: A Primary Care call to action. Insulin 3: 176–184.
  13. Monnier L, Colette C, Owens DR (2008) Glycemic Variability: The Third Component of the Dysglycemia in Diabetes. Is It Important? How to Measure It? J. Diabetes Sci Technol (6): 1094–1100. [Crossref]
  14. Rosseti P, Ampudia-Blasco FJ, Ascaso JF (2014) Old and new basal insulin formulations: understanding pharmacodynamics is still relevant in clinical practice. Diabetes Obes Metab 16: 695–706. [Crossref]
  15. Becker RHA (2015) Low within- and between-day variability in exposure to new insulin glargine 300 U/ml. Diabetes Obes Metab 17: 261–267. [Crossref]
  16. Jeff Unger (2012) Insulin initiation and intensification for patients with T2DM. In: Unger Jeff (Ed.) Diabetes Management in Primary Care- Second Edition. Lippincott, Williams and Wilkins. 2012. Philadelphia, PA. 453–490. [Crossref]
  17. ORIGIN Trial Investigators, Gerstein HC, Bosch J, Dagenais GR, Díaz R, et al. (2012) Basal insulin and cardiovascular and other outcomes in dysglycemia. N Engl J Med 367: 319–328. [Crossref]
  18. Marso SP, McGuire DK, Zinman B, Poulter NR, Emerson SS, et al. (2017) Efficacy and Safety of Degludec versus Glargine in Type 2 Diabetes. N Engl J Med 377: 723–732. [Crossref]
  19. Ferdinand KC, Senatore FF, Clayton-Jeter H, et al. (2017) Improving medication adherence in cardiometabolic disease: practical and regulatory implications. J Am Coll Cardiiol 69 (4): 437–451. [Crossref]
  20. Becker RH, Dahmen R, Bergmann K, Lehmann A, Jax T, et al. (2015) New insulin glargine 300 Units. mL-1 provides a more even activity profile and prolonged glycemic control at steady state compared with insulin glargine 100 Units. mL-1. Diabetes Care 38(4): 637–643. [Crossref]
  21. Becker RH, Nowotny I, Teichert L, Bergmann K, Kapitza C (2015) Low within- and between-day variability in exposure to new insulin glargine 300 U/ml. Diabetes Obes Metab 17: 261–267. [Crossref]
  22. Wysham C, Bhargava A, Chaykin L, de la Rosa R, Handelsman Y, et al. (2017) Effect of Insulin Degludec vs Insulin Glargine U100 on Hypoglycemia in Patients With Type 2 Diabetes: The SWITCH 2 Randomized Clinical Trial. JAMA 318: 45–56. [Crossref]
  23. Meneghini L, Atkin SL, Gough SC, et al. (2013) The efficacy and safety of insulin degludec given in variable once-daily dosing intervals compared with insulin glargine and insulin degludec dosed at the same time daily; a 26-week, randomized, open-label, parallel-group, treat-to-target trial in individuals with type 2 diabetes. Diabetes Care 36 (4): 858–864. [Crossref]
  24. Humulin [package insert] Indianapolis, Ind., Eli Lilly and Co., 2016. Available from pi.lilly.com/us/humulin-r-u500-pi.pdf. Accessed 11/10/17.
  25. Insulin initiation and intensification for patients with T2DM (2012) In Unger Jeff. Diabetes Management in Primary Care- Second Edition. Lippincott, Williams and Wilkins. Philadelphia, PA. 453–490.
  26. Humalog [package insert] Indianapolis, Ind., Eli Lilly and Co., 2015. Available from pi.lilly.com/us/humalog-pen-pi.pdf. Accessed Nov. 10, 2017
  27. Humalog [package insert] Indianapolis, Ind., Eli Lilly and Co., 2015. Available from pi.lilly.com/us/humalog-pen-pi.pdf. Accessed Nov. 10, 2017
  28. Pi-Sunyer FX (2009) The Impact of Weight Gain on Motivation, Compliance, and Metabolic Control in Patients with Type 2 Diabetes Mellitus. Postgrad Med 121 (5): 94–107. [Crossref]
  29. Unger J, Parkin C (2011) Glucagon-Like Peptide-1 (GLP-1) Receptor Agonists: Differentiating the new medications. Diabetes Therapy. [Crossref]
  30. Marso SP, Daniels GH, Brown-Frandsen K, Kristensen P, Mann JF, et al. (2016) Liraglutide and Cardiovascular Outcomes in Type 2 Diabetes. N Engl J Med 375: 311–322. [Crossref]
  31. Marso SP, Daniesl GH, Brown-Frandsen K (2016) Liraglutide and cardiovascular outcomes in type 2 Diabetes. N Engl J Med 375: 311–322. [Crossref]
  32. Marso SP, Bain SC, Consoli A (2016) Semaglutide and cardiovascular outcomes in patients with type 2 diabetes. N Engl J Med 375: 1834–1844. [Crossref]

Response to Induction Therapy Confers a Significant Survival Benefit in Patients with Resected T4 Non-Small Cell Lung Cancer

DOI: 10.31038/CST.2017283

Abstract

Objective: Analyse outcome and detect prognostic factors in surgical candidates with T4 non-small cell lung cancer (NSCLC).

Methods: All T4 NSCLC patients operated between 2001 and 2014 were included. Charts were retrospectively reviewed and data analyzed. Survival was calculated from the date of surgery until last follow-up. The impact of the following variables on overall survival was assessed: type of induction/adjuvant therapy, use of cardiopulmonary bypass (CPB), R-resection type, T4 site, histology, radiologic response to induction and post-induction pathologic T and N stages.

Results: Eighty-three patients were included. In 58 patients (70%), T4 was defined by a single structure involvement including mediastinum (n = 18, 31%), left atrium/pulmonary vein (n = 13, 23%), superior vena cava/right atrium (n = 8, 14%), aorta (n = 6, 10%), pulmonary artery (n = 5, 9%), trachea/carina (n = 3, 5%), spine (n = 3, 5%) or recurrent laryngeal nerve (n = 2, 3%). Induction therapy was administered in 49 patients (59%) consisting in chemotherapy (n = 38, 78%), radiation (n = 1, 2%) or chemoradiation (n = 10, 20%). Lung resections were lobar (n = 15), sublobar (n = 2) or pneumonectomy (n = 52). One isolated carinal resection was performed. Thirteen patients (15%) had unresectable tumors. Cardiopulmonary bypass (CPB) was used in 13 patients (16%). Post-operative mortality was 7%. Overall survivals at 3 and 5 years were 35% and 31%, respectively. In the multivariate analysis, pathologic tumor downstaging (ypT) and CPB use were positive and negative prognostic factors, respectively.

Conclusions: T4 NSCLC can be safely resected in selected patients and within a multimodality therapy approach. Responders to induction therapy with T-downstaging carry a survival benefit compared to non-responders.

Key words

lung cancer, T4, surgery, induction therapy, cardio-pulmonary bypass

Introduction

Treatment for T4 non-small cell lung cancer (NSCLC) invading the mediastinum, heart, great vessels, trachea/carina and vertebral body tend not to be surgical. Indeed, in a cohort study from 1992 to 2002 from the Surveillance, Epidemiology, and End-Results (SEER) Medicare data, only 1177 among 13077 patients (9%) underwent resection [1]. However, selected T4 NSCLC can be treated surgically within a multidisciplinary approach with survivals overwhelming the non-surgical cohort [2-4].

Here, we report a single-center experience of patients who underwent T4 NSCLC resection, with the aim of identifying clinical factors influencing long-term survival. These factors will help better selecting patients who may benefit from this challenging type of surgery.

Material and methods

Patients with a cytology/histology-proven NSCLC and invading the mediastinum, heart, great vessels, trachea/carina, recurrent laryngeal nerve, esophagus or vertebral body on radiologic imaging and referred to our institution for surgery from 2001 to 2014 were included. Patients’ data were retrospectively retrieved from our institutional database and completed with data from patients’ electronic charts. Patient informed consent was obtained prior to surgery.

Staging was routinely performed with computed tomography (CT) of the chest and upper abdomen as well as whole-body positron emission tomography integrated in CT (PET/CT). FDG-avid mediastinal lymph nodes were assessed either by cervical mediastinoscopy or endobronchial ultrasound-guided fine-needle aspiration (EBUS-FNA). Brain CT and/or magnetic resonance imaging (MRI) was performed routinely both for staging and restaging purposes. Response to induction therapy was assessed radiologically by CT of the chest and upper abdomen, and/or PET/CT. Imaging was reviewed for the purpose of the study by one author (H.G.) and tumor response classified as complete response (CR), partial response (PR), stable disease (SD) or progressive disease (PD).

Patients who deemed technically completely resectable on imaging were planned for surgery and consisted in the patient cohort of the study. The appropriate surgical approach was planned according to imaging, mainly an anterolateral thoracotomy in the fifth intercostal space. If the tumor was deemed resectable after exploring the chest, the tumor and its surrounding invaded structures were removed en bloc. An anatomic lung resection was planned in all cases. Intraoperative lymph node staging was done according to the ESTS guidelines [5].

Indication and type of regimen for induction and adjuvant treatments were discussed on a case-by-case basis during our multidisciplinary tumorboard conference. Generally, three cycles of a platin-based doublet chemotherapy (with or without 45 Gy radiation) was administered preoperatively for cN2-disease or to decrease the local extension of the primary tumor. Adjuvant treatment was administered for persisting or unexpected N2-disease, or as part of a postoperative consolidation therapy.

NSCLC tumors were classified and staged according to the 7th edition of the TNM classification of malignant tumors [6].

Statistical analysis was performed using SPSS 20.0 for Windows software (SPSS Inc, Chicago, IL.). Overall survival was estimated from the date of surgery until death or last follow-up, using the Kaplan-Meier survival analysis method. The impact on survival of 9 discrete variables—type of induction/adjuvant therapy, use of cardiopulmonary bypass (CPB), R-resection type, site of T4, histology, radiologic response to induction and post-induction pathologic T and N stages —was assessed by log-rank test and quantified by univariate Cox regression analysis. Variables with statistical significance were further analyzed in a multiple Cox regression model (backward). A p-value less than 0.05 was considered significant.

Results

Eighty-three surgical candidates (23 females, 28%) with T4 NSCLC were included. Median age was 64 (from 41 to 87). Median preoperative FEV1 and DLCO were 75% (from 34 to 120) and 67% (from 20 to 120) of the predicted, respectively.

Tumors were classified as T4 due to involvement of multiple (n = 25, 30%) or a single structures (n = 58, 70%). The most common single structure involved was the mediastinum (n = 18, 31%), followed by left atrium/pulmonary vein (n = 13, 23%), superior vena cava/right atrium (n = 8, 14%), aorta (n = 6, 10%), pulmonary artery (n = 5, 9%), trachea/carina (n = 3, 5%), spine (n = 3, 5%) and recurrent laryngeal nerve (n = 2, 3%).

Surgery was performed upfront in 34 patients (41%). Induction therapy was administered in 49 patients (59%) and consisted in chemotherapy alone (n = 38, 78%), radiation alone (n = 1, 2%) or chemoradiation (n = 10, 20%). A median of 3 cycles (from 1 to 7) of platin-based chemotherapy doublets were administered. Median radiation dose was 44 Gy (from 31 to 72 Gy). No radiologic complete response was seen after induction therapy. Radiologic tumor responses were PR (n = 35, 71%), SD (n = 12, 25%) and PD (n = 2, 4%).

Tumors and invaded structures were resected en bloc. Cardio-pulmonary bypass (CPB) was used in 13 patients (16% – Table 1). Lung resection included pneumonectomy (n = 52, left-sided in 30), lobectomy (n = 15) or sublobar resection (n = 2). One isolated carinal resection was performed. Thirteen patients (15%) had unresectable tumors at explorative thoracotomy.

Table 1. Patients characteristics who underwent T4 resection under cardio-pulmonary bypass

age/sex approach resection cannulation site TN survival (months)
1 65/M left thoracotomy P, PA femoral v., aorta ypT4N1 R0 7
2 71/M right thoracotomy P, SVC-RA bicaval, aorta ypT4N1 R0 8
3 81/M left thoracotomy P, LA bicaval, aorta pT4N1 R0 72
4 45/M left hemiclamshell sleeve P, LA, PA, aorta RA, ascending aorta, descending aorta ypT4N1 R1 5
5 52/F right thoracotomy P, SVC-RA, LA bicaval, aorta ypT4N2 R0 22
6 64/M left thoracotomy P, LA femoral v., femoral a. T4N2 R1 11
7 87/M left thoracotomy lower lobe, LA PA, aorta T4N1 R2 1*
8 56/M left hemiclamshell P, aorta aorta, aorta T4N2 R0 4
9 69/F right thoracotomy sleeve P, SVC bicaval, aorta ypT4N2 R0 2
10 41/F right thoracotomy sleeve P, SVC bicaval, aorta ypT4N2 R0 4
11 55/F left thoracotomy P, LA, aorta PA, ascending aorta, descending aorta ypT4N2 R1 1**
12 65/F left thoracotomy P, LA femoral v., aorta ypT4N2 R0 9
13 58/F left hemiclamshell P, LA femoral v., aorta T4N0 R0 52+

M = male, F = female, P = pneumonectomy, PA = pulmonary artery, SVC = superior vena cava, RA = right atrium, LA = left atrium, v. = vein, a. = artery, + = alive, * from anoxic brain injury, ** from respiratory failure

NSCLC subtypes were squamous cell carcinoma (n = 48, 58%), adenocarcinoma (n = 25, 30%), large cell carcinoma (n = 6, 7%) and other (n = 4, 5%). Downstaging of pathologic tumor stage after induction therapy (ypT) occurred in 16 patients (33%), including ypT3 (n = 1, 6%), ypT2 (n = 7, 44%), ypT1 (n = 5, 31%) and ypT0 (n = 3, 19%). Thirty-three (67%) patients had persisting ypT4 on pathologic examination after induction therapy. Complete resection was achieved in 45 patients (55%). Twenty-two patients (27%) had microscopic incomplete resection (R1) while 16 (20%) presented with unresectable tumor or macroscopic incomplete resections (R2).

Thirty-day or in-hospital mortality was 7%. Cause of death was pneumonia/adult respiratory distress syndrome (n = 2), cerebral vascular insult (n = 2), pulmonary embolism (n = 1) and sepsis/multi-organ failure (n = 1).

Overall 3- and 5-year survivals for the whole cohort was 35% (Standard Error – SE = 6%) and 31% (SE = 5%), respectively (Figure 1). Median survival was 18 months (95% confidence interval – CI = 11-25). Median follow-up was 17 months (from 0 to 127). Although not significantly (p = 0.19), 3- and 5-year survivals increased to 37% (SE = 6%) and 34% (SE = 6%) when patients with exploratory thoracotomy were excluded.

Figure 1. Overall survival for surgical candidates with T4 non-small cell lung cancer.

Patients at risk:

Months 0 12 24 36 48 60
83 50 26 21 16 14

Univariate analysis showed that CPB use, type of radiologic response to induction therapy and pathologic T stage after induction (ypT) had a statistically significant impact on survival. In the multivariate analysis, only CPB use and ypT stage remained significant (Table 2). Corresponding survival curves are illustrated in Figures 2 and 3.

Figure 2. Survival depending on cardiopulmonary bypass (CPB) use. P-value from log rank test = 0.002.

Patients at risk:

Months 0 12 24 36 48 60
with CPB 13 3 2 2 2 1
no CPB 70 47 24 19 14 13

Figure 3. Survival depending on post-induction pathologic tumor stage (ypT). P-value from log rank test = 0.001.

Patients at risk:

Months

0

12

24

36

48

60

ypT0-3

15

13

10

9

9

8

ypT4

34

19

8

6

2

2

At the end of follow-up, 57 patients (69%) had a tumor recurrence. Median delay from surgery to first recurrence was 9 months (95%CI = 2-16). Recurrences were local intrathoracic (n = 28, 34%), distant (n = 17, 21%) or local and distant (n = 12, 14%). Disease-free survivals at 3 and 5 years was 29% (SE = 6%) and 23% (SE = 5%), respectively.

Table 2. Uni- and multivariate analysis of clinical variables with potential impact on survival. HR=hazard ratios, CI=confidence interval

co-variates p-value HR 95%CI
univariate analysis
type of inductionn=83 none (n=34) vs.chemo (n=38) vs.rad (n=1) vs.chemorad (n=10) 0.357
radiologic response to inductionn=49 stable/progressive disease (n=14) vs.partial response (n=35) 0.023+ 2.436 1.132-5.245
histologyn=83 adeno (n=25) vs.squamous (n=48) vs.large cell (n=6) vs.other (n=4) 0.681
ypTn=49 0-3 (n=15) vs.4 (n=34) 0.003+ 0.213 0.077-0.589
ypNn=49 0 (n=15) vs.1-2 (n=34) 0.150
R-resectionn=83 0 (n=45) vs.1-2 (n=38) 0.067
type of adjuvant treatmentn=83 none (n=46) vs.rad (n=25) vs.chemo (n=8) vs.chemorad (n=4) 0.231
use of CPBn=83 no (n=70) vs.yes (n=13) 0.003+ 0.371 0.194-0.711
site of T4n=83 single (n=58) vs.multiple (n=25) 0.390
multiple cox analysis
use of CPBn=83 no (n=70) vs.yes (n=13) 0.003+ 3.910 1.583-9.655
radiologic response to inductionn=49 stable/progressive disease (n=14) vs.partial response (n=35) 0.112+ 0.515 0.227-1.167
ypTn=49 0-3 (n=16) vs.4 (n=33) 0.012+ 3.884 1.349-11.185

+p-value derived from cox regression analysis

Discussion

Surgical treatment of T4 lung cancer is still debated. Analysis of the SEER Medicare database showed that only 9% of T4 NSCLC were offered surgery [1]. This is in part because of the potential for significant morbidity and mortality related to T4 surgery [7]. However, perioperative risk has diminished over time, with mortality ranging from 0% to 12.5% in more recent studies [7]. In our patient cohort, 30-day or in-hospital mortality was 7%.

Survival for patients with T4 NSCLC who cannot undergo complete resection is poor, ranging from 3% to 17% at five years [8-10]. In our cohort, 5-year survival reached 34% for resected T4 NSCLC. This is in line with results from the literature, where 5-year survival ranged from 19% to 38% [11-4].

Therefore, surgery for T4 NSCLC should be considered in relation to multidisciplinary care [7]. Patient selection plays a major role in decreasing perioperative mortality and increasing survival. From the literature, it has been demonstrated that completeness of resection as well as nodal status were factors significantly influencing survival [13,14]. In a large retrospective study including 271 patients with T4 NSCLC, five-year survivals for N0/N1 was 43% compared to 18% for N2/N3/M1, while 5-year survivals were 40% and 16% for R0 and R1 resections, respectively [13]. For both of these factors, only trends without significance were seen in our study.

We found in the multivariate analysis a significant impact on survival for histopathologic tumor response to induction therapy. Patients with pathologic downstaging to ypT0-3 had far better survivals compared to patients without downstaging (ypT4), namely 86% vs. 19% at five years. These results are in line with results of a previous study on T4 NSCLC invading the spine after induction treatment consisting in 2 cycles of cisplatin-etoposide combined to concurrent 45 Gy of radiation [15]. Patients with complete or near complete pathologic response, defined as ≥ 95% tumor necrosis on pathologic examination, behaved significantly better than patients with a partial response. Five-year survivals were 80% compared to 35%. Similar findings were also found in the context of stage IIIA-N2 NSCLC. A trend in better survivals was seen in patients with mediastinal downstaging, compared to patients with persistent N2 disease, with 5-year survivals of 49% and 27%, respectively [16].

Patients requiring CPB in our study had a 5-year survival of 15%. This is lower than the 37% reported in a systematic literature review including 20 articles and pooling 72 patients who required CPB for resection of NSCLC. The superiority survival reported in this review is mainly due to strong publication bias inherent to systematic literature reviews including a large number (12/20, 60%) of case reports or small case series including not more than three patients [17]. Nevertheless, CPB use was highlighted as a negative prognostic factor in the multivariate analysis from our cohort. The reason is unclear. First, it is demonstrated that CPB induced a pro-inflammatory response as well as a transient immunosuppression [18, 19]. Both of these effects may favor tumor progression. Second, it is postulated that tumors invading the heart or other vascular structures (and therefore requiring CPB) have a more aggressive biology. Indeed, in a study including thoracic inlet tumors, it was shown in a multivariate analysis, that subclavian artery invasion negatively impacted on survival [13]. These results are however in contradiction with results of a recent study on T4 surgical candidates, where survival was not different between patients operated on CPB (n = 20) vs. without CPB (n = 354) [10]. In this context, avoiding CPB whenever possible is probably an adequate strategy. Recently, in cases of aortic wall invasion by tumors, the placement of a thoracic aortic endograft allowed complete tumor resection without any aortic clamping or shunts [20].

Our study has some limitations, mostly due to its retrospective nature and limited sample size. However, it emphasized an additional criteria, namely pathologic response to induction treatment for better selecting patients who may benefit from surgery within a multimodal strategy in this heterogeneous T4 patient population.

Funding: None

Conflict of interest: None declared.

References

  1. Farjah F, Wood DE, Varghese TK Jr, Symons RG, Flum DR (2008) Trends in the operative management and outcomes of T4 lung cancer. Ann Thorac Surg 86: 368–374. [crossref]
  2. Bernard A, Bouchot O, Hagry O, Favre JP (2001) Risk analysis and long-term survival in patients undergoing resection of T4 lung cancer. European journal of cardio-thoracic surgery: official journal of the European Association for Cardio-thoracic Surgery 20: 344–9.
  3. Osaki T, Sugio K, Hanagiri T, Takenoyama M, Yamashita T, et al. (2003) Survival and prognostic factors of surgically resected T4 non-small cell lung cancer. Ann Thorac Surg 75: 1745–1751. [crossref]
  4. Spaggiari L, Magdeleinat P, Kondo H, Thomas P, Leon ME, et al. (2004) Results of superior vena cava resection for lung cancer. Analysis of prognostic factors. Lung Cancer 44: 339–346. [crossref]
  5. Lardinois D, De Leyn P, Van Schil P, et al. (2006) ESTS guidelines for intraoperative lymph node staging in non-small cell lung cancer. European journal of cardio-thoracic surgery : official journal of the European Association for Cardio-thoracic Surgery 30: 787–92.
  6. Vallieres E, Shepherd FA, Crowley J, et al. (2009) The IASLC Lung Cancer Staging Project: proposals regarding the relevance of TNM in the pathologic staging of small cell lung cancer in the forthcoming (seventh) edition of the TNM classification for lung cancer. Journal of thoracic oncology : official publication of the International Association for the Study of Lung Cancer 4: 1049–59.
  7. Reardon ES, Schrump DS (2014) Extended resections of non-small cell lung cancers invading the aorta, pulmonary artery, left atrium, or esophagus: can they be justified? Thoracic surgery clinics 24: 457–64.
  8. Jang RW, Le Maitre A, Ding K, et al. (2009) Quality-adjusted time without symptoms or toxicity analysis of adjuvant chemotherapy in non-small-cell lung cancer: an analysis of the National Cancer Institute of Canada Clinical Trials Group JBR.10 trial. Journal of clinical oncology : official journal of the American Society of Clinical Oncology 27: 4268–73.
  9. Fournel P, Robinet G, Thomas P, et al. (2005) Randomized phase III trial of sequential chemoradiotherapy compared with concurrent chemoradiotherapy in locally advanced non-small-cell lung cancer: Groupe Lyon-Saint-Etienne d’Oncologie Thoracique-Groupe Francais de Pneumo-Cancerologie NPC 95-01 Study. Journal of clinical oncology: official journal of the American Society of Clinical Oncology 23: 5910–7.
  10.  Langer NB, Mercier O, Fabre D, Lawton J, Mussot S, et al. (2016) Outcomes After Resection of T4 Non-Small Cell Lung Cancer Using Cardiopulmonary Bypass. Ann Thorac Surg 102: 902–910. [crossref]
  11. Yang HX, Hou X, Lin P, Rong TH, Yang H, Fu JH (2009) Survival and risk factors of surgically treated mediastinal invasion T4 non-small cell lung cancer. The Annals of thoracic surgery 88: 372–8.
  12. Pitz CC, Brutel de la Riviere A, van Swieten HA, Westermann CJ, Lammers JW, van den Bosch JM (2003) Results of surgical treatment of T4 non-small cell lung cancer. European journal of cardio-thoracic surgery: official journal of the European Association for Cardio-thoracic Surgery 24: 1013–8.
  13. Yildizeli B, Dartevelle PG, Fadel E, Mussot S, Chapelier A (2008) Results of primary surgery with T4 non-small cell lung cancer during a 25-year period in a single center: the benefit is worth the risk. The Annals of thoracic surgery 86: 1065–75
  14. Spaggiari L, Tessitore A, Casiraghi M, et al. (2013) Survival after extended resection for mediastinal advanced lung cancer: lessons learned on 167 consecutive cases. The Annals of thoracic surgery 95: 1717–25.
  15. Collaud S, Waddell TK, Yasufuku K, et al. (2013) Long-term outcome after en bloc resection of non-small-cell lung cancer invading the pulmonary sulcus and spine. Journal of thoracic oncology: official publication of the International Association for the Study of Lung Cancer 8: 1538–44.
  16. Decaluwe H, De Leyn P, Vansteenkiste J, et al. (2009) Surgical multimodality treatment for baseline resectable stage IIIA-N2 non-small cell lung cancer. Degree of mediastinal lymph node involvement and impact on survival. European journal of cardio-thoracic surgery: official journal of the European Association for Cardio-thoracic Surgery 36: 433–9.
  17. Muralidaran A, Detterbeck FC, Boffa DJ, Wang Z, Kim AW (2011) Long-term survival after lung resection for non-small cell lung cancer with circulatory bypass: a systematic review. The Journal of thoracic and cardiovascular surgery 142: 1137–42.
  18. Wilhelm W, Grundmann U, Rensing H, et al. (2002) Monocyte deactivation in severe human sepsis or following cardiopulmonary bypass. Shock 17: 354–60.
  19. Grundmann U, Rensing H, Adams HA, et al. (2000) Endotoxin desensitization of human mononuclear cells after cardiopulmonary bypass: role of humoral factors. Anesthesiology 93: 359–69.
  20. Collaud S, Waddell TK, Yasufuku K, et al. (2014) Thoracic aortic endografting facilitates the resection of tumors infiltrating the aorta. The Journal of thoracic and cardiovascular surgery 147: 1178–82

Development and Characterization of a Single Enzyme Linked Immunosorbent Assay for Detection of Antigen Specific IgG in Both Dogs and Cats

DOI: 10.31038/IJVB.2018211

Abstract

The purpose of this study was to develop and characterize an enzyme linked immunosorbent assay for detection of antigen specific IgG in dogs and cats that might be used to document the clinical validity of IgG testing in these animals. The reactivity of multiple lots of affinity purified anti-IgG specific to the fc component of dog IgG or cat IgG, and subsequently biotinylated, were evaluated against varying dilutions of both cat and dog sera. An admixture of these anti-IgG-biotin antibodies (25nG/mL each) was optimized to yield similar responses with reactive calibrators for the two species. No substantial difference in responses between operators were noted; the average intra-assay % CV for positive calibrators was calculated to be 5.7% (range 1.3% – 12.9%) and 8.3% (range 3.2% – 19.2%) for background responses. The average inter-assay variance for each of the operators was indistinguishable; the average % CV was calculated to be 10.6% (range 7.0% – 14.6 %). The intra-laboratory % CV among reactive calibrators remained relatively constant at 11.8% (range 7.4% – 13.1%), while the background variance was calculated to be only slightly higher at 14.0%. Evaluation of multiple samples from both cats and dogs, at a dilution of 1: 3000, against a panel of 24 environmental antigens (59 individual samples) and 24 food antigens (54 individual samples) demonstrate that IgG reactivity to all of these antigens is present in the majority of samples. Approximately 30% of the sample responses were within the lower range of detection (0 – 1000 EAU) and approximately 50% of all responses were in the mid-range (1001 – 3000 EAU) of detection, while the remaining 20% of sample response were in the upper range of detection (3001 – 4000 EAU) or beyond the limits of the assay. The results demonstrate the reproducibility and robustness of the assay and define its utility in detecting IgG specific for a number of different environmental and food antigens. Collectively, the results provide a foundation for future studies intended to address the issues associated with the validity of IgG testing (i.e. clinical sensitivity and specificity) for various antigens, especially those contained in food stuffs.

Key words

Dog IgG, Cat IgG, ELISA, Environmental Antigens, Food Antigens

Introduction

In recent years, information has been presented to document the advancements made in enzyme linked immunosorbent assays (ELISA) for detection of allergen specific IgE in companion animals [1-3]. Some of the commercially available assays have been well characterized and their functionality are continually monitored [2-7]. The utility of these IgE specific assays in confirming allergy diagnosis and providing a basis for selection of allergens to be included in immunotherapeutic regimes has been reasonably well established. In concert with these assays for detection of allergen specific IgE, ELISAs for detection antigen specific IgG have also been introduced [8-15] and substantial claims for the utility of these assays have been set forth in various promotional materials. A multitude of commercially available services are offered that range from monitoring allergen specific IgG following immunotherapy to those assays which purportedly define antigens that are involved with food hypersensitivity and/or intolerance. Unfortunately, very few studies have been published that characterize the assays used for these evaluations. Consequently, the clinical utility of these serum tests for detection of antigen specific IgG remains unclear. The results presented herein characterize a single ELISA that is designed to detect specific IgG to different environmental and food antigens in the sera of both dogs and cats that might provide a foundation for determining the validity of such testing.

Materials and Methods

Buffers

To maintain consistency of protocol and chemistry of assay components among assays for detection of allergen specific IgE, the IgG ELISA procedures used throughout this study mimics that of the previously characterized IgE macELISA for both dogs and cats. Thus, the buffers used were identical to those previously described [2-6] and include: a) well coating buffer: 0.05 M sodium carbonate bicarbonate buffer, pH 9.6; b) wash buffer: phosphate buffered saline (PBS), pH 7.4, containing 0.05% Tween 20, and 0.05% sodium azide; c) serum and reagent diluent buffer: PBS, pH 7.4, containing 1% fish gelatin, 0.05% Tween 20 and 0.05% sodium azide.

Sera

Dog sera and cat sera samples used in this study were originally received for evaluation of allergen specific IgE and were shown to be non-reactive or borderline reactive using the respective macELISA. For assay development and characterization, a single dog sera pool was prepared by combining 41 individual samples while a similar cat sera pool was prepared using 57 individual cat sera samples. A sufficient volume of glycerin was added to each sera pool to yield a 50% solution; the volume of dog sera/glycerin pool equaled 66 mL whereas the cat sera/glycerin pool yielded 80 mL. Sera pools and individual serum samples were stored at -20 °C.

Anti-IgG-Biotin Conjugate

The anti-IgG-biotin second antibody conjugate for both dogs and cats was purchased from Jackson ImmunoResearch Laboratories, Inc (West Grove, PA). Three separate lots of affinity purified rabbit anti-dog IgG-biotin, Fc fragment specific (code number 304-065-008), and three separate lots of affinity purified goat anti-cat IgG-biotin, Fc fragment specific (code number 102-065-008), were evaluated. Each lot of anti-IgG-biotin lyophilized material was reconstituted to a concentration of 1.0 mG/mL using an alkaline phosphatase stabilizing buffer (Sigma-Aldrich, St. Louis, MO) containing 50% glycerin; storage was at -20°C.

Preparation of Coated Wells

All allergen extracts used in this study were purchased from Stallergenes Greer (Lenoir, NC). Micro well flat bottom strip assemblies (Immulon 4HBH, Thermo Electron Corporation, Waltham, MA) were used throughout and served as the solid phase for all ELISA evaluations. The twelve well strips were individually coated with the specified allergen extracts following a previously defined procedure [2, 4-6]. Briefly, the individual extracts were diluted in bicarbonate buffer (pH 9.6) and 100 µL was added to each assigned well. Following overnight incubation at 4-8°C, the wells were washed with PBS, blocked with 1% monoethanolamine (pH 7.5) then air dried and stored at 4-8°C in Ziploc bags until used.

Allergen Panels

Two separate allergen panels were used for evaluation of individual sera samples. The first panel was a 24 allergen composite that is routinely used for the proficiency evaluations of the various laboratories that routinely run the Stallergenes Greer macELISA for detection of allergen specific IgE, and is derived from the array of allergens that are included in the specific panels routinely evaluated in the various laboratories [4-6]. The composite allergen panel consists of 4 grasses, 6 weeds, 6 trees, 5 mites, and 3 fungi. The second antigen panel encompassed an array of 24 food antigens that included 12 meats, 6 grains, and 6 other specific foodstuffs.

General ELISA Procedure for Sample Evaluations

The prototype Enzyme Linked Immunosorbent Assay (ELISA) protocol used for detection of antigen specific immunoglobulins of various isotypes in different species of companion animals has been previously described [2, 4-6]. Briefly, 100 µL of appropriately diluted sample is added to micro wells that had previously been coated with specifically defined allergens. Following an overnight incubation (14-18 hours) at 4-8 oC in a humidified chamber, the wells are washed (2 complete aspirate/wash cycles using PBS wash solution), then 100 µL of an appropriately diluted solution containing biotinylated anti-IgX (where X is equal to a species specific target isotype) second antibodies is added to each well. The wells are returned to the humidified chamber and incubation continued at room temperature (20-25°C) for another 2 hours, and then they are washed (3 complete aspirate/wash cycles). Appropriately diluted Streptavidin-Alkaline Phosphatase Enzyme conjugate (100 µL/well) is added and incubation at room temperature continued for 1 hour. Following a final wash step (4 complete aspirate/wash cycles) 100 μL of p-nitrophenylphosphate substrate (pNPP, Moss Substrates, Pasadena, Maryland) is added to each well and incubation continued for precisely 1 hour. Substrate development is then stopped by adding 50 μL of 20 mM cysteine to each well. Isotype specific antibody (IgX) reactivity to the antigens is estimated by determining the absorbance of each well measured at 405 nM using an automated plate reader. All results are expressed as ELISA Absorbance Units (EAU) which are background corrected observed responses expressed as milli-absorbance.

Statistics: A coefficient of variation (% CV) was calculated as the ratio of standard deviation and means of the responses observed for the solutions within different runs.

Results

Using a checkboard titration scheme, the reactivity of varying dilutions of sera containing grass specific IgG antibodies was determined using varying concentrations of separate lots of anti-IgG-Biotin; evaluations of three separate lots of both anti-dog IgG-biotin and anti-cat IgG-biotin were completed by two separate operators. Because the results obtained by the two operators for all individual evaluations were indistinguishable, the data were treated as a single population. The results presented in Table 1 demonstrate that substantial grass reactivity is evident in the dog sera pool when evaluated with varying concentrations of anti-dog IgG-biotin antibodies. Although reduced in magnitude of response, the anti-dog IgG-biotin antibodies also yield substantial reactivity with varying dilutions of the cat sera pool. Similarly, substantial grass reactivity is evident in the cat sera pool when reacted with varying concentrations of anti-cat IgG-biotin antibodies (Table 2), and a reduced signal is also evident with this regent when evaluating varying dilutions of the dog sera pool. This dual reactivity demonstrated for the anti-dog IgG-biotin and the anti-cat IgG-biotin is likely a consequence of shared or cross reactive epitopes present on the IgG of the two species. To be expected, the magnitude of response reduces in direct proportion to the concentration of anti-IgG used as well as the dilution of sera evaluated. It is noteworthy that the signal evident without the presence of sera (i.e. background response) were indistinguishable between species and remains low regardless of the concentration of anti-IgG-biotin used. Among the various anti-IgG-biotin concentrations (10 – 50 nG/mL) that might be adopted for use in the assay the background responses remain indistinguishable.

Table 1. Reactivity of varying concentrations of anti-DOG IgG-biotin when evaluated with varying dilutions of dog and cat sera pools.

IJVB2017-108-KenLee_F1

* Three separate lots of anti-IgG dog-biotin were evaluated in duplicate by two separate technicians.

Table 2. Reactivity of varying concentrations of anti-CAT IgG-biotin when evaluated with varying dilutions of cat and dog sera pools.

IJVB2017-108-KenLee_F2

*Three separate lots of anti-Cat IgG-biotin were evaluated in duplicate by two separate technicians.

In light of the similarity of the reciprocal results for the anti-dog IgG-biotin and the anti-cat IgG-biotin combined with the consistency among manufactured lots of the reagents, it seems logical that a single assay might be developed for detection of antigen specific IgG in both dogs and cats. To this end, a single secondary anti-IgG antibody regent was prepared by mixing the previously evaluated lots of anti-dog IgG-biotin and anti-cat IgG-biotin. The concentration of each biotinylated anti-IgG was adjusted to 1 mG/mL, then equal volumes of the separate reagents were mixed to yield a 1 mG/mL stock of anti-IgG-biotin reagent comprised of anti-dog IgG-biotin and anti-cat IgG-biotin with each at 500 µG/mL.

The results presented in Table 3 document the reactivity of varying concentrations of this dual reactive reagent with varying dilutions of dog and cat sera pools. Clearly, substantial antigen specific IgG reactivity is demonstrable with either dog or cat sera when evaluated in ELISA using this reagent as the secondary detection antibody. It is likely that the affinity purified anti-IgG-biotin specific for each species contains approximately the same number of reactive molecules. Consequently, the increased signal evident with the cat sera dilutions is likely a result of a greater content of antigen specific IgG present in the cat sera pool. Never the less, we demonstrate that the signals decrease in direct proportion to the dilution of sera evaluated as well as the concentration of anti-IgG-biotin used; the character is consistent with assays of this sort [16,17]. The variances evident between different operators and among different assay runs is also consistent with previous results defined for assays of this sort [2, 4-6]. The overall average % CV was calculated to be 13.0% (range, 2.1% – 24.7%) for dogs and 15.8% (range, 2.2% – 29.4%) for cats. The signals yielded with dog sera dilutions with an anti-dog IgG-biotin concentration of 25 nG/mL encompasses the potential range of reactivity and approximate the same order of magnitude of signals evident for the calibrators used in our assay for detection of allergen specific IgE in dog sera [2,4-6]. Consequently, the stock concentration of anti-IgG-biotin before dilution for use in an assay is adjusted to 25 µG/mL (1000 X use concentration). For consistency between assays, the calibrators that are intended for use in the antigen specific IgG ELISA need to be constructed to approximate the signals evident in the ELISA for detection of allergen specific IgE.

Table 3. Reactivity of varying concentrations of admixtures of anti-dog IgG-biotin anti-cat IgG-biotin when evaluated with varying dilutions of cat and dog sera pools.

IJVB2017-108-KenLee_F3

* Final concentration of anti-dog IgG-biotin and anti-cat IgG-biotin in equal concentration admixtures.

Three separate lots of anti IgG-biotin admixtures evaluated in duplicate by two separate technicians.

Because the ELISA for antigen specific IgG is designed to detect the respective antibodies in both dogs and cats, it is preferable that the calibrator system for this assay contain sera derived from both dogs and cats, and that the signal yielded with any dog sera are comparable to the signals observed with cat sera. To this end, we prepared a calibration system for the assay by preparing solutions containing appropriate mixtures of dog and cat sera. Before admixture, the appropriate dilution of each sera needed to yield comparable signals across a calibration range of 0 – 3500 EAU was empirically determined for each of the previously defined sera pools. For the current pools of cat and dogs sera that were defined in Tables 1-3, the mixture ratio has been defined to be 2.27. To attain the desired calibrator response for calibrator #1 (OD405 = 2.5 – 3.5) at this ratio using the current of dog and cat sera pools requires that the cat sera pool be at a 1: 1700 dilution, whereas the dog sera need be diluted 1: 750. To ensure equality of the signal magnitude for dogs and cats in the calibrator #1 mixture, the cat sera pool was first diluted 1: 850 and the dog sera pool 1: 375 and evaluated separately. Admixture of equal volumes of the separately diluted sera yielded calibrator # 1 to be used in the assay. Subsequent calibrator solutions (# 2-5) were then prepared as a three-fold serial dilution of the calibrator #1 solution.

The results presented in Table 4 document the reproducibility of manufacturing calibrator solutions. A total of seven sets of calibrator solutions were prepared separately by two different technicians and each component of each lot, along with the admixture of the components, was then evaluated in quadruplicate using varying concentrations of anti-IgG-biotin. The overall average % CV was calculated to be 10.4% (range, 3.5% – 18.8%) for the dog calibrator component and 9.8% (range, 3.1% – 20.1%) for the cat calibrator component; the admixture yielded an overall % CV of 12.8% (range, 3.4% – 19.6%). It is noteworthy that the signals generated at the projected assay concentration (25 nG/mL) are reduced in direct proportion to the calibrator dilution; a three-fold dilution in sera results in an approximate two-fold reduction in signal.

To define the overall reproducibility of the antigen specific IgG ELISA, the calibrator solutions were evaluated by two separate technicians on multiple occasions using grass pollen extract coated wells. The results presented in Table 5 document the overall % CV calculated from observed results within multiple assay runs performed by two separate operators. The overall average OD405 calculated for the five reactive calibrators and expressed as milli-absorbance units was 3099, 1591, 648, 254, and 139 for calibrator #1 – 5, respectively; the average background response was calculated to be 78 milli-absorbance units. The average intra-assay % CV among positive calibrators (#1-5) was calculated to be 5.7% (range 1.3% – 12.9%); substantial differences between operators and assay runs were not detected. To be expected, the greatest intra-assay variability was evident with the background ODs (average 8.3; range 3.2 – 19.2%); these responses are well within the expected limits for assays of this sort [2, 16, 17] The average inter-assay variance for each of the operators was indistinguishable and the average % CV was calculated to be 10.6% (range 7.0 – 14.6%). The intra-laboratory % CV among reactive calibrators (#1-5) remained relatively constant (average 11.8%; range 7.4 -13.1%), while the background variance was calculated to be only slightly higher at 14.0%.

To document the utility of the dual assay for detection of antigen specific IgG in the sera of dogs and cats, 59 samples from each species were evaluated on a panel of pollen and environmental antigens. In addition, 54 samples of each species were evaluated on a panel of food extracts. Preliminary evaluations (data not shown) indicate that antigen specific IgG is present at varying levels in the sera of essentially all dogs and cats, and dilution of each sera sample is necessary to estimate the relative quantities of antigen specific IgG. The results presented in Table 6 demonstrate that the magnitude of responses evident in dog sera spans the range of reactivity detectable using the antigen specific IgG ELISA following dilution of 1: 3000. Although the range of EAU detected with the sera samples varies among different antigens tested, the overall response indicates that approximately 30% of the sample responses are within the lower range of detection (0-1000 EAU) and approximately 20% of the sample response are in the upper range of detection (3001-4000 EAU), whereas nearly 50% of all responses are with the mid-range of detection (1001-3000 EAU). A similar response profile is also evident with cat sera samples (Table 7) following a dilution of 1: 3000, and approximately 50% of all sample responses fall within the mid-range of detectability. However, it appears that a greater percentage of samples (36 %) yield responses in the upper range of detection. Whether or not this observation is actually due to a greater quantity of antigen specific IgG in cat sera or merely a function of the population of samples selected for evaluation remains to be determined. However, in light of the quite similar responses evident for dogs (Table 8) and cats (Table 9) with the food antigen panel it is tempting to speculate that the differences observed with the pollen and environmental antigens is actually a function of the population selection.

Table 4. Reactivity of multiple manufacture lots of calibrator solutions detected with admixtures of anti-dog IgG-biotin and anti-cat IgG-biotin.

IJVB2017-108-KenLee_F4

*Final concentration of anti-dog IgG-biotin and anti-cat IgG-biotin in equal concentration admixtures.

Seven separate lots of each set of calibrators was prepared by two different operators and each calibrator solution was evaluated in quadruplicate in grass pollen allergen coated wells. Dog calibrators are prepared using dog sera only, cat calibrators are prepared using cat sera only, and Dog/Cat Calibrators contain both dog and cat sera.

Calibrator #1 is prepared as a dilution of a sera pool that is highly reactive to grass pollen allergens; calibrators #2 – #5 are prepared as a serial 3-fold dilution of calibrator #1.

¥Background responses observed with diluent in place of serum sample.

Table 5. Assay variance of IgG ELISA calibrator solutions observed with different laboratory runs by different operators.

IJVB2017-108-KenLee_F5

* Calibrator #1 is prepared as a dilution of a sera pool that is highly reactive to grass pollen allergens; calibrators #2 – #5 are prepared as a serial 3-fold dilution of calibrator #1.

Background responses observed with diluent in place of serum sample.

Table 6. Range of ELISA reactivity observed with randomly selected DOG sera samples when evaluated against a panel of pollen allergens using an ELISA specific for dog IgG and cat IgG.

IJVB2017-108-KenLee_F6

*EAU = ELISA Absorbance Units, which were calculated as the OD in milli-absorbance units corrected for background (Sample OD – Background OD x 1000) and normalized to a four-point calibration curve.

Table 7. Range of ELISA reactivity observed with randomly selected CAT sera samples when evaluated against a panel of pollen allergens using an ELISA specific for dog IgG and cat IgG.

IJVB2017-108-KenLee_F7

*EAU = ELISA Absorbance Units, which were calculated as the OD in milli-absorbance units corrected for background (Sample OD – Background OD x 1000) and normalized to a four-point calibration curve.

Table 8. Range of ELISA reactivity observed with randomly selected DOG sera samples when evaluated against a panel of food allergens using an ELISA specific for dog IgG and cat IgG.

IJVB2017-108-KenLee_F8

*EAU = ELISA Absorbance Units, which were calculated as the OD in milli-absorbance units corrected for background (Sample OD – Background OD x 1000) and normalized to a four-point calibration curve.

Table 9. Range of ELISA reactivity observed with randomly selected CAT sera samples when evaluated against a panel of food allergens using an ELISA specific for dog IgG and cat IgG.

IJVB2017-108-KenLee_F9

*EAU = ELISA Absorbance Units, which were calculated as the OD in milli-absorbance units corrected for background (Sample OD – Background OD x 1000) and normalized to a four-point calibration curve.

The results presented in Table 8 and Table 9 document the food antigen specific IgG reactivity detected in dogs and cats, respectively. Overall, approximately 40% of the samples in both dogs and cats tested for food specific IgG yielded responses in the lower range of detectability (0 – 1000 EAU); whereas, the percentage of results in the upper range of detection (>3001 EAU) was 12.9% for dogs samples and 15.8% for cat samples. Consistent with the results for the pollen specific IgG detection, approximately 50% of the samples tested yielded results within the mid-range of detection. In spite of the skewed response to food antigens, these results combined with the results for pollen and environmental antigen document the utility of the single ELISA for detection of antigen specific IgG in both dogs and cats.

Discussion

We have previously optimized and characterized an enzyme-linked immunosorbent assay (ELISA) for detection of allergen specific IgE in dogs [2]. This ELISA effectively serves as the prototype for developing similar assays for detection of antigen specific immunoglobulins of various isotypes in different species of companion animals. Logic dictates that when the ELISA protocol for detection of isotype specific immunoglobulins are maintained, the majority of assay components become interchangeable among assays. The only components that are unique to any immunoglobulin specific ELISA of this sort are the biotinylated secondary anti-IgX antibodies and the assay specific calibrators and control reagents. Thus, characterizing these species specific components should yield an optimized assay for that specific immunoglobulin isotype for any given animal companion. Furthermore, the results yielded will remain of the same sort and be easily accommodated by any reporting convention.

A critical component of any laboratory test is the validity of such a test (i.e. Does the test correlate with a disease state or condition?). However, before the validity of a test can be determined, it is necessary to ensure that the laboratory test is reliable. In determining reliability it is important to document reproducible manufacture of the assay components and of the reproducibility of the results generated among assay runs. In the current evaluation, we characterize a single ELISA for detection of antigen specific IgG not only in dogs but in cats as well. We have defined the procedure to reproducibly manufacture the critical components of the proposed assay and we document the reproducibility of the assay on multiple occasions. In addition, we have evaluated the relative levels of antigen specific IgG in dogs and cats to multiple environmental and food antigens using this assay.

In light of the observation that the majority of cats and dogs possess antigen specific IgG in their serum to essentially “all” antigens [8-11] and a serum dilution of 1: 3000 is required in the current assay to reach a response level that falls within the range of a calibration curve, the concept of “assay cutoff” loses meaning. For assays of this sort, the concept of lower limits of detection takes on more meaning. Considering the results presented in Table 4 which demonstrate that a three-fold dilution in sera results in an approximate two-fold reduction in signal and that the signal evident for calibrator # 5 (calculated to be 0.152.) is approximately twice the background response (calculated to be 0.072), it appears that a lower limit is defined by calibrator # 5 at 0.150 (i.e. 150 EAU). This lower limit of detection value is akin to the cutoff value defined for our macELISA for detection of allergen specific IgE in dogs and cats [2].

The IgG results might be reported in ELISA absorbance Units (EAU), which are merely background corrected responses normalized to the calibration curve and expressed in milli-absorbance. The daily results can then be normalized to historical observations of responses observed with the calibrator solutions, which will then allow direct comparison of results collected within different daily assay runs. This form of reporting will be in accord with the macELISA reporting for detection of allergen specific IgE [2].

Results might also be presented in a categorical representation of the relative quantity of antigen specific IgG [16, 17]. To determine the Relative IgG Units (RGU) will require interpolation from a regression curve (preferably a 4-parameter regression curve) created by plotting the background corrected optical density observed with each of the calibrators versus an arbitrarily assigned concentration value (perhaps 100,000 for calibrator #1) based upon the dilution schema used for preparing the calibrator solutions. The dose response curve evident with the calibrator solutions (Table 4) indicates that a three-fold dilution of serum results in an approximate two-fold reduction in signals generated. Thus, the relative amount of antigen specific IgG that might be detected at the lower limit of detection (150 EAU) will need to be increased three-fold to yield a response of 300 EAU and nine-fold to yield a response of 600 EAU; to generate a maximal signal (4000 EAU) will require nearly a 150-fold increase in antigen specific IgG. These finding then provide the bases for categorizing EAU responses into RGU as depicted in Table 10. Reporting of results in quantitative terms must await the characterization of known quantities of affinity purified antigen specific IgG (for each antigen of interest) that can be incorporated into a standard curve which can replace the calibration curve of the current assay.

Clinical improvement following immunotherapy is not simply due to increased production of IgG specific for the components in the treatment therapy, but it has been shown that the level of antigen specific IgG increases in the sera of dogs that have received an immunotherapeutic regime of allergen injections [18]. It is presumed that the IgG acts as a “blocking antibody” against antigens involved in IgE mediated allergy. Although improved responses due to allergen specific immunotherapy (ASIT) are likely a result of active modulation of the immune regulation mechanism, [9, 19-21 ] monitoring of the level of antigen specific IgG following immunotherapy might be included as an adjunct tool to insure the well-being of an allergic animal that has been placed on an immunotherapeutic allergen regime [18]. The assay characterized herein is readily adaptable to such a function.

Adverse food reactions in companion animals can be either food allergy or food intolerance. Allergy has an immunologic basis for its pathogenesis; but an immunologic basis for food intolerance has not be documented [9, 19-21]. The current methods for detection of food allergy includes elimination and challenge diets and serum testing might then be useful for selection of foods that might be included in an elimination-challenge diet. Commercial tests are available for detection of food-specific IgE or IgG in serum, and are promoted as diagnostic tools for food intolerance. Yet, the clinical sensitivity and specificity (validity) of these assays have not yet been adequately documented.

Table 10. Relative categories of IgG in relation to EAU and RGU and interpretation of results.

IJVB2017-108-KenLee_F10

*EAU = ELISA Absorbance Units, which were calculated as the OD in milli-absorbance units corrected for background (Sample OD – Background OD x 1000) and normalized to a four-point calibration curve.

RGU = Relative IgG Units interpolated from regression curve constructed from calibrator responses.

When considering IgG specific responses, high circulating levels of IgG are purported to correlate with clinical food allergy signs and detecting high levels or IgG to certain antigens is supposedly useful in pinpointing various antigens to avoid. Unfortunately, no well controlled prospective studies have been reported to support this contention. In light of the results presented herein (Tables 8-9), which document that the majority of cats and dogs contain IgG to most food stuffs, the mere detection of IgG specific for the food components cannot be the basis for allergy or intolerance. Thus, to conclude an involvement of IgG would require that a difference in the level of IgG to a specific antigen be finite or that a subclass of IgG is the causative agent. The authors are unaware of any study that defines the level of food specific IgG or subclass of IgG required to induce an allergic response. However, the development and characterization of the antigen specific IgG ELISA defined herein opens the possibilities for investigations in this arena. The results presented herein characterize a single ELISA that is capable of detecting antigen specific IgG in both dogs and cats. We have documented the reproducibility and robustness of the assay and defined its utility in detecting IgG specific for a number of different environmental and food antigens. Finally, we have documented the IgG reactivity to these antigen arrays in a subpopulation of dogs and cats. Collectively, these results provide a foundation for future studies intended to address the issues associated with the validity of IgG testing (i.e. clinical sensitivity and specificity) for various antigens, especially those contained in food stuffs.

Authors Contributions

Brennan McKinney and Karen Blankenship manufactured all components used throughout the evaluation and contributed to acquisition, analysis, and interpretation of data. Kenneth Lee contributed to the conception and design of the study; contributed to the acquisition, analysis, and interpretation of data; and drafted the manuscript. All authors gave final approval and agree to be accountable for all aspects of the work in ensuring that questions relating to the accuracy or integrity of any part of the work are appropriately investigated and resolved.

Declaration of conflicting interests: All authors are employees at Stallergenes Greer

Funding: Funding for this study was provided by Stallergenes Greer.

References

  1. DeBoer DJ, Hillier A (2001) The ACVD task force on canine atopic dermatitis (XVI): laboratory evaluation of dogs with atopic dermatitis with serum-based “allergy” tests. Vet Immunol Immunopathol 81: 277–87.
  2. Lee KW, Blankenship KD, McCurry ZM, Esch RE, DeBoer DJ, et al. (2009) Performance characteristics of a monoclonal antibody cocktail-based ELISA for detection of allergen-specific IgE in dogs and comparison with a high affinity IgE receptor-based ELISA. Vet Dermatol 20: 157–164. [crossref]
  3. Stedman K, Lee K, Hunter S, Rivoire B, McCall C, et al. (2001) Measurement of canine IgE using the alpha chain of the human high affinity IgE receptor. Vet Immunol Immunopathol 78: 349–355. [crossref]
  4. Lee KW, Blankenship KD, McCurry ZM, et al. (2012) Reproducibility of a Monoclonal Antibody Cocktail Based ELISA for Detection of Allergen Specific IgE in Dogs: Proficiency Monitoring of macELISA in Six US and European Laboratories. Vet Immunol Immunopathol 148: 267–275.
  5. Lee KW, Blankenship K, McKinney B, et al. (2015) Proficiency monitoring of monoclonal antibody cocktail–based enzyme-linked immunosorbent assay for detection of allergen-specific immunoglobulin E in dogs. Journal of Veterinary Diagnostic Investigation 27: 461–469.
  6. Lee KW, Blankenship K, McKinney B, et al. (2017) Continued Proficiency Monitoring Of Monoclonal Antibody Cocktail-Based Enzyme-Linked Immunosorbent Assay for Detection of Allergen Specific Immunoglobulin E in Dogs – 2016. Integr J Vet Biosci 1: 1–10
  7. Thom N, Favrot C, Failing K, et al. (2010) Intra- and interlaboratory variability of allergen-specific IgE levels in atopic dogs in three different laboratories using the Fc-??receptor testing. Vet Immunol Immunopathol 133: 183–189.
  8. Halliwell, R.E.W., Gordon, C.M., Horvath, C. (2005) IgE and IgG antibodies to food antigens in sera from normal dogs, dogs with atopic dermatitis and dogs with adverse food reactions. In: Hillier, A., Foster, A.P., Kwochka, K.W. (Eds.), Advances in Veterinary Dermatology. Blackwell Publishing, Oxford 28–35.
  9. Pucheu-Haston CM, Bizikova P, Eisenschenk MN, Santoro D, Nuttall T, et al. (2015) Review: The role of antibodies, autoantigens and food allergens in canine atopic dermatitis. Vet Dermatol 26: 115–115e30. [crossref]
  10. Bethlehem S, Bexley J, Mueller RS (2012) Patch testing and allergen-specific serum IgE and IgG antibodies in the diagnosis of canine adverse food reactions. Vet Immunol Immunopathol 145: 582–589.
  11. Zimmer A, Bexley J, Halliwell RE, et al. (2011) Food allergen-specific serum IgG and IgE before and after elimination diets in allergic dogs. Vet Immunol Immunopathol 144: 442–447
  12. Hofmaier S, Comberiati P, Matricardi PM (2014) Immunoglobulin G in IgE-mediated allergy and allergen-specific immunotherapy. Eur Ann Allergy Clin Immunol 46: 6–11. [crossref]
  13. Jeffers JG, Shanley KJ, Meyer EK (1991) Diagnostic testing of dogs for food hypersensitivity. J Am Vet Med Assoc 198: 245–250. [crossref]
  14. Hardy JI, Hendricks A, Loeffler A, et al. 2014. Food-specific serum IgE and IgG reactivity in dogs with and without skin disease: lack of correlation between laboratories. Vet Dermatol 25: 447–e70.
  15. Foster AP, Knowles TG, Moore AH, Cousins PD, Day MJ, et al. (2003) Serum IgE and IgG responses to food antigens in normal and atopic dogs, and dogs with gastrointestinal disease. Vet Immunol Immunopathol 92: 113–124. [crossref]
  16. Tijssen P (1993) Processing of data and reporting of results of enzyme immunoassays. In: Burdon, RH, van Knippenberg PH, editors. Practice and Theory of Enzyme Immunoassays 385–421. Elsevier, Amsterdam.
  17. World Organisation for Animal Health (OIE) (2014) Development and optimization of antibody detection assays. In: Manual of Diagnostic Tests and Vaccines for Terrestrial Animals, OIE, Paris, France.
  18. Hites MJ, Kleinbeck ML, Loker JL, Lee KW (1989) Effect of immunotherapy on the serum concentrations of allergen-specific IgG antibodies in dog sera. Vet Immunol Immunopathol 22: 39–51. [crossref]
  19. Kennis RA (2006) Food allergies: update of pathogenesis, diagnoses, and management. Vet. Clin. North Am. Small Anim Pract 36: 175–184.
  20. Akdis CA, Akdis M (2015) Mechanisms of allergen-specific immunotherapy and immune tolerance to allergens. World Allergy Organ J 2015; 8: 17
  21. Mandigers P, German AJ (2010) Dietary hypersensitivity in cats and dogs. Tijdschr Diergeneeskd 135: 706–710. [crossref]

Higher Serum Ferritin in Tibetan and Han Populations with Diabetes Living on the Tibetan Plateau

DOI: 10.31038/EDMJ.2018211

Abstract

Objective: Tissue iron has emerged as a significant risk factor for diabetes. Pathways that sense and regulate iron and oxygen interact, but few studies examined the interactions of hypoxia and iron in determining diabetes risk in human populations. Accordingly, metabolic phenotyping with analysis of iron homeostasis in both Tibetan and Han Chinese living at 2300-3900m altitudes were conducted.

Research design and methods: Data were collected on Tibetan and Han Chinese living at intermediate altitudes. Iron homeostatic and metabolic parameters including homeostasis model assessments (HOMA), hemoglobin A1c, serum ferritin and transferrin saturation were determined.

Results: Serum ferritin is higher in both Tibetan groups compared to the respective Han groups, and higher in each diabetic group compared to nondiabetics of the same ethnicity. Serum iron and transferrin saturation were also higher in the Tibetan diabetics than the Tibetan non-diabetics. Serum iron was significantly correlated with ferritin levels in the four combined groups (r2=0.07313, p<0.05) and even stronger in the Tibetan diabetic group (r2=0.2702, p<0.05). HOMA-β was negatively correlated with ferritin in the Tibetan combined groups (r2=0.020, p<0.05), and HOMA-IR tended to be positively correlated with ferritin (r2=0.018, p<0.05).

Conclusion: Iron parameters differ both between Han and Tibetans and between diabetics and nondiabetics of both populations. High ferritin, which in these cohorts reflects iron status, is a risk factor for diabetes in both groups, although how iron status relates to the diabetes phenotype differs between the two groups, possibly related to their differing histories of adaptation to high altitude.

Keywords

Iron; Ferritin; Diabetes; Tibetan Adaptation

Key Messages

  • The study presents evidence of the relationship between serum ferritin, a measure of tissue iron stores that has been linked to diabetes risk in other populations, and diabetes in Tibetan and Han populations living at altitudes of 2300 m-3900 m.
  • The study also presents associations of glucose metabolic phenotypes (homeostasis model assessments, HOMA) in those with diabetes.
  • Due to the relatively low prevalence of diabetes in Tibetan populations, the sample size was constrained
  • This study is cross-sectional and therefore, future prospective and follow-up studies to reveal the interactions analysis of iron metabolism and diabetes in Tibetans and Han populations are indicated.
  • The ethnic background of the subjects is by self-report

Introduction

Many factors contribute to the risk of diabetes, including genetics, ethnicity, altitude, and diet [1]. Tissue iron has emerged as an additional significant risk factor for diabetes and has been shown to play an important role in metabolic regulation [2,3]. The initial association between diabetes risk and iron emerged from studies of heritable diseases of iron overload such as hereditary hemochromatosis (HH) [4]. More recent studies demonstrate that the relation between iron and diabetes also exists in the general population and across the broad range of “normal“ iron, and an associations between iron and diabetes have been established in Caucasians [3,5], persons of African descent [6], and several Asian populations [7-11,12]. The mechanism by which iron confers diabetes risk, however, is not established in all of these populations, and the interactions of genetics, diet, and geography with the degree of risk are also unknown.

The interaction of iron and altitudes particularly interesting because residence at higher altitudes is inversely associated with diabetes, but hypoxia responsive pathways also increase iron absorption to allow increased erythropoiesis [13]. Tibetans have successfully adapted to reside at altitudes of up to 5000 m [14,15] and it has been reported that there is a reduced prevalence of diabetes and metabolic syndrome in Tibetans [16]. The genetic determinants of that adaptation include changes in the hypoxia sensing pathway [15]. One characterized genetic mechanism, for example, is a gain of function mutation that confers increased oxygen affinity to the proline hydroxylase that would normally be inactivated by hypoxia, thus facilitating stabilization of hypoxia inducible factors [17]. The adaptation was hypothesized to protect Tibetans from the induction of harmful levels of polycythemia. The mutation, which partially disables the hypoxia response, would also be expected to render Tibetans less sensitive to induction of the diabetes-protective hypoxia response to altitude. Because the hypoxia sensing pathway exerts major effects on multiple metabolic pathways and senses both tissue iron and oxygen levels [18], it is likely that altitude and iron interact to affect metabolism and diabetes risk, and that these interactions may differ in Tibetans. Interactions between iron and hypoxia have been studied in animal models and shown to affect hepatic glucose production [19], for example, a major factor in diabetes, but their interaction in human populations has not been examined.

In order to begin to address these issues, we have examined metabolic phenotypes and measures of iron homeostasis in Tibetan and Han Chinese with and without diabetes, living at altitudes of 2300-3900 m. The aim of this study was to identify how iron and high altitude hypoxia interact in a population of Tibetan highlanders genetically adapted to high altitude, compared to the non-adapted Han Chinese.

Participants and Methods

Participants

This cross-sectional study included one hundred Tibetan residents of an urban centre (Yushu, 3300-3900m altitude), with and without diabetes, randomly selected from a population receiving routine health screening, at Qinghai University Affiliated Hospital. One hundred Han Chinese individuals, with and without diabetes, matched for age and sex, were selected from a clinic-based population, at the Qinghai University Affiliated Hospital, in Xining (2300m). All the participants were chosen between September 2013 and September 2016.

Data collection and measurement

Clinical characteristics including sex, age, body mass index (BMI), and medical history were recorded. Height and weight were measured according to a standardized protocol and technique, with participants wearing no shoes. BMI was calculated as weight (kg)/height (m2). Blood pressure was measured by trained professionals, using an electronic sphygmomanometer (OMRON HEM-7200), and each participant rested for at least 20 min before measurements were taken.

Health screening included the measurement of fasting glucose and glycated haemoglobin (HbA1c) values. Blood samples were drawn from participants’ antecubital veins for measuring fasting blood glucose (FBG), triglycerides (TGs), total cholesterol (TC), low-density lipoprotein cholesterol (LDL-C) and high-density lipoprotein cholesterol (HDL-C) levels. From this information, de-identified participants of each ethnicity (Tibetan and Han Chinese), with no known history of diabetes and who had not taken any insulin or related drugs, were chosen. From among them, 100 individuals of each ethnicity who were newly diagnosed as having diabetes, based on fasting glucose (≥126 mg/dl) or HbA1c (≥6.5%) criteria, or who were nondiabetic, were randomly chosen. Individuals with known hematologic disorders, previously diagnosed diabetes, a history of recent (within 1 year) blood transfusion, and malignancy were excluded. In the case of those individuals, the blood samples drawn for health screening were used for the determination of levels of serum insulin and lipids, and iron parameters. The study was approved by the Ethnic Committee of Qinghai University, and the Institutional Review Board of Wake Forest University. Extra clinical samples were used for the additional testing of iron parameters.

Laboratory studies

Fasting blood glucose (FBG), fasting serum insulin, ferritin and serum iron, TG, LDL, HDL, total cholesterol (TH), and HbA1c levels were analysed by latex agglutination immunoassay (DCA 2000 HbA1c, Siemens Healthcare Co Ltd, Munich, Germany). These parameters were measured by standard techniques used in the clinical chemistry laboratories at the Qinghai University Affiliated Hospital. HOMA-IR and β-cell function (HOMA-β) (%) values were calculated as [FPG (mg/dl) ×IRI (μU/ml)]/405 and [IRI (μU/ml) × 360]/[FPG (mg/dl)-63], respectively.

Iron metabolic parameters were measured using an automated time-resolved immunofluorometric assay (Finland) and the reference values were: Serum iron, Male 11.6–31.7 μmol/L; Female 9.0–30.4 μmol/L, Total Iron Binding Capacity: 45-66 μmol/L, Transferring saturation, Male 20–50%; Female 15–50%, and Serum ferritin, Male 20–240 ng/mL; Female, 10–100 ng/mL)

Statistical analysis

Continuous variables that followed a skewed distribution were transformed to normal distribution by natural log or square root transformation. Using a Students’ t-test or Chi-square, the distribution of clinical and laboratory measurements was tested between individuals with and without diabetes, in the Han Chinese and Tibetan groups, respectively. Pearson and Spearman correlations were used to assess the correlations between ferritin levels, iron concentrations and other variables, in the two groups. Analyses were performed using SPSS 14.0 for Windows software package (SPSS, Chicago, IL). P values <0.05 were considered statistically significant.

Results

Characteristics of the Tibetan and Han Chinese study populations

Tibetan residents with diabetes(n=100) and Han Chinese with diabetes (n=100) were matched to 100 subjects of each group without diabetes, with respect to age, gender, body mass index, total hemoglobin and blood pressure (Table 1). As expected, each diabetic group had higher fasting glucose values than their respective non-diabetic group. HbA1c was not determined in those with FBG less than 126mg/dL. In the Tibetan diabetes group, surprisingly lower triglyceride levels, and lower HDL and higher LDL were noted compared to the non-diabetic group. LDL cholesterol concentrations were also higher the non-diabetic Han compared to the nondiabetic Tibetans (Table 1).

Iron parameters differ between Han Chinese and Tibetan populations, and between those with and without diabetes, and we identified a unique association between diabetes risk and the iron indices, in Tibetans. Because of our study population, which included Tibetans and Han Chinese individuals, both of whom reside in intermediate altitudes of 2300-3900 m, we examined the interrelations between serum iron-related parameters, ethnicity, and diabetes status, respectively. The ferritin level was higher in the diabetes group compared to the non-diabetes group, within the same ethnicity (p<0.01, Figure 1A). Our hypothesis is that, in the non-diabetes groups there should no difference in the ferritin level; however, it was observed that the ferritin level was higher in both Tibetan diabetes and non-diabetes groups, compared to the respective Han Chinese groups (p<0.01); this indicates that Tibetan populations showed specialized tissue iron storage.

Next, we assessed both β-cell function and insulin resistance, according to the homeostasis model assessment (HOMA-β and HOMA-IR). Insulin values were only available in the diabetes groups. The HOMA-IR values were greater than 2 in both the diabetes groups (Table 2); this was consistent with insulin resistance [19]. The HOMA-IR and HOMA-β values did not differ between the Han Chinese and Tibetan populations. The HOMA-β value was negatively correlated with ferritin, in both groups (r2=-0.02, p=0.04), and the HOMA-IR value tended to be positively correlated with ferritin (r2=0.02, p=0.05). Within each ethnicity, the same trends held, but did not reach significance in the smaller groups (Table 2).

Table 1. Distribution of variables in Tibetan and Han Chinese populations with and without diabetes. Results are presented as median (interquartile ranges).

Variable Tibetan Han Chinese
Diabetes groupn=100 Non-diabetes groupn=100 Diabetes groupn=100 Non-diabetes groupn=100
Age(years) 50(44~59.75) 50(45~58.75) 52(46~58) 54(48~58)
Gender (male%) 54% 52% 49% 55%
BMI(kg/m2) 24.08(22.53~26.23) 24.18(21.76~26.5) 24.22(22.2~26.2) 24.15(21.84~25.95)
Haemoglobin (g/L) 160(150~172) 163.02(146.97~172.09) 163(150~172) 160.34(144.49~173.58)
Diastolic Pressure (mmHg) 80(80~88) 80(80~84) 80(76~89) 80(78.25~85.75)
Systolic Pressure(mmHg) 124(120~140) 120(120~130) 120(120~130) 120(119.25~137.25)
Fasting Glucose(mmol/L) 9.36(8~10.94) 4.59(4.3~5) 8.15(6.8~11.39) 4.6(4.3~5.06)
Glycated Haemoglobin (%) 10.25(8.55~11.88) 8.8(7.05~10.2) *
Triglyceride(mmol/L) 1.68(1.32~2.33) 1.71(1.38~2.35)Δ 1.73(1.32~2.32)* 1.76(1.36~2)
Cholesterol(mmol/L) 4.58(4~4.93) 4.57(3.88~5.09) 4.52(3.96~5) 4.26(3.75~5)
HDL(mmol/L) 0.97(0.81~1.13) 1.03(0.85~1.19)Δ 1.03(0.88~1.19)* 1.08(0.88~1.26)
LDL(mmol/L) 3.01(2.25~3.63) 2.44(2.03~2.94)Δ 2.58(2.1~3.28)* 2.57(2~3)
Iron Metabolism
Iron(umol/L) 20(16.4~24.9) 15.6(12~20.58) Δ 16.9(12.85~22)* 15.75(12.9~18.83)
Ferritin (ng/ml) 613.89(457.07~812.75) 279.85(231.32~359.56) Δ 234.66(173.68~325.25)* 78(59.45~98.63)+
TIBC(umol/L) 29.3(23.1~35) 48.6(43.13~57.08) Δ 38(33.05~43.55)* 51.65(47.43~57.4)+
TSAT(%) 0.7(0.5~0.98) 0.33(0.25~0.39) Δ 0.46(0.31~0.64)* 0.30(0.25~0.35)+

 Notes: * for Tibetan diabetes group vs Han Chinese diabetes group with a significant difference of p<0.05; Δ for Tibetan diabetes group vs Tibetan non-diabetes group with a significant difference of p<0.05; + for Tibetan non-diabetes group vs Han Chinese diabetes group with a significant difference of p<0.05

Abbreviations: LDL, low-density lipoprotein; HDL,high-density-lipoprotein; TIBC, total iron binding capacity; TSAT, transferrin saturation

Table 2. Distribution of HOMA values in Tibetan and Han Chinese diabetes groups. Results are presented as median (interquartile ranges)

Variables Tibetans with diabetesN=100 Han Chinese with diabetesN=100 Z p
HOMA-IRHOMA-β 29.35(22.25~34)2.35(1.52~4.04) 25.64(17.02~46.79)2.44(1.49~3.59) -0.293-0.684 0.770.494

Abbreviations: HOMA, homeostasis model assessment; HOMA-IR, homeostasis model assessment insulin resistance

EDMJ2017-115-DonaldMcClain_F1

Figure 1. Iron metabolic values in Tibetan and Han Chinese groups with and without diabetes, in terms of A) Serum ferritin level comparisons; B) Serum iron level comparisons; C) Total iron binding capacity comparisons; and D) Transferrin saturation ratio comparisons.

*dot spot indicates the 5-95 percentile of the values.

Serum ferritin reflects the iron status in the study group, while other iron parameters are also associated with diabetes

After, we examined serum iron levels in the four groups. Like in the case of ferritin, the serum iron level was higher in Tibetans with diabetes than Tibetan without it; in addition, it was higher in Tibetan participants with diabetes than Han Chinese participants with diabetes (p<0.01 for both comparisons, Figure 1B), although the trend among Han Chinese participants with diabetes was only higher than those without diabetes in the same population (p<0.05). The same was true of transferrin saturation (p<0.01, Figure 1D). As further evidence that ferritin reflects iron status rather than inflammation, in our study, the serum iron and ferritin levels were significantly correlated in the four groups (r2=0.07, p<0.01, Figure 2). The correlation was even stronger in the Tibetan diabetes group (r2=0.27, p<0.01), but was not significant in the other groups, taken individually.

EDMJ2017-115-DonaldMcClain_F2

Figure 2. Correlation of serum iron and ferritin levels in Tibetan and Han Chinese populations, with and without diabetes. Scatter-plot diagram.

Higher ferritin levels identified as a new pattern of diabetes risk in Tibetans

Insulin resistance and decreased β-cell function can also result from as well as cause poor plasma glucose stability and hyperglycemia [20]. Therefore, we determined if glucose stability influenced the HOMA-βand HOMA-IR values. The associations of HbA1c levels with the HOMA-IR and HOMA-β values were assessed, respectively. However, HbA1c levels were not found to be correlated with HOMA-IR (p=0.95), HOMA-βor ferritin (p=0.63), in the Tibetan diabetes group. In the Han Chinese diabetes group, however, HbA1cwas significantly negatively correlated with ferritin (p=0.04) and the HOMA-β(p=0.04) value, and trended toward being negatively correlated with the HOMA-IR (p=0.11) value.

Discussion

Iron and diabetes risk in Tibetan and Han Chinese

The connection between iron and diabetes have been the subject of recent reviews [3,4,21-23] and a meta-analysis [24-26]. Originally identified in subjects with hereditary iron overload such as occurs in hereditary hemochromatosis [27,28], the correlation between markers of tissue iron and diabetes has since been noted in numerous populations in the U.S., Europe [3] and elsewhere, including Korean [7], Chinese Han [8-11], African Americans [6,29], and Persian populations [30]. Our findings generally support these studies insofar as Tibetans diabetics have higher ferritin than nondiabetics, and Han diabetics have higher ferritin than Han nondiabetics. However, serum ferritin can rise with systemic inflammation as well as tissue iron, and phlebotomy studies have shown ferritin to be related to tissue iron, but imperfectly so [31]. In general, however, tissue iron, in particular liver iron, is the predominant determinant of serum ferritin levels [32], and ferritin correlates very well with liver iron by imaging criteria [33]. Even in the inflammatory condition of non-alcoholic steatohepatitis, ferritin remains are liable reporter of tissue iron as assessed by liver biopsy [34]. Further evidence that ferritin is reporting on iron status is the correlation of ferritin with serum iron. Thus, although we do not have direct measures of tissue iron content, the results overall support the finding in multiple populations of a correlation of iron with diabetes prevalence. Further support for this conclusion is the large amount of data from animal and human models that support causal connections between iron and diabetes, mediated both by β-cell failure and insulin resistance with the underlying mechanisms including oxidant stress and modulation of adipokines that affect glycemia [29,31,35], and data from NHANES showing that ferritin reflects dietary iron intake rather than inflammation [5].

Our findings also indicate that ferritin remains associated with diabetes in residents of higher altitudes. This replicates a previously reported association of ferritin with diabetes in Han Chinese living at altitude [36]. Living at higher altitudes has been reported to be associated with lower diabetes risk [35] and likewise activation of hypoxia-sensing pathways has salutary effects on glucose homeostasis [37]. Thus, our study indicates that in both populations the association with iron is not erased by the beneficial effects of altitude, though we do not have diabetes incidence and prevalence data as a function of iron with which to examine their possible interaction.

We also show that Tibetans with and without diabetes have significantly higher ferritin levels and transferrin saturations than the Han population. The reasons for this are not clear. One possibility is diet, with the traditional Tibetan diet including substantial amounts of high-iron barley [1], and red yak meat; dietary surveys were not done in this study but would be useful in future studies aimed at explaining these parameters. Epidemiological investigations are needed to explain if the relative risk of diabetes for a given ferritin level is altered in Tibetans compared to Han. Interestingly, although the transferrin saturation is significantly higher in Tibetans with diabetes, which is accounted as much by low iron binding capacity as by higher serum iron, but the basis for this is not known. Finally, hypoxia also induces increased absorption of dietary iron to support polycythemia at altitude. Tibetans have genetically adapted to high altitude with unique haplotypes and mutations in genes of the hypoxia sensing pathways [13], and this may explain part of the differences between the Tibetans and Han in the current study, who are residing at similar altitudes.

Mechanisms of iron-associated diabetes in the Han and Tibetans

Further indication that the association of ferritin, iron and diabetes risk is complex is that if the relationship were simply one of high iron, and if the high ferritin values in Tibetans did simply reflect high iron, that might imply higher diabetes risk in that population, whereas epidemiologic studies suggest that Tibetans have a lower prevalence to diabetes [9]. A minority of the subjects in this study were overweight, with average BMI in all groups being ~24, consistent with the reported association of altitude with leanness [38], and that might be expected, like the altitude itself [1], to counter any degree of iron-associated risk that might also be present. The associations of ferritin with HOMA-β and HOMA-IR were weaker than observed in the other populations cited in the Introduction, yet similar between Han and Tibetan groups. This, too, may be related to the dilution out of these effects by the altitude. The results suggest that altitude adds a new dimension to reported diabetes risk associations, and that further studies of diabetes prevalence in different populations living at high and low altitudes, with more detailed physiologic phenotyping and genotyping, may shed light on the pathogenesis of this disease.

Conclusions, unanswered questions and implication

To our knowledge, this is the first study to suggest that a special relationship exists between tissue iron storage and diabetes risk, in Tibetan populations. Furthermore, it is suggested that residing in high altitudes may impact the associations between the glucose metabolic phenotypes, and lead to more stabilised glucose levels and higher dependency on glucose for energy. In addition, the new patterns of iron homeostasis in Tibetans with urban lifestyles living at high altitudes might contribute to the special adaptations. Notably, since this study had a cross-sectional study design that involved a review of health record data, it was also impossible to obtain other data that may have been of interest, such as dietary histories, or further laboratory measures of other iron-related measures. Therefore, a future perspective and follow-up study to analyse the interactions of iron metabolism and diabetes, in Tibetan populations, is required. Most importantly, the genetic background of the study’s participants was not identified. In addition, the major regulators of iron such as hepcidin and transferring were also not investigated, and both factors play emerged effects on iron homeostasis in human beings. The prevention and management of diabetes through dietary iron intake intervention should be a potential therapy target in the future.

Contributors

ZB and DM wrote the manuscript; CZ and JZ collected and supplied the data; SL with YZ, RF and DM analysed the data; SC with RG designed and coordinated the study. All authors reviewed and approved the final manuscript.

Acknowledgements: The authors thank all the participants, as well all those who provided support.

Funding

This research was supported in China, by the: 1. National Program on Key Basic Research Project of China (No.2012CB518200) 2. National Natural Science Foundation of China (No. 31571231) 3. Science and Technology Department, International Cooperation Program of Qinghai Province (2015-HZ-807), and in the USA by: 4. United States National Institutes of Health1R01 DK081842 (DAM) and 5UL1 TR001420-02 (DAM); 5. United States Department of Veterans Affairs 2I01 BX001140 (DAM).

Competing interests: None.

Ethics approval: The Institutional Ethnic Committee of Qinghai University and the Institutional Review Board of Wake Forest University approved the study.

Data sharing statement: The data that support the findings of this study can be obtained from the corresponding author upon reasonable request.

References

  1. Wang Z, Dang S, Yan H (2010) Nutrient intakes of rural Tibetan mothers: a cross-sectional survey. BMC Public Health 10: 801–801. [Crossref]
  2. Swaminathan S, Fonseca VA, Alam MG, Shah SV (2007) The role of iron in diabetes and its complications. Diabetes Care 30: 1926–1933. [Crossref]
  3. Simcox JA, McClain DA (2013) Iron and diabetes risk. Cell Metab 17: 329–341. [Crossref]
  4. Fernández-Real JM, McClain D, Manco M (2015) Mechanisms linking glucose homeostasis and iron metabolism toward the onset and progression of type 2 diabetes. Diabetes Care 38(11): 2169–2176. [Crossref]
  5. Ford ES, Cogswell ME (1999) Diabetes and serum ferritin concentration among U.S. adults. Diabetes Care 22(12): 1978. [Crossref]
  6. Wilson JG, Lindquist JH, Grambow SC, Crook ED, Maher JF (2003) Potential role of increased iron stores in diabetes. American Journal of the Medical Sciences 325(6): p. 332–339. [Crossref]
  7. Kim CH, Kim HK, Bae SJ, Park JY, Lee KU (2011) Association of elevated serum ferritin concentration with insulin resistance and impaired glucose metabolism in Korean men and women. Metabolism 60(3): 414–420. [Crossref]
  8. Liu BW, Xuan XM, Liu JR, Li FN, Fu-Zai Yin (2015) The Relationship between Serum Ferritin and Insulin Resistance in Different Glucose Metabolism in Nonobese Han Adults. Int J Endocrin 642194.
  9. Jiang R, Manson JE, Meigs JB, Ma J, Rifai N, et al. (2004) Body iron stores in relation to risk of type 2 diabetes in apparently healthy women. JAMA 291: 711–717. [Crossref]
  10. Shi Z, Hu X, Yuan B, Pan X, Meyer HE (2006) Association Between Serum Ferritin, Hemoglobin, Iron Intake, and Diabetes in Adults in Jiangsu, China. Diabetes Care 29(8): p. 1878. [Crossref]
  11. Luan de C, Li H, Li SJ, Zhao Z, Li X, Liu ZM (2008) Body Iron Stores and Dietary Iron Intake in Relation to Diabetes in Adults in North China. Diabetes Care 31(2): p. 285. [Crossref]
  12. Jung CH, Lee MJ, Hwang JY, Jang JE, Leem J, et al. (2013) Elevated Serum Ferritin Level Is Associated with the Incident Type 2 Diabetes in Healthy Korean Men: A 4 Year Longitudinal Study. PLoS One 8(9): p. e75250. [Crossref]
  13. Gassmann M, Muckenthaler MU (2015) Adaptation of iron requirement to hypoxic conditions at high altitude. J Appl Physiol (1985) 119: 1432–1440. [Crossref]
  14. West JB (2012) Concise Clinical Review: High Altitude Medicine. Am J Resp Crit Care Med 186(12): p. 1229–1237. [Crossref]
  15. Simonson TS, McClain DA, Jorde LB, Prchal JT (2012) Genetic determinants of Tibetan high-altitude adaptation. Hum Genet 131: 527–533. [Crossref]
  16. Okumiya K, Sakamoto R, Ishimoto Y, Kimura Y, Fukutomi E, et al. (2016) Glucose intolerance associated with hypoxia in people living at high altitudes in the Tibetan highland. BMJ Open 6(2): p. e009728. [Crossref]
  17. Lorenzo FR, Huff C, Myllymäki M, Olenchock B, Swierczek S, et al. (2014) A genetic mechanism for Tibetan high-altitude adaptation. Nat Genet 46: 951–956. [Crossref]
  18. Semenza GL (2004) Hydroxylation of HIF-1: Oxygen Sensing at the Molecular Level. Physiology (Bethesda) 19(4): p. 176. [Crossref]
  19. Rabasa-Lhoret R, Bastard JP, Jan V, Ducluzeau PH, Andreelli F, Guebre F, et al. (2003) Modified Quantitative Insulin Sensitivity Check Index Is Better Correlated to Hyperinsulinemic Glucose Clamp than Other Fasting-Based Index of Insulin Sensitivity in Different Insulin-Resistant States. J Clin Endocrinol Metab 88(10): p. 4917–4923. [Crossref]
  20. McClain DA, Lubas WA, Cooksey RC, Hazel M, Parker GJ et al. (2002) Altered glycan-dependent signaling induces insulin resistance and hyperleptinemia. Proc Natl Acad Sci U S A 99(16): p. 10695–10699. [Crossref]
  21. Ge RL, Simonson TS, Cooksey RC, Tanna U, Qin G, et al. (2012) Metabolic insight into mechanisms of high-altitude adaptation in Tibetans. Mol Genet Metab 106: 244–247. [Crossref]
  22. Nam H, Jones D, Cooksey RC, Gao Y, et al. (2016) Sink S Synergistic inhibitory effects of hypoxia and iron deficiency on hepatic glucose response in mouse liver. Diabetes [Crossref]
  23. Wang W, Knovich MA, Coffman LG, Torti FM, Torti SV (2010) Serum ferritin: Past, present and future. Biochim Biophys Acta 1800: 760-769. [Crossref]
  24. Kunutsor SK (2013) Ferritin levels and risk of type 2 diabetes mellitus: an updated systematic review and meta-analysis of prospective evidence. Diabetes Metab Res Rev 29(4): p. 308–318.
  25. Orban E (2014) Association of iron indices and type 2 diabetes: a meta-analysis of observational studies. Diabetes Metab Res Rev 30(5): p. 372–394.
  26. Fu S, Li F, Zhou J, Liu Z (2016) The Relationship Between Body Iron Status, Iron Intake And Gestational Diabetes: A Systematic Review and Meta-Analysis. Medicine 95(2): p. e2383. [Crossref]
  27. McClain DA, Abraham D, Rogers J, Brady R, Gault P, et al. (2006) High prevalence of abnormal glucose homeostasis secondary to decreased insulin secretion in individuals with hereditary haemochromatosis. Diabetologia 49(7): p. 1661–1669. [Crossref]
  28. Creighton Mitchell T, McClain DA (2014) Diabetes and hemochromatosis. Curr Diab Rep 14: 488. [Crossref]
  29. Gordeuk VR, McLaren CE, Looker AC, Hasselblad V, Brittenham GM (1998) Distribution of Transferrin Saturations in the African-American Population. Blood 91(6): p. 2175. [Crossref]
  30. Ashourpour M, Djalali M, Djazayery A, Eshraghian MR, Taghdir M, et al. (2010) Relationship between serum ferritin and inflammatory biomarkers with insulin resistance in a Persian population with type 2 diabetes and healthy people. Int J Food Sci Nutr 61(3): p. 316–323. [Crossref]
  31. Gordeuk VR, Reboussin DM, McLaren CE, Barton JC, Acton RT, et al. (2008) Serum ferritin concentrations and body iron stores in a multicenter, multiethnic primary-care population. Am J Hematol 83(8): p. 618–26. [Crossref]
  32. Ryan JD, Armitage AE, Cobbold JF, Banerjee R, Borsani O, et al. (2017) Hepatic iron is the major determinant of serum ferritin in NAFLD patients. Liver Int [Crossref]
  33. Valenti L, Fracanzani AL, Dongiovanni P, Bugianesi E, Marchesini G, et al. (2007) Iron depletion by phlebotomy improves insulin resistance in patients with nonalcoholic fatty liver disease and hyperferritinemia: evidence from a case-control study. Am J Gastroenterol 102(6): p. 1251–1258. [Crossref]
  34. Beaton MD, Chakrabarti S, Adams PC (2014) Inflammation is not the cause of an elevated serum ferritin in non-alcoholic fatty liver disease. Ann Hepatol 13(3): p. 353–356. [Crossref]
  35. Woolcott OO, Castillo OA, Gutierrez C, Elashoff RM, Stefanovski D, et al. (2014) Inverse Association between Diabetes and Altitude: A Cross Sectional Study in the Adult Population of the United States. Obesity (Silver Spring, Md.) 22(9): p. 2080–2090. [Crossref]
  36. American Diabetes Association (2009) Diagnosis and Classification of Diabetes Mellitus. Diabetes Care 32(Suppl 1): p. S62–S67.
  37. McClain DA, Abuelgasim KA, Nouraie M, Salomon-Andonie J, Niu X, et al. (2013) Decreased serum glucose and glycosylated hemoglobin levels in patients with Chuvash polycythemia: a role for HIF in glucose metabolism. J Mol Med (Berl) 91(1): p. 59–67. [Crossref]
  38. Weir MR, Klassen DK, Hoover N, Douglas FL (1989) Preliminary observations of the acute effects of selective serum thromboxane inhibition and angiotensin converting enzyme inhibition on blood pressure and renal hemodynamics in hypertensive humans. J Clin Pharmacol 29(12): p. 1108–1116. [Crossref]