Monthly Archives: April 2018

Intravitreal Injections of Melanocortin Receptor 1, 5 Agonists Prevents Neovascularization in a VEGF165 Mouse Model of Retinopathy

DOI: 10.31038/JCRM.2018112

Abstract

Background: The present study focuses on the evaluation of the protective effect on retinal neovascularization exerted by melanocortin receptor 1–5 (MCR 1–5) agonists in a mouse model of proliferative retinopathy induced by intravitreal injection of vascular endothelial growth factor 165 (VEGF165).

Methods: Intravitreal injections of the MCR1 agonist BMS-470539 and of the MCR5 agonist PG-901 were performed 7 days before the VEGF165 injection and 1 day after VEGF165 injection. Fluorescein angiography (FAG), immunohistochemical and biochemical analysis were performed at different time points during the follow up.

Results: FAG showed a marked vascular tortuosity accompanied by retinal neovascularization in mice receiving VEGF165 intravitreal injection and the absence of neovascularization in mice treated with MCR 1–5 agonists, confirmed by CD34 antigen immunostaining. The biochemical analysis of retinal VEGFR2 gene and protein expression showed that MCR 1–5 agonists significantly reduced VEGFR2 levels, increasing in parallel retinal mir-150 expression.

Conclusions: According to these evidences, we propose that intravitreal injections of melanocortin receptor agonists up-regulate mir-150 expression, and this consequently reduces VEGFR2 expression levels with the endpoint being the blockade of VEGF165 induced retinopathy.

Keywords

intravitreal injection; neovascularization; melanocortin receptors; retina; VEGF;

Introduction

Some of the major eye diseases that cause blindness worldwide are related to intraocular neovascularization. Among these conditions we must consider age-related macular degeneration (AMD), retinopathy of prematurity (ROP), diabetic retinopathy (DR) and retinal vascular occlusions (RVO), which are all linked to ocular ischemia that causes progressively elevated intraocular levels of vascular endothelial growth factor (VEGF) with secondary retinal, subretinal or intravitreal neovascularization leading to progressive visual impairment [1–4].

VEGF is the main player in neovascularization during proliferative retinopathy, it plays a key role as a potent inducer and modulator of proliferation, permeability and survival of endothelial cells. Four VEGF proteins are known VEGFA, -B, -C, -D that act through interaction with the VEGFR1, -2, and -3 receptor subtypes [5,6]. Among these, VEGFR2 is the main receptor that modulates endothelial cell proliferation, migration and in vivo angiogenesis [5,6]. Instead, VEGF-C and -D are involved in the modulation of cell adhesion and cell migration and in extracellular matrix degradation; VEGF-B and PIGF are involved in lymphangiogenesis [7]; VEGF-A promotes the process of neovascularization and increased vascular permeability. In particular, VEGF164(165) isoform is primarily implicated in the pathogenesis of major eye diseases that recognize ocular ischemia as a prime mover [8–11].

The introduction in clinical practice of various anti-VEGF drugs injected intravitreally (bevacizumab, ranibizumab, aflibercept) [12] for the management of the main eye diseases has positively changed the evolution and prognosis of diseases such as AMD,ROP, DR and RVO. In fact, an open research of new strategies and tools has been undertaken nowadays.

Previous studies by Rossi et al.,(2016) indicated that one of these strategies could be that of the modulation of the activity of the retinal endogenous melanocortin pathway and receptors. Indeed, he showed that an agonism at melanocortin receptor 1,5 (MCR1–5) attenuates retinal damage in a mouse model of streptozotocin (STZ) induced diabetic retinopathy (DR) by modulating the pattern of cytockine and chemochine expression [13]. Subsequently, Maisto el al. evidenced that this MCR1–5 agonism restores antioxidant enzyme levels in high glucose primary retinal cells and protects the photoreceptors from the glucose induced damage [14]. These receptors, therefore, appeared to be good candidates for targeted therapy of diabetic retinopathy and possibly its proliferative form as well. Noteworthy, these melanocortin receptors have already been accredited to control a wide range of biological activities including inflammation, oxidative stress, energy homeostasis, sexual function, pain and immune response [13].

Based on this experience, the present study aimed to evaluate the protective effect exerted by MCR 1–5 agonists on retinal vascularization in a mouse model of retinopathy induced by intravitreal injection of VEGF165.

Materials and Methods

BMS-470539 and PG-901 were used as MCR1 and MCR5 agonist respectively [15] and were supplied by Professor Grieco (Pharmacy Department, University of Naples Federico II).

Animals

All the experimental procedures were performed according to Animal Care Ethical Committee of the University of Campania, in accordance with ARVO Statement for the use of Animals in Ophthalmic and Vision Research.

C57BL/6 mice (Harlan, Italy) aged 7 to 10 weeks were housed in standard cages with 24-hours light-dark cycle, humidity and temperature automatically controlled. C57BL/6 mice were divided into 2 settings: the first setting was composed of 2 groups (n = 12 animals per group), treated respectively with sham intravitreous injections of 5μl balanced saline (0.1 ml) and 5μl intravitreal injection of VEGF165 (10μg, Sigma-Aldrich, Italy) [10,11] on day 0. The two groups were monitored by FAG in order to ascertain the time course of the vascular modifications. The second setting was composed of the following 2 groups (n = 8 animals per group): (1) mice treated with 5μl intravitreal injection of the MC1 receptor agonist BMS-470539 (33 μmol) [16] 7 days before the injection of VEGF165 and 1 day after VEGF165 injection; (2) mice treated with 5μl intravitreal injection of the MC5 receptor agonist PG-901 (7.32 nM) [17] 7 days before the VEGF165 injection and 1 day after VEGF165 injection, following pioneering in house experience.

Intravitreal injections

Mice were anesthetized by pentobarbital (45 mg/kg in saline i.p.). Tropicamide (5%) was instilled into the right eye of each animal, in order to induce papillary dilation, and tetracaine (1%) was topically applied for local anaesthesia. Physiological saline, VEGF165 or MC receptor agonists (5 μL volume) were injected intravitreally into the right eye using sterile syringes fitted with a 30-gauge needle (Microfine; Becton Dickinson AG, Meylan, France), as previously described [10,11,18]. Briefly, a transconjunctival 30-gauge, 1.5-mm needle was introduced behind the limbus in the superior temporal quadrant. When the needle was visualized at the vitreous, the various substances were injected in the various experimental groups. After the needle was withdrawn, the scleral entrance site was compressed with a cotton tip for 1 min and a topical antibiotic ointment was applied.

The following MC receptor ligands were used at the indicated doses as selected from the reported publications: BMS-470539, 33 μmol; PG-901, 7.32 nM [16,17].

Fluorescein Angiography (FAG)

For FAG assessment the animals were restrained without anesthesia by grasping firmly at the base of the tail and grasping the scruff of the neck. FAG was performed by using a Topcon TRC-50DX apparatus (Topcon, Japan) following intraperitoneal injection of 10% fluorescein sterile solution (1 mL/kg body weight, AK-Fluor; Akorn Inc., USA). Fundus photographs were captured in order to display the retinal vasculature and to evaluate the early typical alterations of microangiopathy.

Follow-up

In the first setting, FAG was performed after papillary dilatation on all the animals receiving the intravitreal injection of balanced saline or VEGF165 in order to detect the appearance of early vascular disorders. At 7 the day time point, when FAG evidenced neovascularization in VEGF165 mice, 4 animals out of the 12 for each group were randomly chosen, sacrificed and assayed for VEGFR2 and other biochemical parameters. The remaining 8 animals were monitored with FAG at the 14 day time point, when neovascularization was still evident. Again, 4 mice out of the 8 were randomly chosen, sacrificed and assayed for same biochemical parameters as at 7 day time point. The remaining 4 animals were monitored by FAG at 28 days, when no signs of neovascularization were evidenced.

In the second setting, mice receiving intravitreal injection of BMS-470539 and PG-901 seven days prior and one day after VEGF165 were monitored by FAG at 7 and 14 day time points. At 7 days, 4 animals out of the 8 for each group were randomly chosen, sacrificed and assayed for VEGFR2 and other biochemical parameters. The remaining 4 animals were sacrificed and assayed for same biochemical parameters at 14 day time points.

For the biochemical analysis, the eyes were displaced forward by placing curved forceps around the posterior part and cut in two halves. On one half of each eye the cornea was cut using a sharp blade or scalpel, and the retina was squeezed through the cut together with residual pigment epithelium and lens by applying gentle pressure with the forceps. Dissected retina was placed in cooled PBS, freed from non retinal tissue using the forceps, and immediately frozen in liquid nitrogen and stored at −80°C for subsequent biochemical analysis. The other half of each eye was fixed by immersion in 10% neutral buffered formalin and paraffin-embedded for immunohistochemistry.

Immunohistochemistry

CD34 antibody was used as marker of neo-angiogenesis (sc-74499 Santa Cruz Biotec, USA). The ocular tissues were incubated with the primary antibody, washed in PBS, and incubated with secondary antibody. The ocular samples were analyzed by an expert pathologist (variability 6%); every sample was visualized at 200x magnification. The number of CD34 positive particles per area was analyzed in 20 microscopic fields and expressed as percentage of positive stained area/total area.

Total RNA isolation; mir-150 and VEGFR2 mRNA expression levels

The extraction of total RNA, including small RNAs, was performed according the MiRNeasy Minikit protocol (Qiagen, Italy). Syn-cel-miR-39 miScript miRNA Mimic 5 nM (Qiagen, Italy) was added to each sample before the extraction as internal control. The total RNA concentration and integrity were determined by Nanodrop ND-1000 UV spectrophotometer (Nano-Drop® Technologies, Thermo Scientific, USA).

The qRT-PCR analysis for mir-150 was performed on Mastercycler personal (eppendorf, Germany) using miScript II Reverse Transcription Kit (Qiagen, Italy) and on CFX96 Real Time

System cycler (BioRad, Italy) using miScript SYBR Green Kit (Qiagen, Italy) and miScript Primer Assays specific for Syn-cel-miR-39 and mir-150 (Qiagen, Italy).

VEGFR2 gene expression was measured by RT-PCR amplification on Mastercycler personal (eppendorf, Germany). cDNA synthesis was obtained using SuperScript III Reverse Transcriptase Kit (Invitrogen, USA) starting from 200 ng of total RNA. Aliquots of 2 μl cDNA were transferred into a 25 μl PCR reaction mixture containing dNTPs, MgCl2, reaction buffer, specific primers and GoTaq Flexi DNA polymerase (Promega, USA). Sequences for the mouse VEGFR2 mRNA from GeneBank (DNASTAR INC., USA) were used to design specific primer pairs for RT-PCR (Microtech, Italy). The housekeeping gene chosen was hypoxanthine-guanine phosphoribosyl transferase (HPRT). PCR products were resolved into 2.0% agarose gel. A semiquantitative analysis of VEGFR2 mRNA levels was carried out by the Gel Doc EZ UV System (Bio-Rad, USA).

Relative quantification of gene expression was normalized to Syn-cel-miR-39 for mir-150 and to HPRT for VEGFR2, using the 2^−ΔΔCt method.

Enzyme-Linked Immunosorbent Assay (ELISA)

Mouse VEGFR2/Flk-1 Quantikine ELISA Kit (R&D System, UK) was used in the homogenate of dissected retina in order to assess the ocular protein VEGFR2 expression levels, according to the manufacturer’s protocol.

Statistical Analysis

All values are expressed as mean ± standard error of the mean (SEM) of = 4 mice. Statistical analyses were assessed either by Student’s -test (when only two groups were compared) or one-way analyses of variance (ANOVA), followed by Dunnett’s post hoc test (more than two experimental groups). < 0.05 was considered statistically significant.

Results

Melanocortin Receptor1–5 activation prevents the development of retinal neovascularization

No significant vascular alterations were observed in the control group at any of the various time points (Figure 1a and Figure 2a). All the mice treated only with intravitreal injection of VEGF165 developed vascular tortuosity accompanied by retinal neovascularization at 7 days that persisted up to 14 days post-treatment, while it disappeared at the day 28 time point (Figure 1b and Figure 2b).

JCRM2018-103-MaistoRosaItaly_F1

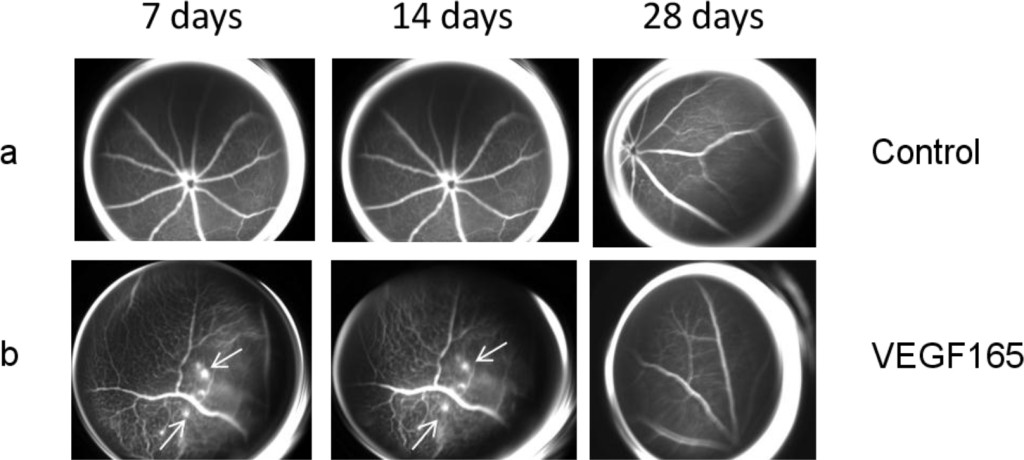
Figure 1. (a) Representative FAG images of a control eye. There are no vascular alterations at the various time points. (b) Representative FAG images of mice treated with intravitreal injection of VEGF165: a marked vascular tortuosity accompanied by retinal neovascularization is present at 7 days and persists until 14 days, while it disappears at the 28 day time point. Arrows indicate the formation of neovessels.

JCRM2018-103-MaistoRosaItaly_F2

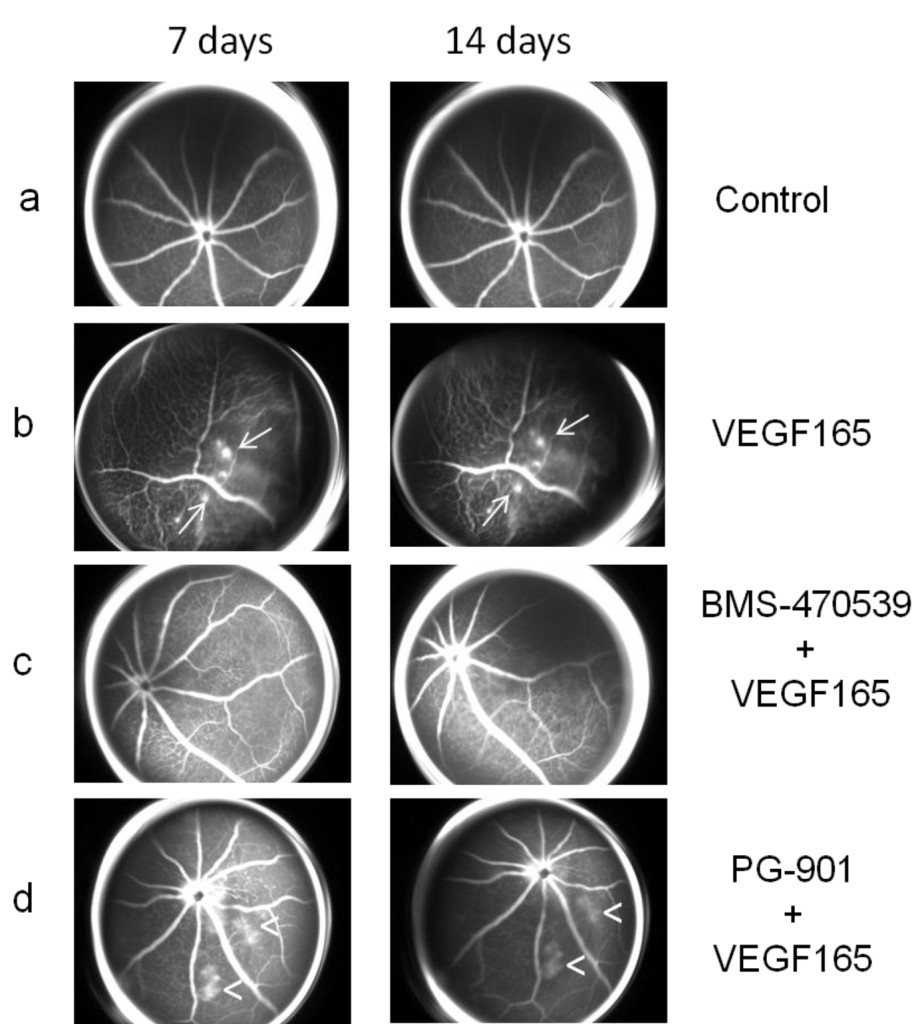
Figure 2. (a) Representative FAG images of a control eye (as Figure 1a). (b) Representative FAG images of mice treated with intravitreal injection of VEGF165 (as Figure 1b). (c) Representative FAG images of mice treated with intravitreal injection of BMS-470539 (33 μmol) 7 days before and 1 day after the injection of VEGF165: the mice did not develop retinal neovascularization during the follow-up but only an irregular vessel caliber appeared at 7 days and persisted until the end of the follow-up at 14 days. (d) Representative FAG images of mice treated with intravitreal injection of PG-901 (7.32 nM) 7 days before and 1 day after the injection of VEGF165: the mice did not develop retinal neovascularization but only an irregular vascular course and caliber was observed, accompanied by an increase in vascular permeability, resulting in dye leakage evident at 7 days and persisting until the end of follow-up at 14 days. Arrows indicate the formation of neovessels; arrowheads indicate vascular leakage.

Intravitreal injections of MC1 receptor agonist BMS-470539 (33 μmol) or MC5 receptor agonist PG-901 (7.32 nM) protect retinal vasculature, as demonstrated by FAG. In particular, mice treated with BMS-470539 (33 μmol) 7 days before and 1 day after the injection of VEGF165 did not develop retinal neovascularization during the follow-up, only an irregular vessel caliber appeared at 7 days and persisted until the end of the follow-up at 14 days (Figure 2c). The mice treated with PG-901 (7.32 nM) 7 days before and 1 day after VEGF165 injection did not develop retinal neovascularization during the follow-up, only an irregularity of the vascular course and caliber was observed. However, this was accompanied by an increase in the vascular permeability resulting in dye leakage which was evident at the 7 day time point and persisted until the end of follow-up at 14 days (Figure 2d).

Melanocortin MC1,5 receptor agonists reduce the retinal expression of the hematopoietic endothelial progenitor cell antigen CD34.

In order to confirm the development of retinal neovascularization at 7 and 14 days after VEGF165 intravitreal injection, immunohistochemistry for CD34 was performed in 4 mice per group randomly chosen. At 7 and 14 days, the analysis showed a significant (P<0.01) increase of CD34 immunostaining in mice receiving intravitreal VEGF165 compared to the mice receiving saline solution (Figure 3–4). In contrast, a marked decrease in the percentages of CD34 positive stained area/total stained area was observed at both time points in retinal tissue of mice receiving intravitreal injections of the MC1 agonist BMS-470539 (40.0 ± 5.15% at 7 days; 31.8 ± 4.3% at 14 days) or the MC5 agonist PG-901 (46.7 ± 4.7% at 7 days; 28.9 ± 4.7%) as calculated against the values quantified in VEGF165 mice (Figure 3 and Figure 4).

JCRM2018-103-MaistoRosaItaly_F3

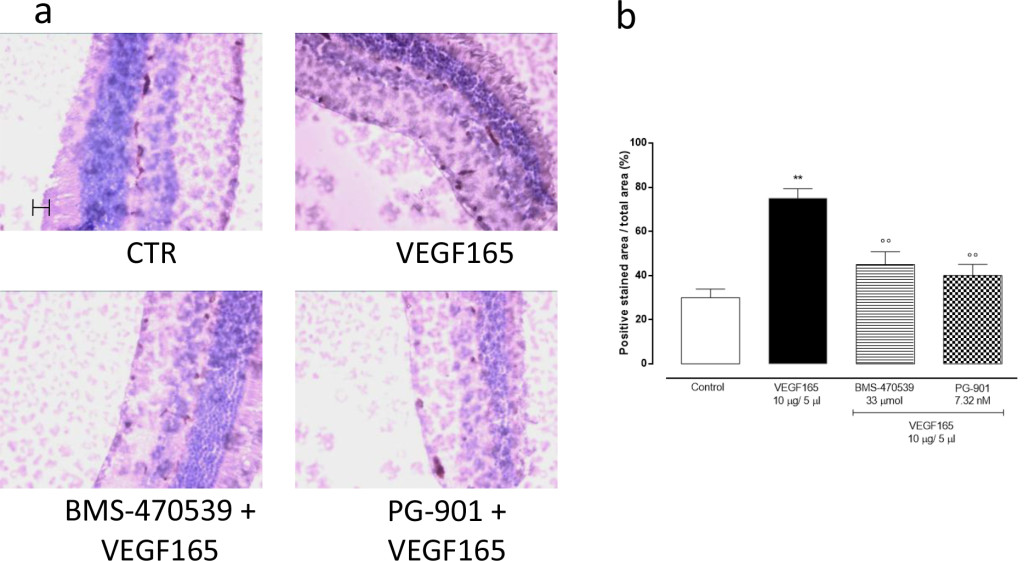
Figure 3.(a) Representative immunohistochemistry for CD34 in the retina of mice treated with vehicle, VEGF165(10 μg/5 μl), BMS-470539 (33 μmol) + VEGF165 and PG-901 (7.32 nM) + VEGF165, 7 days after VEGF165 intravitreal injection. BMS-470539 and PG-901 reduce CD34 immunostaining compared to rats receiving only VEGF165. Scale bar, 50 m. 200x magnification. (b) Graph showing the percentage of the total positive stained area for CD34 per total area analyzed at 200x magnification. Values are mean ± SEM of = 4 observations for each group. ** P < 0.01 vs Control; °° P < 0.01 vs VEGF165.

JCRM2018-103-MaistoRosaItaly_F4

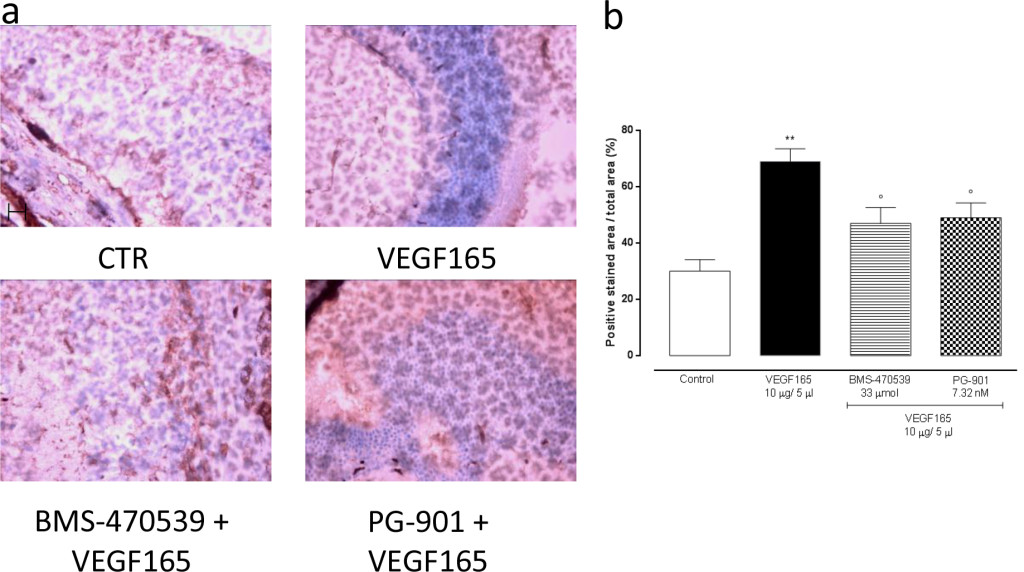
Figure 4. (a) Representative immunohistochemistry for CD34 in the retina of mice treated with vehicle, VEGF165(10 μg/5 μl), BMS-470539 (33 μmol) + VEGF165 and PG-901 (7.32 nM) + VEGF165, 14 days after VEGF165 intravitreal injection. BMS-470539 and PG-901 reduce CD34 immunostaining compared to mice receiving only VEGF165. Scale bar, 50 m. 200x magnification. (b) Graph showing the percentage of the total positive stained area for CD34 per total area analyzed at 200x magnification. Values are mean ± SEM of = 4 observations for each group. ** P < 0.01 vs Control; ° P < 0.05 vs VEGF165.

Melanocortin MC1,5 receptor activation decreases retinal VEGFR2 gene expression

qRT-PCR analysis of VEGFR2 gene expression in the retina showed that in mice receiving a single intravitreal injection of BMS-470539 and PG-901 7 days prior and first day after VEGF165, BMS-470539 and PG-901 significantly down-regulate VEGFR2 gene expression levels both at 7 and 14 day (P < 0.01) time points compared with the group receiving saline only (Figure 5a).

JCRM2018-103-MaistoRosaItaly_F5

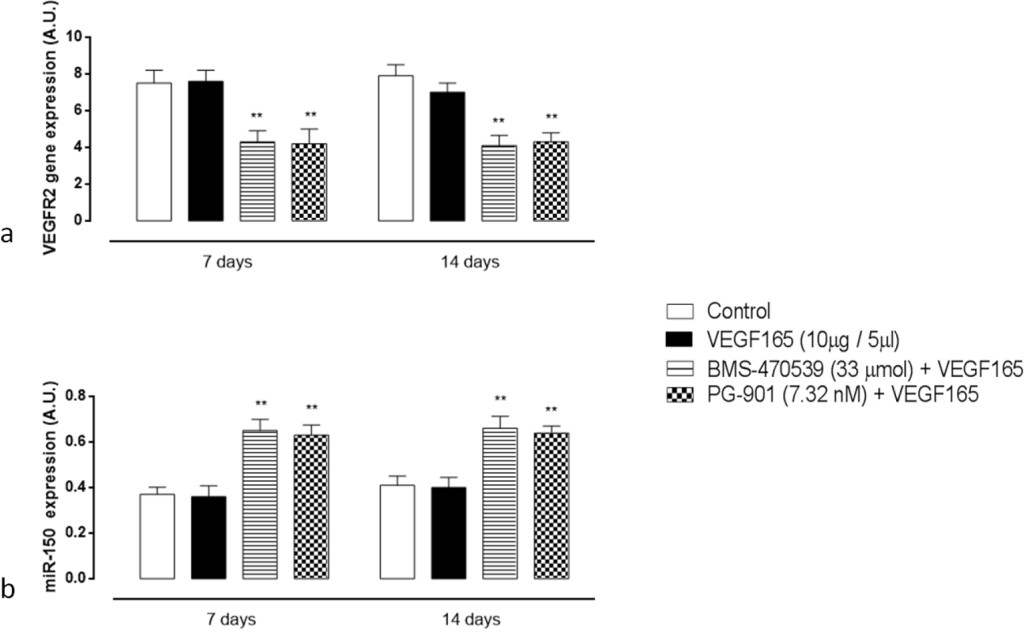
Figure 5. (a) RT-PCR analysis for VEGFR2 gene expression in retinal tissue 7 and 14 days after VEGF165 intravitreal injection. Treatment with BMS-470539 (33 μmol) and PG-901 (7.32 nM) significantly decreases VEGFR2 mRNA expression levels at 7 and 14 days, compared to mice receiving saline only. Results are expressed as mean ± SEM of = 4 observations for each group. ** P < 0.01 vs Control. A.U. = arbitrary units. (b) qRT-PCR analyzing mir-150 expression in retinal tissue 7 and 14 days after VEGF165 intravitreal injection. At 7 and 14 days, BMS-470539 (33 μmol) and PG-901 (7.32 nM) significantly increase mir-150 expression levels compared to mice receiving saline only. Values are mean ± SEM of = 4 observations for each group. ** P < 0.01 vs Control. A.U. = arbitrary units.

Melanocortin MC1,5 receptor activation increases mir-150 expression levels

Intravitreal injection of the MC1 agonist BMS-470539 and the MC5 agonist PG-901 7 days prior and first day after VEGF165, significantly up-regulate retinal mir-150 expression levels at 7 and 14 days (P < 0.01) time points compared with the group receiving saline only (Figure 5b). The single injection of VEGF165 into the vitreous does not affect qRT-PCR analysis of the retina for mir-150 expression levels (Figure 5b).

Intravitreal injection of melanocortin MC1,5 receptor agonists reduces retinal VEGFR2 protein levels

To confirm gene expression data, retinal VEGFR2 protein levels were measured by ELISA assay, and fitting with RT-PCR results, VEGRF2 protein levels significantly decreased after BMS-470539 and PG-901 (P < 0.01, Figure 6) at 7 and 14 time points.

JCRM2018-103-MaistoRosaItaly_F6

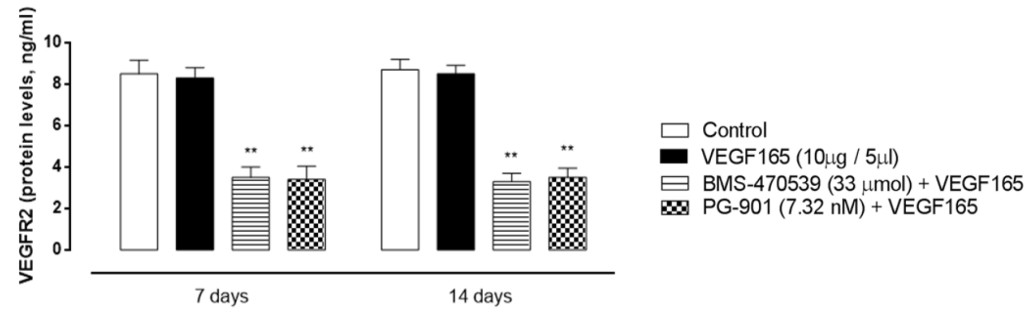
Figure 6. Retinal VEGFR2 protein expression levels (ng/ml) analyzed by Elisa assay 7 and 14 days after VEGF165 intravitreal injection. BMS-470539 (33 μmol) and PG-901 (7.32 nM) significantly decrease VEGFR2 protein expression levels at 7 and 14 days, compared to mice receiving saline only. Results are expressed as mean ± SEM of = 4 observations for each group. * P < 0.01 vs Control.

Discussion

This paper describes for the first time the protective role of the MC1–5 receptor agonists in a mouse model of retinopathy. The paper shows that a single intravitreal injection of the MC1 receptor agonist BMS-470539 or MC5 receptor agonist PG-901 7 days before and 1 day after the injection of VEGF165 into the vitreous prevents the development of retinal neovascularization as viewed by FAG.

Based on the results obtained in the present study, melanocortins and their receptors seem to be good candidates for treating VEGF dependent neovascularization of the retina having shown pivotal control of the development and progression of new vessels into the retina in the mouse model of retinopathy adopted here, although the single concentration of agonist used is a limitation of any cross-molecule comparison.

Melanocortins are endogenous peptides that possess a wide range of biological activities, including promotion of the resolution phase of inflammation effects in experimental models of inflammation-based diseases [19–27]. Their receptors are ubiquitously expressed into the eye and called MC1, MC3, MC4 and MC5. Rossi et al., in an experimental paper published in 2016 [13] showed that among the four melanocortin receptor subtypes expressed in the retina the MC1 and MC5 are the two involved in a positive control of diabetic retinopathy. Indeed, the activation of these receptors by specific agonists induces a series of downstream events such as reduction of inflammatory cytokines IL-1α, IL-1β, IL-6, chemokines MIP-1α, MIP-2α, MIP-3α and M1 macrophage that lead to reduced retinal damage. To this data, we add here a reduced retinal derangement from MC1,5 agonism exerted through reduced proliferation of new vessels in this tissue.

From the molecular point of view we noted that these structural changes were paralleled by biochemical alterations such as reduction in the expression of the VEGFR2 receptor within the retina both at 7 and 14 day time points. The down-regulation of VEGFR2 was caused by selective stimulation of MC1–5 receptors. Indeed, at the same time points it was not present in the control group treated with VEGF165 only. Thus, neovascularization induced by VEGF165 within the retina is hampered by selective activation of endogenous melanocortin MC1,5 receptors and reduced VEGFR2 receptor expression.

How this happens would require further investigation, but a novelty is provided here by the strict correlation between functional improvement of retinal vessel form, VEGFR2 expression and retinal expression of the miRNA mir-150. This mir-150, reported to attenuate retinal vascular overgrowth in diabetic mice through a down-regulation of VEGFR2 gene expression [27], is for the first time related to melanocortin MC1,5 receptors stimulation by the present study. MC1,5 receptors stimulation increases the expression of the retinal mir-150, consequently down-regulating VEGFR2 gene expression and protein levels. This finally improves the early vascular disorders induced by VEGF165 alone. Mirror of this mechanism, CD34 labeling within the retina was reduced. Particularly, CD34 labeling was increased by VEGF165 both at 7 and 14 day time points, confirming the early vascular disorders evidenced by FAG, while it was significantly reduced after MC1,5 agonists.

Noteworthy, CD34 is a transmembrane phosphoglycoprotein well known marker of hematopoietic endothelial progenitor cells (EPCs) proliferation [28], and shown to promote the formation of pathological, invasive vessels during neovascularization in a mouse model of oxygen-induced retinopathy [29]. Interestingly, the differentiation of these cells from the hematopoietic stem cells (HSCs) is associated with the up-regulation of vascular endothelial growth factor receptor 2 (VEGFR2), after which the HSCs are considered endothelial progenitor cells (EPCs), effectively [30–32].

Conclusions

In conclusion, there is positive interplay exerted through increase of mir-150 between retinal melanocortin MC1,5 receptors and VEGFR2 receptor in the model of VEGF165 induced retinopathy in order to prevent the local neoangiogenesis and retinopathy. From the translational point of view, it is tempting to speculate that the enhancement and reinforcement of the action of the endogenous melanocortins pathway can be a tool to prevent the development of retinal neovascularization, probably by amplifying its anti-inflammatory, anti-oxidant and anti-proliferative role. The potential systemic toxicity of the agents used in this study has not been investigated and would require deepening in order to reinforce their efficacy.

Acknowledgments: The authors are grateful to Professor Paolo Grieco (Pharmacy Department, University of Naples Federico II) for his support and acknowledge the precious funding of MIUR PRIN 2015 project.

Conflicts of Interest: The authors declare no conflict of interest.

References

  1. Miller JW (1997) Vascular endothelial growth factor and ocular neovascularization. Am J Pathol 151: 13–23. [Crossref]
  2. Wild S, Roglic G, Green A, Sicree R, King H (2004) Global prevalence of diabetes: estimates for the year 2000 and projections for 2030. Diabetes Care 27: 1047–1053. [Crossref]
  3. Friedman DS, O’Colmain BJ, Muñoz B, Tomany SC, McCarty C, et al. (2004) Prevalence of age-related macular degeneration in the United States. Arch Ophthalmol 122: 564–572. [Crossref]
  4. Visser L, Singh R, Young M, Lewis H, McKerrow N (2012) Guideline for the prevention, screening and treatment of retinopathy of prematurity (ROP). S Afr Med J 103: 116–125. [Crossref]
  5. Veikkola T, Alitalo K (1999) VEGFs, receptors and angiogenesis. Semin Cancer Biol 9: 211–220. [Crossref]
  6. Dai J, Rabie AB (2007) VEGF: an essential mediator of both angiogenesis and endochondral ossification. J Dent Res 86: 937–950. [Crossref]
  7. Park JE, Keller GA, Ferrara N (1993) The vascular endothelial growth factor (VEGF) isoforms: differential deposition into the subepithelial extracellular matrix and bioactivity of extracellular matrix-bound VEGF. Mol Biol Cell 4: 1317–1326.
  8. Ishida S, Usui T, Yamashiro K, Kaji Y, Amano S, et al. (2003) VEGF164-mediated inflammation is required for pathological, but not physiological, ischemia- induced retinal neovascularization. J Exp Med 198: 483–489. [Crossref]
  9. Ishida S, Usui T, Yamashiro K, Kaji Y, Ahmed E, et al. (2003) VEGF164 is proinflammatory in the diabetic retina. Invest Ophthalmol Vis Sci 44: 2155–2162. [Crossref]
  10. Arana LA, Pinto AT, Chader GJ, Barbosa JD, Morales S, et al. (2012) Fluorescein angiography, optical coherence tomography, and histopathologic findings in a VEGF(165) animal model of retinal angiogenesis. Graefes Arch Clin Exp Ophthalmol 250(10): 1421–8. [Crossref]
  11. Badaro E, Novais EA, Abdala K, Chun M, Urias, M, et al. (2014) Development of an experimental model of proliferative retinopathy by intravitreal injection of VEGF165. J Ocul Pharmacol Ther 30(9): 752–6. [Crossref]
  12. Andreoli CM, Miller JW (2007) Anti-vascular endothelial growth factor therapy for ocular neovascular disease. Curr Opin Ophthal mol 18: 502–508. [Crossref]
  13. Rossi S, Maisto R, Gesualdo C, Trotta M.C, Ferraraccio F, et al. (2016) Activation of Melanocortin Receptors MC 1 and MC 5 Attenuates Retinal Damage in Experimental Diabetic Retinopathy. Mediators Inflamm 7368389.
  14. Maisto R, Gesualdo C, Trotta MC, Grieco P, Testa F, et al. (2017) Melanocortin receptor agonists MCR 1–5 protect photoreceptors from high-glucose damage and restore antioxidant enzymes in primary retinal cell culture. J Cell Mol Med 21: 968–974. [Crossref]
  15. Grieco P, Cai M, Liu L, Mayorov A, Chandler K, et al. (2008) Design and microwave-assisted synthesis of novel macrocyclic peptides active at melanocortin receptors: discovery of potent and selective hMC5R receptor antagonists. J Med Chem 51, 9, 2701–2707. [Crossref]
  16. Leoni G, Voisin MB, Carlson K, Getting S, Nourshargh S, Perretti M (2010) The melanocortin MC1receptor agonist BMS-470539 inhibits leucocyte trafficking in the inflamed vasculature. Br. J. Pharmacol 160(1): 171–180. [Crossref]
  17. Møller CL, Raun K, Jacobsen ML, Pedersen TÅ, Holst B, et al. (2011) Characterization of murine melanocortin receptors mediating adipocyte lipolysis and examination of signalling pathways involved. Mol Cell Endocrinol 341(1–2): 9–17. [Crossref]
  18. Di Filippo C, Zippo M.V, Maisto R, Trotta M.C, Siniscalco D, et al. (2014) Inhibition of ocular aldose reductase by a new benzofuroxane derivative ameliorates rat endotoxic uveitis. Mediators Inflamm 9.
  19. Manna SK, Aggarwal BB (1998) Alpha-melanocyte-stimulating hormone inhibits the nuclear transcription factor NF- B activation induced by various inflammatory agents. J Immunol 161, 6, 2873–2880. [Crossref]
  20. Martin LW, Catania A, Hiltz ME, Lipton JM (1991) Neuropeptide alpha-MSH antagonizes IL-6- and TNF-induced fever. Peptides 12: 297–299. [Crossref]
  21. Bhardwaj RS, Schwarz A, Becher E, Mahnke K, Aragane Y, et al. (1996) Proopiomelanocortin-derived peptides induce IL-10 production in human monocytes. J Immunol 156, 7, 2517–2521. [Crossref]
  22. Redondo P, García-Foncillas J, Okroujnov I, Bandrés E (1998) Alpha-MSH regulates interleukin-10 expression by human keratinocytes. Arch Dermatol Res 290: 425–428. [Crossref]
  23. Grabbe S, Bhardwaj RS, Mahnke K, Simon MM, Schwarz T, Luger TA (1996) -melanocyte-stimulating hormone induces hapten-specific tolerance in mice. J Immunol 156, 2, 473–478.
  24. Slominski A, Wortsman J, Luger T, Paus R, Solomon S (2000) Corticotropin releasing hormone and proopiomelanocortin involvement in the cutaneous response to stress. Physiol. Rev 80, 3, 979–1020. [Crossref]
  25. Scholzen TE, Sunderk¨otter C, Kalden DH, Brzoska T, Fastrich M, et al. (2003) alpha-melanocyte stimulating hormone prevents lipopolysaccharide induced vasculitis by down-regulating endothelial cell adhesion molecule expression. Endocrinology 144, 1, 360–370. [Crossref]
  26. Raap U, Brzoska T, Sohl S, Päth G, Emmel J, et al. (2003) -melanocyte-stimulating hormone inhibits allergic airway inflammation. J Immunol 171, 1, 353–359. [Crossref]
  27. Shi L, Kim AJ, Cheng-An Chang R, Ying W, Ko ML, et al. (2016) Deletion of mir-150 exacerbates retinal vascular overgrowth in high-fat-diet induced diabetic mice. PLoS One 11(6): e0157543. [Crossref]
  28.  Ivanovic Z (2010) Hematopoietic stem cells in research and clinical applications: The “CD34 issue”. World J Stem Cells 2: 18–23. [Crossref]
  29. Siemerink MJ, Hughes MR, Dallinga MG, Gora T, Cait J, et al. (2016) CD34 promotes pathological epi-retinal neovascularization in mouse model of oxygen-induced retinopathy. PLoS One 11(6): e0157902. [Crossref]
  30. Körbling M, Katz RL, Khanna A, Ruifrok AC, Rondon G, et al. (2002) Hepatocytes and epithelial cells of donor origin in recipients of peripheral-blood stem cells. N Engl J Med 346(10): 738–46. [Crossref]
  31. Yeh ET, Zhang S, Wu HD, Körbling M, Willerson JT, Estrov Z (2003) Transdifferentiation of human peripheral blood CD34+-enriched cell population into cardiomyocytes, endothelial cells, and smooth muscle cells in vivo. Circulation 108(17): 2070–3.
  32. Murohara T, Ikeda H, Duan J, Shintani S, Sasaki Ki, et al. (2000) Transplanted cord blood-derived endothelial precursor cells augment postnatal neovascularization. J Clin Invest 105(11): 1527–1536. [Crossref]

Diagnostic Value of Cytotoxic Natural Killer Subpopulations in Malignant Pleural Effusions

DOI: 10.31038/CST.2018331

Abstract

Introduction

Malignant pleural effusion is a sign of advanced disease with poor prognosis. The function of natural killer (NK) cells is to identify and destroy target tumor cells. This study aims to evaluate the role that cytotoxic NK subpopulations play when diagnosing malignant pleural effusion.

Methods

NK subpopulations were determined in pleural fluid and peripheral blood by flow cytometry in 71 patients who had suffered pleural effusion of unknown etiology. They were classified into three groups according to their final diagnosis: malignant, paramalignant and benign.

Results

The NK CD56 dim CD16- subpopulation in peripheral blood was the highest subpopulation in benign than in malignant or paramalignant cases (18.5% vs. 5.5% or 5.6%; p<0.001). Cytotoxic subpopulations NK CD56 dim CD16 + and NK CD16+ were higher in malignant and paramalignant than in benign cases (NK CD56 dim CD16+: 90.7% and 90% vs. 81.4%; p<0.001; NK CD16+: 95% and 95.6% vs. 86.5%; p<0.002). No differences were found in any cells studied in pleural fluid.

Conclusions

The data from this study suggested that determining the percentage of subpopulations NK CD56 dim CD16+ and NK CD16+, which perform an antibody-dependent cytotoxic function in peripheral blood, can be useful to diagnose malignant pleural effusion.

Keywords

diagnosis; flow cytometry; natural killer cells; natural killer subpopulations; pleural effusion; malignant

Introduction

Malignant pleural effusion (MPE) is a common clinical problem among patients with neoplastic disease. It is a sign of advanced disease associated with symptoms deteriorating and worse quality of life, with mean survival varying between 3 and 12 months [1]. Given its poor prognosis and clinical involvement, diagnoses must be made early. However, a malignancy diagnosis is not always possible with cytology, whose sensitivity range is 40–87% [2]. Hence the need to resort to complementary methods to identify tumor cells within pleural effusions (PE), [3] and to start early therapeutic interventions in an attempt to reduce these patients’ morbimortality.

MPE are characterized by a high percentage of mononuclear cells involved in immunological defense mechanisms, natural killer (NK) cells being one of the main components of the immunological system that participate in anti-tumoral defense mechanisms [4]. In theory, the presence of a high percentage of NK cells in pleural fluid could help establish its neoplastic nature. However, total NK (CD3- CD56+) quantification in pleural effusions has provided contradictory results in former studies [5–9].

Nowadays, there is very little information about the different NK cell subpopulations which can be found in MPE. However, it is known that the function of these subpopulations can be identified using the intensity of the expression of CD56 and CD16 surface antigens [10]. NK CD56 bright are considered regulator cells given their high capacity of producing pro-inflammatory and anti-inflammatory cytokines, [11] while NK CD56 dim [12] are cytotoxic given their high lytic activity. If the latter are also accompanied by a high CD16 expression, this makes them efficient mediators of antibody-dependent cell cytotoxicity [13]. CD57+ expression is a marker with a strong cytotoxic potential [14,15]. However, there is no data available on CD57+ expression in MPE. Therefore, the already available data seems to indicate that determining only total NK cells is not enough to identify MPEs differentiate them from benign ones. As NK subpopulations are characterized by performing more specific functions, the objective of this study was to study NK cell subpopulations, mainly those with a cytotoxic function, and their discriminative power in early differentiation of MPE, paramalignant pleural effusions (PPE) and benign pleural effusions (BPE).

Methods And Materials

Subjects

This two year (January 2013 to February 2015) prospective observational cohort study included 73 patients who had suffered pleural effusion of unknown etiology and were to undergo diagnostic thoracentesis. The final sample included 71 patients, two patients were excluded as no cellularity was obtained in pleural fluid. Patients were classified into three well differentiated groups according to their PE diagnosis: MPE, PPE and BPE (Figure 1).

CST2018-111-MariaM.MoralesItaly_F1

Figure 1. Flow of patients included in the study

Diagnosis of the type of PE was done according to the following criteria:

MPE was diagnosed if the presence of tumor cells in the pleural cavity was confirmed by a cytological study of pleural fluid, or in pleural tissue obtained by blind pleural biopsy, thoracoscopy or thoracotomy.

PPE (16) is due to a tumor process, but with no direct pleural infiltration by the tumor, and no tumor cells in the pleural fluid or tissue can be determined.

A PE is considered a BPE or as non-specific, when tumor etiology has been reasonably ruled out by imaging techniques, previous examinations, medical history and patient follow-up.

This study complies with the principles of the Declaration of Helsinki. Ethical approval of the study was given by Committee of Ethics and Clinical Trials (CEIC) of the Dr. Peset University Hospital in Valencia, with CEIC code: 10/12 on 29 February 2012. All the participating patients received written information about the nature and purposes of the study and gave their informed consent. A prospective follow-up of patients’ progress was done until they died or the study ended. All patients who were asked to be included in the study agreed to participate.

Measuring Natural Killer Cells

The lymphocyte populations in both the pleural fluid obtained from the first diagnostic thoracentesis performed on each patient and in the peripheral blood taken on the same day were analyzed.

After extraction, homogenization of the peripheral blood sample is immediately performed by the stirrer and mixer The Coulter Mixer (Coulter Electronics Limited, Northwell Drive, Luton, Bedfordshire, LU3 3RH, England®). Then, in a polypropylene tube, 100 μl of sample is introduced with 10 μl of each of the chosen monoclonal antibodies: CD45, CD19, CD3, CD56, CD16 and CD57. The mixture will be incubated for 15 minutes in the dark at room temperature. 0.5ml of the erythrolytic solution OptiLyse® are added, vortexed (Super-Mixer, Lab-Line Instruments Inc.®) and re-incubated in the dark at room temperature for another 15 minutes. After incubation, 2 ml of phosphate-buffered saline are added, centrifuged for 5 minutes at 300 x g (~1,600 r.p.m.) in a Microcen 21® and finally the supernatants are decanted and the cells re-suspended in 1 ml of phosphate-buffered saline and then introduced into a Navios® flow cytometer (Beckman-Coulter).

As in peripheral blood, the pleural fluid sample requires homogenizing the sample after extraction performed using the stirrer and mixer The Coulter Mixer (Coulter Electronics Limited, Northwell Drive, Luton, Bedfordshire, LU3 3RH, England®). However, the pleural fluid sample must be enriched prior to incubation. To do this, 2 ml of phosphate-buffered saline are added to 2 ml of pleural fluid, shaken and centrifuged at 300 x g (~1,600 r.p.m.) in a Microcen 21® for 5 minutes. The supernatants are then decanted and the cells are re-suspended in 0.5 ml of phosphate-buffered saline. After this process, the incubation with the monoclonal antibodies and procurement of the sample to be introduced in the flow cytometer can be performed following the same steps as in the peripheral blood.

A blind analysis of the diagnosis was run with the Kaluza 1.3 software (Beckman-Coulter). The sensitivity of the technique was 10-2 –10-3. After the expression of CD45, B (CD19+ CD3-) and T (CD3+ CD19-) lymphocytes as well as NK cells (CD3- CD56+) were studied first and compared to the 100% total lymphocytes. After and according to the intensity of the expression of antigens CD56 and CD16, the following subpopulations were differentiated: NK CD56 bright (++) CD16-, NK CD56 bright (++) CD16+, NK CD56 dim (+) CD16-, NK CD56 dim (+) CD16+ and NKCD16+ (CD56+/++ CD16+). NKCD57+ (CD56+/++ CD57+) were also determined and percentage quantification was done of all the NK subpopulations compared to the percentage of total NK cells.

Statistical analysis

All the results obtained were analyzed using the Kolmogorov-Smirnov test for a sample to determine if they followed a normal distribution pattern. Results were compared using the chi-square test for qualitative variables, the Student’s t-test for parametric quantitative variables and the Mann-Whitney U test for non-parametric quantitative variables. When comparing more than two groups, a one-way ANOVA (analysis of variance) was applied to the parametric variables and the Kruskal-Wallis test to the non-parametric variables.

The diagnostic efficacy of the analysis of the cells from pleural fluid and peripheral blood which presented differences considered significant enough to discriminate between MPE/PPE and BPE was determined by a receiver operating characteristic (ROC) curve analysis with the area under the ROC curve (AUC). A p-value <0.05 was considered significant and their 95% confidence intervals (95% CI) were calculated by standard techniques. The statistical package IBM SPSS Statistics for Windows (version 21.0. Armonk, New York: IBM Corp., USA) was employed.

Results

Demographics

This study took place at the University Dr. Peset Hospital in Valencia from 2013 to 2015 and analyzed 71 patients who had suffered PE of unknown etiology. The study population’s mean age was 69.1 years, and no differences were observed among groups. Male gender clearly predominated among the MPE and PPE cases (Table 1). According to the final PE diagnosis made, three groups were formed: MPE, PPE and BPE (Figure 1). All the MPE were exudates as well as 93.3% of PPE and 80% of the BPE (p=0.027) Adenocarcinoma was the most frequent histology found among the MPE (Table 1).

Table 1. Characteristics of the patients with malignant, paramalignant and benign pleural effusions.

 Malignant

(n=31)

Paramalignant

 (n=15)

 Benign

(n=25)

 p-valueb

Age (years)

95% CI

69.2±8.9

65.9–72.4

69.8 ±11.1

63.6–76

68.7 ±12.2

63.6–73.7

0.949

Gender

0.133

Male

19 (61.3%)

12 (80%)

12 (48%)

Female

12 (38.7%)

3 (20%)

13 (52%)

Diagnosis

Adenocarcinoma 22 (71%)

Non-specific 12 (48%)

Lymphoma 4 (13%)

CHF 4 (16%)

Mesothelioma 2 (6.5%)

Infectious 3 (12%)

Epidermoid 1 (3.2%)

TBC 2 (8%)

Microcytic 1 (3.2%)

Exp. to asbestos 2 (8%)

Myxoid sarcoma 1 (3.2%)

Cirrhosis 1 (4%)

RA 1 (4%)

Abbreviations: CI (confidence interval), CHF (congestive heart failure), TBC (tuberculosis), Exp. (exposure), RA (rheumatoid arthritis).
aData expressed in absolute values and percentages or mean±SD.
bChi-square test or ANOVA.

Lymphocyte populations in pleural fluid and peripheral blood

Lymphocyte populations were studied by determining B and T lymphocytes and NK cells in pleural fluid and peripheral blood. No differences between the expression of any cell line of the different groups was observed; that is, NK cells showed no higher expression in any pleural effusion type.

NK subpopulations in pleural fluid and peripheral blood

NK subpopulations were analyzed according to the intensity of the expression of surface antigens CD56 and CD16. No differences were found between the MPE, PPE and BPE groups in any cells studied in pleural fluid. Surprisingly, in peripheral blood, significant differences between the groups in the NK subpopulations were found. Subpopulation NK CD56 dim CD16- was higher in BPE cases than in the MPE or PPE ones (18.5% vs. 5.5% or 5.6%; p<0.001). Cytotoxic subpopulations NK CD56 dim CD16 + and NK CD16+ were higher in the MPE and PPE cases than in BPE ones (NK CD56 dim CD16 +: 90.7% and 90% vs. 81.4%; p<0.001 and NK CD16+: 95% and 95.6% vs. 86.5%; p<0.002) (Table 2).

Similarly, NK subpopulations analysis in peripheral blood showed that subpopulation NK CD56 dim CD16- was higher in BPE cases (18.5% vs. 5.5%; p<0.001), and subpopulations NK CD56 dim CD16 + and NK CD16+ appeared mostly in the combined MPE and PPE group, and in the isolated MPE cases (NK CD56 dim CD16 +: 90.7% vs. 81.4%; p<0.001 and NK CD16+: 95% vs. 86.5%: p<0.002) (Table 3).

Table 2. Natural killer subpopulations in peripheral blood.

Malignant

(n=31)

Paramalignant

(n=15)

Benign

(n=25)

p-valueb


NK (CD3-CD56+)

11.6 (0.7–73.2)

9.6 (1.7–16.2)

7 (0.7–31.3)

0.520

NK CD56 bright

0.5 (0–12.7)

1.4 (0–9.1)

0.5 (0–31)

0.479

CD56 bright CD16-

0.2 (0–2.7)

0.4 (0–2)

0.3 (0–17.8)

0.720

CD56 bright CD16+

0.1 (0–11.4)

0.7 (0–8.1)

0 (0–13.2)

0.155

NK CD56 dim

98.6 (81.5–100)

96.9 (91.6–100)

99.4(65.9–100)

0.189

CD56 dim CD16-

5.5 (0.3–92.1)

5.6 (0.3–24.4)

18.5(2.5–100)

0.001***

CD56dim CD16+

90.7 (7.4–99)

90(70.7–99)

81.4 (0–95.4)

0.001***

NK CD16+

95 (7.8–99.6)

95.6 (76.1–99.5)

86.5 (0–97.1)

0.002**

NK CD57+

48.6±20

49.2±17.4

54.4±14.5

0.454

Abbreviations: NK (natural killer).
aPercentage data expressed as mean±SD or median (minimum-maximum).
bANOVA or Kruskal-Wallis test.
*p<0.05; **p<0.01; ***p<0.001

Table 3. Cytotoxic natural killer subpopulations in peripheral blood.

Malignant

(n=31)

Benign

 (n=25)

 p-valueb

CD56dim CD16-

5.5 (0.3–92.1)

18.5 (2.5–100)

0.001***

95%CI

2.3–13

11.8–28.1

CD56dim CD16+

90.7 (7.4–99)

81.4 (0–95.4)

0.001***

95%CI

87–97.7

71.9–88.2

NK CD16+

95 (7.8–99.6)

86.5 (0–97.1)

0.002**

95%CI

92.8–99.8

78.8–92.9

Abbreviations: NK (natural killer) CI (confidence interval).
aPercentage data expressed as median (minimum-maximum).
bStudent’s t-test or Mann-Whitney U test.
*p<0.05; **p<0.01; ***p<0.001

Diagnostic efficacy of cytotoxic NK subpopulations

These results reveal that, despite there being no differences in the NK subpopulations in pleural fluid to differentiate malignant cases from benign ones, differences appeared in the following NK subpopulations in peripheral blood: NK CD56 dim CD16-, NK CD56 dim CD16 + and NK CD16+. In order to determine the diagnostic efficacy of the analysis of these subpopulations in blood, a ROC curve analysis with AUC was performed. The isolated determination of the percentage in peripheral blood of subpopulation NK CD56 dim CD16- had an AUC of 0.777 to discriminate a BPE from a MPE (95%CI: 0.653–0.901; p<0.001). If the cut-off point was 9.82%, sensitivity would be 76% and specificity would be 71%. In order to differentiate a BPE from a MPE/PPE, the AUC was 0.784 (95%CI: 0.671–0.897; p<0.001), with a sensitivity of 76% and a specificity of 72% with the same cut-off point (Figure 2).

CST2018-111-MariaM.MoralesItaly_F2

Figure 2. ROC curve of subpopulation NK CD56 dim CD16- to differentiate benign pleural effusions from malignant and paramalignant ones

Subpopulations NK CD56 dim CD16 + and NK CD16+, which have an antibody-dependent cytotoxic function, allow for discrimination of a patient with MPE from one with a BPE with an AUC of 0.761 (95%CI: 0.637–0.885; p=0.001) and 0.747 (95%CI: 0.619–0.876; p=0.002), respectively. In order to differentiate a MPE and PPE from a BPE, the AUC was 0.774 (95%CI: 0.663–0.885; p<0.001) and 0.753 (95%CI: 0.640–0.867; p<0.001), respectively (Figure 3).

CST2018-111-MariaM.MoralesItaly_F3

Figure 3. ROC curves of subpopulations NK CD56 dim CD16 + and NK CD16+ to differentiate malignant and paramalignant pleural effusions from those of a benign type

Discussion

MPE is a sign of advanced neoplastic disease which implies the pleural space has been affected by this malignant process. Given these patients’ poor prognosis, its diagnosis is therefore essential, and it would be very useful to identify markers that increase the possibility of diagnosing this malignity. Here, NK cells can play a key role in the defense against neoplastic invasion of the pleural cavity. In theory, detecting a high percentage of NK cells in MPE could help establish their tumoral nature. Despite some authors having observed a higher NK cell percentage in MPE, [5–7] others have reported a lower percentage, [8] and some groups, including our own, have not even found any differences [9]. It would appear that published data may indicate that determining only total NK cells is not sufficient to distinguish MPE from BPE. Therefore, we have centered our research on the NK subpopulations characterized by playing a cytotoxic function as presence of neoplastic cells in pleural fluid or tissue should reflect increased cytolytic activity in MPE compared to those of other etiologies. Apart from the subpopulations that explain the intensity of the expression of CD56 and CD16, potentially cytotoxic subpopulation NK CD57+ was also evaluated in differentiating a MPE from a BPE. Our data demonstrated that although no differences between groups or between malignant and benign cases were found in any of the studied cells in pleural fluid, differences appeared in peripheral blood: subpopulation CD56 dim CD16- was higher in BPE cases, and subpopulations CD56 dim CD16 + and NK CD16+ were higher in MPE and PPE ones. This indicated that a high CD16 expression made them efficient mediators of antibody-dependent cell cytotoxicity [13] with expressions in blood, but not in pleural fluid. These findings led us to wonder if there was a more relevant systemic response than the local one in patients with MPE. No published works have analyzed the diagnostic value of NK subpopulations in peripheral blood to distinguish between MPE and BPE. Moreover, information about pleural fluid is scarce. Scherpereel et al.[17] found increased CD16+ in pleural fluid in all PE except for BPE. Cornfield et al.[4] analyzed 30 malignant (pleural, pericardial and ascitic) effusions and 30 benign ones, and found no differences in the percentage of any subpopulation they studied. These authors only reported an increase in the absolute value of NK CD16+ in malignant effusions. Pace et al.[18] encountered that NKCD16+ percentages in patients with MPE and BPE were similar. The comparison made of the findings from this work with the few existing studies is complicated due to the different methodologies employed. Our data coincide with those reported by Cornfield et al. [4] The work by Pace et al. [18] only included 19 patients with MPE, while the BPE group differed (due to heart failure) to that herein studied as they were effusions of unknown etiology suspected of malignity, which pose a problem in diagnosing MPE. Moreover, although NKCD57+ displayed high cytolytic activity, [14,15], no published studies have been conducted on this marker in MPE, and this is the first work to analyses it.

In order to determine the diagnostic efficiency of the analyses of these subpopulations in blood, a ROC curve analysis was carried out. The subpopulation with the largest AUC to differentiate BPE from malignant ones was NK CD56 dim CD16- (0.777), which increased to 0.784 when the discrimination was between BPE and both MPE and PPE. When distinguishing between malignant and benign cases, subpopulations NK CD56 dim CD16+ and NK CD16+ had an AUC of 0.761 and 0.757, respectively. When MPE and PPE were distinguished from BPE the AUC increased to 0.774 and 0.753. This result has never been previously reported.

The main limitation of this study was that 21.1% of the included effusions were of the PPE type. Other studies[4,18] did not include this type. However, as the PPE type has its typical characteristics and is associated with poor prognosis, we decided to include it to well reflect the usual clinical reality.

By way of conclusion, determining the percentage of NK cells in pleural fluid of PE of unknown etiology does not allow malignant cases to be differentiated from benign ones. However, determining the percentage of subpopulations NK CD56 dim CD16+ and NK CD16+ that perform an antibody-dependent cytotoxic function in peripheral blood was identified as a diagnostic test whose capacity helps to early discriminate a patient with a MPE.

Author Contributions: All authors have been involved in the conception and design, or analysis and interpretation of data, as well as in drafting the article or revising it critically for important intellectual content. Maria Morales-Suarez-Varela has been designated as guarantor for the article.

Acknowledgements: The authors would like to thank the Pulmonology Foundation of the Valencian Community for the grant this work was awarded with, and with which the monoclonal antibodies employed were obtained. They would also like to thank everyone who has collaborated either directly or indirectly in this research.

Ethical Approval: All procedures performed in studies involving human participants were in accordance with the ethical standards of the institutional and/or national research committee and with the 1964 Helsinki declaration and its later amendments or comparable ethical standards.

Informed Consent: Informed consent was obtained from all individual participants included in the study.

Competing Interest: The authors declare that they have no competing interest.

Funding Information: Dr. Herrera Lara has received research scholarship support from the Pulmonology Foundation of the Valencian Community.

References

  1. Roberts ME, Neville E, Berrisford RG, Antunes G, Ali NJ (2010) BTS Pleural Disease Guideline Group. Management of a malignant pleural effusion: British Thoracic Society Pleural Disease Guideline Thorax 65 Suppl 2: ii32–40.
  2. Villena Garrido V, Ferrer Sancho J, Hernández Blasco L, de Pablo Gafas A, Pérez Rodríguez E, Rodríguez Panadero F, et al. (2006) Diagnóstico y tratamiento del derrame pleural. Arch Bronconeumol 42: 349–372.
  3. Stonesifer KJ, Xiang JH, Wilkinson EJ, Benson NA, Braylan RC (1987) Flow cytometric analysis and cytopathology of body cavity fluids. Acta Cytol 31: 125–130.
  4. Cornfield DB, Gheith SM (2009) Flow cytometric quantitation of natural killer cells and T lymphocytes expressing T-cell receptors alpha/beta and gamma/delta is not helpful in distinguishing benign from malignant body cavity effusions. Cytometry B Clin Cytom 76: 213–217.
  5. Green LK, Griffin J (1996) Increased natural killer cells in fluids. A new, sensitive means of detecting carcinoma. Acta Cytol 40: 1240–1245. [crossref]
  6. Yu GH, Hida CA, Salhany KE, Baloch Z, Gupta PK (1999) Immunohistochemical detection of cytotoxic lymphocytes in malignant serous effusions. Diagn Cytopathol 21: 18–21.
  7. Laurini JA, Garcia A, Elsner B, Bellotti M, Rescia C (2000) Relation between natural killer cells and neoplastic cells in serous fluids. Diagn Cytopathol 22: 347–350.
  8. Sikora J, Dworacki G, Trybus M, Batura-Gabryel H, Zeromski J (1998) Correlation between DNA content, expression of Ki-67 antigen of tumor cells and immunophenotype of lymphocytes from malignant pleural effusions. Tumor Biol 19: 196–204.
  9. Jezewska E, Sikora J, Slowik-Gabryelska A, Zeromski J (1993) Evaluation of immunophenotype of lymphoid cells isolated from malignant pleural effusions. Arch Immunol Ther Exp (Warsz) 41: 51–56.
  10. Caligiuri MA (2008) Human natural killer cells. Blood 112: 461–469. [crossref]
  11. Poli A, Michel T, Thérésine M, Andres E, Hentges F, Zimmer J (2009) CD56bright natural killer (NK) cells: an important NK cell subset. Immunology 126: 458–465.
  12. Sedlmayr P, Schallhammer L, Hammer A, Wilders-Truschnig M, Wintersteiger R, Dohr G (1996) Differential phenotypic properties of human peripheral blood CD56dim and CD56bright natural killer cell subpopulations. Int Arch Allergy Immunol 110: 308–313.
  13. Montserrat Sanz J, García Torrijos C, Díaz Martín D, Prieto Martín A (2013) Linfocitos natural killer. Medicine(Spain) 11: 1728–1736.
  14. Lopez-Verges S, Milush JM, Pandey S, York VA, Arakawa-Hoyt J, Pircher H, et al (2010) CD57 defines a functionally distinct population of mature NK cells in the human CD56dimCD16+ NK-cell subset. Blood 116: 3865–3874.
  15. Nielsen CM, White MJ, Goodier MR, Riley EM (2013) Functional Significance of CD57 Expression on Human NK Cells and Relevance to Disease. Front Immunol 4: 422.
  16. American Thoracic Society (2000) Management of malignant pleural effusions. Am J Respir Crit Care Med 1987–2001.
  17. Scherpereel A, Grigoriu BD, Noppen M, Gey T, Chahine B, Baldacci S, et al. (2013) Defect in recruiting effector memory CD8 T-cells in malignant pleural effusions compared to normal pleural fluid. BMC Cancer 13: 324.
  18. Pace E, Di Sano C, Ferraro M, Tipa A, Olivieri D, Spatafora M, et al. (2011) Altered CD94/NKG2A and perforin expression reduce the cytotoxic activity in malignant pleural effusions. Eur J Cancer 47: 296–304.

Efficacy of Albendazole on Gastro-Intestinal Strongyles of Cattle in Ngaoundere (Adamawa-Cameroon)

DOI: 10.31038/IJVB.2018222

Abstract

The present study aimed at identifying the gastro-intestinal Strongyles of cattle and to evaluate the effect of albendazole on their population dynamics throughout the year. Three cattle farms located in the village of Velambai were used for the study. 175 animals were screened through coprological examination to assess their infection rate (IR) with gastro-intestinal nematodes. 50 Goudali were monitored from April 2015 to March 2016. Of these animals selected, 25 of them received albendazole on day 0 (D0) and constituted the treated group while the other 25 received nothing and stood for the non-treated group. Faeces were examined using the McMaster method to evaluate the efficacy of treatment and to monitor changes in faecal shedding of Strongyles. Faeces from animals were cultured to recover the infective L3 larval stage of Strongyles by the Baermann method. The survey revealed that Strongyles, Strongyloides and Toxocara were the main gastro-intestinal helminths infecting cattle with IRs of 64.5%, 15% and 24.1% respectively. Deworming at the beginning of the rainy season reduced the shedding of helminth eggs (EPG < 400) throughout the season. Percentage reduction in the number of eggs per gram of faeces (EPG) from Strongyles was 68% at day 30. Stool culture revealed the presence of four types of Strongyles with varying abundance depending on the genus (Trichostrongylus, Haemonchus, Cooperia and Oesophagostomum), animal group and month. The genera Trichostrongylus and Haemonchus were dominant throughout the year. Haemonchus spp were significantly sensitive to albendazole between D30 to D90. On D120, albendazole lost its effect with the genus Haemonchus which resulted in the re-infection of the animals, whereas this effect was rather late for the genus Oesophagostomum (from D270).

Key words

Gastro-intestinal helminths, stool culture, deworming, Albendazole, Ngaoundere, Cameroon.

Introduction

Livestock is an important source of income in most developing countries and contributes to food security. In Africa, it contributes upto 10–20% of the gross domestic product (GDP) [1]. However, in the Adamawa Region of Cameroon like in other African regions, this sector is subject to several constraints including diseases [2] for instance gastro-intestinal cattle strongylosis [1]. Strongylosis contributes to emaciation especially at the end of the dry season [3] and leads to production loss. The control of these pathologies in order to improve the individual productivity of cattle is therefore a necessity in a context already marked by the rapid growth of the human population and the increasing demand for animal protein, both in Cameroon and in all developing countries. In Cameroon, particularly in the Adamawa region, deworming has become a common practice by Veterinarians, but most often by breeders themselves and in most cases without seeking for medical advice [1–4]. For almost two decades now, the anti-parasitic pharmaceutical industries have made tremendous advancements in terms of developing new molecules with improved anthelminthic properties, but parasitism still prevails [5]. Just of recent, albendazole was introduced as an essential anthelmintic, but its usage is sometimes abused [6]. In a context where modern breeding is increasingly confronted with problems related to chemical residues (food safety) and the appearance of parasitic resistant strains to the main families of pharmaceuticals around the world, this has exposed the limitations of a systematic deworming and makes the implementation of treatment protocols essential [3–7]. Studies on the efficacy of albendazole on gastrointestinal parasites in calves in the dry season in vina by Sakativa [8] and Sassa et al. [9] in sheep in Mbé in the Adamawa region, revealed the significant impact of gastro-intestinal parasitosis on the productivity of ruminants in the respective areas. But a longitudinal follow-up study on the effect of deworming on the dynamics of gastro-intestinal Strongyles of adult cattle in Vina is lacking. The purpose of this study was to determine the prevalence of cattle helminths and to evaluate the impact of albendazole treatment on faecal egg counts.

Material and Methods

Study zone

This field trial was carried out in Velambai, geographically located between latitude 6° and 8° North and between longitude 11° and 15 ° East. This area is called the ‘Castle of water’ because large number of rivers in the country originates from this locality. Resulting from the emergence of the old crystalline basement, the department of Vina is elevated at an altitude between 1000 and 1300 meters [10]. The high altitude of this region provides a relatively cool climate with temperatures ranging between 22–25°C [11]. The climate is of the Sudanese tropical type with two seasons: the dry season that occurs from November to March, followed by the wet season. The average annual rainfall is 900 mm to 1500 mm. This area is covered by discontinuous vegetation consisting of savanna grasses such as Hyparrheenia, Panicum and Sporobolus. Three cattle farms were randomly selected from the Velambai locality, where 175 animals of the Goudali cattle breed of both study groups received food supplements such as molasses and cotton seed cake (two to three times a week) during the dry season. Coprological assays were carried out on day zero (D0). A study on the prevalence of gastrointestinal parasites was performed on all the 175 selected animals. Faeces was collected from the rectum, stored in a cooler and transported to the Wakwa Agricultural Research Institute for Development (IRAD) Parasitology laboratory for analysis using the McMaster method. The egg per gram of faeces (EPG) ≥ 50 was noted [12–13].

To evaluate the impact of deworming using albendazole on the population dynamics of gastrointestinal strongyles, two groups of cattle were used to monitor the variation of gastro-intestinal Strongyles for 12 months post albendazole administration. 50 cattle of both sexes were selected from the 175 cattle initially selected. These 50 animals were divided into two groups: treated group of 25 cattle including 8 males and 17 females and an untreated group of 25 cattle including 11 males and 14 females. Only the animals in the experimental group (treated group) had undergone deworming with albendazole in bolus (7.5mg / Kg per os).
Fecal samples were taken once a month for 12 months (from April 2015 to March 2016), ie D0, D30, D60, D90, D120, D150, D180, D210 D240, D270, D300 and D330 after the administration of albendazole. Faecal samples of the animals were cultured in a saturated salt solution and larvae were isolated using the Baermann method [14]. Larval identification was carried out using the identification key of [15].

Data Analysis

The One-way analysis of variance (ANOVA) was performed to compare the effect of age, sex, type with infection prevalence. To compare different infection rates of nematodes, the X2 test was performed. The EPG averages of the two groups of cattle were compared using the Student t-Test. These different statistics were carried out using the R version 3.2 software. The efficacy of the treatment with albendazole was calculated at day 30 using the method of Presidente [16].

Results

The identification of gastro-intestinal helminths in cattle led to the identification of helminth eggs of veterinary importance i.e. strongyles; Strongyloides papillosus and Toxocara vitulorum. Strongyles were the most common (64.7%) (170.65 ± 7.67). Age and sex were statistically significant (p ≤ 0.05) with infection prevalence. Young animals (1–2 years) were the most infected (85%) and males (76.92%) were more infected than females (60.29%) (Table 1). The prevalence of Toxocara vitulorum was 24.1% (20.3–28). The young recorded a prevalence of 24.28% more infested than adults with a significant difference (p ≤ 0.05) (Table 1). The prevalence of Strongyloides was 12.3% (8.6–16) (Table 1).

Table 1. The prevalence of gastro-intestinal nematodes

IJVB2018-104-LendzeCameroon_F6

a, b, c, d: values with different superscript letters on the same line are significantly different (p < 0.05). µ: mean. sd: standard deviation, EPG: egg per gram

Effect of albendazole on the EPG of gastro-intestinal Strongyles

From D30 to D120 after treatment with albendazole, there was a significant decrease (p < 0.001) in faecal excretion of Strongyles eggs in the treated group (Table II). The EPG’s percentage reduction was 67.15%. In the untreated group, monthly EPG averages were moderate (EPG < 400) throughout the study period. Mean faecal egg shedding variations with respect to Strongyles revealed a peak on D90, but decreased to 68EPG on D330 (Table 2).

Table 2. Effect of albendazole on the EPG of gastro-intestinal Strongyles

Period

Treated group (µ ± sd)

Non-treated group (µ ± sd)

P-value

Significant levels

April (D0)

204 ± 170.73

268 ± 226.33

0.265

NS

May (D30)

86 ± 65.38

344 ± 162.86

0,000

***

June (D60)

180 ± 139.19

330 ± 158.77

0.000

***

July (D90)

179.17 ± 207.95

381.25 ± 181.67

0,000

***

August (D120)

202.17 ± 188.58

360.41 ± 174.44

0.004

***

September (D150)

190.91 ± 243.80

291.67 ± 155.11

0.106

NS

October (D180)

204.35 ± 180.22

277.08 ± 129.36

0.121

NS

November (D210)

46.87 ± 71.81

127.08 ± 141.41

0.024

*

December (D240)

33.33 ± 48.80

147.83 ± 154.83

0.003

***

January (D270)

60.00 ± 91.03

135.29 ± 125.95

0.06

NS

February (D300)

75.00 ± 106.46

68.18 ± 83.87

0.833

NS

March (D330)

103.13 ± 107.19

145.24 ± 108.29

0.247

NS

*: significatif; **: more significatif; ***: most significatif; µ: mean; sd: standard deviation, NS: no significant difference.

After the coproculture of the L3 nematode larval stages, the following nematodes: Haemonchus spp., Trichostrongylus spp., Cooperia spp., and Oesophagostomum spp were identified at the beginning of the rainy season. The proportion of the nematodes recovered from the different parts of the gastro-intestinal tract was: Abomasum parasites: Trichostrongylus spp. (42%) and Haemonchus spp. (28%), Parasite of the small intestine, of Cooperia spp. (18%), Parasite of the large intestine, Oesophagostomum spp. (12%). These four genera were present throughout the study in all the sampled herds. The variations of the average monthly intensities of the L3 of the Strongyles showed an overall monthly variation of Strongyles. Trichostrongylus sp. was the most common species from April to October with the lowest infection rate (IR) in January. Haemonchus sp. had two peaks: the first one in August and the second higher rate (56%) in January. Cooperia sp peaked in September while Oesophagostomum presented two peaks, the first in October and the second in late January and declined with its lowest rate in March (Figure 1).

IJVB2018-104-LendzeCameroon_F1

Figure 1. Monthly evolution of the L3 stages of the species of the genera of helminthes identified (T, non-treated animals)

The impact of deworming on Trichostrongylus sp. population was remarkable on D90 in the month of July and the percentage L3 shedding significantly declined in January (Figure 2).

IJVB2018-104-LendzeCameroon_F2

Figure 2. Effect of albendazole on Trichostrongylus sp. (E, treated group and T, non-treated group)

Haemonchus in the treated group responded to treatment by recording an L3 reduction from 29% (April-D0) to 12% in May (D30) post albendazole administration (p.a.a). A statistical significant difference (p ≤ 0.05) was observed between the two groups (treated-E and untreated-T) on days 30 and 60 (Figure 3).

IJVB2018-104-LendzeCameroon_F3

Figure 3. Effect of albendazole on Haemonchus sp. (E, treated group and T, non-treated group)

The mean infection prevalence of Cooperia was 12.1% in the treated group and 13.4% in the untreated counterpart. This frequency in the treated group significantly decreased (p ≤ 0.05) at D30 as compared to the untreated group (Figure 4). The occurrence peak of Cooperia sp. in the treated group was observed on D30, > one month after that of the untreated group (Figure 4).

IJVB2018-104-LendzeCameroon_F4

Figure 4. Effect of albendazole on Cooperia sp. (E, treated group and T, non-treated group)

Oesophagostomum sp in the treated group decreased more than that of the untreated group from September (Figure 5). Its peak in the treated group was observed in May. In the untreated group, two L3 occurrence peaks were noticed, the first one in October and the second in January (Figure 5).

IJVB2018-104-LendzeCameroon_F5

Figure 5. Effect of albendazole on Oesophagostomum sp. (E, treated group and T, non-treated group)

Discussion

Prevalence of gastrointestinal nematodes

Of the 175 cattle sampled in three farms in Velambai, 113 (64.5%) shedded Strongyle eggs (mean: 170.65 ± 7.67). This low average EPG observed could be justified by the extreme weather conditions of the dry season which might have limited the survival of the infestive larvae and consequently the parasite load [17], although the effect of larval hypobiosis cannot be ruled-out [18]. This result is close to the  69.57% observed in calves in the Vina by Sakativa [8]. The prevalence of Strongyles was higher in the Velambai 1 farm (76%) than in the Velambai 2 and Velambai 3 farms (70% and 58.58% respectively) with a statistically significant difference between the three farms. These results are due to pasture management. Indeed, the animals of Velambai l and 2 were regularly dewormed which could have reduced the parasite load in these sites. This finding is similar to that of Sassa et al., [9] in small ruminant farms in Vina. Our results show that Toxocara sp. was frequent in the young animals (24.28%). Age and sex had statistically significant (p ≤ 0.05) effects on Toxocara sp occurence. The prevalence of Strongyloides was 12.3%. This prevalence is close to the 9% observed by Ntonifor et al., [4] in the Jakiri area, but far below the 75.5% obtained by Chollet et al., [3] in calves 0–12 months of age in the North and Far North of Cameroon. The low IR here could be due to the average age of the animals (three years six months). Indeed, with Strongyloides there was a strong immunity against this parasite in cattle from the age of 6–9 months [13].

Effect of albendazole on faecal shedding of Strongyles

After one month of treatment, there was a significant decrease (p ≤ 0.05) in the level of faecal egg shedding of Strongyles eggs in cattle receiving albendazole. This result corroborate with those observed in some studies on the resistance of gastro-intestinal Strongyles of ruminants to anthelmintics [19–9]. The percentage response to treated by this group was 68.7%, revealing a form of resistance to albendazole. In fact, in this study, 60% of the animals were adult cattle (more than two years old). These animals could have received several treatments with albendazole, resulting in Strongyles resistance to this molecule [13]. In the untreated group, OPG monthly averages were maintained at a moderate level (EPG < 400) throughout the year. This result confirmed the effect of the rainy season on the variation of Strongyles eggs. Chiejina and Behnke [20] showed that small rains at the end of the dry season resulted in the development of the infective larvae on the pasture. Acquired immunity might have maintained a moderate level of EPG since the group of cattle examined consisted of 60% of animals over two years old. This finding corroborates with that of Elele et al., [21] on cattle in Port Harcourt, Nigeria.

Variation of the larval population of Strongyles

This study revealed multiple infections in cattle in the Adamawa region of Cameroon and this parasitism was similar to that already reported in cattle in many countries in Africa including Burkina Faso [22], Senegal [18] and Cameroon in small ruminants [9]. Similar results with the predominance of Haemonchus and Trichostrongylus genera were also obtained in sheep in Brazil by Klauck et al., [23]. The antagonistic variation between Trichostrongylus sp and Haemonchus could be due to ecological niche competition as the two parasites share the same habitat (abomasum) [24]. On the other hand, this variation on the genera Cooperia (parasite of the small intestine) and Oesophagostomum (parasite of the large intestine) was rather due to an indirect mechanism occuring through the stimulation of the immune reaction of the host or non-specific inflammatory reactions [24]. The effect of deworming on Trichostrongylus sp was observed on the treated group on D90. But this difference was not statistically significant (p > 0, 05). Roeber et al., [25] and Demelash et al., [26] both observed this low sensitivity of Trichostrongylus sp to albendazole in sheep in Australia and cattle in Ethiopia respectively. The percentage of L3 of Trichostrongylus sp was lower at the end of the rainy season in both treated and untreated groups. Pfukenyi and Mukaratirwa [27] also observed low Trichostrongylus sp. L3 levels at the end of the rainy season, which according to these authors could be low due to the transition in climatic factors of the late seasons (rainy and dry). The percentage of L3 Haemonchus sp in the treated group dropped from 29% to 12%, one month (D30) p.a.a. Statistical significant differences (p ≤ 0.05) were observed between treated and untreated groups from D30 to D90. The susceptibility of Haemonchus sp to albendazole was also observed in cattle and equines in Morocco by Zoutien et al., [28] and sheep of Mbé in the Adamawa region of Cameroon [9]. The effect of albendazole on Haemonchus sp from D120 in the treated cattle group was reported to witness some sort of re-infection, especially with the presence of untreated animal faecal material reservoirs on the pasture land. The percentage of the L3 stage of Cooperia was average in both groups throughout the duration of the study (12.1% in the treated group and 13.4% in the untreated group). This may be due to its high resistance to extreme climatic conditions, despite its low fertility [3–29–27]. The effect of treatment with albendazole was significantly ((p ≤ 0.05) different from the untreated group only at day 30. The percentage of L3 of Oesophagostomum sp in the treated group decreased more than that in the untreated group from D90. This could be related to their sensitivity to albendazole that appears to be related to the location of adult worms in the digestive tract of cattle. Indeed, Oesophagostomum is a worm of the large intestine, since albendazole was administered as a 500 mg bolus, this would have required some time for the dissolution in the rumen and thus a late maximum concentration in the large intestine. Holsback et al., [30] also noted this form of resistance of Oesophagostomum in calves in Paraná.

Conclusion

The objective of self-sufficiency in meat products especially in the reduction of the scramble for beef that Cameroon aims at, a new policy on the development of the livestock sector must be established. Our study of gastrointestinal parasites in cattle in Vina demonstrated the validity of the initial hypothesis that gastrointestinal helminths of cattle are predominant in Vina and that the deworming effect of albendazole has an impact on population variation. It showed two peaks in the infestation level during the rainy season with significant intensities, unlike other studies in the area and showed that animals from one to two years were mostly infected. We were able to show the presence of four genera of gastrointestinal Strongyles among which the genera Trichostrongylus and Haemonchus (parasites of the abomasum) were with frequent. Also, it should be noted that deworming at the beginning of the rainy season will keep the animals at a low infection level until the beginning of the dry season. In addition, this study showed that albendazole has a much greater effect on the population of Haemonchus sp and that this effect is late when referring to the population of Oesophagostomum. Treatments could be administered in mid-May (one month after the actual start of the rains) and in late July (second half of the rainy season). Deworming in mid-May will greatly target the genus Trichostrongylus, while doing so at the end of July will greatly target the genus Haemonchus. Finally, this study also revealed high levels of trematode infection that should also be included in control measures. Any proposal for a deworming schedule should be a subject to economic evaluation and should consider the risk of development of resistance to anthelmintics.

Acknowledgements: This work was supported by the vaccine project. We thank the Department of Parasitology and Parasitological Diseases for the material support. We thank IRAD Wakwa for technical and material assistance.

Conflict of interest: Authors declare no conflict of interest

References

  1. Chartier C, Itard J, Morel P, Troncy P (2000) Précis de Parasitologie Vétérinaire Tropicale. Paris.
  2. Zinsstag J (2000) Nématodes gastro-intestinaux du bétail bovin N’Dama en Gambie: effets sur la productivité et options pour la lutte. Thèse PhD N° 11, Institut de Médecine Tropicale Prince Leopold, Antwerpen, Belgique.
  3. Chollet JY, Martrenchar A, Bouchel D, Njoya A (1994) Épidémiologie des parasitoses digestives des jeunes bovins dans le Nord-Cameroun. Revue d’Élevage et Médecine. Vétérinaire des Pays tropicaux. 47: 365–374
  4. Ntonifor HN, Shei S J, Ndaleh NW, Mbunkur G N (2013) Epidemiological studies of gastrointestinal parasitic infections in ruminants in Jakiri, Bui Division, North West Region of Cameroon. J Vet Med Anim Hlth 5: 344–352.
  5. Radostits OM, Gay CC, Hinchcliff KW, Constable PD (2006) Veterinary medecine: A textbook of the diseases of cattle, horses, sheep, pigs and goats. Tenth Edition, New York, USA, 2162p.
  6. Tanguy I (2011) Évaluation de la résistance des strongles digestifs aux anthelminthiques dans les élevages ovins en Bretagne ? 73p. Thèse de Doctorat Vétérinaire, École Nationale Vétérinaire d’Alfort.
  7. Wymann MN (2005) Calf mortality and parasitism in periurban livestock production in Mali, these PhD, Université de Basel, 227p.
  8. Sakativa D (2014) Effet de la vermifugation chez les jeunes bovins de l’Adamaoua pendant la saison sèche. Mémoire de Diplôme de Docteur Vétérinaire. Université de Ngaoundéré. 76p.
  9. Sassa MA, Agnem EC, Gambo H, Njan Nloga A (2014). Résistance des strongles gastro-intestinaux aux anthelminthiques chez les moutons à Mbé au Cameroun. Revue Africaine de Santé et de Productions Animales 12 : 21–26
  10. Letouzey (1968) Situation des resources genetiques forestieres du Nord-Cameroun, Archives de document de la FAO. Departement des forets 3: 12–14
  11. Mbahe RE (1998) Résultats de recherche agricole pour le développement en zone agro-écologique des hautes savanes guinéennes (Adamaoua). In : Comité régional des programmes, 27–28 oct. 1998. Ngaoundéré, Cameroun, Irad, 17 p.
  12. Hansen J, Perry B (1995). Épidémiologie, Diagnostic et Prophylaxie des Helminthiases des Ruminants Domestiques (7nd edn). FAO : Rome, Italie.
  13. Troncy PM, Chartier C (2000). Helminthoses et coccidioses du bétail et des oiseaux de la basse-cour en Afrique tropicale. In : Chartier C., Itard J., Morel P.C., Troncy P.M., éds, Précis de parasitologie vétérinaire tropicale. Paris, France, Tec & Doc, 773 p.
  14. Thienpont D, Rochette F, Vanparys OFJ (1979) Diagnostic de verminose par examen coprologique. Janssen Research Fondation, Beerse, Belgium, 187 p.
  15. Thienpont D, Rochette F, Vanparijs O (1995). Diagnostic de verminose par examen coprologique. Janssen Research Foundation: Beerse 187p.
  16. Presidente PJA (1985) Methods for the detection of resistance to anthelmintics. In: Resistance in Nematodes to Anthelmintic Drugs (Anderson, N., Waller, and P.J. Eds.). Division of Animal Health, CSIRO, Australia. 13–27.
  17. Ndamukong KJ1, Ngone MM (1996) Development and survival of Haemonchus contortus and Trichostrongylus sp. on pasture in Cameroon. Trop Anim Health Prod 28: 193–198. (crossref)
  18. Ndao M1, Pandey VS, Zinsstag J, Pfister K (1995) Effect of a single dry season anthelmintic treatment of N’Dama cattle on communal pastures in The Gambia. Vet Res Commun 19: 205–213. (crossref)
  19. Gasbarre L, Larry C, Smith L, Patricia E, Pilitt A (2009) Further characterization of a cattle nematode population with demonstrated resistance to current anthelmintics Vet Parasitol 166: 275–280.
  20. Chiejina SN, Behnke JM (2011). The unique resistance and resilience of the Nigerian West African Dwarf goat to gastrointestinal nematode infections. Parasites & Vectors 4: 12
  21. Elele KO, Owhoeli, Gboeloh LB (2013) Prevalence of species of helminths parasites in cattle slaughtered in selected abattoirs in Port Harcourt, south-south, Nigeria International Res Med Sci 1: 10–17.
  22. Ouedraogo A, Ouattara L, Kaufmann J, Pfister K (1992) Epidémiologie des nématodes gastro-intestinaux des ruminants au Burkina Faso: Spectre, fréquences et variations saisonnières. In: 7ème Conf. AIMVT, Yamoussoukro, Côte-d’Ivoire. 749–750.
  23. Klauck V, Pazinato R, Lopes L S, Cucco D C, De Lima H L, et al. (2014). Trichostrongylus and Haemonchus anthelmintic resistance in naturally infected sheep from southern Brazil. Annals of the Brazilian Academy of Sciences 86: 777–784
  24. Dorchies PH, Lacroux C, Levasseur G, Alzieu JP (2002) La paramphistomose bovine. Bulletin des GTV, 13: 87–90.
  25. Roeber F, Jex AR, Campbell AJD, Nielsen R, Anderson GA, et al. (2012). Establishment of a robotic, high-throughput platform for the specific diagnosis of gastrointestinal nematode infections in sheep. Int J Parasitol 42: 1151–1158.
  26. Demelash K, Alemu F, Niguse A, Feyera T (2014). Prevalence of gastrointestinal parasites and efficacy of anthelmintics against Nematodes in camels in Yabello District, Southern Ethiopia. Acta Parasitologica Globalis 5: 223–231.
  27. Pfukenyi DM, Mukaratirwa S (2013). A review of the epidemiology and control of gastrointestinal nematode infections in cattle in Zimbabwe. J Vet Res 80 : 12.
  28. Zouiten H (2006) Résistance aux anthelminthiques des nématodes parasites du tube digestif chez les ovins et les équidés au Maroc. Université MOHAMMED V-AGDAL (Maroc): 141p.
  29. Achi YL1, Zinsstag J, Yao K, Yeo N, Dorchies P, et al. (2003) Host specificity of Haemonchus spp. for domestic ruminants in the savanna in northern Ivory Coast. Vet Parasitol 116: 151–158. (crossref)
  30. Holsback L, Da Silva MA, Patelli T H C, Paula De Jesus A, et al. (2014). Resistance of Haemonchus, Cooperia, Trichostrongylus, and Oesophagostomum to ivermectin in dairy cattle in Paraná. Ciências Agrárias, Londrina. 36: 2031–2036.

Current and Emerging Treatments for Painful Diabetic Neuropathy

DOI: 10.31038/JCRM.2018111

Introduction

Diabetes affects more than 30 million people in the United States with type 2 diabetes accounting for 90–95% of cases (www.diabetes.org). Annual medical expense and disease-related societal burden from diabetes cost more than $245 billion. Most of the diabetic -related disabilities are from chronic diabetic complications in the cardiovascular, renal, retinal, and nervous systems. Among these, diabetic polyneuropathy occurs in approximately 60% of all diabetic patients [1, 2]. Diabetic polyneuropathy causes significant public health burden, serving as the leading cause of diabetes-related hospital admissions and non-traumatic amputations [1, 3, 4].

Patients with diabetic polyneuropathy frequently suffer from painful symptoms, termed as painful diabetic neuropathy (PDN) [2]. Clinically, PDN typically presents with length-dependent spontaneous pain with a combination of burning, tingling, electric-like, or achy sensations. It begins in the feet and extends proximally over time with bilateral and symmetric stocking distribution. Similar distal to proximal pattern of painful symptoms could develop at a later stage in the upper extremities. Patients with PDN also experience induced-pain, such as allodynia and hyperalgesia. Allodynia occurs when regularly innoxious stimuli, such as light touch, become painful, whereas hyperalgesia is increased nocuous sensitivity to painful stimuli, like pin prick. Despite the high morbidity of PDN [5, 6], the underlying molecular mechanisms of PDN are poorly understood [7]. Without targeting the key pathology that leads to the development of PDN, currently accepted medical approaches are only partially successful and are often ineffective [5, 8]. Inadequate control of PDN has significantly reduced quality of life for patients with diabetes [5, 6, 8]. In addition to suffering from painful symptoms, patients with PDN frequently develop insomnia, depression and anxiety, decreased mobility, psychomotor impairment and loss of work [5, 6, 8]. Clearly, more mechanism-specific therapies are urgently needed to effectively manage this common and important health problem.

Current treatment guidelines

Over the last three decades, basic science and clinical studies have generated significant amount of evidenced-based data to establish treatment guidelines for PDN. The 2006 and 2010 guidelines from the European Federation of Neurological Societies task Force (EFNS) [9, 10] and the 2011 guidelines from the American Academy of Neurology (AAN), the American Association of Neuromuscular and Electrodiagnostic Medicine, and American Academy of Physical Medicine and Rehabilitation [11] are the most thorough and up-to-date guidelines on this topic. Several class drugs including α2δ calcium channel antagonists (gabapentin, and pregabalin), anti-convulsants, tricyclic anti-depressants (TCAs), serotonin-norepinephrine reuptake inhibitors (SNRIs), opioids, and various other treatment modalities are discussed and recommended according to the quality of their supporting data. Each published clinical trial is classified according to its level of evidence, following guidelines such as the “AAN classification of recommendations” (www.AAN.com). Although there could be variations among these guidelines, trials deemed as class I are considered to have the highest quality of evidence with lowest risk of bias to support the application of the study drugs. The quality of evidence is decreased in high leveled classes; with class IV evidence has the highest bias potential and lowest supporting evidence for clinical use.

Level A treatments are strongly recommended with class I evidence or consistent findings from multiple studies of class II, III, or IV. They are recommended in clinical practice unless a clear and compelling rationale for an alternative approach is present. Level B treatments are with levels II, III, or IV evidence and findings are generally consistent. Generally, clinicians should follow this recommendation but should remain alert to new information and sensitive to patient preferences [12]. Level C, D, and U treatments do not have sufficient evidence to support their clinical practice.

The use of gabapentin, pregabalin, TCAs (such as amitriptyline), SNRIs (venlafaxine and duloxetine) are supported by EFNS with level A recommendation. In addition, controlled-release oxycodone is recommended by EFNS as effective with level A recommendation based on two class I studies. Tramadol alone or with acetaminophen were listed by the EFNS as level A effective treatments based on two class I studies. Level B recommendations from EFNS include Dextromethorphan (an agonist of N-methyl-D-aspartate receptor, 400 mg/d), Topical capsaicin 0.075% ointment that activates the transient receptor potential cation channel subfamily V member (TRPV) 1, isosorbide dinitrate spray (a vasodilator), type A botulinum toxin (BTX-A, blocks acetylcholine release) and levodopa (a dopamine precursor) [9, 10].

The guideline from AAN supports the use of pregabalin with level A recommendation. Gabapentin, sodium valproate (an anti-convulsant), venlafaxine, duloxetine, amitriptyline, dextromethorphan, morphine sulfate, tramadol, oxycodone, capsaicin 0.075% ointment, isosorbide dinitrate spray, electric stimulation and percutaneous nerve stimulation are presented as level B recommendations. Other anti-convulsants such as oxcarbazepine and lamotrigine; clonidine (an a2 adrenergic  agonist), pentoxifylline (a xanthine derivative), magnetic field treatment, low-intensity laser therapy, and Reiki therapy are not recommended [11].

Emerging treatments

One of the most promising new gene therapies for PDN is a DNA-based therapy using a plasmid DNA that contains the human hepatocyte growth factor (HGF) gene (VM202). VM202 enhances local expression of HGF to promote microvasculature growth and regenerate peripheral nerves to improve symptoms of PDN. A phase 3 study showed that PDN patients receiving 8 mg of VM202 injection per leg improved in all efficacy measures with 48.4 % of the patients experienced at least a 50% reduction in mean pain score in the treated group compared with 17.6 % in the placebo group after 3 months [13]. However, this analgesic effect was not statistically significant at 6 and 9 months. The study also demonstrated significant improvement in the brief pain inventory and the questionnaire portion of the Michigan Neuropathy Screening Instrument. Interestingly, the researchers noted that the largest reductions in pain were found among patients not on pregabalin or gabapentin. In addition, there were no significant adverse events attributable to VM202 and this treatment was deemed safe and well tolerated [13].

A network meta-analysis accumulated 25 randomized controlled trials for studying the effects of capsaicin 179 mg cutaneous patch (capsaicin 8% patch) on PDN. It was concluded that capsaicin 8% patch was significantly more effective than placebo with ≥30% pain reduction in PDN patients. In addition, capsaicin patch was statistically more efficacious when compared with pregabalin and gabapentin. It had similar efficacy while being compared with duloxetine [14].

Nerve growth factor (NGF) has been established as an essential factor for the development of nociceptive nerves. It also mediates the development of mechanical allodynia in animal model of type 2 diabetes [15]. Clinical trials using NGF neutralizing antibodies, including tanezumab and fulnatumab, have been reported with positive results for treating PDN. In the study that examined the effects of tanezumab in PDN, test subjects received subcutaneous tanezumab 20 mg or placebo on Day 1 and Week 8. Mean PDN pain reduction from baseline to Week 8 was greater with tanezumab vs placebo. However, differences in Patient’s Global Assessment of DPN were not significant [16].

Fulranumab, a fully human monoclonal anti-NGF antibody was also tested for PDN. In a phase II, double-blind, placebo-controlled trial, patients with moderate to severe PDN were randomized to treatments with fulranumab (1, 3, or 10 mg) or placebo administered subcutaneously every 4 weeks. Because of early study termination (clinical hold by the US Food and Drug Administration), only 77 of the planned 200 patients were enrolled. The primary endpoint, the mean reduction of average daily pain at week 12 compared with baseline, showed a positive dose-response relationship. The pair-wise comparison between the 10-mg group and placebo was significant. An exploratory responder analysis revealed that a greater proportion of patients in the 10-mg group reported ≥30% reduction in the average pain intensity compared with placebo at week 12. During the combined efficacy and safety extension phases, the top 3 treatment-emergent adverse events in the combined fulranumab group were arthralgia (11%), peripheral edema (11%), and diarrhea (9%). No cases of joint replacement or death were reported [17]. Despite early study termination, fulranumab treatment resulted in dose-dependent efficacy and was generally well tolerated.

ARA 290 is a nonhematopoietic peptide designed from the structure of erythropoietin. In this trial, ARA 290 (4 mg) or placebo were self-administered subcutaneously daily for 28 days and the subjects followed for an additional months without further treatment. During the 56-day observation period, subjects with ARA 290 treatments had improvement in hemoglobin A1c (Hb A1c) and lipid profiles. Neuropathic pain from PDN improved significantly in the ARA 290 group. In addition, subjects with >1 standard deviation reduction in mean corneal nerve fiber density (CNFD) showed a significant improvement in CNFD compared with no change in the placebo group [18].

Botulinum toxins (BoNTs) are used for treating multiple painful conditions. However, BoNTs are not yet approved for treating PDN in the United States. Multiple small-scaled clinical trials have provided evidence to support the use of type A BoNT (BTX-A) injections for PDN. A meta-analysis selected and analyzed the data from a class I [19] and class II [20] studies to examine the efficacy of BTX-A on PDN [21]. Combining the two qualifying studies, there were a total of 58 patients receiving a sum of 76 treatments for PDN randomly allocated to placebo or BTX-A treatments. The injected areas were identical in each trial with a fixed protocol using a 3 × 4 grid that was equally spaced to demarcate the injection sites on the dorsum of each foot. The class 2 study used OnabotulinumA while the class 1 study used AbobotulinumtoxinA. It was concluded that there was an improvement of 1.96 visual analogue scale points following treatment with BTX-A [21]. The results were concluded as clinically significant improvement of “minimum change in pain.” No serious adverse effects were reported in both trials. The meta-analysis evaluated the significance, low overall risk of bias, and almost no statistical heterogeneity support a correlation between Botox and improvement of pain scores for treating PDN [21]. However, further large scale controlled trials are needed to further establish the clinical efficacy and safety for this potential new indication for BTX-A.

Future study strategies

As reviewed in the current article, promising evidence support that several emerging treatments could be available for treating PDN in the near future. Other novel strategies are also under extensive study for developing new PDN treatments.

Animal studies have provided evidence that neurogenic inflammation in skin could be an important pathomechanisms for the development of PDN [22]. In a mouse model of type 2 diabetes, skin inflammatory cells (such as macrophages and Langerhans cells) could be activated by NGF signaling to target intraepidermal nerve fibers and be responsible for the development of pain behaviors. New evidence suggests that cytokine dysregulation could contribute to these skin inflammatory phenomena and suggest using immuno-modulatory therapies could be a novel treatment strategy for PDN [23].

Sodium channel NaV 1.7, NaV 1.8, and NaV 1.9 (encoded by SCN9A, SCN10A, and SCN11A respectively) are preferentially expressed in peripheral sensory neurons for nociception. Sodium channel Nav1.7 antagonists, including Xenon 402, CNV1014802, and PF-05089771, are being tested as new therapies for PDN [24]. Taken together, accumulating data from evidence-based studies shine light to the promising future of PDN management.

References

  1. Feldman EL (2001) Diabetic neuropathy, in Principles and Practice of Endocrinology and Metabolism. Philadelphia, Lippincott Williams & Wilkins, USA, pp. 1391–139.
  2. Feldman EL (2003) Somatosensory neuropathy, in Ellenberg and Rifkin’s Diabetes Mellitus. Pennsylvania, McGraw Hill, USA, pp: 771–788.
  3. Feldman EL (1999) Diabetic neuropathy, in Current Review of Diabetes. Current Medicine 71–83.
  4. Feldman EL (1999) Diabetic neuropathy, in Diabetes in the New Millennium. The Endocrinology and Diabetes Research Foundation of the University of Sydney: Sydney. pp: 387–402.
  5. Dworkin RH,  Turk DC,  Farrar JT,  Haythornthwaite JA,  Jensen MP, et al. (2005) Core outcome measures for chronic pain clinical trials: IMMPACT recommendations. Pain 113: 9–19. [Crossref]
  6. Jensen MP, Dworkin RH, Gammaitoni AR, Olaleye DO, Oleka N, et al. (2006) Do pain qualities and spatial characteristics make independent contributions to interference with physical and emotional functioning? J Pain 7: 644–653. [Crossref]
  7. Galer BS, Gianas A, Jensen MP (2000) Painful diabetic polyneuropathy: epidemiology, pain description, and quality of life. Diabetes Res Clin Pract 47: 123–128. [Crossref]
  8. Dworkin RH, Jensen MP, Gammaitoni AR, Olaleye DO, Galer BS. (2007) Symptom profiles differ in patients with neuropathic versus non-neuropathic pain. J Pain 8: 118–126. [Crossref]
  9. Attal N (2006) EFNS guidelines on pharmacological treatment of neuropathic pain. Eur J Neurol 13: 1153–1169. [Crossref]
  10. Attal N, Cruccu G, Baron R, Haanpää M, Hansson P, et al. (2010) EFNS guidelines on the pharmacological treatment of neuropathic pain: 2010 revision. Eur J Neurol 17: 1113. [Crossref]
  11. Bril V, England J, Franklin GM, Backonja M, Cohen J, et al. (2011) Evidence-based guideline: Treatment of painful diabetic neuropathy: report of the American Academy of Neurology, the American Association of Neuromuscular and Electrodiagnostic Medicine, and the American Academy of Physical Medicine and Rehabilitation. Neurology 76: 1758–1765. [Crossref]
  12. Burns PB, Rohrich RJ, Chung KC (2011) The levels of evidence and their role in evidence-based medicine. Plast Reconstr Surg 128: 305–310. [Crossref]
  13. Kessler JA, Smith AG, Cha BS, Choi SH, Wymer J, et al. (2015) Double-blind, placebo-controlled study of HGF gene therapy in diabetic neuropathy. Ann Clin Transl Neurol 2: 465–478. [Crossref]
  14. van Nooten F, Treur M, Pantiri K, Stoker M, Charokopou M (2017) Capsaicin 8% Patch Versus Oral Neuropathic Pain Medications for the Treatment of Painful Diabetic Peripheral Neuropathy: A Systematic Literature Review and Network Meta-analysis. Clin Ther 39: 787–803 e18. [Crossref]
  15. Cheng HT, Dauch JR, Hayes JM, Hong Y, Feldman EL (2009) Nerve growth factor mediates mechanical allodynia in a mouse model of type 2 diabetes. J Neuropathol Exp Neurol 68: 1229–1243. [Crossref]
  16. Bramson C, Herrmann DN, Carey W, Keller D, Brown MT et al. (2015) Exploring the role of tanezumab as a novel treatment for the relief of neuropathic pain. Pain Med 16: 1163–1176. [Crossref]
  17. Wang H, Romano G, Frustaci ME, Bohidar N, Ma H, et al. (2014) Fulranumab for treatment of diabetic peripheral neuropathic pain: A randomized controlled trial. Neurology 83: 628–637. [Crossref]
  18. Brines M, Dunne AN, van Velzen M, Proto PL, Ostenson CG et al. (2015) ARA 290, a nonerythropoietic peptide engineered from erythropoietin, improves metabolic control and neuropathic symptoms in patients with type 2 diabetes. Mol Med 20: 658–666. [Crossref]
  19. Ghasemi M, Ansari M, Basiri K, Shaigannejad V (2014) The effects of intradermal botulinum toxin type a injections on pain symptoms of patients with diabetic neuropathy. J Res Med Sci 19: 106–111. [Crossref]
  20. Yuan RY, Sheu JJ, Yu JM, Chen WT, Tseng IJ, et al. (2009) Botulinum toxin for diabetic neuropathic pain: a randomized double-blind crossover trial. Neurology 72: 1473–1478. [Crossref]
  21. Lakhan SE, Velasco DN, Tepper D (2015) Botulinum Toxin-A for Painful Diabetic Neuropathy: A Meta-Analysis. Pain Med 16: 1773–1780. [Crossref]
  22. Dauch JR, Bender DE, Luna-Wong LA, Hsieh W, Yanik BM, et al. (2013) Neurogenic factor-induced Langerhans cell activation in diabetic mice with mechanical allodynia. J Neuroinflammation 10: 64. [Crossref]
  23. Zhang C, Ward J, Dauch JR, Tanzi RE, Cheng HT (2018) Cytokine-mediated inflammation mediates painful neuropathy from metabolic syndrome. PLoS One 13. [Crossref]
  24. Bagal SK, Marron BE, Owen RM, Storer RI, Swain NA (2015) Voltage gated sodium channels as drug discovery targets. Channels (Austin) 9: 360–366. [Crossref]

Fentanyl overdose in a female with the FMR1 premutation and FXTAS

DOI: 10.31038/JMG.2018111

Abstract

Fragile X-associated tremor/ataxia syndrome (FXTAS) affects individuals with 55-200 CGG repeats (premutation) in the 5’-untranslated region of the fragile X mental retardation 1 (FMR1) gene. FXTAS is a progressive neurodegenerative disorder associated with an action tremor, cerebellar ataxia, memory and executive function deficits, autonomic dysfunction and neuropathy. Females with the fragile X premutation are often affected by fragile X-associated primary ovarian insufficiency (FXPOI), and may have other medical conditions such as fibromyalgia, depression, anxiety, and immune-mediated disorders like hypothyroidism. Here we present a case of a 54-year-old woman with tremor, ataxia, average memory skills, and executive function deficits who meets criteria for FXTAS. She also has anxiety, Major Depressive Disorder, fibromyalgia, chronic pain and was treated chronically with opioids and she overdosed on fentanyl leading to significant CNS dysfunction.

Keywords

fentanyl, FMR1 premutation, fragile X syndrome, fragile X–associated tremor/ataxia syndrome, FXTAS

Introduction

Patients with the premutation (55-200 CGG repeats) in the fragile X mental retardation 1 (FMR1) gene have elevated FMR1 mRNA expression levels, which have been associated with neurotoxicity, potentially causing neurodevelopmental problems or neurological problems associated with aging in both males and females [1,2]. Women with the premutation face many physical and emotional challenges in their life especially when raising a child with fragile X syndrome (FXS) [3]. Women with the premutation are at risk for early menopause before age 40 (fragile X-associated primary ovarian insufficiency (FXPOI)), fibromyalgia, hypothyroidism, migraines, restless legs syndrome, depression, and anxiety [2,4]. The estimated carrier prevalence of the premutation in women in the USA is approximately 1: 178 [5,6] Premutation carriers may also develop fragile X–associated tremor/ataxia syndrome (FXTAS), a neurodegenerative disorder with increased prevalence with age [7]. FXTAS clinical features include progressive cerebellar ataxia and intention tremor in addition to autonomic dysfunction, peripheral neuropathy, and cognitive impairment [2,8]. Many individuals experience chronic pain and often opioids are prescribed to relieve pain [9]. However, anecdotal evidence suggests that those on long term opioid treatment may experience an increase in the white matter brain changes observed in those with FXTAS [10]. Here we report a case of a woman with FXTAS and autonomic dysfunction who experienced an overdose from fentanyl.

Materials and methods

The patient in this study was evaluated at the Fragile X Research and Treatment Center located at the UC Davis MIND Institute. The patient signed an IRB approved consent form for this research when she was seen. Data were acquired from the medical history obtained during study visits.

Clinical report

The patient is a 54-year-old Caucasian women with a normal allele of 30 CGG repeats and a premutation allele of 93 CGG repeats, with an activation ratio (AR) of 0.15 meaning that only 15% of her cells have the normal X chromosome as the active X. FMR1 mRNA level was 2.71 ± 0.15 times normal. She has a long history of anxiety beginning in childhood and intermittent depression in her adult life. She has a son with FXS who is relatively high functioning. She experienced onset of an intermittent intention tremor and postural tremor at age 49 bilaterally, but more pronounced in her right arm. Progressive balance problems began at age 48, which caused her to fall; her gait difficulties gradually worsened over the next few years.

Her memory problems began at age 47. Her stamina has decreased profoundly over the last few years. She had neuropathy with tingling and numbness in her legs beginning at age 39. Her medical history includes acid reflux, migraines with visual aura, chronic vertigo and chronic pain secondary to fibromyalgia. She started to smoke marijuana daily at age 34 to help her chronic pain. Her history also includes restless legs syndrome, ovarian cysts (which were treated by oophorectomy at age 27), orthostatic hypotension, insomnia (for many years), recurrent urinary tract infections, recurrent nausea and vomiting (treated for the past 10 years with ondansetron). She has a long psychiatric history including severe anxiety, major depression, mood swings, bulimia, and post-traumatic stress disorder (PTSD) (Table 1).

Table 1. FXTAS clinical and molecular findings.

Medical History/Clinical Findings

Age at Onset of Symptoms (years)

Generalized Anxiety

Bulimia

Migraines

FXPOI

Major Depressive Disorder

Dizziness and vertigo

Hypothyroidism

Fibromyalgia

Chronic Pain

Tingling and numbness

Memory problems

Handwriting problems

Balance problem

Swallowing problem

Tremor

Hearing loss

10

14

16

27

30

34

34

34

34

39

47

47

47

47

48

53

Neurological Exam

Severity of Symptoms

Right upper extremity

Left upper extremity

Intention tremor (+++)

Postural tremor (++)

Intention tremor (+)

Postural tremor (+)

Molecular Tests

Results

Fragile X DNA test (CGG repeats)

FMR1 mRNA level (times normal)

93

2.71

 Diagnosis

FXTAS diagnosis

FXTAS stage

Probable

4

Due to chronic pain from the fibromyalgia, she started using hydrocodone which made her sick and sleepy. Therefore she discontinued the use of hydrocodone and started fentanyl patches at age 51, with a 75 mcg/hour patch two to three times per day. She was found passed out at home after using a fentanyl patch and she was taken to the emergency room and then the intensive care unit for four days. She was found to have a 95% blockage of her right carotid artery and she suffered from a serious episode of hypoxia from the fentanyl overdose. After this hospitalization she felt much weaker with worsening of the tremor and ataxia, and she could not walk without crutches. She subsequently underwent surgery to alleviate the carotid blockage and a stent was placed in her carotid artery at age 55.

Her current medications include fentanyl patches (25 mcg/hour patch) for pain control, hydrocodone (10-25 mg), diazepam, pitavastatin (4 mg) for pain control, ondansetron (4 mg) for nausea, topiramate for migraine, meclizine for dizziness, paroxetine hydrochloride (40 mg), clopidogrel (75 mg) after stent replacement, probiotics, levothyroxine sodium (0.125mg per day), and cyanocobalamin (1000 mcg/ml).

Her family history includes her father who died of FXTAS, and she has a son with FXS who is 35 years old.

At age 54 before her stent was placed but after her overdose her examination demonstrated: occipital frontal circumference 56.5 cm, height 165.3 cm, weight 66.1 kg, blood pressure was 131/80, and heart rate was 59 bpm. The patient’s neurologic examination included a severe intention tremor with right hand worse than the left hand and dyskinesia in her movements, a positive snout reflex, and a positive palmomental reflex. She had allodynia (pain to touch), and was ataxic with gait. She could not tandem walk.

Her deep-tendon reflexes were 2+ in the upper extremities, 4+ at the knees, and 2+ at the ankles but she often jerked her whole upper body with the tap of the reflex hammer. Her gag reflex was exaggerated and she had bilateral skin nodules around her proximal metacarpal joints. The patient underwent numerous neuropsychological and neuropsychiatric assessments, including the Wechsler Adult Intelligence Scales, 4th edition (WAIS-IV) [11], the Wechsler Memory Scales, 4th edition (WMS-IV) [12], and the Mini-Mental Status Exam (MMSE) [13] to test cognitive status, and the Structured Clinical Interview for DSM-IV Axis 1 Disorders, Research Version, Non-patient Edition(SCID-I/NP) [14] to diagnose psychiatric disorders. Self-reported psychological problems and symptoms of psychopathology were assessed through the Symptom Checklist-90-R (SCL-90-R) [15]. The SCL-90-R scores are reported in T-scores, which have an average range between 40 and 59. For the assessment of executive function, the Behavioral Dyscontrol Scale 2 (BDS-2) [16] was administered. Her scores on the above mentioned assessments are seen in Table 2.

MRI of the brain at age 54 years after overdose and before vascular surgery demonstrated mild atrophy, increased T2 signal intensity in the pons, and severe diffuse increased T2 signal intensity in the deep white matter of the cerebrum. White matter damage was greater on the right side of the brain compared to the left side, suggesting hypoxic damage secondary to the carotid blockage (Figure 1).

Discussion

In this study we report on a woman who has the FMR1 premutation, FXTAS, chronic pain secondary to fibromyalgia and a fentanyl overdose that led to hypoxia because of a carotid artery blockage secondary to atherosclerosis. Opioids are commonly used for pain associated with neuropathy or fibromyalgia in individuals with FXTAS, however there is anecdotal evidence that those on opioids can have faster progression of their FXTAS symptoms [10]. Premutation neurons die more easily in cell culture compared to normal neurons without the premutation so these neurons are considered to be more vulnerable to environmental toxins [1, 17]. This case points out another danger, specifically the high risk of an overdose from opioids such as fentanyl, which in this carrier led to hypoxic damage. Autonomic dysfunction is often seen in FXTAS and fainting or loss of consciousness from cardiac arrhythmias can also be seen in FXTAS [9] but are two separate disorders that affect different patient groups and have different molecular aetiologies. Thus, in this patient, it is possible that the overdose of the fentanyl may have exacerbated the autonomic instability, which with the combined effect of the carotid blockage, led to significant hypoxia which worsened her FXTAS symptoms.

Table 2. Neuropsychological/neuropsychiatric assessments

Assessment

Index Score

Percentile

Results

WAIS-IV

Verbal comprehension

93

32

Average

Perceptual reasoning

88

21

Low average

Working memory

86

18

Low average

Processing speed

76

5

Borderline

Full scale IQ

83

13

Low average

WMS-IV

Auditory memory

107

68

Average

Visual memory

86

18

Low average

Visual working memory

80

9

Low average

Immediate memory

94

34

Average

Delayed memory

98

45

Average

MMSE

29

Preserved orientation and short term memory skill

BDS-2

16

Moderate difficulties in executive functioning skills

SCID-I/NP

Current Major Depressive Disorder

SCL-90-R (T-scores)

Somatization

81

Clinically Significant

Obsessive-compulsive symptoms

80

Clinically Significant

Interpersonal sensitivity

64

Clinically Significant

Depression

69

Clinically Significant

Anxiety

66

Clinically Significant

Hostility

69

Clinically Significant

Phobic anxiety

70

Clinically Significant

Psychoticism

69

Clinically Significant

Global symptom index

72

Clinically Significant

JMG2018-101-Rand Hagerman_F1

Figure 1. Brain MRI of a 54-year-old female fragile X premutation carrier, after fentanyl overdose and before vascular surgery. MRI demonstrated mild atrophy (A), increased T2 signal intensity in the pons (C), and severe diffuse increased T2 signal intensity in the deep white matter of the cerebrum (A, B). White matter damage was greater on the right side of the brain compared to the left side (B). Patient did not have increased T2 signal intensity in the middle cerebellar peduncles (D).

Even though the patient’s neurocognitive functioning is mainly preserved (low average to average scores on most assessments), her scores on the BDS-2 point to impaired executive functioning, which includes poor decision-making, planning, and motor control. Her borderline low processing speed index score is another indicator of subtle impairments that have not fully expanded to affect her general cognitive functioning (Table 2). In addition, her psychiatric history and current mental health problems indicate a particular vulnerability and could lead to further impairments in the future.

Fentanyl is a potent opioid analgesic used in the treatment of pain which is common in FXTAS and in fibromyalgia. Transdermal fentanyl patches are now widely utilized as an acceptable and efficacious method of medication delivery [18]. In addition to possible exacerbation of FXTAS symptoms, long-term exposure to opioids can make individuals more sensitive to pain through neoplastic changes in the peripheral and central nervous systems, a phenomenon known as opioid-induced hyperalgesia [19]. Identification of individuals currently using opioids in a problematic way is important given the substantial recent increases in prescription rates and consequent increases in morbidity and mortality. The present review provides updated and expanded information regarding excessive opioid use in chronic pain. Because of these findings, we recommend avoiding opioids whenever possible in the treatment of pain in individuals with the premutation or FXTAS.

Conclusion

We recommend evaluating premutation carriers with chronic pain carefully, and avoiding long-term opioid use to prevent possible exacerbation of symptoms of FXTAS. Alternative treatments for pain include gabapentin, cannabidiol and anti-inflammatory medication.

Finally, appropriate management of depression, anxiety, chronic pain and preventing long-term use of opioids may slow the progression of white matter disease in those with FXTAS.

Acknowledgements: This research was supported by the United States National Institute of Child Health and Human Development (grant R01 HD036071), the MIND Institute Intellectual and Developmental Disabilities Research Center (grant U54 HD079125) and the National Center for Advancing Translational Sciences and National Institutes of Health (grant UL1 TR001860).

Conflicts of interest: RH has received funding from Roche, Novartis, Neuren, Marinus, and Alcobra for carrying out treatment studies in patients with fragile X syndrome. She has also consulted with Roche, Novartis, Alcobra, Fulcrum and Zynerba regarding treatment studies in individuals with fragile X syndrome. FT received funds from Asuragen, Inc. The other authors declare no conflicts of interest.

References

  1. Saldarriaga W, Lein P, Gonzalez Teshima LY (2016) Phenobarbital use and neurological problems in FMR1 premutation carriers. Neurotoxicology 53: 141–147. [Crossref]
  2. Hagerman R, Hagerman P (2013) Advances in clinical and molecular understanding of the FMR1 premutation and fragile X-associated tremor/ataxia syndrome. Lancet Neurol 12(8): 786–798. [Crossref]
  3. Hoyos LR, Thakur M (2017) Fragile X premutation in women: recognizing the health challenges beyond primary ovarian insufficiency. J Assist Reprod Genet. 34(3): 315–323. [Crossref]
  4. Hall D, Tassone F (2016) FXTAS, FXPOI and FMR1 Associated Disorders. Springer.
  5. Hantash FM, Goos DM, Crossley B (2011) FMR1 premutation carrier frequency in patients undergoing routine population-based carrier screening: Insights into the prevalence of fragile X syndrome, fragile X-associated tremor/ataxia syndrome, and fragile X-associated primary ovarian insufficiency i. Genet Med 13(1): 39–45. [Crossref]
  6. Tassone F, Iong KP, Tong T-H (2012) FMR1 CGG allele size and prevalence ascertained through newborn screening in the United States. Genome Med 4(12): 100.
  7. Jacquemont S, Hagerman RJ, Leehey MA (2004) Penetrance of the fragile X-associated tremor/ataxia syndrome in a premutation carrier population. JAMA 291(4): 460–469. [Crossref]
  8. Hall DD, O’keefe JJ (2012) Fragile x-associated tremor ataxia syndrome: the expanding clinical picture, pathophysiology, epidemiology, and update on treatment. Tremor Other Hyperkinet Mov (N Y)2: 1–11.
  9. Hagerman RJ, Hagerman P (2016) Fragile X-associated tremor/ataxia syndrome – features, mechanisms and management. Nat Rev Neurol 12: 403–412. [Crossref]
  10. Muzar Z, Adams PE, Schneider A, Hagerman RJ, Lozano R. Addictive substances may induce a rapid neurological deterioration in fragile X-associated tremor ataxia syndrome: A report of two cases. Intractable rare Dis Res 3(4): 162–165. [Crossref]
  11. Wechsler D (2008) Wechsler Adult Intelligence Scale (WAIS).
  12. Wechsler D (2009) Wechsler Memory Scale-Fourth Edition (WMS-IV). San Antonio, TX, Pearson Assessment.
  13. Folstein MF, Folstein SE, McHugh PR (1975) “Mini-mental state”. A practical method for grading the cognitive state of patients for the clinician. J Psychiatr Res 12: 189–198. [Crossref]
  14. First MB, Spitzer RL, Gibbon M, Williams JBW (1997) Structured Clinical Interview for DSM-IV Axis I Disorders, Clinician Version (SCID-CV).
  15. Derogatis LR, Lazarus L (1994) SCL-90—R, Brief Symptom Inventory, and matching clinical rating scales. In: The Use of Psychological Testing for Treatment Planning and Outcome Assessment. 217–248.
  16. Grigsby J, Kaye K, Kowalsky J, Kramer AM (2002) Association of behavioral self-regulation with concurrent functional capacity among stroke rehabilitation patients. J Clin Geropsychology 8(1): 25–33.
  17. Polussa J, Schneider A, Hagerman R (2014) Molecular Advances Leading to Treatment Implications for Fragile X Premutation Carriers. Brain Disord Ther 03(02): 997–1003. [Crossref]
  18. Schauer CKMW, Shand JAD, Reynolds TM (2015) The Fentanyl Patch Boil-Up – A Novel Method of Opioid Abuse. Basic Clin Pharmacol Toxicol 117(5): 358–359. [Crossref]
  19. Vowles KE, McEntee ML, Julnes PS, Frohe T, Ney JP, et al. (2015) Rates of opioid misuse, abuse, and addiction in chronic pain: a systematic review and data synthesis. Pain 156(4): 569–576. [Crossref]

Association between Dietary Iodine Consumption and Body Composition in Caucasian Females between the Ages of 18 to 60: The Pioneer Project

DOI: 10.31038/EDMJ.2018231

Abstract

This study was part of the larger Pioneer Project, conducted at the Institute for Women’s Health, Texas Woman’s University, from 2000 – 2004. The pioneer Project was a longitudinal study of women (n=351) encompassing the lifecycle between ages 18 – 60. The purpose of this study was to determine if there was an association between dietary iodine consumption and body composition in Caucasian females between the ages of 18 to 60. Spearman rank order correlation assessed the association between dietary iodine intake and body weight, percent lean body mass, percent body fat, waist-to-hip ratio, total body bone mineral density (TBBMD), and circulating concentrations of T3, T4, and thyrotropin-stimulating hormone (TSH). No significant association was found between iodine intake and body weight, percent lean body mass, percent body fat, waist-to-hip ratio, TBBMD, TSH, T3, or T4. Analysis of variance (ANOVA) evaluated any significant differences between tertiles of iodine intake. ANOVA revealed no significant differences between iodine intake tertiles on percent lean body mass, percent body fat and waist-to-hip ratio.

Keywords

Iodine, body composition, percent body fat, percent lean mass, thyroid hormones

Introduction

Iodine is an essential micronutrient that is primarily concentrated in the thyroid gland (70–80% of iodine) [1]. The biosynthesis of thyroid hormones depends on adequat  e dietary iodine consumption, with the thyroid gland being the primary site for iodine absorption and storage [2]. An adult human body can contain 15–20 mg of iodine, with about 80% in the thyroid gland [3]. Around 120 µg/d of iodide is typically collected by the thyroid gland to assist with the synthesis of thyroid hormones, tri-iodothyronine, T3 and thyroxine, T4 [1]; T4’s weight is composed of 65% iodine while T3’s weight is composed of 59% iodine [4]. The thyroid gland usually produces about 90% T4 and 10% T3, with T4 having the ability to convert to T3 in tissues of the human body [5]. T3 has the predominant metabolic effects in the body [6]. Most of the iodine in the thyroid gland is stored in the form of the glycoprotein, thyroglobulin. Thyroid hormones assist in the early growth process and development of a majority of organs, specifically the brain, and for metabolism of most human cells [7]. Thyroid iodine accretion and turnover decide the iodine requirement for each individual [8]. Selenium is essential for iodine metabolism because it is part of one of the enzymes, iodothyronine-5’-deiodinase, that contributes to the formation of active T3 from thyroglobulin and T4 [6]. The sodium-iodide symporter system is the primary contributor to the maintenance of healthy thyroid hormone secretion [9]. Iodine excretion is mainly through the urine, but small percentages can be found in feces because of biliary secretion [10].

The essential trace element iodine has a recommended dietary allowance (RDA) of 150 μg/day and tolerable upper intake (UI) of 1100 μg/day [3, 8, 11]. Dietary sources of iodine include iodized salt, seaweed, seafood such as oysters, lobsters, clams, sardines, and other saltwater fish, molasses, potatoes, navy beans, eggs, bread, and dairy products [10, 12, 13]. Iodophors are coloring agents, dough conditioners, and disinfectants used in dairy processing [11]. Iodine content in milk is mainly affected by iodophor sanitizing solutions used by the dairy industry and iodine added to animal feed [14]. Majority of dietary iodine is in iodide form, but iodate form is used in iodized salt, and in bread conditioners; in the body, iodate is readily reduced to iodide when consumed or injected intravenously [3]. The amount of iodine found in a majority of food sources is low, and the irrigation, fertilizers, and soil content can affect the iodine level in each food item [8]. Seafood usually has an increased amount of iodine because marine animals can concentrate iodine from seawater [8]. Iodine can be added into dairy products and chicken through supplementation in feed, as well as any sanitizing agents that may contain iodine [15]. The amount of iodine in both eggs and milk can vary depending on the iodine level in the diet of the hens and cows [3]. Cattle and chicken diets are often supplemented with kelp to provide a considerable amount of iodine through eggs (yolks are iodine-rich), meat, and milk products [16]. Compared to the United States, Japan has some of the highest intakes of iodine because of their consumption of iodine-rich seaweed. Seaweed consumption can add as much as 200 mg of daily iodine to an individual’s diet, and it might have up to 4.5 g I/kg [3, 17]. For those Japanese individuals who favor seaweed, 15–30 g of seaweed Kombu, contains about 35–70 mg of iodine, and would usually be consumed during one meal [17]. The Japanese population may consume up to 25 – 40 times the median amount of iodine in the United States without adverse effects [18]. In the United States, by weight, iodized salt is composed of one part salt to 10, 000 parts sodium chloride; which means that 1 g of iodized salt contains about 75 μg of iodine [16, 19]. Iodine deficiency was almost eliminated with the iodization of salt in the United States and several Western countries [20]. Radiocontrast media, water purification tablets, certain medications such as Amiodarone (or Cordarone), food coloring, dental and skin disinfectants have large amounts of iodine that can impact thyroid function [3, 8]. Goitrogens are substances that are naturally present in foods that can block iodine uptake by the thyroid cells from the blood by reducing iodine organification by the thyroid gland [21]. Foods containing goitrogens include millet, cassava, and cruciferous vegetables like cabbage and broccoli, soybeans, sweet potatoes, peanuts, kelp, turnips, and rapeseed [11]. These do not typically have clinical significance unless an individual has a coexisting iodine deficiency [8]. Iodine deficiency can be worsened if an individual already has a deficiency of selenium, iron, or vitamin A [8]. Iodine is primarily excreted through the kidneys, and therefore urinary iodine assessment can serve as a consistent tool for dietary iodine intake [16]. Recommended median urinary iodine excretion that indicates iodine sufficiency in populations is 150 µg/L [22]. When comparing different geographical areas, urinary iodine excretion and thyroid size are the two commonly utilized measures of an individual’s iodine status. Serum thyroglobulin is a useful marker of iodine status in an iodine-deficient population [23].

Iodine deficiency can affect individuals of all ages, and the clinical effects range from mild hypothyroidism to severe endemic cretinism and goiter [24]. Two primary factors controlling the growth of the thyroid gland are TSH and iodine intake [25]. Iodine deficiency interferes with the synthesis of T3 and T4 hormones. TSH is released in response to reduced serum concentrations of T4. TSH stimulates the thyroid gland to generate more thyroid hormones and to also grow in size in an attempt to concentrate as much iodine as possible [1, 26]. Even though the thyroid gland can release these hormones for a short time through the stored components in thyroglobulin molecules, when these stores are depleted, serum concentrations of T4 start to decrease [15]. The pituitary gland intervenes by increasing TSH release which causes the thyroid gland to enhance its uptake of iodide to increase thyroid hormone production [1]. In chronic iodine deficiency states, hyperplasia of follicular cells occurs when TSH is unable to promote T4 release resulting in hypertrophy and hyperplasia of the follicular cells leading to the development of goiter [1]. Iodine deficiency can be improved through the addition of iodine to dietary sources such as salt, water, sauces, oil, and consumption of iodine-rich foods [1]. The use of iodized salt and iodized oil have proven to be useful in numerous individuals for treatment of iodine deficiency [27]. When the physiological requirements of iodine are not met, a variety of functional or developmental abnormalities including defects in thyroid function, endemic goiter and cretinism, reduced fertility rate, endemic mental retardation, and a rise in perinatal death and infant mortality [7, 27].

A significant association was demonstrated between iodine intake and thyroid volume, with salt iodization significantly reducing thyroid volume in individuals with mild to moderate iodine deficiency [23, 28]. Overweight and obesity can also impact thyroid functioning. Significant correlations between weight, height, and thyroid volume have been observed. Boyanov et al., 2004 demonstrated a positive correlation between weight, height, body surface area (BSA), and fat-free mass and thyroid volume [29]. In another study that compared obese to non-obese participants, thyroid volume in obese participants was not associated with body weight but positively correlated with LBM [25]. In non-obese participants, the correlation between thyroid volume and LBM was stronger than the correlation between thyroid volume and body weight [25]. Sari et al., 2003 demonstrated an increased TSH concentration and thyroid volume in obese vs non-obese women, positive correlation between thyroid volume and body weight, and a significant reduction in TSH and thyroid volume in participants who had > 10% weight loss in six months with the obesity treatment, with no effect on participants with < 10% weight loss [30].

Basal metabolic rate (BMR) contributes about 60–75% to an individual’s daily energy expenditure and therefore regulates body weight [31]. Numerous studies have supported a decrease in BMR related to changes in body composition, especially a reduction of fat-free mass, with physiological, hormonal and lifestyle factors significantly impacting BMR [31, 32]. One of the primary roles of thyroid hormones in adult humans is the regulation of thermogenesis. A variety of studies have observed effects of thyroid hormones on cellular processes necessary for energy expenditure [32]. Patients with hyperthyroidism, with an excess secretion of thyroid hormones, T3 and T4, tend to have an elevated BMR that can lead to weight loss. Patients with hypothyroidism, tend to have a decreased BMR and decreased T3 and T4 concentrations that can lead to weight gain. Data from the National Health and Nutrition Examination Survey (NHANES), 2009–2010, showed that more than one-third of adults in the United States (35.7%) are obese, with no difference in prevalence between sexes [33, 34]. Two-thirds of the United States population is either overweight or obese. In a study by Carlton, 2010, one-third of the U.S. population was on some type of diet such as the Atkins for Life Diet, the South Beach Diet, the DASH (Dietary Approaches to Stop Hypertension) Diet, or the Best Life Diet that is deficient in micronutrients, with such diets being correlated with an increased risk of overweight, obesity and other chronic diseases [35]. Twenty-seven micronutrients including iodine were analyzed, and all four diet plans provided inadequate dietary levels of all twenty-seven micronutrients [35]. With the increasing incidence of obesity and potential lack of iodine in the American diet, use of iodine supplements may help to prevent or decrease obesity through the alteration of body composition and BMR.

Purpose of this study

The purpose of this retrospective study was to determine if dietary iodine consumption is associated with changes in body composition, including body weight, total body bone mineral density (TBBMD), waist-to-hip ratio, percent body fat, and percent lean body mass in Caucasian females between the ages of 18 to 60. The data used for this study came from the Pioneer Project, a longitudinal, observational study performed from 2000–2004 in the Institute for Women’s Health at Texas Woman’s University. The study observed women’s health throughout the reproductive, peri-menopausal, and post-menopausal years of life. Dietary iodine is equally crucial for both growth and metabolism as it is essential for the synthesis of thyroid hormones involved in these processes. Increased incidence of overweight or obesity in individuals may be the result of a deficiency in iodine, resulting from decreased consumption of foods containing iodine. If concentrations of T3 and T4 are decreased in an individual’s body, lower metabolism which ultimately causes weight gain and excess adiposity may be the result. This study may explain some of the causes of the current obesity epidemic. This study assessed the relationships between dietary iodine intake and body weight, percent lean body mass and percent body fat, waist-to-hip ratio, TBBMD, circulating concentrations of T3, T4, and thyrotropin-stimulating hormone (TSH), when controlling for all other variables (such as age, percent body fat, percent lean body mass, and total bone mineral density by DXA). This study tested the following assumptions: all participants were healthy individuals; the Harvard Food Frequency Questionnaire (HFFQ) is a reliable and a valid measure of the participants’ dietary iodine consumptions; the limitations imposed in this study will not destroy the external validity of the results; all participants provided accurate information for this study; and all testing that was performed for this study was reliable and accurate. The null hypotheses are stated below:

  1. There is no significant relationship between dietary iodine intake and body weight.
  2. There is no significant relationship between dietary iodine consumption and percent lean body mass and percent body fat.
  3. There is no significant relationship between dietary iodine intake and waist-to-hip ratio.
  4. There is no significant relationship between dietary iodine intake and TBBMD.
  5. There is no significant relationship between dietary iodine consumption and the circulating concentrations of T3, T4, and thyrotropin-stimulating hormone (TSH).
  6. There is no significant relationship between dietary iodine consumption and the circulating concentrations of T3, T4, and TSH when controlling for all other variables (such as age, percent body fat, percent lean body mass, and total bone mineral density by DXA).
  7. There is no significant relationship between age and circulating concentrations of T3, T4, and TSH when controlling for all other variables (such as age, percent body fat, percent lean body mass, and total bone mineral density by DXA).

Methods

This retrospective study used data collected during the Pioneer Project, a longitudinal, observational study of women’s health throughout the reproductive, peri-menopausal, and post-menopausal years. The Pioneer Project was performed by the Texas Woman’s University’s (TWU) Institute for Women’s Health (IWH) from 2000–2004, with funds provided by the State of Texas. The Pioneer Project recorded comprehensive medical, psychological, physiological, socio-economical, and nutritional information from 351 women between 18 to 60 years of age. The anthropometric and nutritional information that was obtained through the Pioneer Project was used for this retrospective study. This study was approved by the Institutional Review Board at Texas Woman’s University.

Study design

This retrospective study used data collected during the Pioneer Project to determine if there was an association between dietary iodine intake and body composition. Data used in the study included body weight, height, dietary iodine consumption, total body bone mineral density (TBBMD), percent body fat, percent lean body mass, and serum concentrations of T3, T4, and TSH. Dietary iodine consumption levels were estimated using the Harvard Food Frequency Questionnaire (HFFQ). Blood samples were analyzed for serum concentrations of T3, T4, and TSH; blood samples were collected at the beginning of the Pioneer Project and as a follow-up, 1-year later. The blood samples were analyzed by Covance, a clinical research laboratory. TBBMD was measured with the Dual-energy X-ray Absorptiometer (DXA, Lunar Prodigy, Madison, WI) at Texas Woman’s University, Institute for Woman’s Health, Exercise, and Sports Nutrition Clinic. The DXA also evaluated the ratio of fat-to-lean-tissue, muscle mass, bone mass and density.

Participants

The participants included in this study were 351 Caucasian females, 18 to 60 years of age, living primarily in Denton, but also from Dallas and Houston, Texas. Recruitment was completed by distributing flyers around the TWU Campus, through radio announcements, and in local newspapers throughout the surrounding areas of Denton, Dallas, and Houston, Texas. All participants were first screened via a phone interview to determine eligibility criteria and were sent a medical history questionnaire that was completed before their first visit to the IWH. Inclusion Criteria included: participants were in generally good health and able to give written informed consent, females aged between 18 and 60 years, willingness to undergo the necessary testing at yearly intervals, no anticipated change in geographic location for at least 2-years. Exclusion Criteria included- resting systolic blood pressure ≥ 200 mm Hg, diastolic value > 115 mm Hg, weight > 275 lbs, pregnancy or attempting to become pregnant, within 6-months post-partum, or unable to stand freely, any indication of cardiovascular disease, all of which include frequent or complex ventricular ectopy, acute congestive heart failure, suspected myocarditis or pericarditis, aortic stenosis, valvular heart disease, uncontrolled atrial arrhythmia, uncontrolled ventricular arrhythmia, any history of a myocardial infarction, unstable angina, third degree atrioventricular block, and recent significant changes in a resting electrocardiogram (ECG) suggesting infarction or other acute, cardiac event, cardiovascular accident (CVA), renal disease including (but not limited to) polycystic kidney disease, glomerulonephritis, chronic pyelonephritis, recurrent kidney stones; transient ischemic attacks (TIA), positive HIV/AIDS status, seizure disorder, cancer, except for basal cell skin cancer that was completely treated, any history of pulmonary embolus, ventricular aneurysm, acute infection, thrombophlebitis (active), pacemaker, electrolyte abnormalities, hypertension, implantable defibrillator, diagnosed with diabetes, hypercholesterolemia, diagnosed with thyroid disorder, taking oral contraceptives or hormone replacement therapy, participating in clinical drug study, or involving investigator’s judgment, autoimmune disorders such as scleroderma, rheumatoid arthritis, or systemic lupus erythematous; and respiratory disorders like emphysema, asthma (currently), or chronic bronchitis, surgeries such as valve replacement, cardiac bypass, gastric stapling, or intestinal bypass; medication like antipsychotics, thyroid replacement, anticoagulants, corticosteroids, or cardiac medication, hepatic disease such as that which includes Hepatitis B or C, cirrhosis, a transplant of any kind, current or past history of alcohol or drug abuse, illegal drug use, or eating disorder, any pre-existing condition that would prohibit their ability to complete the study procedures (this included foot problems, hip replacement, or orthopedic injury/surgery). Participants who met the inclusion criteria and had all data collected were included in this study. Questionnaires- Participants were required to complete an informed consent form, approved by the Institutional Review Board of Texas Woman’s University to participate in the Pioneer Project and a Physiological Assessment Addendum Consent before their initial visit. Consent forms were signed in the presence of a Pioneer Project staff member. After an initial visit to review the participant’s medical history, and eligibility for study participation, the individual’s height, body weight, pulse, blood pressure, and hip and waist circumference measurements, fasting blood and urine samples were collected. Participants were provided with the Harvard Food Frequency Questionnaire to assess dietary iodine levels and a physical activity questionnaire with instructions on how to complete both the questionnaires. Questionnaires were completed yearly by all participants and physiological measurements obtained every four years from participants meeting specified criteria.

Dietary Iodine assessment- Harvard food frequency questionnaire

The Harvard Food Frequency Questionnaire (HFFQ) developed by Harvard University’s School of Public Health [36], was administered to participants at their initial visit to be filled out and returned at their next visit. The HFFQ is a 115-item questionnaire used for dietary data related to the participants’ dietary intake for the past year. This questionnaire had the participants recall and document the number of times per day, week, or month they consumed certain foods. These food items are categorized by specific food groups including eggs and meat, bread and cereals, dairy, vegetables, and fruits. The HFFQ also had questions concerning how their food was prepared, types of food used, condiment use, vitamin and mineral supplement use and the number of beverages and sweets or baked goods throughout the past year. Once the questionnaires were completed, they were sent to the Harvard University’s School of Public Health for the analyses of total energy consumption and nutrient content. The results were sent back to Texas Woman’s University in an Excel format. Estimated daily iodine intake was obtained from the HFFQ for the present study.

Anthropometric measurements

Height- Height was measured with the use of a wall-mounted stadiometer (Perspectives Enterprises, Portage, MI) that displayed both inches and centimeters. The participants removed their shoes and any heavy outer garments or accessories for the measurements. Participants stood underneath the sliding platform facing away from the stadiometer with their weight evenly distributed between both feet, heels pressed against the wall of the stadiometer with their arms hanging at the side, palms facing their thighs, looking forward with their chin parallel to the floor. Two measurements were obtained within 0.1 cm of each other, and measurements were averaged and recorded. If the two measurements were not within 0.1 cm, a third measurement was obtained, and the median value was recorded. Weight- Two different standard methods were utilized to measure weight. One of the methods had the participant stand on a balance scale (Continental Scale Corporation, Bridgeview, IL), facing the wall, with both feet flat, and arms by their side. The second method had the participant standing still on a digital scale (Tanita Corporation, Japan) with arms by their side. Two weight measurements were obtained for each participant, and the two measurements had to be within 0.1 kg of each other. Then the two measurement values were averaged and recorded. If the weight was not within 0.1 kg, a third measurement was obtained with the median value being recorded. Waist-to-hip ratio- The waist-to-hip ratio is a method that helps to estimate body composition, helps to describe an individual’s body proportions, and reflects the degree of abdominal obesity. A measuring tape (Graham Field, Atlanta, GA) was used to determine the circumference of participant’s hips (widest part of the buttocks) and the circumference of participant’s waist (just above the belly button). Once both of these measurements were obtained, waist-to-hip ratio was calculated by dividing the participant’s hip circumference by the participant’s waist circumference in centimeters. Dual-Energy X-ray absorptiometry-The absorptiometer that was utilized in this study was a Dual-energy X-ray Absorptiometer (DXA, Lunar Prodigy, Madison, WI). DXA utilizes two different photon energies (X-ray beams) to measure an individual’s soft tissue and bone, and therefore, can provide measurements of fat mass, lean body mass, bone mass, and bone density. The T-score displays the amount of bone an individual has compared to a young adult (age 20) of the same sex with peak bone mass. A T-score that is above -1 is considered normal, a score between -1 and -2.5 is classified as osteopenia or low bone mass, and a score below -2.5 is considered osteoporosis. T-score is also used to provide an estimate of an individual’s risk of developing a fracture. Alternatively, the Z-score reflects the amount of bone that an individual has compared with other people in the same age group, sex, and race. The DXA also evaluated the ratio of fat-to-lean-tissue, muscle mass, bone mass and density. Age- Age was determined according to the individual’s date of birth and represents the individual’s age at the time of data collection.

Statistical analyses

IBM Statistical Packages for the Social Sciences (SPSS) version 19.0 (SPSS Inc., Chicago, IL) was used to conduct all statistical analyses. Statistical significance was set at p<0.05. Spearman’s rank order correlation was performed to determine if there was an association between dietary iodine intake and body weight, percent lean body mass and percent body fat, waist-to-hip ratio, TBBMD, and the circulating concentrations of T3, T4, and TSH. Partial correlations were performed to determine if there were associations between dietary iodine consumption and circulating concentrations of T3, T4, and TSH while controlling for age and circulating concentrations of T3, T4, and TSH. One-way analysis of variance (ANOVA) was performed with tertiles of iodine intake at three levels, Group 1, ≤ 33rd percentile of the sample that had the lowest iodine intake; Group 2, > 33rd percentile and ≤ 66th percentile of the sample with an iodine intake in the middle; and Group 3, > 66th percentile of the sample with the highest iodine intake. The data were stratified by thirds to determine if any associations existed between iodine intake and the variables mentioned above.

Results

All participants in this study were Caucasian, even though this was not part of the inclusion criteria. There were 351 participants from the Pioneer Project who provided anthropometric data, including height and weight. There were 188 participants who had their body weight, percent lean body mass, percent body fat, and TBBMD measured, 225 participants who had grams of total mass, grams of total lean mass measured, and grams of total fat mass; 180 participants who had waist-to-hip ratio measured and 57 participants who had TSH, T3, and T4 measured. The sample sizes described above vary for each test because not every participant provided all the data which were analyzed in this study.

The participants’ body weights ranged from 46.5 to 115.8 kg. The participants’ iodine intakes ranged from 0 to 340.1 μg/ day. The percent of lean body mass ranged from 4.6 to 81%. The percent of body fat ranged from 5.4 to 59%. The participants’ waist-to-hip ratios ranged from 0.6776 to 0.9143. TBBMD for the participants ranged from 1.01 to 1.39 g/cm2. The circulating level of TSH ranged from 0.008 to 7.783 µIU/ml while T3 ranged from 0.446 pg/ml to 17.819 pg/ml, and T4 ranged from 0.462 ng/dl to 1.721 ng/dl. Mean Iodine Intake, Weight, Percent Body Fat, Percent Lean Body Mass, and TBBM, TSH, T3, and T4 Data for Pioneer Project Participants are reported in Table 1.

Table 1. Mean Iodine Intake, Weight, Percent Body Fat, Percent Lean Body Mass, and TBBM, TSH, T3, and T4 Data for Pioneer Project Participants.

Variable

Sample Size (n)

Mean

SD

Iodine Intake (μg)

188

55.8

82.9

Weight (kg)

188

66.5

13

LBM%

188

.62

.09

BF%

188

.38

.08

TBBMD (g/cm2)

188

1.18

.07

Waist-to-hip Ratio

180

.8

.05

TSH (µIU/ml)

57

1.21

1.17

T3 (pg/ml)

57

2.81

2.28

T4 (ng/dl)

57

1.16

.35

Percent Body Fat – BF%, Percent Lean Body Mass – LBM%, and Total Body Bone Mineral Density – TBBMD, Thyrotropin Stimulating Hormone – TSH, Triiodothyronine – T3, and Thyroxine – T4

Dietary iodine consumption was assessed from the HFFQ, which revealed that a large group of participants from the Pioneer Project had an intake of 0 μg of iodine per day, reducing the variability of iodine intake in the study population. The majority of participants consumed less than the RDA of 150 μg of iodine per day. 60% of participants (n=113) consumed 0 μg of iodine per day while 70% of participants (n=132) consumed below the 150 μg of iodine per day for the RDA (See Figure 1).

EDMJ2018-104-PallaviPanthUSA_F1

Figure 1. Dietary iodine distribution histogram for pioneer project participants.

ANOVA was used to assess any significant differences between means of three tertiles of iodine intake on percent lean body mass, percent body fat and waist-to-hip ratio (Tables 2 and 3). As a whole, no significant differences between the iodine intake groups on percent lean body mass (p = .696), percent body fat (p = .747), and waist-to-hip ratio (p = .973) were observed. Therefore, the null hypothesis was failed to be rejected. However, it is important to note that the participants who had the highest iodine intake (Group 3, > 66th percentile of the RDA) had the highest mean percent lean body mass and lowest mean percent of body fat. In Group 3, the highest mean percent lean body mass was 62.6% and the lowest mean percent body fat was 37.4%.

Table 2. Mean Percent Body Fat Among Tertiles for Iodine Intake.

Group

Sample Size (n)

Mean

SD

1

113

37.6%

8.9%

2

12

39.4%

8.9%

3

63

37.4%

7.3%

Group 1, ≤ 33rd percentile of the lowest iodine intake; Group 2, > 33rd percentile and ≤ 66th percentile of iodine intake in the middle; Group 3, > 66th percentile of the highest iodine intake

Table 3.Mean Percent Lean Body Mass Among Tertiles for Iodine Intake.

Group

Sample Size (n)

Mean

SD

1

113

61.6%

10%

2

12

60.6%

8.9%

3

63

62.6%

7.3%

Group 1, ≤ 33rd percentile of the lowest iodine intake; Group 2, > 33rd percentile and ≤ 66th percentile of iodine intake in the middle; Group 3, > 66th percentile of the highest iodine intake

Spearman’s rank order correlation assessed the association between dietary iodine intake and body weight, percent lean body mass, percent body fat, waist-to-hip ratio, TBBMD, and circulating concentrations of T3, T4, and TSH (Table 4). No significant association was found between iodine intake and body weight (rs = .085, p = .247), percent lean body mass (rs = .018, p = .808), percent body fat (rs = -.003, p = .962), waist-to-hip ratio (rs = .021, p = .775), TBBMD (rs = .087, p = .235), TSH (rs = -.156, p = .250), T3 (rs = -.038, p = .778), or T4 (rs = -.216, p = .109). After analyzing the data, the null hypotheses failed to be rejected (all p values were > .05) which indicated that there were no significant associations between dietary iodine intake and body weight, percent lean body mass, percent body fat, waist-to-hip ratio, TBBMD, and circulating concentrations of T3, T4, and TSH.

Table 4. Spearman’s Rank Order Correlation Results.

Iodine Intake (μg) vs. Variable Below

rs

P

Weight (kg)

.085

.247

LBM%

.018

.808

BF%

-.003

.962

Waist-to-Hip Ratio

.021

.775

TBBMD (g/cm2)

.087

.235

TSH (µIU/ml)

-.156

.250

T3 (pg/ml)

-.038

.778

T4 (ng/dl)

-.216

.109

Percent Body Fat – BF%, Percent Lean Body Mass – LBM%, Total Body Bone Mineral Density – TBBMD, Thyrotropin Stimulating Hormone – TSH, Triiodothyronine – T3, and Thyroxine – T4

Partial correlations were also performed to determine if there was an association while controlling for specific variables (Table 5). The partial correlations included the evaluation of 1) dietary iodine intake with the circulating concentrations of T3, T4, and TSH while controlling for all other variables that could affect the outcome, and 2) age with the circulating concentrations of T3, T4, and TSH while controlling for all other variables that could affect the outcome. When controlling for body weight, percent lean body mass, percent body fat, waist-to-hip ratio, TBBMD, and age, no correlation between iodine intake and T4 was observed. Concentrations of TSH and T3, and their correlation with iodine intake had a slight increase in their “r” value, but the values indicated no significant correlation. The control variables (body weight, percent lean body mass, percent body fat, waist-to-hip ratio, TBBMD, and age ) did not significantly affect the correlation of iodine intake on TSH (rs = -.069, p = .673), T3 (rs = -.056, p = .731), and T4 (rs = -.152, p = .348). Alternatively, when controlling for body weight, percent lean body mass, percent body fat, waist-to-hip ratio, TBBMD, and iodine intake, there was an increase in the correlation between age and TSH, T3, and T4 than when compared to iodine intake with the levels of circulating hormones. When analyzing the correlations of age with TSH (rs = -.040, p = .806), T3 (rs = .214, p = .185) and T4 (rs = .154, p = .342), there were no significant associations of age with the circulating hormone levels.

Table 5. Partial Correlation Results.

Variable

rs

P

Iodine Intake vs. TSH (µIU/ml)

-.069

.673

Iodine Intake vs. T3 (pg/ml)

-.056

.731

Iodine Intake vs. T4 (ng/dl)

-.152

.348

Age vs. TSH (µIU/ml)

-.040

.806

Age vs. T3 (pg/ml)

.214

.185

Age vs. T4 (ng/dl)

.154

.342

Thyrotropin Stimulating Hormone – TSH, Triiodothyronine – T3, and Thyroxine – T4

After analyzing the data obtained, the null hypotheses were failed to be rejected that there were significant associations between dietary iodine intake and body weight, percent lean body mass, percent body fat, waist-to-hip ratio, TBBMD, and circulating concentrations of T3, T4, and TSH. The null hypothesis was failed to be rejected that there was a significant association between dietary iodine intake and the circulating concentrations of T3, T4, and TSH when controlling for all other variables. ANOVA was completed to assess if there were any significant differences between the means of the iodine intake tertiles on percent lean body mass, percent body fat, and waist-to-hip ratio. After analyzing the effect of iodine intake separated into tertiles, the null hypotheses were failed to be rejected that there were no significant associations between dietary iodine intake and percent body fat, percent lean body mass, and waist-to-hip ratio.

Discussion

Iodine is essential for healthy thyroid function, and the thyroid hormones are responsible for regulating basal metabolic rate (BMR). Thyroid hormones are required for cellular respiration and energy production of ATP, which further enhances an individual’s oxygen consumption and metabolism. Both T3 and T4 are needed for normal growth as well as development, energy metabolism, and protein synthesis. The thyroid stimulates energy production through the cellular mitochondria thereby impacting an individual’s BMR [37]. Strengths of this study include the availability of data from the Pioneer Project which provided comprehensive medical, psychological, physiological, socio-economical, and nutritional information from 351 women between 18 to 60 years of age. The duration of the Pioneer Project with data being collected over a period of 4-years allowed for a varied range of participant ages and large sample size for data analysis. One of the main limitations of this study was that only Caucasian females were analyzed, although this was not an inclusion criterion. It is unsure if the male sex or other ethnicities would have different outcomes from what was shown in this study as neither population was assessed. Not all participants had data collected for every variable being measured in the study accounting for missing data, which may have impacted the results. The HFFQ was used to analyze the participant’s iodine intake as opposed to assessing the participant’s urinary iodine excretion which is a more accurate estimation of dietary iodine intake. The HFFQ revealed that a large group of participants from the Pioneer Project had an intake of 0 μg of iodine per day, which reduced the variability in the population. The majority of participants consumed less than the RDA of 150 μg of iodine per day. The Harvard Food Frequency Questionnaire (HFFQ) utilized in this study can be a practical method for performing a dietary assessment, but it is not without its limitations. The HFFQ requires that the participants recall the frequency of food items they consumed during the week, the month, or the year before. Participants also estimate what they consumed in their diet instead of providing exact measurements through a food record. Also, there are some non-specific questions included in the food frequency questionnaire. For example, one question asked about salt added at the table but did not specify what kind of salt was used. If an individual does not consume the same foods all the time, then they may forget about specific food items such as seasonal foods like fruits and vegetables. Validation studies have shown that correlations are limited by an error in both diet records and food frequency questionnaires [38]. Diet records may have a degree of error similar to food frequency questionnaires [38]. This is the case because when keeping diet records, the portion sizes of some foods may be estimated by dimensions or through household measurements instead of by weight. As a result, the nutrient content may be inaccurate by 20% on average [38]. The reproducibility of food frequency questionnaires has correlations ranging from 0.39–0.88 [38]. In the present study, the HFFQ was not an adequate indicator of iodine intake. 60% of participants consumed 0 μg of iodine per day while 70% of participants consumed below the 150 μg of iodine per day for the RDA. It is difficult to believe that such a large number of participants consumed no iodine in their diet since iodized salt has been distributed nationally since 1924. Based on data from this study, the HFFQ was not an adequate indicator of iodine intake as it is a self-reported history questionnaire, with more chance of reporting bias, and recall bias.

Daily urinary iodine excretion can be a reflection of iodine intake because only a small amount of iodine is excreted through the feces with the remainder excreted in the urine [39]. Therefore, analyzing an individual’s urine output may provide a better estimate of the amount of iodine that an individual consumes each day. The 24-hour urinary iodide is the most widely utilized measure of iodine status, but can be inconvenient for the subject and may be hard to collect accurately [39]. The single spot urinary samples are preferred in population studies [40]. Since there is considerable variability in daily iodine consumption, and because both the intake of iodine and fluid can affect the iodine concentration in urine, spot urine samples are unreliable for assessing iodine deficiency [40]. Urinary iodide concentration expressed as a function of urinary creatinine, this can help to correct the influence of fluid intake [40]. Future studies can focus on assessment methods to evaluate dietary iodine intake in conjunction with urinary iodine excretion to provide a better understanding of iodine status of individuals. Selenium is necessary for the biosynthesis and function of a minimal amount of selenocysteine-containing selenoproteins involved in thyroid hormone metabolism and the function of the thyroid gland [41]. By also analyzing selenium, the researcher can determine what effects this element has on human metabolism in regards to body mass index (BMI), BMR, weight, and body composition. Future studies should consider assessing selenium with iodine to determine what effect a selenium deficiency plays in the production of thyroid hormones. Studies could assess for differences between iodine intake and ethnicity, as dietary habits, and micronutrient intakes are significantly impacted by ethnic status.

Another limitation was that not all participants in this study had their T3 and T4 levels documented. This study did not demonstrate any significant relationships between dietary iodine intake and body weight, percent lean body mass, percent body fat, waist-to-hip ratio, TBBMD, and circulating concentrations of T3, T4, and TSH in Caucasian females between the ages of 18 and 60 years. However, it is important to note is that the participants who had the highest iodine intake (Group 3, > 66th percentile of the RDA) had the highest mean percent lean body mass and lowest mean percent body fat. In Group 3, the highest mean percent lean body mass was 62.6%, and the lowest mean percent body fat was 37.4% (See Tables 2, 3).

The lack of assessments for thyroid volume could also be considered another limitation of this study. Thyroid volume can be affected by daily iodine intake, geographical region and food intake habit [42]. In several other studies, researchers compared the effect of thyroid volume on body weight, body fat percentage, body fat weight, waist circumference, TSH, T4, and T3. Thyroid volume was typically measured using thyroid ultrasonography. These studies have suggested that an individual’s thyroid volume is significantly associated with body weight [30, 43–46]. Whereas, one study indicated that only lean body mass was related to thyroid volume [25]. Thyroid volume has a relationship to BMI, waist-to-hip ratio, and fat mass in areas with an adequate iodine intake as well as mild or moderate iodine-deficient areas [43–46]. There is a significant association between thyroid volume and body weight, body fat percentage, body fat weight, waist circumference, and BMI [30]. A study by Wesche and Wiersinga, 2001 looked at the effects of a 6-month intensive physical training program on thyroid volume [47]. Intensive physical training caused changes in thyroid volume related to body composition. The group of freshman rowers had reductions in thyroid volume, body weight, body mass index, fat weight, and lean body mass [47]. The control group included senior rowers who had participated in a training program for more than two years. The control group had no alterations in thyroid volume or body composition throughout the 6-month surveillance period [47].

Conclusions

In conclusion, there was not a significant association between dietary iodine intake and body weight, percent lean body mass, percent body fat, waist-to-hip ratio, TBBMD, or circulating concentrations of T3, T4, and TSH using the data from the Pioneer Project. The HFFQ did not provide accurate measurements of iodine intake for analysis in the Pioneer Project. Therefore, a more accurate indicator of iodine status needs to be utilized in future studies to analyze the effect of iodine consumption on an individual’s body weight, BMR, and body composition including percent lean body mass and percent body fat. Correlation of BMI and iodine intake was not significant but does warrant further investigation.

Acknowledgments: Thanks is extended to all those women who participated in the Pioneer Project and the State of Texas Higher Education Coordinating Board for funding the project.

References

  1. Ahad F, Ganie SA (2010) Iodine, iodine metabolism and iodine deficiency disorders revisited. Indian J Endocrinol Metab 14: 13–17. [Crossref]
  2. Mansourian AR (2011) A review on the metabolic disorders of iodine deficiency. Pak J Biol Sci 14(7): 412–424. [Crossref]
  3. Baker DH (2004) Iodine toxicity and its amelioration. Exp Biol Med 229: 473–478. [Crossref]
  4. Zimmermann MB, Jooste PL, Pandav CS (2008) Iodine-deficiency disorders. Lancet 372: 1251–1262. [Crossref]
  5. McCance KL, Huether SE (2006) Pathophysiology: The biologic basis for disease in adults and children (5th ed.) St. Louis, Missouri: Elsevier Mosby.
  6. Arthur JR, Nicol F, Beckett GJ (1992) The role of selenium in thyroid hormone metabolism and effects of selenium deficiency on thyroid hormone and iodine metabolism. Biol Trace Elem Res 34: 321–325. [Crossref]
  7. Delange, F, Lecomte P (2000) Iodine supplementation: benefits outweigh risks. Drug Saf 22(2): 89–95. [Crossref]
  8. Institute of Medicine of the National Academies (2006) Iodine. In JJ. Otten JP. Hellwig, LD. Meyers (Eds.), Dietary reference intakes: The essential guide to nutrient requirements (pp. 320–327).
  9. Bürgi H (2009) Iodine excess. Best Pract Res Clin Endocrinol Metab 24: 107–115. [Crossref]
  10. Mahan LK, Escott-Stump S (2008) Krause’s food nutrition therapy (12th ed.) Canada: Saunders Elsevier.
  11. Paknahad Z (2010) Iodine deficiency disorders. Proceeding from the 1st International Applied Geological Congress. Department of Geology at Islamic Azad University of Mashad Branch, Iran.
  12. Brown JE (2008) Nutrition through the life cycle (3rd ed.) Belmont, CA: Thomson Wadsworth.
  13. Dunford M (2006) Sports nutrition: A practice manual for professionals (4th ed.) United States of America: American Dietetic Association.
  14. Pennington JAT (1990) Iodine concentrations in US milk: Variation due to time, season, and region. Journal of Dairy Science 73: 3421–3427.
  15. Soldin OP (2007) The importance of dietary iodine. Wellness Options 34: 29–31.
  16. Lee KL, Bradley R, Dwyer, J Lee SL (1999) Too much versus too little: The implications of current iodine intake in the United States. Nutrition Reviews 57(6): 177–181. [Crossref]
  17. Miyai K, Tokushige T, Kondo M; Iodine Research Group (2008) Suppression of thyroid function during ingestion of seaweed “kombu” (Laminaria japonoca) in normal Japanese adults. Endocr J 55: 1103–1108. [Crossref]
  18. Patrick L (2008) Iodine: deficiency and therapeutic considerations. Altern Med Rev 13(2): 116–127.
  19. McCance KL, Huether SE (2006) Pathophysiology: The biologic basis for disease in adults and children (5th ed.) St. Louis, Missouri: Elsevier Mosby.
  20. Delange F, de Benoist, B, Pretell, E, Dunn JT (2001) Iodine deficiency in the world: Where do we stand at the turn of the century? Thyroid 11: 437–447. [Crossref]
  21. Konijn AM, Gershon, B, Guggenheim K (1973) Further purification and mode of action of a goitrogenic material from soybean flour. J Nutr 103: 378–383. [Crossref]
  22. American Thyroid Association (2018) Iodine deficiency. Retrieved from http://www.thyroid.org/iodine-deficiency/#. Accessed on March 1, 2018.
  23. Rasmussen LB, Ovesen, L, Bülow, I, Jørgensen T, Knudsen N, et al. (2002) Relations between various measures of iodine intake and thyroid volume, thyroid nodularity, and serum thyroglobulin. Am J Clin Nutr 76: 1069–1076. [Crossref]
  24. Arthur JR, Beckett GJ (1999) Thyroid function. Br Med Bull 55: 658–668. [Crossref]
  25. Wesche MF, Wiersinga WM, Smits NJ (1998) Lean body mass as a determinant of thyroid size. Clin Endocrinol (Oxf) 48: 701–706. [Crossref]
  26. Cleveland Clinic (2018) Goiter. Retrieved from https://my.clevelandclinic.org/health/diseases/12625-goiter. Accessed on March 1, 2018.
  27. Zimmermann MB (2008) Research on iodine deficiency and goiter in the 19th and early 20th centuries. J Nutr 138: 2060–2063. [Crossref]
  28. Vejbjerg P, Knudsen N, Perrild H, Carlé A, Laurgerg P, et al. (2007) Effect of a mandatory iodization program on thyroid gland volume based on individuals’ age, gender, and preceding severity of dietary iodine deficiency: A prospective, population-based study. J Clin Endocrinol Metab 92: 1397–1401. [Crossref]
  29. Boyanov MA, Temelkova NL, Popivanov PP (2004) Determinants of thyroid volume in schoolchildren: fat-free mass versus body fat mass–a cross-sectional study. Endocr Pract 10: 409–416.
  30. Sari R, Balci MK, Altunbas H, Karayalcin U (2003) The effect of body weight and weight loss on thyroid volume and function in obese women. Clin Endocrinol (Oxf) 59(2): 258–262. [Crossref]
  31. Meunier N, Beattie JH, Ciarapica D, O’Connor JM, et al. (2005) Basal metabolic rate and thyroid hormones of late-middle-aged and older human subjects: The ZENITH study., Eur J Clin Nutr 59(Suppl 2): S53-S57. [Crossref]
  32. Kim B (2008) Thyroid hormone as a determinant of energy expenditure and the basal metabolic rate. Thyroid 18: 141–144. [Crossref]
  33. Centers for Disease Control (2018) NHANES 2011–2012. Retrieved from < https://wwwn.cdc.gov/nchs/nhanes/ContinuousNhanes/Default.aspx?BeginYear=2011>. Accessed March 1, 2018.
  34. Centers for Disease Control (2012) Adult obesity facts. Accessed on 13 October 2012.
  35. Carlton JB (2010) Prevalence of micronutrient deficiency in popular diet plans. J Int Soc Sports Nutr 7(1): 24. [Crossref]
  36. Rimm E, Giovannuci E, Stampfer M, Colditz G, Litin L, et al. (1992) Reproducibility and validity of a self-administered semi-quantitative food frequency questionnaire, and diet records in U.S. men. J Am Diet Assoc 135: 1114–1136. [Crossref]
  37. Goglia F, Silvestri E, Lanni A (2002) Thyroid hormones and mitochondria. 22(1): 17–32. [Crossref]
  38. Longnecker MP, Lissner L, Holden JM, Flack VF, Taylor PR, et al. (1993) The reproducibility and validity of a self-administered semiquantitative food frequency questionnaire in subjects from South Dakota and Wyoming. Epidemiology 4(4): 356–365. [Crossref]
  39. Thomson CD, Smith TE, Butler KA, Packer MA (1996) An evaluation of urinary measures of iodine and selenium status. J Trace Elem Med Biol 10(4): 214–222. [Crossref]
  40. Vejbjerg P, Knudsen N, Perrild H, Laurberg P, Andersen S, et al. (2009) Estimation of iodine intake from various urinary iodine measurements in population studies. Thyroid 19(11): 1281–1286. [Crossref]
  41. Schomburg, L, Köhrle J (2008) On the importance of selenium and iodine metabolism for thyroid hormone biosynthesis and human health. Mol Nutr Food Res 52(11), 1235–1246. [Crossref]
  42. Nafisi Moghadam R, Shajari A, Afkhami-Ardekani M (2011) Influence of physiological factors on thyroid size determined by ultrasound. Acta Med Iran 49: 302–304. [Crossref]
  43. Gomez JM, Maravall FJ, Gomez, N, Guma, A, Soler J (2000) Determinants of thyroid volume as measured by ultrasonography in healthy adults randomly selected. Clin Endocrinol 53: 629–634. [Crossref]
  44. Hegedües L, Perrild H, Poulsen LR, Andersen JR, Holm B, et al. (1983) The determination of thyroid volume by ultrasound and its relationship to body weight, age and sex in normal subjects. J Clin Endocrinol Metab 56: 260–263. [Crossref]
  45. Ivarsson SA, Persson PH, Ericsson UB (1989) Thyroid gland volume as measured by ultrasonography in healthy children and adolescents in noniodine-deficient area. Acta Paediatrica Scandinavica 78: 633–634. [Crossref]
  46. Semiz S, Senol U, Bircan O, Gümüslü S, Bilmen S, et al. (2001) Correlation between age, body size and thyroid volume in an endemic area. J Endocrinol Invest 24: 559–563. [Crossref]
  47. Wesche MF, Wiersinga WM (2001) Relation between lean body mass and thyroid volume in competition rowers before and during intensive physical training. Horm Metab Res 33: 423–427. [Crossref]