Abstract
This study was part of the larger Pioneer Project, conducted at the Institute for Women’s Health, Texas Woman’s University, from 2000 – 2004. The pioneer Project was a longitudinal study of women (n=351) encompassing the lifecycle between ages 18 – 60. The purpose of this study was to determine if there was an association between dietary iodine consumption and body composition in Caucasian females between the ages of 18 to 60. Spearman rank order correlation assessed the association between dietary iodine intake and body weight, percent lean body mass, percent body fat, waist-to-hip ratio, total body bone mineral density (TBBMD), and circulating concentrations of T3, T4, and thyrotropin-stimulating hormone (TSH). No significant association was found between iodine intake and body weight, percent lean body mass, percent body fat, waist-to-hip ratio, TBBMD, TSH, T3, or T4. Analysis of variance (ANOVA) evaluated any significant differences between tertiles of iodine intake. ANOVA revealed no significant differences between iodine intake tertiles on percent lean body mass, percent body fat and waist-to-hip ratio.
Keywords
Iodine, body composition, percent body fat, percent lean mass, thyroid hormones
Introduction
Iodine is an essential micronutrient that is primarily concentrated in the thyroid gland (70–80% of iodine) [1]. The biosynthesis of thyroid hormones depends on adequat e dietary iodine consumption, with the thyroid gland being the primary site for iodine absorption and storage [2]. An adult human body can contain 15–20 mg of iodine, with about 80% in the thyroid gland [3]. Around 120 µg/d of iodide is typically collected by the thyroid gland to assist with the synthesis of thyroid hormones, tri-iodothyronine, T3 and thyroxine, T4 [1]; T4’s weight is composed of 65% iodine while T3’s weight is composed of 59% iodine [4]. The thyroid gland usually produces about 90% T4 and 10% T3, with T4 having the ability to convert to T3 in tissues of the human body [5]. T3 has the predominant metabolic effects in the body [6]. Most of the iodine in the thyroid gland is stored in the form of the glycoprotein, thyroglobulin. Thyroid hormones assist in the early growth process and development of a majority of organs, specifically the brain, and for metabolism of most human cells [7]. Thyroid iodine accretion and turnover decide the iodine requirement for each individual [8]. Selenium is essential for iodine metabolism because it is part of one of the enzymes, iodothyronine-5’-deiodinase, that contributes to the formation of active T3 from thyroglobulin and T4 [6]. The sodium-iodide symporter system is the primary contributor to the maintenance of healthy thyroid hormone secretion [9]. Iodine excretion is mainly through the urine, but small percentages can be found in feces because of biliary secretion [10].
The essential trace element iodine has a recommended dietary allowance (RDA) of 150 μg/day and tolerable upper intake (UI) of 1100 μg/day [3, 8, 11]. Dietary sources of iodine include iodized salt, seaweed, seafood such as oysters, lobsters, clams, sardines, and other saltwater fish, molasses, potatoes, navy beans, eggs, bread, and dairy products [10, 12, 13]. Iodophors are coloring agents, dough conditioners, and disinfectants used in dairy processing [11]. Iodine content in milk is mainly affected by iodophor sanitizing solutions used by the dairy industry and iodine added to animal feed [14]. Majority of dietary iodine is in iodide form, but iodate form is used in iodized salt, and in bread conditioners; in the body, iodate is readily reduced to iodide when consumed or injected intravenously [3]. The amount of iodine found in a majority of food sources is low, and the irrigation, fertilizers, and soil content can affect the iodine level in each food item [8]. Seafood usually has an increased amount of iodine because marine animals can concentrate iodine from seawater [8]. Iodine can be added into dairy products and chicken through supplementation in feed, as well as any sanitizing agents that may contain iodine [15]. The amount of iodine in both eggs and milk can vary depending on the iodine level in the diet of the hens and cows [3]. Cattle and chicken diets are often supplemented with kelp to provide a considerable amount of iodine through eggs (yolks are iodine-rich), meat, and milk products [16]. Compared to the United States, Japan has some of the highest intakes of iodine because of their consumption of iodine-rich seaweed. Seaweed consumption can add as much as 200 mg of daily iodine to an individual’s diet, and it might have up to 4.5 g I/kg [3, 17]. For those Japanese individuals who favor seaweed, 15–30 g of seaweed Kombu, contains about 35–70 mg of iodine, and would usually be consumed during one meal [17]. The Japanese population may consume up to 25 – 40 times the median amount of iodine in the United States without adverse effects [18]. In the United States, by weight, iodized salt is composed of one part salt to 10, 000 parts sodium chloride; which means that 1 g of iodized salt contains about 75 μg of iodine [16, 19]. Iodine deficiency was almost eliminated with the iodization of salt in the United States and several Western countries [20]. Radiocontrast media, water purification tablets, certain medications such as Amiodarone (or Cordarone), food coloring, dental and skin disinfectants have large amounts of iodine that can impact thyroid function [3, 8]. Goitrogens are substances that are naturally present in foods that can block iodine uptake by the thyroid cells from the blood by reducing iodine organification by the thyroid gland [21]. Foods containing goitrogens include millet, cassava, and cruciferous vegetables like cabbage and broccoli, soybeans, sweet potatoes, peanuts, kelp, turnips, and rapeseed [11]. These do not typically have clinical significance unless an individual has a coexisting iodine deficiency [8]. Iodine deficiency can be worsened if an individual already has a deficiency of selenium, iron, or vitamin A [8]. Iodine is primarily excreted through the kidneys, and therefore urinary iodine assessment can serve as a consistent tool for dietary iodine intake [16]. Recommended median urinary iodine excretion that indicates iodine sufficiency in populations is 150 µg/L [22]. When comparing different geographical areas, urinary iodine excretion and thyroid size are the two commonly utilized measures of an individual’s iodine status. Serum thyroglobulin is a useful marker of iodine status in an iodine-deficient population [23].
Iodine deficiency can affect individuals of all ages, and the clinical effects range from mild hypothyroidism to severe endemic cretinism and goiter [24]. Two primary factors controlling the growth of the thyroid gland are TSH and iodine intake [25]. Iodine deficiency interferes with the synthesis of T3 and T4 hormones. TSH is released in response to reduced serum concentrations of T4. TSH stimulates the thyroid gland to generate more thyroid hormones and to also grow in size in an attempt to concentrate as much iodine as possible [1, 26]. Even though the thyroid gland can release these hormones for a short time through the stored components in thyroglobulin molecules, when these stores are depleted, serum concentrations of T4 start to decrease [15]. The pituitary gland intervenes by increasing TSH release which causes the thyroid gland to enhance its uptake of iodide to increase thyroid hormone production [1]. In chronic iodine deficiency states, hyperplasia of follicular cells occurs when TSH is unable to promote T4 release resulting in hypertrophy and hyperplasia of the follicular cells leading to the development of goiter [1]. Iodine deficiency can be improved through the addition of iodine to dietary sources such as salt, water, sauces, oil, and consumption of iodine-rich foods [1]. The use of iodized salt and iodized oil have proven to be useful in numerous individuals for treatment of iodine deficiency [27]. When the physiological requirements of iodine are not met, a variety of functional or developmental abnormalities including defects in thyroid function, endemic goiter and cretinism, reduced fertility rate, endemic mental retardation, and a rise in perinatal death and infant mortality [7, 27].
A significant association was demonstrated between iodine intake and thyroid volume, with salt iodization significantly reducing thyroid volume in individuals with mild to moderate iodine deficiency [23, 28]. Overweight and obesity can also impact thyroid functioning. Significant correlations between weight, height, and thyroid volume have been observed. Boyanov et al., 2004 demonstrated a positive correlation between weight, height, body surface area (BSA), and fat-free mass and thyroid volume [29]. In another study that compared obese to non-obese participants, thyroid volume in obese participants was not associated with body weight but positively correlated with LBM [25]. In non-obese participants, the correlation between thyroid volume and LBM was stronger than the correlation between thyroid volume and body weight [25]. Sari et al., 2003 demonstrated an increased TSH concentration and thyroid volume in obese vs non-obese women, positive correlation between thyroid volume and body weight, and a significant reduction in TSH and thyroid volume in participants who had > 10% weight loss in six months with the obesity treatment, with no effect on participants with < 10% weight loss [30].
Basal metabolic rate (BMR) contributes about 60–75% to an individual’s daily energy expenditure and therefore regulates body weight [31]. Numerous studies have supported a decrease in BMR related to changes in body composition, especially a reduction of fat-free mass, with physiological, hormonal and lifestyle factors significantly impacting BMR [31, 32]. One of the primary roles of thyroid hormones in adult humans is the regulation of thermogenesis. A variety of studies have observed effects of thyroid hormones on cellular processes necessary for energy expenditure [32]. Patients with hyperthyroidism, with an excess secretion of thyroid hormones, T3 and T4, tend to have an elevated BMR that can lead to weight loss. Patients with hypothyroidism, tend to have a decreased BMR and decreased T3 and T4 concentrations that can lead to weight gain. Data from the National Health and Nutrition Examination Survey (NHANES), 2009–2010, showed that more than one-third of adults in the United States (35.7%) are obese, with no difference in prevalence between sexes [33, 34]. Two-thirds of the United States population is either overweight or obese. In a study by Carlton, 2010, one-third of the U.S. population was on some type of diet such as the Atkins for Life Diet, the South Beach Diet, the DASH (Dietary Approaches to Stop Hypertension) Diet, or the Best Life Diet that is deficient in micronutrients, with such diets being correlated with an increased risk of overweight, obesity and other chronic diseases [35]. Twenty-seven micronutrients including iodine were analyzed, and all four diet plans provided inadequate dietary levels of all twenty-seven micronutrients [35]. With the increasing incidence of obesity and potential lack of iodine in the American diet, use of iodine supplements may help to prevent or decrease obesity through the alteration of body composition and BMR.
Purpose of this study
The purpose of this retrospective study was to determine if dietary iodine consumption is associated with changes in body composition, including body weight, total body bone mineral density (TBBMD), waist-to-hip ratio, percent body fat, and percent lean body mass in Caucasian females between the ages of 18 to 60. The data used for this study came from the Pioneer Project, a longitudinal, observational study performed from 2000–2004 in the Institute for Women’s Health at Texas Woman’s University. The study observed women’s health throughout the reproductive, peri-menopausal, and post-menopausal years of life. Dietary iodine is equally crucial for both growth and metabolism as it is essential for the synthesis of thyroid hormones involved in these processes. Increased incidence of overweight or obesity in individuals may be the result of a deficiency in iodine, resulting from decreased consumption of foods containing iodine. If concentrations of T3 and T4 are decreased in an individual’s body, lower metabolism which ultimately causes weight gain and excess adiposity may be the result. This study may explain some of the causes of the current obesity epidemic. This study assessed the relationships between dietary iodine intake and body weight, percent lean body mass and percent body fat, waist-to-hip ratio, TBBMD, circulating concentrations of T3, T4, and thyrotropin-stimulating hormone (TSH), when controlling for all other variables (such as age, percent body fat, percent lean body mass, and total bone mineral density by DXA). This study tested the following assumptions: all participants were healthy individuals; the Harvard Food Frequency Questionnaire (HFFQ) is a reliable and a valid measure of the participants’ dietary iodine consumptions; the limitations imposed in this study will not destroy the external validity of the results; all participants provided accurate information for this study; and all testing that was performed for this study was reliable and accurate. The null hypotheses are stated below:
- There is no significant relationship between dietary iodine intake and body weight.
- There is no significant relationship between dietary iodine consumption and percent lean body mass and percent body fat.
- There is no significant relationship between dietary iodine intake and waist-to-hip ratio.
- There is no significant relationship between dietary iodine intake and TBBMD.
- There is no significant relationship between dietary iodine consumption and the circulating concentrations of T3, T4, and thyrotropin-stimulating hormone (TSH).
- There is no significant relationship between dietary iodine consumption and the circulating concentrations of T3, T4, and TSH when controlling for all other variables (such as age, percent body fat, percent lean body mass, and total bone mineral density by DXA).
- There is no significant relationship between age and circulating concentrations of T3, T4, and TSH when controlling for all other variables (such as age, percent body fat, percent lean body mass, and total bone mineral density by DXA).
Methods
This retrospective study used data collected during the Pioneer Project, a longitudinal, observational study of women’s health throughout the reproductive, peri-menopausal, and post-menopausal years. The Pioneer Project was performed by the Texas Woman’s University’s (TWU) Institute for Women’s Health (IWH) from 2000–2004, with funds provided by the State of Texas. The Pioneer Project recorded comprehensive medical, psychological, physiological, socio-economical, and nutritional information from 351 women between 18 to 60 years of age. The anthropometric and nutritional information that was obtained through the Pioneer Project was used for this retrospective study. This study was approved by the Institutional Review Board at Texas Woman’s University.
Study design
This retrospective study used data collected during the Pioneer Project to determine if there was an association between dietary iodine intake and body composition. Data used in the study included body weight, height, dietary iodine consumption, total body bone mineral density (TBBMD), percent body fat, percent lean body mass, and serum concentrations of T3, T4, and TSH. Dietary iodine consumption levels were estimated using the Harvard Food Frequency Questionnaire (HFFQ). Blood samples were analyzed for serum concentrations of T3, T4, and TSH; blood samples were collected at the beginning of the Pioneer Project and as a follow-up, 1-year later. The blood samples were analyzed by Covance, a clinical research laboratory. TBBMD was measured with the Dual-energy X-ray Absorptiometer (DXA, Lunar Prodigy, Madison, WI) at Texas Woman’s University, Institute for Woman’s Health, Exercise, and Sports Nutrition Clinic. The DXA also evaluated the ratio of fat-to-lean-tissue, muscle mass, bone mass and density.
Participants
The participants included in this study were 351 Caucasian females, 18 to 60 years of age, living primarily in Denton, but also from Dallas and Houston, Texas. Recruitment was completed by distributing flyers around the TWU Campus, through radio announcements, and in local newspapers throughout the surrounding areas of Denton, Dallas, and Houston, Texas. All participants were first screened via a phone interview to determine eligibility criteria and were sent a medical history questionnaire that was completed before their first visit to the IWH. Inclusion Criteria included: participants were in generally good health and able to give written informed consent, females aged between 18 and 60 years, willingness to undergo the necessary testing at yearly intervals, no anticipated change in geographic location for at least 2-years. Exclusion Criteria included- resting systolic blood pressure ≥ 200 mm Hg, diastolic value > 115 mm Hg, weight > 275 lbs, pregnancy or attempting to become pregnant, within 6-months post-partum, or unable to stand freely, any indication of cardiovascular disease, all of which include frequent or complex ventricular ectopy, acute congestive heart failure, suspected myocarditis or pericarditis, aortic stenosis, valvular heart disease, uncontrolled atrial arrhythmia, uncontrolled ventricular arrhythmia, any history of a myocardial infarction, unstable angina, third degree atrioventricular block, and recent significant changes in a resting electrocardiogram (ECG) suggesting infarction or other acute, cardiac event, cardiovascular accident (CVA), renal disease including (but not limited to) polycystic kidney disease, glomerulonephritis, chronic pyelonephritis, recurrent kidney stones; transient ischemic attacks (TIA), positive HIV/AIDS status, seizure disorder, cancer, except for basal cell skin cancer that was completely treated, any history of pulmonary embolus, ventricular aneurysm, acute infection, thrombophlebitis (active), pacemaker, electrolyte abnormalities, hypertension, implantable defibrillator, diagnosed with diabetes, hypercholesterolemia, diagnosed with thyroid disorder, taking oral contraceptives or hormone replacement therapy, participating in clinical drug study, or involving investigator’s judgment, autoimmune disorders such as scleroderma, rheumatoid arthritis, or systemic lupus erythematous; and respiratory disorders like emphysema, asthma (currently), or chronic bronchitis, surgeries such as valve replacement, cardiac bypass, gastric stapling, or intestinal bypass; medication like antipsychotics, thyroid replacement, anticoagulants, corticosteroids, or cardiac medication, hepatic disease such as that which includes Hepatitis B or C, cirrhosis, a transplant of any kind, current or past history of alcohol or drug abuse, illegal drug use, or eating disorder, any pre-existing condition that would prohibit their ability to complete the study procedures (this included foot problems, hip replacement, or orthopedic injury/surgery). Participants who met the inclusion criteria and had all data collected were included in this study. Questionnaires- Participants were required to complete an informed consent form, approved by the Institutional Review Board of Texas Woman’s University to participate in the Pioneer Project and a Physiological Assessment Addendum Consent before their initial visit. Consent forms were signed in the presence of a Pioneer Project staff member. After an initial visit to review the participant’s medical history, and eligibility for study participation, the individual’s height, body weight, pulse, blood pressure, and hip and waist circumference measurements, fasting blood and urine samples were collected. Participants were provided with the Harvard Food Frequency Questionnaire to assess dietary iodine levels and a physical activity questionnaire with instructions on how to complete both the questionnaires. Questionnaires were completed yearly by all participants and physiological measurements obtained every four years from participants meeting specified criteria.
Dietary Iodine assessment- Harvard food frequency questionnaire
The Harvard Food Frequency Questionnaire (HFFQ) developed by Harvard University’s School of Public Health [36], was administered to participants at their initial visit to be filled out and returned at their next visit. The HFFQ is a 115-item questionnaire used for dietary data related to the participants’ dietary intake for the past year. This questionnaire had the participants recall and document the number of times per day, week, or month they consumed certain foods. These food items are categorized by specific food groups including eggs and meat, bread and cereals, dairy, vegetables, and fruits. The HFFQ also had questions concerning how their food was prepared, types of food used, condiment use, vitamin and mineral supplement use and the number of beverages and sweets or baked goods throughout the past year. Once the questionnaires were completed, they were sent to the Harvard University’s School of Public Health for the analyses of total energy consumption and nutrient content. The results were sent back to Texas Woman’s University in an Excel format. Estimated daily iodine intake was obtained from the HFFQ for the present study.
Anthropometric measurements
Height- Height was measured with the use of a wall-mounted stadiometer (Perspectives Enterprises, Portage, MI) that displayed both inches and centimeters. The participants removed their shoes and any heavy outer garments or accessories for the measurements. Participants stood underneath the sliding platform facing away from the stadiometer with their weight evenly distributed between both feet, heels pressed against the wall of the stadiometer with their arms hanging at the side, palms facing their thighs, looking forward with their chin parallel to the floor. Two measurements were obtained within 0.1 cm of each other, and measurements were averaged and recorded. If the two measurements were not within 0.1 cm, a third measurement was obtained, and the median value was recorded. Weight- Two different standard methods were utilized to measure weight. One of the methods had the participant stand on a balance scale (Continental Scale Corporation, Bridgeview, IL), facing the wall, with both feet flat, and arms by their side. The second method had the participant standing still on a digital scale (Tanita Corporation, Japan) with arms by their side. Two weight measurements were obtained for each participant, and the two measurements had to be within 0.1 kg of each other. Then the two measurement values were averaged and recorded. If the weight was not within 0.1 kg, a third measurement was obtained with the median value being recorded. Waist-to-hip ratio- The waist-to-hip ratio is a method that helps to estimate body composition, helps to describe an individual’s body proportions, and reflects the degree of abdominal obesity. A measuring tape (Graham Field, Atlanta, GA) was used to determine the circumference of participant’s hips (widest part of the buttocks) and the circumference of participant’s waist (just above the belly button). Once both of these measurements were obtained, waist-to-hip ratio was calculated by dividing the participant’s hip circumference by the participant’s waist circumference in centimeters. Dual-Energy X-ray absorptiometry-The absorptiometer that was utilized in this study was a Dual-energy X-ray Absorptiometer (DXA, Lunar Prodigy, Madison, WI). DXA utilizes two different photon energies (X-ray beams) to measure an individual’s soft tissue and bone, and therefore, can provide measurements of fat mass, lean body mass, bone mass, and bone density. The T-score displays the amount of bone an individual has compared to a young adult (age 20) of the same sex with peak bone mass. A T-score that is above -1 is considered normal, a score between -1 and -2.5 is classified as osteopenia or low bone mass, and a score below -2.5 is considered osteoporosis. T-score is also used to provide an estimate of an individual’s risk of developing a fracture. Alternatively, the Z-score reflects the amount of bone that an individual has compared with other people in the same age group, sex, and race. The DXA also evaluated the ratio of fat-to-lean-tissue, muscle mass, bone mass and density. Age- Age was determined according to the individual’s date of birth and represents the individual’s age at the time of data collection.
Statistical analyses
IBM Statistical Packages for the Social Sciences (SPSS) version 19.0 (SPSS Inc., Chicago, IL) was used to conduct all statistical analyses. Statistical significance was set at p<0.05. Spearman’s rank order correlation was performed to determine if there was an association between dietary iodine intake and body weight, percent lean body mass and percent body fat, waist-to-hip ratio, TBBMD, and the circulating concentrations of T3, T4, and TSH. Partial correlations were performed to determine if there were associations between dietary iodine consumption and circulating concentrations of T3, T4, and TSH while controlling for age and circulating concentrations of T3, T4, and TSH. One-way analysis of variance (ANOVA) was performed with tertiles of iodine intake at three levels, Group 1, ≤ 33rd percentile of the sample that had the lowest iodine intake; Group 2, > 33rd percentile and ≤ 66th percentile of the sample with an iodine intake in the middle; and Group 3, > 66th percentile of the sample with the highest iodine intake. The data were stratified by thirds to determine if any associations existed between iodine intake and the variables mentioned above.
Results
All participants in this study were Caucasian, even though this was not part of the inclusion criteria. There were 351 participants from the Pioneer Project who provided anthropometric data, including height and weight. There were 188 participants who had their body weight, percent lean body mass, percent body fat, and TBBMD measured, 225 participants who had grams of total mass, grams of total lean mass measured, and grams of total fat mass; 180 participants who had waist-to-hip ratio measured and 57 participants who had TSH, T3, and T4 measured. The sample sizes described above vary for each test because not every participant provided all the data which were analyzed in this study.
The participants’ body weights ranged from 46.5 to 115.8 kg. The participants’ iodine intakes ranged from 0 to 340.1 μg/ day. The percent of lean body mass ranged from 4.6 to 81%. The percent of body fat ranged from 5.4 to 59%. The participants’ waist-to-hip ratios ranged from 0.6776 to 0.9143. TBBMD for the participants ranged from 1.01 to 1.39 g/cm2. The circulating level of TSH ranged from 0.008 to 7.783 µIU/ml while T3 ranged from 0.446 pg/ml to 17.819 pg/ml, and T4 ranged from 0.462 ng/dl to 1.721 ng/dl. Mean Iodine Intake, Weight, Percent Body Fat, Percent Lean Body Mass, and TBBM, TSH, T3, and T4 Data for Pioneer Project Participants are reported in Table 1.
Table 1. Mean Iodine Intake, Weight, Percent Body Fat, Percent Lean Body Mass, and TBBM, TSH, T3, and T4 Data for Pioneer Project Participants.
|
Variable |
Sample Size (n) |
Mean |
SD |
|
Iodine Intake (μg) |
188 |
55.8 |
82.9 |
|
Weight (kg) |
188 |
66.5 |
13 |
|
LBM% |
188 |
.62 |
.09 |
|
BF% |
188 |
.38 |
.08 |
|
TBBMD (g/cm2) |
188 |
1.18 |
.07 |
|
Waist-to-hip Ratio |
180 |
.8 |
.05 |
|
TSH (µIU/ml) |
57 |
1.21 |
1.17 |
|
T3 (pg/ml) |
57 |
2.81 |
2.28 |
|
T4 (ng/dl) |
57 |
1.16 |
.35 |
Percent Body Fat – BF%, Percent Lean Body Mass – LBM%, and Total Body Bone Mineral Density – TBBMD, Thyrotropin Stimulating Hormone – TSH, Triiodothyronine – T3, and Thyroxine – T4
Dietary iodine consumption was assessed from the HFFQ, which revealed that a large group of participants from the Pioneer Project had an intake of 0 μg of iodine per day, reducing the variability of iodine intake in the study population. The majority of participants consumed less than the RDA of 150 μg of iodine per day. 60% of participants (n=113) consumed 0 μg of iodine per day while 70% of participants (n=132) consumed below the 150 μg of iodine per day for the RDA (See Figure 1).
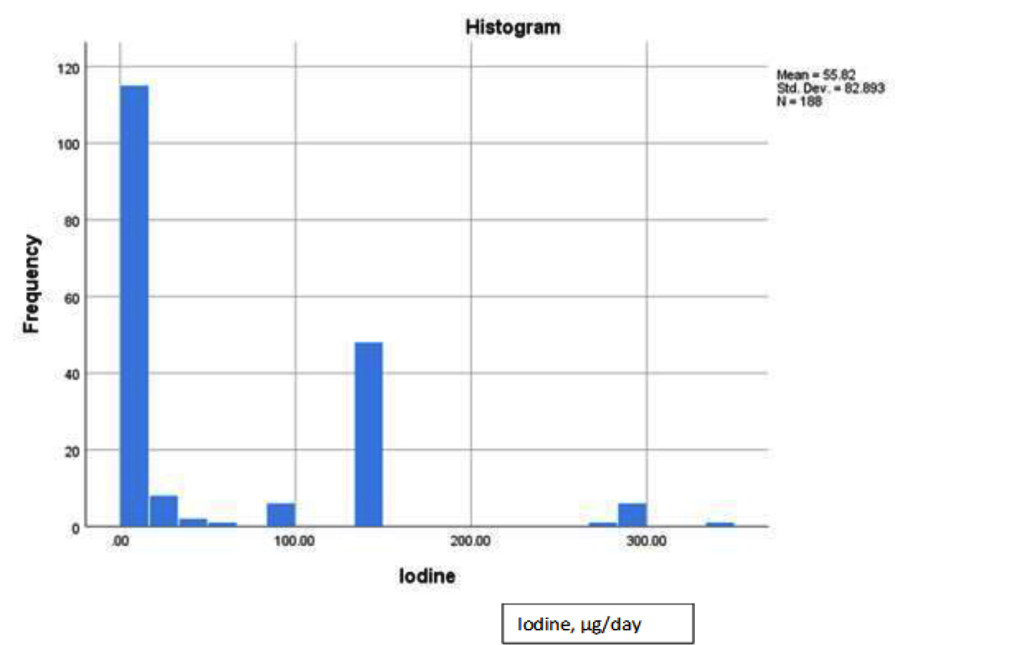
Figure 1. Dietary iodine distribution histogram for pioneer project participants.
ANOVA was used to assess any significant differences between means of three tertiles of iodine intake on percent lean body mass, percent body fat and waist-to-hip ratio (Tables 2 and 3). As a whole, no significant differences between the iodine intake groups on percent lean body mass (p = .696), percent body fat (p = .747), and waist-to-hip ratio (p = .973) were observed. Therefore, the null hypothesis was failed to be rejected. However, it is important to note that the participants who had the highest iodine intake (Group 3, > 66th percentile of the RDA) had the highest mean percent lean body mass and lowest mean percent of body fat. In Group 3, the highest mean percent lean body mass was 62.6% and the lowest mean percent body fat was 37.4%.
Table 2. Mean Percent Body Fat Among Tertiles for Iodine Intake.
|
Group |
Sample Size (n) |
Mean |
SD |
|
1 |
113 |
37.6% |
8.9% |
|
2 |
12 |
39.4% |
8.9% |
|
3 |
63 |
37.4% |
7.3% |
Group 1, ≤ 33rd percentile of the lowest iodine intake; Group 2, > 33rd percentile and ≤ 66th percentile of iodine intake in the middle; Group 3, > 66th percentile of the highest iodine intake
Table 3.Mean Percent Lean Body Mass Among Tertiles for Iodine Intake.
|
Group |
Sample Size (n) |
Mean |
SD |
|
1 |
113 |
61.6% |
10% |
|
2 |
12 |
60.6% |
8.9% |
|
3 |
63 |
62.6% |
7.3% |
Group 1, ≤ 33rd percentile of the lowest iodine intake; Group 2, > 33rd percentile and ≤ 66th percentile of iodine intake in the middle; Group 3, > 66th percentile of the highest iodine intake
Spearman’s rank order correlation assessed the association between dietary iodine intake and body weight, percent lean body mass, percent body fat, waist-to-hip ratio, TBBMD, and circulating concentrations of T3, T4, and TSH (Table 4). No significant association was found between iodine intake and body weight (rs = .085, p = .247), percent lean body mass (rs = .018, p = .808), percent body fat (rs = -.003, p = .962), waist-to-hip ratio (rs = .021, p = .775), TBBMD (rs = .087, p = .235), TSH (rs = -.156, p = .250), T3 (rs = -.038, p = .778), or T4 (rs = -.216, p = .109). After analyzing the data, the null hypotheses failed to be rejected (all p values were > .05) which indicated that there were no significant associations between dietary iodine intake and body weight, percent lean body mass, percent body fat, waist-to-hip ratio, TBBMD, and circulating concentrations of T3, T4, and TSH.
Table 4. Spearman’s Rank Order Correlation Results.
|
Iodine Intake (μg) vs. Variable Below |
rs |
P |
|
Weight (kg) |
.085 |
.247 |
|
LBM% |
.018 |
.808 |
|
BF% |
-.003 |
.962 |
|
Waist-to-Hip Ratio |
.021 |
.775 |
|
TBBMD (g/cm2) |
.087 |
.235 |
|
TSH (µIU/ml) |
-.156 |
.250 |
|
T3 (pg/ml) |
-.038 |
.778 |
|
T4 (ng/dl) |
-.216 |
.109 |
Percent Body Fat – BF%, Percent Lean Body Mass – LBM%, Total Body Bone Mineral Density – TBBMD, Thyrotropin Stimulating Hormone – TSH, Triiodothyronine – T3, and Thyroxine – T4
Partial correlations were also performed to determine if there was an association while controlling for specific variables (Table 5). The partial correlations included the evaluation of 1) dietary iodine intake with the circulating concentrations of T3, T4, and TSH while controlling for all other variables that could affect the outcome, and 2) age with the circulating concentrations of T3, T4, and TSH while controlling for all other variables that could affect the outcome. When controlling for body weight, percent lean body mass, percent body fat, waist-to-hip ratio, TBBMD, and age, no correlation between iodine intake and T4 was observed. Concentrations of TSH and T3, and their correlation with iodine intake had a slight increase in their “r” value, but the values indicated no significant correlation. The control variables (body weight, percent lean body mass, percent body fat, waist-to-hip ratio, TBBMD, and age ) did not significantly affect the correlation of iodine intake on TSH (rs = -.069, p = .673), T3 (rs = -.056, p = .731), and T4 (rs = -.152, p = .348). Alternatively, when controlling for body weight, percent lean body mass, percent body fat, waist-to-hip ratio, TBBMD, and iodine intake, there was an increase in the correlation between age and TSH, T3, and T4 than when compared to iodine intake with the levels of circulating hormones. When analyzing the correlations of age with TSH (rs = -.040, p = .806), T3 (rs = .214, p = .185) and T4 (rs = .154, p = .342), there were no significant associations of age with the circulating hormone levels.
Table 5. Partial Correlation Results.
|
Variable |
rs |
P |
|
Iodine Intake vs. TSH (µIU/ml) |
-.069 |
.673 |
|
Iodine Intake vs. T3 (pg/ml) |
-.056 |
.731 |
|
Iodine Intake vs. T4 (ng/dl) |
-.152 |
.348 |
|
Age vs. TSH (µIU/ml) |
-.040 |
.806 |
|
Age vs. T3 (pg/ml) |
.214 |
.185 |
|
Age vs. T4 (ng/dl) |
.154 |
.342 |
Thyrotropin Stimulating Hormone – TSH, Triiodothyronine – T3, and Thyroxine – T4
After analyzing the data obtained, the null hypotheses were failed to be rejected that there were significant associations between dietary iodine intake and body weight, percent lean body mass, percent body fat, waist-to-hip ratio, TBBMD, and circulating concentrations of T3, T4, and TSH. The null hypothesis was failed to be rejected that there was a significant association between dietary iodine intake and the circulating concentrations of T3, T4, and TSH when controlling for all other variables. ANOVA was completed to assess if there were any significant differences between the means of the iodine intake tertiles on percent lean body mass, percent body fat, and waist-to-hip ratio. After analyzing the effect of iodine intake separated into tertiles, the null hypotheses were failed to be rejected that there were no significant associations between dietary iodine intake and percent body fat, percent lean body mass, and waist-to-hip ratio.
Discussion
Iodine is essential for healthy thyroid function, and the thyroid hormones are responsible for regulating basal metabolic rate (BMR). Thyroid hormones are required for cellular respiration and energy production of ATP, which further enhances an individual’s oxygen consumption and metabolism. Both T3 and T4 are needed for normal growth as well as development, energy metabolism, and protein synthesis. The thyroid stimulates energy production through the cellular mitochondria thereby impacting an individual’s BMR [37]. Strengths of this study include the availability of data from the Pioneer Project which provided comprehensive medical, psychological, physiological, socio-economical, and nutritional information from 351 women between 18 to 60 years of age. The duration of the Pioneer Project with data being collected over a period of 4-years allowed for a varied range of participant ages and large sample size for data analysis. One of the main limitations of this study was that only Caucasian females were analyzed, although this was not an inclusion criterion. It is unsure if the male sex or other ethnicities would have different outcomes from what was shown in this study as neither population was assessed. Not all participants had data collected for every variable being measured in the study accounting for missing data, which may have impacted the results. The HFFQ was used to analyze the participant’s iodine intake as opposed to assessing the participant’s urinary iodine excretion which is a more accurate estimation of dietary iodine intake. The HFFQ revealed that a large group of participants from the Pioneer Project had an intake of 0 μg of iodine per day, which reduced the variability in the population. The majority of participants consumed less than the RDA of 150 μg of iodine per day. The Harvard Food Frequency Questionnaire (HFFQ) utilized in this study can be a practical method for performing a dietary assessment, but it is not without its limitations. The HFFQ requires that the participants recall the frequency of food items they consumed during the week, the month, or the year before. Participants also estimate what they consumed in their diet instead of providing exact measurements through a food record. Also, there are some non-specific questions included in the food frequency questionnaire. For example, one question asked about salt added at the table but did not specify what kind of salt was used. If an individual does not consume the same foods all the time, then they may forget about specific food items such as seasonal foods like fruits and vegetables. Validation studies have shown that correlations are limited by an error in both diet records and food frequency questionnaires [38]. Diet records may have a degree of error similar to food frequency questionnaires [38]. This is the case because when keeping diet records, the portion sizes of some foods may be estimated by dimensions or through household measurements instead of by weight. As a result, the nutrient content may be inaccurate by 20% on average [38]. The reproducibility of food frequency questionnaires has correlations ranging from 0.39–0.88 [38]. In the present study, the HFFQ was not an adequate indicator of iodine intake. 60% of participants consumed 0 μg of iodine per day while 70% of participants consumed below the 150 μg of iodine per day for the RDA. It is difficult to believe that such a large number of participants consumed no iodine in their diet since iodized salt has been distributed nationally since 1924. Based on data from this study, the HFFQ was not an adequate indicator of iodine intake as it is a self-reported history questionnaire, with more chance of reporting bias, and recall bias.
Daily urinary iodine excretion can be a reflection of iodine intake because only a small amount of iodine is excreted through the feces with the remainder excreted in the urine [39]. Therefore, analyzing an individual’s urine output may provide a better estimate of the amount of iodine that an individual consumes each day. The 24-hour urinary iodide is the most widely utilized measure of iodine status, but can be inconvenient for the subject and may be hard to collect accurately [39]. The single spot urinary samples are preferred in population studies [40]. Since there is considerable variability in daily iodine consumption, and because both the intake of iodine and fluid can affect the iodine concentration in urine, spot urine samples are unreliable for assessing iodine deficiency [40]. Urinary iodide concentration expressed as a function of urinary creatinine, this can help to correct the influence of fluid intake [40]. Future studies can focus on assessment methods to evaluate dietary iodine intake in conjunction with urinary iodine excretion to provide a better understanding of iodine status of individuals. Selenium is necessary for the biosynthesis and function of a minimal amount of selenocysteine-containing selenoproteins involved in thyroid hormone metabolism and the function of the thyroid gland [41]. By also analyzing selenium, the researcher can determine what effects this element has on human metabolism in regards to body mass index (BMI), BMR, weight, and body composition. Future studies should consider assessing selenium with iodine to determine what effect a selenium deficiency plays in the production of thyroid hormones. Studies could assess for differences between iodine intake and ethnicity, as dietary habits, and micronutrient intakes are significantly impacted by ethnic status.
Another limitation was that not all participants in this study had their T3 and T4 levels documented. This study did not demonstrate any significant relationships between dietary iodine intake and body weight, percent lean body mass, percent body fat, waist-to-hip ratio, TBBMD, and circulating concentrations of T3, T4, and TSH in Caucasian females between the ages of 18 and 60 years. However, it is important to note is that the participants who had the highest iodine intake (Group 3, > 66th percentile of the RDA) had the highest mean percent lean body mass and lowest mean percent body fat. In Group 3, the highest mean percent lean body mass was 62.6%, and the lowest mean percent body fat was 37.4% (See Tables 2, 3).
The lack of assessments for thyroid volume could also be considered another limitation of this study. Thyroid volume can be affected by daily iodine intake, geographical region and food intake habit [42]. In several other studies, researchers compared the effect of thyroid volume on body weight, body fat percentage, body fat weight, waist circumference, TSH, T4, and T3. Thyroid volume was typically measured using thyroid ultrasonography. These studies have suggested that an individual’s thyroid volume is significantly associated with body weight [30, 43–46]. Whereas, one study indicated that only lean body mass was related to thyroid volume [25]. Thyroid volume has a relationship to BMI, waist-to-hip ratio, and fat mass in areas with an adequate iodine intake as well as mild or moderate iodine-deficient areas [43–46]. There is a significant association between thyroid volume and body weight, body fat percentage, body fat weight, waist circumference, and BMI [30]. A study by Wesche and Wiersinga, 2001 looked at the effects of a 6-month intensive physical training program on thyroid volume [47]. Intensive physical training caused changes in thyroid volume related to body composition. The group of freshman rowers had reductions in thyroid volume, body weight, body mass index, fat weight, and lean body mass [47]. The control group included senior rowers who had participated in a training program for more than two years. The control group had no alterations in thyroid volume or body composition throughout the 6-month surveillance period [47].
Conclusions
In conclusion, there was not a significant association between dietary iodine intake and body weight, percent lean body mass, percent body fat, waist-to-hip ratio, TBBMD, or circulating concentrations of T3, T4, and TSH using the data from the Pioneer Project. The HFFQ did not provide accurate measurements of iodine intake for analysis in the Pioneer Project. Therefore, a more accurate indicator of iodine status needs to be utilized in future studies to analyze the effect of iodine consumption on an individual’s body weight, BMR, and body composition including percent lean body mass and percent body fat. Correlation of BMI and iodine intake was not significant but does warrant further investigation.
Acknowledgments: Thanks is extended to all those women who participated in the Pioneer Project and the State of Texas Higher Education Coordinating Board for funding the project.
References
- Ahad F, Ganie SA (2010) Iodine, iodine metabolism and iodine deficiency disorders revisited. Indian J Endocrinol Metab 14: 13–17. [Crossref]
- Mansourian AR (2011) A review on the metabolic disorders of iodine deficiency. Pak J Biol Sci 14(7): 412–424. [Crossref]
- Baker DH (2004) Iodine toxicity and its amelioration. Exp Biol Med 229: 473–478. [Crossref]
- Zimmermann MB, Jooste PL, Pandav CS (2008) Iodine-deficiency disorders. Lancet 372: 1251–1262. [Crossref]
- McCance KL, Huether SE (2006) Pathophysiology: The biologic basis for disease in adults and children (5th ed.) St. Louis, Missouri: Elsevier Mosby.
- Arthur JR, Nicol F, Beckett GJ (1992) The role of selenium in thyroid hormone metabolism and effects of selenium deficiency on thyroid hormone and iodine metabolism. Biol Trace Elem Res 34: 321–325. [Crossref]
- Delange, F, Lecomte P (2000) Iodine supplementation: benefits outweigh risks. Drug Saf 22(2): 89–95. [Crossref]
- Institute of Medicine of the National Academies (2006) Iodine. In JJ. Otten JP. Hellwig, LD. Meyers (Eds.), Dietary reference intakes: The essential guide to nutrient requirements (pp. 320–327).
- Bürgi H (2009) Iodine excess. Best Pract Res Clin Endocrinol Metab 24: 107–115. [Crossref]
- Mahan LK, Escott-Stump S (2008) Krause’s food nutrition therapy (12th ed.) Canada: Saunders Elsevier.
- Paknahad Z (2010) Iodine deficiency disorders. Proceeding from the 1st International Applied Geological Congress. Department of Geology at Islamic Azad University of Mashad Branch, Iran.
- Brown JE (2008) Nutrition through the life cycle (3rd ed.) Belmont, CA: Thomson Wadsworth.
- Dunford M (2006) Sports nutrition: A practice manual for professionals (4th ed.) United States of America: American Dietetic Association.
- Pennington JAT (1990) Iodine concentrations in US milk: Variation due to time, season, and region. Journal of Dairy Science 73: 3421–3427.
- Soldin OP (2007) The importance of dietary iodine. Wellness Options 34: 29–31.
- Lee KL, Bradley R, Dwyer, J Lee SL (1999) Too much versus too little: The implications of current iodine intake in the United States. Nutrition Reviews 57(6): 177–181. [Crossref]
- Miyai K, Tokushige T, Kondo M; Iodine Research Group (2008) Suppression of thyroid function during ingestion of seaweed “kombu” (Laminaria japonoca) in normal Japanese adults. Endocr J 55: 1103–1108. [Crossref]
- Patrick L (2008) Iodine: deficiency and therapeutic considerations. Altern Med Rev 13(2): 116–127.
- McCance KL, Huether SE (2006) Pathophysiology: The biologic basis for disease in adults and children (5th ed.) St. Louis, Missouri: Elsevier Mosby.
- Delange F, de Benoist, B, Pretell, E, Dunn JT (2001) Iodine deficiency in the world: Where do we stand at the turn of the century? Thyroid 11: 437–447. [Crossref]
- Konijn AM, Gershon, B, Guggenheim K (1973) Further purification and mode of action of a goitrogenic material from soybean flour. J Nutr 103: 378–383. [Crossref]
- American Thyroid Association (2018) Iodine deficiency. Retrieved from http://www.thyroid.org/iodine-deficiency/#. Accessed on March 1, 2018.
- Rasmussen LB, Ovesen, L, Bülow, I, Jørgensen T, Knudsen N, et al. (2002) Relations between various measures of iodine intake and thyroid volume, thyroid nodularity, and serum thyroglobulin. Am J Clin Nutr 76: 1069–1076. [Crossref]
- Arthur JR, Beckett GJ (1999) Thyroid function. Br Med Bull 55: 658–668. [Crossref]
- Wesche MF, Wiersinga WM, Smits NJ (1998) Lean body mass as a determinant of thyroid size. Clin Endocrinol (Oxf) 48: 701–706. [Crossref]
- Cleveland Clinic (2018) Goiter. Retrieved from https://my.clevelandclinic.org/health/diseases/12625-goiter. Accessed on March 1, 2018.
- Zimmermann MB (2008) Research on iodine deficiency and goiter in the 19th and early 20th centuries. J Nutr 138: 2060–2063. [Crossref]
- Vejbjerg P, Knudsen N, Perrild H, Carlé A, Laurgerg P, et al. (2007) Effect of a mandatory iodization program on thyroid gland volume based on individuals’ age, gender, and preceding severity of dietary iodine deficiency: A prospective, population-based study. J Clin Endocrinol Metab 92: 1397–1401. [Crossref]
- Boyanov MA, Temelkova NL, Popivanov PP (2004) Determinants of thyroid volume in schoolchildren: fat-free mass versus body fat mass–a cross-sectional study. Endocr Pract 10: 409–416.
- Sari R, Balci MK, Altunbas H, Karayalcin U (2003) The effect of body weight and weight loss on thyroid volume and function in obese women. Clin Endocrinol (Oxf) 59(2): 258–262. [Crossref]
- Meunier N, Beattie JH, Ciarapica D, O’Connor JM, et al. (2005) Basal metabolic rate and thyroid hormones of late-middle-aged and older human subjects: The ZENITH study., Eur J Clin Nutr 59(Suppl 2): S53-S57. [Crossref]
- Kim B (2008) Thyroid hormone as a determinant of energy expenditure and the basal metabolic rate. Thyroid 18: 141–144. [Crossref]
- Centers for Disease Control (2018) NHANES 2011–2012. Retrieved from < https://wwwn.cdc.gov/nchs/nhanes/ContinuousNhanes/Default.aspx?BeginYear=2011>. Accessed March 1, 2018.
- Centers for Disease Control (2012) Adult obesity facts. Accessed on 13 October 2012.
- Carlton JB (2010) Prevalence of micronutrient deficiency in popular diet plans. J Int Soc Sports Nutr 7(1): 24. [Crossref]
- Rimm E, Giovannuci E, Stampfer M, Colditz G, Litin L, et al. (1992) Reproducibility and validity of a self-administered semi-quantitative food frequency questionnaire, and diet records in U.S. men. J Am Diet Assoc 135: 1114–1136. [Crossref]
- Goglia F, Silvestri E, Lanni A (2002) Thyroid hormones and mitochondria. 22(1): 17–32. [Crossref]
- Longnecker MP, Lissner L, Holden JM, Flack VF, Taylor PR, et al. (1993) The reproducibility and validity of a self-administered semiquantitative food frequency questionnaire in subjects from South Dakota and Wyoming. Epidemiology 4(4): 356–365. [Crossref]
- Thomson CD, Smith TE, Butler KA, Packer MA (1996) An evaluation of urinary measures of iodine and selenium status. J Trace Elem Med Biol 10(4): 214–222. [Crossref]
- Vejbjerg P, Knudsen N, Perrild H, Laurberg P, Andersen S, et al. (2009) Estimation of iodine intake from various urinary iodine measurements in population studies. Thyroid 19(11): 1281–1286. [Crossref]
- Schomburg, L, Köhrle J (2008) On the importance of selenium and iodine metabolism for thyroid hormone biosynthesis and human health. Mol Nutr Food Res 52(11), 1235–1246. [Crossref]
- Nafisi Moghadam R, Shajari A, Afkhami-Ardekani M (2011) Influence of physiological factors on thyroid size determined by ultrasound. Acta Med Iran 49: 302–304. [Crossref]
- Gomez JM, Maravall FJ, Gomez, N, Guma, A, Soler J (2000) Determinants of thyroid volume as measured by ultrasonography in healthy adults randomly selected. Clin Endocrinol 53: 629–634. [Crossref]
- Hegedües L, Perrild H, Poulsen LR, Andersen JR, Holm B, et al. (1983) The determination of thyroid volume by ultrasound and its relationship to body weight, age and sex in normal subjects. J Clin Endocrinol Metab 56: 260–263. [Crossref]
- Ivarsson SA, Persson PH, Ericsson UB (1989) Thyroid gland volume as measured by ultrasonography in healthy children and adolescents in noniodine-deficient area. Acta Paediatrica Scandinavica 78: 633–634. [Crossref]
- Semiz S, Senol U, Bircan O, Gümüslü S, Bilmen S, et al. (2001) Correlation between age, body size and thyroid volume in an endemic area. J Endocrinol Invest 24: 559–563. [Crossref]
- Wesche MF, Wiersinga WM (2001) Relation between lean body mass and thyroid volume in competition rowers before and during intensive physical training. Horm Metab Res 33: 423–427. [Crossref]