DOI: 10.31038/EDMJ.20261024
Abstract
Background: Thyroid disorders are among the most common endocrine conditions in pregnancy. Both overt and subclinical hypothyroidism have been linked to adverse maternal and fetal outcomes; however, data from Bangladesh remain limited. This study aimed to determine the prevalence of hypothyroidism and assess its association with maternal and neonatal outcomes.
Methods: This hospital-based prospective observational study was conducted at BIRDEM General Hospital between March 2018–December 2019 and December 2022–September 2023. A total of 60 pregnant women at their first antenatal visit were enrolled following inclusion and exclusion criteria. Data were collected through interviews, clinical examination, and laboratory investigations. Serum thyroid-stimulating hormone (TSH), free thyroxine (FT4), and antithyroid antibodies were measured in hypothyroid participants, while only TSH was measured in controls. Statistical analysis was performed using SPSS version 25.
Results: Of the 60 participants, 30 (50%) were euthyroid and 30 (50%) had hypothyroidism. Among the hypothyroid group, 21.67% were previously diagnosed and euthyroid on therapy, while 28.33% were newly diagnosed (including 12 subclinical and 5 overt cases). Antithyroid peroxidase antibody positivity was higher in subclinical hypothyroidism (66.7%), whereas most previously diagnosed cases were antibody negative (76.9%) (p < 0.05). A family history of thyroid disease was significantly more common in hypothyroid women (75%; OR 1.83, 95% CI 1.16–2.88). Hypothyroidism was associated with increased risks of maternal complications, including anemia, hypertension, preterm delivery, and cesarean section. Neonatal complications such as jaundice, hypoglycemia, low birth weight, and NICU admission were also more frequent. Newly diagnosed cases showed higher risks of adverse outcomes than previously known cases. No significant differences were observed across first-trimester thyroid hormone cut-off values.
Conclusions: Hypothyroidism, particularly newly diagnosed cases during pregnancy, is associated with adverse maternal and neonatal outcomes. Universal screening may enable early detection and improve pregnancy outcome.
Keywords
Hypothyroidism, Pregnancy, Subclinical hypothyroidism, Maternal outcomes, Fetal outcomes, Neonatal outcomes, Thyroid dysfunction, Pregnancy complications, Antithyroid antibodies
Introduction
Thyroid disorders are among the most common endocrine conditions encountered during pregnancy and represent the second most frequent endocrinopathy after diabetes mellitus [1]. Hypothyroidism during pregnancy has gained increasing attention because of its potential impact on maternal health and fetal development. Globally, hypothyroidism affects a considerable proportion of pregnant women, with reported prevalence varying across populations depending on iodine status, diagnostic criteria, and screening practices [2]. In iodine-sufficient regions, the prevalence of hypothyroidism during pregnancy is estimated to be approximately 2%, while higher rates have been reported in several Asian populations [3].
In Bangladesh, thyroid disorders during pregnancy represent an important public health concern. Previous studies have reported varying prevalence rates of thyroid dysfunction among pregnant women, with subclinical hypothyroidism (SCH) being the most commonly identified abnormality [4,5]. According to the 2017 guidelines of the American Thyroid Association, maternal hypothyroidism is defined by elevated thyroid-stimulating hormone (TSH) levels during pregnancy. Subclinical hypothyroidism is characterized by elevated TSH with normal free thyroxine (FT4) levels, whereas overt hypothyroidism is defined by elevated TSH accompanied by decreased FT4 concentrations or TSH levels greater than 10 mIU/L regardless of FT4 levels [6]. Accurate diagnosis is essential because thyroid physiology undergoes significant changes during pregnancy, including increased thyroid hormone production, elevated thyroxine-binding globulin levels, and increased iodine requirements.
Adequate maternal thyroid hormone levels are essential for normal fetal growth and neurodevelopment, particularly during early pregnancy when the fetus relies largely on maternal thyroxine supply. Maternal hypothyroidism has been associated with several adverse obstetric and neonatal outcomes. These include miscarriage, preeclampsia, gestational hypertension, preterm birth, placental abruption, and low birth weight [7]. In addition, maternal thyroid dysfunction has been linked to impaired neurocognitive development in offspring due to insufficient thyroid hormone availability during critical periods of brain development.
Despite increasing recognition of the clinical importance of thyroid dysfunction in pregnancy, data on the prevalence and associated maternal and fetal outcomes remain limited in many developing countries, including Bangladesh. Variability in screening strategies and diagnostic thresholds further contributes to uncertainty regarding the burden of disease in this population. Therefore, the present study aimed to evaluate the prevalence of hypothyroidism during pregnancy and to assess its association with adverse maternal and fetal outcomes among pregnant women in Bangladesh.
Materials and Methods
Study Design and Setting
This prospective observational study was conducted at the Department of Endocrinology and the Department of Obstetrics and Gynaecology, BIRDEM General Hospital, Dhaka, Bangladesh. The study period extended from March 2018 to November 2019 and from December 2022 to September 2023.
Study Population and Sampling
Pregnant women in their first trimester attending antenatal visits at outpatient and inpatient departments were recruited. A purposive sampling technique was used, and all eligible participants during the study period were enrolled.
The sample size was calculated based on the risk of preeclampsia in normal (4%) and hypothyroid (29%) pregnant women at a 5% significance level and 95% confidence interval, yielding a minimum of 30 participants per group (total 60).
Inclusion and Exclusion Criteria
Inclusion Criteria
Pregnant women in the first trimester with or without hypothyroidism
- Age 18–35 years
- Receiving or not receiving thyroxine supplementation
Exclusion Criteria
- Acute illness at presentation
- Refusal to participate
- History of diabetes mellitus or gestational diabetes
- Hypertension or other chronic illnesses
Study Variables and Definitions
Variables Collected
- Socio-demographic: age, education, occupation, residence
- Menstrual history: last menstrual period
- Obstetric history: gravida, para, gestational age
- Clinical variables: BMI, blood pressure, thyroid-related symptoms
Operational Definitions
Hypothyroidism and subclinical hypothyroidism were defined according to ATA 2017 guidelines. Maternal and fetal outcomes were defined based on standard international guidelines (NICE, WHO, ACOG, ADA).
Data Collection and Study Procedure
Data were collected using a semi-structured questionnaire, clinical examination, and laboratory investigations.
Blood samples (5 mL) were collected after overnight fasting to measure serum TSH, FT4, and thyroid autoantibodies using ECLIA. Additional tests included CBC, urine analysis, ultrasonography, and OGTT as part of routine antenatal care.
Participants were followed through each trimester and up to the first postpartum week to assess maternal and fetal outcomes.
Statistical Analysis
Data were analyzed using SPSS version 25. Continuous variables were expressed as mean ± SD and categorical variables as frequency and percentage.
Comparisons were performed using:
- Mann–Whitney U test / ANOVA (continuous variables)
- Chi-square or Fisher’s exact test (categorical variables)
- Kruskal–Wallis test (hormonal comparisons)
A p-value <0.05 was considered statistically significant.
Ethical Considerations
Ethical approval was obtained from the IRB of BIRDEM General Hospital. Written informed consent was obtained from all participants prior to data collection.
Quality Control and Confidentiality
Data quality was ensured through regular supervision and validation. Each participant was assigned a unique ID to maintain confidentiality, and access to identifiable data was restricted.
Funding and Budget
No additional investigations were required; all procedures were part of routine care. Costs were limited to administrative expenses borne by the investigator.
Results
A total of 60 pregnant women in the first trimester were included in this hospital-based prospective observational study conducted at the Departments of Obstetrics and Gynecology and Endocrinology, BIRDEM General Hospital, following predefined inclusion and exclusion criteria. Thyroid function was evaluated using serum thyroid-stimulating hormone (TSH) and free thyroxine (FT4) levels. The normal reference ranges were defined as TSH 0.40–4.0 mIU/L and FT4 9.14–23.18 pmol/L, and values outside these ranges were considered abnormal. Subclinical hypothyroidism (SCH) was defined as TSH levels between 4.0–10 mIU/L with normal FT4 levels, while overt hypothyroidism (OH) was defined as TSH >10 mIU/L and/or FT4 <9.14 pmol/L.
The mean age of the participants was 26.55 ± 4.01 years, with the highest proportion (46.7%, n=28) belonging to the 24–29 years age group. Most participants were undergraduates (68.3%, n=41), and the majority were homemakers (83.3%, n=50) (Table 1).
Table 1: Socio-demographic characteristics of the participants (n=60). Data presented as frequency and percentage over columns.
|
Characteristics
|
Frequency |
Percentage (%)
|
| Age (in years) |
|
|
| 18-23 |
15
|
25
|
| 24-29 |
28
|
46.7
|
| ≥30 |
17
|
28.3
|
| Mean ± SD |
26.55 ± 4.01
|
|
| Level of Education |
|
|
| Graduate |
19
|
31.7
|
| Undergraduate |
41
|
68.3
|
| Occupation |
|
|
| Service |
10
|
16.7
|
| Homemaker |
50
|
83.3
|
An equal proportion of participants were primigravida and multigravida (50% each). The majority (73.3%, n=44) had no family history of thyroid disorders, while 26.7% (n=16) reported a positive family history. A history of abortion was present in only 3.3% (n=2) of participants (Table 2).
Table 2: Obstetric history of the study participants (n=60). Data presented as frequency and percentage over columns.
|
Variables
|
Frequency |
Percentage (%)
|
| Parity |
|
|
| Primigravida |
30
|
50
|
| Multigravida |
30
|
50
|
| H/O abortion |
|
|
| No |
58
|
96.7
|
| Yes |
2
|
3.3
|
| F/H of thyroid disease |
|
|
| No |
44
|
73.3
|
| Yes |
16
|
26.7
|
Most participants (98.3%, n=59) were asymptomatic. Only one participant (1.7%, n=1) presented with symptoms suggestive of hypothyroidism, including facial puffiness, cold intolerance, constipation, and dry skin (Table 3).
Table 3: Symptoms of the study participants (n=60). Data presented as frequency and percentage over columns.
|
Symptoms
|
Frequency |
Percentage (%)
|
| Asymptomatic |
|
|
| No |
1
|
1.7
|
| Yes |
59
|
98.3
|
| Facial puffiness |
|
|
| Yes |
1
|
1.7
|
| No |
59
|
98.3
|
| Cold intolerance |
|
|
| Yes |
1
|
1.7
|
| No |
59
|
98.3
|
| Constipation |
|
|
| Yes |
1
|
1.7
|
| No |
59
|
98.3
|
| Dry skin |
|
|
| Yes |
1
|
1.7
|
| No |
59
|
98.3
|
The mean body mass index (BMI) was 26.10 ± 2.66 kg/m². The mean heart rate was 75.81 ± 6.45 beats per minute, while the mean systolic and diastolic blood pressures were 121.06 ± 15.34 mmHg and 74.46 ± 9.51 mmHg, respectively. On thyroid examination, only one participant (1.7%, n=1) had a palpable thyroid gland, while the remaining participants had no abnormal findings (Table 4).
Table 4: Examination findings of the study participants (n=60). Data are presented as mean ± standard deviation (SD) for continuous variables and frequency with percentage (%) for categorical variables. BMI: Body mass index; bpm: beats per minute; SBP: systolic blood pressure; DBP: diastolic blood pressure.
|
Examination findings
|
Mean ± SD
|
| BMI (kg/m²) |
26.10 ± 2.66
|
| Heart rate (bpm) |
75.81 ± 6.45
|
| SBP (mmHg) |
121.06 ± 15.34
|
| DBP (mmHg) |
74.46 ± 9.51
|
| Thyroid gland |
Frequency
|
Percentage (%)
|
| Not palpable |
59
|
98.3
|
| Palpable |
1
|
1.7
|
Half of the participants (50%, n=30) had normal thyroid function. Among the remaining participants, 28.33% (n=17) were newly diagnosed with hypothyroidism during pregnancy, while 21.67% (n=13) had a prior diagnosis of hypothyroidism before pregnancy (Figure 1).
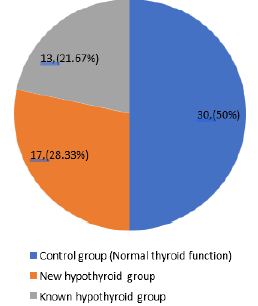
Figure 1: Thyroid status of the study participants (n=60).
Among the 30 participants with hypothyroidism in the first trimester, 13 were previously diagnosed cases who were euthyroid on replacement therapy.
Of the 17 newly diagnosed cases, 12 were classified as subclinical hypothyroidism (SCH) and five as overt hypothyroidism (OH) (Figure 2).
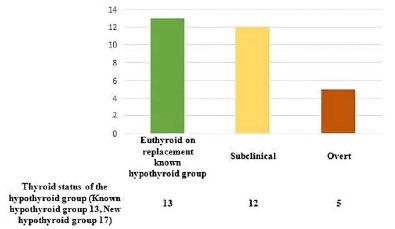
Figure 2: Distribution of hypothyroid participants according to thyroid status at 1st trimester of pregnancy (n=30).
Family history of thyroid disease was more common among hypothyroid participants (75%, n=12) compared to the control group (40.9%, n=18). This difference was statistically significant (p=0.020), with an odds ratio of 1.83 (95% CI: 1.16–2.88). No significant differences were observed between the two groups in terms of age, parity, history of abortion, body mass index (BMI), heart rate, systolic blood pressure (SBP), or diastolic blood pressure (DBP) (Table 5).
Table 5: Comparison of socio-demographic, history and examination findings of the study participants (n=60). Data are presented as frequency (percentage) for categorical variables and as mean ± standard deviation (SD) for continuous variables. OR: odds ratio; CI: confidence interval. s indicates statistically significant (p < 0.05), and ns indicates not significant (p ≥ 0.05).
|
Variables
|
Control group (n=30) |
Hypothyroid group (n=30) |
OR (95% CI) |
p-value
|
|
Frequency(%)
|
Frequency (%)
|
|
|
| Age (in years) |
|
|
|
|
| 18-23 |
8 (53.3)
|
7 (46.7)
|
|
|
| 24-29 |
12 (42.9)
|
16 (57.1) |
|
0.558ns
|
| >30 |
10 (58.8)
|
7 (41.2) |
……………….
|
|
| Mean ± SD |
26.63 ± 4.14
|
26.46 ± 3.94 |
|
0.935ns
|
| Parity |
|
|
|
|
| Primigravida |
18 (60)
|
12 (40) |
0.66 (0.39-1.12) |
0.121ns
|
| Multigravida |
12 (40)
|
18 (60)
|
|
|
| H/O abortion |
|
|
|
|
| Present |
0 (0)
|
2 (100) |
0.48 (0.37-0.63) |
0.492ns
|
| Absent |
30 (51.7)
|
28 (48.3)
|
|
|
| F/H of thyroid disease |
|
|
|
|
| Yes |
4 (25)
|
12 (75) |
1.83 (1.16-2.88) |
0.020s
|
| No |
26 (59.1)
|
18 (40.9)
|
|
|
|
Mean ± SD
|
Mean ± SD
|
|
|
| BMI (kg/m2) |
25.93 ± 2.23
|
26.29 ± 3.09 |
|
0.944ns
|
| Heart rate(bpm) |
76.30 ± 5.24
|
75.28 ± 7.60 |
|
0.815ns
|
| SBP (mmHg) |
119.93 ± 11.46
|
122.20 ± 18.57 |
|
0.666ns
|
| DBP (mmHg) |
74.33 ± 7.96
|
74.60 ± 10.99 |
|
0.660ns
|
Comparison of clinical and laboratory parameters among control, newly diagnosed hypothyroid, and known hypothyroid groups showed no significant differences in age, BMI, heart rate, SBP, or DBP. However, serum TSH levels differed significantly among the groups (p< 0.001), with the highest mean TSH observed in the newly diagnosed hypothyroid group (19.67 ± 29.49 mIU/L) compared to the control (1.55 ± 0.57 mIU/L) and known hypothyroid groups (2.83 ± 0.51 mIU/L) (Table 6).
Table 6: Comparison of clinical and laboratory variables between control and hypothyroid group (n= 60). Data are presented as mean ± standard deviation (SD). Age is expressed in years; BMI in kg/m²; HR in beats per minute (bpm); SBP and DBP in millimeters of mercury (mmHg); and TSH in milli-international units per Liter (mIU/L). BMI: body mass index; HR: heart rate; SBP: systolic blood pressure; DBP: diastolic blood pressure; TSH: thyroid-stimulating hormone. s indicates statistically significant (p < 0.05), and ns indicates not significant (p ≥ 0.05).
|
Variables
|
Control group (n=30) |
Hypothyroid Group (n=30) |
p-value
|
|
|
Newly diagnosed (n=17)
|
Known (n=13)
|
|
|
Mean±SD
|
Mean±SD |
Mean±SD
|
|
| Age |
26.63±4.14
|
25.76±4.53 |
27.38±2.93 |
0.550ns
|
| BMI |
25.93±2.23
|
26.97±3.45 |
25.49±2.52 |
0.307ns
|
| HR |
76.30±5.24
|
73.73±7.55 |
77.07±7.55 |
0.334ns
|
| SBP |
119.93±11.46
|
123.17±18. |
120.92±19.69 |
0.790ns
|
| DBP |
74.33±7.96
|
75.29±12.24 |
73.69±9.51 |
0.899ns
|
| TSH |
1.55±0.57
|
19.67±29.49 |
2.83±0.51 |
0.001s
|
Among the 30 hypothyroid participants, TSH levels varied significantly across the three trimesters among the known hypothyroid, subclinical hypothyroid (SCH), and overt hypothyroid groups. In the first trimester, mean TSH levels were highest in the overt hypothyroid group (52.04 ± 40.24 mIU/L), followed by the SCH group (6.18 ± 1.32 mIU/L), and lowest in the known hypothyroid group (2.83 ± 0.51 mIU/L). A significant reduction in TSH levels was observed in the second and third trimesters across all groups. These differences were statistically significant based on the Kruskal-Wallis test (p < 0.05) (Table 7).
Table 7: TSH level of the hypothyroid participants in each trimester (n=30). Data presented as mean ± SD over columns. P-value reached through c Kruskal-Wallis test for non-normally distributed data. SCH: subclinical hypothyroidism; Overt: overt hypothyroidism. s indicates statistically significant (p < 0.05).
|
Time of estimation of thyroid level
|
TSH level
|
p-value Overt (n=5)
|
|
Known hypothyroid group (n=13)
|
New hypothyroid group (n= 17) SCH (n=12)
|
|
Mean ± SD
|
Mean ± SD |
Mean ± SD
|
|
| First Trimester |
2.83 ± 0.51
|
6.18 ±1.32 |
52.04 ± 40.24 |
<0.001s
|
| Second Trimester |
1.65 ± 0.49
|
2.11 ± 0.45 |
2.37 ± 0.25 |
0.010s
|
| Third Trimester |
1.29 ± 0.45
|
2.13 ± 0.54 |
2.10 ± 0.25 |
0.002s
|
Regarding thyroid antibody status, anti-thyroid peroxidase (anti-TPO) antibody positivity was higher among SCH (66.7%, n=8) and overt hypothyroid participants (80%, n=4), whereas the majority of known hypothyroid participants were anti-TPO antibody negative (76.9%, n=10). This difference was statistically significant (p=0.043) (Table 8).
Table 8: Thyroid antibody status in the hypothyroid group (n=30). Data are presented as frequency (percentage). Fisher’s exact test was used for categorical variables where the expected cell count was less than 5. SCH: subclinical hypothyroidism; Overt: overt hypothyroidism; Anti-TPO Ab: anti-thyroid peroxidase antibody; Anti-Tg Ab: anti-thyroglobulin antibody. s indicates statistically significant (p < 0.05), and ns indicates not significant (p ≥ 0.05).
|
Hypothyroid status
|
Thyroid Antibody |
|
p-value
|
|
Anti TPO Ab positive
|
Anti TPO Ab negative
|
|
|
Frequency (%)
|
Frequency (%)
|
|
| SCH |
8 (66.7)
|
4 (33.3)
|
|
| Overt |
4 (80)
|
1 (20) |
a0.043s
|
| Known hypothyroid group |
3 (23.1)
|
10 (76.9)
|
|
|
Anti Tg positive
|
Anti Tg negative
|
|
|
Frequency (%)
|
Frequency (%)
|
|
| SCH |
7 (58.3)
|
5 (41.7)
|
|
| Overt |
3 (60)
|
2 (40) |
a0.160ns
|
| Known hypothyroid group |
3 (23.1)
|
10 (76.9)
|
|
In contrast, anti-thyroglobulin (anti-Tg) antibody positivity was observed in 58.3% (n=7) of SCH and 60% (n=3) of overt hypothyroid participants, while most known hypothyroid participants were anti-Tg antibody negative (76.9%, n=10). However, this difference was not statistically significant (p=0.160) (Table 8).
Among the hypothyroid participants (n=30), cesarean section was the most common maternal outcome (n=12), followed by anemia of pregnancy (n=8), hypertension (n=5), and gestational diabetes mellitus (GDM) (n=5). Preterm delivery occurred in four cases. Rare outcomes included pre-eclampsia, eclampsia, and spontaneous abortion, each observed in one case.
Regarding fetal outcomes, neonatal jaundice was the most frequent finding (n=5), followed by neonatal hypoglycemia (n=4) and NICU admission (n=4). Low birth weight was observed in two cases (Table 9).
Table 9: Maternal and fetal outcome of the hypothyroid group only (n=30). Data presented as frequency and percentage over rows. SCH: subclinical hypothyroidism; Overt: overt hypothyroidism; HTN: hypertension; GDM: gestational diabetes mellitus; NICU: neonatal intensive care unit. Percentages are calculated within each group. s indicates statistically significant (p < 0.05), and ns indicates not significant (p ≥ 0.05).
|
Hypothyroid status
|
Thyroid Antibody |
|
p-value
|
|
Anti TPO Ab positive
|
Anti TPO Ab negative
|
|
|
Frequency (%)
|
Frequency (%)
|
|
| SCH |
8 (66.7)
|
4 (33.3)
|
|
| Overt |
4 (80)
|
1 (20) |
a0.043s
|
| Known hypothyroid group |
3 (23.1)
|
10 (76.9)
|
|
|
Anti Tg positive
|
Anti Tg negative
|
|
|
Frequency (%)
|
Frequency (%)
|
|
| SCH |
7 (58.3)
|
5 (41.7)
|
|
| Overt |
3 (60)
|
2 (40) |
a0.160ns
|
| Known hypothyroid group |
3 (23.1)
|
10 (76.9)
|
|
When outcomes were compared based on thyroid antibody status, maternal complications such as anemia (62.5%, n=5), cesarean section (41.7%, n=5), GDM (60%, n=3), hypertension (60%, n=3), and preterm delivery (75%, n=3) were more common among anti-TPO antibody-positive participants.
Among fetal outcomes, neonatal jaundice was observed in all anti-TPO antibody-positive cases (100%, n=5), and this association was statistically significant (p=0.042). Neonatal hypoglycemia and NICU admission were also more frequent in the anti-TPO positive group (75%, n=3 each), although these differences were not statistically significant (Table 10).
Table 10: Comparison of maternal and fetal outcome of the hypothyroid group according to thyroid antibody status (n=30). Data are presented as frequency (n) and percentage (%). The chi-square test was used for categorical variables, and Fisher’s exact test was applied when the expected cell count was less than 5. Anti-TPO: anti-thyroid peroxidase antibody; HTN: hypertension; GDM: gestational diabetes mellitus; NICU: neonatal intensive care unit. s indicates statistically significant (p < 0.05), and ns indicates not significant (p ≥ 0.05).
|
Outcome
|
Thyroid Antibody |
|
p-value
|
|
Anti TPO positive
|
Anti TPO negative
|
|
|
Frequency (%)
|
Frequency (%)
|
|
| Maternal Outcome |
|
|
|
| Pre-eclampsia |
1 (100)
|
0 (0) |
>0.99ns
|
| Eclampsia |
1 (100)
|
0 (0) |
>0.99ns
|
| HTN |
3 (60)
|
2 (40) |
>0.99ns
|
| Spontaneous abortion |
1 (100)
|
0 (0) |
>0.99ns
|
| C-section |
5 (41.7)
|
7 (58.3) |
0.456ns
|
| Anemia of pregnancy |
5 (62.5)
|
3 (37.5) |
0.682ns
|
| GDM |
3 (60)
|
2 (40) |
>0.99ns
|
| Preterm delivery |
3 (75)
|
1 (25) |
0.598ns
|
| Fetal Outcome |
|
|
|
| Low birth weight |
1 (50)
|
1 (50) |
>0.99ns
|
| Neonatal jaundice |
5 (100)
|
0 (0) |
0.042s
|
| Neonatal hypoglycemia |
3 (75)
|
1 (25) |
0.598ns
|
| NICU admission |
3 (75)
|
1 (25) |
0.598ns
|
Compared to the control group, hypothyroid participants showed higher odds of several maternal complications, including eclampsia and spontaneous abortion (OR=2.03), anemia of pregnancy (OR=1.62), hypertension (OR=1.51), preterm delivery (OR=1.38), gestational diabetes mellitus (OR=1.30), and cesarean section (OR=1.15). However, none of these associations reached statistical significance (p > 0.05). The odds of preeclampsia were similar between the two groups (OR=1.00) (Table 11).
Table 11: Comparison of maternal outcome of the study participants (n=60). Data are presented as frequency (n) and percentage (%). The chi-square test was used for categorical variables, and Fisher’s exact test was applied when the expected cell count was less than 5. OR: odds ratio; CI: confidence interval; HTN: hypertension; GDM: gestational diabetes mellitus. s indicates statistically significant (p < 0.05), and ns indicates not significant (p ≥ 0.05).
|
Variables
|
Control group (n=30) |
Hypothyroid group (n=30) |
OR (95% CI) |
p-value
|
|
Frequency (%)
|
Frequency (%)
|
|
|
| Preeclampsia |
|
|
|
|
| Yes |
1 (50)
|
1 (50) |
1.00 (0.24-4.09) |
>0.99ns
|
| No |
29 (50)
|
29 (50)
|
|
|
| Eclampsia |
|
|
|
|
| Yes |
0 (0)
|
1 (100) |
2.03 (1.56-2.63) |
>0.99ns
|
| No |
30 (50.8)
|
29 (49.2)
|
|
|
| HTN |
|
|
|
|
| Yes |
2 (28.6)
|
5 (71.4) |
1.51 (0.87-2.62) |
0.424ns
|
| No |
28 (52.8)
|
25 (47.2)
|
|
|
| Spontaneous abortion |
| Yes |
0 (0)
|
1 (100) |
2.03 (1.56-2.63) |
>0.99ns
|
| No |
30 (50.8)
|
29 (49.2)
|
|
|
| C-section |
|
|
|
|
| Yes |
10 (45.5)
|
12 (54.5) |
1.15 (0.69-1.91) |
0.592ns
|
| No |
20 (52.6)
|
18 (47.4)
|
|
|
| Anemia of pregnancy |
| Yes |
3 (27.3)
|
8 (72.7) |
1.62 (1.00-2.60) |
0.095ns
|
| No |
27 (55.1)
|
22 (44.9)
|
|
|
| GDM |
|
|
|
|
| Yes |
3 (37.5)
|
5 (62.5) |
1.30 (0.70-2.38) |
0.706ns
|
| No |
27 (51.9)
|
25 (48.1)
|
|
|
| Preterm delivery |
| Yes |
2 (33.3)
|
4 (66.7) |
1.38 (0.73-2.59) |
0.671ns
|
| No |
28 (51.9)
|
26 (48.1)
|
|
|
Similarly, fetal outcomes such as neonatal jaundice (OR=1.51), neonatal hypoglycemia (OR=1.38), low birth weight (OR=1.35), and NICU admission (OR=1.16) were more frequent among newborns of hypothyroid mothers compared to controls. However, these differences were not statistically significant (p > 0.05) (Table 12).
Table 12: Comparison of fetal outcome of the study participants (n=60). Data are presented as frequency (n) and percentage (%). Fisher’s exact test was used for categorical variables when the expected cell count was less than 5. OR: odds ratio; CI: confidence interval; NICU: neonatal intensive care unit. s indicates statistically significant (p < 0.05), and ns indicates not significant (p ≥ 0.05).
|
Variables
|
Control group (n=30) |
Hypothyroid group (n=30) |
OR (95% CI) |
p-value
|
|
Frequency (%)
|
Frequency (%)
|
|
|
| Low birth weight |
| Yes |
1 (33.3)
|
2 (66.7) |
1.35 (0.58-3.15) |
>0.99ns
|
| No |
29 (50.9)
|
28 (49.1)
|
|
|
| Neonatal jaundice |
| Yes |
2 (28.6)
|
5 (71.4) |
1.51 (0.87-2.62) |
0.424ns
|
| No |
28 (52.8)
|
25 (47.2)
|
|
|
| Neonatal hypoglycemia |
| Yes |
2 (33.3)
|
4 (66.7) |
1.38 (0.73-2.59) |
0.671ns
|
| No |
28 (51.9)
|
26 (48.1)
|
|
|
| NICU admission |
| Yes |
3 (42.9)
|
4 (57.1) |
1.16 (0.58-2.34) |
>0.99ns
|
| No |
27 (50.9)
|
26 (49.1)
|
|
|
Among hypothyroid participants, newly diagnosed cases demonstrated higher odds of certain maternal complications, including preeclampsia, eclampsia, and spontaneous abortion (OR=1.81), compared to those with known hypothyroidism. However, no statistically significant differences were observed between the two groups for any maternal outcomes, including hypertension, cesarean section, anemia of pregnancy, gestational diabetes mellitus, or preterm delivery (p > 0.05) (Table 13).
Table 13: Comparison of maternal outcome of the hypothyroid group according to time of diagnosis (n=30). Data are presented as frequency (percentage), and odds ratio (OR) with 95% confidence interval (CI) was calculated to assess the association between variables. HTN: Hypertension; GDM: Gestational diabetes mellitus; C-section: Cesarean section. ns denotes not statistically significant (p > 0.05). Chi- square test and Fisher’s exact test were applied where appropriate.
|
Variables
|
Known hypothyroid group (n=13) |
New hypothyroid group (n=17) |
OR (95% CI) |
p-value
|
|
Frequency (%)
|
Frequency (%)
|
|
|
| Preeclampsia |
|
|
|
|
| Yes |
0 (0)
|
1 (100) |
1.81 (1.30-2.51) |
>0.99ns
|
| No |
13 (44.8)
|
16 (55.2)
|
|
|
| Eclampsia |
|
|
|
|
| Yes |
0 (0)
|
1 (100) |
1.81 (1.30-2.51) |
>0.99ns
|
| No |
13 (44.8)
|
16 (55.2)
|
|
|
| HTN |
|
|
|
|
| Yes |
2 (40)
|
3 (60) |
0.84 (0.12-5.99) |
>0.99ns
|
| No |
11 (44)
|
14 (56)
|
|
|
| Spontaneous abortion |
| Yes |
0 (0)
|
1 (100) |
1.81 (1.30-2.51) |
>0.99ns
|
| No |
13 (44.8)
|
16 (55.2)
|
|
|
| C-section |
|
|
|
|
| Yes |
5 (41.7)
|
7 (58.3) |
0.89 (0.20-3.91) |
0.880ns
|
| No |
8 (44.4)
|
10 (55.6)
|
|
|
| Anemia of pregnancy |
| Yes |
3 (37.5)
|
5 (62.5) |
0.72 (0.13-3.78 |
>0.99ns
|
| No |
10 (45.5)
|
12 (54.5)
|
|
|
| GDM |
|
|
|
|
| Yes |
1 (20)
|
4 (80) |
0.27 (0.02-2.77) |
0.355ns
|
| No |
12 (48)
|
13 (52)
|
|
|
| Preterm delivery |
| Yes |
1 (25)
|
3 (75) |
0.38 (0.03-4.24) |
0.613ns
|
| No |
12 (46.2)
|
14 (53.8)
|
|
|
Regarding fetal outcomes, newborns of mothers with newly diagnosed hypothyroidism showed higher odds of neonatal hypoglycemia and NICU admission (OR=2.00 each) compared to those with known hypothyroidism. In contrast, low birth weight was slightly more frequent among newborns of mothers with known hypothyroidism (OR=1.33). However, none of these differences were statistically significant (p > 0.05) (Table 14).
Table 14: Comparison of fetal outcome of the hypothyroid group according to time of diagnosis (n=30). Data are presented as frequency (n) and percentage (%). Fisher’s exact test was used for categorical variables when the expected cell count was less than 5. OR: odds ratio; CI: confidence interval; NICU: neonatal intensive care unit. s indicates statistically significant (p < 0.05), and ns indicates not significant (p ≥ 0.05).
|
Variables
|
Known hypothyroid group (n=13) |
New hypothyroid group (n=17) |
OR (95% CI) |
p-value
|
|
Frequency (%)
|
Frequency (%)
|
|
|
| Low birth weight |
| Yes |
1 (50)
|
1 (50) |
1.33(0.07-23.54) |
>0.99ns
|
| No |
12 (42.9)
|
16 (57.1)
|
|
|
| Neonatal jaundice |
| Yes |
1 (20)
|
4 (80) |
0.27 (0.02-2.77) |
0.355ns
|
| No |
12 (48)
|
13 (52)
|
|
|
| Neonatal hypoglycemia |
| Yes |
0 (0)
|
4 (100) |
2.00 (1.36-2.93) |
0.113ns
|
| No |
13 (50)
|
13 (50)
|
|
|
| NICU admission |
| Yes |
0 (0)
|
4 (100) |
2.00 (1.36-2.93) |
0.113ns
|
| No |
13 (50)
|
13 (50)
|
|
|
Among hypothyroid participants, maternal outcomes were compared based on first-trimester TSH levels (≤4 vs >4 mIU/L). Although some complications such as preeclampsia, eclampsia, spontaneous abortion, gestational diabetes mellitus, and preterm delivery were observed more frequently in participants with TSH >4 mIU/L, none of these differences were statistically significant (p > 0.05) (Table 15).
Table 15: Comparison of maternal outcome of the hypothyroid group according TSH level in first trimester (n=30). Data are presented as frequency (n) and percentage (%). Fisher’s exact test was used for categorical variables when the expected cell count was less than 5. TSH: thyroid-stimulating hormone; HTN: hypertension; GDM: gestational diabetes mellitus. s indicates statistically significant (p < 0.05), and ns indicates not significant (p ≥ 0.05).
|
Variables
|
TSH level in first trimester |
p-value
|
|
≤4
|
>4
|
|
|
Frequency (%)
|
Frequency (%)
|
|
| Preeclampsia |
|
|
|
| Yes |
0 (0)
|
1 (100) |
>0.99ns
|
| No |
13 (44.8)
|
16 (55.2)
|
|
| Eclampsia |
|
|
|
| Yes |
0 (0)
|
1 (100) |
>0.99ns
|
| No |
13 (44.8)
|
16 (55.2)
|
|
| HTN |
|
|
|
| Yes |
2 (40)
|
3 (60) |
>0.99ns
|
| No |
11 (44)
|
14 (56)
|
|
| Spontaneous abortion |
| Yes |
0 (0)
|
1 (100) |
>0.99ns
|
| No |
13 (44.8)
|
16 (55.2)
|
|
| C-section |
|
|
|
| Yes |
5 (41.7)
|
7 (58.3) |
0.880ns
|
| No |
8 (44.4)
|
10 (55.6)
|
|
| Anemia of pregnancy |
| Yes |
3 (37.5)
|
5 (62.5) |
>0.99ns
|
| No |
10 (45.5)
|
12 (54.5)
|
|
| GDM |
|
|
|
| Yes |
1 (20)
|
4 (80) |
0.355ns
|
| No |
12 (48)
|
13 (52)
|
|
| Preterm delivery |
|
|
|
| Yes |
1 (25)
|
3 (75) |
0.613ns
|
| No |
12 (46.2)
|
14 (53.8)
|
|
Similarly, fetal outcomes, including low birth weight, neonatal jaundice, neonatal hypoglycemia, and NICU admission, were more frequently observed among participants with TSH >4 mIU/L. However, no statistically significant differences were found between the two groups (p > 0.05) (Table 16).
Table 16: Comparison of fetal outcome of the hypothyroid group according TSH level in first trimester (n=30). Data are presented as frequency (n) and percentage (%). Fisher’s exact test was used for categorical variables when the expected cell count was less than 5. TSH: thyroid-stimulating hormone; LBW: low birth weight; NICU: neonatal intensive care unit. s indicates statistically significant (p < 0.05), and ns indicates not significant (p ≥ 0.05).
|
Variables
|
TSH level in first trimester |
p-value
|
|
≤4 mIU/L
|
>4 mIU/L
|
|
|
Frequency (%)
|
Frequency (%)
|
|
| LBW |
|
|
|
| Yes |
1 (50)
|
1 (50) |
>0.99ns
|
| No |
12 (42.9)
|
16 (57.1)
|
|
| Neonatal jaundice |
|
|
|
| Yes |
1 (20)
|
4 (80) |
0.355ns
|
| No |
12 (48)
|
13 (52)
|
|
| Neonatal hypoglycemia |
| Yes |
0 (0)
|
4 (100) |
0.113ns
|
| No |
13 (50)
|
13 (50)
|
|
| NICU admission |
|
|
|
| Yes |
0 (0)
|
4 (100) |
0.113ns
|
| No |
13 (50)
|
13 (50)
|
|
Among hypothyroid participants, maternal outcomes were compared according to first-trimester FT4 levels (<9.14, 9.14–16.00, and 16.01–23.18 pmol/L). Although variations in the distribution of complications such as preeclampsia, eclampsia, hypertension, spontaneous abortion, cesarean section, anemia of pregnancy, gestational diabetes mellitus, and preterm delivery were observed across the FT4 categories, none of these differences were statistically significant (p > 0.05) (Table 17).
Table 17: Comparison of maternal complications of the hypothyroid group according to FT4 level in first trimester (n=30). Data are presented as frequency (n) and percentage (%). Fisher’s exact test was used for categorical variables when the expected cell count was less than 5. FT4: free thyroxine; HTN: hypertension; GDM: gestational diabetes mellitus. s indicates statistically significant (p < 0.05), and ns indicates not significant (p ≥ 0.05).
|
Variables
|
FT4 level in first trimester |
|
p-value
|
|
<9.14
|
9.14-16.00 |
16.01-23.18
|
|
|
Frequency (%)
|
Frequency (%) |
Frequency (%)
|
|
| Preeclampsia |
|
|
|
|
| Yes |
0 (0)
|
1 (100) |
0 (0) |
>0.99ns
|
| No |
5 (19.2)
|
14 (53.8) |
7 (26.9)
|
|
| Eclampsia |
|
|
|
|
| Yes |
1 (100)
|
0 (0) |
0 (0) |
0.185ns
|
| No |
4 (15.4)
|
15 (57.7) |
7 (26.9)
|
|
| HTN |
|
|
|
|
| Yes |
0 (0)
|
3 (75) |
1 (25) |
0.185ns
|
| No |
5 (21.7)
|
12 (52.2) |
6 (26.1)
|
|
| Spontaneous abortion |
| Yes |
1 (100)
|
0 (0) |
0 (0) |
0.185ns
|
| No |
4 (15.4)
|
15 (57.7) |
7 (26.9)
|
|
| C-section |
|
|
|
|
| Yes |
1 (10)
|
5 (50) |
4 (40) |
0.492ns
|
| No |
4 (23.5)
|
10 (58.8) |
3 (17.6)
|
|
| Anemia of pregnancy |
| Yes |
2 (28.6)
|
4 (57.1) |
1 (14.3) |
0.720ns
|
| No |
3 (15)
|
11 (55) |
6 (30)
|
|
| GDM |
|
|
|
|
| Yes |
1 (20)
|
3 (60) |
1 (20) |
>0.99ns
|
| No |
4 (18.2)
|
12 (54.5) |
6 (27.3)
|
|
| Preterm delivery |
| Yes |
1 (33.3)
|
1 (33.3) |
1 (33.3) |
0.749ns
|
| No |
4 (16.7)
|
14 (58.3) |
6 (25)
|
|
Similarly, fetal outcomes, including low birth weight, neonatal jaundice, neonatal hypoglycemia, and NICU admission, showed variation across different FT4 level categories. However, no statistically significant associations were found between FT4 levels and fetal outcomes (p > 0.05) (Table 18).
Table 18: Comparison of fetal outcome of the hypothyroid group according to FT4 level in first trimester (n=30). Data are presented as frequency (n) and percentage (%). Fisher’s exact test was used for categorical variables when the expected cell count was less than 5. FT4: free thyroxine; NICU: neonatal intensive care unit. s indicates statistically significant (p < 0.05), and ns indicates not significant (p ≥ 0.05).
|
Variables
|
FT4 level in first trimester |
|
p-value
|
|
<9.14
|
9.14-16.00 |
16.01-23.18
|
|
|
Frequency (%)
|
Frequency (%) |
Frequency (%)
|
|
| Low birth weight |
| Yes |
1 (50)
|
0 (0) |
1 (50) |
0.188ns
|
| No |
4 (16)
|
15 (60) |
6 (24)
|
|
| Neonatal jaundice |
| Yes |
0 (0)
|
3 (100) |
0 (0) |
0.390ns
|
| No |
5 (20.8)
|
12 (50) |
7 (29.2)
|
|
| Neonatal hypoglycemia |
| Yes |
1 (25)
|
3 (75) |
0 (0) |
0.609ns
|
| No |
4 (17.4)
|
12 (52.2) |
7 (30.4)
|
|
| NICU admission |
| Yes |
1 (25)
|
3 (75) |
0 (0) |
0.609ns
|
| No |
4 (17.4)
|
12 (52.2) |
7 (30.4)
|
|
Comparison of first-trimester TSH levels with maternal complications showed that mean TSH levels were significantly higher among participants with anemia of pregnancy compared to those without anemia (p=0.038). In contrast, no statistically significant differences in TSH levels were observed for other maternal complications, including preeclampsia, hypertension, gestational diabetes mellitus, and preterm delivery (p > 0.05) (Table 19).
Table 19: Comparison of TSH level regarding maternal complications of the study participants (N=60). Data are presented as mean ± standard deviation (SD) and median. The Mann–Whitney U test was used for non-normally distributed data. TSH: thyroid-stimulating hormone; HTN: hypertension; GDM: gestational diabetes mellitus. s indicates statistically significant (p < 0.05), and ns indicates not significant (p ≥ 0.05).
|
Maternal Complications
|
TSH level in first trimester |
p-value
|
|
Mean±SD
|
Median
|
|
| Pre-eclampsia |
|
|
|
| Yes |
4.55±3.32
|
4.55 |
0.498ns
|
| No |
7.04±17.64
|
2.30
|
|
| HTN |
|
|
|
| Yes |
4.06±2.80
|
3.10 |
0.469ns
|
| No |
7.34±18.43
|
2.30
|
|
| Anemia of pregnancy |
|
|
|
| Yes |
8.91±11.73
|
3.97 |
0.038s
|
| No |
6.52±18.45
|
2.10
|
|
| GDM |
|
|
|
| Yes |
5.89±6.24
|
4.30 |
0.338ns
|
| No |
7.12±18.52
|
2.30
|
|
| Preterm Delivery |
|
|
|
| Yes |
4.18±2.58
|
4.05 |
0.352ns
|
| No |
7.27±18.27
|
2.30
|
|
Similarly, no statistically significant differences in first-trimester TSH levels were found between participants with and without fetal complications, including low birth weight, neonatal jaundice, neonatal hypoglycemia, and NICU admission (p > 0.05) (Table 20).
Table 20: Comparison of TSH level regarding fetal complications of the study participants (N=60). Data are presented as mean ± standard deviation (SD) and median. The Mann–Whitney U test was used for non-normally distributed data. TSH: thyroid- stimulating hormone; NICU: neonatal intensive care unit. s indicates statistically significant (p < 0.05), and ns indicates not significant (p ≥ 0.05).
|
Fetal Complications
|
TSH level in first trimester |
p-value
|
|
Mean ± SD
|
Median
|
|
| Low Birth Weight |
|
|
|
| Yes |
3.43 ± 1.72
|
2.70 |
0.517ns
|
| No |
7.15 ± 17.79
|
2.30
|
|
| Neonatal Jaundice |
|
|
|
| Yes |
4.76 ± 2.92
|
4.50 |
0.178ns
|
| No |
7.25 ± 18.44
|
2.30
|
|
| Neonatal Hypoglycemia |
|
|
|
| Yes |
7.12 ± 6.88
|
6.60 |
0.239ns
|
| No |
6.94 ± 18.19
|
2.30
|
|
| NICU |
|
|
|
| Yes |
6.29 ± 6.66
|
6.30 |
0.428ns
|
| No |
7.05 ± 18.34
|
2.30
|
|
Discussion
This prospective observational study included 60 pregnant women, with and without hypothyroidism, recruited through purposive sampling according to predefined inclusion and exclusion criteria at BIRDEM General Hospital. The majority of participants (46.7%, n=28) were aged between 24–29 years, with a mean age of 26.55 ± 4.01 years.
This finding is comparable to the study conducted by Gaikwad and Salvi, where the mean age of participants was reported as 25.56 years, indicating that hypothyroidism in pregnancy is frequently observed in women within the mid-twenties reproductive age group [8].
A significantly higher proportion of hypothyroid participants reported a family history of thyroid disease (75%, n=12) compared with euthyroid participants (25%, n=4). This difference was statistically significant (p < 0.05) with an odds ratio of 1.83 (95% CI:1.16–2.88), suggesting a possible genetic or familial predisposition. Similar observations were reported by Kiran et al., who found that 15.3% of pregnant women with hypothyroidism had a family history of thyroid disease, primarily among first-degree relatives [9].
Regarding gravidity, our study demonstrated an equal distribution between primigravida and multigravida participants. This observation differs from several previous studies. For instance, Gaikwad and Salvi reported a higher proportion of primigravida cases [8], while Kumar et al. observed a significantly higher prevalence of hypothyroidism among primigravida women (53.7%) [10]. In our cohort, most participants (73.3%) had no family history of thyroid disease and only 3.3% had a history of abortion, which is comparable to findings reported by Mahadik, Choudhary and Roy, where both family history of thyroid disorders and recurrent miscarriage were observed in approximately 4.5% of cases [11].
The majority of participants in the present study were asymptomatic (98.3%). Only one patient exhibited classical symptoms of hypothyroidism, including facial puffiness, cold intolerance, constipation, and dry skin, and only one participant had a palpable thyroid gland. This highlights the often subclinical nature of thyroid dysfunction during pregnancy. Similarly, Kiran et al. reported a small number of cases with Hashimoto’s thyroiditis presenting with goiter [9].
In the present study, half of the participants (50%) were euthyroid and served as the control group. Among the remaining participants, 28.33% were newly diagnosed with hypothyroidism during pregnancy, while 21.67% had a known diagnosis prior to pregnancy. These findings are partially consistent with observations from Sreedevi et al., who reported newly detected hypothyroidism in 11% and previously diagnosed hypothyroidism in 3.8% of pregnant women [12]. Similarly, Gaikwad and Salvi reported that 30.7% of hypothyroid cases were detected during pregnancy screening, while the majority (69.3%) were diagnosed before the current pregnancy [8].
Among the 30 hypothyroid patients in our cohort, 13 had been diagnosed prior to pregnancy and were euthyroid due to levothyroxine replacement therapy. Among the newly diagnosed cases, 12 were classified as subclinical hypothyroidism (SCH) and 5 as overt hypothyroidism. Comparable findings were reported by Sreedevi et al., where the overall prevalence of hypothyroidism was 14.8%, including both newly diagnosed and previously known cases [12]. In addition, our analysis demonstrated significant differences in TSH levels across trimesters among known hypothyroid, subclinical hypothyroid, and overt hypothyroid groups (p < 0.05).
Autoimmune thyroid markers also showed significant variation between groups. Among patients diagnosed prior to pregnancy, the majority (76.9%) were anti-TPO antibody negative, whereas 66.7% of participants with newly diagnosed SCH were anti-TPO antibody positive. This difference was statistically significant (p < 0.05). Additionally, anti-thyroglobulin antibodies were positive in 58.3% of SCH cases. Previous studies support these observations: Dhanwal et al. reported anti-TPO positivity in approximately 40% of hypothyroid pregnant women [13], while Reh A et al. found anti-TPO positivity in 57.1% of subclinical hypothyroid cases [14].
In our cohort, demographic and physiological variables such as age, BMI, heart rate, systolic blood pressure, and diastolic blood pressure were not significantly different between hypothyroid and euthyroid groups. However, TSH levels differed significantly among euthyroid, newly diagnosed hypothyroid, and known hypothyroid groups (p < 0.05), with the highest levels observed in newly diagnosed cases.
Adverse maternal outcomes were relatively common among hypothyroid participants. The most frequent complications included cesarean delivery (n=12), anemia of pregnancy (n=8), gestational diabetes mellitus and hypertension (n=5), and preterm delivery (n=4). Neonatal complications included neonatal jaundice (n=5), neonatal hypoglycemia, and NICU admission (n=4). These findings are consistent with the cohort study conducted by Lee et al., which reported higher incidences of preterm labor, cesarean delivery, gestational diabetes, and prematurity among hypothyroid pregnancies [15].
Among anti TPO antibody positive hypothyroid women, adverse outcomes were more pronounced. Anemia occurred in 62.5% of cases, cesarean delivery in 41.7%, gestational diabetes in 60%, preterm delivery in 75%, and hypertension in 60%. Neonatal jaundice occurred in all cases (100%) and was statistically significant (p < 0.05), with a high proportion of NICU admissions and neonatal hypoglycemia. Similar associations between anti TPO positivity and adverse pregnancy outcomes were reported by Gupta et al. and Feki et al. [16,17].
Our findings also demonstrated an increased risk of several maternal complications in hypothyroid pregnancies compared with euthyroid pregnancies, including spontaneous abortion (OR 2.03), eclampsia (OR 1.62), anemia of pregnancy (OR 1.51), hypertension (OR 1.38), preterm delivery (OR 1.30), and gestational diabetes (OR 1.15). Similar trends were observed in the study by Kumar et al., who reported higher incidences of preeclampsia, anemia, abortion, and other obstetric complications among hypothyroid women [10].
Neonatal complications were also more frequent among infants born to hypothyroid mothers, including neonatal jaundice (OR 1.51), neonatal hypoglycemia (OR 1.38), low birth weight (OR 1.35), and NICU admission (OR 1.16). Previous studies such as Mahadik, Choudhary and Roy have similarly reported increased risks of low birth weight and NICU admission among neonates born to hypothyroid mothers [11].
Furthermore, newly diagnosed hypothyroid women had a higher risk of preeclampsia, eclampsia, and spontaneous abortion (OR 1.81) compared with women with known hypothyroidism receiving treatment. Neonates born to newly diagnosed hypothyroid mothers also had a higher risk of NICU admission and neonatal hypoglycemia (OR 2.00). However, these associations were not statistically significant (p > 0.05).
Finally, maternal and fetal outcomes were not significantly associated with different first-trimester TSH or FT4 cutoff values in our study (p > 0.05). These findings align with studies by Joshi et al. and Poulasouchidou et al., which also reported no significant association between maternal thyroid hormone levels and adverse pregnancy outcomes within certain TSH thresholds [18,19].
References
- Chang DLF, Pearce EN (2013) Screening for maternal thyroid dysfunction in pregnancy a review of the clinical evidence and current guidelines. J Thyroid Res. [crossref]
- Taylor PN, Albrecht D, Scholz A, Gutierrez-Buey G, Lazarus JH, Dayan CM et (2018) Global epidemiology of hyperthyroidism and hypothyroidism. Nat Rev Endocrinol. [crossref]
- Korevaar TIM, Medici M, Visser TJ, Peeters RP (2017) Thyroid disease in pregnancy new insights in diagnosis and clinical Nat Rev Endocrinol. [crossref]
- Shahid MM, Ferdousi S (2021) Prevalence and incidence of thyroid disorder during pregnancy in Bangladesh a tertiary care hospital-based Sri Lanka J Diabetes Endocrinol Metab
- Ferdousi MA, Al Baki A (2021) Prevalence and maternal effects of hypothyroidism in Chattagram Maa-O-Shishu Hosp Med Coll J. [crossref]
- Alexander EK, Pearce EN, Brent GA, Brown RS, Chen H, Dosiou C et al. (2017) 2017 guidelines of the American Thyroid Association for the diagnosis and management of thyroid disease during pregnancy and the postpartum. Thyroid. [crossref]
- De Groot L, Abalovich M, Alexander EK, Amino N, Barbour L, Cobin RH et (2012) Management of thyroid dysfunction during pregnancy and postpartum an Endocrine Society clinical practice guideline. J Clin Endocrinol Metab. [crossref]
- Gaikwad V, Salvi PN, Nandini R (2022) Study of trimester-wise effect of hypothyroidism in pregnancy and its materno-fetal Indian J Public Health Res Dev. [crossref]
- Kiran Z, Sheikh A, Malik S, Meraj H, Masood M, Ishtiaq O et al. (2019) Maternal characteristics and outcomes affected by hypothyroidism during BMC Pregnancy Childbirth. [crossref]
- Kumar R, Bansal R, Shergill HK, Garg P (2023) Prevalence of thyroid dysfunction in pregnancy and its association with fetomaternal outcomes a prospective observational Clin Epidemiol Glob Health. [crossref]
- Mahadik K, Choudhary P, Roy PK (2020) Study of thyroid function in pregnancy and its fetomaternal outcome a prospective observational study. BMC Pregnancy Childbirth. [crossref]
- Sreedevi DP, Bhavani DK, Rohini DA, Singh N, Badikela D, Tharani (2022) Study on prevalence and fetomaternal outcome in hypothyroidism in J Clin Med
- Dhanwal DK, Bajaj S, Rajput R, Subramaniam KA, Chowdhury S, Bhandari R et al. (2016) Prevalence of hypothyroidism in pregnancy an epidemiological study from Indian J Endocrinol Metab. [crossref]
- Reh A, Grifo J, Danoff A (2010) What is a normal thyroid-stimulating hormone level? Effects of stricter thresholds on pregnancy outcomes after in vitro Fertil Steril. [crossref]
- Lee RH, Spencer CA, Mestman JH, Miller EA, Petrovic I, Braverman LE et al. (2009) Free T4 immunoassays are flawed during pregnancy. Am J Obstet Gynecol. [crossref]
- Gupta T, Mani P, Gupta A, Yadav L (2019) Neonatal and fetal effects of antithyroid peroxidase positivity in hypothyroidism in pregnancy a hospital-based Indian J Child Health
- Feki M, Omar S, Menif O, Tanfous NB, Slimane H, Zouari F et al. (2008) Thyroid disorders in pregnancy frequency and association with obstetrical complications. Clin Biochem. [crossref]
- Joshi D, Dewan R, Bharti R, Sharma S, Gupta A, Dutta S et (2015) Fetomaternal outcome using new screening criteria of serum TSH. J Clin Diagn Res. [crossref]
- Poulasouchidou MK, Goulis DG, Poulakos P, Mintziori G, Athanasiadis A, Grimbizis GF et al. (2012) Prediction of maternal and neonatal adverse outcomes in hypothyroid Hormones Athens. [crossref]