Author Archives: author

From the Granite-Pegmatite Solvus Curves to Extreme Element Enrichment Indicated by Gaussian, Lorentzian, and Voigt Distributions

DOI: 10.31038/GEMS.2026821

Abstract

The Variscan Ehrenfriedersdorf tin deposit (Germany) is a classic example of extreme enrichment of Sn and associated elements in granite–pegmatite systems. This study investigates the statistical distributions of major and trace elements derived from melt and fluid inclusion data, with particular emphasis on Gaussian, Lorendian, Voigt, and idealized Dirac-like distributions. These distributions provide quantitative insight into the physicochemical processes governing ore formation. A key result is the identification of weakly asymmetric pseudobinary solvus curves in the silicate melt–H2O (±B2O3) system, defined by water concentration versus temperature. Both granite- and pegmatite-related solvus curves exhibit closely similar critical points (≈25–30 % H₂O), despite differences in bulk composition. The region around these critical points coincides with pronounced enrichment of economically important elements, whose concentrations follow characteristic Gaussian, Lorendian, or mixed (Voigt) distributions when plotted against water content of the melt inclusion glass. Gaussian distributions reflect relatively well-mixed systems governed by multiple small-scale processes, whereas Lorendian distributions indicate rare but powerful enrichment events driven by lifetime-limited, interaction-based processes. The frequent occurrence of Lorendian behavior for elements such as Sn, Li, Be, Ta, and W points to episodic supercritical fluid or melt pulses. Extremely high, δ-like “runaway” concentrations are interpreted as the result of trapping stoichiometric daughter minerals during the transition from supercritical to undercritical conditions. These observations demonstrate that solvus geometry, element distribution functions, and critical phenomena are fundamentally linked. The data provide compelling evidence that supercritical, water-rich melts and fluids—likely derived from mantle–crust interaction—play a decisive role in redistributing elements and forming ore in the Ehrenfriedersdorf deposit and comparable Variscan systems.

Introduction

In recently published papers [1,2], in part results from melt and fluid inclusions were used to explain the formation of Sn, Ta, Nb deposits by extraction at the magmatic stages in porphyry deposits, the formation of pegmatites, and the growth of gems from extremely hard fluids (Li, Be, and B). This author and coauthors use a very different model to explain the formation of mineral deposits in general. According to the first author’s research in the last 30 years, especially after the development of a method for the determination of water in glasses and melt inclusions [3], an idea about the extreme element enrichment near the solvus crest of the pseudo binary silicate melt–water system in the form of Gaussian, Lorentzian, and Voigt element distributions was born. The Gaussian, Lorentzian, and Voigt distributions are key to understanding the behavior of silicate melts during ore-forming processes in the famous tin deposit of Ehrenfriedersdorf, Germany. Basic results are in Thomas et al. 2019 [4] and 2022 [5]. Figure 1 shows the generalized pseudobinary solvus curves for the Ehrenfriedersdorf granites and pegmatites. The solvus of the granites (blue curve) of the Ehrenfriedersdorf area is remarkably small due to high concentrations of fluorine, phosphorus, and alkalies (Li, Na, K, Rb, Cs). This curve shows some similarity to the phase diagram of the haplogranite-H2O system according to Bureau and Keppler (1999) [6], due to the strong deviation of the actual composition from the haplogranite system, resulting in significantly lower pressure (see also Sowerby and Keppler, 2002) [7]. The water content at the critical points (CP) of both curves (850°C, 25 % H2O and 712°C, 27.7 % (H2O+B2O3) is nearly identical.

Figure 1: Pseudobinary solvus curves of evolved granites (blue) and pegmatites (red) for the Ehrenfriedersdorf tin deposit. CP – critical point. The critical point for the F-rich granites is 850°C and 25% H2O, and for the pegmatites, the CP is 712°C and 27.7% (H2O + B2O3).

The solvus curves of the granites and pegmatites determine the main processes for the enrichment of ore-forming and rare elements. As we will show below, the region around the critical point is where the crucial processes occur. To discuss the processes, we will first briefly define the relevant element distribution types in our case, including the Diracian distribution used by Vigneresse (2026) [2].

Gaussian, Lorentzian, Voigt, and Diracian distributions (see Linford, 2014 [8], and References in it)

Gaussian Distribution – “Normal Distribution” Natural Variability

The Geochemical meaning of a Gaussian (normal) distribution indicates that many small, random, additive processes produce element variability. That is the most common pattern in geochemistry. This kind of distribution results from measurement noise and multiple small-scale processes adding up (Central Limit Theorem). A Gaussian pattern suggests the system was relatively well-mixed and governed by many equal, independent factors – not dominated by rare or extreme processes. The standard Gaussian frequency distribution (distribution of an element) will not be considered here. We consider, in the following, the frequency distribution relative to another reference of the same sample (melt inclusion), for example, water (H2O) or (H2O+B2O3), which holds for the Lorentzian distribution (see further below). All points forming the corresponding curves are Gaussian distributed, which results from instrumental noise, sample heterogeneity, and counting statistics. In our case, the peak center corresponds to the sulvus crest, the water concentration at the critical point of the solvus curve. The area under the curve is proportional to the element concentration – giving us, in our case, information on the deviation from the corresponding Clarke concentration (see Rösler and Lange, 1975) [9].

Lorentzian Distribution — Presence of Outliers or Resonant Processes

A Lorentzian distribution has fatter tails than a Gaussian. That indicates occasional large excursions (outliers) and processes dominated by a few strong influences rather than many small ones. Typical causes are supercritical pulses that strongly enrich a trace element, forming a sharp element anomaly. For Lorentzian processes, “lifetime” effects (analogous to Lorentzian broadening in spectroscopy) are characteristic. A Lorentzian pattern implies that rare but powerful events influenced the chemical system. The “heavy tails” correspond to unusually high concentrations due to supercritical pulses. A Lorentzian distribution of an element indicates lifetime-limited or interaction-driven processes. It is important to note that, in our case, the Lorentzian curve is not a classic peak but a curve over another element concentration. Typical causes of the Lorentzian distribution are pressure- or collision-broadening and strong matrix or chemical interactions. The “peak” height becomes unreliable, but the area under the curve remains proportional to concentration.

Voigt Distribution

A Voigt profile is a convolution of Gaussian and Lorentzian effects, meaning both random noise and physical broadening mechanisms are important. The Voigt distribution, as a realistic concentration model, provides information about the instrumental noise (Gaussian component) and the physical or chemical broadening (Lorentzian component).

Dirac (δ) Distribution — Highly Uniform or Idealized Single-Value Concentrations

A Dirac delta distribution represents all values concentrated at one exact number – a perfect spike or an idealized, infinitely sharp line. That is, in our case, not attainable. In reality, this almost never occurs, but it is used conceptually to represent single transition energies or states in analog physical systems (e.g., δ-like spectral lines in the absence of broadening). A Dirac-like pattern suggests a geochemical reservoir with practically no heterogeneity, a mineral phase with stoichiometric composition, and an element controlled by a single dominant process (supercritical process) with negligible variability. An example is the appearance of ideal stoichiometric, however unusual, minerals in melt and fluid inclusions. In natural datasets, a δ distribution rarely occurs; it is more of a reference ideal. We call this distribution here because Vigeresse (2026) [2] used it for his very schematic interpretation.

Typical Examples of Distributions Obtained from Melt Inclusions in Quartz of Pegmatite and Pegmatite-Like Rocks from the Ehrenfriedersdorf Sn Deposit

It is important here that we correlate the distribution of trace and major elements with the water content of the melt inclusions, determined by micro-Raman spectroscopy [3]. The trace and major elements were determined using different analytical methods (microprobe, SIMS, LA-ICP-QMS, synchrotron radiation XRF, and Raman spectroscopy) – see Borisova et al. (2012) [10] and Thomas et al. (2019, 2022) [4,5]. First, we show the Rb vs. H2O distributions for a pegmatite from the Sauberg mine near Ehrenfriedersdorf, Central Erzgebirge, Germany. We see a distribution of Rb vs. H2O in melt and fluid inclusions, forming a solvus-like curve in the silicate-water range (up to about 50% H2O), and a distribution of Rb in the fluid phase at high water concentration (filled triangles).

A similar relationship holds for the B2O3-H2O and F-H2O systems of the Ehrenfriedersdorf pegmatite [11]; Thomas and Rericha, 2023). That means at least that the solvus curve obtained for the pegmatites related to the Variscan granites of the Ehrenfriedersdorf region is determined primarily by H2O, B2O3, Rb as well as by F. We will see that at least all elements forming Gaussian and Lorentzian curves over the water concentration take part in the formation of the characteristic solvus curves, because this refrains from the region around the critical point, the fringes fit well with the solvus curves. A similar plot result for antimony (Sb) vs. water. The Sb data for this plot were obtained using the Synchrotron radiation XRF technique with Monte Carlo-based quantification [12,13]. This plot clearly shows that trace elements like Sb also follow the solvus crest of the pegmatite-H2O system. In the fluid part of the system, even 700-900 ppm Sb is possible [10], obviously related to chlorine complexes.

We will later see that, around the critical point of the solvus, Gaussian and Lorentzian element distribution curves are sitting. That means the solvus, the Gaussian, and the Lorentzian curves are not independent. Figures 2 and 3 clearly show that, generally, on the right side of the solvus curves, a fluid phase coexists with the corresponding curve [14]. That means the coexistence of two melt inclusion types (A- and B-type MI) with fluid phases containing different daughter phases, often Al- and Si-bearing (topaz, muscovite). Now we will show a Gaussian distribution curve. As an example of such a Gaussian element distribution, see Figure 4: the distribution of Be versus water content in the measured melt inclusions.

Figure 2: Plot of the Rb concentration in melt and fluid inclusions versus the water content. Black points represent the so-called A-type melt inclusions, and half-filled points represent the water-rich B-type melt inclusions, and the black triangles stand for fluid inclusions. The isotherms are drawn in for both melt inclusion types.

Figure 3: Distribution of antimony (Sb) in melt (red) and fluid (grey line) inclusions.

Figure 4: Gaussian distribution of Be versus the water content of melt inclusions in pegmatite quartz from Ehrenfriedersdorf (beryl-quartz vein in the Sauberg mine). The center is at 26.4% H2O, the half-maximum distance is at 9.5% water, the maximum of the Gaussian curve is at 12075 ppm Be, and the offset corresponds to 214 ppm Be. The offset represents the regional enrichment of Be for the given mineralization.

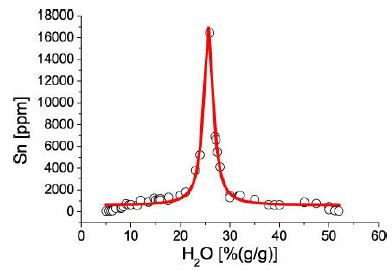
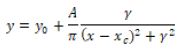
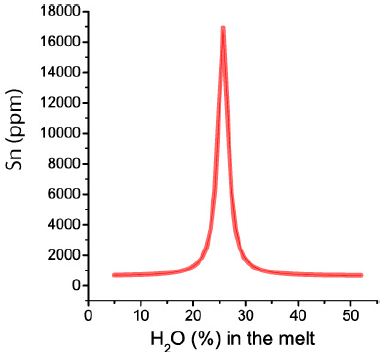
Gaussian curves are rare in Ehrenfriedersdorf Sn deposits. Most of the studied elements follow a Lorentzian distribution, as shown in Figure 5. The relationship between the solvus curve of pegmatite-like mineralizations is presented by Thomas and Rericha (2024) [15]. In this paper, the authors also establish a clear relationship between the solvus curve and the Lorentzian distribution of Sn, as well as a generalization of the Lorentzian distribution using normalized element concentrations CA/CA-crit versus the normalized water concentration of the solvus H2O/H2O-crit. This correlation enables the estimation of the Lorentzian distribution of any element from only a couple of measurements (Table 1).

Figure 5: The figure shows the Lorentzian distribution of Sn vs. H2O, and in Table 1 are the resulting fitting data summarized. The center (25.7 % H2O) is the position of the peak’s center, which corresponds to the critical point of the solvus curve and the maximum (height) of the Sn concentration (here, 16400 ppm Sn). Width is the half-width at half-maximum (HWHM). The offset refers to the displacement of the Lorentzian curve from its original position along the x-axis (H2O concentration) corresponding to 644 ppm.

Table 1: Lorentzian fit of Sn, determined in silicate melt inclusions from the pegmatite system of the Sauberg mine near Ehrenfriedersdorf (46 measuring points). Each point is the mean of 5 to 10 single measurements. The values in the second data row are calculated (see Thomas 2025a).

Area Center Width Offset Height R2
A xc w yo Io
Measured 57799 ppm2 25.7% H2O 2.3% H2O 644 ppm Sn 16295 ppm Sn 0.9843
Calculated 58871 ppm2 25.7% H2O 2.3% H2O (603 ppm Sn) 16295 ppm Sn 1.0000

Thomas (2025a) [16] also discusses the Lorentzian distribution in more detail. In this contribution, the Lorentzian data for the 10 elements Be, B, P, Cl, Zn, As, Cs, Sn, Ta, and W are tabulated. More elements of other mineralizations are in Thomas et al. 2019, 2022. Here, we will include the results of another element, which is of great economic significance at the time: Li.

Table 2 summarizes the Lorentzian data for Li shown in Figure 6. According to Rösler and Lange (1975) [9], the mean of granitic rocks is 40 ppm.

Table 2: Lorentzian fit of Li, determined in silicate melt inclusions from the pegmatite system of the Sauberg mine near Ehrenfriedersdorf.

Area Center Width Offset Height R2
A xc w yo Io
273330 ppm2 25.1% H2O 6.53% H2O 1363 ppm Li 26660 ppm Li 0.9821

Figure 6: Lorentzian distribution of Li versus the water content in melt inclusions in pegmatite quartz from the Sauberg mine, Ehrenfriedersdorf/Germany.

In contrast to Sn, the width of Li is almost three times as large, and the value at the center (water content at the critical point) is 666.5 times that of the normal granite. The large width of the Li curve is a hint for the participation of Li in the formation of the solvus curve. Sometimes we also observe overlapping Lorentzian curves for a single element, as shown here for Be (Figure 7 and Table 3) [5].

Figure 7: Distribution of Be in some melt inclusions in pegmatite quartz from Ehrenfriedersdorf (sample Qu8). The sum curve (grey) results from the overlapping of two Lorentzian components caused by different Be species in the melt inclusions. Peak 1 is representative of beryllonite [NaBePO4], and peak 2 (blue) is for hambergite [Be2BO3(OH,F)] as a daughter mineral.

Table 3: Lorentzian fit parameters for both Be curves.

Center Width Height
Peak 1 25.5% H2O 7.5% H2O 12840 ppm Be
Peak 2 31.0% H2O 4.8% H2O 4280 ppm Be

In a single-melt inclusion, we found up to 71500 ppm Be as a large daughter crystal of beryllonite. That would, after the classic idea, be a (however real!) runaway value. This observation is typical for Lorentzian element distribution curves: peak height becomes unreliable. We see that the positions of the second Lorentzian Be peaks shift to higher H2O values with increasing bulk volatile concentration. This observation confirms the term “critical range.”

The fourth distribution, the Diracian distribution, is characterized by a signal that represents an idealized, infinitely sharp line. We often found extremely high concentrations at the centers of the Lorentzian distributions (mostly at the solvus crest). Such behavior is very typical for the Ehrenfriedersdorf case and does not approach the pure Lorentzian distribution. The distribution of tin (Figure 5) already suggests such a distribution. Also, the high Be value of 71500 ppm Be in the case of the first peak form, at least a so-called runaway value, which cannot be ignored. In the past, we often encountered so-called runaway data during our analytical work, which irritated us and others because it was mostly uncorrelated with other elements. See the extended discussion of our data by London and Evensen (2002) [17]. The first such example we found during the development of the first SYXRF-microprobe spectrometer at DESY/Hamburg in 1995, Thomas et al. (1995) [18], on a melt inclusion in quartz from the Sauberg mine near Ehrenfridersdorf. In the first studied melt inclusion, we found high Rb and Cs concentrations and extremely high Sn values, which could be traced to a cassiterite daughter mineral phase, as indicated by microscopic studies.
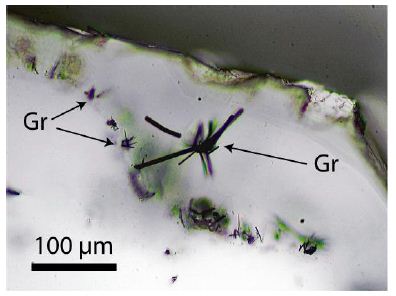
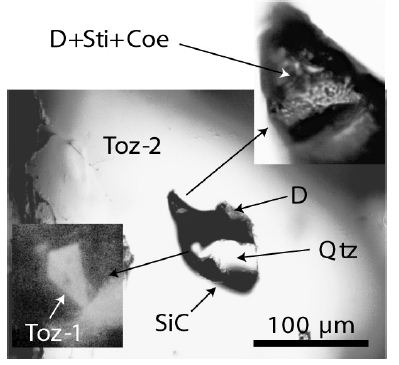
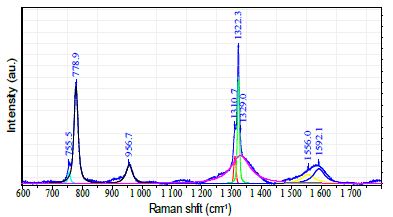
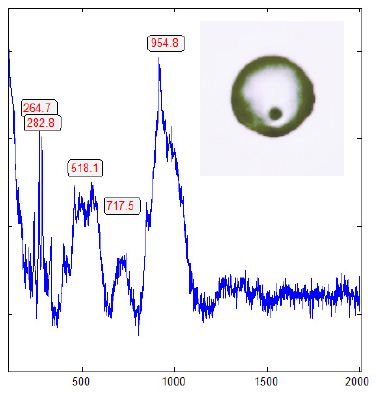
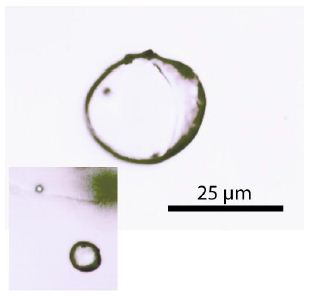
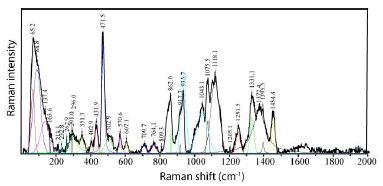
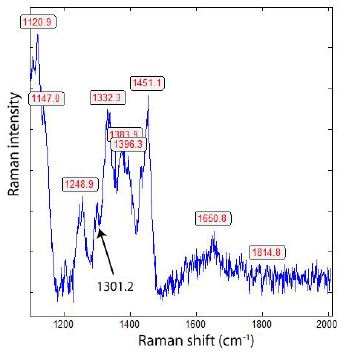
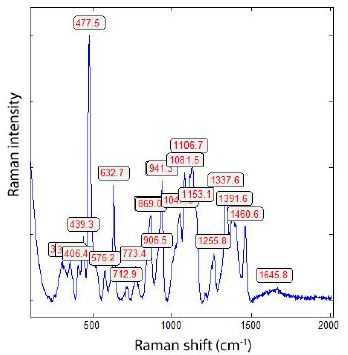
The so-called “Runaway-Points” can be explained very simply: At the transition of a supercritical fluid to the undercritical state, insoluble cassiterite microcrystalls form, are suspended in the melt, and are trapped by the change. A similar process can also be observed in the case of Be distribution, where different large beryllonite daughter crystals are trapped quite by chance. A completely different case is the sporadic occurrence of diamond crystals in the typical greisen rock of the Ehrenfriedersdorf tin deposits. The appearance of spherical diamonds (Raman peak at 1326 ± 9.8 cm-1, n = 13 different crystals) in such a typical crustal rock is clear proof of interaction with supercritical fluids coming from the Earth’s mantle. Another or additional explanation for the presence of diamonds in crustal rocks is the formation of extreme shock-like pressure at the transition of a supercritical fluid or melt into the undercritical state (see the whisker-like diamond needles in quartz crystals from Zinnwald, Thomas (2025b) [19]. Another surprising discovery is the presence of graphite and diamond aggregates or crystals (see Figure 8) in quartz, characterized by numerous melt and fluid inclusions, as the second explanation underline (Table 4).

Figure 8: Raman spectrum of diamond (D)-containing graphite (Gr) in pegmatite quartz (Qu8) from the Sauberg mine near Ehrenfriedersdorf. The leaf-like graphite (right at the top) is 80 µm deep from the sample surface. The FWHM is 77 cm-1 (FWHM is Full Width at Half Maximum).

Table 4: Results of the Raman spectroscopic determination of diamond in pegmatite quartz (Qu8) from the Saubach mine near Ehrenfriedersdorf, Central-Erzgebirge/ Germany.

Sample Mean 1s FWHM 1s n
leaf-like graphite 1324.4 2.9 75.9 5.0 10

1s: Standard Deviation, FWHM: Full Width at Half Maximum, n: Measured Points (at different points of the leaf; see Figure 8).

Discussion

In this contribution, we show, using the well-studied example from Ehrenfriedersdorf/Germany, that melt inclusions provide important information about element distribution. During the determination of water by Raman spectroscopy [3], a natural example of a solvus curve (water versus temperature) is identified for the first time. Further studies on the same example (Ehrenfriedersdorf) brought more information about the behavior of a couple of elements. Important ore-deposit-forming elements exhibit characteristic distributions that are Gaussian, Lorentzian, or mixed, such as the Voigt distribution. Very important points are the critical ones. It is remarkable that this point ± coincidence with all solvus, Gaussian, Lorentzian, and Voigt curves. Why is that so?. It is well known that, above the critical point, the matter is in the supercritical state. The presence of a Gaussian and/ or Lorentzian distribution indicates that we have not only a sharp peak but also a relatively large temperature range, from about 850 to 600°C (see Figure 1). Unusual physicochemical properties characterize this range: extremely low viscosity and extremely high diffusivity (see Thomas et al., 2019 [4], 2022 [5], 2023 [20]). These conditions enable the extreme enrichment of normally rare elements. By the transition of the supercritical fluid or extremely water-rich melt from the mantle region into under-critical conditions at the crustal level, a first crystallization of ore-forming minerals occurs – the trapping of such minerals (e.g., cassiterite, beryllonite, hambergite, and others with stochiometric composition) follows the Lorentzian distribution. A single dominant process with negligible variability controls such minerals. Similar processes also occur during a high-temperature hydrothermal stage (see Borisova et al. 2012) [10]: the trapping of Zn-rich minerals (88, 121, and 46,049 ppm) in two fluid inclusions, only some micrometers apart, in pegmatite quartz. The trapped mineral phase, according to Raman (room temperature), is a daughter crystal of K2[ZnCl4] (flinteite) in both fluid inclusions in pegmatite quartz (Qu8) from the Ehrenfriedersdorf tin deposit, with high Rb, Cs, and Br concentrations in the flinteite formula.

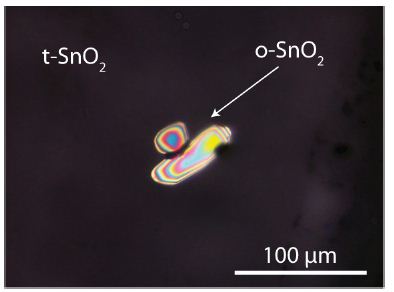
The finding of co-trapped high-pressure minerals, including diamond, moissanite, coesite, lonsdaleite, kumdykolite, reidite, as well as high-pressure orthorhombic cassiterite, in nearly all parts of the Ehrenfriedersdorf deposit (diamonds and BN also in the greisen part), underscores the significance of the supercritical state and the decisive role of supercritical fluids or extreme water-rich melts (see e.g. Thomas and Trinkler, 2024) [21]. First hints of such a scenario were discussed by Schütze et al. 1983 [22]. These authors, based on their studies, conclude that the inducing processes are subduction- or subfluence-related and involve older ocean crust. Our studies provide evidence that supercritical, water-rich melts and/or fluids have a significant influence on the entire Variscan ore mineralization in the Central Erzgebirge and elsewhere. The often-cited evidence that, for example, a large part of the tin is transported as orthorhombic cassiterite underscores the active interaction between mantle and crust. By the existence of orthorhombic cassiterite crystals in the supercritical fluid, it is plausible that this fluid is also saturated in Sn. That is compatible with the new discussion that a lot of water is concentrated in the deep Earth (see, for example, Mohn et al., 2025) [23-25] and may move episodically from the mantle deeps into the crust (see also Thomas et al., 2025a) [15].

Acknowledgments

We thank Jean-Louis Vigneresse for initiating this contribution, which will address some differences in his viewing and our understanding of the meaning of melt inclusions for ore-forming processes.

References

  1. Vigneresse J-L, Poddar A, Chattaraj PK (2025) Felsic trans-porphyry deposits and associated ore (Sn, Ta, Nb, pegmatites) viewed from physics, chemistry (cDFT) and geologic Lithos 514-515: 1-15.
  2. Vigneresse J-L (2026). Specificity of ore generation (tin, pegmatites, and gems) in trans-porphyry deposits. Minerals 16: 1-32.
  3. Thomas R (2000) Determination of water contents of granitic melt inclusions by confocal laser Raman microprobe American Mineralogist 85: 868-887.
  4. Thomas R, Davidson P, Appel K (2019) The enhanced element enrichment in the supercritical states of granite-pegmatite systems. Acta Geochim 38: 335-349.
  5. Thomas R, Davidson P, Rericha A, Voznyak DK (2022) Water-rich melt inclusions as “frozen” samples of the supercritical state in granites and pegmatites reveal extreme element enrichment resulting under non-equilibrium Mineralogical Journal (Ukraine) 44: 3-15.
  6. Bureau H, Keppler H (1999) Complete miscibility between silicate melts and hydrous fluids in the upper mantle: experimental evidence and geochemical Earth and Planetary Science Letters 165: 187-196.
  7. Sowerby JR, Keppler H (2002) The effect of fluorine, boron and excess sodium on the critical curve in the albite-H2O Contrib Mineral Retrol 143: 32-37.
  8. Linford MR (2014) The Gaussian-Lorentzian sum, product, and convolution (Voigt) functions used in peak fitting XPS narrow scans, and an introduction to the impulse Vacuum Technology & Coating 8(2): 1–6.
  9. Rösler HJ, Lange H (1975) Geochemische VEB Deutscher Verlag für Grundstoffindustrie. Leipzig 675 Pg.
  10. Borisova AY, Thomas R, Salvi S, Candaudap F, Lanzanova A, Chmeleff J (2012) Tin and associated metal and metalloid geochemistry by femtosecond LA-ICP-QMS microanalysis of pegmatite-leucogranite melt and fluid inclusions: new evidence for melt-melt-fluid Mineralogical Magazine 76: 91-113.
  11. Thomas R, Förster HJ, Heinrich W (2003) The behaviour of boron in a peraluminous granite-pegmatite system and associated hydrothermal solutions: a melt and fluid-inclusion study. Contrib Mineral Petrol 144: 457-472.
  12. Rickers K, Thomas R, Heinrich W (2004) Trace-element analysis of individual synthetic and natural fluid inclusions with synchrotron radiation XRF using Monte Carlo simulation for Eur J Mineral 16: 23-35.
  13. Rickers K, Thomas R, Heinrich W (2006) The behavior of trace elements during the chemical evolution of the H2O-, B-, and F-rich granite-pegmatite-hydrothermal system at Ehrenfriedersdorf, Germany: a SXRF study of melt and fluid Miner Deposita. 41: 229-245.
  14. Vogel R (1959) Die heterogenen Leipzig. Pg: 728.
  15. Thomas R, Rericha A (2024) Meaning of supercritical fluids in pegmatite formation and critical-element Geol Earth Mar Sci 6: 1-5.
  16. Thomas R (2025a) Interpretation of the Lorentzian distribution of tin in the Variscan Ehrenfriedersdorf deposit/Germany. Geol Earth Mar Sci 7: 1-5.
  17. London D, Evensen JM (2002) Beryllium in silicic magmas and the origin of beryl-bearing Reviews in Mineralogy & Geochemistry 50: 445-486.
  18. Thomas R, Klemm W, Haller M, Knöchel A, Radtke M (1995) First results on melt inclusions in geological samples using SYXRF-microprobe. Hamburger Synchrotronstrahlungslabor HASYLAB am Deutschen Elektronen-Synchrotron Jahresbericht II, 961-962.
  19. Thomas R (2025b) The change from supercritical fluid-melt system into the under­critical stage: The Zinnwald Geol Earth Mar Sci 7: 1-9.
  20. Thomas R, Davidson P, Rericha A, Recknagel U (2023) Ultrahigh-pressure mineral inclusions in a crustal granite: Evidence for a novel transcrustal transport mechanism. Geoscience 94: 1-13.
  21. Thomas R, Trinkler M (2024) Monocrystalline lonsdaleite in REE-rich fluorite from Sadisdorf and Zinnwald/E-Erzgebirge, Germany. Geol Earth Mar Sci 6: 1-5.
  22. Schütze H, Stiehl G, Wetzel K, Beuge P, Haberland R, et al. (1983) Isotopen-undelementgeochemische sowie radiogeochronologische Aussagen zur Herkunft des Ehrenfriedersdorfer Granits-Ableitung erster ZFI-Mitteilungen 76: 232-254.
  23. Mohn CE, Caracas R, Conrad CP (2025) Lower mantle water distribution from ab initio proton diffusivity in Earth Planet Sci Lett 649: 1-10.
  24. Thomas R, Brümmer G, Scheiblauer K (2025) Paradigm change of pegmatite formation – Where does the water come from?. Geol Earth Mar Sci 7: 1-7.
  25. Thomas R, Webster JD, Davidson P (2011) Be-daughter minerals in fluid and melt inclusions: implications for the enrichment of Be in granite-pegmatite systems. Contrib Mineral Petrol 161: 483-495.

A Nanoplatform for Hypoxia-Responsive Co-delivery of an NQO1 Enzyme-responsive Pterostilbene Prodrug and Phenanthriplatin for Multi-Mechanistic Cervical Cancer Therapy

DOI: 10.31038/CST.20261112

Abstract

This commentary discusses a recent study that developed a hypoxia-responsive nanoplatform PAP 3.5/Phen-Pt/PTS-433 for co-delivering phenanthriplatin (Phen-Pt) and an NQO1-activated prodrug of pterostilbene (PTS-433) in cervical cancer. The system exploits tumor hypoxia and NQO1 overexpression to achieve targeted drug release, enhance platinum-induced DNA damage, and restore natural killer (NK) cell activity. This commentary highlights the dual-responsive design, the immunological benefits, and the translational potential, while also discussing limitations such as NQO1 expression heterogeneity and the need for more advanced hypoxia models.

Keywords

Cervical cancer, Hypoxia-responsive nanoplatform, NQO1 prodrug, Phen-Pt, Pterostilbene, Immunotherapy

Introduction

Platinum-based chemotherapy remains a cornerstone for treating advanced cervical cancer, but its efficacy is severely limited by tumor hypoxia and acquired resistance [1]. In a recent article published in BBA-Molecular Cell Research, we present an elegant nanoplatform that addresses these challenges through a triple-action design: a hypoxia-sensitive size-switchable dendrimer (PAP 3.5) co-delivers the monofunctional platinum agent Phen-Pt together with a novel quinone-locked PTS-433, which is selectively activated by NQO1 overexpressed in cervical cancer cells [2]. We demonstrate that released pterostilbene acts as a histone deacetylase inhibitor (HDACi) to sensitize cancer cells to Phen-Pt, while also reversing the hypoxic immunosuppression of NK cells. This commentary evaluates the study’s strengths, potential limitations, and implications for future nanomedicine and immune-oncology.

Summary of Key Findings

We synthesized PTS-433 by modifying the phenolic hydroxyl of pterostilbene with a trimethyl-locked Quinone Propionic Acid (QPA) moiety, which is cleaved by NQO1. PTS-433 showed negligible toxicity in normal cells (low NQO1) but potent activity in HeLa and SiHa cells (high NQO1), with IC₅₀ values around 30 μM. The combination of PTS-433 and Phen-Pt produced strong synergistic effects (combination index < 0.2 at optimal ratios), increased histone acetylation, enhanced γ-H2AX phosphorylation, and induced apoptosis [2].

The PAP 3.5 nanocarrier (PAMAM-AZO-PEG) was 97 nm in normoxia but shrank to 10 nm under hypoxic conditions (Na₂S₂O₄ treatment), due to azobenzene (AZO) reduction and PEG detachment. This size switch promoted cellular uptake and tumor accumulation. Drug release was strictly dependent on both acidic pH (6.8) and hypoxia, achieving 80-90% release within 90 min. Importantly, PTS-433 upregulated major histocompatibility complex class I chain-related gene A and B (MICA/B) on cervical cancer cells (via PI3K/ AKT) and downregulated NRP-1, TGF-β, and IDO, thereby restoring NKG2D expression and NK cell cytotoxicity in co-culture models. In a HeLa xenograft model, PAP 3.5/Phen-Pt/PTS-433 achieved a 3.26-fold higher tumor inhibition than the negative control, with no significant body weight loss [2].

Strengths and Novelty

The study has several noteworthy strengths. First, the dual stimuli-responsiveness (hypoxia and acidic pH) ensures that the cytotoxic payloads are released preferentially in the tumor microenvironment (TME), minimising premature drug leakage. The hypoxia-triggered size reduction from 97 nm to 10 nm is a clever design that combines the EPR effect (via PEG shielding) with deep tumour penetration after size collapse. Second, the NQO1-activated prodrug strategy adds a second layer of selectivity: PTS is released only in cancer cells that overexpress NQO1, sparing normal tissues. This is particularly important because PTS acts as an HDACi, which could otherwise cause Zuoping Li (2026). A Nanoplatform for Hypoxia-Responsive Co-delivery of an NQO1 Enzyme-responsive Pterostilbene Prodrug and Phenanthriplatin for Multi-Mechanistic Cervical Cancer Therapy unwanted epigenetic changes. Third, the immunomodulatory function of PTS-433 distinguishes this platform from conventional platinum nanotherapies. By upregulating MICA/B and downregulating TGF-β/ IDO, it counteracts the immunosuppressive TME and restores NK cell activity-a feature that could synergise with immune checkpoint inhibitors [3].

Limitations and Open Questions

Despite these advances, some limitations warrant discussion. NQO1 expression heterogeneity-while high in many cervical cancers, NQO1 levels vary considerably among patients and even within tumour regions [4]. We used HeLa and SiHa cells as NQO1-high models, but clinical translation would require patient stratification or a theranostic approach to confirm prodrug activation. Second, the hypoxia model relied on Na₂S₂O₄ as a chemical reducing agent, which does not fully replicate the complex, chronic hypoxia in solid tumours (e.g., gradients of O₂, nutrient deprivation, and acidic metabolites). Future studies should validate the system in more physiological hypoxic cultures (e.g., 1% O₂ incubators for extended periods) and in orthotopic or patient-derived xenograft models. Third, while the nanoplatform showed excellent biocompatibility in the short term, long-term toxicity and biodistribution studies (e.g., accumulation in the reticuloendothelial system) are needed before clinical consideration. Finally, the combination of Phen-Pt and PTS produced strong synergy (CI = 0.14-0.20), but the optimal dosing ratio and scheduling in vivo require further refinement, especially because PTS-433 release kinetics differ from those of Phen-Pt.

Conclusion

We have developed a sophisticated nanoplatform that leverages two tumor-specific cues (hypoxia and NQO1) to deliver a synergistic combination of Phen-Pt and a PTS-433. The work convincingly demonstrates enhanced cytotoxicity, apoptosis, and NK cell activity in vitro, along with superior tumor inhibition in a xenograft model. Although certain gaps remain, this study provides a strong proof-of-concept for multi-mechanistic, microenvironment-responsive drug delivery in cervical cancer. Future refinement of the carrier design and more rigorous immune evaluation will determine its potential for clinical adoption.

Acknowledgment

The school-level scientific research fund project of Xinjiang University of Science and Technology, with the project number of 2026-KYRC21?

References

  1. Park GY, Wilson JJ, Song Y, Lippard SJ (2012) Phenanthriplatin, a monofunctional DNA-binding platinum anticancer drug candidate with unusual potency and cellular activity Proc Natl Acad Sci USA. [crossref]
  2. Li Z, Zhao Z, Zhang Y, Xie Z, Zhang J, Jin X, et (2026) A nanoplatform for hypoxia-responsive co-delivery of an NQO1 enzyme-responsive pterostilbene prodrug and phenanthriplatin for multi-mechanistic cervical cancer therapy. Biochim Biophys Acta Mol Cell Res. [crossref]
  3. Gutierrez-Hoya A, Soto-Cruz I (2021) NK cell regulation in cervical cancer and strategies for Cells. [crossref]
  4. Srivenugopal KS, Arutla V, Punganuru SR, Khan A (2024) Application of a specific and sensitive NQO1 turn-on near-infrared fluorescence probe for live cancer cell and xenografted tumor Methods Mol Biol. [crossref]

Geophysical Vectoring of Structurally Controlled Barite–Galena Mineralisation in a Precambrian Basement Terrain: Evidence from Integrated Magnetic and Electromagnetic Investigations, South-Eastern Nigeria

DOI: 10.31038/GEMS.2026852

Abstract

Barite–galena mineralization constitutes an important component of Nigeria’s industrial mineral and base metal resource potential. This study presents an integrated geophysical investigation of structurally controlled mineralization within the Precambrian basement terrain of Iyamitet, Obubra Local Government Area, south-eastern Nigeria. This deployment of ground magnetic and Very Low Frequency Electromagnetic (VLF-EM) methods produced robust interpretation of concise data for delineating Barite–Galena mineralisation within the Iyamitet area. Residual Magnetic Intensity, Analytical Signal, 3-D Euler Solution, and Q-Factor maps were generated to identify conductive sulphide-bearing structures, lithological contacts, hydrothermal alteration zones, and fracture-controlled mineralized pathways. The magnetic maps revealed pronounced low magnetic anomalies associated with hydrothermal alteration and sulphide mineralisation, while the Analytical Signal and Euler Solution maps delineated dominant NE–SW and NW–SE structural trends interpreted as faults, fractures, and vein systems favourable for hydrothermal fluid migration and ore emplacement. The Q-Factor map derived from VLF-EM filtering revealed conductive linear anomalies corresponding to sulphide-rich fracture zones spatially associated with magnetic lows and clustered Euler depth solutions. The mineralisation potential zonation further identified moderate to high prospective zones characterized by structurally controlled conductive and resistive signatures indicative of hydrothermal Pb–Zn–Barite mineralisation. The continuity and spatial distribution of these anomalies suggest significant economic potential for Barite–Galena deposit development within the area.

The integrated interpretation confirms that the Iyamitet area is highly prospective for structurally controlled hydrothermal Barite–Galena mineralisation. The results demonstrate the effectiveness of integrated geophysical techniques for mineral exploration in structurally complex basement terrains and provide a scientific framework for targeted drilling and sustainable mineral resource development in southeastern Nigeria.

Keywords

Barite–galena, Basement mineralization, Magnetic survey, VLF-EM, Structural controls, Nigeria

Introduction

Barite (BaSO₄) is a high-density industrial mineral widely used in petroleum drilling, chemical industries, and radiation shielding applications, while galena (PbS) remains the principal ore of lead globally. In Nigeria, barite–galena mineralization is commonly associated with hydrothermal vein systems controlled by tectonic structures within basement and sedimentary terrains. Oladapo et al. (2011) [1], Ezekwesili et al. (2012) [2] and Obaje et al. (2009) [3], the aforementioned carried out related studies on Galena and Barite deposit in different location within Nigeria. The workdone by Akinde et al. 2019 [4] recommended the use of multiple geophysical techniques to uncover the presence of Barite – Galena Mineralisation since the results of Vertical Electrical Sounding alone could not properly delineate the presence of Barite-Galena mineralisation. Recently, Akinde et al 2026b [5] adopted magnetotelluric to delineate structural traps hosting groundwater bodies, the work focussed on the important roles played by structural traps which is also relevant in hydrothermal mineral flows. Despite early documentation of barite occurrences, many deposits remain poorly characterized geophysically, limiting effective exploration and resource development. In the Iyamitet area, artisanal mining has revealed occurrences of barite–galena assemblages within quartz-schist host rocks. This study thus integrates the deployment of ground magnetic and Very Low Frequency VLF geophysical methods to characterize structural controls, delineate mineralized zones, and evaluate Iyamitet’s Barite-Galena mineralistion deposit (Figures 1 and 2).

Figure 1: Geological Exploration Base Map of the Iyamitet Prospect Area Showing Hydrographic Network, Exploration Access Routes, Vegetated Terrain and Dominant NE-SW Trending Mineralised Structural Lineament Interpreted to Control Subsurface Mineralisation.

Figure 2: Elevation and 3-D Elevation Map of the Study Area.

Geological Setting

The study area lies within the southeastern Nigerian Precambrian basement complex, comprising schists, phyllites, gneisses, and granitic intrusions. Regionally, the Oban Massif forms part of a tectonically reworked crustal block influenced by Pan-African orogeny. Hydrothermal mineralization is structurally controlled and typically occurs along fracture-filling systems within metamorphic lithologies. Oden et al. (2012) [6] carried out comparative analysis of fracture lineaments in Oban and Obudu areas, SE Nigeria.

Materials and Methods

Magnetic Survey

Ground magnetic data were collected along 21 traverses with 20 m station spacing. Data enhancement techniques included:

  • Reduction to magnetic equator (RTE).
  • Upward continuation filtering.
  • Pseudo-gravity transformation.
  • Analytical signal analysis.
  • Spectral depth estimation.
  • 3-D Euler deconvolution.

Electromagnetic Survey

VLF-EM data were acquired using ABEM WADI equipment along established grid lines. Filtered real (Q-factor) anomalies were used to map conductive structures interpreted as fracture systems associated with mineralization (Figures 3.1-3.3).

Figure 3.1: Magnetic Intensity Map of Iyamitet Obtained from Ground Magnetic Data.

Figure 3.2: Ground Magnetic Intensity Map of Iyamitet (Upward Continued to 20 m.

Figure 3.3: Reduction to the Equator Map of Iyamitet

Results

  1. Integrated geophysical interpretation revealed: A dominant NE–SW-trending structural corridor controlling mineralization.
  2. Low magnetic intensity zones coinciding with high pseudo-gravity anomalies.
  3. Conductive zones delineated by VLF-EM corresponding to fracture systems.
  4. Depth estimates indicating shallow (<10 m) to intermediate (~50 m) mineralized bodies.
  5. Analytical signal and Euler solutions confirmed structural controls on mineral emplacement (Figures 4.1-4.7).

Figure 4.1: Residual Ground Magnetic Intensity Map of Iyamitet.

Figure 4.2: Analytical Signal Map of the Study Area.

Figure 4.3: 3-D Euler Solution Map of Iyamitet (SI = 0).

Figure 4.4: 3-D Euler Solution Map of Iyamitet (SI = 0.5).

Figure 4.5: Radially Averaged Spectrum Map of Iyamitet.

Figure 4.6: Raw Real Component Map of Iyamitet.

Figure 4.7: Q-Factor Map of Iyamitet Obtained from Filtering of the Raw Real Data.

Discussion

The VLF-EM and ground magnetic maps of the Iyamitet area reveal significant subsurface structural and lithological characteristics that strongly favour the occurrence of structurally controlled barite–galena mineralisation. The integration of the Residual Magnetic Intensity Map, Analytical Signal Map, Euler Depth Solutions, and Q-Factor filtering maps provides convincing evidence for fracture-controlled hydrothermal mineral deposition within the study area. The Residual Ground Magnetic Intensity Map (Figure 4.1) shows pronounced magnetic contrasts characterized by alternating zones of high and low magnetic intensities. The dominant low magnetic closures (blue to cyan colours) observed particularly within the central and northeastern portions of the study area are interpreted as zones of hydrothermal alteration, demagnetization, and structural weaknesses. These low magnetic signatures are typical of sulphide-bearing mineralized zones because galena (PbS) and barite (BaSO₄) are essentially non-magnetic minerals and are commonly associated with altered host rocks that have undergone destruction of magnetic minerals such as magnetite during hydrothermal fluid circulation. Conversely, the moderate to high magnetic anomalies (yellow, red, and purple zones) surrounding the low magnetic corridors likely represent relatively fresh basement rocks or ferruginized lithologies which acted as competent host rocks and structural traps for mineralizing fluids. The sharp magnetic gradients observed between magnetic highs and lows indicate lithological contacts and faulted boundaries that served as migration pathways for hydrothermal solutions responsible for barite–galena emplacement. The Analytical Signal Map (Figure 3.5) further enhances the delineation of structural contacts and subsurface discontinuities independent of magnetization direction. The strong analytical signal amplitudes trending predominantly NE–SW and NW–SE suggest the presence of deep-seated fracture systems and fault intersections. These structural trends are highly significant because barite–galena mineralisation within the Benue Trough and adjoining basement terrains of Nigeria is commonly controlled by fault systems, shear zones, and fracture networks. The analytical signal closures around the central part of the map indicate concentrated subsurface structural disturbances which may represent mineralized veins or hydrothermal conduits. The clustering of anomalies around these lineaments strongly suggests structurally localized sulphide mineralisation. The intersection zones of the lineaments are especially important because they usually provide enhanced permeability for ascending hydrothermal fluids and consequently form favourable sites for barite and galena deposition.

The 3-D Euler Solution Maps (Figures 4.3 and 4.4) provide depth estimations and geometric characterization of the causative bodies. The Euler solutions with Structural Index (SI = 0) are indicative of contact-type geological structures such as faults, lithological boundaries, and vein systems. The clustering of Euler depth solutions along elongated trends suggests the presence of continuous structural corridors. These corridors are interpreted as fracture-controlled mineralized zones favourable for epigenetic barite–galena deposition. Similarly, the Euler solutions with SI = 0.5 indicate dyke-like or vein-like bodies occurring at shallow to intermediate depths. The concentration of these solutions within the central and southern parts of the study area strongly supports the existence of vein-controlled mineralisation. Barite and galena deposits in Nigeria are commonly emplaced as hydrothermal veins along fault planes and fractures; therefore, the observed Euler signatures strongly favour this style of mineral occurrence. The depth estimates ranging approximately from near-surface to moderate depths further increase the economic significance of the mineralization because shallow hydrothermal sulphide systems are generally more accessible for exploration and possible exploitation. The Q-Factor Map (Figure 4.7), derived from filtering of the VLF-EM real component data, provides one of the strongest evidences for conductive mineralized structures within the area. The map reveals several conductive zones represented by anomalous closures and linear conductive trends. These conductive anomalies are interpreted as sulphide-rich fracture zones because galena exhibits relatively high electrical conductivity compared to surrounding country rocks. The conductive linear features identified on the Q-Factor map correspond spatially with the structural trends mapped from the magnetic interpretation. This correlation strongly validates the interpretation of interconnected fracture-controlled mineralized systems. The conductive anomalies labelled around the central and western portions of the study area are particularly significant because they coincide with zones of magnetic lows and Euler structural clustering.

Such coincidence between:

  • conductive VLF-EM anomalies,
  • magnetic discontinuities,
  • analytical signal peaks,
  • And a clustered Euler depth solution is a classical geophysical signature of structurally controlled hydrothermal sulphide mineralisation.

The VLF-EM response also suggests that the mineralized fractures are likely steeply dipping and laterally extensive. This interpretation is consistent with hydrothermal barite–galena veins commonly associated with tectonic reactivation and fluid migration along regional fractures. Geologically, the integrated geophysical signatures suggest that the Iyamitet area experienced intense tectonic deformation that created interconnected fracture systems which later became conduits for hydrothermal fluids rich in barium, lead, zinc, and associated sulphides. The hydrothermal fluids precipitated barite and galena within structurally weak zones, especially along lithologic contacts, fractures, and fault intersections.

The spatial association of:

  • low magnetic anomalies,
  • conductive VLF-EM zones,
  • fracture-related Euler clusters,
  • and analytical signal lineaments therefore strongly favours the presence of structurally controlled barite–galena mineralisation within the Iyamitet area. The integrated interpretation of the VLF-EM and aeromagnetic and ground geophysical datasets confirms that the Iyamitet area possesses favourable subsurface structural architecture and hydrothermal conditions for economically viable barite–galena mineral deposition (Figure 4.8).

Figure 4.8(a-g): Maps Showing Synthesis of Results.

The synthesis maps (Figure 4.8 a–g) show the integrated interpretation of the geophysical datasets within the study area. Variations in colour patterns indicate contrasts in subsurface properties, structural features, and mineralisation potential. High-anomaly zones represented by red, pink, and purple colours suggest possible mineralised or conductive regions, while blue and green zones indicate relatively resistive formations.

The maps reveal structurally controlled anomalies associated with fractures, faults, and alteration zones that may have served as pathways for mineralising fluids. Concentrated and continuous anomalous zones observed in the central and lower sections are interpreted as favourable targets for mineralisation. Generally, the synthesis results indicate significant subsurface heterogeneity and delineate prospective zones suitable for further detailed exploration, trenching, and drilling activities [7-9] (Figure 5).

Figure 5: Mineralization Potential Zonation Map of Iyamitet.

Conclusions

The mineralisation potential zonation map of the Iyamitet area reveals well-defined anomalous zones characterized by structurally controlled conductive and resistive signatures favourable for Barite–Galena mineralisation. The distribution of the anomalous zones suggests hydrothermal fluid emplacement along fractures, faults, and lithological contacts within the subsurface. The moderate to high mineralisation potential zones identified on the map indicate significant concentration of sulphide-bearing minerals, particularly galena associated with barite veins. The continuity and spatial extent of the favourable zones further suggest that the Iyamitet area possesses appreciable economic potential for Barite–Galena deposit development. The integrated interpretation therefore confirms that the area is prospective for hydrothermal Pb–Zn–Barite mineralisation and justifies detailed exploration involving trenching, core drilling, geochemical sampling, and reserve estimation to delineate the ore body and evaluate its commercial viability.

Acknowledgement

The author acknowledges field support and geophysical data acquisition assistance from relevant technical teams, Contribution of late Mr Romanus E.J. to his blessed memory is well appreciated in this research work.

References

  1. Oladapo MI, Oladapo-Adeoye OO (2011) Geophysical Investigation of Barite Deposit in Tunga, Northeastern Nigeria. International Journal of the Physical Sciences 6: 4760-4774.
  2. Ezekwesili GE, Celestine OO, Chidozie IP (2012) Structural styles and economic potentials of some barite deposits in the Southern Benue Trough, Nigeria. Romanian Journal of Earth Sciences 86: 27-40.
  3. Obaje NG (2009) Geology and Mineral Resources of Nigeria, London. Springer Dordrecht. Pp 221.
  4. Akinde AS, Dikedi PN, Ogharandukun (2019) Adopting Geo-electric Approach in Mineral Characterisation of Iyamitet Settlement. Journal of Geology and Geophysics 8: 1-7.
  5. Akinde AS, Afuwai CG, Gata TB (2026b) Efficacy of Magnetotelluric Method in Delineating Structural Traps Hosting Groundwater Bodies. International Journal of Natural and Practical Sciences 8: 1-3.
  6. Oden MI, Okpamu TA, Amah EA (2012) Comparative analysis of fracture lineaments in oban and obudu areas, SE Journal of Geography and Geology. 4. ISSN 19169779. E-ISSN 1916-9787. Published by Canadian Center of Science and Education.
  7. Geosoft (2005) Quick start Tutorial and User guide applications (Electronic Version); Oasis Montaj data processing and analysis (DPA) system for Earth Science applications, Euro Technologies, 2007, Version.5.1.4, 242.
  8. Oyeniyi TO, Salami AA, Ojo SB (2016) Magnetic Surveying as an Aid to Geological Mapping: A Case Study from Obafemi Awolowo University Campus in Ile-Ife, Southwest Nigeria. Ife Journal of Science 18.
  9. Spector A, Grant FS (1970) Statistical Models for interpreting aeromagnetic data. Geophysics 35: 293-302.

A Further Example of a Striking Alkaline Premineralization in the Variscan Ehrenfriedersdorf Sauberg Tin Deposit, Central-Erzgebirge, Germany

DOI: 10.31038/GEMS.2026814

Abstract

In this short contribution, we show the complexity of mineral-forming processes using the example of the Variscan Ehrenfriedersdorf tin deposit and, by way of a further unexpected example, the occurrence of typical alkaline mineralization as an alkaline remnant of vuoriyarvite-K in fluorite in the tin paragenesis.

Keywords

Raman spectroscopy, Vuoriyarvite-K, Strong Alkalinity, Variscan Tin Mineralisation, Ehrenfriedersdorf

Introduction

The author and coauthors have previously shown that exceptional minerals are present in the classic tin deposit of Ehrenfriedersdorf. To these belong nepheline crystals (Figure 1), and the high-pressure minerals diamond, moissanite, orthorhombic cassiterite, and others [1]. In granite quartz, there are melt inclusions of peralkaline granitic composition [2]. That means, at last, that the famous and very rich tin deposits from the Variscan granites around Ehrenfriedersdorf are not the result of a single granite intrusion or a single mineral-forming process. Also, supercritical fluids and melts participate in mineral-forming processes. In Thomas and Rericha (2023) [3], a new microphotograph of nepheline (Figure 4) is presented, and the nepheline composition and that of the surrounding K-feldspar are tabulated. According to melt inclusion studies, there are generally two granite trends: the peraluminous and the peralkaline, as well as an alkaline mineralization, which are detectable to varying degrees and are roughly equal in abundance. In Figure 1, exemplarily shown are the nepheline aggregates in quartz from Ehrenfriedersdorf (Sauberg mine). The figure is from Thomas et al. (2006) [2] and serves as a reminder that nepheline is not typically present or possible in a granite environment; it is nevertheless present!

Furthermore, we will show that remnants of older mineral inclusions in younger ones demonstrate that multi-stage processes are responsible for the exceptional tin-rich deposit. One such example is the occurrence of vuoriyarvite-K [K2(Nb,Ti)2(Si4O12)(O,OH)2 · 4H2O]. Simple one-sided geochemical studies cannot solve the complex puzzle of mineral-forming processes.

Figure 1: Back-scattered electron images of nepheline inclusions in feldspar (a) and quartz (b) from the Ehrenfriedersdorf pegmatite. Nepheline shows kalsilite and aegirine exsolution lamellae. Ae – aegirine, Kfs- K-feldspar, Kls – kalisilite, Ne-nepheline, Qtz – quartz.

Methods and Samples

Raman Spectroscopy

Raman spectra were recorded with the EnSpectr Raman microscope RamMics R532 in the spectral range of 0 – 4000 cm-1 using a 50 mW single-mode 532 nm laser, an entrance aperture of 20 μm, a holographic grating of 1800 g/mm, and a spectral resolution of 4 cm-1. Depending on the grain size, we used microscope objectives with magnifications between 3.2x and 100x. As 100x objective, we used the long-distance LMPLFLN100x from Olympus. The laser energy on the sample can continuously be adjusted down to 0.02 mW. Generally, we used 30 mW on the sample for the present study. The positions of the Raman bands were controlled before and after each series of Si-band measurements using a single-crystal semiconductor-grade silicon chip. The run-to-run repeatability of the line position (from 20 measurements each) was ± 0.3 cm-1 for Si (520.4 ± 0.3 cm-1) and 0.5 cm-1 for diamond (1332.3 ± 0.5 cm-1 over the range 80 – 2000 cm-1), respectively. As a diamond reference, we used a water-clear natural diamond crystal (from Brazil). An essential advantage of the Raman spectrometer is the simple zero-point calibration. For the identification of minerals using Raman microspectroscopy, we used the RRUFF database and the Crystal Sleuth program [4].

Reference Sample

As a reference for our study, we used crystals of vuoriyarvite-K [K2(Nb,Ti)2(Si4O12)(O,OH)2 · 4H2O] from Pitkäranta (Lupikko shaft) on the northern shore of Lake Ladoga, Karelian SSR/Russia, which were proven with X-ray techniques (sample from Crystal-Treasure, Kassel).

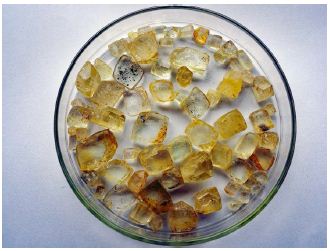
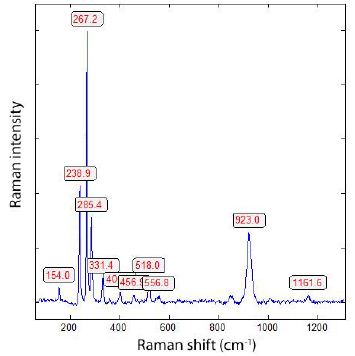
Figure 2 shows an example of the nearby colorless reference vuoriyarvite-K material from Pitkäranta. The spectrum of reference vuoriyarvite-K is given in Figure 3. The RRUFF data file (RRUFF ID R070703 for a 532 nm laser) of vuoriyarvite-K is a little different, but similar. The sample is from another place: Kirov Mine, Kuukisvumchorr Mt. Khininy Massif, Kola Peninsula, Russia.

Figure 2: Reference crystals of vuoriyarvite-K from Pitkäranta/Lake Ladoga, Russia. The spectrum of reference vuoriyarvite-K is given in Figure 3.

Figure 3: Reference Raman spectrum of the vuoriyarvite-K [K2(Nb,Ti)2(Si4O12)(O,OH)2 4H2O] from Pitkäranta (Lupikko shaft) on the northern shore of Lake Ladoga, Karelian SSR/Russia, which was proven with X-ray techniques.

Sample

As a sample, we used a polished mostly green fluorite crystal from a cassiterite paragenesis (Sn-70 from the Prinzler ancillary vein) with a small violet rim at one end, measuring about 2.5 x 2.6 x 0.2 cm. Figure 4 shows the used sample.

Figure 4: Double-sided polished fluorite sample. The green part contains many remnants of vuoriyarvite-K (Vuo). In the fluorite part, the market with arrows contains a high concentration of this mineral.

Results – Key Observations

The Raman spectrum of the fluorite host is given in Figure 5. According to Chukanov and Vigasina (2020) [5], the fluorite is characterized by a single strong Raman band at about 322 cm1.

Figure 5: Raman spectrum of the fluorite host of vuoriyarvite-K. The lines beside the strong, sharp fluorite line at 320.7 cm-1  may be fluorescence lines.

The fluorit sample contains many small corroded crystal remnants of vuoriyarvite-K. By the refractive index (fluorite n = 1.44, vuoriyarvite-K = 1.73), the crystals under the microscope are well seen. During the study of the large fluorite crystal, unusual, corroded, and more or less colorless vuoriyarvite-K crystals were observed (Figures 6 and 7).

Figure 6: Vuoriyarvite-K (Vuo) remnant in the fluorite matrix.

Figure 7: A larger vuoriyarvite-K (Vuo) crystal in fluorite (CaF2) surrounded by dark, undefined material (product of decomposition – maybe oxides of Nb).

Figures 8 and 9 show the Raman spectra of the vuoriyarvite-K-like mineral.

Rastsvetaeva and Chukanov (2002) [6] reported that the labuntsovite group contains more than 20 minerals, with compositions that vary widely. For example, K2O can vary from 0 to 15%. From most minerals of this group, there are no Raman spectra. Therefore, the interpretation of the labuntsovite-group minerals by Raman and IR spectroscopy is very difficult.

Figure 8: Raman spectrum of vuoriyarvite-K-like mineral in fluorite from the Ehrenfriedersdorf tin deposit, Sauberg mine. The sharp line at 320.5 cm-1 is from the fluorite host.

Figure 9: Raman spectrum of a vuoriyarvite-K-like mineral. This spectrum corresponds well to the RRUFF ID R070703 (Lafuente et al., 2016). The 320.3 cm-1 Raman band comes from the fluorite host.

Discussion

The labuntsovite group minerals, with the here described vuoriyarvite-K, are typical of alkaline massifs of the Kola Peninsula and Greenland [6,7]. Here in the Variscan tin deposit of Ehrenfriedersdorf in the Central-Erzgebirge, Germany, are the occurrences of such minerals as nepheline, kalisilite, and vuoriyarvite-K-like minerals, at first sight untypical. However, they clearly demonstrate that the classic tin mineralization is not the result of a single enrichment process from the surrounding Sn-granite. The formation of the tin deposit results from multiple evolutionary stages, including alkaline stages and the interaction of supercritical fluids coming from Earth’s mantle. In such fluids, chromatographic processes of element enrichment and depletion can occur.

References

  1. Thomas R, Recknagel U, Rericha A (2023) A Moissanite-diamond-graphite paragenesis in a small beryl-quartz vein related to the Variscan tin-mineralization of the Ehrenfriedersdorf deposit, Geosciences. 13: 1-13.
  2. Thomas R, Webster JD, Rhede D, Seifert W, Rickers K, et al. (2006) The transition from peraluminous to peralkaline granitic melts: Evidence from melt inclusions and accessory Lithos 91: 137-149.
  3. Thomas R, Rericha A (2023) The function of supercritical fluids for the solvus formation and enrichment of critical Geol Earth Mar Sci. 5(8): 1-4.
  4. Lafuente B, Downs RT, Yang H, Stone N (2016) The power of database: The RRUFF In Highlights in Mineralogical Crystallography; Armbruster T, Danisi RM (Eds.). De Gruyter: Berlin, München, Boston. 1-30.
  5. Chukanov NV, Vigasina MF (2020) Vibrational (Infrared and Raman) spectra of minerals and related compounds. Springer Mineralogy. Pg: 1376.
  6. Rastsvetaeva PK, Chukanov NV (2002) X-ray diffraction and IR spectroscopy study of the labuntsovite-group Crystallography reports. 47: 939-945.
  7. Pekov IV (2000) Lovorzero Massif. Moscow. Pg: 480.

Diamond in Pycnite-Rock from Altenberg and in the Topaz from the Famous Schneckenstein Deposit

DOI: 10.31038/GEMS.2026851

Abstract

This study investigates topaz from Altenberg pycnite rock and the Schneckenstein deposit, with emphasis on fluorine variability and the occurrence of carbon phases. Raman spectroscopy was used to characterize topaz, determine fluorine contents, and identify inclusions. The results show that Altenberg pycnite is compositionally heterogeneous, containing both fluorine-rich and fluorine-poorer domains, whereas Schneckenstein topaz is associated with unusual Ti-rich topaz-rutile inclusions and small spheres of diamond-like carbon and diamond. The discovery of diamond and related carbon phases in both occurrences is interpreted as evidence that supercritical fluids and/or deeper melts participated in the formation of these rocks and minerals.

Keywords

Topaz, Pycnite, Altenberg, Schneckenstein, Raman spectroscopy, Fluorine, Diamond, Diamond-like carbon, Supercritical fluids, Mineral inclusions

Introduction

Topaz [Al2SiO4Fx(OH)2-x], normally an orthorhombic F-rich Generally, topaz is orthorhombic and has 2V axis angles of 50-68°. Especially the pycnite from Altenberg is a little bit unusual. The c-axis of the topaz crystals makes an angle of about 12° with mineral, is of mineralogical and genetic interest. The F-content is up to 20.65% F, and x=1.4-2.0. If we speak in%, we mean always [%(g/g)], because wt% is not a permitted unit since 1988 [1]. First, we will present some simple mineralogical characteristics. The F-content and the lattice angle 2V characterize mainly the topaz. Table 1 presents topaz data from a selection of crystals [2-4].

Table 1: Results of the X-ray determination of fluorine in topaz according to Thomas (1979 and 1982) [2-3] using the Ribbe and Rosenberg (1971) [5] method. The (200) peak of NaCl is the reference. Δ(021)=2ΘNaCl200 – 2ΘTopaz 021, the optical 2V-determination, and the Raman determination using equation (1) presented by Loges et al. 2025 [6].

Thomas (1979 and 1982) [2,3]

According to Loges et al. 2025, Equ. (1)
Sample Δ(021) F [%(g/g)] n 2V [°] F [%(g/g)]

n

San Luis Potosí, Mexico

3.909 ± 0.006

16.05 ± 0.21 23 50.6 ± 0.9 16.79 ± 0.35

11

Ehrenfriedersdorf, Sauberg mine: Top-5

3.845 ± 0.004

18.33 ± 0.14 7 60.1 ± 0.9

19.08 ± 0.35

10

Ehrenfriedersdorf, Sauberg mine: Top-4

3.839 ± 0.005

18.55 ± 0.18 8 61.0 ± 0.8 19.54 ± 0.35

10

Ehrenfriedersdorf, Sauberg mine: Top-2

3.825 ± 0.004

19.05 ± 0.14 11 63.1 ± 0.6 19.02 ± 0.23

11

Schneckenstein

3.822 ± 0.004

19.15 ± 0.14 11 63.5 ± 0.6 19.26 ± 0.74

10

Altenberg pycnite II

3.811 ± 0.005

19.55 ± 0.18 13 65.2 ± 0.8 19.44 ± 0.45

8

Zinnwald pycnite

3.814 ± 0.005

19.44 ± 0.18 9 64.7 ± 0.8 19.94 ± 0.68

10

Amerika bei Penig, Saxonia

3.811 ± 0.009

19.55 ± 0.32 9 65.2 ± 1.4 n.b.

Otani Jama, Japan

3.805 ± 0.005

19.76 ± 0.18 8 66.0 ± 0.8 n.b.

Altenberg, pycnite I

3.803 ± 0.005

19.83 ± 0.18 15 66.3 ± 0.8 n.b.

Ouro Preto, Brazil

3.802 ± 0.003

19.87 ± 0.11 10 66.5 ± 0.4

20.00 ± 0.45

 
Sadisdorf, pycnite

3.801 ± 0.007

19.90 ± 0.25 7 66.6 ± 1.0 19.98 ± 0.40

18

Topaz Mountain, Thomas Range, Utah, USA

3.800 ± 0.003

19.94 ± 0.11 10 66.8 ± 0.5 20.11 ± 1.00

14

Spitzkopje, Namibia

3.796 ± 0.007

20.08 ± 0.25 9 67.4 ± 1.0 20.19 ± 0.59

22

Tröstau, Fichtelgebirge

3.796 ± 0.006

20.08 ± 0.21 7 67.4 ± 0.9 n.b.

Epprechtstein, Fichtelgebirge

3.795 ± 0.008

20.12 ± 0.29 10 67.5 ± 1.2 20.14 ± 0.14

10

Note that in the original table (Thomas, 1979 and 1982) [2,3], the names of the topazes from San Luis Potosí, Mexico, and Ouro Preto, Brazil, are mixed up.
n.b. – means the samples are not present anymore.

Generally, topaz is orthorhombic and has 2V axis angles of 50-68°. Especially the pycnite from Altenberg is a little bit unusual. The c-axis of the topaz crystals makes an angle of about 12° with the a-b plane. Using conoscopic mode on a fine-grained fraction of topaz/pycnite cleavage lamellae reveals optical biaxial symmetry. However, that is not clear proof because many grains show unclear two axes, unlike the Schneckenstein topaz. In the same riddle fraction from Schneckenstein, most crystals show a clear biaxial behavior. According to Gatta et al. (2006) [7], topaz is the stable phase above 12 GPa and 1100°C. The Raman spectroscopic determination of F according to Loges et al. (2025) [6] and Thomas (2026a) [4] showed that the Altenberg topaz contain an relative high portion of topaz with lower fluorine content: F=15.66 ± 2.01% (n =11). Similar lower results were obtained for the black topaz inclusions in normal Topaz from Schneckenstein/W-Erzgebirge: F=16.52 ± 0.76% (n=10). However, we do not want to repeat the results reported in Thomas (2026a) [4] but rather present completely new results. That concerns the topaz and the not-so-rare diamond inclusions. The diamond is, of course, a little bit different from a perfect diamond because, on the long journey from the place of origin to the place of deposition via supercritical fluid (SCF), it undergoes extreme thermal and pressure stress. The spectren look, in a sense, like nanodiamonds.

Methods and Samples

Raman Spectroscopy

We used the Raman spectroscopy to identify the topaz-specific Raman bands and determine the fluorine concentration according to Loges et al. (2025) [6] and Thomas (2026a) [4]. Furthermore, Raman spectroscopy was very helpful in distinguishing the Ti-rich topaz from the wine-yellow Schneckenstein topaz. Another task is to provide clear proof of diamond and DLC (diamond-like carbon) in topaz from Altenberg and Scheckenstein. According to Zaitsev (2001) [8], the more correct term is “diamond-like materials.” The data presented here were acquired using an EnSpectr Raman microscope (RamMics R532). Measurements covered the spectral range from 0 to 4000 cm⁻¹ and were conducted with a single-mode 532 nm laser operating at a maximum output of 50 mW. Analytical settings included a 20 µm entrance aperture, a holographic grating of 1800 g mm⁻¹, and a spectral resolution of approximately 4 cm⁻¹ (generally for the whole range). For most analyses of different topaz crystals, a long-working-distance Olympus LMPlanFL 100× objective was used. Using lower magnifications introduces the problem of excitation of different F-bearing areas within the topaz crystal (lamellas). Laser power at the sample surface was continuously adjustable down to 0.02 mW. Higher powers (up to 50 mW) were applied only for overview measurements. Generally, for F-concentration measurements, we used 0.9 mW on the sample in the range from 75 to 900 cm⁻¹ to prevent local heating. For the measurement of the OH band of topaz, the 0-4000 cm⁻¹ range was used (which is not, however, the object of the present study). For OH-rich topazes transported via supercritical fluids, we have determined an XOH=0.83 ± 0.08 (at another place). Raman band positions were calibrated before and after each measurement series using the Si band of a semiconductor-grade single-crystal silicon chip. Based on 20 repeated measurements, run-to-run reproducibility was ± 0.2 cm⁻¹ for silicon (520.2 ± 0.2 cm⁻¹) in the measuring range 75 to 900 cm⁻¹.

Fluorine Determination

The Raman method for fluorite determination is described in detail by Thomas (2026a) [4] and is based on the method of Loges et al. (2025) [6].

Samples

A detailed description of the localities of the topaz crystals used is in both books: Topas (1997) [9] and the licensed edition topaz (2011) – [10]. A comprehensive description of the pycnite-bearing rock, including analyses, from Altenberg/E-Erzgebirge, Germany, is provided by Recknagel (1969), Weinhold (2002) [11], and Lausch (2024) [12]. For the preparation of the Altenberg samples, diamond was never used; for polishing, an alumina suspension (50 nm, pH 7-8, 200 g/l) was used. The topaz from the Schneckenstein dates from a visit to the Schneckenstein in October 1960, together with Peter Haupt. In the study, only centimeter-sized natural crystal cleavages perpendicular to the c-axis are generally used (Figure 1). A description of the occurrence of the “Schneckenstein” is given in Lahl (2012) [13].

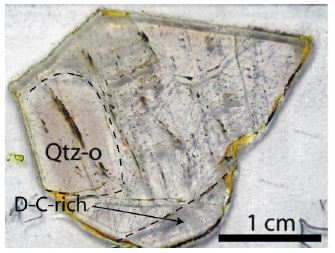
Figure 1: Topaz crystal cleavage with Ti-rich topaz and DLC inclusions. The scale is 1 cm.

Results

New Results on Topaz (Pycnite) from Altenberg

The pycnite variety of topaz is not uniform in its F content. The main part has a F-concentration of 19.55 ± 0.18% (n=13), whereas in a smaller part the concentration is lower: F=15.66 ± 2.01% (n=11). By the mixture, the cleavage is not uniform. A 12° “inclination of the c-axis against the a–b plane” is a big red flag that what we are seeing is not a change from orthorhombic → monoclinic topaz, but rather an orientation/domain effect (misindexing, twinning, or internal lattice bending/mosaicity). However, as we will see, the high-pressure modifications (monocline system) are not absolutely impossible. However, the pressure should exceed 24 GPa. Another important new finding is the proof of diamond or DLC (diamond-like carbon).

New Results on Topaz from Schneckenstein

Normally, the topaz from Schneckenstein is yellow, water-clear, and contains only a small number of solid mineral inclusions (besides many fluid inclusions, which often contain sassolite daughter phases (see Gilg and Thomas in: Topaz, 2011) [10]. Later, we will see that the fluid inclusions are, as a rule, secondary, and that the F-concentration-temperature diagram (Figure 7 in Thomas 2026a) [4] has only a limited meaning. During the study of samples collected in 1960, we found that, in addition to black spherical topaz-like aggregates (which contain some graphite), topaz also contains small brown-orange spheres, which are topaz with significantly lower F-content. Striking inclusions in topaz (Figure 2) are composed of rutile and topaz; the relative amount of rutile in these inclusions is similar. So, the composition of this inclusion type is ± the same, suggesting a homogeneous formation. That means that this inclusion was at high temperature and high pressure, a single homogeneous mineral phase – in our case, a Ti-rich topaz, in analogy to the Ge- and Ga-rich analog of topaz, the krieselite (Spivak et al., 2021 [14] and Setkova et al., 2024) [15]. A further large surprise was the finding of small spheres (up to 10 µm in diameter) of diamond and DLC in the topaz host, as well as DLC in the old topaz-rutile inclusions in the same host. The finding of diamond spheres in both topaz types (pycnite from Altenberg, topaz from Schneckenstein) demonstrates that during the formation of the rock (pycnite-rock, topaz breccia), supercritical fluids (SCF) and/or supercritical melts (SCM) participated more or less strongly in the formation.

Figure 2: Inclusion in topaz (Toz) from Schneckenstein. The red and green minerals are mostly rutile, with a little anatase, and the grey parts are Ti-rich topaz (Ti-Toz). And the black crystals are DLC (diamond-like carbon).

Such quite unusual inclusions, if present, always have the same bulk composition. Of course, that is strictly speaking speculative; however, it looks like so. The substitution of Al by Ti4+ ions in the octahedral position is conceivable and, under HT and HP, realistic. The availability of titan is also important. There are well-formed topaz crystals that are very rich in ilmenite. Rutile and anatase are rare minerals and are (in the case of rutile) mostly arranged as a single small crystal in topaz. Anatase is absent in the matrix. The appearance of rutile and anatase clusters within topaz inclusions is remarkable. Figures 3 and 4 show examples of Raman spectra of the Ti-phases.

Figure 3: Raman spectrum of rutile in the inclusion (Figure 2, green crystal).

Figure 4: Raman spectrum of rutile in the inclusion (Figure 2, red crystal).

Figures 3 and 4 show the Raman spectra of rutile in the topaz inclusion in the matrix topaz crystal. Both spectra show remnants of TiO2-II [16], which means that rutile and TiO2-II coexisted at HP and HT (Figure 5). The black crystals in Figure 6 are DLC (diamond-like carbon) in the rutile-bearing topaz inclusion in topaz from Schneckenstein.

Figure 5: Raman spectrum of diamond-like carbon (DLC) in Figure 2.

The discovery of diamond-like carbon in the rutile-topaz inclusion in water-clear topaz prompted an intense search for diamonds in both studied topaz types. At first, we found diamond and DLC in pycnite-topaz quartz from Altenberg (Figure 6, and further down in Figure 8b).

Figure 6: DLC and diamond in pycnite-topaz from Altenberg.

Figure 7: Raman spectrum of diamond in pycnite-topaz from Altenberg (see Figure 6).

Figure 8a: Water-clear diamond (D) sphere in topaz (Toz) from Schneckenstein. The Raman spectrum is in Figure 8b.

Figure 8b: Typical first-order Raman spectrum of diamond in topaz from Schneckenstein.

Table 2 presents the Raman results for diamond and DLC in both samples (pycnite quartz, pycnite from Altenberg, and topaz from Schneckenstein.

Table 2: Results of the Raman measurement in the first-order range of diamond.

Diamond, DLC

FWHM G-band FWHM

n

Quartz from Altenberg (Thomas, 2025) [17]  

1324.2 ± 10.2 cm⁻¹

74.8 ± 18.0 cm⁻¹ 1585.8 ± 7.6 cm⁻¹ 57.0 ± 7.8 cm⁻¹

18

Topaz (Pycnite) from Altenberg

1330.2 ± 2.2 cm⁻¹

74.6 ± 21.4 cm⁻¹ 1574.7 ± 9.4 cm⁻¹ 64.3 ± 15.5 cm⁻¹ 13
1339.0 ± 3.6 cm⁻¹ 79.3 ± 6.0 cm⁻¹ 1593.3 ± 14.7 cm⁻¹ 64.9 ± 15.6 cm⁻¹

12

Topaz from Schneckenstein

1326.6 ± 4.2 cm⁻¹

41.6 ± 25.4 cm⁻¹ 1597.3 ± 2.8 cm⁻¹ 61.2 ± 3.5 cm⁻¹ 14
1304.2 ± 1.9 cm⁻¹ 22.7 ± 1.7 cm⁻¹ n.d. n.d.

7

DLC – Diamond-like carbon, FWHM – Full Width at Half Maximum. n – number of measured crystals. n.d. – not detected.
Note: The intensity of the second and third-order Raman bands (e.g., the 2666 cm⁻¹ and the 3825 cm⁻¹ peaks) of diamond is very weak and has a large FWHM, and at 2664 cm⁻¹, the topaz from Schneckenstein shows a relatively strong Raman background of the (OH)-band in this region.

The discovery of diamond in topaz supports the idea of the formation of Ti-rich diamond, because the interaction of supercritical phases (SCF, SCM) from mantle depths can yield 5 GPa pressures exceeding. At the crustal level, with low HP and HT values, the Ti-topaz phase is clearly unstable. The rutile concentration in the Ti-rich topaz (Figure 2) looks very high. However, if we take the analyses given by Setkova et al. (2024) [15] for Ga- and Ge-rich topaz, we obtain the following relationship.

The pure Ge-substituted topaz analog is krieselite, with the formula Al2(GeO4)F2, and the corresponding Ti-topaz analog is then Al2(TiO4)F2. Besides the remnants of Ti-topaz analog, some topaz crystals contain black, spherical, or rounded crystals that also exhibit the topaz Raman spectrum (Figure 10).

Figure 9: Sum of Ga2O3 and GeO2 versus fluorine in Ga, Ge-rich topaz according to Setkova et al. (2024).

Figure 10a: Black topaz (b-Toz)) in matrix topaz (Toz) from Schneckenstein.

Figure 10b: Raman spectrum of a black topaz inclusion in topaz from Schneckenstein.

Figure 10c: Raman spectrum of black Ti-rich topaz in the first-order carbon range.

The origin of the black color of the topaz is unclear. Possible materials are simple carbon, graphite, and DLC. More studies are necessary.

According to Beny and Piriou (1987) [18], all Raman lines are characteristic of topaz. Using long-time spectra in the narrow range of 50 to 200 and 400 to 900 cm⁻¹, three Raman lines appear, which are characteristic of anatase (145, 514, and 638 cm⁻¹). Obviously, that black Ti-rich topaz is on the verge of disintegrating into anatase and topaz. Additionally, several “anomalous” secondary O-H stretching bands can be seen in the region from 3200 to 3950 cm⁻¹ (see Beny and Piriou, 1987) [18]. The black coloring of the topaz is caused by DLC (see Figure 10c).

Interpretation

After the first proof of spherical diamonds in pycnite-topaz from Altenberg, we have found unusual rutile-(anatase)-rich topaz inclusions in topaz from Schneckenstein. The appearance of this type of inclusion suggests that the inclusion was primarily a homogeneous mineral phase – a very Ti-rich topaz. Because this inclusion is now present in the Schneckenstein topaz in the upper crust, we can assume that the primary homogeneous inclusion originated from greater depth. That is supported by the mostly spherical diamond crystals, which we interpret as evidence of the SCF and/or SCM originating from mantle depths [17,19]. This statement is supportedbynumerous studies over thepastfew years that have provided evidence of HP and HT minerals (cristobalite X-I, coesite, diamond, lonsdaleite, moissanite, orthorhombic cassiterite, stishovite, and others) in Variscan mineralization in the Lusatian Mts, the Saxon Granulite Mts., the Erzgebirge, Slavkovský les, and Thuringia [17, 19, 20-24]. At last, the ascent of SCF and SCM from the mantle into the crust is not a rare, insignificant event. Besides water and other volatiles (F, CO2, CH4, higher hydrocarbons), economic important elements like Sn (as orthorhombic cassiterite) and many others, as well as diamond, lonsdaleite, and moissanite, are evidence of the interaction between mantle and crust via SCF and SCM (e.g., Thomas and Rericha, 2025) [25-27]. Such phases from the mantle region must have left their traces not only as minerals but also in significant isotope shifts and trace element ratios.

Conclusions

In summary, Raman spectroscopy shows that topaz from Altenberg pycnite is compositionally heterogeneous and includes domains with distinctly lower fluorine contents, whereas topaz from Schneckenstein contains unusual Ti-rich topaz-rutile inclusions together with diamond-like carbon and diamond. The occurrence of these carbon phases in both localities, combined with evidence for high-pressure Ti-bearing inclusions, supports the interpretation that supercritical fluids and/or melts derived from greater depth contributed to the formation of the pycnite rock and Schneckenstein topaz. These results strengthen the view that mantle-derived components may have played a significant role in the evolution of Variscan mineralization in the Erzgebirge.

Acknowledgment

My interest in topaz began in October 1960 during a visit to the Schneckenstein crag with Peter Haupt, also an apprentice at the Zwickau coal mine, whose father participated in the drilling program by Prof. L. Baumann and S. Gorny.

References

  1. Ebel HF, Bliefert C, Russey WE (2004) The Art if Scientific Writing. Wiley-VCH. Pg:595.
  2. Thomas R (1979) Untersuchungen von Einschlüssen zur thermodynamischen aund physikochemischen Charakteristic lagerstättenbildender Lösungen und Prozesse im magmatischen und postmagmatischen Bergakademie Freiberg, Dissertation Pg: 245 + 83.
  3. Thomas R (1982) Ergebnisse der thermobarometrischen Untersuchungen an Flüssigkeitseinschlüssen in Mineralen der postmagmatischen Zinn-wolfram-mineralisation des Freiberger Forschungshefte (FFH). C370: 5-85 + I-XVI.
  4. Thomas R (2026a) Raman spectroscopic determination of fluorine in topaz. Geol Earth Mar Sci 8: 1-8.
  5. Ribbe PH, Rosenberg PE (1971) Optical and X-ray determinative method for fluorine in topaz. American Mineralogist 56: 1812-1821.
  6. Loges A, Qiao S, Zhong X, Fuller J, John T (2025) Determination of fluorine concentration in Topaz using Raman spectroscopy. American Mineralogist (Revision 2). Pg: 45.
  7. Gatta GD, Nestola F, Bromiley GD, Loose A (2006) New insight into crystal chemistry of topaz: A multi-methodological American Mineralogist 91: 1839-1846.
  8. Zaitsev AM (2001) Optical Properties of Diamond -A Data Handbook. Berlin, Heidelberg, New York, Springer. Pg: 502.
  9. Topas – Das prachtvolle Mineral, der lebhafte Edelstein (1997). Extra Lapis 13. Christian Weise Verlag München. Pg: 95.
  10. Topaz – Perfect Cleavage (2011). Licensed edition. Extra Lapis No. 14. Christian Weise Verlag München. Pg: 100.
  11. Weinhold G (2002) Die Zinnerz-Lagerstätte Altenberg/Osterzgebirge. Bergbaumonographie Band 9, Freiberg. Pg: 283.
  12. Lausch H (2024) (Editor) Geologie und Mineralien des Zwitterstocks zu Manuskripte zum Montanwesen um Altenberg und Zinnwald, Bergbaumuseum und Knappenverein Altenberg e.V. Heft 7/2024. Pg: 213.
  13. Lahl B (2012) Königliche Topase vom Chemnitzer Verlag. Pg: 142.
  14. Spivak AV, Setkova TV, Borovikova EY, Kvas PS, Balitsky VS, et (2021) Physical chemical properties of geomaterials. Experiment in Geosciences 27: 105-107.
  15. Setkova TV, Balitsky VS, Spivak AV, Kuzmin AV, Borovikova EY, et al. (2024) Crystal growth, composition, structure, and Raman spectroscopy of novel Ga,Ge-rich topaz. Journal of Crystal Growth 637-638: 1-10 inclusive, the Supporting Information: 1-18.
  16. Xie X, Gu X, Chen M (2023) The discovery of TiO2-II, the a-PbO2 -structured high-pressure polymorph of rutile, in the Suizhou L6 chondrite. Acta Geochim 42: 1-8.
  17. Thomas R (2025) The change from the supercritical fluid-melt system into the under-critical stage: The Zinnwald example. Geol Earth Mar Sci 7: 1-9.
  18. Beny JM, Piriou B (1987) Vibrational spectra of single-crystal Phys Chem Minerals 15: 148-154.
  19. Thomas R (2026b) Ultrahigh-pressure and -temperature mineral inclusions in more crustal mineralizations: The role of supercritical fluids. Geol Earth Mar Sci 5: 1-2.
  20. Thomas R (2024a) The CaCl2-to-rutile phase transition in SnO2 from high to low pressure in nature. Geol Earth Mar Sci 6: 1-4.
  21. Thomas R (2024b) Rhomboedric cassiterite as inclusions in tetragonal cassiterite from Slavkovský les – North Bohemia (Czech Republic). Geol Earth Mar Sci 6: 1-6.
  22. Thomas R, Recknagel U (2024) Lonsdaleite, diamond, and graphite in a lamprophyre: Minette from East-Thuringia/Germany. Geol Earth Mar Sci 6: 1-4.
  23. Thomas R, Trinkler M (2024) Monocrystalline lonsdaleite in REE-rich fluorite from Sadisdorf and Zinnwald/E-Erzgebirge, Germany. Geol Earth Mar Sci 6: 1-5.
  24. Thomas R, Davidson P, Rericha A, Recknagel U (2022) Discovery of stishovite in the prismatine-bearing granulite from Waldheim, Germany: A possible role of supercritical fluids of ultrahigh-pressure origin. Geosciences 12: 196: 1-13.
  25. Thomas R, Rericha A (2025) Extreme element enrichment by the interaction of supercritical fluids from the mantle with crustal rocks. Minerals 33: 1-10.
  26. Thomas R, Brümmer G, Scheiblauer K (2025) Paradigm change of pegmatite formation – Where does the water come from?
  27. Thomas R, Davidson P (2013) The missing link between granites and granitic Journal of Geosciences 58: 183-200.

Decolonising Medical Education in Low- and Middle- Income Countries: Reclaiming Social Accountability Beyond Commercial Metrics

DOI: 10.31038/JCRM.2026912

Introduction

Medical education in low- and middle-income countries (LMICs) is experiencing profound transformation. Expansion of private educational institutions, increasing global competition, international accreditation systems, and growing commercial influences have reshaped how medical schools define quality, excellence, and success. While these developments have contributed to educational expansion and international engagement, they have also intensified concerns regarding equity, social accountability, and the extent to which medical education remains responsive to local population health needs.

Recent evidence suggests that commercialisation and neo-colonial influences increasingly intersect within medical education systems. A qualitative evidence meta-synthesis examining studies from LMICs identified recurring patterns through which market incentives and external systems of legitimacy influence educational priorities, professional identity formation, and institutional decision-making [1]. Four interconnected mechanisms emerged: credential dependence linked to migration markets, market-driven educational recruitment, commercial influence on continuing professional development, and accreditation functioning as a market signal. Collectively, these mechanisms illustrate how commercial and neo-colonial forces can reshape institutional priorities, often privileging market value over social value.

These findings raise important questions regarding the purpose of medical education. Should educational success be defined primarily through international recognition, accreditation status, and graduate mobility, or through meaningful contributions to population health and health system strengthening? This commentary argues that the central challenge facing medical education in LMICs is not commercialisation itself, but the growing dominance of commercial and externally driven metrics over the social mission of medical education. Decolonising medical education therefore requires renewed commitment to social accountability, local relevance, and educational sovereignty.

Commercialism and the Reproduction of Dependency

Commercialisation and neo-colonialism are often treated as distinct phenomena, yet they frequently reinforce one another. Market forces increasingly shape educational priorities while simultaneously strengthening dependency on external standards, credentials, and systems of validation [1].

One of the most visible manifestations of this dynamic is credential dependence. Qualifications and examinations associated with high-income countries continue to function as markers of prestige, competence, and professional legitimacy. For many students, educational success is increasingly linked to opportunities for international mobility rather than service within local healthcare systems. Educational institutions may consequently adapt curricula, assessment systems, and strategic priorities to support these aspirations.

Such processes contribute to what Abimbola describes as the “foreign gaze,” whereby external actors and institutions exert disproportionate influence over how value and legitimacy are assigned [2]. Within medical education, this can result in the privileging of externally derived standards and knowledge systems while local expertise, contextual realities, and community priorities receive comparatively less attention.

Commercial pressures further intensify these dynamics. Competition for students, international partnerships, and institutional prestige may encourage medical schools to align themselves with globally recognised benchmarks. Although these efforts can enhance visibility and reputation, they may also redirect attention away from pressing local health needs. Educational quality becomes increasingly associated with external recognition rather than measurable contributions to healthcare delivery and population health.

The concern is therefore not that commercial investment or global engagement are inherently problematic. Rather, difficulties arise when market-oriented values become the dominant organising principle of educational systems and displace commitments to public service and social responsibility.

Accreditation, Regulation, and Educational Sovereignty

Accreditation has become one of the most influential forces shaping contemporary medical education. Ideally, accreditation promotes quality improvement, accountability, and transparency. However, accreditation systems do not operate in a political vacuum.

Rashid et al. argue that regulatory and accreditation processes must be examined through a decolonial lens because standards developed within particular educational, cultural, and economic contexts are frequently transferred across diverse settings with limited adaptation [3]. Consequently, accreditation may function not only as a mechanism for quality assurance but also as a vehicle through which external assumptions regarding educational excellence are reproduced.

The findings of Khan et al. [1] suggest that accreditation increasingly serves a dual purpose. While it continues to support quality improvement, it also functions as a form of market currency used for institutional branding, recruitment, and competitive positioning. Under such conditions, institutions may prioritise compliance with measurable indicators rather than meaningful educational transformation.

A decolonised approach to accreditation does not require rejecting standards or abandoning international collaboration. Rather, it requires recognising that educational quality cannot be reduced to technical compliance alone. Regulatory frameworks should support educational sovereignty by allowing institutions to respond to local health priorities while maintaining rigorous standards. Quality indicators should therefore include measures of social accountability, community engagement, workforce distribution, and responsiveness to national health needs.

Reclaiming Social Accountability

If commercialisation and neo-colonial influences risk distancing medical education from its social purpose, social accountability offers a framework through which that purpose can be reclaimed.

Boelen and Woollard argue that socially accountable institutions direct their education, research, and service activities towards addressing the priority health concerns of the populations they serve [4]. This perspective shifts evaluation away from purely institutional achievements and towards societal impact. Questions of educational quality become linked to workforce retention, health equity, community engagement, and contributions to health system strengthening.

This approach is particularly relevant in LMICs, where healthcare systems frequently face workforce shortages, uneven service distribution, and substantial disease burdens. In such settings, educational excellence should be measured not only by institutional prestige but also by the ability of graduates to address local health challenges and improve healthcare outcomes.

Importantly, social accountability does not imply isolation from global educational networks. Rather, it encourages forms of collaboration grounded in reciprocity rather than dependency. Abimbola highlights the importance of recognising LMIC institutions as producers of knowledge rather than passive recipients of expertise [2]. Decolonising medical education therefore requires creating space for local perspectives, local scholarship, and contextually relevant innovation within global educational conversations.

Recent guidance from Abdalla et al. further emphasises that social accountability should be embedded throughout the educational continuum rather than treated as an aspirational principle [5]. Curriculum design, assessment systems, institutional governance, and accreditation frameworks should all reflect commitments to community needs and health equity.

Towards a More Equitable Future

The future of medical education in LMICs will inevitably remain connected to global educational systems. The challenge is not whether institutions should engage internationally, but how such engagement can occur without undermining local relevance and social responsibility.

Several priorities emerge from current evidence. First, educational institutions should critically evaluate the influence of commercial incentives on decision-making processes and ensure that financial considerations do not supersede public health priorities. Second, accreditation and regulatory systems should incorporate measures of social accountability alongside traditional quality indicators. Third, greater investment is required in locally generated research, educational leadership, and scholarship to reduce dependence on externally defined models of excellence.

Most importantly, the definition of educational success must expand beyond accreditation status, rankings, and graduate mobility. Success should also be reflected in stronger health systems, improved health outcomes, reduced inequities, and meaningful contributions to the communities medical schools are intended to serve.

It is important to recognise that LMICs are not a homogeneous group, and the manifestations of commercialisation and neo-colonial influence may vary considerably across educational, regulatory, and health system contexts.

Conclusion

Commercialisation is not inherently detrimental to medical education. Investment, innovation, and international collaboration have contributed substantially to educational development across many LMICs. However, challenges emerge when market-oriented values become the dominant framework through which educational success is defined and evaluated.

Evidence from recent scholarship suggests that commercial and neo-colonial dynamics frequently reinforce one another, shaping educational priorities, professional aspirations, and institutional behaviour in ways that may distance medical education from its social mission [1]. Medical education exists not merely to produce internationally competitive graduates, but to strengthen health systems, advance health equity, and improve population health outcomes within the communities it serves.

Decolonising medical education therefore requires more than curricular reform. It demands a critical re-examination of the values that define educational excellence and a renewed commitment to social accountability as a guiding principle. The path forward does not lie in rejecting global engagement, but in ensuring that medical education remains accountable first and foremost to the populations it is intended to serve.

Declarations

Competing Interests

The author declares that there are no competing interests.

Funding Information

No external funding was received for this work.

Author Contribution

AFK conceptualised the commentary, conducted the literature review, drafted the manuscript, and approved the final version for submission.

Acknowledgements

The author would like to acknowledge the contributions of researchers whose work informed the development of this commentary.

Keywords

Medical education; Social accountability; Decolonisation; Commercialisation; Accreditation; Low- and middle-income countries

References

  1. Khan AF, Junaid A, Khan JS (2026) Commercialism in medical education in low- and middle-income countries through a neo-colonial lens: a qualitative evidence meta-synthesis (2015-2025). Pak J Med Sci 42: 1309-1317.
  2. Abimbola S (2019) The foreign gaze: authorship in academic global BMJ Glob Health 4: e002068.
  3. Rashid MA, Ali SM, Dharanipragada K (2023) Decolonising medical education regulation: a global BMJ Glob Health 8: e011622. [crossref]
  4. Boelen C, Woollard R (2009) Social accountability and accreditation: a new frontier for educational institutions. Med Educ 43: 887-894.
  5. Abdalla ME, Taha MH, Onchonga D, Preston R, Barber C, et (2024) Instilling social accountability into the health professions education curriculum with international case studies: AMEE Guide No. 175. Med Teach.

Maternal and Neonatal Outcomes Associated with Hypothyroidism During Pregnancy in a Hospital Based Study in Bangladesh

DOI: 10.31038/EDMJ.20261024

Abstract

Background: Thyroid disorders are among the most common endocrine conditions in pregnancy. Both overt and subclinical hypothyroidism have been linked to adverse maternal and fetal outcomes; however, data from Bangladesh remain limited. This study aimed to determine the prevalence of hypothyroidism and assess its association with maternal and neonatal outcomes.

Methods: This hospital-based prospective observational study was conducted at BIRDEM General Hospital between March 2018–December 2019 and December 2022–September 2023. A total of 60 pregnant women at their first antenatal visit were enrolled following inclusion and exclusion criteria. Data were collected through interviews, clinical examination, and laboratory investigations. Serum thyroid-stimulating hormone (TSH), free thyroxine (FT4), and antithyroid antibodies were measured in hypothyroid participants, while only TSH was measured in controls. Statistical analysis was performed using SPSS version 25.

Results: Of the 60 participants, 30 (50%) were euthyroid and 30 (50%) had hypothyroidism. Among the hypothyroid group, 21.67% were previously diagnosed and euthyroid on therapy, while 28.33% were newly diagnosed (including 12 subclinical and 5 overt cases). Antithyroid peroxidase antibody positivity was higher in subclinical hypothyroidism (66.7%), whereas most previously diagnosed cases were antibody negative (76.9%) (p < 0.05). A family history of thyroid disease was significantly more common in hypothyroid women (75%; OR 1.83, 95% CI 1.16–2.88). Hypothyroidism was associated with increased risks of maternal complications, including anemia, hypertension, preterm delivery, and cesarean section. Neonatal complications such as jaundice, hypoglycemia, low birth weight, and NICU admission were also more frequent. Newly diagnosed cases showed higher risks of adverse outcomes than previously known cases. No significant differences were observed across first-trimester thyroid hormone cut-off values.

Conclusions: Hypothyroidism, particularly newly diagnosed cases during pregnancy, is associated with adverse maternal and neonatal outcomes. Universal screening may enable early detection and improve pregnancy outcome.

Keywords

Hypothyroidism, Pregnancy, Subclinical hypothyroidism, Maternal outcomes, Fetal outcomes, Neonatal outcomes, Thyroid dysfunction, Pregnancy complications, Antithyroid antibodies

Introduction

Thyroid disorders are among the most common endocrine conditions encountered during pregnancy and represent the second most frequent endocrinopathy after diabetes mellitus [1]. Hypothyroidism during pregnancy has gained increasing attention because of its potential impact on maternal health and fetal development. Globally, hypothyroidism affects a considerable proportion of pregnant women, with reported prevalence varying across populations depending on iodine status, diagnostic criteria, and screening practices [2]. In iodine-sufficient regions, the prevalence of hypothyroidism during pregnancy is estimated to be approximately 2%, while higher rates have been reported in several Asian populations [3].

In Bangladesh, thyroid disorders during pregnancy represent an important public health concern. Previous studies have reported varying prevalence rates of thyroid dysfunction among pregnant women, with subclinical hypothyroidism (SCH) being the most commonly identified abnormality [4,5]. According to the 2017 guidelines of the American Thyroid Association, maternal hypothyroidism is defined by elevated thyroid-stimulating hormone (TSH) levels during pregnancy. Subclinical hypothyroidism is characterized by elevated TSH with normal free thyroxine (FT4) levels, whereas overt hypothyroidism is defined by elevated TSH accompanied by decreased FT4 concentrations or TSH levels greater than 10 mIU/L regardless of FT4 levels [6]. Accurate diagnosis is essential because thyroid physiology undergoes significant changes during pregnancy, including increased thyroid hormone production, elevated thyroxine-binding globulin levels, and increased iodine requirements.

Adequate maternal thyroid hormone levels are essential for normal fetal growth and neurodevelopment, particularly during early pregnancy when the fetus relies largely on maternal thyroxine supply. Maternal hypothyroidism has been associated with several adverse obstetric and neonatal outcomes. These include miscarriage, preeclampsia, gestational hypertension, preterm birth, placental abruption, and low birth weight [7]. In addition, maternal thyroid dysfunction has been linked to impaired neurocognitive development in offspring due to insufficient thyroid hormone availability during critical periods of brain development.

Despite increasing recognition of the clinical importance of thyroid dysfunction in pregnancy, data on the prevalence and associated maternal and fetal outcomes remain limited in many developing countries, including Bangladesh. Variability in screening strategies and diagnostic thresholds further contributes to uncertainty regarding the burden of disease in this population. Therefore, the present study aimed to evaluate the prevalence of hypothyroidism during pregnancy and to assess its association with adverse maternal and fetal outcomes among pregnant women in Bangladesh.

Materials and Methods

Study Design and Setting

This prospective observational study was conducted at the Department of Endocrinology and the Department of Obstetrics and Gynaecology, BIRDEM General Hospital, Dhaka, Bangladesh. The study period extended from March 2018 to November 2019 and from December 2022 to September 2023.

Study Population and Sampling

Pregnant women in their first trimester attending antenatal visits at outpatient and inpatient departments were recruited. A purposive sampling technique was used, and all eligible participants during the study period were enrolled.

The sample size was calculated based on the risk of preeclampsia in normal (4%) and hypothyroid (29%) pregnant women at a 5% significance level and 95% confidence interval, yielding a minimum of 30 participants per group (total 60).

Inclusion and Exclusion Criteria

Inclusion Criteria

Pregnant women in the first trimester with or without hypothyroidism

  • Age 18–35 years
  • Receiving or not receiving thyroxine supplementation

Exclusion Criteria

  • Acute illness at presentation
  • Refusal to participate
  • History of diabetes mellitus or gestational diabetes
  • Hypertension or other chronic illnesses

Study Variables and Definitions

Variables Collected

  • Socio-demographic: age, education, occupation, residence
  • Menstrual history: last menstrual period
  • Obstetric history: gravida, para, gestational age
  • Clinical variables: BMI, blood pressure, thyroid-related symptoms

Operational Definitions

Hypothyroidism and subclinical hypothyroidism were defined according to ATA 2017 guidelines. Maternal and fetal outcomes were defined based on standard international guidelines (NICE, WHO, ACOG, ADA).

Data Collection and Study Procedure

Data were collected using a semi-structured questionnaire, clinical examination, and laboratory investigations.

Blood samples (5 mL) were collected after overnight fasting to measure serum TSH, FT4, and thyroid autoantibodies using ECLIA. Additional tests included CBC, urine analysis, ultrasonography, and OGTT as part of routine antenatal care.

Participants were followed through each trimester and up to the first postpartum week to assess maternal and fetal outcomes.

Statistical Analysis

Data were analyzed using SPSS version 25. Continuous variables were expressed as mean ± SD and categorical variables as frequency and percentage.

Comparisons were performed using:

  • Mann–Whitney U test / ANOVA (continuous variables)
  • Chi-square or Fisher’s exact test (categorical variables)
  • Kruskal–Wallis test (hormonal comparisons)

A p-value <0.05 was considered statistically significant.

Ethical Considerations

Ethical approval was obtained from the IRB of BIRDEM General Hospital. Written informed consent was obtained from all participants prior to data collection.

Quality Control and Confidentiality

Data quality was ensured through regular supervision and validation. Each participant was assigned a unique ID to maintain confidentiality, and access to identifiable data was restricted.

Funding and Budget

No additional investigations were required; all procedures were part of routine care. Costs were limited to administrative expenses borne by the investigator.

Results

A total of 60 pregnant women in the first trimester were included in this hospital-based prospective observational study conducted at the Departments of Obstetrics and Gynecology and Endocrinology, BIRDEM General Hospital, following predefined inclusion and exclusion criteria. Thyroid function was evaluated using serum thyroid-stimulating hormone (TSH) and free thyroxine (FT4) levels. The normal reference ranges were defined as TSH 0.40–4.0 mIU/L and FT4 9.14–23.18 pmol/L, and values outside these ranges were considered abnormal. Subclinical hypothyroidism (SCH) was defined as TSH levels between 4.0–10 mIU/L with normal FT4 levels, while overt hypothyroidism (OH) was defined as TSH >10 mIU/L and/or FT4 <9.14 pmol/L.

The mean age of the participants was 26.55 ± 4.01 years, with the highest proportion (46.7%, n=28) belonging to the 24–29 years age group. Most participants were undergraduates (68.3%, n=41), and the majority were homemakers (83.3%, n=50) (Table 1).

Table 1: Socio-demographic characteristics of the participants (n=60). Data presented as frequency and percentage over columns.

Characteristics

Frequency

Percentage (%)

Age (in years)
18-23

15

25

24-29

28

46.7

≥30

17

28.3

Mean ± SD

26.55 ± 4.01

Level of Education
Graduate

19

31.7

Undergraduate

41

68.3

Occupation
Service

10

16.7

Homemaker

50

83.3

An equal proportion of participants were primigravida and multigravida (50% each). The majority (73.3%, n=44) had no family history of thyroid disorders, while 26.7% (n=16) reported a positive family history. A history of abortion was present in only 3.3% (n=2) of participants (Table 2).

Table 2: Obstetric history of the study participants (n=60). Data presented as frequency and percentage over columns.

Variables

Frequency

Percentage (%)

Parity
Primigravida

30

50

Multigravida

30

50

H/O abortion
No

58

96.7

Yes

2

3.3

F/H of thyroid disease
No

44

73.3

Yes

16

26.7

Most participants (98.3%, n=59) were asymptomatic. Only one participant (1.7%, n=1) presented with symptoms suggestive of hypothyroidism, including facial puffiness, cold intolerance, constipation, and dry skin (Table 3).

Table 3: Symptoms of the study participants (n=60). Data presented as frequency and percentage over columns.

Symptoms

Frequency

Percentage (%)

Asymptomatic
No

1

1.7

Yes

59

98.3

Facial puffiness
Yes

1

1.7

No

59

98.3

Cold intolerance
Yes

1

1.7

No

59

98.3

Constipation
Yes

1

1.7

No

59

98.3

Dry skin
Yes

1

1.7

No

59

98.3

The mean body mass index (BMI) was 26.10 ± 2.66 kg/m². The mean heart rate was 75.81 ± 6.45 beats per minute, while the mean systolic and diastolic blood pressures were 121.06 ± 15.34 mmHg and 74.46 ± 9.51 mmHg, respectively. On thyroid examination, only one participant (1.7%, n=1) had a palpable thyroid gland, while the remaining participants had no abnormal findings (Table 4).

Table 4: Examination findings of the study participants (n=60). Data are presented as mean ± standard deviation (SD) for continuous variables and frequency with percentage (%) for categorical variables. BMI: Body mass index; bpm: beats per minute; SBP: systolic blood pressure; DBP: diastolic blood pressure.

Examination findings

Mean ± SD

BMI (kg/m²)

26.10 ± 2.66

Heart rate (bpm)

75.81 ± 6.45

SBP (mmHg)

121.06 ± 15.34

DBP (mmHg)

74.46 ± 9.51

Thyroid gland

Frequency

Percentage (%)

Not palpable

59

98.3

Palpable

1

1.7

Half of the participants (50%, n=30) had normal thyroid function. Among the remaining participants, 28.33% (n=17) were newly diagnosed with hypothyroidism during pregnancy, while 21.67% (n=13) had a prior diagnosis of hypothyroidism before pregnancy (Figure 1).

Figure 1: Thyroid status of the study participants (n=60).

Among the 30 participants with hypothyroidism in the first trimester, 13 were previously diagnosed cases who were euthyroid on replacement therapy.

Of the 17 newly diagnosed cases, 12 were classified as subclinical hypothyroidism (SCH) and five as overt hypothyroidism (OH) (Figure 2).

Figure 2: Distribution of hypothyroid participants according to thyroid status at 1st trimester of pregnancy (n=30).

Family history of thyroid disease was more common among hypothyroid participants (75%, n=12) compared to the control group (40.9%, n=18). This difference was statistically significant (p=0.020), with an odds ratio of 1.83 (95% CI: 1.16–2.88). No significant differences were observed between the two groups in terms of age, parity, history of abortion, body mass index (BMI), heart rate, systolic blood pressure (SBP), or diastolic blood pressure (DBP) (Table 5).

Table 5: Comparison of socio-demographic, history and examination findings of the study participants (n=60). Data are presented as frequency (percentage) for categorical variables and as mean ± standard deviation (SD) for continuous variables. OR: odds ratio; CI: confidence interval. s indicates statistically significant (p < 0.05), and ns indicates not significant (p ≥ 0.05).

Variables

Control group (n=30) Hypothyroid group (n=30) OR (95% CI)

p-value

Frequency(%)

Frequency (%)

Age (in years)
18-23

8 (53.3)

7 (46.7)

24-29

12 (42.9)

16 (57.1)

0.558ns

>30

10 (58.8)

7 (41.2)

……………….

Mean ± SD

26.63 ± 4.14

26.46 ± 3.94

0.935ns

Parity
Primigravida

18 (60)

12 (40) 0.66 (0.39-1.12)

0.121ns

Multigravida

12 (40)

18 (60)

H/O abortion
Present

0 (0)

2 (100) 0.48 (0.37-0.63)

0.492ns

Absent

30 (51.7)

28 (48.3)

F/H of thyroid disease
Yes

4 (25)

12 (75) 1.83 (1.16-2.88)

0.020s

No

26 (59.1)

18 (40.9)

Mean ± SD

Mean ± SD

BMI (kg/m2)

25.93 ± 2.23

26.29 ± 3.09

0.944ns

Heart rate(bpm)

76.30 ± 5.24

75.28 ± 7.60

0.815ns

SBP (mmHg)

119.93 ± 11.46

122.20 ± 18.57

0.666ns

DBP (mmHg)

74.33 ± 7.96

74.60 ± 10.99

0.660ns

Comparison of clinical and laboratory parameters among control, newly diagnosed hypothyroid, and known hypothyroid groups showed no significant differences in age, BMI, heart rate, SBP, or DBP. However, serum TSH levels differed significantly among the groups (p< 0.001), with the highest mean TSH observed in the newly diagnosed hypothyroid group (19.67 ± 29.49 mIU/L) compared to the control (1.55 ± 0.57 mIU/L) and known hypothyroid groups (2.83 ± 0.51 mIU/L) (Table 6).

Table 6: Comparison of clinical and laboratory variables between control and hypothyroid group (n= 60). Data are presented as mean ± standard deviation (SD). Age is expressed in years; BMI in kg/m²; HR in beats per minute (bpm); SBP and DBP in millimeters of mercury (mmHg); and TSH in milli-international units per Liter (mIU/L). BMI: body mass index; HR: heart rate; SBP: systolic blood pressure; DBP: diastolic blood pressure; TSH: thyroid-stimulating hormone. s indicates statistically significant (p < 0.05), and ns indicates not significant (p ≥ 0.05).

Variables

Control group (n=30) Hypothyroid Group (n=30)

p-value

Newly diagnosed (n=17)

Known (n=13)

Mean±SD

Mean±SD

Mean±SD

Age

26.63±4.14

25.76±4.53 27.38±2.93

0.550ns

BMI

25.93±2.23

26.97±3.45 25.49±2.52

0.307ns

HR

76.30±5.24

73.73±7.55 77.07±7.55

0.334ns

SBP

119.93±11.46

123.17±18. 120.92±19.69

0.790ns

DBP

74.33±7.96

75.29±12.24 73.69±9.51

0.899ns

TSH

1.55±0.57

19.67±29.49 2.83±0.51

0.001s

Among the 30 hypothyroid participants, TSH levels varied significantly across the three trimesters among the known hypothyroid, subclinical hypothyroid (SCH), and overt hypothyroid groups. In the first trimester, mean TSH levels were highest in the overt hypothyroid group (52.04 ± 40.24 mIU/L), followed by the SCH group (6.18 ± 1.32 mIU/L), and lowest in the known hypothyroid group (2.83 ± 0.51 mIU/L). A significant reduction in TSH levels was observed in the second and third trimesters across all groups. These differences were statistically significant based on the Kruskal-Wallis test (p < 0.05) (Table 7).

Table 7: TSH level of the hypothyroid participants in each trimester (n=30). Data presented as mean ± SD over columns. P-value reached through c Kruskal-Wallis test for non-normally distributed data. SCH: subclinical hypothyroidism; Overt: overt hypothyroidism. s indicates statistically significant (p < 0.05).

Time of estimation of thyroid level

TSH level

p-value Overt (n=5)

Known hypothyroid group (n=13)

New hypothyroid group (n= 17) SCH (n=12)

Mean ± SD

Mean ± SD

Mean ± SD

First Trimester

2.83 ± 0.51

6.18 ±1.32 52.04 ± 40.24

<0.001s

Second Trimester

1.65 ± 0.49

2.11 ± 0.45 2.37 ± 0.25

0.010s

Third Trimester

1.29 ± 0.45

2.13 ± 0.54 2.10 ± 0.25

0.002s

Regarding thyroid antibody status, anti-thyroid peroxidase (anti-TPO) antibody positivity was higher among SCH (66.7%, n=8) and overt hypothyroid participants (80%, n=4), whereas the majority of known hypothyroid participants were anti-TPO antibody negative (76.9%, n=10). This difference was statistically significant (p=0.043) (Table 8).

Table 8: Thyroid antibody status in the hypothyroid group (n=30). Data are presented as frequency (percentage). Fisher’s exact test was used for categorical variables where the expected cell count was less than 5. SCH: subclinical hypothyroidism; Overt: overt hypothyroidism; Anti-TPO Ab: anti-thyroid peroxidase antibody; Anti-Tg Ab: anti-thyroglobulin antibody. s indicates statistically significant (p < 0.05), and ns indicates not significant (p ≥ 0.05).

Hypothyroid status

Thyroid Antibody

p-value

Anti TPO Ab positive

Anti TPO Ab negative

Frequency (%)

Frequency (%)

SCH

8 (66.7)

4 (33.3)

Overt

4 (80)

1 (20)

a0.043s

Known hypothyroid group

3 (23.1)

10 (76.9)

Anti Tg positive

Anti Tg negative

Frequency (%)

Frequency (%)

SCH

7 (58.3)

5 (41.7)

Overt

3 (60)

2 (40)

a0.160ns

Known hypothyroid group

3 (23.1)

10 (76.9)

In contrast, anti-thyroglobulin (anti-Tg) antibody positivity was observed in 58.3% (n=7) of SCH and 60% (n=3) of overt hypothyroid participants, while most known hypothyroid participants were anti-Tg antibody negative (76.9%, n=10). However, this difference was not statistically significant (p=0.160) (Table 8).

Among the hypothyroid participants (n=30), cesarean section was the most common maternal outcome (n=12), followed by anemia of pregnancy (n=8), hypertension (n=5), and gestational diabetes mellitus (GDM) (n=5). Preterm delivery occurred in four cases. Rare outcomes included pre-eclampsia, eclampsia, and spontaneous abortion, each observed in one case.

Regarding fetal outcomes, neonatal jaundice was the most frequent finding (n=5), followed by neonatal hypoglycemia (n=4) and NICU admission (n=4). Low birth weight was observed in two cases (Table 9).

Table 9: Maternal and fetal outcome of the hypothyroid group only (n=30). Data presented as frequency and percentage over rows. SCH: subclinical hypothyroidism; Overt: overt hypothyroidism; HTN: hypertension; GDM: gestational diabetes mellitus; NICU: neonatal intensive care unit. Percentages are calculated within each group. s indicates statistically significant (p < 0.05), and ns indicates not significant (p ≥ 0.05).

Hypothyroid status

Thyroid Antibody

p-value

Anti TPO Ab positive

Anti TPO Ab negative

Frequency (%)

Frequency (%)

SCH

8 (66.7)

4 (33.3)

Overt

4 (80)

1 (20)

a0.043s

Known hypothyroid group

3 (23.1)

10 (76.9)

Anti Tg positive

Anti Tg negative

Frequency (%)

Frequency (%)

SCH

7 (58.3)

5 (41.7)

Overt

3 (60)

2 (40)

a0.160ns

Known hypothyroid group

3 (23.1)

10 (76.9)

When outcomes were compared based on thyroid antibody status, maternal complications such as anemia (62.5%, n=5), cesarean section (41.7%, n=5), GDM (60%, n=3), hypertension (60%, n=3), and preterm delivery (75%, n=3) were more common among anti-TPO antibody-positive participants.

Among fetal outcomes, neonatal jaundice was observed in all anti-TPO antibody-positive cases (100%, n=5), and this association was statistically significant (p=0.042). Neonatal hypoglycemia and NICU admission were also more frequent in the anti-TPO positive group (75%, n=3 each), although these differences were not statistically significant (Table 10).

Table 10: Comparison of maternal and fetal outcome of the hypothyroid group according to thyroid antibody status (n=30). Data are presented as frequency (n) and percentage (%). The chi-square test was used for categorical variables, and Fisher’s exact test was applied when the expected cell count was less than 5. Anti-TPO: anti-thyroid peroxidase antibody; HTN: hypertension; GDM: gestational diabetes mellitus; NICU: neonatal intensive care unit. s indicates statistically significant (p < 0.05), and ns indicates not significant (p ≥ 0.05).

Outcome

Thyroid Antibody

p-value

Anti TPO positive

Anti TPO negative

Frequency (%)

Frequency (%)

Maternal Outcome
Pre-eclampsia

1 (100)

0 (0)

>0.99ns

Eclampsia

1 (100)

0 (0)

>0.99ns

HTN

3 (60)

2 (40)

>0.99ns

Spontaneous abortion

1 (100)

0 (0)

>0.99ns

C-section

5 (41.7)

7 (58.3)

0.456ns

Anemia of pregnancy

5 (62.5)

3 (37.5)

0.682ns

GDM

3 (60)

2 (40)

>0.99ns

Preterm delivery

3 (75)

1 (25)

0.598ns

Fetal Outcome
Low birth weight

1 (50)

1 (50)

>0.99ns

Neonatal jaundice

5 (100)

0 (0)

0.042s

Neonatal hypoglycemia

3 (75)

1 (25)

0.598ns

NICU admission

3 (75)

1 (25)

0.598ns

Compared to the control group, hypothyroid participants showed higher odds of several maternal complications, including eclampsia and spontaneous abortion (OR=2.03), anemia of pregnancy (OR=1.62), hypertension (OR=1.51), preterm delivery (OR=1.38), gestational diabetes mellitus (OR=1.30), and cesarean section (OR=1.15). However, none of these associations reached statistical significance (p > 0.05). The odds of preeclampsia were similar between the two groups (OR=1.00) (Table 11).

Table 11: Comparison of maternal outcome of the study participants (n=60). Data are presented as frequency (n) and percentage (%). The chi-square test was used for categorical variables, and Fisher’s exact test was applied when the expected cell count was less than 5. OR: odds ratio; CI: confidence interval; HTN: hypertension; GDM: gestational diabetes mellitus. s indicates statistically significant (p < 0.05), and ns indicates not significant (p ≥ 0.05).

Variables

Control group (n=30) Hypothyroid group (n=30) OR (95% CI)

p-value

Frequency (%)

Frequency (%)

Preeclampsia
Yes

1 (50)

1 (50) 1.00 (0.24-4.09)

>0.99ns

No

29 (50)

29 (50)

Eclampsia
Yes

0 (0)

1 (100) 2.03 (1.56-2.63)

>0.99ns

No

30 (50.8)

29 (49.2)

HTN
Yes

2 (28.6)

5 (71.4) 1.51 (0.87-2.62)

0.424ns

No

28 (52.8)

25 (47.2)

Spontaneous abortion
Yes

0 (0)

1 (100) 2.03 (1.56-2.63)

>0.99ns

No

30 (50.8)

29 (49.2)

C-section
Yes

10 (45.5)

12 (54.5) 1.15 (0.69-1.91)

0.592ns

No

20 (52.6)

18 (47.4)

Anemia of pregnancy
Yes

3 (27.3)

8 (72.7) 1.62 (1.00-2.60)

0.095ns

No

27 (55.1)

22 (44.9)

GDM
Yes

3 (37.5)

5 (62.5) 1.30 (0.70-2.38)

0.706ns

No

27 (51.9)

25 (48.1)

Preterm delivery
Yes

2 (33.3)

4 (66.7) 1.38 (0.73-2.59)

0.671ns

No

28 (51.9)

26 (48.1)

Similarly, fetal outcomes such as neonatal jaundice (OR=1.51), neonatal hypoglycemia (OR=1.38), low birth weight (OR=1.35), and NICU admission (OR=1.16) were more frequent among newborns of hypothyroid mothers compared to controls. However, these differences were not statistically significant (p > 0.05) (Table 12).

Table 12: Comparison of fetal outcome of the study participants (n=60). Data are presented as frequency (n) and percentage (%). Fisher’s exact test was used for categorical variables when the expected cell count was less than 5. OR: odds ratio; CI: confidence interval; NICU: neonatal intensive care unit. s indicates statistically significant (p < 0.05), and ns indicates not significant (p ≥ 0.05).

Variables

Control group (n=30) Hypothyroid group (n=30) OR (95% CI)

p-value

Frequency (%)

Frequency (%)

Low birth weight
Yes

1 (33.3)

2 (66.7) 1.35 (0.58-3.15)

>0.99ns

No

29 (50.9)

28 (49.1)

Neonatal jaundice
Yes

2 (28.6)

5 (71.4) 1.51 (0.87-2.62)

0.424ns

No

28 (52.8)

25 (47.2)

Neonatal hypoglycemia
Yes

2 (33.3)

4 (66.7) 1.38 (0.73-2.59)

0.671ns

No

28 (51.9)

26 (48.1)

NICU admission
Yes

3 (42.9)

4 (57.1) 1.16 (0.58-2.34)

>0.99ns

No

27 (50.9)

26 (49.1)

Among hypothyroid participants, newly diagnosed cases demonstrated higher odds of certain maternal complications, including preeclampsia, eclampsia, and spontaneous abortion (OR=1.81), compared to those with known hypothyroidism. However, no statistically significant differences were observed between the two groups for any maternal outcomes, including hypertension, cesarean section, anemia of pregnancy, gestational diabetes mellitus, or preterm delivery (p > 0.05) (Table 13).

Table 13: Comparison of maternal outcome of the hypothyroid group according to time of diagnosis (n=30). Data are presented as frequency (percentage), and odds ratio (OR) with 95% confidence interval (CI) was calculated to assess the association between variables. HTN: Hypertension; GDM: Gestational diabetes mellitus; C-section: Cesarean section. ns denotes not statistically significant (p > 0.05). Chi- square test and Fisher’s exact test were applied where appropriate.

Variables

Known hypothyroid group (n=13) New hypothyroid group (n=17) OR (95% CI)

p-value

Frequency (%)

Frequency (%)

Preeclampsia
Yes

0 (0)

1 (100) 1.81 (1.30-2.51)

>0.99ns

No

13 (44.8)

16 (55.2)

Eclampsia
Yes

0 (0)

1 (100) 1.81 (1.30-2.51)

>0.99ns

No

13 (44.8)

16 (55.2)

HTN
Yes

2 (40)

3 (60) 0.84 (0.12-5.99)

>0.99ns

No

11 (44)

14 (56)

Spontaneous abortion
Yes

0 (0)

1 (100) 1.81 (1.30-2.51)

>0.99ns

No

13 (44.8)

16 (55.2)

C-section
Yes

5 (41.7)

7 (58.3) 0.89 (0.20-3.91)

0.880ns

No

8 (44.4)

10 (55.6)

Anemia of pregnancy
Yes

3 (37.5)

5 (62.5) 0.72 (0.13-3.78

>0.99ns

No

10 (45.5)

12 (54.5)

GDM
Yes

1 (20)

4 (80) 0.27 (0.02-2.77)

0.355ns

No

12 (48)

13 (52)

Preterm delivery
Yes

1 (25)

3 (75) 0.38 (0.03-4.24)

0.613ns

No

12 (46.2)

14 (53.8)

Regarding fetal outcomes, newborns of mothers with newly diagnosed hypothyroidism showed higher odds of neonatal hypoglycemia and NICU admission (OR=2.00 each) compared to those with known hypothyroidism. In contrast, low birth weight was slightly more frequent among newborns of mothers with known hypothyroidism (OR=1.33). However, none of these differences were statistically significant (p > 0.05) (Table 14).

Table 14: Comparison of fetal outcome of the hypothyroid group according to time of diagnosis (n=30). Data are presented as frequency (n) and percentage (%). Fisher’s exact test was used for categorical variables when the expected cell count was less than 5. OR: odds ratio; CI: confidence interval; NICU: neonatal intensive care unit. s indicates statistically significant (p < 0.05), and ns indicates not significant (p ≥ 0.05).

Variables

Known hypothyroid group (n=13) New hypothyroid group (n=17) OR (95% CI)

p-value

Frequency (%)

Frequency (%)

Low birth weight
Yes

1 (50)

1 (50) 1.33(0.07-23.54)

>0.99ns

No

12 (42.9)

16 (57.1)

Neonatal jaundice
Yes

1 (20)

4 (80) 0.27 (0.02-2.77)

0.355ns

No

12 (48)

13 (52)

Neonatal hypoglycemia
Yes

0 (0)

4 (100) 2.00 (1.36-2.93)

0.113ns

No

13 (50)

13 (50)

NICU admission
Yes

0 (0)

4 (100) 2.00 (1.36-2.93)

0.113ns

No

13 (50)

13 (50)

Among hypothyroid participants, maternal outcomes were compared based on first-trimester TSH levels (≤4 vs >4 mIU/L). Although some complications such as preeclampsia, eclampsia, spontaneous abortion, gestational diabetes mellitus, and preterm delivery were observed more frequently in participants with TSH >4 mIU/L, none of these differences were statistically significant (p > 0.05) (Table 15).

Table 15: Comparison of maternal outcome of the hypothyroid group according TSH level in first trimester (n=30). Data are presented as frequency (n) and percentage (%). Fisher’s exact test was used for categorical variables when the expected cell count was less than 5. TSH: thyroid-stimulating hormone; HTN: hypertension; GDM: gestational diabetes mellitus. s indicates statistically significant (p < 0.05), and ns indicates not significant (p ≥ 0.05).

Variables

TSH level in first trimester

p-value

≤4

>4

Frequency (%)

Frequency (%)

Preeclampsia
Yes

0 (0)

1 (100)

>0.99ns

No

13 (44.8)

16 (55.2)

Eclampsia
Yes

0 (0)

1 (100)

>0.99ns

No

13 (44.8)

16 (55.2)

HTN
Yes

2 (40)

3 (60)

>0.99ns

No

11 (44)

14 (56)

Spontaneous abortion
Yes

0 (0)

1 (100)

>0.99ns

No

13 (44.8)

16 (55.2)

C-section
Yes

5 (41.7)

7 (58.3)

0.880ns

No

8 (44.4)

10 (55.6)

Anemia of pregnancy
Yes

3 (37.5)

5 (62.5)

>0.99ns

No

10 (45.5)

12 (54.5)

GDM
Yes

1 (20)

4 (80)

0.355ns

No

12 (48)

13 (52)

Preterm delivery
Yes

1 (25)

3 (75)

0.613ns

No

12 (46.2)

14 (53.8)

Similarly, fetal outcomes, including low birth weight, neonatal jaundice, neonatal hypoglycemia, and NICU admission, were more frequently observed among participants with TSH >4 mIU/L. However, no statistically significant differences were found between the two groups (p > 0.05) (Table 16).

Table 16: Comparison of fetal outcome of the hypothyroid group according TSH level in first trimester (n=30). Data are presented as frequency (n) and percentage (%). Fisher’s exact test was used for categorical variables when the expected cell count was less than 5. TSH: thyroid-stimulating hormone; LBW: low birth weight; NICU: neonatal intensive care unit. s indicates statistically significant (p < 0.05), and ns indicates not significant (p ≥ 0.05).

Variables

TSH level in first trimester

p-value

≤4 mIU/L

>4 mIU/L

Frequency (%)

Frequency (%)

LBW
Yes

1 (50)

1 (50)

>0.99ns

No

12 (42.9)

16 (57.1)

Neonatal jaundice
Yes

1 (20)

4 (80)

0.355ns

No

12 (48)

13 (52)

Neonatal hypoglycemia
Yes

0 (0)

4 (100)

0.113ns

No

13 (50)

13 (50)

NICU admission
Yes

0 (0)

4 (100)

0.113ns

No

13 (50)

13 (50)

Among hypothyroid participants, maternal outcomes were compared according to first-trimester FT4 levels (<9.14, 9.14–16.00, and 16.01–23.18 pmol/L). Although variations in the distribution of complications such as preeclampsia, eclampsia, hypertension, spontaneous abortion, cesarean section, anemia of pregnancy, gestational diabetes mellitus, and preterm delivery were observed across the FT4 categories, none of these differences were statistically significant (p > 0.05) (Table 17).

Table 17: Comparison of maternal complications of the hypothyroid group according to FT4 level in first trimester (n=30). Data are presented as frequency (n) and percentage (%). Fisher’s exact test was used for categorical variables when the expected cell count was less than 5. FT4: free thyroxine; HTN: hypertension; GDM: gestational diabetes mellitus. s indicates statistically significant (p < 0.05), and ns indicates not significant (p ≥ 0.05).

Variables

FT4 level in first trimester

p-value

<9.14

9.14-16.00

16.01-23.18

Frequency (%)

Frequency (%)

Frequency (%)

Preeclampsia
Yes

0 (0)

1 (100) 0 (0)

>0.99ns

No

5 (19.2)

14 (53.8)

7 (26.9)

Eclampsia
Yes

1 (100)

0 (0) 0 (0)

0.185ns

No

4 (15.4)

15 (57.7)

7 (26.9)

HTN
Yes

0 (0)

3 (75) 1 (25)

0.185ns

No

5 (21.7)

12 (52.2)

6 (26.1)

Spontaneous abortion
Yes

1 (100)

0 (0) 0 (0)

0.185ns

No

4 (15.4)

15 (57.7)

7 (26.9)

C-section
Yes

1 (10)

5 (50) 4 (40)

0.492ns

No

4 (23.5)

10 (58.8)

3 (17.6)

Anemia of pregnancy
Yes

2 (28.6)

4 (57.1) 1 (14.3)

0.720ns

No

3 (15)

11 (55)

6 (30)

GDM
Yes

1 (20)

3 (60) 1 (20)

>0.99ns

No

4 (18.2)

12 (54.5)

6 (27.3)

Preterm delivery
Yes

1 (33.3)

1 (33.3) 1 (33.3)

0.749ns

No

4 (16.7)

14 (58.3)

6 (25)

Similarly, fetal outcomes, including low birth weight, neonatal jaundice, neonatal hypoglycemia, and NICU admission, showed variation across different FT4 level categories. However, no statistically significant associations were found between FT4 levels and fetal outcomes (p > 0.05) (Table 18).

Table 18: Comparison of fetal outcome of the hypothyroid group according to FT4 level in first trimester (n=30). Data are presented as frequency (n) and percentage (%). Fisher’s exact test was used for categorical variables when the expected cell count was less than 5. FT4: free thyroxine; NICU: neonatal intensive care unit. s indicates statistically significant (p < 0.05), and ns indicates not significant (p ≥ 0.05).

Variables

FT4 level in first trimester

p-value

<9.14

9.14-16.00

16.01-23.18

Frequency (%)

Frequency (%)

Frequency (%)

Low birth weight
Yes

1 (50)

0 (0) 1 (50)

0.188ns

No

4 (16)

15 (60)

6 (24)

Neonatal jaundice
Yes

0 (0)

3 (100) 0 (0)

0.390ns

No

5 (20.8)

12 (50)

7 (29.2)

Neonatal hypoglycemia
Yes

1 (25)

3 (75) 0 (0)

0.609ns

No

4 (17.4)

12 (52.2)

7 (30.4)

NICU admission
Yes

1 (25)

3 (75) 0 (0)

0.609ns

No

4 (17.4)

12 (52.2)

7 (30.4)

Comparison of first-trimester TSH levels with maternal complications showed that mean TSH levels were significantly higher among participants with anemia of pregnancy compared to those without anemia (p=0.038). In contrast, no statistically significant differences in TSH levels were observed for other maternal complications, including preeclampsia, hypertension, gestational diabetes mellitus, and preterm delivery (p > 0.05) (Table 19).

Table 19: Comparison of TSH level regarding maternal complications of the study participants (N=60). Data are presented as mean ± standard deviation (SD) and median. The Mann–Whitney U test was used for non-normally distributed data. TSH: thyroid-stimulating hormone; HTN: hypertension; GDM: gestational diabetes mellitus. s indicates statistically significant (p < 0.05), and ns indicates not significant (p ≥ 0.05).

Maternal Complications

TSH level in first trimester

p-value

Mean±SD

Median

Pre-eclampsia
Yes

4.55±3.32

4.55

0.498ns

No

7.04±17.64

2.30

HTN
Yes

4.06±2.80

3.10

0.469ns

No

7.34±18.43

2.30

Anemia of pregnancy
Yes

8.91±11.73

3.97

0.038s

No

6.52±18.45

2.10

GDM
Yes

5.89±6.24

4.30

0.338ns

No

7.12±18.52

2.30

Preterm Delivery
Yes

4.18±2.58

4.05

0.352ns

No

7.27±18.27

2.30

Similarly, no statistically significant differences in first-trimester TSH levels were found between participants with and without fetal complications, including low birth weight, neonatal jaundice, neonatal hypoglycemia, and NICU admission (p > 0.05) (Table 20).

Table 20: Comparison of TSH level regarding fetal complications of the study participants (N=60). Data are presented as mean ± standard deviation (SD) and median. The Mann–Whitney U test was used for non-normally distributed data. TSH: thyroid- stimulating hormone; NICU: neonatal intensive care unit. s indicates statistically significant (p < 0.05), and ns indicates not significant (p ≥ 0.05).

Fetal Complications

TSH level in first trimester

p-value

Mean ± SD

Median

Low Birth Weight
Yes

3.43 ± 1.72

2.70

0.517ns

No

7.15 ± 17.79

2.30

Neonatal Jaundice
Yes

4.76 ± 2.92

4.50

0.178ns

No

7.25 ± 18.44

2.30

Neonatal Hypoglycemia
Yes

7.12 ± 6.88

6.60

0.239ns

No

6.94 ± 18.19

2.30

NICU
Yes

6.29 ± 6.66

6.30

0.428ns

No

7.05 ± 18.34

2.30

Discussion

This prospective observational study included 60 pregnant women, with and without hypothyroidism, recruited through purposive sampling according to predefined inclusion and exclusion criteria at BIRDEM General Hospital. The majority of participants (46.7%, n=28) were aged between 24–29 years, with a mean age of 26.55 ± 4.01 years.

This finding is comparable to the study conducted by Gaikwad and Salvi, where the mean age of participants was reported as 25.56 years, indicating that hypothyroidism in pregnancy is frequently observed in women within the mid-twenties reproductive age group [8].

A significantly higher proportion of hypothyroid participants reported a family history of thyroid disease (75%, n=12) compared with euthyroid participants (25%, n=4). This difference was statistically significant (p < 0.05) with an odds ratio of 1.83 (95% CI:1.16–2.88), suggesting a possible genetic or familial predisposition. Similar observations were reported by Kiran et al., who found that 15.3% of pregnant women with hypothyroidism had a family history of thyroid disease, primarily among first-degree relatives [9].

Regarding gravidity, our study demonstrated an equal distribution between primigravida and multigravida participants. This observation differs from several previous studies. For instance, Gaikwad and Salvi reported a higher proportion of primigravida cases [8], while Kumar et al. observed a significantly higher prevalence of hypothyroidism among primigravida women (53.7%) [10]. In our cohort, most participants (73.3%) had no family history of thyroid disease and only 3.3% had a history of abortion, which is comparable to findings reported by Mahadik, Choudhary and Roy, where both family history of thyroid disorders and recurrent miscarriage were observed in approximately 4.5% of cases [11].

The majority of participants in the present study were asymptomatic (98.3%). Only one patient exhibited classical symptoms of hypothyroidism, including facial puffiness, cold intolerance, constipation, and dry skin, and only one participant had a palpable thyroid gland. This highlights the often subclinical nature of thyroid dysfunction during pregnancy. Similarly, Kiran et al. reported a small number of cases with Hashimoto’s thyroiditis presenting with goiter [9].

In the present study, half of the participants (50%) were euthyroid and served as the control group. Among the remaining participants, 28.33% were newly diagnosed with hypothyroidism during pregnancy, while 21.67% had a known diagnosis prior to pregnancy. These findings are partially consistent with observations from Sreedevi et al., who reported newly detected hypothyroidism in 11% and previously diagnosed hypothyroidism in 3.8% of pregnant women [12]. Similarly, Gaikwad and Salvi reported that 30.7% of hypothyroid cases were detected during pregnancy screening, while the majority (69.3%) were diagnosed before the current pregnancy [8].

Among the 30 hypothyroid patients in our cohort, 13 had been diagnosed prior to pregnancy and were euthyroid due to levothyroxine replacement therapy. Among the newly diagnosed cases, 12 were classified as subclinical hypothyroidism (SCH) and 5 as overt hypothyroidism. Comparable findings were reported by Sreedevi et al., where the overall prevalence of hypothyroidism was 14.8%, including both newly diagnosed and previously known cases [12]. In addition, our analysis demonstrated significant differences in TSH levels across trimesters among known hypothyroid, subclinical hypothyroid, and overt hypothyroid groups (p < 0.05).

Autoimmune thyroid markers also showed significant variation between groups. Among patients diagnosed prior to pregnancy, the majority (76.9%) were anti-TPO antibody negative, whereas 66.7% of participants with newly diagnosed SCH were anti-TPO antibody positive. This difference was statistically significant (p < 0.05). Additionally, anti-thyroglobulin antibodies were positive in 58.3% of SCH cases. Previous studies support these observations: Dhanwal et al. reported anti-TPO positivity in approximately 40% of hypothyroid pregnant women [13], while Reh A et al. found anti-TPO positivity in 57.1% of subclinical hypothyroid cases [14].

In our cohort, demographic and physiological variables such as age, BMI, heart rate, systolic blood pressure, and diastolic blood pressure were not significantly different between hypothyroid and euthyroid groups. However, TSH levels differed significantly among euthyroid, newly diagnosed hypothyroid, and known hypothyroid groups (p < 0.05), with the highest levels observed in newly diagnosed cases.

Adverse maternal outcomes were relatively common among hypothyroid participants. The most frequent complications included cesarean delivery (n=12), anemia of pregnancy (n=8), gestational diabetes mellitus and hypertension (n=5), and preterm delivery (n=4). Neonatal complications included neonatal jaundice (n=5), neonatal hypoglycemia, and NICU admission (n=4). These findings are consistent with the cohort study conducted by Lee et al., which reported higher incidences of preterm labor, cesarean delivery, gestational diabetes, and prematurity among hypothyroid pregnancies [15].

Among anti TPO antibody positive hypothyroid women, adverse outcomes were more pronounced. Anemia occurred in 62.5% of cases, cesarean delivery in 41.7%, gestational diabetes in 60%, preterm delivery in 75%, and hypertension in 60%. Neonatal jaundice occurred in all cases (100%) and was statistically significant (p < 0.05), with a high proportion of NICU admissions and neonatal hypoglycemia. Similar associations between anti TPO positivity and adverse pregnancy outcomes were reported by Gupta et al. and Feki et al. [16,17].

Our findings also demonstrated an increased risk of several maternal complications in hypothyroid pregnancies compared with euthyroid pregnancies, including spontaneous abortion (OR 2.03), eclampsia (OR 1.62), anemia of pregnancy (OR 1.51), hypertension (OR 1.38), preterm delivery (OR 1.30), and gestational diabetes (OR 1.15). Similar trends were observed in the study by Kumar et al., who reported higher incidences of preeclampsia, anemia, abortion, and other obstetric complications among hypothyroid women [10].

Neonatal complications were also more frequent among infants born to hypothyroid mothers, including neonatal jaundice (OR 1.51), neonatal hypoglycemia (OR 1.38), low birth weight (OR 1.35), and NICU admission (OR 1.16). Previous studies such as Mahadik, Choudhary and Roy have similarly reported increased risks of low birth weight and NICU admission among neonates born to hypothyroid mothers [11].

Furthermore, newly diagnosed hypothyroid women had a higher risk of preeclampsia, eclampsia, and spontaneous abortion (OR 1.81) compared with women with known hypothyroidism receiving treatment. Neonates born to newly diagnosed hypothyroid mothers also had a higher risk of NICU admission and neonatal hypoglycemia (OR 2.00). However, these associations were not statistically significant (p > 0.05).

Finally, maternal and fetal outcomes were not significantly associated with different first-trimester TSH or FT4 cutoff values in our study (p > 0.05). These findings align with studies by Joshi et al. and Poulasouchidou et al., which also reported no significant association between maternal thyroid hormone levels and adverse pregnancy outcomes within certain TSH thresholds [18,19].

References

  1. Chang DLF, Pearce EN (2013) Screening for maternal thyroid dysfunction in pregnancy a review of the clinical evidence and current guidelines. J Thyroid Res. [crossref]
  2. Taylor PN, Albrecht D, Scholz A, Gutierrez-Buey G, Lazarus JH, Dayan CM et (2018) Global epidemiology of hyperthyroidism and hypothyroidism. Nat Rev Endocrinol. [crossref]
  3. Korevaar TIM, Medici M, Visser TJ, Peeters RP (2017) Thyroid disease in pregnancy new insights in diagnosis and clinical Nat Rev Endocrinol. [crossref]
  4. Shahid MM, Ferdousi S (2021) Prevalence and incidence of thyroid disorder during pregnancy in Bangladesh a tertiary care hospital-based Sri Lanka J Diabetes Endocrinol Metab
  5. Ferdousi MA, Al Baki A (2021) Prevalence and maternal effects of hypothyroidism in Chattagram Maa-O-Shishu Hosp Med Coll J. [crossref]
  6. Alexander EK, Pearce EN, Brent GA, Brown RS, Chen H, Dosiou C et al. (2017) 2017 guidelines of the American Thyroid Association for the diagnosis and management of thyroid disease during pregnancy and the postpartum. Thyroid. [crossref]
  7. De Groot L, Abalovich M, Alexander EK, Amino N, Barbour L, Cobin RH et (2012) Management of thyroid dysfunction during pregnancy and postpartum an Endocrine Society clinical practice guideline. J Clin Endocrinol Metab. [crossref]
  8. Gaikwad V, Salvi PN, Nandini R (2022) Study of trimester-wise effect of hypothyroidism in pregnancy and its materno-fetal Indian J Public Health Res Dev. [crossref]
  9. Kiran Z, Sheikh A, Malik S, Meraj H, Masood M, Ishtiaq O et al. (2019) Maternal characteristics and outcomes affected by hypothyroidism during BMC Pregnancy Childbirth. [crossref]
  10. Kumar R, Bansal R, Shergill HK, Garg P (2023) Prevalence of thyroid dysfunction in pregnancy and its association with fetomaternal outcomes a prospective observational Clin Epidemiol Glob Health. [crossref]
  11. Mahadik K, Choudhary P, Roy PK (2020) Study of thyroid function in pregnancy and its fetomaternal outcome a prospective observational study. BMC Pregnancy Childbirth. [crossref]
  12. Sreedevi DP, Bhavani DK, Rohini DA, Singh N, Badikela D, Tharani (2022) Study on prevalence and fetomaternal outcome in hypothyroidism in J Clin Med
  13. Dhanwal DK, Bajaj S, Rajput R, Subramaniam KA, Chowdhury S, Bhandari R et al. (2016) Prevalence of hypothyroidism in pregnancy an epidemiological study from Indian J Endocrinol Metab. [crossref]
  14. Reh A, Grifo J, Danoff A (2010) What is a normal thyroid-stimulating hormone level? Effects of stricter thresholds on pregnancy outcomes after in vitro Fertil Steril. [crossref]
  15. Lee RH, Spencer CA, Mestman JH, Miller EA, Petrovic I, Braverman LE et al. (2009) Free T4 immunoassays are flawed during pregnancy. Am J Obstet Gynecol. [crossref]
  16. Gupta T, Mani P, Gupta A, Yadav L (2019) Neonatal and fetal effects of antithyroid peroxidase positivity in hypothyroidism in pregnancy a hospital-based Indian J Child Health
  17. Feki M, Omar S, Menif O, Tanfous NB, Slimane H, Zouari F et al. (2008) Thyroid disorders in pregnancy frequency and association with obstetrical complications. Clin Biochem. [crossref]
  18. Joshi D, Dewan R, Bharti R, Sharma S, Gupta A, Dutta S et (2015) Fetomaternal outcome using new screening criteria of serum TSH. J Clin Diagn Res. [crossref]
  19. Poulasouchidou MK, Goulis DG, Poulakos P, Mintziori G, Athanasiadis A, Grimbizis GF et al. (2012) Prediction of maternal and neonatal adverse outcomes in hypothyroid Hormones Athens. [crossref]

The Emotional Landscape of Everyday Eating: Using AI and Mind Genomics to Understand How Patients Think About Food

DOI: 10.31038/MGSPE.2026614

Abstract

Nutrition is usually presented to clinicians as a technical domain—macronutrients, biomarkers, guidelines—but patients live it as an emotional, cultural, and psychological experience. The same plate of food can represent comfort, guilt, rebellion, reward, or self care, depending on the mind that encounters it. Emotional eating, mindless eating, and conflicted eating are not marginal behaviors; they are central to how people drift from health toward nutritional disease. Yet medical education still treats food as a counseling topic rather than a lived emotional world. At the same time, AI supported training platforms now demonstrate that empathy, communication, and soft skill reasoning can be taught with the same rigor as technical skills. Mind Genomics adds a complementary layer by treating the patient’s inner logic as a measurable system, revealing distinct mind sets that respond differently to the same nutritional message. This paper integrates AI generated patient narratives with Mind Genomics segmentation to illuminate how people think and feel about everyday eating long before diabetes or obesity are diagnosed. The goal is to give clinicians a sharper lens on the emotional landscape of food, so prevention and counseling can begin where patients actually live—inside their daily decisions, habits, and feelings.

Keywords

Mind genomics, Emotional eating, Nutritional psychology, Artificial intelligence, Patient communication

Abbreviations

AI: Artificial Intelligence; OLS: Ordinary Least Squares

Introduction

Medical education increasingly recognizes nutrition as a major determinant of health, yet structured nutrition training remains limited in many medical curricula. Professional organizations have emphasized the need for longitudinal nutrition education in order to strengthen physicians’ ability to address diet-related disease and provide effective counseling [1,2]. Despite these efforts, nutrition is still often taught primarily as a technical domain of macronutrients, biomarkers, and dietary guidelines rather than as a lived behavioral and psychological experience.

Parallel to these developments, research in nutritional psychiatry and nutritional psychology has demonstrated that dietary patterns interact closely with mood, cognition, and emotional wellbeing. Food therefore functions not only as metabolic fuel but also as a continuous psychological signal embedded in identity, stress regulation, culture, and emotional meaning [3,4]. Individuals rarely approach food neutrally. Emotional eating research shows that people frequently use food to regulate feelings, distract themselves from stress, or create temporary comfort, often followed by cycles of guilt or frustration that reinforce unhealthy eating patterns [5,6].

At the same time, artificial intelligence has begun to play an expanding role in healthcare education. AI-supported virtual patient simulations are increasingly used to train communication skills, empathy, and patient-centered reasoning. These systems allow learners to practice clinical conversations, experiment with phrasing and tone, and receive structured feedback on interpersonal skills that are traditionally difficult to teach at scale [7,8].

Mind Genomics provides a complementary framework for understanding how individuals interpret everyday experiences and make behavioral decisions. Rather than studying attitudes through traditional surveys, Mind Genomics experimentally combines small elements of meaning into short narrative vignettes that respondents evaluate. Statistical decomposition of these responses reveals the psychological “drivers” that shape interest, resistance, or indifference toward specific messages [9,10]. In this way, Mind Genomics treats everyday decision-making as an experimentally measurable system.

Understanding these psychological drivers is particularly important in the context of eating behavior. Dietary choices are rarely determined by knowledge alone; they emerge from emotional triggers, habits, identity, convenience, and social context [11]. As a result, two individuals may receive identical nutritional advice yet respond to it in entirely different ways.

The present study focuses on the early stage of the nutritional trajectory—the world of everyday eating before chronic disease such as obesity or diabetes is formally diagnosed. The central premise is that prevention requires understanding the emotional landscape of food as patients actually experience it in daily life. AI provides narrative realism, while Mind Genomics offers experimental structure for exploring how different psychological mindsets interpret the same eating situations. Together, these approaches create a framework for examining how patients think and feel about food long before disease becomes clinically visible.

Materials and Methods

This study applies the Mind Genomics experimental framework to explore the emotional meanings associated with everyday eating. Mind Genomics treats everyday decision-making as an experimentally measurable system by decomposing complex experiences into smaller elements of meaning that can be systematically tested [9].

The study begins by identifying a set of micro-elements—short statements representing different ways individuals think and feel about food. These elements reflect multiple dimensions of everyday eating, including emotional drivers, situational triggers, identity themes, and practical considerations. In the Mind Genomics design, these elements are typically organized into a structured matrix consisting of four questions with four alternative answers each, yielding sixteen total elements intended to capture a broad range of interpretations related to eating behavior.

The elements are combined into short narrative vignettes. Each vignette contains two to four elements drawn from the full set, arranged according to a systematic experimental design so that each element appears in different combinations across the vignettes. Respondents evaluate a series of these vignettes and rate them according to personal resonance—for example, the degree to which the scenario reflects their own eating behavior or emotional relationship with food.

The ratings are analyzed using ordinary least squares (OLS) regression to estimate the part-worth utility associated with each element. The resulting coefficients reveal which ideas generate strong positive reactions, which provoke rejection, and which have minimal influence on responses. Cluster analysis is then applied to the pattern of coefficients in order to identify distinct psychological segments referred to as mindsets. These mindsets represent different interpretive frameworks through which individuals understand everyday eating situations rather than demographic groupings.

AI systems are used to generate narrative expansions of the experimental elements and to simulate clinician–patient dialogues representing different mindsets. AI-based educational simulations and large language model tools have increasingly been used to support communication training and patient-centered interaction in healthcare education [8,12].

Together, the integration of Mind Genomics segmentation and AI-generated narrative simulation creates a dual-lens system for understanding eating behavior. The quantitative layer identifies psychological drivers of everyday food choices, while the narrative layer illustrates how these drivers may appear in realistic clinical conversations about nutrition and health.

This study represents a conceptual and simulation-based application of the Mind Genomics framework. No real patient data or identifiable human participant information were used in this work. The AI-generated narratives and simulated dialogues are illustrative examples developed for educational and methodological demonstration.

Results

Mindsets Emerging from Everyday Eating

Everyday eating is not a single behavior but a set of psychological operating systems through which individuals interpret food, respond to stress, and understand nutritional advice. When the Mind Genomics framework is conceptually applied to the domain of everyday eating, it suggests that individuals may interpret food-related situations through several distinct psychological orientations.

Based on the structure of the experimental elements and their narrative interpretation, three illustrative mindsets emerge that represent different ways individuals relate to food in daily life. These mindsets are not demographic categories but patterns of meaning that shape how people experience hunger, react to emotional stress, and respond to recommendations about healthy eating.

The three mindsets identified in this framework are:

Mindset 1: The Emotional Eater

Mindset 2: The Convenience Navigator

Mindset 3: The Health-Identity Striver

Each mindset reflects a different internal logic guiding everyday eating behavior. The Emotional Eater experiences food primarily as emotional regulation and comfort. The Convenience Navigator approaches eating as a practical activity shaped by schedule constraints and convenience. In contrast, the Health-Identity Striver views food choices as expressions of discipline, self-control, and personal identity.

To illustrate the differences among these psychological orientations, Table 1 summarizes the defining characteristics of the three mindsets across several behavioral dimensions, including motivations for eating, responses to stress, interpretations of hunger, reactions to nutritional advice, barriers to change, and interpretations of failure.

Table 1: Psychological mindsets in everyday eating identified through the mind genomics framework.

Table 1 demonstrates that individuals who appear similar in demographic terms may interpret food and eating behavior in fundamentally different ways. Recognizing these psychological orientations can help clinicians anticipate how patients might respond to nutritional counseling and tailor communication strategies accordingly.

Fly-on-the-Wall Simulation

To further illustrate how these mindsets may appear in real-world clinical conversations, a “fly-on-the-wall” simulation was developed using AI-generated dialogue.

In this approach, the reader is positioned as an observer watching an interaction between a clinician and representative patients belonging to different mindsets. The purpose of the simulation is to translate the conceptual psychological segmentation into narrative form, allowing clinicians to observe how different orientations toward food may manifest during patient discussions.

The simulation highlights how the Emotional Eater frames food as emotional comfort, how the Convenience Navigator treats eating as a practical activity shaped by time pressure, and how the Health-Identity Striver interprets food choices as part of a disciplined lifestyle identity. By presenting these contrasting perspectives side by side, the dialogue illustrates how identical nutritional advice may be interpreted differently depending on the patient’s underlying mindset.

Illustrative Clinician–Patient Dialogue

Discussion

The findings from this study show that everyday eating is not a single behavior but a set of emotional, cognitive, and logistical patterns that shape how people move along the nutritional arc. The three mindsets—Emotional Eater, Convenience Navigator, and Health Identity Striver—demonstrate that patients do not hear nutritional advice the same way. Each mindset filters information through its own logic, priorities, and vulnerabilities. When clinicians assume a single “typical patient,” they inadvertently miss the psychological diversity that drives adherence, resistance, or ambivalence. AI and Mind Genomics together provide a structured way to surface these hidden patterns and make them visible, teachable, and clinically actionable.

AI contributes by generating natural-language voices that reflect the emotional logic of each mindset. Recent reviews of generative AI tools have highlighted their growing role in healthcare education, research assistance, and clinical training environments [12]. In this context, simulated patient narratives allow clinicians to rehearse conversations with individuals who think and feel differently about food. The Emotional Eater reveals the role of food as comfort and emotional relief; the Convenience Navigator exposes the logistical pressures that shape everyday eating; and the Health-Identity Striver shows how food choices become expressions of discipline and self-control. These voices are not caricatures. Rather, they are grounded in the conceptual structure of the Mind Genomics framework, ensuring that the AI-generated simulations reflect meaningful psychological patterns rather than generic stereotypes.

Mind Genomics contributes by decomposing the complexity of everyday eating into conceptual elements that represent the different ways individuals interpret food-related situations. It highlights which ideas resonate strongly, which are ignored, and which provoke resistance. This structure allows educators to teach soft-skill reasoning with the same rigor as technical content. Instead of vague advice like “meet patients where they are,” Mind Genomics helps clarify where patients are—what they value, what they fear, and what motivates them. This precision transforms empathy from an intuition into a teachable skill.

The combination of AI and Mind Genomics also addresses a major gap in medical education: the lack of systematic training in the emotional and psychological dimensions of nutrition. Students learn about dietary guidelines, but they rarely learn how patients experience food in daily life. They are taught what patients should do, but not how patients think. By integrating narrative realism with psychological segmentation, this approach gives learners a dual lens: they can see the structure of patient thinking and hear how it sounds in conversation. This dual perspective is essential for building clinical intuition.

Clinicians who understand mindsets can tailor their communication more effectively. Emotional Eaters need validation and emotional support before they can engage with behavioral change. Convenience Navigators need simple, efficient solutions that fit their routines. Health Identity Strivers need structured goals and reassurance that flexibility does not undermine identity. When clinicians match their approach to the patient’s mindset, adherence improves, trust deepens, and nutritional counseling becomes more effective.

This approach also has implications for prevention. Nutritional disease does not begin with biomarkers; it begins with daily decisions shaped by emotion, habit, and identity. By understanding the emotional landscape of everyday eating, clinicians can intervene earlier and more effectively. They can recognize when a patient is drifting toward patterns that increase risk for diabetes or obesity. They can offer support that aligns with the patient’s psychological operating system. Prevention becomes not just a matter of information but of emotional alignment.

Finally, this work demonstrates that AI can play a constructive role in teaching empathy. AI does not replace human connection; it enhances it by giving clinicians repeated exposure to diverse patient voices. Mind Genomics ensures that these voices are grounded in meaningful psychological patterns. Together, they create a new educational instrument—one that is scalable, rigorous, and deeply human. This integration represents a new frontier in medical humanities, where technology supports the development of emotional intelligence, communication skills, and patient-centered care.

Conclusion

Everyday eating is a psychological world that clinicians must understand if they hope to prevent nutritional disease. AI and Mind Genomics together provide a powerful framework for illuminating this world. AI generates realistic patient voices, while Mind Genomics structures the underlying patterns of interpretation. The result is a dual-lens system that makes the emotional landscape of eating visible, teachable, and clinically actionable. This approach transforms empathy from an abstract ideal into a practical skill that can be practiced, refined, and mastered. As medical education evolves, integrating AI-supported narrative simulation with Mind Genomics segmentation offers a promising and scalable new path forward—one that honors the complexity of human behavior and strengthens the clinician’s ability to meet patients where they truly live.

Competing Interests

The authors declare that they have no competing interests.

References

  1. Aspry KE, Van Horn L, Carson JAS et (2018) Medical Nutrition Education, Training, and Competencies to Advance Guideline-Based Diet Counseling by Physicians A Science Advisory from the American Heart Association. Circulation. [crossref]
  2. Crowley J, Ball L, Hiddink GJ (2019) Nutrition in medical education a systematic The Lancet Planetary Health. [crossref]
  3. Adan RAH, van der Beek EM, Buitelaar JK et (2019) Nutritional psychiatry Towards improving mental health by what you eat. Eur Neuropsychopharmacol. [crossref]
  4. Nutritional Psychology Institute (2024) What is Nutritional Psychology. Nutritional Psychology Institute.
  5. American Psychological Association (2013) Stress and eating. American Psychological Association.
  6. Frayn M, Livshits S, Knäuper B (2018) Emotional eating and weight regulation a qualitative study of compensatory behaviors and J Eat Disord. [crossref]
  7. Gehrman E (2024) How Generative AI Is Transforming Medical Education. Harvard Medicine Magazine.
  8. Masters K (2019) Artificial intelligence in medical Med Teach
  9. Moskowitz HR (2012) Mind genomics the experimental inductive science of the ordinary and its application to aspects of food and feeding. Physiol Behav. [crossref]
  10. Moskowitz HR, Ashman H (2006) Founding a New Science Mind Genomics. J Sens Stud
  11. Lazarevich I, Irigoyen-Camacho ME, Radilla-Vázquez CC et (2025) Mindful Eating and Its Relationship with Obesity Eating Habits and Emotional Distress in Mexican College Students. Behav Sci Basel. [crossref]
  12. Sallam M (2023) ChatGPT Utility in Healthcare Education Research and Practice Systematic Review on the Promising Perspectives and Valid Concerns. Healthcare Basel. [crossref]

A New Hypothesis About Neuroinflammation and Osteomyelitis in Adults With Type 2 Diabetes Mellitus and Peripheral Neuropathy Without and With Foot Lesions. What Comes First?

DOI: 10.31038/EDMJ.20261023


In the paper “Neuroinflammation and osteomyelitis in adults with Type 2 diabetes mellitus and peripheral neuropathy without and with foot lesions. What comes first?” published in September 2025 [1], diabetic foot disease, the leading causes of major and minor non-traumatic amputation worldwide, was originally described as a destructive, progressive bone tissue process beginning from perypheral nerve functional damage (Figure 1a-f, see main paper inn ref. [1]). An innovative framework was proposed, in which chronic oxidative stress, induced by hyperglycemia, may trigger epigenetically mediated adverse neuronal signals as proNGF expression in post-mitotic cells. This neuronal injury could initiate a domino-like cascade involving innervated peripheral tissues leading to neuro-ischemic gangrene or infected necrosis, remembering different tissue damages as myocardial heart failure, diabetic retinopathy and end-stage renal disease where similar irreversible behaviors could share convergent pathogenic mechanisms.

In the paper “Neuroinflammation and Osteomyelitis in Adults with Type 2 Diabetes Mellitus and Peripheral Neuropathy Without and With Foot Lesions. What Comes First?” published in September 20251 , diabetic foot disease—the leading cause of major and minor non-traumatic amputations worldwide—was originally described as a progressive, destructive bone tissue process that begins with peripheral nerve functional damage (Figure 1 a–f, see main paper1). The authors propose an innovative framework in which chronic oxidative stress induced by hyperglycemia may trigger epigenetically mediated adverse neuronal signaling, such as proNGF expression in post-mitotic cells. This neuronal injury could initiate a domino-like cascade affecting innervated peripheral tissues, ultimately leading to neuro-ischemic gangrene or infected necrosis. This process resembles other tissue injuries observed in conditions such as myocardial heart failure, diabetic retinopathy, and end-stage renal disease, where similar irreversible changes may share convergent pathogenic mechanisms.

The updated definition for diabetes-related foot disease proposed by the International Working Group on the Diabetic Foot (IWGDF, 2023 update) [2] describes it as a “disease of the foot of a person with current or previously diagnosed diabetes mellitus that includes one or more of the following: peripheral neuropathy, peripheral artery disease, infection, ulcer(s), neuro‐osteoarthropathy, gangrene, or amputation”. This statement reads more as an updated descriptive framework than a definition, because it describes coexisting or concomitant events and does not illustrate a progression or a prognosis of the phenomenon. Our hypothesis was that hyperglycemia alters the mitochondrial milieu and triggers danger-associated neurotrasmission signals capable of affecting both central and peripheral neuronal function. In particular, distal sensory and autonomic neuropathy could activate neuroischemic and endothelial signaling pathways, inflammatory responses and induce bone cell apoptosis, thereby exposing coating tissues to fatal damage prone to infections (Figure 1).

Figure 1: Hematoxylin/eosin staining and CX3CL1 and RORɣ imunohistochimic change expression in femoral head controls (a-c) versus foot bone of diabetic patients with HIOM (d-f). Magnification for A and B 200X, for B-E 400X (Figure 6 [1]).

Based on this hypothesis, we tried to identify an early marker of the phenomenon. Fractalkine (CX3CL1), a constitutively expressed transmembrane chemokine with different neurovascular distribution and unique cleavage-dependent signaling properties, emerged as a candidate [3]. Elevated expression of both the membrane-bound and soluble forms [4] of CX3CL1 has been shown to enhance fractalkine receptor (CX3CR1)-mediated recruitment of inflammatory cells, promote vascular endothelial dedifferentiation, and contribute to tissue fibrosis in non-obstructive vascular diseases. The spread of neuroinflammatory signals throughout peripheral innervated tissues can ultimately converge cytotoxic and apoptotic pathways, leading to irreversible damage in the foot.

It was described that CX3CR1 expression has an important role in early activation of endothelial and peri-endothelial cells both involved in ostructive and non obstructive coronary diseases [4]. In vitro studies have demonstrated that CX3CL1 is not only an endothelial chemokine and a monocyte adhesion molecule, but also acts as a dysfunctional endothelial trigger by promoting the production of reactive oxygen species (ROS), which leads to reduced nitric oxide (NO) bioavailability in vascular smooth muscle cells [4]. Experimental peripheral nerve injuries demonstrated the presence of Fractalkine/CX3CR1 axis beetween neuron and activated glia where clivating enzimes deliver soluble fractalkine for axonal preservation and vascular regeneration [5]. In our neuropathic patients, analysis of bone proteins involved in signal transduction pathways revealed a prominent reduction in ERK1/2 activating phosphorylation (P-ERK1/2) in bone tissue rich of fractalkine, accompanied by increased Akt activation (P-Akt) (See main paper [1] Figure 8C), supporting the hypothesis of a contributory role in the apoptotic cascade. These findings raise a critical question: what is the impact of reduced intraneuronal activity on peripheral nerve function and the integrity of innervated tissues?

In our paper, we reported data of 374 adults with Type 2 diabetes mellitus (T2DM) and diabetic neuropathy (DN) divided into progressive, at risk, or with established foot damage subgroups: 106 neuroparthic subjects without foot lesions (DNp); 119 non-macrovascular neuropathic subjects with ulcers/lesions/osteomyelitis (DNpU); 149 revascularized neuropathic subjects with ulcers/lesions/osteomyelitis (DNpUV) and a group of 53 healthy adults as normal control (NC). We performed biopsy specimens from exposed bone (grade III University of Texas wound classification, TUC) to obtain microbiological standards and histological analysis. Based on TUC classification which defines from stage I (dermal) to stage III (bone) the ulcer depth, we correlated CX3CL1 migration marker with EMG parameters of neuropathy and analyzed pro/anti-inflammatory cytokines, blood cells subsets (lymphocytes subpopulations, classical, non-classical and SLAN+ monocytes, classical DCs, innate lymphoid cells), Nerve Growth Factor (NGF) species, autophagy markers (Ulk1, Beclin1, LC3, and p62), pro/anti-apoptotic proteins (Bax, Bcl2, cleaved Caspase-3) and signal transduction proteins involved in inflammation and cell survival (p65-NF-kB, Akt and ERK1/2). Our results are interesting puzzle pieces in diabetic foot labyrinth. Electrophysiological parameters as Sural nerve (sS) conduction velocity (CV) and sensory Action Potential (sAP) thresholds confirmed the presence and severity of diabetic neuropathy. Worsening in neuronal function was correlated with depth of foot lesions, with or without peripheral critical ischemia and increased immature neurokine NGF (proNGF) circulating levels. Furthermore, we found higher numbers of SLAN+ monocytes co-expressing CX3CR1 in all TUC III versus I TUC groups; these inflammatory cells directly correlated with proNGF levels and worsened autonomic and sensory testing. All bone lesions were positive for CX3CL1 and RORɣ (lymphoid marker) in our immunohistochemical analysis1; in the same bone biopsies, sympathetic TH-positive nerves resulted positive by immunofluorescence for the co-expression of CX3CL1 and NGF receptors (p75, TrkA receptors; see main paper Figure 7 in [1]).

Finally, bone cleaved caspase 3 and Bax directly correlated with % of CX3CR1+SLAN+CD16+ inflammatory monocytes and inversely with bone ERK1/2 activating phosphorylation. Multiple RNA array sub-analysis confirmed potential impairments in autophagy and upregulated mTOR/RHEB apoptotic signaling co-expressed with CX3CR1 on bone species (see main paper [1] Figure 9C-E).

Collectively, these findings indicate that diabetic neuropathy represents a primary pathogenic driver in diabetic foot disease, triggering a domino-like neuroinflammatory process. Loss of sensitive function and autonomic dysregulation appear to compromise foot integrity, alter intrabone neurotrophins and CX3CL1 expression and induce vascular dysfunction, early bone apoptosis and CX3CR1+monocytes chemotaxis preceding and potentially occurring independently of infected osteomyelitis. These data redefine the hierarchy of pathogenic events in diabetic foot disease and may mark the way for the development of new targeted therapies.

Abbreviations

BAX: Bcl2 Associated X Protein; Bcl2: B-Cell Lymphoma 2; CD: Cluster Differentiation; CV: Conduction Velocity; CX3CL1: Chemokine (C-X3-C Motif) Ligand 1; CX3CR1: C-X3-C Motif Chemokine Receptor 1; DC: Dendritic Cell; DN: Diabetic Neuropathy; EMG: Electromyography; ERK1/2: Extracellular Signal-Regulated Kinase; HIOM: High Infected Osteomyelitis; IWGDF International Working Group on the Diabetic Foot; LC3: Microtubule-Associated Protein 1A/1B-Light Chain 3; mAP/sAP: Motor/Sensory Action Potential; MIOM: Mild Infected Osteomyelitis; m/proNGF: Mature/Immature Nerve Growth Factor; mTOR: Mechanistic Target of Rapamycin; NC: Normal Control; nDFH: Non-Diabetic Femur Head; NF-kB: Nuclear Factor Kappa-light-chain-enhancer of Activated B Cells; nILOM: Non Infected Low Osteomyelitis; NGF: Nerve Growth Factor; NK: Natural Killer Cell; NO: Nitric Oxide; p75 NTR p75 Neurotrophic Receptor; PA: Plasminogen Activation; PB: Peripheral Blood; RHEB: Ras Homolog Enriched in Brain; ROS: Reactive Oxygen Species; ROR𝛾: RAR-related Orphan Receptor Gamma; SLAN: 6-sulfo LacNAc; ; sS: Sural; sSa: Saphenous; sSP: Superficial Peroneal; T2DM: Type 2 Diabetes Mellitus; TH: Tyrosin Hydroxilase; TrkA: Tropomyosin Receptor Kinase A; TUC: University of Texas Wound Classification; Ulk1: Unc-51 Like Autophagy Activating Kinase 1.

Keywords

Diabetic foot, Neuropathy, Osteomyelitis, Fractalkine CXC3L1/CXC3R1 axis

References

  1. Sambataro M, Sambado L, Colardo M, Furlan A, Stefani PM, Durante E, Antico A, Conte S, Bella SD, Nollino L, Barbara Z, Menegotto N, Vian E, Segatto M, Fassan M (2025) Neuroinflammation and osteomyelitis in adults with Type 2 diabetes mellitus and peripheral neuropathy without and with foot lesions What comes first? J Diabetes Complications. [crossref]
  2. Schaper NC, van Netten JJ, Apelqvist J, Bus SA, Fitridge R, Game F, Monteiro-Soares M, Senneville E (2024) Practical guidelines on the prevention and management of diabetes-related foot disease IWGDF 2023 update. Diabetes Metab Res Rev. [crossref]
  3. Umehara H, Bloom ET, Okazaki T, Nagano Y, Yoshie O, Imai T (2004) Fractalkine in vascular biology from basic research to clinical disease. Arterioscler Thromb Vasc Biol. [crossref]
  4. Stangret A, Sadowski KA, Jabłoński K, Kochman J, Opolski G, Grabowski M, Tomaniak M (2024) Chemokine Fractalkine and Non-Obstructive Coronary Artery Disease-Is There a Link? Int J Mol Sci. [crossref]
  5. Pottorf TS, Rotterman TM, McCallum WM, Haley-Johnson ZA, Alvarez FJ (2022) The Role of Microglia in Neuroinflammation of the Spinal Cord after Peripheral Nerve Injury. Cells. [crossref]

Understanding Radicalization Narratives: An AI-Assisted Mind Genomics Framework

DOI: 10.31038/MGSPE.2026613

Abstract

Acts of political violence often generate intense public attention, particularly when the motivations of the perpetrator remain unclear. In such situations, news narratives frequently become the primary lens through which the public attempts to interpret complex events. This study presents a conceptual framework that integrates artificial intelligence–assisted narrative analysis with Mind Genomics thinking to examine how audiences interpret narratives related to radicalization. Using a widely reported news account of the July 2024 assassination attempt on former U.S. President Donald Trump as a narrative stimulus, the study demonstrates how complex news stories can be decomposed into structured informational elements representing online environments, ideological alignment, social connection, autonomy, and emotional states. These elements are organized within a conceptual experimental design consistent with Mind Genomics methodology, enabling the construction of vignette-based simulations that illustrate how different combinations of narrative components may influence interpretation. The framework proposes three illustrative interpretive mindsets—The Radical, The Explorer, and The Outsider—to demonstrate how readers may cognitively segment when encountering narratives of political violence and radicalization. Although the present work represents a conceptual simulation rather than an empirical experiment, it outlines a methodological approach through which researchers, educators, and students may systematically analyze complex news narratives. By combining AI-assisted narrative decomposition with Mind Genomics experimental thinking, the study offers a structured approach for examining how individuals interpret contemporary news events and for promoting more reflective and critical engagement with media narratives.

Keywords

Mind genomics, Radicalization, Artificial intelligence, Narrative analysis, Media interpretation, Conceptual simulation

Introduction

Acts of political violence often generate intense public attention and extensive media coverage. When such events occur, journalists, policymakers, and researchers attempt to understand the motivations behind the perpetrator’s actions. However, in many cases, the motivations remain uncertain even after extensive investigation. In such situations, public interpretation of the event becomes heavily influenced by the narratives circulating in media and social discourse.

Radicalization has long been recognized as a complex process involving multiple psychological and social factors. Research suggests that ideological extremism typically emerges through interactions among identity processes, perceived grievances, and social influence rather than from a single causal factor [1]. Individuals may adopt increasingly extreme beliefs when they perceive threats to identity, belonging, or social status.

Identity-based uncertainty and social categorization processes can also contribute to ideological extremism. When individuals experience uncertainty about their social identity or group membership, they may be more likely to adopt strongly defined ideological positions in order to achieve clarity and belonging [2]. These psychological dynamics illustrate how ideological narratives can influence cognitive interpretation.

Scholars have also emphasized the role of perceived injustice and social context in shaping radicalization processes. Reviews of the social-science literature highlight that grievances, identity threats, and group dynamics often interact in the development of extremist beliefs [3]. Psychological analyses further indicate that emotional narratives and cognitive framing can influence how individuals interpret political conflict and violence [4].

In recent years, digital communication environments have added an additional dimension to radicalization research. Online networks may facilitate ideological reinforcement and allow individuals to connect with communities sharing similar beliefs or grievances [5]. Social media platforms can accelerate these processes by enabling rapid dissemination of emotionally charged narratives and by connecting geographically dispersed individuals [6].

Understanding how audiences interpret such narratives remains a major challenge. Traditional research approaches often focus on isolated psychological or sociological variables. However, real-world narratives typically combine multiple interacting influences including political rhetoric, emotional reactions, and social context.

Mind Genomics offers a methodological framework capable of addressing this complexity. Mind Genomics investigates how individuals interpret combinations of ideas embedded within short narrative descriptions known as vignettes [7]. Instead of analyzing isolated variables, the approach explores how people respond to patterns of information presented simultaneously.

Recent studies have extended Mind Genomics into the investigation of complex social issues including radicalization and public attitudes toward political conflict [8]. These studies demonstrate how experimental vignette designs can reveal distinct cognitive segments within populations.

To illustrate how such a framework may be developed, this study draws on a widely reported news account describing the attempted assassination of U.S. President Donald Trump during a campaign rally in Butler, Pennsylvania, in July 2024 [9]. Despite an extensive federal investigation lasting several months, the motivations of the shooter remain unclear [10].

This absence of a clear motive creates a particularly interesting analytical situation. When events occur without a definitive explanation, news narratives become the primary source through which the public attempts to interpret what happened. Different readers may interpret the same story in very different ways depending on their beliefs, experiences, and cognitive orientation.

The present study therefore uses the structure of this news narrative not to analyze the actions or motivations of any individual, but to demonstrate how artificial intelligence–assisted narrative analysis combined with Mind Genomics thinking can provide a framework for understanding how audiences interpret complex news stories.

Materials and Methods

Conceptual Study Design

The present study represents a conceptual simulation rather than an empirical experiment. A publicly reported news narrative describing an attempted political assassination was used as a narrative stimulus to illustrate how complex real-world events can be translated into structured analytical frameworks.

Artificial intelligence tools were used in an exploratory manner to assist in identifying recurring themes within the narrative. These themes included ideological rhetoric, social media influence, emotional responses, and perceptions of identity or belonging. AI tools were used only as supportive instruments for narrative decomposition rather than as autonomous analytical systems.

The resulting narrative components were translated into conceptual experimental elements consistent with the principles of Mind Genomics experimental design.

In this sense, the study can be viewed as a conceptual demonstration of how artificial intelligence and Mind Genomics thinking can be combined to help readers and students interpret news stories more systematically. AI tools can assist in identifying key narrative themes within complex reports, while Mind Genomics provides an experimental framework for examining how combinations of narrative elements influence interpretation.

Rather than attempting to determine factual causes of the event itself, the framework focuses on how different informational elements within the narrative may influence how readers understand and interpret the story.

Mind Genomics Methodology

Mind Genomics is an experimental methodology designed to examine how individuals interpret combinations of ideas embedded within narrative scenarios [7]. The method draws on principles of conjoint analysis and experimental design to explore cognitive responses to multi-element messages.

In a typical Mind Genomics study, respondents evaluate a series of short vignettes composed of multiple informational elements. Each vignette represents a unique combination of elements drawn from different thematic categories. Participants rate these vignettes using a defined scale, allowing researchers to determine how different combinations of ideas influence perception and judgment.

The methodology has been widely applied in areas including consumer research, communication studies, and social perception [11]. More recently, the approach has been applied to examine how individuals think about complex social issues such as radicalization [8].

Experimental Design Framework

Based on the narrative stimulus, five conceptual categories were identified:

A. Online environment
B. Social connection
C. Ideological alignment
D. Autonomy
E. Emotional state

Each category contains four conceptual elements. This structure allows a large number of possible narrative combinations.

Total possible vignette combinations:

4⁵ = 1,024 conceptual scenarios

In a typical empirical Mind Genomics study, respondents would evaluate approximately 25–30 vignettes generated through a balanced experimental design.

Results

Conceptual Mindset Segmentation

Radicalization narratives often evoke different interpretations depending on the cognitive orientation of the reader. Within the Mind Genomics framework, audiences can be conceptually segmented into distinct interpretive mindsets. These segments represent patterns of thinking rather than demographic categories.

To illustrate these differences, three conceptual interpretive mindsets were developed: The Radical, The Explorer, and The Outsider. Each mindset reflects a different orientation toward ideological narratives, social media influence, and perceptions of social belonging.

In the present conceptual framework, these mindsets are not derived from empirical respondent data but are introduced as illustrative cognitive segments. In a full empirical Mind Genomics study, statistical modeling would identify such segments from respondent-level responses to experimental vignettes. Here they serve to illustrate how readers may interpret the same narrative through different psychological orientations.

The comparison of these mindsets across several emerging issues related to radicalization and online discourse is summarized in Table 1.

Table 1: Conceptual comparison of three interpretive mindsets (Radical, Explorer, Outsider) across emerging issues related to radicalization and online discourse.

Issue

Mind-Set 1: The Radical Mind-Set 2: The Explorer

Mind-Set 3: The Outsider

1. Social media regulation The Radical opposes regulation, seeing it as an attack on free speech. The Explorer is open to regulation, but wants to ensure it does not stifle online discussion. The Outsider is indifferent to regulation, seeing it as a reflection of mainstream values.
2. Online extremism The Radical sees online extremism as a necessary response to perceived injustices. The Explorer is concerned about online extremism, but wants to understand its root causes. The Outsider is drawn to online extremism, seeing it as a way to express their frustration and anger.
3. Hate speech laws The Radical opposes hate speech laws, seeing them as an attack on free speech. The Explorer is open to hate speech laws, but wants to ensure they are balanced with the need for online discussion. The Outsider is indifferent to hate speech laws, seeing them as a reflection of mainstream values.
4. Radicalization prevention The Radical sees radicalization prevention as a form of social control. The Explorer is open to radicalization prevention, but wants to ensure it is based on nuanced and multifaceted approaches. The Outsider is skeptical of radicalization prevention, seeing it as a way to manipulate and control individuals.
5. Mental health support The Radical sees mental health support as a form of weakness. The Explorer is open to mental health support, but wants to ensure it is tailored to individual needs. The Outsider is indifferent to mental health support, seeing it as a reflection of mainstream values.
6. Community engagement The Radical sees community engagement as a threat to their ideology. The Explorer is open to community engagement, but wants to ensure it is based on mutual respect and understanding. The Outsider is skeptical of community engagement, seeing it as a way to manipulate and control individuals.
7. Social media monitoring The Radical opposes social media monitoring, seeing it as an attack on privacy. The Explorer is open to social media monitoring, but wants to ensure it is balanced with the need for online freedom. The Outsider is indifferent to social media monitoring, seeing it as a reflection of mainstream values.
8. Counter-narratives The Radical sees counter-narratives as a form of propaganda. The Explorer is open to counter-narratives, but wants to ensure they are based on nuanced and multifaceted approaches. The Outsider is skeptical of counter-narratives, seeing them as a way to manipulate and control individuals.

Understanding radicalization narratives also requires identifying the central questions guiding analytical inquiry. Researchers frequently examine how online environments, ideological narratives, and emotional responses interact to influence interpretation.

The key analytical questions guiding the present conceptual framework are summarized in Table 2.

Table 2: Key analytical questions used to structure the conceptual framework for examining radicalization narratives and media interpretation.

 Question

Importance 1 Importance 2

Importance 3

What role do social media platforms play in radicalization? Understanding the mechanisms of online radicalization Identifying potential vulnerabilities in social media platforms Informing strategies for counter-narratives and online extremism prevention
How can we balance online freedom with the need for regulation? Ensuring that regulation does not stifle online discussion Protecting individuals from online extremism and hate speech Informing strategies for social media monitoring and counter-narratives
What are the root causes of radicalization, and how can we address them? Understanding the psychological and social factors that contribute to radicalization Informing strategies for radicalization prevention and intervention Identifying potential vulnerabilities in individuals and communities
How can we develop effective counter-narratives to extremist ideologies? Understanding the mechanisms of online influence and persuasion Informing strategies for counter-narratives and online extremism prevention Identifying potential vulnerabilities in extremist ideologies

The experimental structure underlying the Mind Genomics simulation is based on vignette construction using combinations of narrative elements. Each vignette represents a unique combination of elements drawn from the five conceptual categories described earlier.

The conceptual vignette structure used in this framework is summarized in Table 3.

Table 3: Conceptual vignette elements illustrating the Mind Genomics experimental design used to construct narrative combinations.

Code

Element

QUESTION A What role do social media platforms play in radicalization?
A1 Social media platforms provide a conduit for extremist ideologies to spread.
A2 Social media platforms can also be used to promote counter-narratives and prevent radicalization.
A3 Social media platforms have a responsibility to regulate online content and prevent extremism.
A4 Social media platforms are merely a reflection of societal values and norms.
QUESTION B How can we balance online freedom with the need for regulation?
B1 Regulation should prioritize online safety and security over freedom of expression.
B2 Regulation should prioritize freedom of expression over online safety and security.
B3 Regulation should strike a balance between online safety and freedom of expression.
B4 Regulation is not necessary, as online communities can self-regulate.
QUESTION C What are the root causes of radicalization, and how can we address them?
C1 Radicalization is often the result of psychological and social factors, such as mental health issues and social isolation.
C2 Radicalization is often the result of ideological and theological factors, such as extremist ideologies and charismatic leaders.
C3 Radicalization is often the result of a combination of psychological, social, ideological, and theological factors.
C4 Radicalization is a complex and multifaceted phenomenon that cannot be reduced to a single cause or factor.
QUESTION D How can we develop effective counter-narratives to extremist ideologies?
D1 Counter-narratives should prioritize empathy and understanding over confrontation and critique.
D2 Counter-narratives should prioritize confrontation and critique over empathy and understanding.
D3 Counter-narratives should strike a balance between empathy and confrontation, and critique and understanding.
D4 Counter-narratives are not necessary, as extremist ideologies will ultimately collapse under their own weight.

Discussion

The framework presented in this study demonstrates how AI-assisted narrative analysis combined with Mind Genomics thinking can transform complex news narratives into structured analytical models. Research suggests that radicalization often emerges through interactions among identity processes, perceived grievances, and social influence [12]. Psychological analyses further highlight the role of emotional narratives and ideological framing in shaping extremist cognition [13].

Digital communication environments may amplify these dynamics by enabling rapid dissemination of ideological narratives and connecting individuals with communities that reinforce particular beliefs [5,6]. Mind Genomics provides a complementary perspective by examining how individuals interpret combinations of ideas rather than isolated variables. By systematically varying narrative elements, researchers can explore how audiences interpret complex events and identify patterns of cognitive segmentation.

The framework proposed in this study treats the news event referenced in the narrative solely as an illustrative example used to demonstrate how such an analytical structure may be constructed. The objective is not to determine the motivations or psychological characteristics of any specific individual involved in the incident, but rather to show how complex news narratives can be decomposed into informational elements that allow systematic exploration of audience interpretation.

Beyond its relevance for research on radicalization, the integration of artificial intelligence–assisted narrative analysis with Mind Genomics thinking may also offer important educational value. Students and readers are frequently exposed to complex news stories involving political violence, social conflict, or ideological tensions. Without structured analytical tools, such narratives may be interpreted primarily through emotional reactions, media framing, or pre-existing political beliefs.

By decomposing news narratives into identifiable informational elements and examining how different combinations of these elements influence interpretation, the combined use of AI and Mind Genomics thinking offers a systematic approach for understanding how readers make sense of complex public events. Such an approach may help students develop more reflective and structured ways of engaging with contemporary news stories, thereby promoting critical thinking, media literacy, and a deeper awareness of how narratives shape public perception.

Conclusion

This study presents a conceptual framework demonstrating how artificial intelligence–assisted narrative analysis can be integrated with Mind Genomics thinking to examine how audiences interpret complex news narratives related to radicalization and political violence. Using a widely reported news account as a conceptual stimulus, the paper illustrates how complex media narratives can be decomposed into structured informational elements and organized into a conceptual experimental design consistent with Mind Genomics methodology. The framework highlights how combinations of narrative elements—such as online environments, ideological alignment, social connection, autonomy, and emotional states—may influence the ways in which individuals interpret events associated with radicalization.

Although the present work represents a conceptual simulation rather than an empirical study, it outlines a methodological pathway for future research. Empirical Mind Genomics experiments could apply this framework to measure how different narrative components influence audience interpretation and to identify distinct cognitive segments among readers exposed to narratives of political conflict and extremism. Such investigations could contribute to a deeper understanding of how individuals process complex and emotionally charged news stories.

More broadly, the integration of AI-assisted narrative decomposition with Mind Genomics thinking offers a structured analytical approach for studying contemporary news discourse. Beyond research applications, the framework may also have educational value by helping students and readers develop more systematic and reflective ways of interpreting complex media narratives. By transforming unstructured news stories into analyzable informational components, the approach may contribute to improved critical thinking, media literacy, and a deeper understanding of how narratives shape public perceptions of radicalization and political violence.

Competing Interests

The authors declare that they have no competing interests.

Funding

No external funding was received for this study.

References

  1. Kruglanski AW, Gelfand MJ, Bélanger JJ, Sheveland A, Hetiarachchi M, Gunaratna R (2014) The psychology of radicalization and deradicalization: How significance quest impacts violent extremism. Polit Psychol 35(S1): 69-93. doi: 10.1111/pops.12163
  2. Hogg MA (2014) From uncertainty to extremism: Social categorization and identity processes. Curr Dir Psychol Sci 23(5): 338-342. doi: 10.1177/0963721414540168
  3. Borum R (2011) Radicalization into violent extremism I: A review of social science theories. J Strateg Secur 4(4): 7-36. doi: 10.5038/1944-0472.4.4.1
  4. Victoroff J (2005) The mind of the terrorist: A review and critique of psychological approaches. J Conflict Resol 49(1): 3-42. doi: 10.1177/0022002704272040
  5. Sageman M (2008) Leaderless jihad: Terror networks in the twenty-first century. Philadelphia (PA): University of Pennsylvania Press.
  6. Klausen J (2015) Tweeting the jihad: Social media networks of Western foreign fighters in Syria and Iraq. Stud Confl Terror 38(1): 1-22. doi: 10.1080/1057610X.2014.974948
  7. Moskowitz HR, Gofman A (2007) Selling blue elephants: How to make great products that people want before they even know they want them. Upper Saddle River (NJ): Wharton School Publishing.
  8. Papajorgji P, Moskowitz HR (2023) The ‘Average Person’ Thinking About Radicalization: A Mind Genomics Cartography. J Police Crim Psychol 38(2): 369-380. [crossref]
  9. Reuters (2024) Trump survives assassination attempt at Pennsylvania rally. News report.
  10. Tanzer A (2026) Vice President JD Vance says Crooks motive remains unknown after Trump rally shooting investigation. News report.
  11. Moskowitz HR (2012) Mind genomics: An experimental approach to understand human thinking and decision processes. Food Qual Prefer 24(1): 1-11. doi: 10.1016/j.foodqual.2011.09.002
  12. McCauley C, Moskalenko S (2017) Friction: How radicalization happens to them and us. New York: Oxford University Press.
  13. Horgan J (2014) The psychology of terrorism. 2nd ed. London: Routledge.