Monthly Archives: January 2022

fig 2

Maladjustment of Pressure Settings of Programmable Shunt Valves by Weak Magnetic Fields – A Case Report

DOI: 10.31038/PSYJ.2022412

Abstract

Introduction: Hydrocephalus is caused by the progressive accumulation of cerebral spinal fluid (CSF) within the intracranial space. Resulting in an abnormal expansion of cerebral ventricles and, consequently, in brain damage. The standard treatment of hydrocephalus in children and adults is implantation of a shunt valve (i.e. Codman-Hakim shunt valve from Johnson & Johnson). This study shows easy maladjustment of a Codman-Hakim programmable valve even with magnetic field strengths as they occur in daily life.

Methods and Materials: The Codman-Hakim valve is a programmable CSF shunt valve with an opening pressure between 30 and 200 mm H2O. The valve relies on a special ball-in-cone system. A spherical ruby ball is pressed against a conical valve seat by a stainless-steel spring. The spring is attached to a spiral cam. If the pressure difference across the valve exceeds a preset pressure adjustment, the ball rises from the seat and vents CSF. To provide a larger valve orifice, the ball moves further away from the seat once the flow rate through the valve increases.

Findings and Outlook: Electromagnetic locking mechanism of common hospital doors employs magnetic field amplitudes strong enough to unintentionally change the patient’s shunt settings We experimentally verified that even weak (5-25 mT) magnetic fields can lead to significant changes in the spiral cam setting of Codman-Hakim shunt valves weak magnetic fields of up to 25 mT suggest that shunt valve might even interfere with household objects when brought in close proximity (i.e. refrigerator magnets) Our everyday life involves electronic and technological advances, the number of potentially interfering devices is likely to increase systematic characterization of various shunt valves with respect to everyday’s objects might be of significant importance to prevent ‘artificially’ created psychiatric symptomatic.

Keywords

Codman-Hakim programmable shunt valves, Maladjustment, Case report, Hydrocephalus

Introduction

Hydrocephalus is caused by a progressive accumulation of cerebral spinal fluid (CSF) within the intracranial space resulting in an abnormal expansion of cerebral ventricles and, consequently, in brain damage.

Implantation of ventriculo-peritoneal shunts (VP-shunts) is the standard treatment of hydrocephalus in children and adults. Most of the currently used shunt systems involve a valve to control pressure and drain CSF if needed [1-3].

In the last few years, malfunctions of programmable VP-shunts have been reported in cases in which patients have encountered powerful electromagnetic fields, e. g. Magnetic Resonance Imaging (MRI) [4,5]. However, the effects of small magnetic fields on VP-shunts are not well known.

In this study we present a case from Forensic Psychiatry in which pressure settings of an implanted Codman-Hakim programmable valve were changed when using electromagnetically controlled doors in a hospital ward.

Case Report

The patient is a 53-year-old man with a triventricular hydrocephalus due to cerebri stenosis of aqueductus, diagnosed in January 2013 – randomly discovered via MRI because of a newly developed insecure gait without Hakim’s triad. Also, an increasing psychomotoric slowdown and affective flattening were described. A treatment with a left ventriculoperitoneal programmable Codman Hakim valve and a Miethke-shunt-assistant was selected.

The pressure of the Codman-Hakim programmable valve was preset at 60 mm H2O, since the patient developed hygroma as a sign of overdrainage in June 2018.

In September 2018 the patient’s behavior was slightly changing. He showed an increasing affective flattening and modifications in psychopathology like repellent behavior. Often a loss of motivation and discouraged answering were recognized.

In skull x-ray a change in preset pressure from 60 to 50 mm H2O was recognized. In consideration of observed ventricle range, previous patient history of overdrainage and maladjusted pressure setting of 50 mm H2O, the valve pressure was changed to 40 mm H2O. One day after changing the pressure setting, the patient felt better and the described symptoms became less.

In mid-January the same symptoms recurred. Skull x-ray revealed a pressure setting of 50 instead of the preset 40 mm H2O and excluded a shunt disconnection. Again, maladjustments in the pressure setting were thought to have caused behavioral changes, and the valve pressure was subsequently reprogrammed to 40 mm H2O. Again, the patient improved clinically. Due to the rigorous absence of mobile phones or any other external electromagnetic equipment, the valve’s pressure setting had to be changed by some device present in Forensic Psychiatry – the magnetically closure assistance of the doors.

Methods

The Codman Hakim valve (Codman, Johnson & Johnson Company) is a programmable CSF shunt with an opening pressure between 30 and 200 mm H2O. The valve relies on a special ball-in-cone system. A spherical ruby ball is biased against a conical valve seat by a stainless-steel spring. Atop the spring sits a rotating spiral cam that contains a stepper motor. If the pressure difference across the valve exceeds a predefined popping pressure the ball rises from the seat to vent CSF. To provide a larger valve orifice the ball moves further away from the seat if the flow rate through the valve increases. Therefore, the pressure drop across the orifice never rises much above the predefined popping pressure.

To adjust a particular opening pressure an external handheld programming device is placed over the valve and the four programmer’s coils enclose the spiral cam centrically (Figure 1). Generating an electrically induced alternating magnetic field only few magnets are attracted by one coil or another. By switching on and off the electric current the spiral cam rotates step by step. This enables setting the opening pressure non-invasively within 18 steps with a range of 10 mm H2O each.

fig 1

Figure 1: Sketch of a Codman-Hakim shunt valve

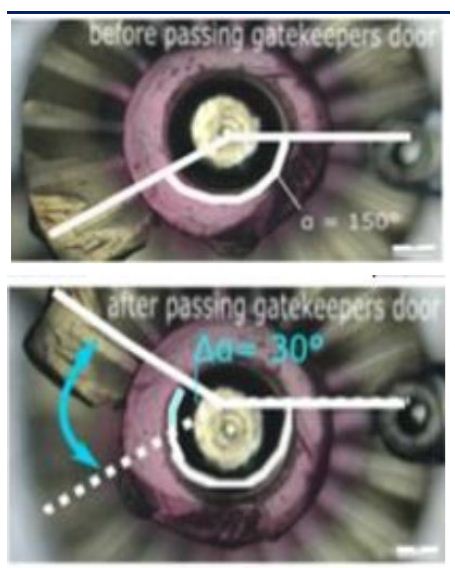
In addition to the described case, our internal testing in Forensic Psychiatry showed also changes of valve’s pressure settings. To evaluate interactions between the Codman Hakim valve and the doors, a field experiment was conducted. A similar, unused Codman Hakim shunt valve was held up at patient’s face level while walking through different doors in the hospital ward. Before and after passing a door, the angle of the spiral cam was measured using an optical microscope. Before and after the walk through a doorway, the angle of the spiral cam was measured with an optical microscope (Figure 2).

fig 2

Figure 2: Rotating spiral cam before and after passing a door the angle of the spiral cam was measured using an optical microscope.

Conclusion

The described case and our internal testing suggest that even weak magnetic fields below 80 mT may lead to significant changes in the cam setting of Codman-Hakim shunt valves. Therefore, even common household items may interfere with Codman-Hakim shunt valves. In fact, any item that creates a magnetic field with a corresponding trajectory of movement, even devices in the healthcare environment, could potentially influence pressure settings. Because our everyday life involves more and more electronic and technological advances, the number of potentially interfering devices is very likely to increase. Both low-intensity and strong magnetic fields carry the risk of interacting with the pressure settings of shunt valves, a problem that both patients and medical professionals should be made aware of.

Even though the validation and reproducibility of our tests may have been somewhat limited, our results underline the fragility of Codman-Hakim shunt valves against even the weakest magnetic fields and pave the way for safe medical devices. Because our everyday life involves more and more electronic and technological advances, the number of potentially interfering devices is very likely to increase. Both low-intensity and strong magnetic fields carry the risk of interacting with the pressure settings of shunt valves, a problem that both patients and medical professionals should be made aware of [6,7].

References

  1. Akbar M, Aschoff A, Georgi JC, Nennig E, Heiland S etal (2010) Adjustable Cerebrospinal Fluid Shunt Valves in 3.0-Tesla MRI: a Phantom Study using Explanted Devices. Rofo 182: 594-602 [crossref]
  2. Kahle KT, Kulkarni AV, Limbrick DD, Warf BC (2016) Hydrocephalus in children. Lancet. 387: 788-799. [crossref]
  3. Mirzayan MJ, Klinge PM, Samii M, Goetz F, Krauss JK (2012) MRI safety of a programmable shunt assistant at 3 and 7 Tesla. Br JNeurosurg 26(3): 397-400. [crossref]
  4. Okazaki T, Oki S, Migita K, Kurisu K (2005) A rare case of shunt malfunction attributable to a broken Codman-Hakim programmable shunt valve after a blow to the head. Pediatr Neurosurg 41: 241-243 [crossref]
  5. Portillo Medina SA, Franco JVA, Ciapponi A, Garotte V, Vietto V (2017) Ventriculo- peritoneal shunting devices for hydrocephalus. Cochrane Database Syst Rev. [crossref]
  6. PROCEDURE GUIDE Codman Hakim Programmable Valve System for Hydrocephalus.
  7. Schneider T, Knauff U, Nitsch J (2002) Electromagnetic field hazards involving adjustable shunt valves in hydrocephalus. J Neurosurg 96: 331-334 [crossref]

Home is Where the Heart is, but Where is “Home”?

DOI: 10.31038/PSYJ.2022411


Due to constant political and financial instability, many young adults are leaving Argentina moving to various places around the world searching for a more promising future. This emigration has been raising on and on for the last few years …

For those of us who have been living abroad for some time, we know that living abroad is not easy and finding a new place to call home takes some time, one of the first questions you get when you meet someone is, where are you from? Of course, the answer to that question is easy. Later, when they get to know you, comes a second and sometimes tricky question, where is home for you.

Where is Home for Me

I was brought up in a family that moved from one country to another. Take into account that the internet and “family-based technology” are younger than me; so, staying connected was hard.… It was my dad’s job. We all just followed the league. Every three or four years we would come back to “homeland” Argentina, but, for me, that was not home. No friends, no school, no known neighborhood…Home for me was where my parents lived, no special land, no matter the country, just that place where I could be myself. I was from “my family”, that was when I discovered that for me home was where my heart was.

I grew up and discovered I had the “moving bee” inside. I just went on traveling and moving from one place to another. While I studied animal behavior, I saw that animals would try to take possession of the place they lived. Usually, they would mark it with their smell just to make it theirs. Make it home for them and their family. This way they could also let the rest know that place was theirs. Well, I guess humans, or at least me, do the same in some way. We decorate the places, do the lawn. We make it home.

Attachment to Home

There is a connection, a cognitive-emotional bond between us humans and our settings, this attachment to what we call home is a common human experience that is why moving isn’t as easy as it might sound. To ignore this fact of minimizing its effects might make the emigration process harder.

It is no secret that people develop a strong attachment to what we call home. Nor related to a specific place, it is related to a sense of control, predictability stability.

Home is Where My Heart is

As I see a home as a part of my self-definition, I made a home of every place where every place I lived. I considered each of those places my home at one time or another, whether it was for months or years I made it mine. Home then was where I was, where my heart is. Me myself, that was my home.

So if you have decided to emigrate, if you chose to move to another country just remember to allow yourself the time to make that place you choose your home. This does not mean you regret what you left, it means your home is where your heart is.

Familiarity with Caspian Kutum (Rutilus kutum)

DOI: 10.31038/AFS.2022412

Abstract

Caspian kutum is one of the valuable and economical species in the Caspian Sea basin, which in most years of exploitation accounts for half of the amount of bony fish catch and has two forms of autumn and spring, the spring form of most of the stocks of this fish gives. These reserves have decreased due to various reasons such as irresponsible fishing, changes in the water level of the Caspian Sea, construction of dams, etc., and for this reason, they have resorted to artificial reproduction of this fish to compensate for this issue. It is an Anadromoys and migrates to the river to reproduce when it reaches sexual maturity and then returns to the sea. After spawning and returning to the sea, Caspian kutum feed on the shallow shores of the Caspian Sea, a land rich in benthic animals, for the remainder of spring and summer. In late summer, due to the very high temperature, Caspian kutum leave the shallow shores and live in deeper places, and when the autumn temperature rotates, they return to the shallow parts of the shores with a depth of less than 20 meters for feeding.

Keywords

Kutum, Caspian Sea, Anadromoys

Introduction

The Caspian Sea is the largest lake in the world and the unique and major habitat of Caspian kutum [1-4]. Caspian kutum is a bony fish belonging to the family Cyprinidae of the genus Rutilus with the scientific name of Rutilus kutum, a native fish of the Caspian Sea. Caspian kutum are migratory and rudimentary and spend most of their lives in the salty waters of the sea and migrate to the fresh water of the river every year in the spring (mid-March to the end of May) for spawning and reproduction [5].

Caspian kutum food is very diverse and numerous, in fact Caspian kutum is omnivorous and gluttonous. The intensity of feeding varies at different times, for example during reproductive times and when they migrate to the river to lay eggs, and the intestines of these fish are often thick and empty, and also in late winter and with decreasing temperature, this index decreases sharply Finds [6].

Sexual Management of Caspian kutum

Sexual maturity in fish is affected by various environmental factors such as temperature, length of light period, water salinity and various other factors. Changes in these factors can have adverse effects on fish reproduction [7].

Sexual Intercourse Consists of Six Stages

Stage 1 – Immature

Very small sexual organs close to the spine, testicles and ovaries transparent and grayish in color, eggs invisible to the naked eye (ovogony)

Stage 2 – Immature

In the testicles and ovaries are semi-transparent, gray, half or slightly more than half the length of the abdominal area, the eggs are solitary and with a visible magnifying glass, spawning fish (resting) are placed in this class (Primary eggs).

Stage 3 – Developing

The testicles and ovaries are dark, reddish with blood capillaries occupy half of the abdomen and the eggs are visible to the naked eye in the form of copper grains. (Hollow eggs)

Stage 4 – Preparation for Spawning

The genitals fill the abdominal area and the testicles are white, the sperm fluid is shed due to pressure and the eggs are completely round and some are semi-transparent.

Stage 5 – Spawning

Eggs and sperm are released at low pressure, most of the eggs are translucent with a number of clear eggs.

Stage 6 – Spawning

The ovaries are loose and wrinkled, the abdomen is completely empty and the eggs are empty [8].

Migration of Spring and Autumn forms of Caspian kutum

The maximum age of Caspian kutum is 9 to 10 years and its maximum weight is 5 to 6 kg. Male Caspian kutum mature at three years old and female Caspian kutum at four years old. Caspian kutum spawn on aquatic plants as well as on bedrock rocks and pebbles. Spawning peaks of spring Caspian kutum occur in April and May, when the water temperature is between 13 and 15 degrees Celsius.

After migrating to the sea, Caspian kutum spend their feeding and growth stages in the sea and after reaching the age of sexual maturity, they enter the fresh water environment of Anzali wetland and the rivers leading to the Caspian Sea for natural reproduction and reproduction.

Autumn migratory Caspian kutum, if the conditions are right, usually enter the sea from early October and through the canal, first the male fish and then the females. The Shijan region in the eastern lagoon spends time in deep areas and then, as the weather warms up in late winter, they migrate to rivers that are covered with marginal vegetation such as reeds and loess, and carry out propagation operations on them, which is why the reason for this form of Caspian kutum is called phytophilus. But now the main population of Caspian kutum in the Caspian Sea belongs to the spring form, which accounts for more than 98% of the reserves [9].

Artificial Reproduction

The annual extraction rate of Caspian kutum from 1980 to 2006 was between 8 to 11 thousand tons per year. Comparison of these release and catch values shows that during the last 30 years, more Caspian kutum stocks have been provided as a result of artificial reproduction, and the available evidence indicates that during this period, the natural reproduction conditions of Caspian kutum become more unsuitable every year and the share of natural reproduction in existing reserves Caspian kutum in the Caspian Sea have been declining to a very small extent. Caspian kutum feed and grow in the sea and after reaching sexual maturity are used for spawning in very few rivers as the main places for spawning and artificial reproduction of this species. Reconstruction of reserves involves capturing part of the population and reproducing them in captivity and releasing them into the wild. In this method, the broods are caught from the rivers of the Caspian Sea and after artificial reproduction, the fertilized eggs are transferred to the breeding center and finally the larvae weighing 2g are released into the sea, thus the annual fishing center has about 200 million The larvae are produced through artificial reproduction and this release plays a key role in restoring the stocks of this species [10-12].

References

  1. Kouchesfahani NE, Vajargah MF (2021) A SHORT REVIEW ON THE BIOLOGICAL CHARACTERISTICS OF THE SPECIES ESOX LUCIUS, LINNAEUS, 1758 IN CASPIAN SEA BASIN (IRAN). Transylvanian Review of Systematical & Ecological Research 23: 73-80.
  2. Forouhar Vajargah M, Sattari M, Imanpour Namin J, Bibak M (2021) Evaluation of trace elements contaminations in skin tissue of Rutilus kutum Kamensky 1901 from the south of the Caspian Sea. Journal of Advances in Environmental Health Research 9: 139-148.
  3. Forouhar Vajargah M, Sattari M, Imanpour Namin J, Bibak M (2020) Length-weight, length-length relationships and condition factor of Rutilus kutum (Actinopterygii: Cyprinidae) from the southern Caspian Sea, Iran. Journal of Animal Diversity 2: 56-61.
  4. Vajargah MF, Sattari M, Namin JI, Bibak M (2021) Predicting the Trace Element Levels in Caspian Kutum (Rutilus kutum) from south of the Caspian Sea Based on Locality, Season and Fish Tissue. Biological Trace Element Research 200: 354-363. [crossref]
  5. Vajargah MF, Mohsenpour R, Yalsuyi AM, Galangash MM, Faggio C (2021) Evaluation of Histopathological Effect of Roach (Rutilus rutilus caspicus) in Exposure to Sub-Lethal Concentrations of Abamectin. Water, Air, & Soil Pollution 232: 1-8.
  6. Sattari M, Vajargah MF, Bibak M, Bakhshalizadeh S (2020) Relationship between Trace Element Content in the Brain of Bony Fish Species and Their Food Items in the Southwest of the Caspian Sea Due to Anthropogenic Activities. Avicenna Journal of Environmental Health Engineering 7: 78-85.
  7. Forouhar Vajargah M, Sattari M, Imanpour J, Bibak M (2020) Length-weight relationship and‎ some growth parameters of‎ Rutilus kutum (Kaminski 1901) in‎ the South Caspian Sea. Experimental animal Biology 9: 11-20.
  8. Sattari M, Namin JI, Bibak M, Vajargah MF, Hedayati A, et al. (2019) Morphological comparison of western and eastern populations of Caspian kutum, Rutilus kutum (Kamensky, 1901)(Cyprinidae) in the southern Caspian Sea. International Journal of Aquatic Biology 6: 242-247.
  9. Sattari M, Imanpour Namin J, Bibak M, Forouhar Vajargah M, Bakhshalizadeh S, et al. (2020) Determination of trace element accumulation in gonads of Rutilus kutum (Kamensky, 1901) from the south Caspian Sea trace element contaminations in gonads. Proceedings of the National Academy of Sciences, India Section B: Biological Sciences 90: 777-784.
  10. Vajargah MF, Hedayati A, Yalsuyi AM, Abarghoei S, Gerami MH, et al. (2014) Acute toxicity of Butachlor to Caspian Kutum (Rutilus frisii Kutum Kamensky, 1991). Journal of Environmental Treatment Techniques 2: 155-157.
  11. Sattari M, Bibak M, Forouhar Vajargah M (2020) Evaluation of trace elements contaminations in muscles of Rutilus kutum (Pisces: Cyprinidae) from the Southern shores of the Caspian Sea. Environmental Health Engineering and Management Journal 7: 89-96.
  12. Forouhar Vajargah M, Bibak M (2021) Pollution zoning on the southern shores of the Caspian Sea by measuring metals in Rutilus kutum Biological Trace Element Research 1-11. [crossref]

Women as Human Rights Defenders at Risk – A Present Case Example

DOI: 10.31038/AWHC.2022511

Abstract

November 29 has been appointed as International Women Human Rights Defenders Day, while persecution, imprisonment, cruel and unusual punishment, torture, and even extra-legal killings, are unfortunately frequent in many countries. The UN declaration against torture, or the Bangkok rules for the treatment of women as prisoners are often ignored in this context. In our short report we want to draw attention to a recent important case in Iran, that demonstrates the violation of human rights and potential health impact in a country singled out by the UN and many international NGOs for such violations. Both domestic and political violence must be addressed by strong efforts by the international community and national bodies, not only because of the adverse individual and public health impact, but also to protect the concept of human rights as a preventive factor in itself. Independent monitoring of the safety and health of women as prisoners, especially in the context of persecution, must be permitted to support this effort.

Keywords

Woman, Prison conditions, Torture, Persecution, Iran

Women are globally especially active as human rights defenders, but also at increased risk of persecution, imprisonment, cruel and unusual punishment and torture, as underlined by the installation of the 29th of November as International Women Human Rights Defenders Day, and demonstrated by the recent case of Narges Mohammadi, spokesperson for Iran’s Centre for Human Rights Defenders. Women, like the first women surgeon, Homa Shaibany [1], sometimes play an important role as professionals in the history and development of the country, in spite of the barriers facing them in public and professional life, as reported for example by the international NGO Human Rights Watch . Reports by victims and witnesses brought out of the country circumventing the else strict censorship, are frequently the only information on ongoing cases of violations and can at least be used to argue for independent investigation, as for example by the UN special rapporteurs on torture or on Iran.

Well known for both her publications and her firm stance in the defense of human rights in Iran, Mohammadi is back in prison after 13 months of freedom. She had been released on 8 October 2020 after more than five years behind bars and most recently Ms. Mohammadi was arbitrarily arrested and detained again after taking part in a memorial service, as reported by Amnesty International, the OMCT, and other independent international NGOs [2].

Between prison terms, persecution continued. According to personal communication to the author, during her 13 months of freedom, Mohammadi continued to be subjected to judicial harassment, which included being arrested at least eight times, as must be assumed, because of her support for the families of imprisoned journalists and other prisoners of conscience [3]. She was violently attacked by security forces on the street at least three times when she attempted to visit the families of political prisoners or executed prisoners Navid Afkari and Sattar Beheshti, again based on personal communication received by the first author (SM).

Judicial authorities had further confirmed a decision to give her a new sentence of 36 months in prison, 80 lashes and a fine on charges of “anti-government propaganda by means of the publication of false information” and “insulting government officials” [4].

She said on a phone call to her husband, the transcript being shared with the author and again regarding flogging sentence during an online meeting with author, before her arrest (SM): “I’m in security section 2A of Evin prison [a section controlled by the Revolutionary Guards] and they’ve told me I must serve 30 months in prison and receive 80 lashes, but as long as I live, I won’t let myself be flogged.” Flogging [2] must be seen as both a form of torture and “cruel and unusual punishment” denounced internationally [3,4]

During imprisonment, she had been exposed to solitary confinement, which is, according to UN, a form of psychological torture, with potentially severe health consequences, also practiced for example in the US [5], but forbidden as torture by international human rights standards, as stated by UN Special rapporteur Juan Mendez , and criticized by international expert boards [6-9]. Narges Mohammadi has published two books, which are currently being translated into English and German, and made a documentary film about the consequences of so-called “white torture,” in which prisoners are systematically held in solitary confinement for an unknown period of time without even access to a lawyer, under harsh conditions such as being exposed to light or noise all the time, etc. [6]. Conditions described would not violate the prohibitions described in the UN Anti-torture convention [4], but would also violate the special considerations applying to women prisoners as outlined in the UN standards (“Bangkok rules”) [10]. Mohammadi had also reportedly been earlier been subjected to direct physical violence by the director of Tehran’s Evin prison and several guards when she protested against her transfer to Zanjan prison, 300 km northwest of Tehran, in December 2019 [8].

The Third Committee of the UN General Assembly, which specialises in human rights issues, meanwhile adopted a resolution on 17 November, condemning Iran yet again for its flagrant human rights abuses, including its crackdowns on protests “using weapons of war,” according to Javaid Rehman, the UN special rapporteur on the human rights situation in Iran [9].

It might be noted, that publishing independent scientific research and reporting on human rights violations from countries such as Iran are nearly impossible, and data must frequently make use of reports by victims, family members and international NGOs [11]. The Islamic Republic of Iran is ranked 174th out of 180 countries in RSF’s 2021 World Press Freedom Index [10].

The Un Special Rapporteurs should therefore been invited to independently assess the situation of Narges Mohammadi and other, especially women prisoners in Iran. Women as human rights defenders should receive special support and consideration by the international community [12], to be given not only at November 29.

References

  1. Fahimi M, Homa Shaibany (1952) First woman surgeon of Iran. J Am Med Womens Assoc 7: 272-273.
  2. Leth PM, Banner J (2005) Forensic medical examination of refugees who claim to have been tortured. Am J Forensic Med Pathol 26: 125-130. [crossref]
  3. Lines R (2008) The right to health of prisoners in international human rights law. Int J Prison Health 4: 3-53. [crossref]
  4. Rasmussen OV (2006) The medical aspects of the UN Convention against Torture. Torture 16: 58-64. [crossref]
  5. Gawande A (2009) Hellhole: the United States holds tens of thousands of inmates in long-term solitary confinement. Is this torture? New Yorker 36-45. [crossref]
  6. Alempijevic D, Beriashvili R, Beynon J, Alempijevic Petersen D, Birmanns B, et al., (2020) Statement of the Independent Forensic Expert Group on Conversion Therapy. Torture 30: 66-78. [crossref]
  7. Hunt SC, Orsborn M, Checkoway H, Biggs ML, McFall M, et al., (2008) Later life disability status following incarceration as a prisoner of war. Mil Med 173: 613-618. [crossref]
  8. The Istanbul Statement on the Use and Effects of Solitary Confinement. Torture, 2008. 18: 63-66.
  9. Smith PS (2008) Solitary confinement. An introduction to the Istanbul Statement on the Use and Effects of Solitary Confinement. Torture 18: 56-62. [crossref]
  10. Van Hout MC, S Fleissner, H Stover (2021) #Me Too: Global Progress in Tackling Continued Custodial Violence against Women: The 10-Year Anniversary of the Bangkok Rules. Trauma Violence Abuse 15248380211036067.
  11. Siroos Mirzaei HA, Seyed Zarei, Reem Alksiri (2021) Psychosocial consequences of widespread of torture and sociopolitical pressure in Iran. Social Medicine 14.
  12. Wenzel T, Alksiri R, den Otter J, Mirzaei S (2020) Special challenges related to persecution and imprisonment for Woman in Syria-aspects of neglected problems in the support of survivors. ARCH Women Health Care 3: 1-3.
fig 3

The Dollar Value of Ideas Surrounding Ethnic Foods: A Mind Genomics Cartography

DOI: 10.31038/NRFSJ.2022511

Abstract

310 respondents each evaluated 60 unique vignettes (combinations of messages) about ethnic foods, the messages presenting information about the country of origin, when and why the food is eaten, and the benefit if the ethnic food goes ‘mainstream’, and the issues about food safety. Respondents each rated unique sets of 60 the vignettes, first assigning purchase price, and second recording their emotion on reading the vignette. Three mind-sets emerged, based upon the dollar value of the messages. Further analysis demonstrated the interaction of elements, showing how the specific ethnic source drove the dollar value of other elements. The approach is presented as a model for the easy, rapid, and affordable creations of databases of the mind of people as they experience issues of everyday life.

Introduction

One need only go to large supermarkets to look at the foods which become trendy. Whereas decades ago, the foods were big brands, mainstream, today the opposite is happening. Ethnic foods are booming, for many reasons, not the least of which are adventurous eaters, people who want to hold on to their heritages, and the ever-present desire of marketers to identify new opportunities to enter food categories perceived to be densely crowded.

Most of the focus on ethnic foods tends to be trends [1], the emergence of specific preferences for foods, [2], and the sheer joy of writing in depth about something new, something with substance to it which has a story. And of course, ethnic cuisine with it arrays of specific appearances, aromas, tastes, and textures make for interesting reading and interesting video presentations. Watching the chef prepare an ethnic dish is simply entertainment.

Part of appeal of research on food is the sheer fact that everyone eats. Researchers recognize that people eat for different reasons, whether those reasons be economic, satisfaction, curiosity, social demands, and forth [3]. The studies on what makes people try ethnic foods are often studies of the psychology of people or just as often the using people to understand more deeply the aspects of the food itself [4-6]. This paper emerges from a joint focus on the above issues; the mind of the consumer (rules of decision), and an interest in ethnic foods as it enters society (responses to ethnic foods going ‘mainstream’, and concerns about food safety) safety. What is it about ethnic foods which make them interesting? What is the economics involved with ethnic foods, such as the business issue of the premium price, if any, appropriate for ethnic foods? Can we learn more about the mind of the customer who buys ethnic foods?

The Contribution of Mind Genomics

Mind Genomics can be defined as the ‘science of the everyday’ from the point of view of the person who is experiencing the ordinary, topics requiring decisions. We are familiar with world of the everyday because we live in that world. Occasionally, researchers focus on this world, especially anthropologists and sociologists, as well as consumer researchers. Anthropologists describe the structure of our everyday culture. Sociologists describe how people relate to each other, what type of institutions they set up and how they deal with each other. Consumer research looks at what people do from the point of understanding a business situation. Most of these studies are from the outside in, looking at the external behavior of the person in a situation filled with choice opportunities. By looking from the outside in, we mean seeing how people react. Looking from the outside in does not mean disregarding what people say, but rather looking at generalities of a situation instead of the more granular specifics of the situation. For example, in a study of food choice by low-income families, Burns et al. (2013) instructed respondents to sort foods on the basis choice [7]. The basic unit adopted by the respondent was quantity per unit price (value for money), as well as estimated satiation of hunger per price. What more could have been learned were the respondent able to tell the researcher ‘why’.

Mind Genomics is an emerging discipline, cross-sectional in nature, with the objective to understand the world of everyday experience and choices through the lens of choice experiments. in simple terms, the goal is to understand how people think about the different aspects of a situation, such as the way we think about ethnic foods. Rather than simply asking respondent one or two questions about ethnic food, the objective is to probe more deeply, in the way a psychologist understands the mind from the inside out. The question is how one applies that type of thinking to something quite ordinary, like the nature of ethnic food. Personality could be probed and link that to the response to ethnic food, but the effort seems too circuitous. There should be a more direct way to understand the mind of the person regarding ethnic food, doing it so from inside.

During the past 80, researchers have recognized the possibility of learning a great deal of complex and compound systems of variables, using experimental design to create test stimuli comprising mixtures resembling what people experience in everyday life, measure the response to the mixtures, and then deconstruct the response into what each variable contributes when it is judged in what could be a simplified approximation to the ‘blooming, buzzing confusion’ of everyday life. The approach, systematized experimentation, makes sense when we work with both with description of everyday life. As simple as this sound, the process is quite elegant, and produces a great deal of understanding. Typically, the respondent first tries to figure out ‘what is the right answer’, but soon relaxes, realizing that it’s impossible to game the system. In this way the systematized mixing of ideas become a strong method to understand the everyday. The strength of the approach has not escaped researchers. The history of mixing ideas together goes back to the notions of functional measurement [8], to the mathematical psychology of conjoint measurement [9], and to the applications of these groundbreaking ideas by Paul Green and his associates at Wharton School of Business at the University of Pennsylvania in Philadelphia [10].

Applying the Approach to Ethnic Foods

The research comes from the continuing interest in food safety, a topic expanded in the literature by Saulo and colleagues [11] the opportunity came along to study the intersection of food safety, and ethnic foods. At the same time, interest was growing in the application of methods other than Likert scales to measure hedonics. At the time of the study (2012), Moskowitz and colleague Stephen Rappaport were expanding Mind Genomics into the world of economics, calling the effort Cognitive Economics. The approach was looking at money both as a source of stimuli for investigation, and as a rating unity in place of hedonic judgments. Some of the interest emerged from the pioneering work of psychophysicist Eugene Galanter [12], who studied the utility and disutility of money, finding that the relation between Utility of Money and Actual amount of money could be represented by a power function of the form: Utility k (Dollars0.5). The use of money as a rating scale had been published before [13], but only as part of a study on the responsiveness of different kinds of scales to measure personality-related issues. The studies by Moskowitz and colleagues [14,15] would usher in the use of money scales to measure the response of homo economicus (dollars as scale points) versus homo emotionalis (Likert Scale).

It is important to note that the term ‘cognitive economics’ had been used before to describe the focus of economics on the psychological processes involved in economic decisions [16-19]. The term ‘cognitive economics’ used by Moskowitz, Rappaport and colleagues used the term strictly as an easy way to describe the use monetary scales by Mind Genomics, to compare scaling based on perception of price versus based on feeling Mind Genomics studies using both dollars as ratings, and liking as ratings, viz., two scales, suggested that respondents were more conservative when they used money as a scaling device, rather than interest or purchase intent as a scaling device (unpublished observations by HRM). Furthermore, in those studies for business clients, it appeared that the segmentation or dividing respondents by pattern of responses differed when the dependent variable was ‘dollar value’ associated with the element versus ‘degree of purchase intent’ associated with the element. This was summarized by the notion that ‘homo economicus’ may play by different rules than does ‘homo emotionalis.’ We may like something very much, but that does not mean we are going to pay more for it.

These early studies led to the study reported here, on the dollar value of the different aspects of ethnic food. Using Mind Genomics as the tool makes it possible to measure the dollar value of different aspects of ethnic food, such as the origin, the nature of food safety, the and the acceptance of the food, respectively. Although there are various studies in the literature discussing the acceptance and popularity of different ethnic foods, there did not seem to be any effort towards quantifying the different aspects of food in the spirit of a ‘dollar metric’ of the type that Mind Genomics would provide.

As noted above, Mind Genomics is well-suited towards the exploration of the dollar value of different aspects of a compound stimulus. Rather than breaking down the compound stimulus into its components and measuring responses to each component separately, Mind Genomics work with more ecologically typical combinations of components or messages. Respondents evaluate mixtures of messages, such as origin, usage, safety, etc. The combination more typically resembles a description of an ethnic food, although the combination is not at all polished. So long as the combinations are created in a statistically meaningful way using ‘experimental design’ [20], the researcher can create the combinations, test them with people using a scale, and then deconstruct the ratings into the part-worth contribution of each element, its impact. The process is more efficient, cannot be ‘gamed’, and forces the respondent to maintain a common criterion for judgment across different types of messages.

Setting Up the Mind Genomics Experiment for Ethnic Foods

Step 1: Select the Topic, the Questions (Categories), and Answers (Elements)

Mind Genomics works in a structured, templated manner. The test stimuli in a Mind Genomics experiment comprise combinations of elements, combinations that will to be treated as one compound idea. The underlying structure of the stimuli created by Mind Genomics is dictated by a ‘recipe’ book called the experimental design. Only certain pre-tested lists of specific mixtures are allowed. The structure guides the number of question and answers. Figure 1 shows the four questions, and the nine answers for each equation. The structure shown in Table 1 is called a 4×9 (four questions, nine answers per questions, henceforth referred to as nine elements per question).

fig 1

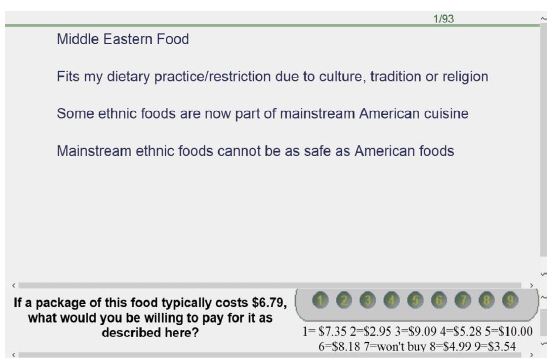
Figure 1: Example of a four element vignette

Table 1: The raw material, comprising four questions and nine elements (answers) for each question.

table 1


A key feature of Mind Genomics is that the questions will never be presented to the respondents. They are simple there to promote thinking about the topic. Furthermore, the question-answer format is a template. A question can comprise two or more different subs-questions. The only requirement is that an answer to one question cannot be broken into two groups, viz., appear as answers to two questions. . That is, one could imagine question #1 on the nature of the ethnic food ‘spilling over’ to question #2. This specific design can accommodate a maximum of nine different ethnic foods.

In contrast, a single question can comprise two or more topics, so long as the topic is completely covered in the one question. For example, Question #1 might comprise ethnic foods as well as methods of preparation. Having two different issues in Question 1 is fine, so long as neither issue appears in another question. The rationale for this is bookkeeping. All elements from one question must be able to be combined with all elements from another question, without creating a mutually incompatibility. In the case the question spills overs, e.g., having 12 different ethnic foods, not nine, it is likely that some vignettes will have two different ethnic foods of different types in the same vignette, a design flaw because the two elements of the same type contradict each other.

Step 2: Create the Test Vignettes, According to an Underlying Experimental Design

The respondents evaluated small vignettes comprising 2-4 elements, as dictated by an underlying experiment [20]. Figure 1 shows an example of a vignette comprising four elements, one from each of the four questions. Some of the vignettes comprise two elements, some three elements, the majority four elements. No more than one element ever appears from a question, permitting the design to act as a bookkeeping device.

One might question the design of the vignette. It does not appear to be nicely set up as a paragraph, with connecting words. The reality is that the vignette is set up to convey information in the format easiest for the respondent to search for the relevant information. In contrast to what might be thought at first, this sparse format is easy, and does not tire the respondent. The respondent quickly learns the scheme, in an in a way that is relaxed, the respondent evaluated each vignette, for a total of 60 vignettes.

Step 3: Select the Rating Scales that the Respondent Will Use to Evaluate the Vignettes

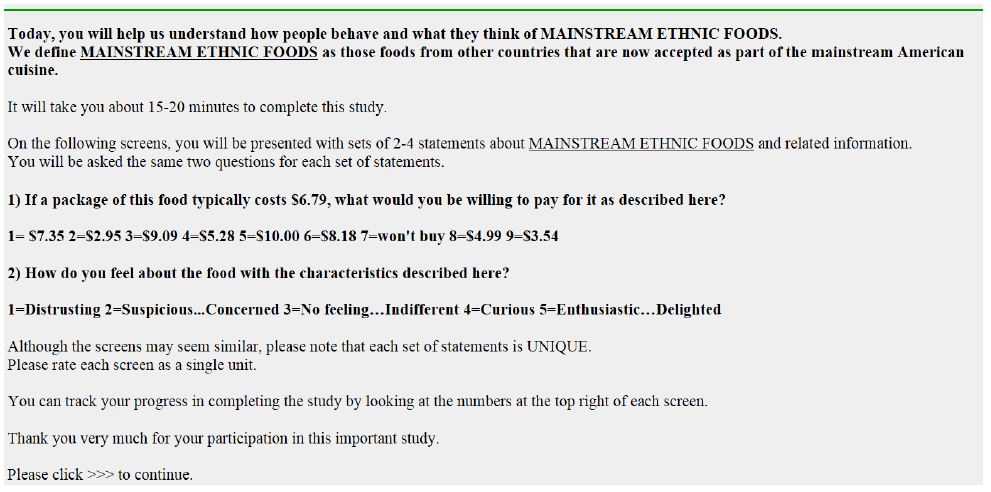
The rating scale provides a numerical way for the respondent to communicate with the researcher. This study comprised two scales, the first a scale of dollars, and the second a choice of emotion/feeling after reading the vignette. The dollar values were randomized, forcing the respondent to think before the scale ends up being memorized. By putting the different dollar values into an irregular order, the research forces the respond to put some extra thought into the evaluation of price. The second rating scale, emotion, was presented in an ascending array of emotions. Figure 2 shows an example of the orientation page that the respondents read before evaluating the vignettes, and before profiling themselves on a follow-on questionnaire.

fig 2

Figure 2: The orientation page for the study.

In the analysis, the dollar values will be treated a continuous scale, having ratio properties. In contrast, the five-point emotion scale will be treated as a nominal scale. The five points will be considered different alternatives. Ratings 1 and 2 are considered negative; rating 3 is considered neural, rating 4 and 5 are considered positive.

The entire evaluation session took about 20 minutes. The study comprised the orientation page, 60 vignettes, each rated on two scales, and a self-profiling questionnaire, dealing with who the person is, what the person does with regards to food and shopping, and attitudes toward different dimensions of ethnic foods, such as food safety.

The respondents were recruited by Luth Research, Inc. in San Diego, CA, and compensated as part of their panel participation. The study was totally anonymized so that the respondents could not be identified. A total of 310 respondents participated the respondents coming from across the United States. The requirements were to have approximately half males, half female, and an equal spread of ages.

Step 4: Preliminary, Surface-level Data Analysis

The data generated by the study comprises 60 vignettes each evaluated by 310 respondents, on two rating scales. The experimental design provides information about the actual nature of the stimuli, in terms of the phrases. Our first analysis, however, looks only at the patterns of the responses, without attempting to understand how the ‘meaning’ of the elements drives the response.

Without knowing the meaning of the elements, it is still possible to learn a great deal about the patterns of response. The first question involves the number of times each of the prices is chose, as well as the number of times the type of feeling is chosen. We define negative emotions as Distrusting, Suspicious. Concerned; the neutral emotion as Indifferent; and the positive emotions as Curious, Enthusiastic delighted. The analysis uses the base of 18,600 ratings, looking at the covariation of price and emotion. The analysis is a simple count.

Table 2 shows the cross tabulation of type of emotion (column) by the price chosen (row). The top part of Table 2 shows the choice of dollar value for each emotion. The pattern is quite clear. Negative emotions (Distrusting; Suspicion-Concerned) are associated with low prices, positive emotions (Curious; Enthusiastic-Excited) are associated with higher prices. The bottom part shows the choice of emotion associated with each dollar value. The same pattern holds, higher prices are associated with positive emotions.

Table 2: Association of selection of price and type of emotion.

table 2


The second superficial analysis looks at the consistency of the ratings across the 60 vignettes tested. The second rating scale, selection of emotion, was converted to five ‘daughter’ scales, one daughter scale for each of the five choices. When a specific feeling/emotion was selected for a vignette, the appropriate daughter scale was given the value ‘100’. The remaining four daughter scales were given the value 0. Thus, there are a total of 18,600 rows of data, each with a dollar value and five daughter scales, the latter having one ‘100’ and four 0’. The analysis consists of dividing the 18,600 rows of data into 60 summary rows, one row corresponding to one of the 60 positions or orders.

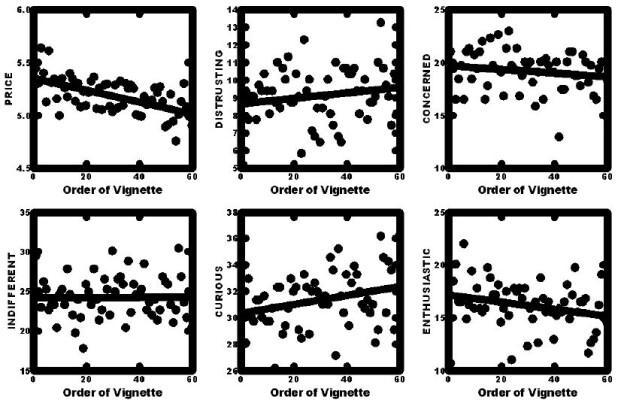
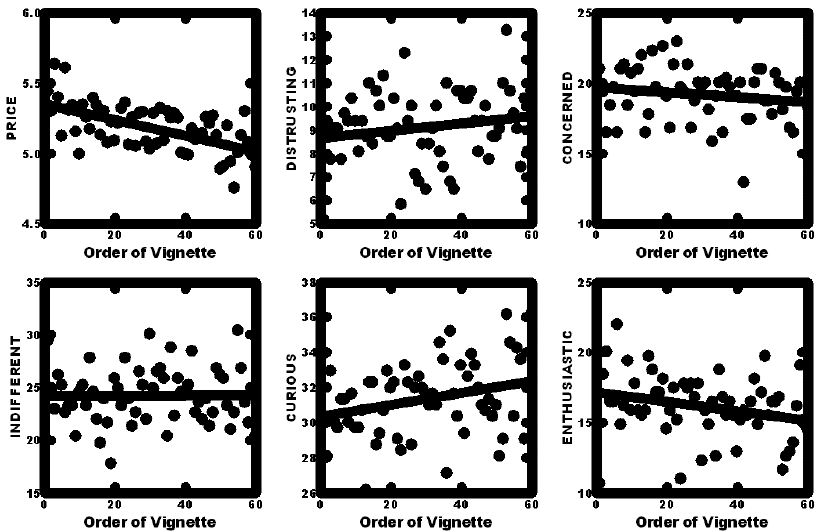
Figure 3 shows the averages by position for the dollar rating, and each of the five feelings/emotions. The key finding is that the selected price drops by about 65 cents from the start of the evaluation (order 1) to the end of the evaluation (order 60). This is an important trend, suggesting some change in the perception of an item’s worth over repeated exposures. The feelings/emotions show less stability, with the averages bouncing around, but there is no meaningful change that captures attention as does the change in assigned price.

fig 3

Figure 3: Change in the assigned rating of price, and the selection of feeling/emotion across the 60 vignettes evaluated by each respondent.

Step 5: Creating Individual-level Models and Developing Mind-sets by Clustering Coefficients

A hallmark of Mind Genomics is the effort to divide individuals based upon the pattern of their responses to the issues of everyday life. Whereas many methods for segmentation of consumers work on the supposition that people can be divided by the general patterns of what they believe, it is the tenet of Mind Genomics that the most practical and productive way is to divide people by how they respond to a limited, manageable ‘chunk of everyday life.’ There may be overriding groups of individuals falling into a limited number of grander mind-sets (e.g., Joel Garreau’s 1981 book on the Nine Nations of North America) [21], but such grand efforts do not cast light upon specific topic encountered in the granular existence of everyday life.

Mind Genomics divides people in a simpler way, more directly, and based upon the pattern of coefficients relating the presence/absence of the test elements to the responses. In our cases, the test elements comprise 36 statements, as shown in Table 1. The respondents evaluated small vignettes, comprising 2-4 elements. Each respondent evaluated 60 different vignettes, allowing us at the level of the individual respondent to create an equation: Dollar Value = k1(A1) + k2(A2) …. k36(D9). The equation relates the dollar chosen by the respondent to the presence absence of the 36 elements. The underlying experimental design allowed us to do this. Each element A1-D9 will end up with a dollar value. The data matrix will comprise 310 rows, each row comprising 36 columns of dollar values, one column for each estimated dollar value for each respondent. Although the respondents evaluated combinations, the regression modeling deconstructs the dollar value selected by the respondent to the individual dollar values of the elements. The respondent is entirely unaware, of course, that this economic deconstruction is going on based upon her or his data, within seconds of the completion of the evaluations.

At the end of the individual-level modeling, we are left with 310 equations each having 36 coefficients. We use clustering to divide these 310 respondents into two and then three smaller, non-overlapping groups. We do that by a method called k-means clustering [22,23], one of the many ‘flavors’ of clustering. The specific clustering method is not the key point here, but rather the notion that the clustering method is a heuristic, allowing us to easily divide this ‘booming buzzing confusion’ into a group of similar patterns. The choices of two or three or even more groups are a matter of interpretation, as is the naming of the groups.

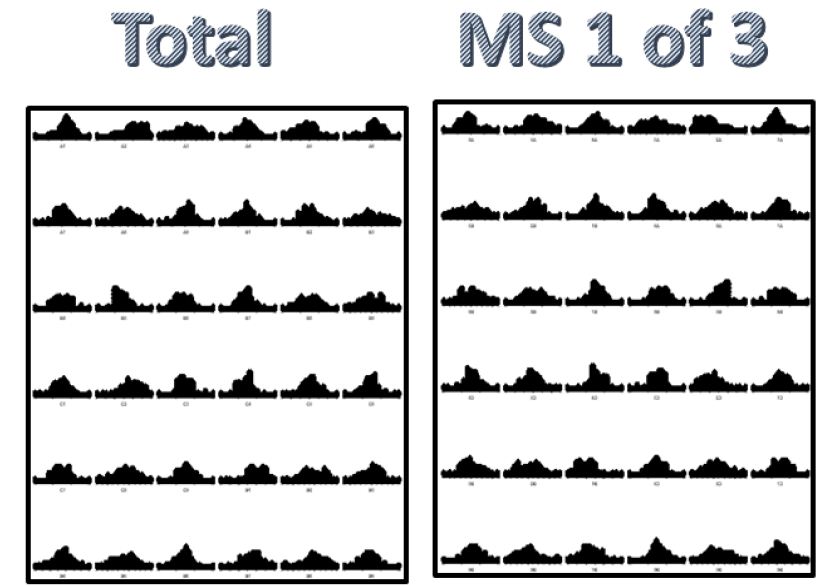
As an example of what the clustering algorithm faces consider the panels in Figure 4. Each panel comprises six rows, each shows six ‘distributions’, albeit in a highly-shrunk fashion. Thus, each panel shows 36 distributions. The six rows in each panel correspond to the A1-A6 (row 1), A7-A9 & B1-B3 (row 2) etc. Each distribution corresponds to one of the 36 elements. The each of the 310 respondents contributes one ‘dot’ or ‘point’ to each of the 36 distributions. Just looking at the set of 36 distributions gives no idea about the existence of underlying groups. Everything looks theme same.

fig 4(1)

fig 4(2)

Figure 4: The distribution of coefficients. Each row in a panel corresponds shows the distribution of the coefficient value for one of the elements.

Now apply the clustering algorithm, and emerge with three mind-sets (MS1, MS2 MS3). It is still virtually impossible to discover the differences between the mind-sets, even though computationally we will see that the clustering algorithm pulls them appear. They are quite different from each other, with each mind-set placing different patterns of dollar values on the 36 elements.

The clustering algorithm computes a ‘distance’ between every pair of the 310 respondents, using the value (1-Pearson R), where Pearson R is the linear correlation between two respondents calculated from the 36 pairs of coefficients. The Pearson R takes on the value 1 when two respondents show coefficients moving in precisely the same pattern, so their distance is 0 (1-1). The Pearson R takes on the value -1 when the two respondents show coefficients moving in precisely opposite directions, so their distance is 2 (viz., 1 – – 1).

The array of distances, k-means clustering identifies a solution, or set of assignments of each of the 310 respondents, first to two clusters (two mind-sets), and then to three clusters (three mind-sets). The assignment attempts to minimize the distance between people in the same cluster as well as maximize the distances among the centroids of the cluster. The entire analysis is mathematically driven. It is the task of the researcher to select the number of clusters, and to name them. That task is done by naming the strong performing elements in each clustering (interpretability), and choosing as few clusters as one can (parsimony).

Step 6: Create the Grand Model, First for Total Panel, and Second for Each of the Three Mind-sets

Once the clusters or mind-sets are identified, the data can be treated either as one grand dataset of 310 respondents, or analyzed on a segment by segment, mind-set by mind-set basis. We will use the term ‘mind-set’ henceforth. The mind-set is named for the strongest performing elements, viz., the elements generating the highest dollar value for the mind-set. Each mind-set comprises individuals who seem to think about the world of ethnic foods in a similar fashion.

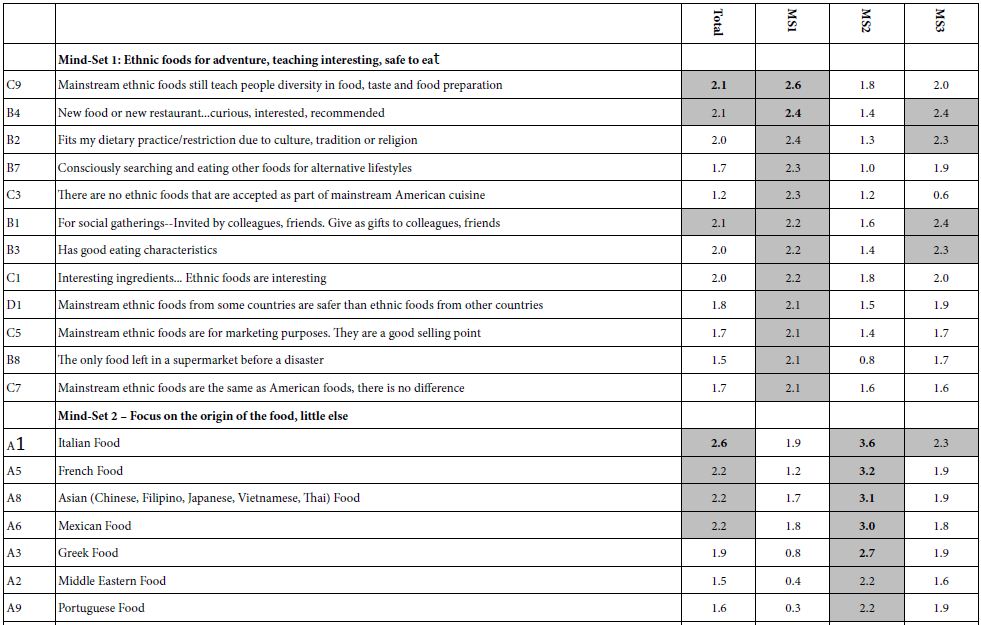
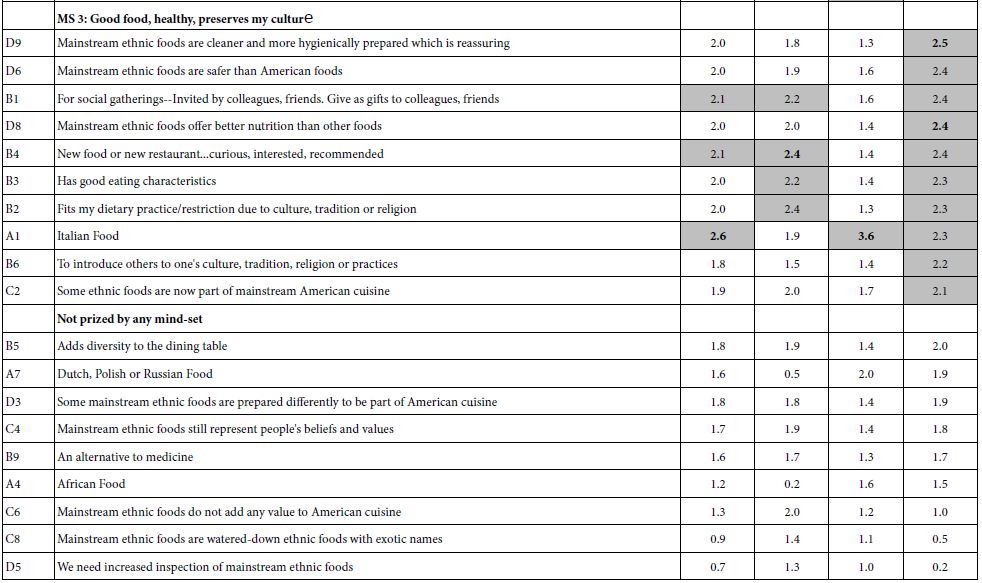
Table 5 shows the 36 coefficients, estimated first for the total panel, and then for the three mind-sets. Each model or equation is estimated on the pattern of responses to the elements. The creation of the mind-sets or clusters is objective, whereas the naming of the mind-sets is subjective, left to the researcher. To name the mind-sets we sort the 36 ‘dollar-based’ coefficient from high to low and highlight any coefficient of value 2.1 or higher, an arbitrary cut-point which allows us to name the mind-set. Mind-sets 1 and 3 are not polar opposites but show different patterns of stress on features of the experience. Mind-Set 2 is different, focusing on the ethnic origin of the food.

Mind-Set 1: Prizes ethnic foods for adventure, teaching interesting, safe to eat

Mind-Set 2: Prizes seven of the nine ethnic foods, does not prize African food, or Dutch, Polish, Russian foods (foods lacking well established restaurants in the United States)

Mind-Set 3: Prizes good food, healthy food, food which preserves my culture

Keep in mind that these are the statements for which the respondent is willing to pay more, even if the respondent does not realize it. The respondent is presented with many different elements. Even though the respondent may feel that she or he is responding in a ‘haphazard’ fashion, the data are orderly.

Scenarios: Interaction of Ethnic Food Source and Element to Increase or Decrease Price

Table 3 suggests three mind-sets, one of which (Mind-Set 2), is willing to pay more when the source of the ethnic food is revealed, e.g., Italian food (worth $3.6), or French food (worth $3.2). The data from Mind-Set 2 can be further studied by isolating all respondents from Mind-Set 2, and then creating 10 different strata, or smaller databases. Each smaller database comprises all the vignettes with a specific ethnic origin. Thus, there are all the vignettes which have NO ETHNIC ORIGIN mentioned, as prescribed by the experimental design. In addition, there are nine additional strata or smaller databases, one stratum for all vignettes having the origin Italian, a second stratum for all vignettes having the origin French, etc. In summary, then, we have 10 different strata generated from the data from Mind-Set 2.

Table 3: Dollar value for the 36 elements for the total panel and three emergent mind-sets. Strong performing elements (dollar coefficient of 2.1 or higher) are highlighted, allowing patterns to emerge.

table 3(1)

table 3(2)

For each stratum we can relate the dollar value of the vignette to 27 elements, B1-D9. We can no longer use Ethnic origin of the food because that origin is a constant for each stratum. That is, all the vignettes in the stratum for ‘African’ come respondents in Mind-Set 2, who evaluated vignettes begun with the statement ‘African Food.’

The analysis follows these steps

a. Create a data matrix. First create the model for all respondents in Mind-Set 2, for the stratum having NO mention of ethnic origin (viz., A – 0) The parameters of that model appear at the far-right column of Table 4, the title of the column being NONE (viz., no ethnic origin of the food.) This will be the baseline. Every other number will be compared to this baseline. Every other number in Table 4 will be ((Coefficient for element estimated with a specific ethnic origin) MINUS (Coefficient for that same element estimated in the absence of an ethnic origin)). This means that the coefficients in the first nine columns are differences from the NO Ethnicity Mentioned.

b. Build nine separate models for all respondents in Mind-Set 2, one for each of the nine strata having a specific country mentioned.

c. The difference is the INCREMENTAL VALUE OF THE ETHNIC ORIGIN. For example, B3 (Has good eating characteristics) is worth 2.3 dollars more when paired with Italian Food, but worth on 1.2 dollars more when paired with African Food.

Table 4: Interactive effect s- how ethnic origin of food interactions with the different elements. The numbers in the body of the body of the table show the change in dollar value of the element when it is associated with a specific ethnic origin.

table 4

Table 4 shows shaded cells for all cells evidencing an increase of $2.00 or more

The same element can be affected differently by the nine ethnic origins.

The same ethnic origin can affect different elements in different ways

There may or may not be an underlying pattern. If there is, that pattern may reveal itself by inspection, if simple enough.

The four elements most positively affected by statements of ethnic origin are:

Mainstream ethnic foods are safer than American foods.

Some ethnic foods are now part of mainstream American cuisine.

Mainstream ethnic foods still represent people’s beliefs and values.

Mainstream ethnic foods still teach people diversity in food, taste and food preparation.

The three elements least positively affected by statements of ethnic origin are:

Our food inspectors are not familiar with mainstream ethnic foods and don’t know how to inspect them.

Consciously searching and eating other foods for alternative lifestyles.

Mainstream ethnic foods cannot be as safe as American foods.

Although the naming of the mind-sets is straightforward, the pattern of interactions may be as interpretable, even though the pattern can be discovered.

The Covariation of Price with Emotion

We finish the analysis by considering the covariation of price with the selection of positive emotions (Curious…Enthusiastic) and or negative emotions (Distrust, Suspicious). We run two models, using Question #1 (select dollar value). We run six models, a model for each of the three mind-sets using only the vignettes generating a positive emotion (rating 4 or 5 on Question #2), and then a second model for each of the three mind-sets using only the vignettes generating a negative emotion (rating 1 or 2 on Question #2).

Table 5 shows that virtually always those elements generating a positive emotion drove a higher rating for dollars for the same element. There are some interesting foods where emotion plays a greater effect influencing the dollar value ascribable to the element. Three elements are worth 1.30 to 1.50 when the respondent feels about a good experience reading the vignette.

Table 5: Coefficients of the two models for dollar value of elements for three mindsets. The models were six times, three mind-sets, first based on vignettes associated with a positive emotion (Pos), and second based on vignettes associated with a negative emotion (Neg). The AVG column shows the difference in dollar value.

table 5

Middle Eastern Food $1.50 more

Consciously searching and eating other foods for alternative lifestyles $1.40 more

Dutch, Polish or Russian Food $1.40 more

Not every element show a strong lift in dollar value correlating with strongly positive emotions. Here are elements, whose values are increased by 60 cents or less. They are elements which do not talk about the joy of foods, but they do talk about food safety.

Inspectors need training on how to inspect mainstream ethnic foods

We need increased inspection of mainstream ethnic foods

Interesting ingredients… Ethnic foods are interesting

Mainstream ethnic foods from some countries are safer than ethnic foods from other countries

There are no ethnic foods that are accepted as part of mainstream American cuisine

Mainstream ethnic foods are safer than American foods

Discussion and Conclusion

The data presented here provide a new way to understand the way we make decisions. As noted in the introduction, a great deal of our knowledge about ethnic foods comes from those who do ‘trend spotting’, identifying what people search for on the web, identifying what the trade believes to be happening, or asking people in ongoing surveys which build databases over time. Sometimes the pattern becomes obvious, when one sees the emergence of new foods on the shelves in stores, and the opening of restaurants, often short lived.

At the same time that there is the richness of food behavior measured, databased, and summarized, there is little in the way of a profound understanding of the mind of the ordinary person with respect to ethnic foods. There are isolated, generally unconnected studies emerging from marketing and food science, executed and published because the topic of ethnic foods is relevant to the researcher’s focus on consumers and the way they think. There is appears to be almost nothing dealing with the inside of the consumer focusing outwards, related to foods. It’s all outward focusing inward or inwards focused on psychological processes, using food as a convenient topic.

This paper merges two new areas to focus on ethnic foods, doing so in a way which displays the richness about the way we think. The first is the disciplined approach imposed upon the research. Rather than ‘pick and choose’ interesting ideas, focusing only upon them, Mind Genomics forces the researcher to come up with structured questions, which tells a ‘sort of story’. The four questions in this study can be considered as the outline of the story, perhaps being told from the vantage point of Where the food comes from (Question 1), where the food is consumed (Question 2), what are the benefit of the food if it goes mainstream (Question 3), and what are the aspects of food safety which might be relevant (Question 4). The requirement to provide nine answers to each question forces the researcher to new ways to think about the topic in terms of specifics, not just in terms of general topics having vague meaning.

The Role of Money, rather than Stated Purchase Intent, as a Key Response Measure

Researcher continually look for appropriate, sensitive, and meaningful measures by which they can more deeply understand how the respondent ‘feels’ about specifics of the external world. The most widely used variables are the rating scales, used to measure intensity of feeling, such as degree of desire to purchase a product. This has been labelled the rating by ‘homo emotionalis’, emotional man, because the respondent is stating a feeling, albeit through the scale. The use of money as a rating scale calls into play different decision processes. Just because a person likes something does not mean that the person will pay more or even a lot more when the person is asked to rate the ‘appropriate price.’

The data from this study suggest that there is a loose relationship between homo economicus (shown by Question #1, dealing with dollars), and homo emotionalis (shown by Question# 2). Table 5 suggests that for the same food, a person who says she or he is experiencing a positive emotion is likely to say that she or he will spend an extra dollar or even several dollars more for certain elements. The discovery here is that the two ways of measuring responses are not parallel.

The Value of Being Able to Test a Lot of the Design Space, and Discover Interactions among Elements

A key contribution of this paper is the demonstration that one can discover interactions among variables in an experimental design, even when the variables are discrete. The unique experimental designs created for Mind Genomics, and the systematized permutations of the basic design enable the researcher to test a great deal of the possible ‘space’ of vignettes, our combinations of elements. There are nine elements in each of the four questions, so that there are 10 actual options of an element (viz, A0-A9, B0-B9, C0-C9, D0-D9). If we look at the total possible number of vignettes, we arrive at 10,000 – 1, the ‘1’ corresponding to the one vignette comprising no elements (A, B, C, and D are all absent). If we are more rigid, we can discard another 36 vignettes. It is highly unlikely for the researcher to be able to find the mind-sets when all 60 vignettes are the same across the 310 respondents. There might emerge mind-sets, but there would be no reason to expect that these mind-sets would represent anything other than a local pattern driven strongly by the single original experimental design. There would be no generality to the finding, just a statistical ‘nicety.’

The second benefit is the ability to do the scenario analysis, as we did to find out how the country of origin of the ethnic food interacts with the other elements. Without the interactions the data just shows the strength of the element, averaging the varying strength of the element which waxes and wanes, depending upon the other element with which it is paired. The data in Table 5 suggests that the dollar value of the element can be dramatically influenced by the nature of the ethnic origin, a pattern that could only be hypothesized about without the scenario analysis and the ability to identify interactions and calculate their magnitude.

References

  1. Campbell JM, Fairhurst A (2014) Billion dollar baby: local foods and US grocery. Journal of Food Products Marketing 20: 215-228.
  2. Meiselman HL (1996) The contextual basis for food acceptance, food choice and food intake: the food, the situation, and the individual. In Food Choice, Acceptance and Consumption (pp. 239-263). Springer, Boston, MA.
  3. Barrena R, García T, Sánchez M (2015) Analysis of personal and cultural values as key determinants of novel food acceptance. Application to an ethnic product. Appetite 87: 205-214. [crossref]
  4. Jang SS, Kim D (2015) Enhancing ethnic food acceptance and reducing perceived risk: The effects of personality traits, cultural familiarity, and menu framing. International Journal of Hospitality Management 47: 85-95.
  5. Prescott J, Young O, O’neill L, Yau NJN, Stevens R (2002) Motives for food choice: a comparison of consumers from Japan, Taiwan, Malaysia and New Zealand. Food quality and preference 13: 489-495.
  6. Samant SS, Hanson AD, Asare R, Nichols DS, Nna-Mba JP, et al. (2018) Effects of food neophobia on visual attention and sensory acceptance of ethnic-flavored foods. Culture and Brain 6: 53-70.
  7. Burns C, Cook K, Mavoa H (2013) Role of expendable income and price in food choice by low income families. Appetite 71: 209-217. [crossref]
  8. Anderson NH, Zalinski J (1988) Functional measurement approach to self‐estimation in multi attribute evaluation. Journal of Behavioral Decision Making 1: 191-221.
  9. Krantz DH (1964) Conjoint measurement: The Luce-Tukey axiomatization and some extensions. Journal of Mathematical Psychology 1: 248-277.
  10. Green PE, Krieger AM, Wind Y (2001) Thirty years of conjoint analysis: Reflections and prospects. Interfaces 31: S56-S73.
  11. Saulo AA, Moskowitz HR (2011) Uncovering the mind-sets of consumers towards food safety messages. Food quality and preference 22: 422-432.
  12. Galanter E (1962) The direct measurement of utility and subjective probability. The American journal of psychology 75: 208-220. [crossref]
  13. Biernat M, Manis M, Nelson TE (1991) Stereotypes and standards of judgment. Journal of Personality and Social Psychology 60: 485-499.
  14. Moskowitz H, Rappaport S, Moskowitz D, Porretta S, Velema B, et al. (2017) Product design for bread through mind genomics and cognitive economics. In Developing New Functional Food and Nutraceutical Products (pp, 249-278). Academic Press.
  15. Saulo AA, Moskowitz HR, Gere A, Papajorgji P, Ettinger Lieberman L, et al. (2019) Linking Food Endorsement Labels & Messaging to Perceived Price and Emotions. A Mind Genomics® Exploration. Advances in Nutrition and Food Science.
  16. Bourgine P (2004) Cognitive economics: an interdisciplinary approach. Springer Science & Business Media.
  17. Bushong B, King LM, Camerer CF, Rangel A (2010) Pavlovian processes in consumer choice: The physical presence of a good increases willingness-to-pay. American Economic Review 100: 1556-1571.
  18. Chater N (2015) Can cognitive science create a cognitive economics?. Cognition 135: 52-55. [crossref]
  19. Ogiela L (2014) Towards cognitive economy. Soft Computing 18: 1675-1683.
  20. Gofman A, Moskowitz H (2010) Isomorphic permuted experimental designs and their application in conjoint analysis. Journal of Sensory Studies 25: 127-145.
  21. Garreau J (1981) The Nine Nations of North America. Avon Books.
  22. Rokach L, Maimon O (2005) Clustering methods. In Data mining and knowledge discovery handbook (pp. 321-352). Springer, Boston, MA.
  23. Fusco V, den Besten HM, Logrieco AF, Rodriguez FP, Skandamis PN, et al. (2015) Food safety aspects on ethnic foods: toxicological and microbial risks. Current Opinion in Food Science 6: 24-32.
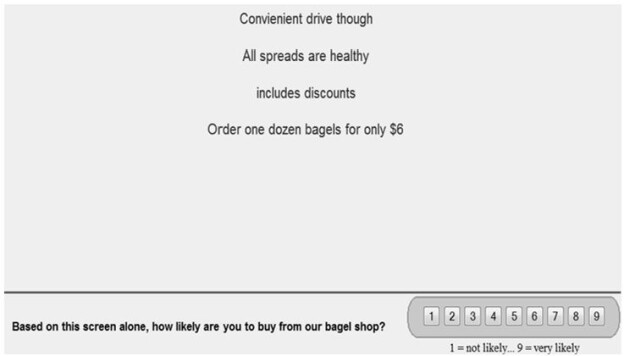
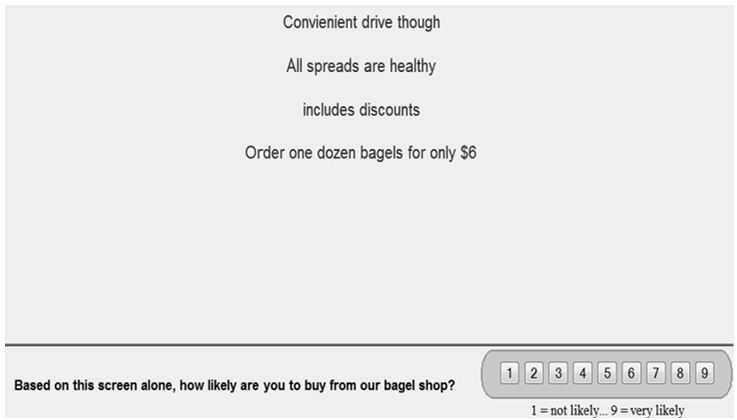
fig 1

Bagels and Steak: A Mind Genomics Cartography of an ‘Alpha vs. Omega’ of Dining

DOI: 10.31038/PSYJ.2021354

Abstract

The paper presents two Mind Genomics cartographies of restaurants, a morning-oriented bagel shop and an evening-oriented steak house. Thirty-six elements for each restaurant, text appearing in different advertisements, were selected, edited if necessary, and then combined into small, easy to read vignettes, prescribed by an underlying experimental design. The ratings were assigned to the vignettes, the first focusing on interest, the second requiring the selection of one of five feeling. For the bagel shop two mind-sets emerged, not strongly different, but providing different emphases on two themes: the experience and the product, respectively. For the steak house three dramatically different mind-sets emerged, focusing on product quality, on selection and service, and on ambiance, respectively. The emotional profiles differed by restaurant. The bagel shop did not elicit strong emotional linkages with elements, whereas the steak house elicited linkages to the feelings of confident and uncertain, respectively. The ability to create deep information about the ‘ordinary’ through simple online experimentation suggests the potential creation of large-scale, intercomparable databases on facets of everyday life, using scientific methods, at a rapid pace, at low cost, with scalability across cultures and over time.

Background

Studies of the customer experience are becoming increasingly popular today. One can scarcely engage in a commercial transaction without the corporate representative warning that there may be a follow-up survey about the experience, and would the customer or client be kind enough to up-rate the corporate representative when instructed to assign the rating of ‘experience.’

This ‘mania’ to evaluate the experience has emerged from the competitive landscape, where the experience itself has become as important as the product being purchased. When the experience is the product, such as restaurants, knowing what makes customers satisfied/happy versus dissatisfied/unhappy is of great important. The conventional wisdom is that one should treat one’s customers right, or else the competitors will.

In the spirit of understand the dimensions of daily experience was born Mind Genomics The objective was and remains to study the experience of the everyday, not so much in the purity of conventional research which isolates a variable to understand it, but rather in the spirit of the random events of daily experience.

In the world of customer wishes and customer experience, Mind Genomics emerges from a decades long effort to understand the relation between what a product or an experience ‘comprises’ and how people react to the product or experience. in other words, what makes a good experience? What specific features can be combined to improve experience?. The answer to the foregoing questions have has more than academic value to build knowledge. The answer to ‘what makes a good experience’ is part of the key to business success.

Insights – A Plethora of Unknown Knowns

Part of the history of Mind Genomics emerged from the world of consumer research and the so-called ‘insights business.’ One way to look at the consumer research and restaurants or indeed almost any topic, is by the nature of the so-called insights which emerge. With their history in sociology and political polling, consumer researchers often excel in measuring external behavior, whether directly, or culling different sources of information and creating from that a model of what might be happening in the mind of consumers. These are consumer trends, evaluated from the outside in, from observing behavior, or from asking questions, uncovering patterns.

What consumer researchers do not know, however, is what messages really work and why they work, viz. the insight out. Presumably people respond to messages, either to patronize a restaurant (the focus here) to buy a product, hire a service, and so forth. Consumer researchers can measure the responses to existing ideas, doing so in any number of ways, and with many tools, ranging from simple polls to in-depth discussion. What is not known, however, is the reaction to specific messages. These are ‘known unknowns,’ in the words of former Secretary of Defense, Donald H. Rumsfeld

It is the systematic study of these messages, using disciplines including experimental design, statistical modeling, and clustering which define the lineaments, the outward aspects of this emerging science, Mind Genomics. The specific objective is to understand the nature of decision making for topics of the everyday, using the pattern of responses to actual messages of real meaning given at by the source of the topic [1]. In other words, understand the topic, say restaurants, not from 30,000 feet, using abstractions, but rather from responses to and judgments of the actual messages that an individual might encounter when reading about the restaurants.

Explicating the Process and Demonstrating with the Results from Two Teams of Students

The Mind Genomics system is templated, allowing anyone to become a researcher. The studies reported below represent the contributions of students to knowledge about restaurants, specifically a bagel shop versus a steakhouse. Both studies reveal the power of insights that are available to virtually anyone willing to think about a topic, to do ‘background’ research using the web on a specific topic, and then to execute a small evaluation with Mind Genomics, involving 36 messages, 50 respondents in a study taking 60 minutes to field with complete results with 5-10 minutes after the last respondent has completed the interview.

By way of background the study was conducted as part of a program at Queens College of the City University of New York, run by author Dr. Martin Braun and author Dr. Sue Henderson. The studies were part of the Queens College effort to introduce new pedagogies to students who declared themselves to be not ‘science material,’ but had to take a mathematics course to satisfy the curriculum requirements. Math 110 was the result, a combination of experimentation, statistics, and an application to create excitement among the students regarding mathematics and research, and an item for their personal portfolio.

Each group met, selected a topic. During two separate years, and two separate classes, the topics of bagel shop and steak houses were selected, by different students. The objective was to apply the Mind Genomics thinking to studying these two topics. The students were encouraged to read about the topic they selected, especially using the Internet, and then with the messages that they gleaned from the Internet, and their own imagination, they were to run a study with 50 respondents, funded by Queens College.

The efforts, done 2011-2012, eventuated into a series of studies with profound implications, as shown below. The two studies, bagel shop and steak house, were done on topics where there is a great deal of information available about different offerings by restaurants, and news stories about one or another restaurant appearing in the popular press. Based upon Google(r), and a search at the time of this writing (Fall, 20201), there are a remarkable 8.8 million hits for bagel shop and an even more remarkable 26.3 million hits for steakhouse. Surprisingly, however was almost nothing about these restaurants in the scientific press, as shown by a search of Google Scholar(r). That is, the topic of dining and eating is relevant to academic researchers, but only in the context of ‘general rules’, with practical, every day, ‘cognitively meaningful’ experience not a key topic of the research. The topic of bagel shops, for example, is of interest to sociology as it compares to bodegas [2], and of interest as an example of understanding economic behavior [3,4]. But the topic of bagel shops in and of itself is ignored, perhaps because until now there has been no structure in which to embed current knowledge and create new knowledge.

We present the two studies intertwined, to show the differences between an eating place that is casual, familiar, and oriented to mornings, versus an evening higher sale restaurant. The research process was virtually the same for both. The results provide a sense of what can be quickly learned about messaging, simply by doing a deconstruction of messages provided by current offerors, coupled with imagination, and implemented in a few hours.

Step 1: Decide the Topic, Create a Set of Questions Which ‘Unfold the Restaurant’, and for Each Question Provide a Set of ‘Answers or Simple Phrases

In today’s (2021) version of Mind Genomics, the number of questions and the number of answers to each question has been trimmed to four questions, four answers to each question, generating 24 vignettes, rated on one scale, and requiring a field execution of 3-4 minutes at most, reasonable in a period where time is a valuable commodity. When these studies were run, 2011-2012, there was less time pressure, so the studies were larger, comprising six questions, six answers per question, generating 48 vignettes, and two rating scales, requiring 17 minutes.

Table 1 shows the elements for the bagel study, Table 2 shows the elements for the steak study. It is important emphasize that most, not all, of the elements were taken from existing messaging. Thus, the Mind Genomics ‘experiments’ reported here can reveal the degree to which the existing restaurants used demonstrably strong-performing elements, and, perhaps unexpectedly, selected elements appealing to different mind-sets existing within the restaurant’s clientele. The assumption is that the material appearing in advertisements represents ‘vetted selling points.’

Table 1: Elements for the bagel store study.

  Question A: What is location and the ambience?
A1 Easily available for commuters
A2 Convenient walking location
A3 Convenient drive though
A4 Comfortable ambience
A5 Nice music
A6 Many locations available
  Question B:  What are ‘good for you’ features?
B1 All bagels are highly nutritious
B2 includes vitamins and minerals
B3 Bagels are all-organic
B4 All bagels are made fresh
B5 No preservatives in our bagels
B6 All spreads are healthy
  Question C:  What are price specials?
C1 The best ingredients for the lowest prices
C2 includes discounts
C3 Get a free mug with a dozen bagels
C4 Gift cards available
C5 Affordable prices
C6 Buy ten get two free
  Question D:  Describe the sensory experience
D1 Delicious in many flavors
D2 Bagels are a high quality
D3 Highest rated bagels in the state
D4 Available in every flavor and color
D5 Savory and melts in your mouth
D6 Innovative bagel technology to create the best taste
  Question E:  Describe flavor of bagels and spreads
E1 Made from high-quality ingredients
E2 All organic ingredients for the many spreads
E3 Mix and match for your favorite personal combination
E4 Help create your own flavor with our new flavor creator
E5 Hundreds of spreads to choose from
E6 Free toasting available with spread purchase
  Question F:  Describe delivery features
F1 Order fresh bagels anytime
F2 Order one dozen bagels for only $6
F3 Order before 6pm for same day shipping
F4 Order gift boxes for any occasion
F5 Local delivery in only 30min
F6 Free shipping with any purchase over $15

Table 2: Elements for the steak study.

  Question A: What is one product description that would gain attention
A1 We have the biggest portion sizes around.
A2 Our menu includes more than just steaks…variety of delicious chicken, fish and vegetarian options
A3 Come try our legendary 48oz porter house and join the carnivore club
A4 Many great desert options made from our world-renowned pastry chef
A5 Zagat rating of best beef wellington in the city
A6 All our food is cooked with fresh grown material and all our steaks are USDA prime approved steaks
  Question B:  Describe the interaction with the staff (nonfood)
B1 Save time with our valet parking. Our staff offers service with a smile
B2 Our staff offers service with a smile
B3 For your convenience book any reservation online
B4 We offer a private room for up to 50 guests
B5 Coat checking for the convenience of space at the table
B6 All waiters are veterans in the business
  Question C: Describe other features such as alcohols, seasonal decorations, etc.
C1 A large selection of imported and domestic beers on tap
C2 We offer a huge selection of aged wine
C3 Come eat at the bar each night 7-9 p.m. for our happy hour discounts
C4 Enjoy a drink while you wait for your table
C5 Get into the holiday spirit with our seasonal decorations
C6 Since opening our restaurant has been rated top in the city for cleanliness
  Question D:  Where is the restaurant located
D1 Located in the heart of the city
D2 Conveniently located to subway lines
D3 Show your ticket stub from any nearby theaters to receive discounts
D4 Located near the financial sector of town
D5 Located a block away from the stadium
D6 Conveniently located a half mile off the interstate
  Question E:  Describe an experience in emotional terms
E1 Going on a date…enjoy our quiet child-free sections after 9 p.m.
E2 Lightly colored rooms to satisfy eloquent dining
E3 Dress comfortable while enjoying our casual dining
E4 Start off your romantic evening with a candlelight dinner
E5 Fresh flowers on each table to satisfy your senses
E6 Keep warm while waiting for your table near our fireplace
  Question F:  Describe other features beyond food and service
F1 Live singer every Tuesday night
F2 Enjoy a steak while cheering on the home team
F3 Offers a dance floor to spice up the night
F4 Jazz bands perform each Friday and Saturday night.
F5 Learn how to cook like our chefs…come to a cooking class in the afternoons
F6 Comedy shows are available

Step 2: Combine the Elements (Answers, Messages) into Small, Easy to Read Combinations, Using an Experimental Design

A hallmark of Mind Genomics is the nature of the stimulus. The test stimuli are combinations of elements. The combinations are strictly prescribed, according to an underlying structure known as an experimental design [5]. Experimental designs are well accepted in science. They prescribe combinations of variables. It the response to these combinations which is of interest. The response will be deconstructed into the contributions of the separate elements.

The use of combinations rather than of single elements emerges from a fundamental difference between the science of Mind Genomics to understand the psychology of the everyday, and other areas of psychology in particular and science in general, which focus on testing stimuli in as pure a form as possible. That is, the typical psychological approach would be to test all 36 elements, one element at a time, instructing the respondent to rate the single element. In contrast, the Mind Genomics approach focuses on responses to combinations, presenting stimuli in the form shown in Figure 1. The vignette comprises four elements, not one. The respondent cannot find the ‘right answer’, so the respondent settles for being honest rather than being ‘right’..

fig 1

Figure 1: Four element vignette for a bagel shop, and the first rating scale at the bottom

At first, the approach just stated above does not seem to make sense. It would seem that the four elements would fight with each other to drive the rating, whereas in the typical research approach attention is paid to each element one at a time. It is precisely the fact that the combinations resemble the type of information encountered in the daily, ordinary world, which makes Mind Genomics ‘work.’ People easily ‘navigate’ their way through a world of compound complexity, a world which mixes and matches various stimuli together in patterns which are erratic. What are the rules by which people evaluate these natural combinations, which they do in everyday behavior, whether the evaluation is to change the direction of their movement, stop to do something etc.

The goal of Mind Genomics is to understand these rules. Thus, the combinations tested by the respondent are created in a systematized fashion. The rules governing the precise combinations of elements are embedded in an experimental design [5]. The experimental design comprises a schematic which states which combinations are to be created. The experimental design DOES NOT prescribe the content of the combinations, but just the structure of those combinations.

Mind Genomics uses a set of experimental designs with these properties:

a. The nomenclature is question (i.e., variable), and answer (i.e., element).

b. Each question has the same number of answers

c. The answers (but not the questions) appear in the combinations, such as seen in Figure 1.

d. The answers are statistically independent of each other, allowing the design to be analyzed by powerful statistical tools such as OLS (ordinary least-squares), and even with pairwise interactions when relevant.

e. The vignettes are incomplete. For this design of 6×6 (six questions, each question with six answers) the design prescribed 48 vignettes, 36 comprising four elements (two questions do not contribute to the vignette), and 12 comprising three elements (three questions do not contribute to the vignette).

f. The experimental design is works at the level of each respondent, so the data of a single respondent can be subject to the power analyses, such as OLS regression

g. Each respondent evaluates the same STRUCTURE of combinations, but the specific combinations are changed using a permutation scheme. That is, the mathematics is the same, but for each respondent the combinations are different. The permutation changes the assignment of each phrase to an element. This permutation is then used by the experimental design to create new, unique combinations. Table 3 shows an example of a permutation.

Table 3: Example of a permutation of six elements (A1-A6) for three respondents (R1-R3)

R1 R2 R3 Question A: What is location and the ambience?
A1 A3 A4 Easily available for commuters
A2 A1 A5 Convenient walking location
A3 A5 A1 Convenient drive though
A4 A4 A6 Comfortable ambience
A5 A6 A2 Nice music
A6 A2 A3 Many locations available

h. It is important to realize that the permutations do not always work. [6] were able to patent the approach of permutation, and the different combinations which work. The viable combinations must be created empirically.

Figure 1 shows an example of a four-element vignette. The Mind Genomics program sets up the vignette, guided by the experimental design. There is no hint about the underlying questions. Rather, the respondent sees the combination ad rates the combinations on two scales below. The combination appear is rated on the first scale, rated on the second scale, and proceeds to the next combination.

Step 3: Present the respondent with the instructions (Figure 2), and then with the 48 vignettes, each of which is rated on two scales, shown in Figure 2.

fig 2

Figure 2: The orientation page for the bagel shop study

The first scale is INTEREST (an evaluative criterion):

Bagel shop: Based on this screen alone, how likely are you to buy from our bagel shop (1=not likely .. 9=very likely)

Steakhouse: Based on this screen alone, how likely are you to come to our steakhouse (1=not likely … 9=very likely)

The second scale is emotion (a choice across five feelings/emotions),. The feelings/emotions were selected by the students

Bagel Shop      Interested Uninterested Hungry                          Bored              Excited

Steak House Eager                    Confident             Uncertain Intimated Uninterested

The orientation presents little background information, because the objective is to discover the elements which resonate, given the nature of the restaurant (bagel shop versus steak house). The usual practice of a Mind Genomics cartography is to present as little information as possible. Respondents do not need much information to form their judgments. The only situations when it is advisable to present more information are the where the background is important, such as a legal case.

At the end of the evaluation, the respondent completed a self-profiling classification questionnaire detailing gender, age, education, food and restaurant attitudes and practices. For this paper we focus only on the total panel, and mind-sets emerging from the data.

Step 3: Transform the Data into a Form Readily Analyzable by OLS (Ordinary Least-Squares) Regression

Traditionally, managers using consumer data prefer simple statistics, such as no/yes. It is difficult for a manager to understand what an average actually ‘means’ in practical terms. Often, managers presented with data in the form of average ratings will ask ‘what is a good average?’ or ‘what does the average really mean?’. In some cases, such as the 9-point hedonic scale for liking, the researchers label every scale point, so that the manager presented with the data can refer to the labelled scale.

Mind Genomics follows a different tradition, inherited from consumer research and political polling. This different tradition was created by individuals who had to present data to managers, with neither the manager nor the researcher educated in science and in the business of scaling. The approach was elegantly simple. The researcher would divide the scale into two parts, choosing the dividing point by fiat. The process typically divided the 9-point scale into the lower half (1-6, coded ‘0’) and the upper half (7-9, coded 100). The binary scale (0/100, 0/1) is easy to understand, good or bad. For the data in this study, all ratings were transformed in that fashion. Afterwards a vanishingly small random number (<10-5) was added to the ratings to ensure that the OLS regression would not ‘crash’, even if the respondent assigned all ratings either 1-6 (all coded 0), or 7-9 (all coded 100). This small prophylactic step is a standard practice for all scale data in Mind Genomics.

The second transformation was more complicated. The second rating question is a so-called nominal scale. The five numbers are placeholders only. They have no numerical meaning. The strategy to prepare the ratings from question #2 was to create five new binary variables, one for each choice available in question #2. For each case, each of the 48 vignettes, the one newly created binary variable corresponding to the emotion chosen was transformed to 100. The four binary variables corresponding to the four feelings not chosen, were transformed to 0. Once again the vanishingly small random number was added to the value 0, to prevent crashes during the OLS regression.

Step 4: Run Individual Level Models for Question #1 for Each Respondent, and Cluster the Respondents Using k-Means Clustering

As noted above, the experimental design is valid at the level of a single respondent, even though each respondent evaluated 48 different vignettes. The property of complete design at the level of the individual respondent makes it possible to create an equation for each respondent relating the presence/absence of the elements A1 – F6 to the ratings (0/100). The equation is written as:

Binary Dependent Variable = k0 + k1(A1) + k2(A2) … k36(F6)

This first ‘modeling’ or ‘equation-fitting’ generated one row of coefficients for each respondent in the study. Although the specific elements in each vignette differed because of the permuted design, the structure of the data remains the same for each row, namely the additive constant, and one coefficient for each of the 36 elements.

A hallmark of Mind Genomics is the discovery of different clusters, mind-sets. The mind-sets are groups of respondents, who look at a common topic (viz., restaurants) in different ways. The respondents are not necessarily defined by WHO the respondent is or what the respondent DOES, but rather by the pattern of the responses to the specific elements. The 36 coefficients (but not the additive constant) are used to create these different groups, called mind-sets.

The mind-sets are created by a clustering program known as k-means clustering (Likas, 2003). It is the pattern of coefficients which is important, not any single coefficient. The k-means clustering program creates a measure of ‘distance’ between two respondents by using the 36 coefficients generated by each respondent. Distance between any pair of respondents is defined by the quantity (1-Pearson R), where the Pearson R, a measure of relatedness of two sets of numbers, is computed from the 36 corresponding pairs of elements, the first from person A, the second from person B. The quantity (1-Pearson R) ranges from a low of 0 when two patterns are parallel to each other, to a maximum of 2 when the two patterns are opposite to each other.

Clustering works in a purely mathematical way, independent of the meaning of the variables that it clusters. Human judgment is needed to select the number of clusters and to name the clusters. For Mind Genomics studies, the rule of thumb is to select as few clusters as possible (parsimony), subject to the fact that the clusters ‘make sense’, viz. tell a story (interpretability). A third rule, one more of caution than substance, is to select clusters of reasonable size, so that they are stable. When a cluster of small size emerges, this cluster can be pulled out and eliminated, as was done for MS2 for Bagel Shop, which interpretable, but too small to be stable, comprising only six respondents.

Step 5: Rerun the OLS Regression for Each Subgroup, Incorporating the Data from the Respondents Who are Assigned to the Subgroup by the k-Means Clustering Program

For the Total Panel, this means incorporating everyone. For the other subgroups, the clusters (now called mind-sets), this means running the OLS regression with the smaller number of respondents, viz., those who had been assigned to the mind-set.

Step 6: Create the Equations for Each Feeling

For each study separately, and using the data from the Total Panel, run the five separate regressions, one for each emotion. This time do not use the additive constant, so the equation estimated is ‘forced through the origin.’ The expression is: Feeling = k1(A1) + k2(A2) … k36(F6)

Results

Interest in the Restaurant – The Bagel Shop vs. the Steak House

The Mind Genomics cartographies return with large amounts of data, especially when the respondent is presented with 48 vignettes and instructed to rate each vignette on two scales. To make the analysis easy, we present only those coefficients of value +10 or higher. These are the elements which strongly drive the response of ‘likely to visit’. For the additive constant we present the value emerging from the OLS regression, no matter the sign or the magnitude.

Table 4 shows the data for the Bagel Shop, Table 5 shows the data for the steakhouse.

Table 4: Strong performing elements for the Bagel Store (BS), for the Total Panel and for BS Mind-Sets 1 and 3. BS Mind-Set 2 comprised only six respondents, and is not shown.

Bagel Shop

Total

BS MS1

BS MS3

Base Size

50

26

18

Additive constant

-1

12

-33

Bagel Shop MS1
THE BAGEL PURCHASE EXPERIENCE (BUT NOT NECESSARY EATING)
C3 Get a free mug with a dozen bagels

16

22

C5 Affordable prices

16

22

E6 Free toasting available with spread purchase

19

19

28

E3 Mix and match for your favorite personal combination

18

19

25

D6 Innovative bagel technology to create the best taste

24

18

42

E2 All organic ingredients for the many spreads

16

16

25

C1 The best ingredients for the lowest prices

18

13

25

D1 Delicious in many flavors

17

13

37

B1 All bagels are highly nutritious

13

13

20

C6 Buy ten get two free

13

12

13

F5 Local delivery in only 30min

13

11

21

A3 Convenient drive though

10

11

Bagel Shop MS2
NOT SHOWN – ONLY SIX RESPONDENTS OUT OF 50
Bagel Shop MS3
FOCUS ON PRODUCT
D3 Highest rated bagels in the state

21

57

D4 Available in every flavor and color

18

47

D2 Bagels are a high quality

20

45

E4 Help create your own flavor with our new flavor creator

14

43

D5 Savory and melts in your mouth

23

10

42

D6 Innovative bagel technology to create the best taste

24

18

42

B4 All bagels are made fresh

16

38

D1 Delicious in many flavors

17

13

37

F2 Order one dozen bagels for only $6

16

32

B5 No preservatives in our bagels

13

28

B2 includes vitamins and minerals

28

E6 Free toasting available with spread purchase

19

19

28

B6 All spreads are healthy

12

26

C1 The best ingredients for the lowest prices

18

13

25

E2 All organic ingredients for the many spreads

16

16

25

E3 Mix and match for your favorite personal combination

18

19

25

A6 Many locations available

12

22

F5 Local delivery in only 30min

13

11

21

B3 Bagels are all-organic

20

F6 Free shipping with any purchase over $15

13

20

B1 All bagels are highly nutritious

13

13

20

E5 Hundreds of spreads to choose from

11

16

E1 Made from high-quality ingredients

14

C6 Buy ten get two free

13

12

13

F3 Order before 6pm for same day shipping

11

A4 Comfortable ambience

10

Table 5: Strong performing elements for the Steak House (SH), for the Total Panel and Three Mind-Sets.


Total

SH MS1 SH MS2

SH MS3

Base size

50

12 11

27

Additive constant:

57

67 47

57

Mind-Set 1 – Food Quality
A5 Zagat rating of best beef wellington in the city

14

A6 All our food is cooked with fresh grown material and all our steaks are USDA prime approved steaks

11

Mind-Set 2 -Selection and Service
C4 Enjoy a drink while you wait for your table

18

D1 Located in the heart of the city

17

C6 Since opening our restaurant has been rated top in the city for cleanliness

12

A3 Come try our legendary 48oz porter house and join the carnivore club

12

A2 Our menu includes more than just steaks…variety of delicious chicken, fish and vegetarian options

11

B2 Our staff offers service with a smile

11

  Mind-Set3 – Decor        
E5 Fresh flowers on each table to satisfy your senses

14

E1 Going on a date…enjoy our quiet child-free sections after 9 p.m.

13

E2 Lightly colored rooms to satisfy eloquent dining

12

We focus on highlights only, to give a sense of the meaning of the results, both from a general perspective and from the perspective of key elements and implications.

  1. Number of mind-sets. Each cartography started out with 50 respondents. The k-means clustering program was instructed to ‘create’ three mind-sets, using the specific mathematical criterion. Mind-Set 2 for the Bagel Shop comprised only six respondents, too few to show. We do not show it because the results are unstable with the low base size and may mislead.
  2. The additive constant. The additive constant is the baseline, the readiness of a respondents to say I am likelyk to visit the restaurant. The additive constant is a purely computed parameter. The first ‘reality’ of the constant lies in the facts that it will be the base to which will be added the contributions of the elements, when the user creates a new message to advertise the restaurant. The second reality is that the additive constant gives a sense of the basic interest in the restaurant, in the absence of elements. High additive constants means that there is an innate interested in the restaurant, independent of the elements. Low and negative additive constants mean that there is no interest, so that it is the job of the elements to do all the work of convincing.
  3. Bagel Shop (Table 4): Basic interested in the restaurant without specifics is virtually nil (-1). Mind-Set 1 has a minimal positive response; Mind-Set 2 has a negative response to the idea of the Bagel Shop. In both cases it will be the elements which will drive the response of ‘likely to visit’.

    Steak House (Table 5): Basic interest in the restaurant is medium to high, very high for Mind-Set 1 (67).

    The data suggest clear differences in the mind of the respondent who thinks about these two restaurants in terms planning to visit the restaurant. It may be that one simply does not plan to ‘visit’ a bagel shop in the same way that one visits a steak house.

  4. The strong performing coefficients for the Total Panel. Most Mind Genomics studies reveal a few elements performing strongly, with ‘strongly’ defined operationally as 10 or higher when the model has an additive constant, and when the rating is assigned to one scale (viz. likely to visit, or degree of interest). The data from our two restaurants will show a major difference in the patterns for Total Panel

Our two restaurants differ dramatically for the coefficients for the total panel. Skipping to the steak house first, we see no strong elements with coefficients over 10 for the steakhouse (Table 5).

Returning now to the Bagel Shop (Table 4), we see a remarkable 14 of 36 elements with coefficients of 16 or higher, a record number in the informal history of Mind Genomics

Innovative bagel technology to create the best taste

Savory and melts in your mouth

Highest rated bagels in the state

Bagels are a high quality

Free toasting available with spread purchase

Mix and match for your favorite personal combination

The best ingredients for the lowest prices

Available in every flavor and color

Delicious in many flavors

Get a free mug with a dozen bagels

Affordable prices

All organic ingredients for the many spreads

All bagels are made fresh

Order one dozen bagels for only $6

  1. Define the mind-sets. The statistical method of clustering does not name the clusters. Naming the cluster is the task of the researcher. The usual criterion for naming the cluster or mind-set is by identifying the ‘story’ linking the strongest messages. There need not be a single theme, especially in multi-attribute situations such as restaurants, where the elements come from a variety of sources (product, service, ambience, prices).

Bagel Shop Mind-Set 1 responds both to the experience of buying a bagel, and then to some aspects of the eating experience.

Bagel Shop Mind-Set 2 is not shown because it comprised only six respondents.

Bagel Shop Mind-Set 3 has a remarkably low additive constant (-33) but responds to most of the elements. For Bagel Shop Mind-Set 3, the drivers are first statements about the product/eating experience, and secondarily about the other aspect of the experience

For the Bagel Shop mind-sets, we can say that they intertwine product and non-product experiences..

Steak House Mind Set 1 focuses on quality.

Steak House Mind Set 2 focuses on selection and service

Steak House Mind Set 3 focuses on decor

In contrast to the Bagel Shop, the Steak House mind-sets dramatically differ in their focus and cannot be confused. That is, for the Bagel Shop it is a matter of differentially weighting the same inputs to arrive at a decision. For the Steak House it is a matter of which description is most compelling.

Linking Feelings to Elements

Tables 6 and 7 show the linkage between the elements and the five feelings, done for the total panel for each study. Recall that the respondent selected a single feeling as a response to an entire vignette, the vignette comprising three or four elements. Thus, just as in Question #1 (interest), it is virtually impossible for the respondent to consciously ‘game the system,’ unless the respondent selects only one, or at maximum two feelings from the set. The data suggest that for most feelings except Bored (Bagel Shop) or Intimidated (Steak House), all elements show strong linkages with feelings.

Table 6: Strong linkages between feelings and elements for Bagel Shop.

Bagel Shop

Interested

Uninterested Hungry Bored

Excited

Interested
A2 Convenient walking location

21

A3 Convenient drive though

20

C3 Get a free mug with a dozen bagels

18

E2 All organic ingredients for the many spreads

18

F2 Order one dozen bagels for only $6

17

C6 Buy ten get two free

16

C4 Gift cards available

15

10

A1 Easily available for commuters

13

A6 Many locations available

13

C5 Affordable prices

12

D3 Highest rated bagels in the state

12

10

E3 Mix and match for your favorite personal combination

12

E4 Help create your own flavor with our new flavor creator

12

A4 Comfortable ambience

11

11

C2 includes discounts

10

11

D1 Delicious in many flavors

10

E6 Free toasting available with spread purchase

10

F3 Order before 6pm for same day shipping

10

13

Uninterested
A5 Nice music

13

F3 Order before 6pm for same day shipping

10

13

F6 Free shipping with any purchase over $15

12

A4 Comfortable ambience

11

11

C2 includes discounts

10

11

F4 Order gift boxes for any occasion

10

F5 Local delivery in only 30min

10

C4 Gift cards available

15

10

Hungry
D5 Savory and melts in your mouth

20

B4 All bagels are made fresh

11

E5 Hundreds of spreads to choose from

11

Bored – No strong linkages
Excited
E5 Hundreds of spreads to choose from

11

Table 7: Strong linkages between feelings and elements for Bagel Shop.


Eager

Confident Uncertain Intimated

Uninterested

Eager
A2 Our menu includes more than just steaks…variety of delicious chicken, fish and vegetarian options

12

11

A5 Zagat rating of best beef wellington in the city

10

10

Confident
A6 All our food is cooked with fresh grown material and all our steaks are USDA prime approved steaks

12

B2 Our staff offers service with a smile

12

E4 Start off your romantic evening with a candlelight dinner

12

C6 Since opening our restaurant has been rated top in the city for cleanliness

11

A2 Our menu includes more than just steaks…variety of delicious chicken, fish and vegetarian options

12

11

A1 We have the biggest portion sizes around.

10

11

A4 Many great desert options made from our world-renowned pastry chef

10

E6 Keep warm while waiting for your table near our fireplace

10

Uncertain
D2 Conveniently located to subway lines

18

D4 Located near the financial sector of town

18

C3 Come eat at the bar each night 7-9 p.m. for our happy hour discounts

16

B4 We offer a private room for up to 50 guests

15

10

C5 Get into the holiday spirit with our seasonal decorations

14

D5 Located a block away from the stadium

14

10

C2 We offer a huge selection of aged wine

13

C4 Enjoy a drink while you wait for your table

13

F5 Learn how to cook like our chefs…come to a cooking class in the afternoons

12

A1 We have the biggest portion sizes around.

10

11

A3 Come try our legendary 48oz porter house and join the carnivore club

11

D6 Conveniently located a half mile off the interstate

11

F2 Enjoy a steak while cheering on the home team

11

F3 Offers a dance floor to spice up the night

11

10

E3 Dress comfortable while enjoying our casual dining

10

A5 Zagat rating of best beef wellington in the city

10

10

Intimidated – No Strong Linkages
Uninterested
B3 For your convenience book any reservation online

11

B4 We offer a private room for up to 50 guests

15

10

D5 Located a block away from the stadium

14

10

F3 Offers a dance floor to spice up the night

11

10

The most important feeling for Bagel Shop in this set of feelings is Interest, an intellectual response. The most important feelings for Steak House are Uncertain, then Confident, emotional responses

Discussion and Conclusions

Mind Genomics focuses on the topics of the everyday, from the point of specifics, looking at how people respond to the different aspects or dimensions of the topic. This simple comparison of two types of restaurants shows how much can be learned by simply charting out the responses to the different messages. What are often considered to be simply throw-away pieces of information about a situation, e.g., descriptions of the food, of the service, of the experience, become important information on which one can construct a deeper understanding of a situation relevant to everyday life.

The simple tools that were used, collection of messages from existing sources, creating different combinations and the scoring of those combinations on both an evaluation scale and on a fit-to-feeling sale provides remarkably deep information, both in the general pattern and in the specific score of the elements. There would be no way to predict that the bagel shop would generate so many strong positive, and not have a dramatic segmentation, where the steak restaurant would generate so few strong positives, show high basic interest, and be so strongly segmented.

The promise of Mind Genomics is not simply deeper knowledge of a specific restaurant, although that is a welcome outcome. Rather, the promise of Mind Genomics is the ability to create deep understanding of how people respond to the ordinary things of their lives, the ordinary situations of their lives. There is some of that in the ongoing surveys of well-being and other concerns, especially social issues, such as USA Facts, or the PEW Research Center. Companies commission extensive attitudes and practices studies for the product or service in which they are involved. Yet, for the former, ongoing surveys of a social nature, the topics are so broad that the surveys merely touch the surface and signal the emerge of problems where they may be but not the specifics of the problem. The latter, attitudes and practices, are done on an irregular basis and at the request of marketers in a company, with the focus on the particular issues of the moment. In other words, trends can be pieced together across years, if the data can be compared from year to year, often impossible first because companies are reluctant to part with their private data just as company policy, and second because the questions may change from year to year depending upon the business environment, and the internal politics of the company, and the momentary proclivities of those in charge of knowledge and ‘insight.’.

With the foregoing in perspective, it might well be possible to foresee a project in which the researcher deals with say 20 different types of restaurants, focusing simply on the question of evaluation (Question #1 here, likelihood of visiting). The current Mind Genomics technology, publicly available simply for the processing cost, would require 20 studies each with 50 respondents, or 1000 respondents altogether. The respondents would be required to answer age, gender, and one additional classification question. The studies would deal with 16 elements, not 36 elements, and require a 3–4-minute study for each respondent, testing 24 vignettes (rather than the 48 vignettes teste here). The entire set of studies could be set up in 1-2 days, executed in one day, with results completely analyzed available 1-2 hours after the study has been launched. The cost on a per country basis for the full set of 20 studies would be approximately $200-$300 per restaurant type per country, country, or a total of $4,000-$6,000 for the full set of 20 studies, for 20 types of restaurants. (The only additional cost might be a nominal cost to translate the elements, and the respondent interface screen). The database of 20 studies, each the same in 20 countries, over 10 years, would comprise 4,000 studies. Happily, the data would comparable across country and across year, a virtual unique, easy-to create resource of great intellectual value, and of historic worth value to mankind.

Acknowledgments

The authors are grateful to the Queens College Fund for sponsoring these studies.

The late Steven Onufrey and Ms. Janna Kaminsky helped to execute the studies in Prof. Braun’s Math 110 class.

Prof. Henderson was COO of Queens College, and spearheaded the adoption of Math 110 2010-2014.

References

  1. Moskowitz HR, Gofman A (2007) Selling Blue Elephants: How to Make Great Products that People Want Before They Even Know They Want Them. Pearson Education.
  2. Meltzer R, Schuetz J (2012) Bodegas or bagel shops? Neighborhood differences in retail and household services. Economic Development Quarterly 26: 73-94.
  3. Goldberg DE, Wang L (1997) Adaptive niching via coevolutionary sharing. Genetic Algorithms and Evolution Strategy in Engineering and Computer Science 21-38.
  4. Goodman M (2005) The rise and fall of the bagel. Harvard Review 28: 91-99.
  5. Gofman A, Moskowitz H (2010) Isomorphic permuted experimental designs and their application in conjoint analysis. Journal of Sensory Studies 25: 127-145.
  6. Moskowitz HR, Gofman A (2003) System and method for content optimization. United States Patent No. 6,663,215,B1 (Issued December 9, 2003).
  7. Likas A, Vlassis N, Verbeek JJ (2003) The global k-means clustering algorithm. Pattern Recognition 36: 451-461.

Volunteer Motives Determining Task Preference in Health Service Delivery

DOI: 10.31038/PSYJ.2021353

Abstract

Health experts globally are currently concerned with health systems strengthening through community engagement. Community Health Volunteers is a core element of community engagement although confronted by the problem of high attrition rates and hence high cost of training to sustain community level service delivery through volunteers. This paper focuses on the identification of volunteers likely to be retained, at the time of selection by a theory based assessment framework to guide investment in volunteer training and support.

Methodology: The study was undertaken in three stages starting with literature review to identify theories to underpin the development of a volunteer assessment framework, and to inform the testing of the validity and reliability of the framework in determining task preference. A cross sectional survey was carried out to investigate the relationship between volunteer motives and task preference by comparing motives and task preference among volunteers with non-volunteers in Western Kenya. We obtained the eight motives we examined from literature, and tasks from a list of common health activities undertaken by volunteers in Kenya. We rated the task preference of 1062 respondents for each of the tasks on a 1-5 Likert scale. We compared task preference ratings by motives and volunteer status.

Findings: Volunteer motive constructs were identified from literature guided by theories underpinning volunteerism. Theories identified were Social exchange theory, Functional theory and Role identity theory. Eight motives constructs were identified which were grounded on these theories. Altruistic motive was strongly associated with most tasks investigated. Non-volunteers showed greater association with materialistic tasks. Routine, long duration health tasks such as mother and child healthcare and curative care were significantly associated more with altruistic than with material gain motives. Short-term tasks such as helping in disease outbreaks, and participation in immunization campaigns were associated with both altruistic and material gain motives. The self-seeking motives tended to be associated only with short-term tasks.

Conclusion: The resultant volunteer assessment framework consists of two core constructs, altruistic value and material gain. They are effective in identifying the motives of those likely to volunteer long term and short term. Altruistic and material gains were constructs in which the perceptions of volunteers and non-volunteers differed most significantly. The study demonstrated that it is possible to classify tasks according to the motives they satisfy identify and to select volunteers that are likely to serve long term. Assessing the motivational needs of volunteers can assist the management in providing the most effective placement of volunteers into activities that meet their needs and thus maximize their effectiveness.

Keywords

Volunteers, Motives, Constructs, Task, Preference, Assessment framework, Screening, Health service

Introduction

Health experts globally are currently concerned with health systems strengthening through community engagement, World Health Organization Astana Declaration [1]. Community Health Volunteers (CHVs) is a core element of community engagement although confronted by the problem of high attrition rates and hence high cost of training to sustain community level service delivery through volunteers. To address retention of volunteers, assessing and identifying individuals likely to remain committed to volunteer work for long at recruitment, is considered crucial to sustainability. A logical assumption underlying the assessments is that volunteers whose motives are satisfied would be more active in service delivery and more likely to continue for long.

Community Health Volunteers (CHVs) have a central role to provide the vital link between communities and formal health systems as they know and understand the health needs of the communities within which they live and work. Moreover, they can be trained and deployed quickly. Evidence from available data on the use of community health volunteers from Gambia, South Africa, Tanzania, Zambia, Madagascar and Ghana suggests that these workers enhance the performance of community engagement initiatives and that they are cost effective [2] CHVs with minimal additional training can deliver treatment for important diseases, such as malaria, HIV, TB and even isolate and care for COVID 19 cases that are either asymptomatic or exhibit mild illness.

A variety of trials have shown substantial reductions in child mortality through community case management by CHVs, guided by World Health Organization community case management guide [3]. One such trial in Tigray, Ethiopia, showed a 40% reduction in under-five mortality after local co-coordinators were trained to teach mothers to give anti-malarial medicines to their sick children in the home [4]. CHVs were promoted for implementation of packages of interventions such as antenatal home visits, promotion of immediate and exclusive breastfeeding, skin-to-skin care, appropriate care of the skin and umbilical stump [5], and recognition and treatment with antibiotics of sick newborns [6] to reduce neonatal mortality. Delivery of interventions in the home by CHVs was viewed as critical during the first month of life, when many families observe a period of postpartum confinement which makes them less likely to seek care or advice from outside the home [7]. Syed and colleagues found that CHVs were effective in tracking pregnant women through the postnatal period and in raising awareness of appropriate maternal and newborn care practices [8].

Implementation of newborn care interventions is relatively complex compared to other CHV interventions, such as the promotion of immunizations. To be effective, CHVs must gain mastery of a range of information and skills related to their area of responsibility, and know how to adapt counseling strategies to households with varied composition and needs. This, in turn, required greater investment by programs in CHV selection and training.

Studies indicated that volunteer motivation was driven by many elements including intrinsic factors such as individual goals, sense of altruism and self-efficacy. They suggested that extrinsic factors include peer approval, the incentives provided, and future expectations [9]. They concluded that high rates of attrition undermined programs’ investments in CHVs, and potentially limited the effectiveness of community engagement interventions and that higher attrition rates were associated with higher costs. High attrition rates had been reported in many CHV programs, as summarized by Bhattacharyya et al. [10], reporting attrition rates for CHVs ranging from 3.2% to 77%. The evaluation of these studies did not take into account the theoretical models that underpinned motives for volunteering. This study specifically focused on the identification of CHVs likely to be retained long term, at the time of selection by a theory based assessment framework to guide investment in volunteer training and support. The main objective was to identify, from literature, the features of an instrument that could be used to assess the underlying motivational drives of volunteers in Kenya, their validity and reliability as well as the relationship of the motives with their task preference in health service delivery at the community level.

Methodology

We carried out the study in three stages starting with literature review to identify motive construct that could be used in an assessment framework and theories that underpin volunteerism, then we tested the validity and reliability of the identified motive constructs in the Western Kenya setting, and finally we related motives to task preference, and compared volunteers to non-volunteers.

The Elements of a Framework for Assessing CHVs Motives from Literature

Volunteer motive constructs were identified from literature guided by theories underpinning volunteerism. The search used electronic database engines that provided an international word search for articles in public health, social sciences and development. These included Google scholar, Research gate, the Cochrane reviews, the National Institute of Health and Clinical Excellence (NICE), Pubmed Health, Science Direct and Popline. The purpose was to identify generic models and guidance for assessment of volunteer motives focused on the following terms used in the title, and abstract: volunteer motives assessment frameworks, volunteer task preference, volunteer task performance.

The review considered worldwide experiences, and was not time limited, while paying keen attention to published models, examples and frameworks from the African region, looking out for motives that researchers had included in assessment tools, as well as their assessment items and methods that had been used to carry out such assessments. The motives from models and frameworks identified were synthesized in to a draft volunteer’s assessment framework. The resultant framework was subjected to face and content validity testing through a pretest among respondents similar to the study population as described by [11], before it was eventually field tested more rigorously for construct validity and reliability in the local context. The pretest showed that the tool was able to measure the constructs of interest. It provided insight on how potential participants might interpret and respond to the assessment items.

Assessing Validity and Reliability of Volunteer Motives from the Framework

The draft framework was then taken through translational, face and content validity testing [12], using local community experts. Then it was tested for construct validity and reliability. Construct Validity was undertaken as described by Cronbach & Meehl [13], Brink & Wood [14], and Polit & Beck [15]. The effectiveness of the framework was assessed to establish the degree to which test scores predicted repeatability when the framework is used [16]. Participants were presented with descriptions of the volunteer motives in a self-administered questionnaire. Volunteers were compared with non-volunteers to establish the association of the motives significantly more either with the volunteers or non-volunteers. The participants were asked to indicate their agreement with assessment statements on a 5 – point Likert scale (ranging from 1 being “strongly disagree” to 5 being “strongly agree”) in relation to the motives for CHVs volunteerism in the draft assessment framework. The assessment items explored responses to statements designed to assess motives for volunteering, by expressing the degree to which they agreed or disagreed with the assessment items as stated. In addition, participants completed a demographic questionnaire comprising gender, age, educational background, history of volunteerism, and occupation. Respondents were asked to complete the sentences about the reason people volunteer and indicate the degree of their agreement with each one (Table 1).

Table 1: Volunteer Assessment Framework (VAF).

Altruistic value (core)

Strongly Agree Agree undecided Disagree

Strongly disagree

It creates a better society
It translates deep held values into actions.
They think about the welfare of other people,
They feel empathy for others
They consider themselves to be people who get involved
 

Material gain (core)

They benefit at times in terms of cash or kind
At times they are given materials that have remained after volunteering
Sometimes they are paid
Sometimes they are rewarded and they feel good
Volunteer benefits add to their wealth
 

3. Esteem enhancement (additional for volunteers)

They want to instill pride in themselves
It makes them feel important
It makes them feel appreciated
It makes them feel recognized
No matter how bad one has been feeling, volunteering helps one to forget about it
 

4. Career Development (additional for non-volunteers)

They want to learn job-related skills
Of the chance to gain new experience
It will help them get an opportunity at a place where they would like to work
It can help them get a job
Of personal growth
 

5. Social adjustment (optional for non-volunteers)

It is an opportunity for relationships
People at job/school/church/group would approve of their volunteering.
People who are close to them would support them to volunteer
Their family members would encourage them to volunteer.
Of reciprocal interactions in community
 

6. Development of understanding (optional) for non-volunteers

It satisfies their curiosity about other people and the problems that they face
Of the opportunity to make friends
Of opportunity to challenge themselves
Volunteerism allows them to test their existing skills and abilities.

Relating Motives to Tasks Preferred

The last part of this study was to determine relationship between health tasks and motive constructs as an attempt to categorize volunteers according to the tasks they prefer. The motives were related to tasks preferred. This was to form a basis for linking the motives to certain task categories. The CHVs were presented with descriptions of 40 volunteer tasks and were asked to rank the tasks in order of preference for engaging in them. The questions asked participants to rank each of the volunteer tasks in order of his or her preference indicating “most preferred choice” “least preferred choice.” Then, participants were presented with descriptions of volunteer motives as well as descriptions of the tasks and were asked to evaluate the extent to which each task would satisfy each of the volunteer motives for himself or herself. Finally, the CHVs were asked to assess, on 1-5 Likert scale, the extent to which each of the 8 motives had been satisfied, giving examples of tasks that had contributed to their motives satisfaction. This was to confirm the appropriate tasks to be assigned to the volunteers through triangulation of information.

Data Analysis

The data were analyzed using Scientific Package for Social Sciences (SPSS) Computer package version 16 and presented on frequency tables and graphs. Descriptive statistical analysis was undertaken with respect of demographic characteristics to compare the sampled volunteers and non-volunteers. The descriptive statistics also gave an impression as to the distribution of data as well as identification of values that could be seen as common. It also described the geographical distribution of the sample population [17].

Then the data were analyzed to find out the Cronbach’s alpha reliability coefficient value. The analysis of the data used the summated scales and subscales and not individual items. The results were calculated based upon the formula Cronbach’s alpha reliability coefficient = rk/[1 + (k -1)r] where k is the number of items considered and r is the mean of the inter-item correlations. Cronbach’s alpha reliability coefficient normally ranges between 0 and 1. The closer Cronbach’s alpha coefficient is to1.0 the greater the internal consistency of the items in the scale. The size of alpha is determined by both the number of items in the scale and the mean inter-item correlations. [18] provide the following rules of thumb: “_ >.9 – Excellent, _ >.8 – Good, _ >.7 – Acceptable, _ >.6 – Questionable, _ >.5 – Poor, and_ <.5 – Unacceptable. An alpha of 0.8 is a reasonable goal. A high value for Cronbach’s alpha indicates good internal consistency of the items in the scale.

For the assessment of validity and reliability of the framework the study used exploratory factor analysis, Cronbach’s coefficient alpha [19], to test the internal validity and reliability of the questionnaire derived from the framework. This was to assess the psychometric properties of the measures and thus compare CHVs and non-CHVs’ motives. Construct validity is the degree to which an instrument measures the construct it is intended to measure [13]. Cronbach’s alpha is an index of reliability associated with the variation accounted for by the true score of the underlying construct [19]. It was used to establish the internal consistency of the framework. This is important as it determines whether the instrument will always elicit consistent and reliable response even if questions were replaced with other similar questions. A variable is said to be reliable when responses generated from such a set of questions are stable. Reliability or internal consistency indicates how well the items on a framework fit together conceptually. The internal consistency test was undertaken using the Cronbach’s alpha coefficient test, as described by [14,15]. It is supported if the instrument’s items are related to its operationally defined theory and concepts.

The developed instrument was intended to measure volunteers’ motives and would be valid based on items in the framework having the capability to exclusively measure concepts that were theoretically and structurally related to volunteer motives. This was assessed by equivalence reliability test which uses the Cronbach’s alpha coefficient test. Construct was the hypothetical variable that was being measured [20]. The framework reliability was assessed, by demonstrating that there were volunteer constructs that were more associated with CHVs than non-CHVs. Reliability pertains to evidence of repeatability in identifying attributes in a measurement both in time as well as by other researchers.

Then, association of the constructs and measurement items with the volunteer status was tested using cluster analysis. Cluster analysis classifies a set of observations into two or more mutually exclusive unknown groups based on combinations of interval variables. The purpose of cluster analysis was to use a system of organizing observations into groups, where members of the groups share properties in common. It is cognitively easier for people to predict behavior or properties of people or objects based on group membership, all of whom share similar properties. By clustering the responses into agree (4, 5), undecided (3) and disagree (1, 2) and cross tabulating against the proportions among volunteer and non-volunteers the researcher was able to compare the proportions in the different clusters for each of the constructs and assessment items. The procedure tabulates a variable into categories and computes a chi-square statistic (χ2), degrees of freedom (df) and significance values (p). This goodness-of-fit test compares the observed and expected frequencies in each group to test whether the proportion of respondents are the same. In this study, the Chi-Square test was used to examine the relation between constructs and assessment items and volunteers or non-volunteers in the sample population.

This test was repeated by comparing the mean scores on the Likert scales among cases, volunteers, and controls, non-volunteers. The responses on volunteers’ motives were thus validated by correlations with construct measures, to establish their reliability in the local context. Mean scores by volunteer motives were calculated, compared and statistical significance of difference tested by t test. Association of constructs and measurement items was examined by comparing the mean scores among volunteers with those among non-volunteers. Using t test the constructs and measurement items that showed statistically different mean scores were identified for inclusion.

The results of the three tests, Cronbach’s alpha, cluster analysis, and comparison of means, enabled the researcher to select the best constructs and assessment items to include in the volunteer assessment framework for identification of volunteer health workers in the local context. The constructs and assessment items that showed statistically different scores between volunteers and non- volunteers, were considered suitable for inclusion in the final volunteer assessment framework. A p value <0.05 was considered statistically significant.

Results

Elements in a Volunteer Assessment Framework for CHVs

We identified three theories from literature underpinning motives identified: Social exchange theory which underpins egoistic motives, Functional theory underpins the altruistic motives and Role identity theory and underpins the Social motive constructs. Eight motive constructs were identified were from literature (Table 2). Eight categories of motive constructs with 86 assessment items were identified from literature (Table 1). The motives were: Altruism is the motive “to help others”, described by [21,22]. Community Concern motive is having a sense of obligation to the communities [23] and Spirituality motive is expression of faith [24-26].

Table 2: Motives to assess volunteer types by theory and source.

Theories

Motives Sources

Remarks

Functional theory Altruistic values Fitch, 1987, Omoto and Snyder (1995), Calary et al 1994 Intrinsic intangible rewards, humanitarian
Community concern Omoto and Snyder (1995), Clary et al (1994), Clary et al (1998) Caring for wellbeing of neighbor
Spirituality Ochieng B.M (2012) Religious motivation
Social exchange Material gain Fitch, 1987, Snyder (1995), Clary et al 1994, Henderson 1980, Caldwell and Andereck (1994) Tangible rewards, Imbalance between contribution and reward leads to discontinuation
Personal, career development Omoto and Snyder (1995), Clary et al 1994 Career, resume’, growth, learn skills, job opportunity
Role identity Social adjustment Morrow-Howell and Mui (1989), Henderson 1981, Clary et al (1998), (Moen 1995), (Greenfield 2010), (Utz 2002), (Li 2007). Satisfactions from interpersonal interactions, identity, make friends, accumulation of social roles, leads to wellbeing
Esteem enhancement, Ego Protection, Omoto and Snyder 2002, Clary et al (1998), (Stets 2000), Stevens 1995, (Morrow-Howell 2009), (MacNeela 2008), (Hinterlong 2006). Deal with guilt of success, self confidence, need to be productive and maintain meaning
Understanding, Knowledge Omoto and Snyder (1995), Clary et al (1998), Caldwell and Andereck (1994) Satisfy intellectual curiosity

Social adjustment motive is seeking to respond to social pressure [27] and to the expectations of others [28-30]. Development of Understanding motive is seeking opportunity to understand, practice, and apply skills and abilities [31,32] and Ego-defensive or esteem enhancement motive is the need to enhance self-esteem, self-confidence.

Material gain motive is hope for material incentives. Career development motive is seeking to increase one’s job prospects and enhance one’s career [33], the desire for personal growth and learning of new skills [34,35].

The roles and tasks of CHVs to be used for assessing task preference were also identified and how to assess their relationship to volunteer motives.

Motive Constructs with Adequate Validity and Reliability among CHV in Western Kenya

The results of Construct Validity test showed that six out of the eight constructs in the tool were adequately valid in the local context, and suitable in Western Kenyan in identifying individuals likely to serve as long term health volunteers. These were:

Altruistic Values

Although the statements from literature were 12, only 5 of these were found to resonate with the respondents. This construct appeared to be among the most powerful predictors of long term volunteerism since it was the least egoistic in the local context. The long term CHVs scored the assessment items under this construct highly.

Material Gain

This construct was consistently, scored highly by non-volunteers and low by long serving CHVs. All the assessment items were equally strongly associated with non-volunteers than volunteers.

Career Development

This construct was scored moderately strongly by both CHVs non-volunteers than CHVs, there was no statistically significant difference in the scores, but young volunteers tended to score it highly. All the assessment items were significantly associated with non-volunteers than controls, and any could be used in the final tool.

Social Adjustment

Similarly this construct was scored moderately by both volunteers and non-volunteers were not statistically significantly different. Only two assessment items were identifiable more with volunteers as compared to non-volunteers.

Esteem Enhancement

All the assessment items under this construct were significantly associated more with long serving volunteers, scoring them more highly than the controls.

Development of Understanding

This motive was not scored by the respondents in a consistent way. Not all the assessment items were significantly associated more with long serving volunteers than with the controls except “opportunity for self-growth”.

The association of constructs and assessment items with health volunteers and non-volunteers was examined by comparing mean scores. A statistical t-test was performed to determine the level of statistical significant difference in all the items in the constructs. The findings are summarized in table 2. Results showed three groups of motive constructs in terms of association with volunteers or non-volunteers. Those that demonstrated strongest associations were altruistic (with volunteers) and material gain (with non-volunteers); those that demonstrated weak association with either, community concern (with volunteers), development of understanding, esteem enhancement, and social adjustment (with non-volunteers); and those that were associated with neither volunteers nor non-volunteers were spirituality and career development (Tables 2 and 3).

Table 3: Comparison of mean scores by motives and volunteer status.

Volunteer Motives

subjects participants N Mean Std. Deviation T- test

Criteria

Altruistic value cases

531

63.05 9.77

.000

Significant
controls

531

60.15

11.57

Career development cases

531

25.92 5.47

.207

Not significant
controls

531

25.83

5.97

Development of understanding cases

531

43.36 10.12

.002

Significant
controls

531

44.09

11.72

Esteem enhancement cases

531

15.67 6.35

.255

Not significant
controls

531

17.11

6.57

Community Concern cases

531

30.02 6.41

.006

Significant
controls

531

29.13

7.22

Social adjustment cases

531

18.92 7.14

.001

Significant
controls

531

20.29

7.81

Material gain cases

531

12.95 7.24

.000

 Significant
controls

531

16.09

8.03

Spirituality cases

531

20.91 4.99

.023

 Significant
controls

531

20.40

5.77

Comparing the conclusions from the two tests, an interesting pattern emerged. Altruistic and materialistic values were strongly associated only with volunteers and non-volunteers respectively, by both tests, and therefore the best constructs to use in the local context. While four, mostly social constructs, poorly differentiated between volunteers and non-volunteers, but could prove useful for inclusion depending on the objectives of the program for which volunteers are sought. These were social adjustment, esteem enhancement, development of understanding and career development. Thus the findings suggested two core constructs, and four additional constructs with twenty-nine assessment items that could be applied to the framework, for the local setting. Spirituality and community concern did not differentiate between volunteers and non-volunteers by both tests and therefore were unsuitable for the framework being tested (Table 4).

Table 4: Final Volunteer Assessment Framework (VAF): Complete the following sentences about the reason people volunteer and indicate the degree of your agreement with each one.

Altruistic value (core)

Strongly Agree Agree undecided Disagree

Strongly disagree

It creates a better society
It translates deep held values into actions.
They think about the welfare of other people,
They feel empathy for others
They consider themselves to be people who get involved
 

Material gain (core)

They benefit at times in terms of cash or kind
At times they are given materials that have remained after volunteering
Sometimes they are paid
Sometimes they are rewarded and they feel good
Volunteer benefits add to their wealth
 

OPTIONAL CONSTRUCT MOTIVES

3. Esteem enhancement (additional for volunteers)
They want to instill pride in themselves
It makes them feel important
It makes them feel appreciated
It makes them feel recognized
No matter how bad one has been feeling, volunteering helps one to forget about it
4. Career Development (additional for non-volunteers)
They want to learn job-related skills
Of the chance to gain new experience
It will help them get an opportunity at a place where they would like to work
It can help them get a job
Of personal growth
 

5. Social adjustment (optional for non-volunteers)

It is an opportunity for relationships
People at job/school/church/group would approve of their volunteering.
People who are close to them would support them to volunteer
Their family members would encourage them to volunteer.
Of reciprocal interactions in community
 

6. Development of understanding (optional) for non-volunteers

It satisfies their curiosity about other people and the problems that they face
Of the opportunity to make friends
Of opportunity to challenge themselves
Volunteerism allows them to test their existing skills and abilities.

Relating Motive Constructs with Preferred Tasks

Tasks investigated were associated more with volunteers than non-volunteers based on the mean scores. The findings identified three categories of tasks: the typical long-term health tasks, preferred more by long serving health volunteers; long term participation tasks preferred by both volunteers and non-volunteers and tasks that were either short term or emergency in nature, requiring urgent response for relatively short periods (Table 3).

Long Term Health Tasks Preferred More by Long Serving Health Volunteers

Altruistic motive was strongly associated with most tasks investigated. Only family planning and community based health information system were not strongly preferred by respondents with altruistic motive. Career enhancement was associated with the care of orphaned and vulnerable children. Tasks investigated were associated more with volunteers than non-volunteers based on the mean scores.

Long Term Participation Tasks Preferred by Both Volunteers and Non-volunteers

The rest of the motives were not adequately associated with tasks. Social motives demonstrated some relationship with tasks such as attending meetings and dialogue sessions. Esteem enhancement was associated with mother and child health, and household visits for health education.

Short Term Emergency or Curative Tasks Preferred by Both Volunteers and Non-volunteers

The non-volunteers showed greater association with materialistic tasks than the volunteers themselves. These were tasks requiring urgent response for relatively short periods, tended to be associated with material gain which was not significantly associated with the majority of the tasks investigated, except curative care. Similarly, development of understanding was associated only with curative care tasks (Tables 5a-5c).

Table 5a: Task Preference by volunteers and Non-volunteers.

Cases

 Controls

n-531

n-531

Least preferred n(%) Undecided

n(%)

Preferred

n(%)

P Value

Visiting Pregnant women and Counseling them on Individual Birth Plan (IBP) and referring them for Ante Natal Care (ANC) Cases

0(0.0)

39(3.7) 491(46.3)

0.00

Controls

3(0.3)

406(38.3)

121(11.4)

Carrying out repeat home visiting if pregnant women to discuss readiness for delivery Cases

3(0.3)

48(4.5) 479(45.2)

0.00

Controls

3(0.3)

408(38.5)

119(11.2)

Mothers with Newborns visited soon after delivery and Counseled on Exclusive Breast Feeding( EBF) Cases

5(0.5)

44(4.2) 481(45.3)

0.00

Controls

4(0.5)

408(38.5)

118(11.2)

Home deliveries visited and referred for Post Natal Care(PNC ) Cases

5(0.5)

38(3.6) 487(45.9)

0.00

Controls

2(0.2)

407(38.4)

121(11.4)

Referring Children <1 years to clinic for Immunizations Cases

4(0.4)

38(3.6) 488(46)

0.00

Controls

2(0.2)

406(38.3)

123(11.6)

Following up and referring Immunizations defaulters Cases

2(0.2)

37(3.5) 491(46.3)

0.00

Controls

2(0.2)

406(38.3)

122(11.5)

Visiting Children <5 to monitor their health, growth and development Cases

3(0.3)

41(3.9) 486(45.9)

0.00

Controls

2(0.2)

407(38.4)

121(11.4)

Referring <5 children who are ill for prompt treatment at Health Facility Cases

5(0.5)

43(4.1) 482(45.5)

0.00

Controls

4(0.4)

406(38.3)

120(11.3)

Referring Children <5 years for Vitamin A and growth monitoring Cases

9(0.9)

46(4.4) 475(44.9)

0.00

Controls

4(0.4)

407(38.4)

119(11.2)

Assessing Children < 5 nutrition status using Mid Upper Arm Circumference (MUAC ) Cases

59(5.6)

49(4.6) 422(39.8)

0.00

Controls

8(0.8)

412(38.9)

110(10.4)

Referring Children <5 with malnutrition Cases

21(2.0)

50(4.7)

459(43.3)

0.00

Controls

6(0.6)

411(38.8)

113(10.6)

Referring Orphans and Vulnerable Children( OVCs) for care and support Cases

44(4.1)

29(2.7) 457(43.1)

0.00

Controls

31(3)

91(8.5)

408(38.5)

Supplying clients with Family Planning( FP) commodities Cases

132(12.4)

60(5.7) 338(31.9)

0.00

Controls

23(2.2)

414(39.1)

93(8.8)

Identifying and referring Cases of chronic cough Cases

13(1.2)

42(4.0) 475(44.8)

0.00

Table 5b: Task Preference by volunteers and Non-volunteers.

 Cases

 Controls

n-531

n-531

Least preferred n(%) Undecided

n(%)

Preferred

n(%)

P Value

Controls

8(0.8)

413(39)

109(10.3)

Tracing and referring AIDS treatment defaulters Cases

21(2.0)

49(4.7) 460(43.4)

0.00

Controls

8(0.8)

416(39.3)

106(10.0)

Referring people for Home Counseling and treatment (HCT) Cases

72(6.7)

53(5.0) 405(38.2)

0.00

Controls

13(1.2)

415(39.2)

102(8.6)

Identifying and managing Cases of fever and diarrhea Cases

38(3.5)

53(5.0) 439(41.4)

0.00

Controls

10(1.0)

413(39)

107(10.1)

Providing Cases with painkillers, Managing injuries and wounds Cases

103(17.8)

67(6.4) 360(34)

0.00

Controls

22(1.1)

84(7.9)

424(40)

Referring Elderly people for check – ups Cases

69(6.5)

53(5.0) 408(38.5)

0.00

Controls

10(1.0)

414(39.1)

106(10.0)

Households visited for health education Cases

5(0.5)

45(4.3) 480(45.3)

0.00

Controls

0(0.0)

408(38.5)

132(11.5)

Holding Meetings With CHEWs Cases

6(0.6)

22(2.1) 502(47.3)

0.00

Controls

31(3.0)

95(8.9)

404(38.1)

Holding Dialogue meetings with community Cases

7(0.7)

16(1.5) 507(47.8)

0.00

Controls

22(2.1)

84(7.9)

424(400)

Conducting Community Action Days Cases

20(1.8)

17(1.6) 493(46.5)

0.00

Controls

24(2.3)

98(9.2)

408(38.5)

Organizing immunization campaigns Cases

31(2.9)

26(2.4) 473(44.6)

0.00

Controls

34(3.3)

107(10)

389(36.7)

Participating in indoor spraying against malaria Cases

55(5.2)

37(3.5) 438(41.3)

0.00

Controls

47(4.4)

114(10.7)

369(34.8)

Participating in food distribution during disasters Cases

76(7.2)

47(4.4) 407(38.4)

0.00

Controls

54(5.1)

103(9.7)

373(35.2)

Treating water during cholera outbreaks Cases

40(3.8)

30(2.8) 460(43.2)

0.00

Controls

36(3.3)

103(9.7)

373(35.2)

Table 5c: Task Preference by volunteers and Non-volunteers.

 Cases

 Controls

n-531

n-531

Least preferred n (%) Undecided

n(%)

Preferred

n(%)

P Value

Managing cholera cases during cholera outbreaks Cases

55(5.2)

57(5.4) 418(39.5)

0.00

Controls

11(1.1)

412(38.9)

107(10.1)

Giving health education during outbreaks Cases

16(1.5)

27(2.5) 487(46)

0.00

Controls

32(3.0)

108(10.2)

390(36.8)

Cleaning of the health facilities Cases

31(3.0)

59(5.5) 440(41.5)

0.00

Controls

32(3.0)

108(10.2)

390(36.8)

Distribution of ITNs Cases

26(2.4)

25(2.4) 479(45.2)

0.00

Controls

47(4.4)

113(10.7)

370(34.9)

Distribution of water guard Cases

31(3.0)

32(3.5) 467(44)

0.00

Controls

31(3.0)

119(11.3)

380(35.8)

House H old registration and updates Cases

25(2.3)

32(3.0) 473(44.7)

0.00

Controls

39(3.6)

149(14.0)

342(22.3)

Data analysis Cases

58(5.4)

38(3.5) 434(41)

0.00

Controls

48(4.5)

148(14.0)

333(35.5)

Helping in emergencies (accidents victims ) Cases

58(5.5)

46(4.3) 426(40.2)

0.00

Controls

34(3.2)

155(14.6)

341(32.2)

Helping in emergencies (house on fire ) Cases

61(5.8)

47(4.4) 422(39.9)

0.00

Controls

29(2.7)

139(13.1)

362(34.2)

Helping in emergencies(flood victims) Cases

84(8.0)

61(5.7) 385(36.3)

0.00

Controls

32(3.0)

141(13.3)

357(33.7)

Food distribution during famine Cases

99(9.3)

64(6.0) 367(34.6)

0.00

Controls

49(4.6)

152(14.4)

329(31)

Vaccination of livestock/poultry campaign Cases

85(7.7)

56(5.3) 389(36.7)

0.00

Controls

75(7.0)

183(17.2)

271(25.7)

Discussion

Elements of the CHV Assessment Framework

The results of Construct Validity test showed that all the constructs in the tool were adequately valid in the local context. The constructs suited the Western Kenyan context in identification of individuals likely to serve as long term health volunteers. Literature provided theories, motives and assessment items that were used to develop a volunteer assessment framework for recruitment of CHVs, so that their motives for volunteering are known from the beginning to guide their training and management. This would improve the cost-efficiency of CHV programs. The main premise was that while different people can perform the same actions, the actions serve different psychological functions for different individuals [36-48].

The eight motive constructs identified were in three categories first suggested by Morrow-Howell and Mui in [49]. (1) Altruistic, (2) Material and (3) Social, grounded on three theories, Functional theory, Clary and Snyder underpins the altruistic motive constructs, Social exchange theory [50,51] and Role identity theory [52] which underpins the Social motive constructs [53-65].

Functional Theory

Penner [66] suggests that functional approach explained the processes that underlie long-term volunteering. Omoto and Snyder found that satisfaction with the volunteer experience was related to longevity of service, and Clary and colleagues found a positive association between satisfaction and intentions to continue volunteering [67]. Similarly, Penner and Finkelstein reported that satisfaction correlated significantly with both length of service and time spent volunteering [68], hence greater understanding of retention issues. These elements were based on Functional Analysis of motives based on this theory classified under Altruistic values.

Altruistic Values are based on deeply held beliefs of the importance of helping others, suggesting motivation processes that underlie long-term volunteering, such as is required for Community Health Volunteers. This construct was the most powerful predictor of long-term volunteerism, being least egoistic. This finding is consistent with research undertaken on volunteer motivation [66]. A person with altruistic value tends to think about the welfare of other people, to feel empathy for them, and to act in a way that benefits them. Volunteering for a worthy cause provides people with an opportunity to express their humanitarian concerns and translates their deeply held values into actions. Researchers have demonstrated that intention to volunteer was positively related to altruistic values [69,70].

Social Exchange Theory

The social exchange theory underlined the importance of matching volunteer motivations to the benefits that volunteerism provides, noting that matching benefits with personal motivations resulted in positive volunteer outcomes. Clary et al. found that students with matching benefits were more satisfied with their volunteerism experience and had greater intentions to continue volunteering. Material gain motives, and career development, were consistent with social exchange theory [71]. In this study the material gain values emerged as one of the core motive constructs.

Role Identity Theory

According to this perspective, one’s self-concept consisted of a hierarchy of social-role identities that guide behavior [72]. The more others identified one with a particular role, the more the individual internalized the role and incorporated it into the self-concept. Additionally, according to [72], carrying out the role of a volunteer not only shaped how an individual’s viewed themselves, but it also drove future behavior as individuals strove to make their behavior consistent with the volunteer-role identity. In regard to role identity theory, the concept of “self” had a direct causal effect on volunteer activity. Specifically, continued volunteering leads to the development of a volunteer role identity that drives continued volunteer actions. Social (social adjustment, esteem enhancement, development of understanding) were consistent with role identity theory [71] while the social constructs poorly differentiated between volunteers and non-volunteers.

Role identity theory proposed that women were more likely to adopt multiple roles and that maintaining some of these throughout life was important for well-being. Research also suggested that as men and women age they constructed new gender identities which relied less on traditional stereotypes (Silver 2003). In this study, these benefits were explored, utilizing role identity theory to examine how volunteering could be a positive activity for CHVs, since role identities were important throughout life, and that these roles gave life meaning.

Validity and Reliability of Motive Constructs among CHV in Western Kenya

The effectiveness of the framework was assessed to establish the degree to which test scores predicted repeatability when the tool was used (Shultz & Whitney, 2005). Two of the constructs were consistently strongly associated either with volunteers or non-volunteers. These were altruistic value and material gain, respectively. Four additional constructs did not demonstrate strong association with volunteers but could prove useful for inclusion depending on the objectives of the program for which volunteers are sought. These were social adjustment, esteem enhancement, development of understanding and career development. This was consistent with the classification by Morrow-Howell and Mui (1989), (1) Altruistic, (2) Material, and (3) Social. In this study the altruistic and material were the core constructs while the rest, mostly social constructs poorly differentiated between volunteers and non-volunteers. Thus the findings suggested two core constructs, and four additional constructs with twenty-nine assessment items that could be applied to the framework, for the local setting.

This study provided valuable information about the actual motives and their relative importance to identify volunteers likely to serve long as needed in community-based health care. Altruistic and material values emerged as the core motive constructs most useful in identifying volunteers, positively or negatively while the social constructs poorly differentiated between volunteers and non-volunteers. Career development and esteem enhancement motives showed relative relevance within the prevailing socio-cultural context but social adjustment and development of understanding motives had inconsistent association with volunteers and non-volunteers.

Altruistic Values are deeply held beliefs of the importance of helping others, (Clary, Snyder & Ridge, 1992, Penner 2002) suggesting motivation processes that underlie long-term volunteering, such as is required for Community Health Volunteers, being least egoistic. This finding is consistent with research undertaken on volunteer motivation (Penner 2002).

Material Gain was the construct describing individuals who volunteered in order to benefit in terms of cash, kind or some other tangible way. It was strongly associated with non-volunteers in this study. This finding was consistent with many other social theories underlying reasons for people to take action because they weigh investment against benefits, [73]. The assessment items would exclude candidates not interested in long term volunteering since they perceived volunteering as a productive activity (Warburton 2006). Career Development constructs identify those who volunteer to enhance job opportunity. It was not always strong in association with non-volunteers as should have been expected. This implies that both volunteers and non-volunteers desire a career, and could consider volunteering with this at the back of their mind. Given the young age of volunteers and their level of education, individuals with this motive could be considered suitable when there are career prospects in the volunteer program, which is a possibility for community based volunteers [74].

Social Adjustment statements were appreciated by volunteers who perceived volunteering as useful not only intrinsically, but in the eyes of others (Finkelstein 2009) such as esteem enhancement constructs in which volunteerism serves to enhance self-esteem, and self-confidence as observed by [75-77]. All the assessment items were significantly associated with non-volunteers than controls. The construct could be particularly useful in recruiting retired older volunteers, expected to be sensitive about self-esteem. The third construct under social, development of understanding, did not seem to resonate with respondents in this study.

The importance of identifying altruistic and egoistic motives for volunteering had been described by many researchers [78,79]. This supports the clustering of the constructs according to how altruistic or egoistic ending up with the final constructs and assessment items. Social Adjustment construct was weak in identifying volunteers. The responses from volunteers and non-volunteers were not statistically significantly different. Only two assessment items were identifiable more with volunteers as compared to non-volunteers which are culturally supportable [26].

Researchers have described the importance of these differences in the recruitment, placement and retention of volunteers in community settings (Clary, Snyder & Ridge, 1992) [80-82] (Barbuto, Marx, Etling, & Burrow, 2000). However, this study contributes in demonstrating the superiority of altruistic constructs in identifying long serving volunteers and superiority of material constructs in identifying non-volunteers and the inferiority of the social constructs in the Western Kenyan context. The study contributes to a greater understanding of the underlying reasons why people volunteer in the local setting. Understanding these motivations is of great assistance to the managers of community based health care such as the Kenyan Ministry of Health. The importance of identifying altruistic and egoistic motives for volunteering had been described by many researchers (Fitch, 1987; Phillips 1982; Smith 1981), and supports the clustering of the constructs according to how altruistic or egoistic they are.

The core motive constructs identified in the final framework contribute to a greater understanding of the underlying reasons why people volunteer. Many of these motivations were consistent with those examined by Clary, Snyder (1998) and their colleagues. However this study adds the element of identifying the most powerful predictors of long term volunteers – altruistic value, material gain. They were the constructs in which the perceptions of volunteers and non-volunteers differed most significantly. Understanding these motivations is suggested by many authors to be of great assistance to the managers of volunteers in their recruitment, selection, placement and ultimate retention of volunteers (Clary, Snyder & Ridge, 1992), and thus contributes to strengthening the health system.

The study demonstrated that it is possible to classify tasks according to the motives they satisfy. The results suggest that maternal child health, curative care, household visits are in one class; community based information system, meetings and dialogue in another and emergency tasks are in a third cluster. This will help volunteer recruiters to align them to tasks with benefits that match their personal motives resulting in higher satisfaction and commitment to serve their community for long. Other workers have reported that when volunteering met the motives for helping, individuals reported greater satisfaction and stronger intentions to continue volunteering than they did when those motives remained unfulfilled, or irrelevant motives were satisfied (Clary & Snyder, 1999; Clary et al., 1998; Stukas, Daly, & Cowling, 2005). This study adds the specific categories relevant to health volunteers: long term health, long term developmental or participative and short term tasks required in disasters and emergencies. The importance of identifying altruistic and egoistic motives for volunteering had been described by many researchers (Fitch, 1987; Phillips 1982; Smith 1981). This supports the clustering of the constructs according to how altruistic or egoistic ending up with the final constructs and assessment items.

Relating Motives to Tasks of Volunteers

Matching motives with benefits has real consequences in motivating the volunteer, hence the importance of identifying preferred tasks in allocating tasks as observed by Snyder and colleagues (Snyder et al 2000). Different combinations of motives were associated with different tasks as observed by Clary et al. (1996). In this study people differentiated tasks based on the motives they satisfied. When given a choice, individuals preferred tasks with benefits that matched their personally relevant motives. [83] found that individuals chose volunteer tasks that they perceived would satisfy the motives that were most important to them. Researchers observe that people continue to volunteer to the extent that their experiences fulfill relevant motives [84] (Van Dyne & Farmer, 2005) Clary & Snyder, 1999; Clary et al., 1998; Stukas, Daly, & Cowling, 2005). Motive fulfillment also correlated with later volunteer activity (Omoto & Snyder, 1995).

The findings identified three categories of tasks: typical long-term health tasks, long term participation tasks and short term or emergency tasks, demonstrating that the framework could be used to classify volunteers by task preference and thus aid in efficient management of volunteer activities. The value of such a classification is supported by many researchers in this field (Clary & Snyder, 1999; Clary et al., 1998; Davis, Hall, and Meyer 2003; Stukas, Daly, & Cowling, 2005). Houle, Sagarin, and Kaplan (2005) add that people do differentiate tasks based on the volunteer motives they satisfy, and hence tasks can be classified in terms of the motive(s) it does or does not satisfy. The classification of tasks for volunteer assignment would contribute to the retention of community health volunteers [85], by placing them in tasks that community volunteers prefer. The core motive constructs, altruistic value and material gain can be used in the identification and allocation of tasks to health volunteers and one does not have to use all seven constructs, making the framework short and user friendly yet effective.

Altruistic motive was strongly associated with most tasks investigated. Individuals with altruistic value are the most suitable for voluntary work of all kinds, health, developmental, participatory, short term intermittent and emergencies. A study by Anderson and Moore (1978) supported the importance of this motive construct. In contrast material gain was not significantly associated with the majority of the tasks investigated, except curative care that could be considered materialistic. Career enhancement was associated with the care of orphaned and vulnerable children. Indeed, studies have shown that individuals experience greater learning and development when volunteering involves the acquisition and application of a variety of skills [86,87]. Social motives demonstrated some relationship with tasks of participation such as attending meetings and dialogue sessions. Esteem enhancement was associated with mother and child health, and household visits for health education, described by (Omoto and Snyder 1995). Development of understanding was associated only with curative care tasks. Research suggests that volunteering can provide a mastery experiences [88].

This study makes unique contribution on determinants of sustained involvement in volunteering, by providing a mechanism to classify volunteers allocate them to the tasks they prefer. The core motive constructs identified in the final framework contribute to a greater understanding of the underlying reasons why people volunteer, many being consistent with those examined by Clary, Snyder and their colleagues (Clary et al 1998), however this study adds the element of identifying the most powerful predictors of long term volunteers – altruistic value, material gain. They were the constructs in which the perceptions of volunteers and non-volunteers differed most significantly. Understanding these motivations can be of great assistance to the managers of volunteers in their recruitment, selection, placement and ultimate retention (Clary, Snyder & Ridge, 1992), and thus contributes to strengthening the health system. [89-95]

The study adds the dimension of using the motives to predetermine volunteers that are likely to last in order to determine their tasks and training and thus improve efficiency by targeting training in content and length according to realistic expectations of volunteers by categories so defined. It makes substantial contribution to justify the expectation of volunteerism even in poor settings. This will improve the cost-efficiency of CHV programs. Individuals can thus be matched with tasks they are likely to find the most rewarding (Houle, Sagarin, & Kaplan, 2005). In general it demonstrates that volunteering is good for all people. This is a significant contribution to the community health profession. Several scholars examined volunteer motives in rural community settings (Bajema, Miller & Williams, 2002 and Fritz, Barbuto, Marx, Etling, & Burrow, 2000). This study developed a comprehensive VAF tool that is flexible and usable in the Western Kenyan context for recruitment and task allocation of health volunteers, based on the type of volunteer required. It has 6 motive constructs and 29 assessment items.

Houle, Sagarin, and Kaplan (2005) found that individuals chose volunteer tasks that they perceived would satisfy the motives that were most important to them. Individuals can thus be matched with tasks they are likely to find the most rewarding. Omoto and Snyder found that satisfaction with the volunteer experience was related to longevity of service, and Clary and colleagues found a positive association between satisfaction and intentions to continue volunteering (Clary et al., 1998; Omoto & Snyder, 1995). They reported greater satisfaction and stronger intentions to continue volunteering than when motives remained unfulfilled, or irrelevant motives were satisfied (Clary & Snyder, 1999; Clary et al., 1998; Stukas, Daly, & Cowling, 2005). This study adds the specific categories relevant to health volunteers: long term health, long term developmental or participative and short term tasks required in disasters and emergencies. Similarly, Penner and Finkelstein reported that satisfaction correlated significantly with both length of service and time spent volunteering (Penner & Finkelstein, 1998), hence appropriate allocation of tasks would contribute to tenure and retention. People continue to volunteer to the extent that their experiences fulfill relevant motives (Davis, Hall, & Meyer, 2003; Van Dyne & Farmer, 2005).

The study demonstrated that it is possible to classify tasks according to the motives they satisfy. The results suggest that maternal child health, curative care, household visits are in one class; community based information system and meetings and emergency tasks are in a third cluster, a contribution that this study is making to new knowledge. This will help volunteer recruiters to align them to tasks with benefits that match their personal motives resulting in higher satisfaction and commitment to serve their community for long.

Conclusion

The resultant volunteer assessment framework consists of two core constructs, altruistic value and material gain. The two core constructs are effective in identifying the motives of those likely to volunteer long term (altruistic) and individuals unlikely to volunteer long term (material gain) in the Western Kenya context. They were the constructs in which the perceptions of volunteers and non-volunteers differed most significantly. This tool will be instrumental in the recruitment of appropriately motivated volunteers for long term assignment, and hence improve the retention rate among volunteers. Additionally, it will be used to exclude those that are unsuitable. The core motive constructs identified in the final framework contribute to a greater understanding of the underlying reasons why people volunteer. The study finding opens up original avenues for understanding the factors that influence the sustainability of volunteering within communities. The study extends our understanding of caring and compassion by suggesting a novel way of conceptualizing community volunteering. It also contributes to the work design literature by identifying reduced volunteering as an unintended consequence of job enrichment, and to volunteering research in psychology and sociology by revealing new contextual influences on volunteering motives and role identities. The study demonstrated that it is possible to classify tasks according to the motives they satisfy. In general it demonstrates that volunteering is good for all people, including the poor. By understanding the motivations of their volunteers through the framework, a manager of volunteers can identify and select volunteers that are likely to serve long term.

The final framework, Volunteer Assessment Framework (VAF), is short and user friendly, consisting of two core constructs (altruistic value and material gain) with ten statements as assessment items that must always be in the framework. The next two constructs (esteem enhancement and career development) with ten statements as assessment items may be additional. The remaining two constructs (social adjustment and development of understanding) with nine assessment items, would be optional. Assessing the motivational needs of volunteers can assist the management in providing the most effective placement volunteers into activities that meet their needs and are satisfying to them and thus maximize their effectiveness. The framework therefore, will make a significant contribution in seeking to enhance the recruitment, effective placement and greater retention of community health volunteers. It is therefore a useful addition to available psychometric tools for improving efficiency of recruitment and training of community health volunteers (Insert Appendix A).

Study Limitations

The study focused on western Kenyan CHVs there is a need to extend it to other contexts, and other volunteers beyond the health sector to improve the generalizability of the findings.

Further Research

More work is needed to identify the theories underpinning community concern and spirituality constructs as well as assessment items to measure them, in order to improve their usefulness in an assessment framework.

A prospective experimental study design by assessing and recruiting volunteers based on altruistic and egoistic motives and following them up to measure task performance, motive satisfaction and health outcomes would strengthen the evidence.

Abbreviations

CHV: Community Health Volunteers; CHW: Community Health Workers; VAF: Volunteer Assessment Framework; LMIC: Low and Middle Income Country.

Declarations

The publication costs associated with this article are funded by Tropical Institute of Community Health (TICH).

Ethics Approval and Consent to Participate

All participants provided written consent to participate in the study. The study protocols were reviewed and approved in Kenya, by Great Lakes University of Kisumu (GLUK) Ethics Review Board. All methods were performed in accordance with relevant guidelines and regulations of Kenya that protected the research subjects.

Consent for Publication

All authors read and approved the final manuscript.

Availability of Data and Materials

The datasets used and/or analyzed during the current study are available from the corresponding author on request.

Competing Interests

The authors declare no conflict of interest

Funding

This study was funded by Tropical Institute of Community Health (TICH) in Africa.

Authors Contribution

BMO: Designed the study, managed the research process, supervised all aspects of the study and the team members, carried out the analysis of data, development of the analysis framework, and synthesized the contributions from co other author into the manuscript. She further engaged actively in the revision of the manuscript in response to critiques from co-author and took the lead in writing and editing the manuscript based on internal peer reviewers’ comments.

DCOK: Participated in the analysis of data, development of the analysis framework, reviewed and contributed to the writing of the manuscript and made suggestions aan inputs towards the final draft.

All authors have read and approved the manuscript.

Acknowledgements

This work was funded and supported Tropical Institute of Community health (TICH).

End Notes: This paper provides valuable information about the actual motivations of volunteers and their relative importance to identify volunteers likely to serve for long periods of time, especially in health programs. It offers a framework that will be instrumental in the recruitment of appropriately motivated volunteers for long-term assignments, and details a screening process which will improve the cost-efficiency of health volunteer programs by considering the motivations of their volunteers. This is critical to managers involved in the recruitment, placement and retention of volunteers.

This research opens up original avenues for understanding the factors that influence the sustainability of volunteering within communities. It will extend the reader’s understanding of caring and compassion by suggesting a novel way of conceptualizing volunteering. The article makes a major contribution to the work design literature by identifying reduced volunteering as an unintended consequence of job enrichment, and to volunteering research in psychology and sociology by revealing new contextual influences on volunteering motives and role identities.

References

  1. WHO guideline on health policy and system support to optimize community health worker programmes. 2018.
  2. Hongoro C, McPake B (2004) How to bridge the gap in human resources for health. Lancet 364: 1451-56.
  3. World Health Organization (2006) Intergrated community case management (Iccm) guide.
  4. Haines A, Sanders D, Lehmann U, Rowe AK, Lawn JE, et al. (2007) Achieving child survival goals: potential contribution of community health workers. Lancet 369: 2121-2131. [crossref].
  5. Jones PM (2003) Juilliard: A History. 24 issue: 197-201.
  6. Winch PJ, GK (2005) Intervention models for the management of children with signs of pneumonia or malaria by community health workers. Health Policy Plan 20: 199-212. [crossref].
  7. Rowe A (2007) Entry on ‘Friendship’ in Y. Jewkes and J. Bennett. Dictionary of Prisons and Punishment.
  8. Macro International Report 1998.
  9. Walt G (1990) Community health workers in national programmes: just another pair of hands? Open University Press.
  10. Bhattacharyya K, Winch P, Le BK, Thien M (2001) Community health worker incentives and disincentives: How they affect motivation, retention, and sustainability.
  11. Ferketich S, Phillips L, Verran J (1993) Focus on psychometrics. Development and administration of a survey instrument for cross-cultural research. Research Nurses Health 16: 227-30. [crossref].
  12. Netemeyer RG, Bearden WO, Sharma S (2003) Scaling procedures: Issues and applications. Thousand Oaks, Sage.
  13. Cronbach LJ, Meehl PE (1955) Construct validity in psychological tests. Psychological Bulletin 52: 281-302. [crossref].
  14. Brink PJ, Wood MJ (1998) Advanced design in nursing research. Thousand Oaks, Sage.
  15. Polit DF, Beck CT (2004) Nursing Research. Principles and Methods. Lippincott.
  16. Schultz KS, Whitney DJ (2005) Measurement theory in action. Thousand Oaks. Sage.
  17. Saunders M, Lewis P, Thornhill A (2003) Research Methods for Business Students England: Prentice Hall.
  18. George, Darren & Mallery, Paul (2003) SPSS for Windows Step-by-Step: A Simple Guide and Reference.
  19. Cronbach LJ (1951) Coefficient Alpha and the Internal Structure of Tests. Psychometrika 16: 297-334.
  20. Hatcher L (1994) A Step-by-Step Approach to Using the SAS System for Factor Analysis and Structural Equation Modeling.
  21. Clary EG, Miller J (1986) Socialization and situational influences on sustained altruism. Child Dev 57: 1358-69. [crossref].
  22. Anderson JC, Moore LF (1978)The Motivation To Volunteer. Journal of Voluntary Action Research 7: 120-129.
  23. Omoto, Synder, Omoto, Allen M, Mark Snyder (2002) Considerations of Community: The Context and Process of Volunteerism. American Behavioral Scientist 45: 846-867.
  24. Kironde S, Banjunirwe F (2002) Lay workers in directly observed treatment (DOT) programmes for tuberculosis in high burden settings: Should they be paid? A review of behavioral perspectives. African HealthScience 2002: 73-78.
  25. Kaseke R, Dhemba J (2006) Five country study on service and volunteering in Southern Africa: Zimbabwe country report. Centre for Social Development in Africa.
  26. Ochieng BM, Kaseje DCO, Wafula CO (2012) Journal of Developing Countries Studies 2: 36-43.
  27. Francies GR (1983) The volunteer needs profile: Atool for reducing turnover. The Journal of Volunteer Administration 1: 17-33.
  28. Clary EG, Mark S, Robert DR, John C, Arthur AS et al. (1998) Understanding and Assessing the Motivations of Volunteers: A Functional Approach. Journal of Personality and Social Psychology 74: 1516-1530. [crossref].
  29. Harrison, David A (1995) Volunteer Motivation and Attendance Decisions: Competitive Theory Testing in Multiple Samples From a Homeless Shelter. Journal of Applied Psychology 80: 371-385.
  30. Fisher, Robert J, David A (1998) The Effects of Recognition and Group Need on Volunteerism: A Social Norm Perspective. Journal of Consumer Research 25: 262-275.
  31. Katz D (1960) The functional approach to the study of attitudes. Public Opinion Quarterly 106-204.
  32. Smith M, Bruner J, White R (1956) Opinions and personality.
  33. Beale AV (1984) Exploring careers through volunteerism. The School Counselor 32: 68-71.
  34. Phillips, Michael (1982), Motivation and Expectation in Successful Volunteerism. Journal of Voluntary Action Research 11: 118-125.
  35. Smith, David H (1981) Altruism, Volunteers, and Volunteerism. Journal of Voluntary Action Research, 10: 21-36.
  36. Stukas, Arthur A, Daly, Maree and Cowling, Martin J (2005) Volunteerism and Social Capital: A Functional Approach. Australian Journal on Volunteering 10: 35-44.
  37. Herek GM (1987) Can functions be measured? A new perspective on the functional approach to attitudes. Social Psychology Quarterly 50: 285-303.
  38. Snyder M, DeBono KG (1987) A functional approach to attitudes and persuasion. Social influence: The Ontario Symposium 5: 107-125.
  39. Clary EG, Snyder M (1999) The motivations to volunteer: Theoretical and practical considerations. Current Directions in Psychological Science 8: 156-159.
  40. Clary EG, Snyder M, Ridge R (1992) Volunteers’ motivations: a functional strategyfor the recruitment, placement, and retention of volunteers. Nonprofit Management and Leadership 2: 333-350. [crossref].
  41. Clary EG, Synder M, Stukas AA (1996) Volunteers Motives. Findings from a National Survey. Nonprofit and Voluntary Sector Quarterly 25: 485-505.
  42. Omoto AM, Snyder M (1995) Sustained helping without obligation: Motivation, longevity of service, and perceived attitude change among AIDS volunteers. Journal of Personality and Social Psychology 68: 671- 686. [crossref].
  43. Omoto AM, Snyder M, Berghuis JP (1993) The psychology of volunteerism: A conceptual analysis and a program of action research. The Social Psychology of HIV Infection 333-356.
  44. Snyder M (1993) Basic research and practical problems: The promise of a “functional” personality and social psychology. Personality and Social Psychology Bulletin 19: 251-264.
  45. Snyder M, Clary EG, Stukas AA (2000) The functional approach to volunteerism. Why we evaluate: Functions of attitudes.
  46. Snyder M, Omoto AM (1992) Volunteerism and society’s responseto the HIV epidemic. Current Directions in Psychological Science 1: 113-116.
  47. Snyder M, Omoto AM (1992) Who helps and why? The psychologyof AIDS volunteerism. Helping andbeing helped: Naturalistic studies. Newbury Park, Sage. 213-239.
  48. Clary, Snyder (2005) A Functional Approach to Volunteerism: Do Volunteer Motives Predict Task Preference? Basic and Applied Social Psychology 27(4).
  49. Morrow HN, Mui AC (1989) Elderly volunteers: Reasons for initiating and terminating service. J Gerontol Soc Work 13: 21-34.
  50. Kohlberg, Howarth E (1976) Personality characteristics of volunteers. Psychological Reports 38: 855-858.
  51. Fitch RT (1987) Characteristics and motivations of college students volunteering for community service. Journal of College Student Personnel 28: 424-431.
  52. Stryker S, Statham A (2006) Symbolic interaction and role theory. In Handbook of Social Psychology.
  53. Gubrium J, Wallace J (1990) Who theorizes age? Ageing Soc 18: 131-149.
  54. Warburton J, McLaughlin D (2006) Doing it from your heart: the role of older women as informal volunteers. Women Aging 18: 55-72.
  55. Thoits P (1991) On merging identity theory and stress research. Psychol. Quart 54: 101-112.
  56. Stryker S, Burke P (2000) The past, present and future of an identity theory. Soc Psychol Quart 63: 284-297.
  57. Stets J, Burke P (2000) Identity theory and social identity theory. Soc Psychol Quart 63: 224-237.
  58. Moen P, Robison J, Dempster MD (1995) Caregiving and women’s well-being: a life-course approach. J Health Soc Behaviour 36: 259-273.
  59. Greenfield E, Marks N (2003)Volunteering Protects Older Adults at Risk for Loss of Purpose in Life.
  60. Erikson E, Erikson J, Kivnick H (1986) Vital Involvement in Old Age. New York, USA,.
  61. Stevens E (1993) Making sense of usefulness: an avenue towards satisfaction in later life. Int J Aging Human Dev 47: 313-325.
  62. MacNeela P (2008) The Give and Take of Volunteering: Motives, Benefits, and Personal Connections among Irish Volunteers International Journal of Voluntary and Nonprofit Organizations 19: Page 125.
  63. Finkelstein MA, Penner LA, Brannick MT (2005) Motive, role identity, and prosocial personality as predictors of volunteer activity. An International Journal 33: 403-418.
  64. Henderson KA (1981) Motivations and perceptions of volunteerism and a leisure activity. Journal of Leisure Research 13: 208-218.
  65. Finkelstein M (2009) Intrinsic extrinsic motivational orientations and the volunteer process. Pers Indiv Differ 46: 653-658.
  66. Penner LA (2002) Dispositional and organizational influences on sustained volunteerism: An interactionist perspective. Journal of Social Issues 58: 447-467.
  67. Omoto, Allen M, Mark S (1995) Sustained Helping without Obligation: Motivation, Longevity of Service, and Perceived Attitude Change among AIDS Volunteers. Journal of Personality and Social Psychology 68: 671-686.
  68. Penner LA, Finkelstein MA (1998) Dispositional and structural determinants of volunteerism. Journal of Personality & Social Psychology 74: 525-537.
  69. Piliavin, Jane A, Hong WC (1990) Altruism: A Review of Recent Theory and Research. Annual Reviewof Sociology 16: 27-65.
  70. Unger LS (1991) Altruism as a motivation to volunteer. Journal of Economic Psychology 12: 71-100.
  71. Morrow HN, Mui AC.(1989) Elderly volunteers: Reasons for initiating and terminating service. J Gerontol Soc Work 13: 21-34.
  72. Finklestein, Penner, Finkelstein MA, Penner LA (2004) Predicting Organizational Citizenship Behavior: Integrating the functional and role identity approaches. An International Journal 32: 383-398.
  73. Bandura A (1999) Moral disengagement in the perpetration of inhumanities. Personality and Social Psychology Review 3: 193-209. [crossref].
  74. Gidron B (1978) Volunteer work and its rewards. Volunteer Administration 11: 18-32.
  75. Cheng YY, Chan MM,Kwong J, Peng S, ChenX, et al. (2010) The good old days and a better tomorrow: Historical representations and future imaginations of China during the 2008 Olympic games. Asian Journal of Social Psychology 13: 118- 127.
  76. Cheng YY, Chen X, Chiu CY (2009) Cultural identity and preference for local vs. foreign cultures. Paper presented at the Guanghua School of Management, Peking University, Beijing China.
  77. Warburton J, Chambers B (2007) Older Indigenous Australians: their integral role in community and culture. Australas J Ageing 26: 3-7.
  78. Fitch RT (1987) Characteristics and motivations of college students volunteering for community service. Journal of College Student Personnel 28: 424-431.
  79. Smith, David H (1981) Altruism, Volunteers, and Volunteerism. Journal of Voluntary Action Research 10: 21-36.
  80. Esmond J (2001) Count me in! 501 ideas on recruiting volunteers. Perth: New season Publications.
  81. Bajema DH, Miller WW, Williams DL (2002) Aspirations of Rural Youth. Journal of Agricultural Education 43: 61-71.
  82. Fritz, Susan & Barbuto, Jr John & Marx, David & Etling, Arlen & Burrow, et al (2000) motivation and recognition preferences of 4-h volunteers.
  83. Houle BJ, Sagarin BJ, Kaplan MF (2005) A functional approach to volunteerism: Do volunteer motives predict task preference? Basic and Applied Social Psychology 27: 337-344.
  84. Davis MH, Hall JA, Meyer M (2003) The First Year: Influences on the Satisfaction, Involvement, and Persistence of New Community Volunteers. Personality and Social Psychology Bulletin 29: 248-260.
  85. Grube JA, Piliavin JA (2000) Role identity, organizational experiences and volunteer performance. Soc Psychol Bull 26: 1108-19.
  86. Bartel C (2001) Social comparisons in boundary – spanning work: Effectiveness of community outreach on members’ organization identity and identification. Administrative Science Quarterly 46: 379-413.
  87. Musick MA,Wilson J (2003) Volunteering and depression: The role of psychological and social resources in different age groups. Social Science and Medicine 56: 259-269.
  88. Mojza EJ, Sabine S (2010) Does volunteer work during leisure time buffer negative effects of job stressors? A diary study. European Journal of Work and Organizational Psychology 19: 231-252.
  89. Carmines EG, Zeller RA (1979) Reliability and validity assessment. Thousand Oaks, Sage.
  90. Clary EG, Snyder M (1995) Motivations for volunteering and giving: A functional approach. New directions for philanthropic fundraising. 8: pp. 111-123.
  91. Cheng YY, Chan MM,Kwong J, Peng S, ChenX, et al. (2010) The good old days and a better tomorrow: Historical representations and future imaginations of China during the 2008 Olympic games. Asian Journal of Social Psychology 13: 118- 127.
  92. Harrison, David A (1995) Volunteer Motivation and Attendance Decisions: Competitive Theory Testing in Multiple Samples From a Homeless Shelter. Journal of Applied Psychology: 80: 371-385.
  93. Henderson K (1984) Volunteerism as leisure. Journal of Voluntary Action Research 13: 55-63.
  94. Morrow HN, Hong S, Tang F.(2009) Who benefits from volunteering? Variations in perceived benefits. Gerontologist Vol, 49, 91-102. [crossref].
  95. Penner LA, Dovidio JF, Piliavin JA, Schroeder DA (2005) Prosocial behavior. Annual Review of Psychology 56: 365-92.
fig 1

Senolytic Development in Osteoarthritis: A New Paradigm

DOI: 10.31038/IJOT.2021422

Abstract

OA is a large unmet medical need, with increasing incidence in our aging population. Recent physiopathogical knowledge have identified the accumulation of senolytic cells in cartilage and the synovium as deleterious. This has prompted the development of senolytic drugs in OA. Senolytics are a class of drugs that selectively clear senescent cells. Senolytics induce apoptosis of senescent cells accumulated in joint tissue with a tissue-destructive SASP (senescent associated secreted proteome). They include three major classes of molecules. Senolytics which seek to kill/eliminate senescent cells by playing on increased cell survival pathways during the senescence process. Seno-morphics, which change the inherent properties of the senescent state, for example by reactivating autophagy while maintaining the stopping of the cycle. And finally, a third class of therapeutic agents, senosuppressants, will block the entry or the spread of senescence. Thus, drugs with senotherapy properties such as metformin, rapamycin, fisetin, dasatinib, quercetin, resveratrol, have shown modulation of the aging process and associated pathologies including OA. Thus, many therapeutic alternatives in the treatment of osteoarthritis are opening up, but clinical trials will have to be carried out to confirm their effectiveness.

Keywords

Senescence, Osteoarthritis, Senolytics

fig 1

Introduction

Life expectancy of human populations is increasing worldwide as a result of medical and socio-economic advances, the years of life gained are often in poor health. Indeed, aging poses specific medical problems because it is the primary risk factor for developing a broad spectrum of chronic musculoskeletal diseases in the general population including osteoarthritis (OA) and osteoporosis [1]. Current advances in the biology of aging will be at the origin of therapeutical improvement making it possible to increase life expectancy in good health and prevent OA.

Senescence and OA Physiopathology

Senescence is a complex pathophysiological phenomenon that can be observed in the context of tissue damage associated with aging in the context of cancer development. Cellular senescence is a cell fate that entails essentially irreversible replicative arrest, sustained viability with resistance to apoptosis and increased metabolic and protein secretion activity [2].

Inducers of senescence can be DNA damage, telomere dysfunction, oncogene expression or replicative stress or even inducers of proliferation such as growth hormones. Extrinsic Inducers of senescence include the presence of circulating AGEs, saturated lipids and other bioactive lipids (prostaglandins), reactive metabolites (e.g. ROS, hypoxia), mechanical stress, inflammatory cytokines, damage-associated molecular patterns and pathogen-associated molecular patterns (PAMPs, e.g. bacterial endotoxins).

Cellular senescence results in cell cycle arrest by the activation of cyclin kinase inhibitor (including p16INK4a and p21Cdkn1a), associated with an increase in beta galactosidase activity and increased cell metabolism. This leads to the secretion of many secreted proteins that are calls SASP including proteins responsible for inflammation, insulin resistance, proteins that promote apoptosis, chemokines and factors of the TGF Beta family. The SASP profile varies depending on the cell type and will commonly include cytokines IL1, IL6, IL8, metalloproteases MMP13 secreted in the immediate cellular environment. Senescent cells accumulate with ageing and at causal sites of multiple chronic disorders, including musculoskeletal diseases associated with ageing, including OA and osteoporosis. The most deleterious senescent cells are resistant to apoptosis and have up-regulation of anti-apoptotic pathways allowing them to survive, despite killing neighbouring cells [3-5].

Osteoarthritis (OA) is a common pathology of cartilage, leading to disability and chronic pain. This incidence of OA increases with the aging of the population. It results on a complex physiopathology combining synovial inflammation, subchondral bone oedema and osteoblast activation and chondrocytes hypertrophy associated with the secretion of metalloproteases collagenases, ADAMT’S which will remodel cartilage extracellular matrix. This is accompanied by an arrest of the cell cycle, alteration of the cell metabolism as well as a chronic inflammation of the synovium. These biological events are related to the senescence of synovial cells and chondrocytes. The role of senescent cell accumulation in OA has been demonstrated in mouse models. Using elegant genetic constructs where senescent cells positive P16 very be selectively removed from articular tissues. In these experiments the elimination of senescent cells, in particular in joint tissues, helps prevent experimental osteoarthritis [6-8]. This suggest that drugs able to deleted senescent cells in osteoarthritis disease could provide clinical benefit.

Senolytics in OA

The demonstration of molecules capable of preventing senescence opens an important pathway in the treatment of diseases associated with aging. Senolytics induce apoptosis of senescent cells accumulated in joint tissue with a tissue-destructive SASP. Senolytics are a class of drugs that selectively clear senescent cells (SC) [9]. Through this demonstration of causality between senescence and tissue degeneration, a new category of treatments aimed at targeting senescence has recently emerged in preclinical and clinical studies. They include three major classes of molecules. Senolytics which seek to kill/eliminate senescent cells by playing on increased cell survival pathways during the senescence process. Seno-morphics, which change the inherent properties of the senescent state, for example by reactivating autophagy while maintaining the stopping of the cycle. And finally, a third class of therapeutic agents, senosuppressants, will block the entry or the spread of senescence. Thus, drugs with senotherapy properties such as in particular metformin, rapamycin, fisetin, dasatinib/quercetin mixture, resveratrol, spermidine, curcumin and astaxanthin, have shown that the aging process and associated pathologies, can be partially prevented in mice. Moreover, 4 of these molecules are currently in phase I clinical trials in several indications in the elderly. Therefore, geroprotective interventions (senostatic strategies) are now designed to slow ageing and maintain health for longer before end of life.

The first studied senolytic drugs including Dasatinib, Quercetin, Fisetin are proapoptotic molecules. These drugs are MDM2 antagonists with ubiquitin ligase activity leading to the down expression of P53. These molecules therefore make it possible to switch senescent cells back to apoptotic cells and therefore eliminate accumulative senescent cells. Therapeutic strategies combining dasatinib and quercitin have been proposed with encouraging results, in particular in diabetes or dysmetabolic diseases [10,11].

Other molecules have been identified as regulators of Bcl2 apoptosis pathway through Bcl-xl inhibition. More recently, Nutlin3a (an MDM2 inhibitor) or navitoclax (a BCL-2 inhibitor), has been proposed as a alternative therapeutic strategy in osteoarthritis disease with encouraging preclinical results [12,13]. Navitoclax reduced the expression of inflammatory cytokines and promoted cartilage matrix aggregation in OA chondrocyte by inducing apoptosis. Moreover, OA pathological changes in the cartilage and subchondral bone in OA rat were alleviated by Navitoclax intra-articular injection. However phase 2 clinical study in OA was stopped prematurely because of lack of results.

Among other senolytics, rapamycin regulates cell metabolism (through the inhibition of mTor pathway) and induces autophagy [14]. Mildly lowering the activity of the nutrient-sensing network, especially the activity of mechanistic target of rapamycin protein complex 1 (mTORC1), using natural metabolites from the systemic environment that can rejuvenate stem cells, increasing autophagy/mitophagy, and reducing age-related inflammation are emerging as key mechanisms by which these interventions exert their effects. Rapamycin dramatically decelerated loss of proliferative potential caused by ectopic p21, p16 induction. During cell cycle arrest, rapamycin transformed the irreversible arrest into a reversible condition.

Other molecules, such as FOXO4-derived peptide designed to inhibit the interaction of this transcription factor with the tumour suppressor p53 reduced senescent cell viability through p53-mediated cell-intrinsic apoptosis [15]. In addition, FOXO4 inhibition in cells that were already senescent, but not their control counterparts, reduced viability and cell density. After acute damage FOXO4 favors senescence over apoptosis and maintains viability of senescent cells by repressing their apoptosis response.

HSP90 inhibitors have been shown to be active in cancer through targeting of p53 and inducing apoptosis. Geldanamycin (GA), a benzoquinone ansamycin, depletes mutant p53 in breast cancer cell. GA restores ubiquitination and degradation of mutant p53 by the proteasome [16].

More recently, fibrates have shown senolytic activity. Fibrates impact on autophagy and lipid metabolism through PPAR ligands and constitution of retinoic acid heterodimer. Fibrate have a senolytic potential on OA senescent chondrocytes in-vitro. Peroxisome proliferator activated receptor alpha activation decreases synovial inflammation and cartilage lesions in osteoarthritis [17,18].

Finally, seno-suppressants which directly inhibit SASP via inflammatory cytokine secretion related to the SASP may be proposed in degenerative joint diseases. Janus Kinases (JAK) are cytosolic protein tyrosine kinases directly associated with receptors for cytokines, hormones and growth factors involved in SASP. Jak inhibitors, such as Bariticinib or Ruxolitinib® reduce the expression of CKIs p16INK4a and p21Cdkn1a, correlating with the reestablishment of the proliferative capacity of senescent cells. Janus Kinase inhibitors have shown the ability to reduce adipocyte SASP and restore function and mobility in aged mice [19]. JAK1/2 inhibitors reduced inflammation and alleviated frailty in aged mice. Recently, Jak inhibitors was shown to reduce senescent cells in ageing tendon.

Conclusion

OA is a large unmet medical need. Recent physiopathogical knowledge have identified the accumulation of senolytic cells in cartilage and the synovium as deleterious. This has prompted the development of senolytic drugs in OA. Thus, many therapeutic alternatives in the treatment of osteoarthritis are opening up, but clinical trials will have to be carried out to confirm their effectiveness on a structural impact and not just anti-inflammatory (Figure 1).

References

  1. Christensen K., Doblhammer G., Rau R (2009) Ageing populations: the challenges ahead. Lancet 374: 1196-1208. [crossref]
  2. He S, Sharpless NE (2017) Senescence in health and disease. Cell 169: 1000-1011. [crossref]
  3. Hernandez SA, Tristan VDJ, Simon M, Victor G, Judith C, et al. (2017) Unmasking Transcriptional Heterogeneity in Senescent Cells Curr Biol. 27: 2652-2660. [crossref]
  4. Kirkland JL, Tchkonia T (2017) Cellular senescence: a translational perspective. EBioMedicine. 21: 21-28. [crossref]
  5. Jeon OH, Kim C, Laberge RM (2017) Local clearance of senescent cells attenuates the development of post-traumatic osteoarthritis and creates a pro-regenerative environment. Nat Med 23: 775-781. [crossref]
  6. Tachikart Y, Malaise O, Mumme M, (2019) Seno-suppressive molecules as new therapeutic perspectives in rheumatic diseases. Biochem Pharmacol 165: 126-133.
  7. Jeon OH, David N, Campisi J, (2018) Senescent cells and osteoarthritis: a painful connection. J Clin Invest 128: 1229-1237. [crossref]
  8. Patil P, Dong Q, Wang D (2019) Systemic clearance of p16 (INK4a) -positive senescent cells mitigates age-associated intervertebral disc degeneration. Aging Cell 18: e12927.
  9. Kirkland JL, Tchkonia T (2020) Senolytic drugs: from discovery to translation. J Intern Med. 288: 518-536. [crossref]
  10. Wu D, Prives C (2018) Relevance of the p53-MDM2 axis to aging. Cell Death Differ 25: 169-179. [crossref]
  11. Wiley CD, Schaum N, Alimirah F (2018) Small-molecule MDM2 antagonists attenuate the senescence-associated secretory phenotype. Sci Rep 8: 2410-2414. [crossref]
  12. Yosef R, Pilpel N, Tokarsky AR (2016) Directed elimination of senescent cells by inhibition of BCL-W and BCL-XL. Nat Commun 7: 11190-95. [crossref]
  13. Hao Y, Cheng C, Hao C, Xiaojun D, Juan L (2020) Navitoclax (ABT263) reduces inflammation and promotes chondrogenic phenotype by clearing senescent osteoarthritic chondrocytes in osteoarthritis. Aging (Albany NY) 12: 12750-12770. [crossref]
  14. Zoya ND, Svetlana GZ, Elena IB, Valery AP, Tatiana VP (2009) Rapamycin decelerates cellular senescence. Cell Cycle 12: 1888-1895.
  15. Baar MP, Brandt RM, Putavet DA (2017) Targeted apoptosis of senescent cells restores tissue homeostasis in response to chemotoxicity and aging. Cell 169: 132-147. [crossref]
  16. Fuhrmann SH, Ling YY, Zhao J (2017) Identification of HSP90 inhibitors as a novel class of senolytics. Nat Commun 8: 422-25. [crossref]
  17. Clockaerts S, Bastiaansen JYM, Feijt C (2011) Peroxisome proliferator activated receptor alpha activation decreases inflammatory and destructive responses in osteoarthritic cartilage. Osteoarthritis Cartilage 19: 895-902. [crossref]
  18. Nogueira RU, Lorenzo GI, Blanco FJ (2019) Fibrates as drugs with senolytic and autophagic activity for osteoarthritis therapy. EBioMedicine 45: 588-605. [crossref]
  19. Chen M, Xiao L, Dai G, Lu P, Zhang Y, et al. (2021) Inhibition of JAK-STAT Signaling Pathway Alleviates Age-Related Phenotypes in Tendon Stem/Progenitor Cells . Frontiers in Cell and Developmental Biology 9: 575-580 [crossref]

Reanimate the Dead to Life by Practicing Cryo Techniques

DOI: 10.31038/SRR.2021413

Abstract

Therapeutic Hypothermia has been evolving as a science in itself since a very long time. There have been many accidents chronicled wherein people were buried alive in snow or under ice in frigid waters, left scientifically dead without any signs of heartbeat and breathing, only to be revived many hours later. The most notable case being that of Anna Bagenholm from Sweden. Doctors in Siberia have been placing babies in snow banks since the 1960’s before surgery to increase their chances of survival. Stowaways have been known to survive in the wheel well of an aircraft jetliner at 38,000 feet altitude with negligible oxygen & -50 degree temperatures. Inspiration is also drawn from hibernation ability of the hibernating animals like the artic ground squirrel, wood frog, nematodes, polar bears etc. in harsh winter conditions. But it has been felt that the real benefits of medical hypothermia have not been exploited so far for the progress of mankind. By means of this research, we have now discovered how cooling can assist in bringing back the dead to life.

Pigs were bled to death with a major trauma to their vital common jugular vein and/or carotid artery to mimic an accident/trauma injury. The pig had by now lost its heartbeat, pulse, blood pressure, respiration, etc. and all other vital signs of life, leaving it clinically dead. Its chest cavity was opened via a thoracotomy. A cannula or long specialised Cather was inserted into the aorta. Dead bodies of these pigs were immediately cooled by sucking out their entire blood through the aorta & replacing it with an ice cold saline solution (at 5 degrees Celsius) suspended with PFC’s – Perfluorocarbon aggressively pumped into the aorta. PFC’s are efficient artificial oxygen carriers. All this drained blood of the pig was carefully collected in a vat for re-transfusion in future. This cold oxygenated solution was continuously circulated through the blood vessels of the dead pig bringing its core body temperature to about 10 degrees Celsius rapidly within 10 minutes. An ECMO machine was connected with a chiller and heater alternatively, used continuously for all circulatory purposes of both the warm blood & ice cold solution throughout the pig’s body. External cooling packs & ice pads were also applied on the entire body of the pig to cool down its dead body as soon as possible. A surgery was performed on the dead body to restore the tear (sew up the vein which had been severed). The pig was slowly thawed in a warm water bath at about 0.5 degree Celsius per hour to the normal body temperature of 38 degrees of the pig. The ice cold saline was then replaced with the warm original blood of the pig when the temperature reached 30 degrees. After about reaching to 32 degrees some of the pig’s heart started beating automatically while the others had to be given a jumpstart using external electric shocks called defibrillation or Electrical Cardioversion. The pigs were immediately connected to a ventilator device for assisted respiration. After about a day or so these pigs returned to normalcy with regards to heart & breathing rhythms. By following the above procedure dead humans may also be brought back to life immediately after demise. This procedure will be more effective in dead youths who unfortunately got killed. Pigs were used for this experiment as they share a number of surprising comparable traits with humans which are a well-known fact.

Keywords

Cryo technique, Therapeutic hypothermia, Cooling, Suspended animation, Resurrect dead to life, Cryopreservation, Cryogenics, Emergency medicine

Introduction

The word hypothermia comes from the Greek language. Therapeutic hypothermia has been around since ancient times. It has been practiced since the past 5000 years in varying intensities. It was even used by the ancient Egyptians and finds mention in the “Edwin Smith Papyrus”. Even the ancient Greek physician Hippocrates has stated some uses of cooling in medicine in accordance with the knowledge of his times. Hypothermia was back in vogue in the 17th, 18th & 19th Centuries in different types of treatments like cold water bathing, spas etc. for general fitness & wellbeing. Sometimes cold was used as a sedative. It was sometimes seen as an alternative medical practice also. Freezing water was poured on psychiatric patients as a method to treat mental disorders. They were tortured by forcibly dipping them in ice cold water. But in this paper we are exploring an advanced use of clinically controlled therapeutic hypothermia to help bring back the dead to life.

Methods/Procedure

The dead body can be cooled rapidly after sudden death, repaired & thawed back slowly to life. This process is most effective in young patients when even after death occurs there is minimal damage to the body structures/physical anatomy of the human body.

As noted the brain cells begin to die within 10 minutes after respiration & heartbeat stops due to non-receipt of fresh oxygen from the blood.

This process of brain cell death can be prevented by placing ice packs over the head immediately after death or immersing the entire head in an ice bucket or ice bag at once after death. This may be a crude technique but a very effective first aid in locations where no other medical assistance such as a Cryo Kit is unavailable. CPR is continuously kept done to circulate the blood till reaching the cryo facility either manually or by a machine available at the scene. Supportive oxygen or air should be forced into the lungs if possible. Utmost care must be taken to prevent any brain cells from dying of oxygen deprivation.

The Cooling using ice or thermal blankets reduces the possibility of the neural damage to the brain to some extent.

Once the onsite medical practitioner has confirmed death by checking the routine pulse & breathing parameters, the cold dead body should be immediately rushed to the cryo rusticating ICU facility in a hospital.

At the Cryo facility anti blood coagulating injections like heparin are immediately injected into the cadaver. The chest cavity is opened. Then the entire blood is flushed out of the body through the aorta within a few minutes using a high pressure pump. The adult human body has just about 5 Litres of blood.

There are two kinds of processes developed to bring back the dead to life.

  1. The Chilled Process at 10 degree
  2. The Frozen Process at minus -18 degree

The Chilled Process at 10 Degree

The body is transported to a chilled operation theatre temperature controlled at 10 degrees Celsius. All the blood is immediately replaced with a 0.9 concentration saline solution suspended with perfluorocarbons cooled to 5 degrees Celsius. This maintains the core temperature of the body at 10 degrees Celsius which is constantly monitored using an advanced body heat probe.

The cooled saline solution is continuously oxygenated and kept circulating in the body using an ECMO Machine. These PFC’s in the solution carry oxygen to the cells & remove the carbon dioxide.

Oxygen dissolved in saline solution is a bit less but enough for the now chilled brain cells which have no or minimal oxygen demand.

Since, 5% Metabolism of the cells falls with every degree Celsius drop in temperature. Our general body temperature is 37 degrees Celsius. Therefore, chilling the core body temperature to 10 degrees practically stops all physical, chemical & biological processes at the cellular level of the body.

The body is thus put in a state of suspended animation which arrests all of the metabolic activities. In this state of suspended animation, the defect that caused death is rectified. For example, if death was due to a cardiac arrest the blood vessels of/near the heart are cleared. Angioplasty or bypass surgery may be performed. If the death was due to gunshot or stabbing the wound the organ damage is repaired artificially and sutured. The injuries are repaired. If the death was due to an accident, the trauma borne parts are repaired surgically. If the death was due to poisoning the poison is completely flushed out of the system etc. and so on. Death should have happened due to fixable causes.

Once the reason for death has been cured, the body is moved to room temperature & is slowly thawed back by placing it in a water bath.

The saline solution is pumped out and replaced by warm blood when the thawing reaches 30 degrees. The heart is given a jump start to beating by electrical shock to begin beating. EPR (Electro-Pulmonary Resuscitation). Slowly the temperature is increased over a period of many hours to the normal 37 degrees @ 0.5 degrees per hour.

Once the hearts start beating back on its own the patient may be provided with a ventilator device for a few days/weeks to assist breathing. After the patient is fully recovered from whatever was his cause of death & is declared fit & fine, He or she can be discharged from the hospital if all the vital parameters such as BP, SPO2, ECG, EEG, BPM, etc. are back to normal.

The Frozen Process at -18 degree

The frozen process is very similar to the chilled process. The only change being that the temperature set is at minus -18 degrees.

The body is transported to a frozen operation theatre temperature controlled at minus -18 degrees Celsius. It may be even equipped with a blast freezer to freeze the arriving dead body to -18 degrees rapidly.

All the blood is immediately replaced with a Cryoprotectant solution such as ethylene glycol, dimethyl sulfoxide (DMSO), glycerol, etc. cooled to minus 18 degrees Celsius which may or may not be suspended with PFC.

This cryoprotectant is to prevent the formation of large ice crystals within & outside the cell structure which will pierce & damage the cell membrane and kill the cells. It also protects the cells from dehydration that may occur by replacing the water within the cells & damage the cellular structure.

The cryoprotectant helps flash freezing or Vitrification to -18 degree of the body using a blast freezer without lethal ice crystal formation.

This process is mainly used to keep the dead animated for a longer period for a few days & cure their cause of death effectively if possible.

This maintains the core temperature of the body at -18 degrees Celsius.

The cooled cryoprotectant solution is continuously oxygenated and kept circulating in the body using an ECMO Machine.

Oxygen dissolved in cryo solution is very less as compared with blood, but enough for the now frozen brain cells if required.

Since, 5% Metabolism of the cells falls with every degree Celsius drop in temperature. Our general body temperature is 37 degrees Celsius. Therefore, chilling the core body temperature to -18 degrees practically stops all physical, chemical & biological processes at the cellular level of the body.

The body is thus put in a state of suspended animation which arrest all of the metabolic activities. In this state of suspended animation, the defect that caused death is rectified. For example, if death was due to a cardiac arrest the blood vessels of/near the heart are cleared. If the death was due to gunshot or stabbing the wound and organ is repaired artificially and sutured. If the death was due to an accident, the trauma borne parts are repaired surgically. If the death was due to poisoning the poison is completely flushed out of the system. It can also be a bridge towards organ transplant till the matching donor organ becomes available. Special surgical equipment’s may be needed to operate as the dead body is frozen stiff and is hard like stone at -18 degrees.

Once the cause of the death has been cured, the body is moved to room temperature & is slowly thawed back by placing it in a water bath.

The cryoprotectant solution is pumped out and replaced by warm blood at 30 degrees. The heart is given a jump start to beating by electrical shock to begin beating. Patient is thawed slowly & steadily to the normal 37 degrees @ 0.5 degrees per hour.

Once the hearts start beating back on its own the patient may be provided with a mechanical ventilator for a few days/weeks to assist breathing. After the patient is fully recovered from whatever was his cause of death & fit & fine. He can be discharged from the hospital if all the vital parameters are back to normal.

This procedure is less preferred over 10-degree saline solution process as cryoprotectants are toxic to some extent. Freezing also has a drawback of ice crystal formation danger. It is best if the patient is revived within a few hours after death using the 10-degree procedure. More time the dead body is kept in suspended animation, lesser are the chances of bringing it back to life as degradation still begins at a microscopic level.

This procedure may also be related to cryonics wherein the dead patient is vitrified to a glass like phase and ultimately stored in liquid nitrogen at -196 degrees with a vision to resurrect them someday in the future. However, no dead cryonic patient is yet known to be successfully reanimated till date. Thus if this procedure is used then the chances of bringing back the dead body back again to life is minimal, taking into account the technology available today.

The PIG Experiment

A pig has been used as a subject for this experiment. All the blood from the live pig as pumped out from a major artery (aorta), leaving the pig without any heartbeat or respiration. Inducing a cardiac arrest, a vital vein (jugular vein) on the pig was also cut to mimic an external trauma. Basically an uncontrolled lethal haemorrhage. Essentially the definition for clinical death.

Then the pigs dead body was constantly circulated with oxygenated saline solution /electrolyte solution cooled at 10 degrees Celsius. PH around 5.5. This solution can be reinforced by perfluorocarbons (PFC are artificial oxygen carriers) or RBC’S – Red Blood Cells of the correct blood group suspended in it to maximize its oxygen carrying capacity. The chest cavity is opened. The cold solution is pumped into the aorta. Arteries leading downward in the body are clamped to make sure that the brain & heart get this cold solution first. Then this clamp is removed allowing the full body to receive the cold solution. At this point the body will have no pulse, no blood pressure, no heartbeat, no respiration & no brain activity. That is the clinical definition of death. The cut major vein was sown up & repaired through which the saline solution /blood loss was bound to happen.

After thawing the pig back slowly to 38 degrees at the rate of 0.5 degree per hour, to prevent any reperfusion injury the heart may start beating again on its own. Or the heart can be jump started with electrical shocks, the pigs fully recovered from clinical death. The pig may require assisted breathing or a ventilator for a few days to normalize heart & respiration rhythms.

The pigs were earlier trained to identify different colours & smells, prior to death, they retained the same ability & memory even after resuscitation. This proves that there was no major brain damage or neurological impairments sustained because of this procedure.

Results

The results were quite encouraging. On an average 90% i.e. 9 out of 10 pigs survived this gruelling procedure. It is observed that, time can be brought to a halt for the patients for a few hours with use of extreme hypothermia and all activities of the body at the cellular level freezes and can be made to come to a standstill. They can be basically frozen in time.

Using these results as a blueprint dead humans can be immediately cooled rapidly after death preserving their cellular structure intact and be gradually thawed back to life after fixing their reason for death. If the cause of death was a major blood loss due to a traumatic injury or accident, then blood transfusion can be done to recompense for this lost blood.

This experiment on being performed on farm animals, especially pigs, as the anatomy of pigs is similar to humans. If the brain cells of human beings remain intact to some extent by use of low temperatures, they can be revived with no or minimal neurological damage. No memory would be lost & there would be no brain impartments.

This technique should be actively implemented mainly on young patients who unfortunately die early from repairable causes, to grant them a second chance at life. These results can act as a small boost in the field of cryonics freezing patients in liquid nitrogen at -196 degrees or freezing patients for inter galactic travel in future. But this is just a baby step, and it may have many other encouraging future applications also.

Discussions

Apparatus required in the emergency Cryo ICU are:

  1. Temperature Controlled ICU Chamber at 10 degrees with or without a blast freezer.
  2. 9 Concentration NaCl Sodium Chloride Saline solution which may be suspended with at least 20% perfluorocarbons.
  3. AV Artery Venous ECMO Device (Extracorporeal membrane oxygenation) or Heart Lung Machine with attached pump to perform the functions of both the heart & lungs.
  4. Cooler, Heat Exchanger & Condenser System etc. connected to the ECMO to keep the circulating saline solution at 10 degrees continuously.
  5. IV – Intravenous Cannulas to insert directly into the aorta to pump the blood out & cold solution in and out rapidly.
  6. Water bath which can be increased to a temperature of 37 degrees in another chamber to increase the body temperature slowly to avoid any reperfusion injury.

Warmed blood, the body should be thawed slowly at a rate of 0.5 degree per hour. (medium thawing) Trained personal in Cryo Cooling Science.

Apparatus required in the Emergency Mobile Cryo Ambulance:

  1. Cooling Pads or Cooling bag filled with with cold gel or circulating cold fluids to cover & cool the entire dead body, especially the head immediately.
  2. Automated chest compression machine to perform CPR to maintain the blood circulation.
  3. Supplementary Oxygen from cylinder to provide artificial respiration.
  4. Anti-blood clotting injections such as Heparin.

The patient must be reached as soon as possible to the Cryo ICU at the hospital after on site stabilisation by the paramedics.

Apparatus in Cryo First Aid Kit:

  1. Lots of Ice to at least cover the head of the dead body. The more part of the dead body covered with ice the better. This will slow down organ damage.
  2. CPR to be performed manually.
  3. Artificial mouth to mouth breathing to be given every 7-10 seconds.

It is very important to begin all these procedures immediately after death on the cadaver.

More the time lost before therapeutic cooling less are the chances of resurrecting the dead patient. At most a dead patient can be resurrected 1 hour after death in normal circumstances. Because brain cell death & neurological damage begins within 10 minutes the body stops receiving oxygen. Other vital organs & tissues also suffer from oxygen deprivation at normal temperatures. As time is lost, even after bringing back the dead body to life, the patient may have to live lifelong with irreversible brain damage. It is almost impossible to bring back to life someone who has been dead and warm for 10-12 hours. As the old saying goes “You are not dead until warm & dead”.

Bringing back the dead to life using cryo technique is more suitable for young dead bodies under the age of 60 years. This is because their systems are generally more robust to handle the strain of this procedure. This procedure is not efficient in people with terminal incurable illness like end stage cancer or HIV/AIDS as they are deemed to die again soon even if brought back to life by using this procedure\ temporarily. Therefore, a do not rusticate code may be practiced with such patients.

Conclusion

From the above research it may be concluded that, immediate cooling especially of the head, should be applied as a standard operating procedure at once after death is confirmed.

This cooling may be performed by any frozen material available at hand on site such as ice, cold water bags or even frozen food packets until the paramedics arrive. Even a Cryo Cooling Machine which can double up as a common food refrigerator when not in use may be purchased & kept handy for this purpose in every household & commercial establishment.

Every ambulance must be compulsorily equipped with the above suggested basic cryo cooling kit, to safely regulate the dead patients’ temperature until reaching the Cryo ICU at the earliest.

At the Cryo ICU the trained team of doctors, surgeons, super specialists, perfusionists, nurses, etc. should revive the dead patient using the most advanced technology as stated in this article & reverse death.

This procedure of Cryo Resurrection should be strictly adopted at all major medical facilities especially on the unfortunate young dead patients. In this way we can give the dead a second chance by bringing them back to life.

Declaration of Conflicting Interest

The author declares that there is no conflict of interest.

Funding

Due to lack of Funds, this research project could not be completed & had to be abandoned.

This research received no specific grant from any funding agency in the public, commercial, or not-for-profit sectors.

Acknowledgements

I would like to take this opportunity to thank my mother Mrs Sathi Devi Menon who is always by my side rock solid and is also my biggest supporter. To my father Mr KRK Menon who struggled for years to provide the best education to me as a child. Without their unrelenting cooperation & support this research would have never been possible [1-7].

References

  1. Samuel A. Tisherman. Emergency Preservation and Resuscitation for cardiac arrest from trauma (EPR-CAT). University of Maryland School of Medicine. [crossref]
  2. Dr Phil Jaekl. Curiosities of Medical History: The controversy of using cold as a treatment – Medical News today.
  3. Hasan BA. Learning and memory is preserved after induced asanguineous hyperkalemic hypothermic arrest in a swine model of traumatic exsanguination. [crossref]
  4. Safar P, Brown T, Holtey W (1961) Ventilation and circulation with closed chest cardiac massage in man. JAMA 176: 574-576. [crossref]
  5. Rhee PM, Acosta J, Bridgeman A, Wang D, Jordan M, et al. (2000) Survival after emergency department thoracotomy: review of published data from the past 25 years. Journal of the American College of Surgeons 190: 288-298. [crossref]
  6. Samuel AT, Hasan BA, Peter MR, Thomas MS, Tomas D et al. Development of the emergency preservation and resuscitation for cardiac arrest from trauma clinical trial. [crossref]
  7. Peter Rhee (2000) Induced Hypothermia during Emergency Department Thoracotomy: An Animal Model. The Journal of trauma 48: 439-447.
fig 1

Metformin Use and Mortality among Prostate Cancer Patients

DOI: 10.31038/IMROJ.2021654

Abstract

Purpose: Limited research has been conducted on the long-term use of metformin in patients with and without diabetes. Metformin is considered one of the most effective and affordable drugs used in patients with diabetes. However, only a few studies have examined the effects of metformin on prostate cancer mortality. This study aimed to understand the impact of metformin use on prostate cancer mortality among men, adjusted for diabetes.

Methods: SEER-Medicare data between 2007 and 2013 were used to extract demographic information from patients and cancer characteristics, including age, race, marital status, comorbidities (i.e., diabetes), and metformin use. Descriptive statistical analysis and logistic regression were performed to investigate the association between mortality rates (12, 60, and 120 months) and metformin use in men with prostate cancer with and without diabetes.

Results: We identified 222,289 prostate cancer patients enrolled in Medicare Part D. Among them, 17% received metformin, and 35% were diagnosed with diabetes. Among metformin users, a significantly higher proportion of cancer patients had diabetes (34.75%). Prostate cancer patients who took metformin had 0.54(AOR: 95% CI: 0.48-0.61), 0.58 (AOR: 95% CI: 0.55-0.62), and 0.56 (AOR: 95% CI: 0.54-0.59) lower odds of dying at 12 months, 60 months, and 120 months since the first diagnosis of prostate cancer than those without using metformin.

Conclusion: Metformin is one of the most commonly used diabetes treating agents. However, few studies have examined its role in treating prostate cancer. Our study showed that patients with prostate cancer who received metformin had a higher mortality rate than those who did not. Further studies are needed to determine whether metformin can positively affect patients with prostate cancer.

Keywords

Diabetes mellitus, Elderly, Metformin, Mortality, Prostate cancer, SEER-Medicare

Introduction

According to the Centers for Disease Control and Prevention (CDC), prostate cancer in the United States is the second leading cause of death, surpassed by heart disease, and one of the top four common cancers [1]. Furthermore, it is also one of the leading causes of cancer death among men of all races and populations of Hispanic origin populations [2,3]. Research from the Prostate Cancer Foundation revealed information about the probability that African American men are about 1.6 times more likely than all other men to get prostate cancer and twice more likely to die from it [4]. Specifically, approximately more than 200,000 new cases of prostate cancer were reported among men in 2017, and more than 30,000 men died from this cancer [5]. The Mayo Clinic estimates that approximately 60% of older adults (50 years or older) are at an increased risk of developing prostate cancer [6].

Diabetes mellitus is one of the most common comorbidities in patients with prostate cancer patients [7-9]. Diabetes is associated with an increased incidence of prostate cancer and mortality due to prostate cancer-specific mortality and/or all-cause mortality [10]. However, the biological link between diabetes and prostate cancer is poorly understood [11].

According to the American Diabetes Association, metformin is an inexpensive generic drug used to treat diabetes [12]. Recently, physicians have widely prescribed metformin because of its specific effects in treating and curing diabetes [13,14] as well as to prevent the development of diabetes [15].

Recent studies have shown that metformin can be used to reduce cancer incidence and mortality [16-19]. However, little is known regarding metformin in patients with prostate cancer. The results of studies evaluating the role of metformin in prostate cancer are contradictory. There are different perspectives on whether metformin use improves or deteriorates health conditions. One study showed that patients with diabetes mellitus taking metformin had a lower risk of prostate cancer [20]. However, a study conducted in Toronto found that metformin use is associated with an increased risk of being diagnosed with prostate cancer [21]. Another study suggested that metformin did not have proven benefits in cancer cells [22]. In 2020, the U.S. Food and Drug Administration (FDA) conducted recalls for different types of metformin. In other words, the FDA has not approved the use of certain types of metformin for patients with diabetes, as it can cause lactic acidosis [23]. Given these conflicting findings and the generally limited research, this study aimed to examine the association between metformin use and prostate cancer mortality, adjusted for diabetes status in patients. This study aimed to obtain data from Medicare beneficiaries (Medicare) and Surveillance, Epidemiology, and End Results (SEER).

Methods

Study Design and Data Source

Our study is a secondary analysis of merged data from the SEER and Medicare datasets, Medicare beneficiaries (Medicare), and Surveillance, Epidemiology, and End Results (SEER). The National Cancer Institute sponsors the SEER program [24]. Additionally, the dataset provided information on different stages of cancer and was designed to track cancer incidence and mortality rates in the United States [25]. Staging information is based on classification schemata that vary according to cancer site and year of diagnosis [26]. The SEER dataset also covers diverse populations with detailed cancer-related diagnoses and social demographics and covers more than 26% of the U.S. population in different demographics [26,27].

fig 1

Figure 1: Flow chart for the inclusion and exclusion of studies among Medicare beneficiaries diagnosed with diabetes and incident prostate cancer

The Medicare dataset consists of claim data and billing information, including inpatient, outpatient, and home health information [28]. Medicare is the primary health insurer for over 90% of the U.S. population aged 65 years and older in the U.S. [29]. All Medicare data were de-identified to protect patient information so that no protected health information could be traced to individual patients.

Combining the two datasets represents over 20% of the U.S. population from 1991 to 2013 (What Is SEER?, n.d.) [27]. The merging of the two datasets, SEER and Medicare claims, allows for a longitudinal analysis of cancer patients’ healthcare utilization and health outcomes.

Sample Selection

Our study included 222,289 patients, and all male patients aged 66 years and older who had prostate cancer diagnoses between January 1, 2007, and December 31, 2013, were selected from SEER-Medicare. Patients were excluded if their cancer diagnosis date was missing, death occurred before cancer diagnosis, or there was no follow-up medical care. We also excluded patients identified as having cancer through a death certificate. Furthermore, patients were excluded if they did not enroll in Medicare Part A, B, or D during the study follow-up. Some people may want to enroll in Medicare later could be that they have to pay a premium for Part A. It is also possible that a person who contributes to a health savings account (HSA) may consider delaying Medicare Part A [30]. Exclusion criteria were used to ensure that the long-term prostate cancer survivors/medication use data were complete for all patients. There were no missing values for age, metformin use, or diabetes based on the inclusion criteria. However, 27,188 (12.23%) individuals were classified as unknown for marital status, and 1,314 (0.59%) did not disclose their race/ethnicity.

Measures

Long-term prostate cancer survivors were defined as those who survived for >12 months after being diagnosed with prostate cancer [31,32]. Mortality at 12, 60, and 120 months was the key dependent variable in this study. Our study design also included the analysis of patients who survived more than 60 and 120 months after being diagnosed with prostate cancer. The initial selection of independent variables was based on both current data and existing literature [14,22]. Metformin use was a key independent variable. Most independent variables were categorized as binary variables. For example, age at diagnosis was divided into two different age groups, 66-74 and 75 years or older. Race/ethnicity was classified into four types: white non-Hispanic, black, Hispanic, and others. The five contrasting marital statuses were single, married, separated/divorced, widowed, and unknown. The presence of diabetes was identified using at least one hospital visit or more than one physician visit, with a primary or secondary diagnosis code for diabetes. The physician used several ICD-codes to identify diabetes, such as ICD-9-CM codes: 250.x0 or 250.x2. Diagnosis codes were extracted from Medicare Provider Analysis and Review (MEDPAR), carrier claims (NCH), and outpatients (OUTPAT). Metformin use was extracted from Part D Event (PDE).

Statistical Analysis

Descriptive statistics analysis using the chi-square test was used to investigate the association between mortality at 12, 60, and 120 months and each independent variable. Specifically, we examined the risk factors for patient mortality (12, 60, and 120 months) after being first diagnosed with prostate cancer and metformin use among men with prostate cancer. Additionally, we evaluated the mortality rates among those who used metformin and were diagnosed with incident prostate cancer with and without diabetes. Bivariate analyses examined the differences between basic demographic variables, metformin use, prostate cancer, diabetes, and mortality. Logistic regression models were built to estimate the direction and size of the association between live length and metformin use. Logistic regression was used to analyze the relationship between diabetes and mortality among metformin users. Several covariates, including age, race/ethnicity, and marital status, were used to adjust these models to estimate adjusted odds ratios and 95% confidence intervals for mortality of prostate cancer patients with or without diabetes using metformin.

Results

Baseline Characteristics

Table 1 shows the characteristics of the sample and bivariate associations between metformin use status and each independent variable and diabetes. The study sample included 222,289 patients with prostate cancer. Most of the patients were in the age group 66-74 116,344 (52.34%), and non-metformin users 96,654 (83.08%). In our study, there were more white non-Hispanic 170,598 (76.7%), and among the total population, there were more married 147,081 (66.17%) compared to other races and marital status. A significantly higher proportion of metformin users (32,076 patients) were diagnosed with diabetes, while there was still a high proportion of patients; 60,219 non-metformin users also had diabetes. Significant associations were also observed between diabetes, race/ethnicity, and white non-Hispanic individuals who were more likely to use metformin.

Table 1: Characteristics of the patient in a cohort of older adults with prostate cancer: SEER-Medicare database, 2007-2013.

Characteristics

Overall sample

n (%)

Metformin users

n (%)

Non-metformin

users n (%)

P-value

Unweighted Observations

n=222,289 (100%)

n=37,500 (16.87%) n=184,789 (83.13%)
Age

 <0.476

66-74

116,344 (100%)

19,690 (16.92%)

96,654 (83.08%)

75 or older

105,945 (100%)

17,810 (16.81%)

88,135 (83.19%)

Diabetes

<0.001

Yes

92,295 (100%)

32,076 (34.75%)

60,219 (65.25%)

No

129,994 (100%)

5,424 (4.17%)

124,570 (95.83%)

Race/Ethnicity

<0.001

White non-Hispanic

170,598 (100%)

26,181 (15.35%)

144,417 (84.65%)

Black non-Hispanic

29,344 (100%)

6,047 (20.61%)

23,297 (79.39%)

Hispanic

6,098 (100%)

1,666 (27.32%)

4,432 (72.68%)

Other

16,249 (100%)

3,606 (22.19%)

12,643 (77.81%)

Marital Status

<0.237

Married

147,081 (100%)

24,851 (16.90%)

122,230 (83.10%)

Unmarried

15,675 (100%)

2,676 (17.07%)

12,999 (82.93%)

Divorced /Separated

32,345 (100%)

5,338 (16.50%)

27,007 (83.50%)

Unknown

27,188 (100%)

4,635 (17.05%)

22,553 (82.95%)

Table 2 presents descriptive statistics of the sample with the three different outcomes, mortality at 12 months, 60 months, and 120 months among patients with prostate cancer patients. Age, race/ethnicity, marital status, metformin use, and diabetes were statistically significant differences (p-value < 0.05) for the three outcomes: 12 months mortality, 60 months mortality, and 120 months mortality after being diagnosed with prostate cancer. A total of 219,551 (98.77%) patients survived more than 12 months, and 2,738 (1.23%) died. There were 204,579 (93.18%) patients who survived more than 60 months, and 14,972 (6.82%) did not survive more than 60 months. There were 184,433 (90.15%) patients who survived more than 120 months, and 20,146 (9.85%) did not survive more than 120 months after being first diagnosed with prostate cancer.

Table 2: Descriptive statistics for mortality at 12 months, 60 months, and 120 months

Variables

One-Year Mortality (12 months) P-value Five-Year Mortality (60 months) P-value Ten-Year Mortality (120 months)

P-value


Yes

n (%)

No

n (%)

  Yes

n (%)1

No

n (%)0

  Yes

n (%)

No

n (%)


Age

<0.001

<0.001

<0.001

66-74

1,524 (1.31%)

114,820 (98.69%) 8,008 (6.97%) 106,812 (93.03%) 10,073 (9.43%)

96,739 (90.57%)

75 or older

1,214 (1.15%)

104,731 (98.85%) 6,964 (6.65%) 97,767 (93.35%) 10,073 (10.30%)

87,694 (89.70%)

Race

0.034

<0.001

<0.001

White-non-Hispanic

2,089 (1.22%)

168,509 (98.78%) 11,294 (6.70%) 157,215 (93.30%) 15,271 (9.71%)

141,944 (90.29%)

Black-non-Hispanic

383 (1.31%)

28,961 (98.69%) 2,176 (7.51%) 26,785 (92.49%) 2,912 (10.87%)

23,873 (89.13%)

Hispanic

92 (1.51%)

6,006 (98.49%) 495 (8.24%) 5,511 (91.76%) 637 (11.56%)

4,874 (88.44%)

Other

174 (1.07%)

16,075 (98.93%) 1,007 (6.26%) 15,068 (93.74%) 1,326 (8.80%)

13,742 (91.20%)

Marital Status

<0.001

<0.001

0.002

Married

1,733 (1.18%)

145,348 (98.82%) 9,617 (6.62%) 135,731 (93.38%) 13,380 (9.86%)

122,351 (90.14%)

Unmarried

185 (1.18%)

15,490 (98.82%) 1,124 (7.26%) 14,366 (92.74%) 1,419 (9.88%)

12,947 (90.12%)

Separated/ Divorced

373 (1.15%)

31,972 (98.85%) 2,136 (6.68%) 29,836 (93.31%) 3,061 (10.26%)

26,775 (89.74%)

Unknown

447 (1.64%)

26,741 (98.36%) 2,095 (7.83%) 24,646 (92.17%) 2,286 (9.28%)

22,360 (90.72%)

Metformin

<0.001

<0.001

<0.001

No

2,408 (1.30%)

182,381 (98.70%) 12,919 (7.08%) 169,462 (92.92%) 17,352 (10.24%)

152,110 (89.76%)

Yes

330 (0.88%)

37,170 (99.12%) 2,053 (5.52%) 35,117 (94.48%) 2,794 (7.96%)

32,323 (92.04%)

Diabetes

<0.001

<0.001

<0.001

No

1,433 (1.10%)

128,561 (98.90%) 7,469 (5.81%) 121,092 (94.19%) 10,106 (8.35%)

110,986 (91.65%)

Yes

1,305 (1.41%)

90,990 (98.59%) 7,503 (8.25%) 83,487 (91.75%) 10,040 (12.03%)

73,447 (87.97%)

Most of the patients aged 66 to 74 survived for over one year with a p-value = 0.001). With five-year mortality, most patients survived more than five years after being diagnosed with prostate cancer (p = 0.001). The third result showed that most of the patients stayed alive for more than 120 months, with a p-value of 0.001.

Race/ethnicity was statistically significant among the three outcomes, 12 months mortality (p-value=0.034), 60 months mortality (p-value < 0.001), 120 months mortality (p < 0.001) after the first diagnosis of prostate cancer. Among the same race/ethnicity, most patients, whether white-no Hispanic, black-no Hispanic, Hispanic, or other non-Hispanic, have survived more than half of the population for 12 months after being first diagnosed with prostate cancer.

Metformin use and mortality outcomes were statistically significant (p < 0.001). For the second outcome, the age group between 66 and 74 years had more than half of the population, and 106,812 (93.03%) survived more than 60 months after the first diagnosis of prostate cancer. Among the same race/ethnicity, most patients survived more than 60 months after the first diagnosis of prostate cancer, with a p-value of 0.001. Marital status was statistically significant for all three outcome variables, with a p-value of less than 0.005. The diabetes variables were also statistically significant for the three outcomes, with a p-value less than 0.001. Based on the three different outcomes of logistic regression, most patients survived for > 12, 60, and 120 months.

Table 3 describes the AOR for mortality at 12, 60, and 120 months in patients with prostate cancer treated with metformin. For this subgroup, metformin use between 66 and 74 years was 0.54 (95% CI: 0.48-0.61), 0.58 (95% CI: 0.55-0.62), 0.56 (95% CI:0.53-0.59) times less likely to die after prostate cancer was diagnosed within 12 months, 60 months, 120 months than those who were older than 74 years, respectively. Patients with diabetes were 1.49 (95% CI: 1.38-1.62), 1.64 (95% CI: 1.59-1.70), 1.66 (95% CI:1.60-1.72), 1.74 (95% CI: 1.69-1.79) times more likely to die after being diagnosed with prostate cancer within 12 months and 60 months, and 120 months compared to those without diabetes. Patients taking metformin were 0.54 (95% CI 0.48-0.61), 0.57 (95% CI 0.55-0.62), 0.56 (95% CI: 0.54-0.59) times less likely to die after prostate cancer compared to those who did not take metformin, respectively. Furthermore, black non-Hispanics had an AOR of 1.06 (95% CI: 1.01-1.11), 1.06 (95% CI: 1.02-1.11) times more likely to die within five years and ten years after the first diagnosis of prostate cancer. Hispanics are 1.19 (95% CI: 1.09-1.31) and 1.16 (95% CI: 1.06-1.26) times more likely to die within five and ten years after being diagnosed with prostate cancer than other races/ethnicities. The other marital status groups are 1.10 (95% CI: 1.03-1.17) times less likely to die after being diagnosed with prostate cancer. Otherwise, other marital statuses were not statistically significant.

Table 3: Adjusted odds ratios for mortality at 12 months, 60 months, and 120 months among prostate cancer patients.

Variables

One-Year Mortality (12 months) Five-Year Mortality (60 months) Ten-Year Mortality (120 months)
  OR 95% CI OR 95% CI OR

95% CI

Age
66-74

0.85

0.79-0.92* 0.94 0.91-0.97* 1.10

1.07-1.13*

75 or older

(ref.)

(ref.)

(ref.)

Race/Ethnicity
White-non-Hispanic

(ref.)

(ref.)

(ref.)

Black-non-Hispanic

1.02

0.91-1.14 1.06 1.01-1.11* 1.06

1.02-1.11*

Hispanic

1.21

0.98-1.50 1.19 1.09-1.31* 1.16

1.06-1.26*

Other

0.87

0.74-1.02 0.91 0.85-0.97* 0.87

0.82-0.93*

Marital Status
Married

(ref.)

(ref.)

(ref.)

Unmarried

0.99

0.85-1.16 1.10 1.03-1.17* 1.00

0.94-1.06

Separated/ Divorced

0.99

0.89-1.11 1.01 0.96-1.06 1.03

0.98-1.07

Metformin
No

(ref.)

(ref.)

(ref.)

Yes

0.54

0.48-0.61* 0.58 0.55-0.62* 0.56

0.54-0.59*

Diabetes
No

(ref.)

(ref.)

(ref.)

Yes

1.49

1.38-1.62* 1.66 1.60-1.72* 1.74

1.69-1.79*

Discussion

The age at diagnosis is an important predictor of prostate cancer mortality. Race/ethnicity can include various major risk factors such as genetic factors, medical practices such as screening, and complete reporting. Furthermore, there is conflicting evidence regarding the relationship between metformin use and mortality in patients with prostate cancer patients (He et al., 2019)33. The present study provides additional evidence that metformin use reduces the likelihood of mortality in patients with prostate cancer, regardless of diabetes. This finding is consistent with the existing evidence in the literature reviews that we found [33-36].

Furthermore, the results of this study showed that unmarried men were more likely to die within 60 months than married men. The findings showed that family support plays an important role in cancer outcomes; however, more research is needed to study the difference between different years of mortality versus unmarried status. Among metformin users, patients with diabetes have higher odds of mortality than those without diabetes. This may be due to the fact that metformin is the first-line medicine for diabetes. These findings support the notion that metformin is beneficial. These results indicate that metformin users with diabetes and prostate cancer are less likely to die. This finding may have been biased because we considered diabetes the only comorbidity in our analysis. Other comorbidities and diabetes may play a complex role in cancer-related mortality.

This observational study had several limitations. First, our study population included Medicare beneficiaries aged over 65 years. However, our findings may not be generalizable to younger age groups. Second, diabetes and cancer are two common diseases that are complex and have several subtypes. This study did not consider the different types or severity of diabetes, and other comorbidities were not included in the analysis. Therefore, this study may have excluded important risk factors related to patient outcomes. Furthermore, this study did not consider several important factors such as possible individual exposure to different types of treatment with an optimal potential dose, schedule, and duration of metformin treatment, which can contribute to different clinical outcomes.

Despite the study’s limitations, our study used a large sample size to identify the association between mortality due to metformin use among prostate cancer patients with or without diabetes. In general, metformin decreased the mortality of some patients with prostate cancer at 12, 60, and 120 months.

Conclusion

This study provides evidence that metformin use can reduce the mortality risk among patients with prostate cancer, including those with diabetes. The results showed that age, metformin use, and comorbidities influence prostate cancer. Socioeconomic disparities and prolonged use of metformin may explain the differences in mortality. Even the fact that metformin is an inexpensive drug with few side effects and anticancer effects in many types of cancer. Low socioeconomic status may explain why some patients have difficulty accessing treatment. Previous results concluded that our research identified population segments that may benefit from targeted interventions.

More studies, such as clinical trials, are needed to provide evidence of the effectiveness of metformin in patients with prostate cancer. Furthermore, we found a correlation between metformin and mortality in prostate cancer by adding additional information on comorbidities and various disparities. With more variables included in future research, more value can be added to identify better treatment options for older adults.

References

  1. Cancer Statistics—National Cancer Institute (nciglobal, ncienterprise) (2015) https://www.cancer.gov/about-cancer/understanding/statistics
  2. CDCBreastCancer (2021) Prostate Cancer Statistics. Centers for Disease Control and Prevention https://www.cdc.gov/cancer/prostate/statistics/index.htm
  3. Xiao H, Tan F, Goovaerts P, Adunlin G, Ali AA, et al. (2016) Impact of Comorbidities on Prostate Cancer Stage at Diagnosis in Florida. American Journal of Men’s Health 10: 285-295. [crossref]
  4. Prostate cancer in Black men: Risk factors, symptoms, and more. (2021) https://www.medicalnewstoday.com/articles/prostate-cancer-in-black-men
  5. USCS Data Visualizations. (n.d.). Retrieved March 31 (2021) from https://gis.cdc.gov/grasp/USCS/DataViz.html
  6. Prostate cancer—Symptoms and causes. (n.d.) (2021) Mayo Clinic. from https://www.mayoclinic.org/diseases-conditions/prostate-cancer/symptoms-causes/syc-20353087
  7. Ng HS, Koczwara B, Roder D, Vitry A (2018) Development of comorbidities in men with prostate cancer treated with androgen deprivation therapy: An Australian population-based cohort study. Prostate Cancer and Prostatic Diseases 21: 403-410. [crossref]
  8. Roy S, Vallepu S, Barrios C, Hunter K (2018) Comparison of Comorbid Conditions Between Cancer Survivors and Age-Matched Patients Without Cancer. Journal of Clinical Medicine Research 10: 911-919. [crossref]
  9. Tseng (2011) Diabetes and Risk of Prostate Cancer. Diabetes Care 34: 616-621. [crossref]
  10. Feng X, Song M, Preston MA, Ma W, Hu Y, et al. (2020) The association of diabetes with risk of prostate cancer defined by clinical and molecular features. British Journal of Cancer 123: 657-665. [crossref]
  11. DeNoon DJ (2021) Why Does Diabetes Raise Cancer Risk? WebMD. from https://www.webmd.com/diabetes/news/20100616/why-does-diabetes-increase-cancer-risk
  12. Suissa S, Azoulay L (2014) Metformin and Cancer: Mounting Evidence Against an Association. Diabetes Care 37: 1786-1788. [crossref]
  13. Saraei P, Asadi I, Kakar MA, Moradi-Kor N (2019) The beneficial effects of metformin on cancer prevention and therapy: A comprehensive review of recent advances. Cancer Management and Research 11: 3295-3313. [crossref]
  14. Wright JL, Stanford JL (2009) Metformin use and prostate cancer in Caucasian men: Results from a population-based case–control study. Cancer Causes & Control 20: 1617. [crossref]
  15. What Diabetes Drugs Improve Insulin Sensitivity? (n.d.). (2021) WebMD. from https://www.webmd.com/diabetes/diabetes-drugs-insulin-sensitivity
  16. Clements A, Gao B, Yeap SHO, Wong MKY, Ali SS, et al. (2011) Metformin in prostate cancer: Two for the price of one. Annals of Oncology 22: 2556-2560. [crossref]
  17. Hankinson SJ, Fam M, Patel NN (2017) A review for clinicians: Prostate cancer and the antineoplastic properties of metformin. Urologic Oncolog 35: 21-29.
  18. Nobes JP, Langley SEM, Klopper T, Russell-Jones D, Laing RW (2012) A prospective, randomized pilot study evaluating the effects of metformin and lifestyle intervention on patients with prostate cancer receiving androgen deprivation therapy. BJU International 109: 1495-1502. [crossref]
  19. Whitburn J, Edwards CM, Sooriakumaran P (2017) Metformin and Prostate Cancer: A New Role for an Old Drug. Current Urology Reports 18: 46.
  20. Zaidi S, Gandhi J, Joshi G, Smith NL, Khan SA (2019) The anticancer potential of metformin on prostate cancer. Prostate Cancer and Prostatic Diseases 22: 351-361. [crossref]
  21. Lee MJ, Jayalath VH, Xu W, Lu L, Freedland SJ, et al. (2021) Association between metformin medication, genetic variation and prostate cancer risk. Prostate Cancer and Prostatic Diseases 24: 96-105. [crossref]
  22. Raval AD, Mattes MD, Madhavan S, Pan X, Wei W, et al. (2016) Association between Metformin Use and Cancer Stage at Diagnosis among Elderly Medicare Beneficiaries with Preexisting Type 2 Diabetes Mellitus and Incident Prostate Cancer. Journal of Diabetes Research e2656814. [crossref]
  23. Research C (2019) FDA Drug Safety Communication: FDA revises warnings regarding use of the diabetes medicine metformin in certain patients with reduced kidney function. FDA. https://www.fda.gov/drugs/drug-safety-and-availability/fda-drug-safety-communication-fda-revises-warnings-regarding-use-diabetes-medicine-metformin-certain
  24. Beebe-Dimmer JL, Fryzek JP, Yee CL, Dalvi TB, Garabrant DH, et al. (2016) Mesothelioma in the United States: A Surveillance, Epidemiology, and End Results (SEER)–Medicare investigation of treatment patterns and overall survival. Clinical Epidemiology 8: 743-750.
  25. Daly MC, Paquette IM (2019) Surveillance, Epidemiology, and End Results (SEER) and SEER-Medicare Databases: Use in Clinical Research for Improving Colorectal Cancer Outcomes. Clinics in Colon and Rectal Surgery 32: 61-68. [crossref]
  26. Ambs A, Warren JL, Bellizzi KM, Topor M, Haffer SC, et al. (2018) Overview of the SEER—Medicare Health Outcomes Survey Linked Dataset. Health Care Financing Review 29: 5-21. [crossref]
  27. What Is SEER? – National Cancer Institute (nciglobal, ncienterprise). (n.d.). [CgvInfographic]. Retrieved March 31, 2021, from /research/areas/public-health/what-is-seer-infographic
  28. CMS announces new payment model to improve quality, coordination, and cost-effectiveness for both inpatient and outpatient care | CMS. (n.d.). Retrieved July 5, 2020, from https://www.cms.gov/newsroom/press-releases/cms-announces-new-payment-model-improve-quality-coordination-and-cost-effectiveness-both-inpatient
  29. Moon M (1996) What Medicare Has Meant To Older Americans. Health Care Financing Review 18: 49-59.
  30. Fact Sheet: Deciding whether to enroll in Medicare Part A and Part B when you Turn 65. (n.d.). FACT SHEET, 15.
  31. Brenner H, Arndt V (2016) Long-Term Survival Rates of Patients with Prostate Cancer in the Prostate-Specific Antigen Screening Era: Population-Based Estimates for the Year 2000 by Period Analysis. Journal of Clinical Oncology https://doi.org/10.1200/JCO.2005.11.148
  32. Stokes ME, Black L, Benedict Á, Roehrborn CG, Albertsen P (2010) Long-term medical-care costs related to prostate cancer: Estimates from linked SEER-Medicare data. Prostate Cancer and Prostatic Diseases 13: 278-284. [crossref]
  33. He K, Hu H, Ye S, Wang H, Cui R, et al. (2019) The effect of metformin therapy on incidence and prognosis in prostate cancer: A systematic review and meta-analysis. Scientific Reports 9: 2218.
  34. Bo S, Ciccone G, Rosato R, Villois P, Appendino G, et al. (2012) Cancer mortality reduction and metformin: A retrospective cohort study in type 2 diabetic patients. Diabetes, Obesity and Metabolism. 14: 23-29. [crossref]
  35. Landman GWD, Kleefstra N, Hateren KJJ, Groenier KH, Gans ROB, et al. (2010) Metformin Associated With Lower Cancer Mortality in Type 2 Diabetes: ZODIAC-16. Diabetes Care 33: 322-326. [crossref]
  36. Zingales V, Distefano A, Raffaele M, Zanghi A, Barbagallo I, et al. (2017) Metformin: A Bridge between Diabetes and Prostate Cancer. Frontiers in Oncology 7: 243.