Abstract
310 respondents each evaluated 60 unique vignettes (combinations of messages) about ethnic foods, the messages presenting information about the country of origin, when and why the food is eaten, and the benefit if the ethnic food goes ‘mainstream’, and the issues about food safety. Respondents each rated unique sets of 60 the vignettes, first assigning purchase price, and second recording their emotion on reading the vignette. Three mind-sets emerged, based upon the dollar value of the messages. Further analysis demonstrated the interaction of elements, showing how the specific ethnic source drove the dollar value of other elements. The approach is presented as a model for the easy, rapid, and affordable creations of databases of the mind of people as they experience issues of everyday life.
Introduction
One need only go to large supermarkets to look at the foods which become trendy. Whereas decades ago, the foods were big brands, mainstream, today the opposite is happening. Ethnic foods are booming, for many reasons, not the least of which are adventurous eaters, people who want to hold on to their heritages, and the ever-present desire of marketers to identify new opportunities to enter food categories perceived to be densely crowded.
Most of the focus on ethnic foods tends to be trends [1], the emergence of specific preferences for foods, [2], and the sheer joy of writing in depth about something new, something with substance to it which has a story. And of course, ethnic cuisine with it arrays of specific appearances, aromas, tastes, and textures make for interesting reading and interesting video presentations. Watching the chef prepare an ethnic dish is simply entertainment.
Part of appeal of research on food is the sheer fact that everyone eats. Researchers recognize that people eat for different reasons, whether those reasons be economic, satisfaction, curiosity, social demands, and forth [3]. The studies on what makes people try ethnic foods are often studies of the psychology of people or just as often the using people to understand more deeply the aspects of the food itself [4-6]. This paper emerges from a joint focus on the above issues; the mind of the consumer (rules of decision), and an interest in ethnic foods as it enters society (responses to ethnic foods going ‘mainstream’, and concerns about food safety) safety. What is it about ethnic foods which make them interesting? What is the economics involved with ethnic foods, such as the business issue of the premium price, if any, appropriate for ethnic foods? Can we learn more about the mind of the customer who buys ethnic foods?
The Contribution of Mind Genomics
Mind Genomics can be defined as the ‘science of the everyday’ from the point of view of the person who is experiencing the ordinary, topics requiring decisions. We are familiar with world of the everyday because we live in that world. Occasionally, researchers focus on this world, especially anthropologists and sociologists, as well as consumer researchers. Anthropologists describe the structure of our everyday culture. Sociologists describe how people relate to each other, what type of institutions they set up and how they deal with each other. Consumer research looks at what people do from the point of understanding a business situation. Most of these studies are from the outside in, looking at the external behavior of the person in a situation filled with choice opportunities. By looking from the outside in, we mean seeing how people react. Looking from the outside in does not mean disregarding what people say, but rather looking at generalities of a situation instead of the more granular specifics of the situation. For example, in a study of food choice by low-income families, Burns et al. (2013) instructed respondents to sort foods on the basis choice [7]. The basic unit adopted by the respondent was quantity per unit price (value for money), as well as estimated satiation of hunger per price. What more could have been learned were the respondent able to tell the researcher ‘why’.
Mind Genomics is an emerging discipline, cross-sectional in nature, with the objective to understand the world of everyday experience and choices through the lens of choice experiments. in simple terms, the goal is to understand how people think about the different aspects of a situation, such as the way we think about ethnic foods. Rather than simply asking respondent one or two questions about ethnic food, the objective is to probe more deeply, in the way a psychologist understands the mind from the inside out. The question is how one applies that type of thinking to something quite ordinary, like the nature of ethnic food. Personality could be probed and link that to the response to ethnic food, but the effort seems too circuitous. There should be a more direct way to understand the mind of the person regarding ethnic food, doing it so from inside.
During the past 80, researchers have recognized the possibility of learning a great deal of complex and compound systems of variables, using experimental design to create test stimuli comprising mixtures resembling what people experience in everyday life, measure the response to the mixtures, and then deconstruct the response into what each variable contributes when it is judged in what could be a simplified approximation to the ‘blooming, buzzing confusion’ of everyday life. The approach, systematized experimentation, makes sense when we work with both with description of everyday life. As simple as this sound, the process is quite elegant, and produces a great deal of understanding. Typically, the respondent first tries to figure out ‘what is the right answer’, but soon relaxes, realizing that it’s impossible to game the system. In this way the systematized mixing of ideas become a strong method to understand the everyday. The strength of the approach has not escaped researchers. The history of mixing ideas together goes back to the notions of functional measurement [8], to the mathematical psychology of conjoint measurement [9], and to the applications of these groundbreaking ideas by Paul Green and his associates at Wharton School of Business at the University of Pennsylvania in Philadelphia [10].
Applying the Approach to Ethnic Foods
The research comes from the continuing interest in food safety, a topic expanded in the literature by Saulo and colleagues [11] the opportunity came along to study the intersection of food safety, and ethnic foods. At the same time, interest was growing in the application of methods other than Likert scales to measure hedonics. At the time of the study (2012), Moskowitz and colleague Stephen Rappaport were expanding Mind Genomics into the world of economics, calling the effort Cognitive Economics. The approach was looking at money both as a source of stimuli for investigation, and as a rating unity in place of hedonic judgments. Some of the interest emerged from the pioneering work of psychophysicist Eugene Galanter [12], who studied the utility and disutility of money, finding that the relation between Utility of Money and Actual amount of money could be represented by a power function of the form: Utility k (Dollars0.5). The use of money as a rating scale had been published before [13], but only as part of a study on the responsiveness of different kinds of scales to measure personality-related issues. The studies by Moskowitz and colleagues [14,15] would usher in the use of money scales to measure the response of homo economicus (dollars as scale points) versus homo emotionalis (Likert Scale).
It is important to note that the term ‘cognitive economics’ had been used before to describe the focus of economics on the psychological processes involved in economic decisions [16-19]. The term ‘cognitive economics’ used by Moskowitz, Rappaport and colleagues used the term strictly as an easy way to describe the use monetary scales by Mind Genomics, to compare scaling based on perception of price versus based on feeling Mind Genomics studies using both dollars as ratings, and liking as ratings, viz., two scales, suggested that respondents were more conservative when they used money as a scaling device, rather than interest or purchase intent as a scaling device (unpublished observations by HRM). Furthermore, in those studies for business clients, it appeared that the segmentation or dividing respondents by pattern of responses differed when the dependent variable was ‘dollar value’ associated with the element versus ‘degree of purchase intent’ associated with the element. This was summarized by the notion that ‘homo economicus’ may play by different rules than does ‘homo emotionalis.’ We may like something very much, but that does not mean we are going to pay more for it.
These early studies led to the study reported here, on the dollar value of the different aspects of ethnic food. Using Mind Genomics as the tool makes it possible to measure the dollar value of different aspects of ethnic food, such as the origin, the nature of food safety, the and the acceptance of the food, respectively. Although there are various studies in the literature discussing the acceptance and popularity of different ethnic foods, there did not seem to be any effort towards quantifying the different aspects of food in the spirit of a ‘dollar metric’ of the type that Mind Genomics would provide.
As noted above, Mind Genomics is well-suited towards the exploration of the dollar value of different aspects of a compound stimulus. Rather than breaking down the compound stimulus into its components and measuring responses to each component separately, Mind Genomics work with more ecologically typical combinations of components or messages. Respondents evaluate mixtures of messages, such as origin, usage, safety, etc. The combination more typically resembles a description of an ethnic food, although the combination is not at all polished. So long as the combinations are created in a statistically meaningful way using ‘experimental design’ [20], the researcher can create the combinations, test them with people using a scale, and then deconstruct the ratings into the part-worth contribution of each element, its impact. The process is more efficient, cannot be ‘gamed’, and forces the respondent to maintain a common criterion for judgment across different types of messages.
Setting Up the Mind Genomics Experiment for Ethnic Foods
Step 1: Select the Topic, the Questions (Categories), and Answers (Elements)
Mind Genomics works in a structured, templated manner. The test stimuli in a Mind Genomics experiment comprise combinations of elements, combinations that will to be treated as one compound idea. The underlying structure of the stimuli created by Mind Genomics is dictated by a ‘recipe’ book called the experimental design. Only certain pre-tested lists of specific mixtures are allowed. The structure guides the number of question and answers. Figure 1 shows the four questions, and the nine answers for each equation. The structure shown in Table 1 is called a 4×9 (four questions, nine answers per questions, henceforth referred to as nine elements per question).
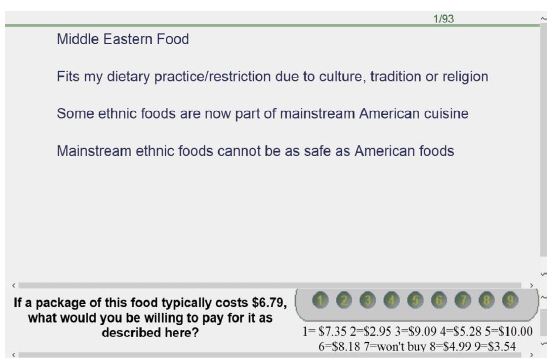
Figure 1: Example of a four element vignette
Table 1: The raw material, comprising four questions and nine elements (answers) for each question.
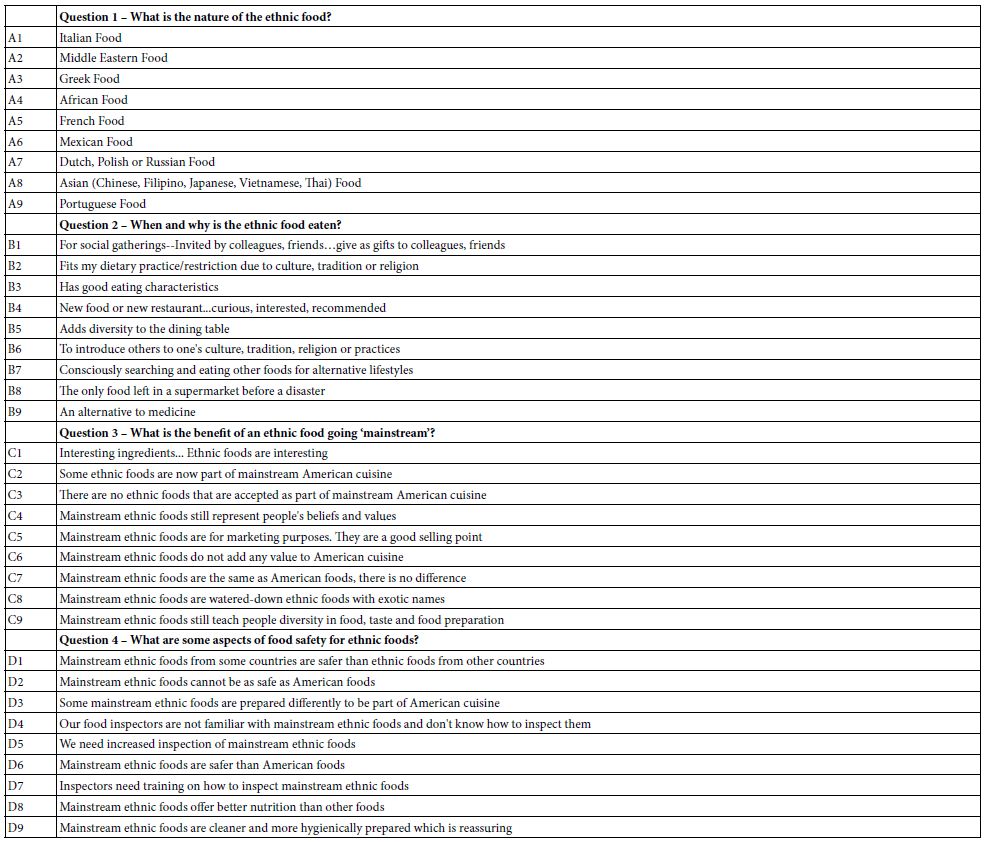
A key feature of Mind Genomics is that the questions will never be presented to the respondents. They are simple there to promote thinking about the topic. Furthermore, the question-answer format is a template. A question can comprise two or more different subs-questions. The only requirement is that an answer to one question cannot be broken into two groups, viz., appear as answers to two questions. . That is, one could imagine question #1 on the nature of the ethnic food ‘spilling over’ to question #2. This specific design can accommodate a maximum of nine different ethnic foods.
In contrast, a single question can comprise two or more topics, so long as the topic is completely covered in the one question. For example, Question #1 might comprise ethnic foods as well as methods of preparation. Having two different issues in Question 1 is fine, so long as neither issue appears in another question. The rationale for this is bookkeeping. All elements from one question must be able to be combined with all elements from another question, without creating a mutually incompatibility. In the case the question spills overs, e.g., having 12 different ethnic foods, not nine, it is likely that some vignettes will have two different ethnic foods of different types in the same vignette, a design flaw because the two elements of the same type contradict each other.
Step 2: Create the Test Vignettes, According to an Underlying Experimental Design
The respondents evaluated small vignettes comprising 2-4 elements, as dictated by an underlying experiment [20]. Figure 1 shows an example of a vignette comprising four elements, one from each of the four questions. Some of the vignettes comprise two elements, some three elements, the majority four elements. No more than one element ever appears from a question, permitting the design to act as a bookkeeping device.
One might question the design of the vignette. It does not appear to be nicely set up as a paragraph, with connecting words. The reality is that the vignette is set up to convey information in the format easiest for the respondent to search for the relevant information. In contrast to what might be thought at first, this sparse format is easy, and does not tire the respondent. The respondent quickly learns the scheme, in an in a way that is relaxed, the respondent evaluated each vignette, for a total of 60 vignettes.
Step 3: Select the Rating Scales that the Respondent Will Use to Evaluate the Vignettes
The rating scale provides a numerical way for the respondent to communicate with the researcher. This study comprised two scales, the first a scale of dollars, and the second a choice of emotion/feeling after reading the vignette. The dollar values were randomized, forcing the respondent to think before the scale ends up being memorized. By putting the different dollar values into an irregular order, the research forces the respond to put some extra thought into the evaluation of price. The second rating scale, emotion, was presented in an ascending array of emotions. Figure 2 shows an example of the orientation page that the respondents read before evaluating the vignettes, and before profiling themselves on a follow-on questionnaire.
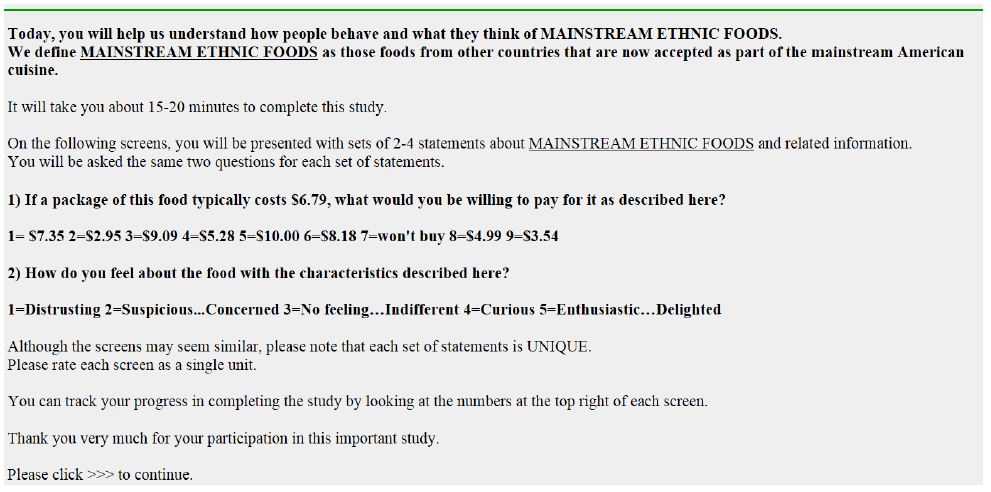
Figure 2: The orientation page for the study.
In the analysis, the dollar values will be treated a continuous scale, having ratio properties. In contrast, the five-point emotion scale will be treated as a nominal scale. The five points will be considered different alternatives. Ratings 1 and 2 are considered negative; rating 3 is considered neural, rating 4 and 5 are considered positive.
The entire evaluation session took about 20 minutes. The study comprised the orientation page, 60 vignettes, each rated on two scales, and a self-profiling questionnaire, dealing with who the person is, what the person does with regards to food and shopping, and attitudes toward different dimensions of ethnic foods, such as food safety.
The respondents were recruited by Luth Research, Inc. in San Diego, CA, and compensated as part of their panel participation. The study was totally anonymized so that the respondents could not be identified. A total of 310 respondents participated the respondents coming from across the United States. The requirements were to have approximately half males, half female, and an equal spread of ages.
Step 4: Preliminary, Surface-level Data Analysis
The data generated by the study comprises 60 vignettes each evaluated by 310 respondents, on two rating scales. The experimental design provides information about the actual nature of the stimuli, in terms of the phrases. Our first analysis, however, looks only at the patterns of the responses, without attempting to understand how the ‘meaning’ of the elements drives the response.
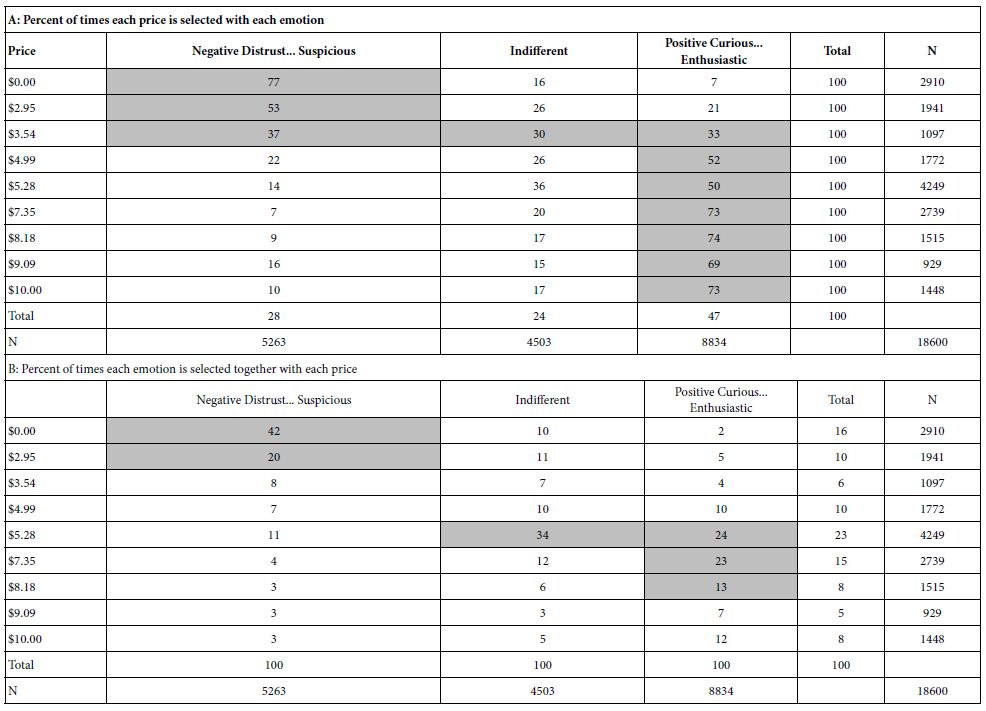
Without knowing the meaning of the elements, it is still possible to learn a great deal about the patterns of response. The first question involves the number of times each of the prices is chose, as well as the number of times the type of feeling is chosen. We define negative emotions as Distrusting, Suspicious. Concerned; the neutral emotion as Indifferent; and the positive emotions as Curious, Enthusiastic delighted. The analysis uses the base of 18,600 ratings, looking at the covariation of price and emotion. The analysis is a simple count.
Table 2 shows the cross tabulation of type of emotion (column) by the price chosen (row). The top part of Table 2 shows the choice of dollar value for each emotion. The pattern is quite clear. Negative emotions (Distrusting; Suspicion-Concerned) are associated with low prices, positive emotions (Curious; Enthusiastic-Excited) are associated with higher prices. The bottom part shows the choice of emotion associated with each dollar value. The same pattern holds, higher prices are associated with positive emotions.
Table 2: Association of selection of price and type of emotion.
The second superficial analysis looks at the consistency of the ratings across the 60 vignettes tested. The second rating scale, selection of emotion, was converted to five ‘daughter’ scales, one daughter scale for each of the five choices. When a specific feeling/emotion was selected for a vignette, the appropriate daughter scale was given the value ‘100’. The remaining four daughter scales were given the value 0. Thus, there are a total of 18,600 rows of data, each with a dollar value and five daughter scales, the latter having one ‘100’ and four 0’. The analysis consists of dividing the 18,600 rows of data into 60 summary rows, one row corresponding to one of the 60 positions or orders.
Figure 3 shows the averages by position for the dollar rating, and each of the five feelings/emotions. The key finding is that the selected price drops by about 65 cents from the start of the evaluation (order 1) to the end of the evaluation (order 60). This is an important trend, suggesting some change in the perception of an item’s worth over repeated exposures. The feelings/emotions show less stability, with the averages bouncing around, but there is no meaningful change that captures attention as does the change in assigned price.
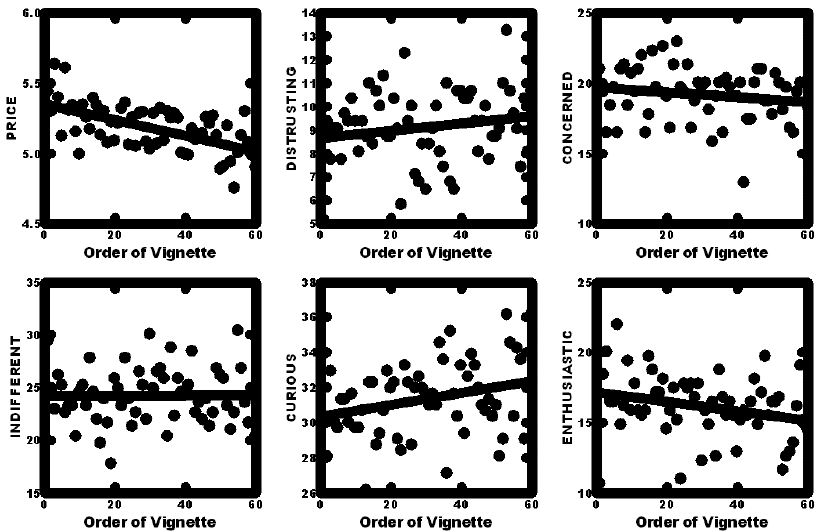
Figure 3: Change in the assigned rating of price, and the selection of feeling/emotion across the 60 vignettes evaluated by each respondent.
Step 5: Creating Individual-level Models and Developing Mind-sets by Clustering Coefficients
A hallmark of Mind Genomics is the effort to divide individuals based upon the pattern of their responses to the issues of everyday life. Whereas many methods for segmentation of consumers work on the supposition that people can be divided by the general patterns of what they believe, it is the tenet of Mind Genomics that the most practical and productive way is to divide people by how they respond to a limited, manageable ‘chunk of everyday life.’ There may be overriding groups of individuals falling into a limited number of grander mind-sets (e.g., Joel Garreau’s 1981 book on the Nine Nations of North America) [21], but such grand efforts do not cast light upon specific topic encountered in the granular existence of everyday life.
Mind Genomics divides people in a simpler way, more directly, and based upon the pattern of coefficients relating the presence/absence of the test elements to the responses. In our cases, the test elements comprise 36 statements, as shown in Table 1. The respondents evaluated small vignettes, comprising 2-4 elements. Each respondent evaluated 60 different vignettes, allowing us at the level of the individual respondent to create an equation: Dollar Value = k1(A1) + k2(A2) …. k36(D9). The equation relates the dollar chosen by the respondent to the presence absence of the 36 elements. The underlying experimental design allowed us to do this. Each element A1-D9 will end up with a dollar value. The data matrix will comprise 310 rows, each row comprising 36 columns of dollar values, one column for each estimated dollar value for each respondent. Although the respondents evaluated combinations, the regression modeling deconstructs the dollar value selected by the respondent to the individual dollar values of the elements. The respondent is entirely unaware, of course, that this economic deconstruction is going on based upon her or his data, within seconds of the completion of the evaluations.
At the end of the individual-level modeling, we are left with 310 equations each having 36 coefficients. We use clustering to divide these 310 respondents into two and then three smaller, non-overlapping groups. We do that by a method called k-means clustering [22,23], one of the many ‘flavors’ of clustering. The specific clustering method is not the key point here, but rather the notion that the clustering method is a heuristic, allowing us to easily divide this ‘booming buzzing confusion’ into a group of similar patterns. The choices of two or three or even more groups are a matter of interpretation, as is the naming of the groups.
As an example of what the clustering algorithm faces consider the panels in Figure 4. Each panel comprises six rows, each shows six ‘distributions’, albeit in a highly-shrunk fashion. Thus, each panel shows 36 distributions. The six rows in each panel correspond to the A1-A6 (row 1), A7-A9 & B1-B3 (row 2) etc. Each distribution corresponds to one of the 36 elements. The each of the 310 respondents contributes one ‘dot’ or ‘point’ to each of the 36 distributions. Just looking at the set of 36 distributions gives no idea about the existence of underlying groups. Everything looks theme same.
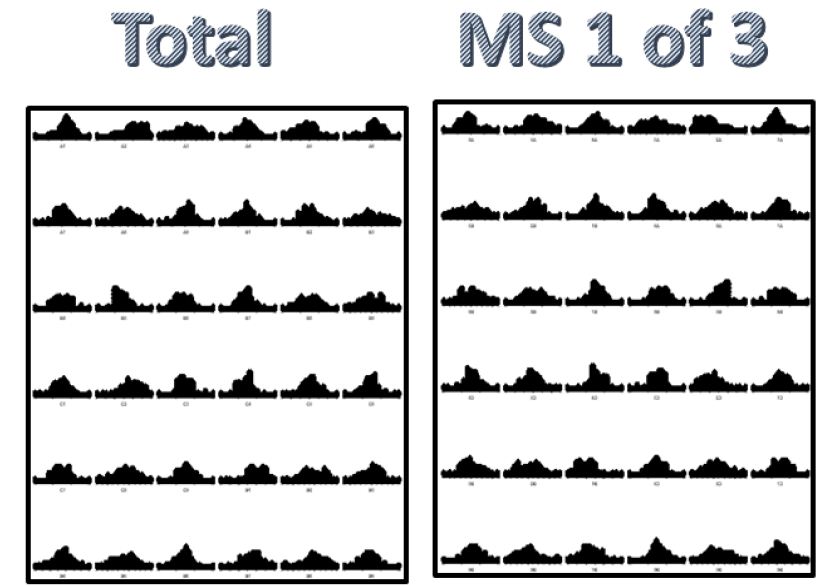

Figure 4: The distribution of coefficients. Each row in a panel corresponds shows the distribution of the coefficient value for one of the elements.
Now apply the clustering algorithm, and emerge with three mind-sets (MS1, MS2 MS3). It is still virtually impossible to discover the differences between the mind-sets, even though computationally we will see that the clustering algorithm pulls them appear. They are quite different from each other, with each mind-set placing different patterns of dollar values on the 36 elements.
The clustering algorithm computes a ‘distance’ between every pair of the 310 respondents, using the value (1-Pearson R), where Pearson R is the linear correlation between two respondents calculated from the 36 pairs of coefficients. The Pearson R takes on the value 1 when two respondents show coefficients moving in precisely the same pattern, so their distance is 0 (1-1). The Pearson R takes on the value -1 when the two respondents show coefficients moving in precisely opposite directions, so their distance is 2 (viz., 1 – – 1).
The array of distances, k-means clustering identifies a solution, or set of assignments of each of the 310 respondents, first to two clusters (two mind-sets), and then to three clusters (three mind-sets). The assignment attempts to minimize the distance between people in the same cluster as well as maximize the distances among the centroids of the cluster. The entire analysis is mathematically driven. It is the task of the researcher to select the number of clusters, and to name them. That task is done by naming the strong performing elements in each clustering (interpretability), and choosing as few clusters as one can (parsimony).
Step 6: Create the Grand Model, First for Total Panel, and Second for Each of the Three Mind-sets
Once the clusters or mind-sets are identified, the data can be treated either as one grand dataset of 310 respondents, or analyzed on a segment by segment, mind-set by mind-set basis. We will use the term ‘mind-set’ henceforth. The mind-set is named for the strongest performing elements, viz., the elements generating the highest dollar value for the mind-set. Each mind-set comprises individuals who seem to think about the world of ethnic foods in a similar fashion.
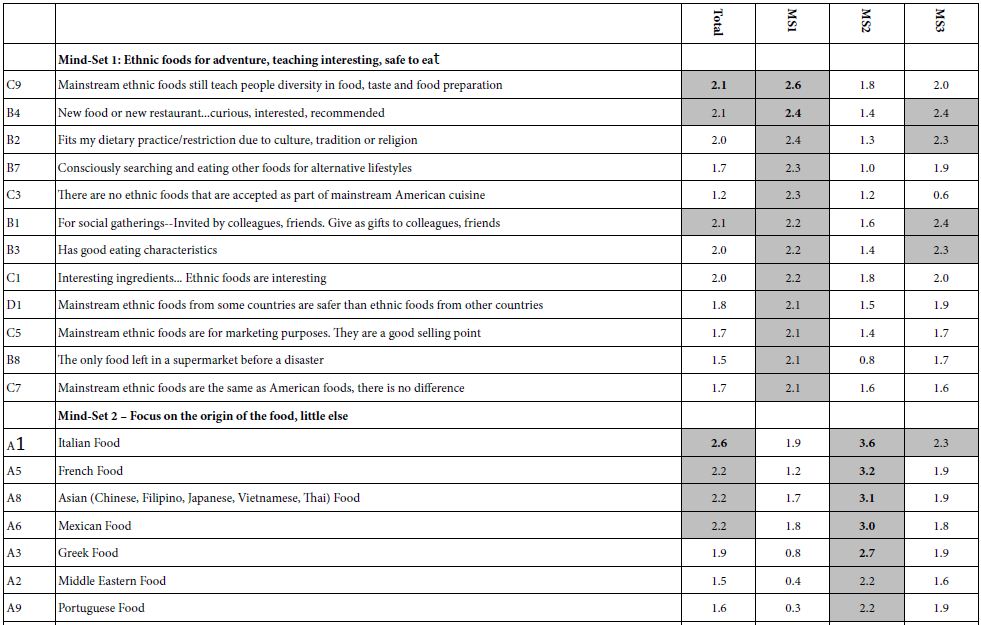
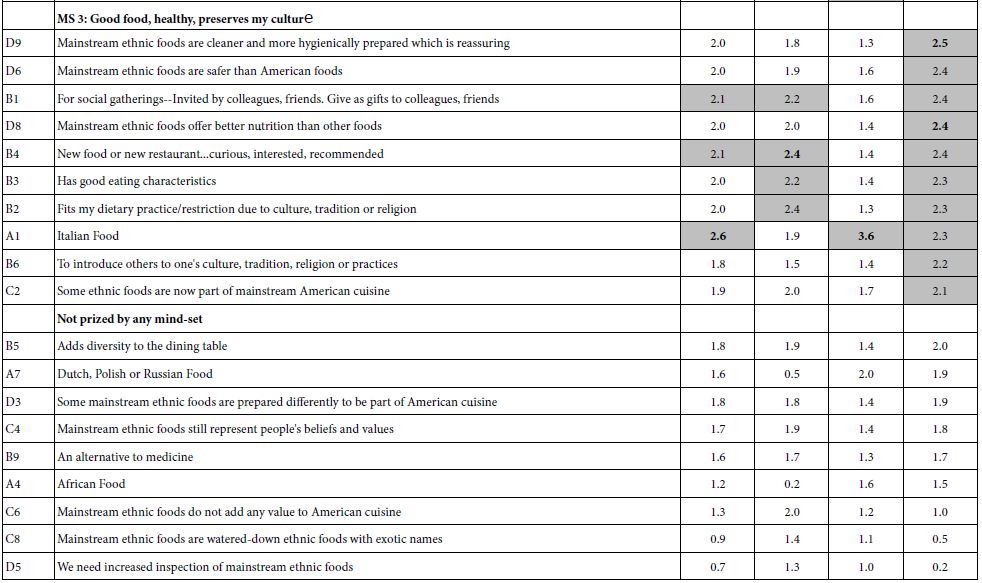
Table 5 shows the 36 coefficients, estimated first for the total panel, and then for the three mind-sets. Each model or equation is estimated on the pattern of responses to the elements. The creation of the mind-sets or clusters is objective, whereas the naming of the mind-sets is subjective, left to the researcher. To name the mind-sets we sort the 36 ‘dollar-based’ coefficient from high to low and highlight any coefficient of value 2.1 or higher, an arbitrary cut-point which allows us to name the mind-set. Mind-sets 1 and 3 are not polar opposites but show different patterns of stress on features of the experience. Mind-Set 2 is different, focusing on the ethnic origin of the food.
Mind-Set 1: Prizes ethnic foods for adventure, teaching interesting, safe to eat
Mind-Set 2: Prizes seven of the nine ethnic foods, does not prize African food, or Dutch, Polish, Russian foods (foods lacking well established restaurants in the United States)
Mind-Set 3: Prizes good food, healthy food, food which preserves my culture
Keep in mind that these are the statements for which the respondent is willing to pay more, even if the respondent does not realize it. The respondent is presented with many different elements. Even though the respondent may feel that she or he is responding in a ‘haphazard’ fashion, the data are orderly.
Scenarios: Interaction of Ethnic Food Source and Element to Increase or Decrease Price
Table 3 suggests three mind-sets, one of which (Mind-Set 2), is willing to pay more when the source of the ethnic food is revealed, e.g., Italian food (worth $3.6), or French food (worth $3.2). The data from Mind-Set 2 can be further studied by isolating all respondents from Mind-Set 2, and then creating 10 different strata, or smaller databases. Each smaller database comprises all the vignettes with a specific ethnic origin. Thus, there are all the vignettes which have NO ETHNIC ORIGIN mentioned, as prescribed by the experimental design. In addition, there are nine additional strata or smaller databases, one stratum for all vignettes having the origin Italian, a second stratum for all vignettes having the origin French, etc. In summary, then, we have 10 different strata generated from the data from Mind-Set 2.
Table 3: Dollar value for the 36 elements for the total panel and three emergent mind-sets. Strong performing elements (dollar coefficient of 2.1 or higher) are highlighted, allowing patterns to emerge.
For each stratum we can relate the dollar value of the vignette to 27 elements, B1-D9. We can no longer use Ethnic origin of the food because that origin is a constant for each stratum. That is, all the vignettes in the stratum for ‘African’ come respondents in Mind-Set 2, who evaluated vignettes begun with the statement ‘African Food.’
The analysis follows these steps
a. Create a data matrix. First create the model for all respondents in Mind-Set 2, for the stratum having NO mention of ethnic origin (viz., A – 0) The parameters of that model appear at the far-right column of Table 4, the title of the column being NONE (viz., no ethnic origin of the food.) This will be the baseline. Every other number will be compared to this baseline. Every other number in Table 4 will be ((Coefficient for element estimated with a specific ethnic origin) MINUS (Coefficient for that same element estimated in the absence of an ethnic origin)). This means that the coefficients in the first nine columns are differences from the NO Ethnicity Mentioned.
b. Build nine separate models for all respondents in Mind-Set 2, one for each of the nine strata having a specific country mentioned.
c. The difference is the INCREMENTAL VALUE OF THE ETHNIC ORIGIN. For example, B3 (Has good eating characteristics) is worth 2.3 dollars more when paired with Italian Food, but worth on 1.2 dollars more when paired with African Food.
Table 4: Interactive effect s- how ethnic origin of food interactions with the different elements. The numbers in the body of the body of the table show the change in dollar value of the element when it is associated with a specific ethnic origin.
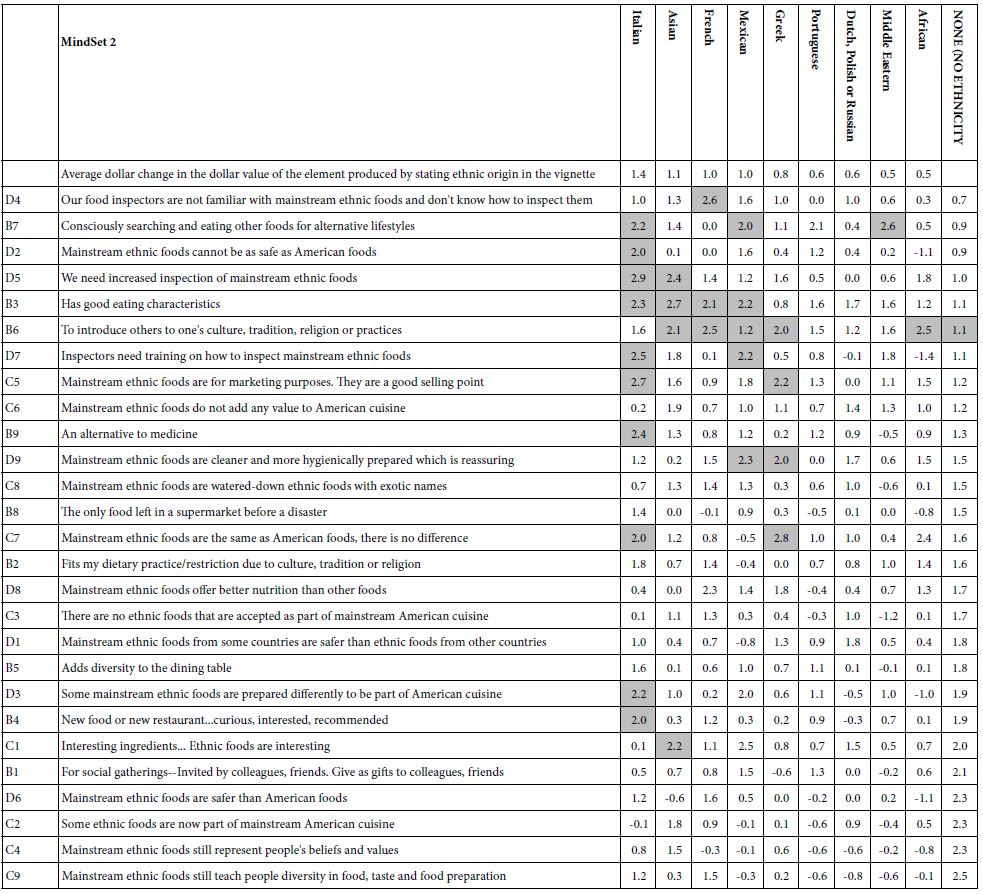
Table 4 shows shaded cells for all cells evidencing an increase of $2.00 or more
The same element can be affected differently by the nine ethnic origins.
The same ethnic origin can affect different elements in different ways
There may or may not be an underlying pattern. If there is, that pattern may reveal itself by inspection, if simple enough.
The four elements most positively affected by statements of ethnic origin are:
Mainstream ethnic foods are safer than American foods.
Some ethnic foods are now part of mainstream American cuisine.
Mainstream ethnic foods still represent people’s beliefs and values.
Mainstream ethnic foods still teach people diversity in food, taste and food preparation.
The three elements least positively affected by statements of ethnic origin are:
Our food inspectors are not familiar with mainstream ethnic foods and don’t know how to inspect them.
Consciously searching and eating other foods for alternative lifestyles.
Mainstream ethnic foods cannot be as safe as American foods.
Although the naming of the mind-sets is straightforward, the pattern of interactions may be as interpretable, even though the pattern can be discovered.
The Covariation of Price with Emotion
We finish the analysis by considering the covariation of price with the selection of positive emotions (Curious…Enthusiastic) and or negative emotions (Distrust, Suspicious). We run two models, using Question #1 (select dollar value). We run six models, a model for each of the three mind-sets using only the vignettes generating a positive emotion (rating 4 or 5 on Question #2), and then a second model for each of the three mind-sets using only the vignettes generating a negative emotion (rating 1 or 2 on Question #2).
Table 5 shows that virtually always those elements generating a positive emotion drove a higher rating for dollars for the same element. There are some interesting foods where emotion plays a greater effect influencing the dollar value ascribable to the element. Three elements are worth 1.30 to 1.50 when the respondent feels about a good experience reading the vignette.
Table 5: Coefficients of the two models for dollar value of elements for three mindsets. The models were six times, three mind-sets, first based on vignettes associated with a positive emotion (Pos), and second based on vignettes associated with a negative emotion (Neg). The AVG column shows the difference in dollar value.
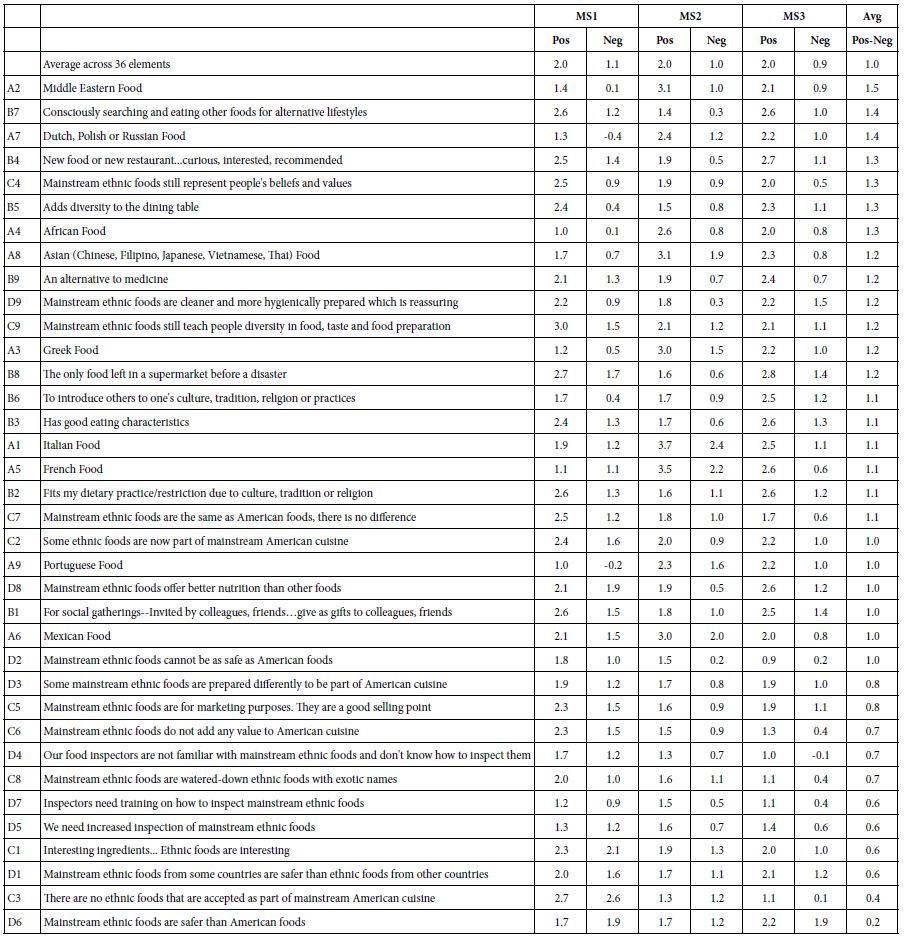
Middle Eastern Food $1.50 more
Consciously searching and eating other foods for alternative lifestyles $1.40 more
Dutch, Polish or Russian Food $1.40 more
Not every element show a strong lift in dollar value correlating with strongly positive emotions. Here are elements, whose values are increased by 60 cents or less. They are elements which do not talk about the joy of foods, but they do talk about food safety.
Inspectors need training on how to inspect mainstream ethnic foods
We need increased inspection of mainstream ethnic foods
Interesting ingredients… Ethnic foods are interesting
Mainstream ethnic foods from some countries are safer than ethnic foods from other countries
There are no ethnic foods that are accepted as part of mainstream American cuisine
Mainstream ethnic foods are safer than American foods
Discussion and Conclusion
The data presented here provide a new way to understand the way we make decisions. As noted in the introduction, a great deal of our knowledge about ethnic foods comes from those who do ‘trend spotting’, identifying what people search for on the web, identifying what the trade believes to be happening, or asking people in ongoing surveys which build databases over time. Sometimes the pattern becomes obvious, when one sees the emergence of new foods on the shelves in stores, and the opening of restaurants, often short lived.
At the same time that there is the richness of food behavior measured, databased, and summarized, there is little in the way of a profound understanding of the mind of the ordinary person with respect to ethnic foods. There are isolated, generally unconnected studies emerging from marketing and food science, executed and published because the topic of ethnic foods is relevant to the researcher’s focus on consumers and the way they think. There is appears to be almost nothing dealing with the inside of the consumer focusing outwards, related to foods. It’s all outward focusing inward or inwards focused on psychological processes, using food as a convenient topic.
This paper merges two new areas to focus on ethnic foods, doing so in a way which displays the richness about the way we think. The first is the disciplined approach imposed upon the research. Rather than ‘pick and choose’ interesting ideas, focusing only upon them, Mind Genomics forces the researcher to come up with structured questions, which tells a ‘sort of story’. The four questions in this study can be considered as the outline of the story, perhaps being told from the vantage point of Where the food comes from (Question 1), where the food is consumed (Question 2), what are the benefit of the food if it goes mainstream (Question 3), and what are the aspects of food safety which might be relevant (Question 4). The requirement to provide nine answers to each question forces the researcher to new ways to think about the topic in terms of specifics, not just in terms of general topics having vague meaning.
The Role of Money, rather than Stated Purchase Intent, as a Key Response Measure
Researcher continually look for appropriate, sensitive, and meaningful measures by which they can more deeply understand how the respondent ‘feels’ about specifics of the external world. The most widely used variables are the rating scales, used to measure intensity of feeling, such as degree of desire to purchase a product. This has been labelled the rating by ‘homo emotionalis’, emotional man, because the respondent is stating a feeling, albeit through the scale. The use of money as a rating scale calls into play different decision processes. Just because a person likes something does not mean that the person will pay more or even a lot more when the person is asked to rate the ‘appropriate price.’
The data from this study suggest that there is a loose relationship between homo economicus (shown by Question #1, dealing with dollars), and homo emotionalis (shown by Question# 2). Table 5 suggests that for the same food, a person who says she or he is experiencing a positive emotion is likely to say that she or he will spend an extra dollar or even several dollars more for certain elements. The discovery here is that the two ways of measuring responses are not parallel.
The Value of Being Able to Test a Lot of the Design Space, and Discover Interactions among Elements
A key contribution of this paper is the demonstration that one can discover interactions among variables in an experimental design, even when the variables are discrete. The unique experimental designs created for Mind Genomics, and the systematized permutations of the basic design enable the researcher to test a great deal of the possible ‘space’ of vignettes, our combinations of elements. There are nine elements in each of the four questions, so that there are 10 actual options of an element (viz, A0-A9, B0-B9, C0-C9, D0-D9). If we look at the total possible number of vignettes, we arrive at 10,000 – 1, the ‘1’ corresponding to the one vignette comprising no elements (A, B, C, and D are all absent). If we are more rigid, we can discard another 36 vignettes. It is highly unlikely for the researcher to be able to find the mind-sets when all 60 vignettes are the same across the 310 respondents. There might emerge mind-sets, but there would be no reason to expect that these mind-sets would represent anything other than a local pattern driven strongly by the single original experimental design. There would be no generality to the finding, just a statistical ‘nicety.’
The second benefit is the ability to do the scenario analysis, as we did to find out how the country of origin of the ethnic food interacts with the other elements. Without the interactions the data just shows the strength of the element, averaging the varying strength of the element which waxes and wanes, depending upon the other element with which it is paired. The data in Table 5 suggests that the dollar value of the element can be dramatically influenced by the nature of the ethnic origin, a pattern that could only be hypothesized about without the scenario analysis and the ability to identify interactions and calculate their magnitude.
References
- Campbell JM, Fairhurst A (2014) Billion dollar baby: local foods and US grocery. Journal of Food Products Marketing 20: 215-228.
- Meiselman HL (1996) The contextual basis for food acceptance, food choice and food intake: the food, the situation, and the individual. In Food Choice, Acceptance and Consumption (pp. 239-263). Springer, Boston, MA.
- Barrena R, García T, Sánchez M (2015) Analysis of personal and cultural values as key determinants of novel food acceptance. Application to an ethnic product. Appetite 87: 205-214. [crossref]
- Jang SS, Kim D (2015) Enhancing ethnic food acceptance and reducing perceived risk: The effects of personality traits, cultural familiarity, and menu framing. International Journal of Hospitality Management 47: 85-95.
- Prescott J, Young O, O’neill L, Yau NJN, Stevens R (2002) Motives for food choice: a comparison of consumers from Japan, Taiwan, Malaysia and New Zealand. Food quality and preference 13: 489-495.
- Samant SS, Hanson AD, Asare R, Nichols DS, Nna-Mba JP, et al. (2018) Effects of food neophobia on visual attention and sensory acceptance of ethnic-flavored foods. Culture and Brain 6: 53-70.
- Burns C, Cook K, Mavoa H (2013) Role of expendable income and price in food choice by low income families. Appetite 71: 209-217. [crossref]
- Anderson NH, Zalinski J (1988) Functional measurement approach to self‐estimation in multi attribute evaluation. Journal of Behavioral Decision Making 1: 191-221.
- Krantz DH (1964) Conjoint measurement: The Luce-Tukey axiomatization and some extensions. Journal of Mathematical Psychology 1: 248-277.
- Green PE, Krieger AM, Wind Y (2001) Thirty years of conjoint analysis: Reflections and prospects. Interfaces 31: S56-S73.
- Saulo AA, Moskowitz HR (2011) Uncovering the mind-sets of consumers towards food safety messages. Food quality and preference 22: 422-432.
- Galanter E (1962) The direct measurement of utility and subjective probability. The American journal of psychology 75: 208-220. [crossref]
- Biernat M, Manis M, Nelson TE (1991) Stereotypes and standards of judgment. Journal of Personality and Social Psychology 60: 485-499.
- Moskowitz H, Rappaport S, Moskowitz D, Porretta S, Velema B, et al. (2017) Product design for bread through mind genomics and cognitive economics. In Developing New Functional Food and Nutraceutical Products (pp, 249-278). Academic Press.
- Saulo AA, Moskowitz HR, Gere A, Papajorgji P, Ettinger Lieberman L, et al. (2019) Linking Food Endorsement Labels & Messaging to Perceived Price and Emotions. A Mind Genomics® Exploration. Advances in Nutrition and Food Science.
- Bourgine P (2004) Cognitive economics: an interdisciplinary approach. Springer Science & Business Media.
- Bushong B, King LM, Camerer CF, Rangel A (2010) Pavlovian processes in consumer choice: The physical presence of a good increases willingness-to-pay. American Economic Review 100: 1556-1571.
- Chater N (2015) Can cognitive science create a cognitive economics?. Cognition 135: 52-55. [crossref]
- Ogiela L (2014) Towards cognitive economy. Soft Computing 18: 1675-1683.
- Gofman A, Moskowitz H (2010) Isomorphic permuted experimental designs and their application in conjoint analysis. Journal of Sensory Studies 25: 127-145.
- Garreau J (1981) The Nine Nations of North America. Avon Books.
- Rokach L, Maimon O (2005) Clustering methods. In Data mining and knowledge discovery handbook (pp. 321-352). Springer, Boston, MA.
- Fusco V, den Besten HM, Logrieco AF, Rodriguez FP, Skandamis PN, et al. (2015) Food safety aspects on ethnic foods: toxicological and microbial risks. Current Opinion in Food Science 6: 24-32.