Monthly Archives: June 2020

The Covid-19 Lockdown, Ethics, and Screening

DOI: 10.31038/IGOJ.2020313

Covid-19

The Spanish flu, SARS, and MERS are corona virus pandemics (1). For the first time in history, however, the information technology allowed us to receive large amounts of instant data regarding the impact of this upper respiratory tract infection. The spread of this new virus, the effects on vulnerable people and our unpreparedness to manage a pandemic in a socially and ethically equitable manner has shocked the free world. TB, Malaria, HIV, or childbirth, to mention only some of the devastating conditions which kill hundreds of thousands of people yearly, mainly in third world countries, do not receive such instant and intense coverage. The knee-jerk response of the politicians and of the authorities to overcrowded, understaffed, ill equipped and unprepared healthcare facilities, combined with raised public expectations, was unprecedented. They were worried about accusations of negligence, their political survival, and feared litigation. Their actions and response were a reaction to the realisation that the largest, strongest, and wealthiest economies were unprepared to receive and treat large numbers of severe causalities, for an extended period. For too long, authorities relied heavily on brain drain, underpaid, privatised and short funded healthcare. They promoted, however, democratic principle of equality, freedom, and choice. This pandemic unmasked the ill prepared, inadequate, insufficient, and unequal healthcare systems. These levels of excellence were not achieved in third world countries where healthcare is not universal, accessible, or functional. Advising, recommending, isolating, quarantining, protecting the old, the sick and the ones at risk would have been democratic and more effective. Building and equipping hospitals, employing more staff, and supplying PPE would have achieved the same results, more cost effectively and without the devastating effect on economy and the instillation of fear in the public. An undemocratic regime’s, massive lockdown, suppressed reporting and the great success prompted nationwide lockdowns and limitations of civil rights in major democracies. We sheepishly followed into lockdown. The most unreal rules were invented, implemented, and enforced by authorities. Freedom of choice, civil liberties and rights were brutally curtailed in the name of flattening a curve. This is political and media run management of a pandemic, a scary infodemic. Third world countries have followed democracies and implemented unconstitutional, undemocratic, unethical, immoral, and devastating lockdowns on their population. No science or words can explain the reasoning behind such dictatorial steps, except the poor state and ill preparedness of health services. Should the authorities have had a plan and used the lockdown to build hospitals, manufacture needed quality equipment, high quality PPE, and, enlarge stronger and safer emergency response capabilities, we would be in a better position to restart the world. Hygiene, Social distancing, and facecloths only slow down and prolong, do not avoid, or treat the pandemic. Only primary prevention and effective treatments can control a viral pandemic. Developing strong, specialised, well equipped, expandable, and rapidly deployable emergency healthcare systems, training more specialist and research staff, discovering effective antibiotics, antivirals, vaccines, and vaccine producing R&D should be the priority. This should be the duty of the state, the army or civil defence force who are rather developing better mass destruction capabilities. The annual flu kills half a million, mostly vulnerable people. Millions of new-borns, neonates and under 1-year old children die yearly and the majority could be prevented by implementing simple hygienic, proven effective primary and secondary preventative measures, disinfectants, clean water, and an antibiotic, but we do not have funds. So far, we did not reach the number of fatalities expected with an annual flu epidemic, but we are sacrificing the quality of life, wellbeing and livelihood of billions of people, with a Popular Science style, media driven, political management.

Ethically

1. The autonomy of the people was crushed. Decisions taken were with coercion and coaxing and were not based on a benefit risk analysis.

2. There is no justice in lockdowns for the old, the frail, the sick, the obese or the diabetic. The speed of the spread was slowed down but the risk of contracting the illness and of succumbing to it at a later stage, without an effective antiviral or a vaccine stayed the same. For the majority, the young, the fit and the healthy, the financial losses were enormous. In the third world, the distribution of scarce resources towards an exercise in dictatorial rules conflicting with established legislation was senseless. In the first world, at least governments released trillions of US$ to support businesses and unemployment. The third world is not coping with the repayment of the interest on borrowed money. We are releasing low risk criminals and arrest joggers, or people traveling to visit family or friends.

3. Are there any benefits from flattening the curve to those at risk? Again, in the absence of a cure or a primary preventative vaccine, it is a frustrating prolongation of the inevitable.

4. Finally, non-maleficence requires that the interventions, in this case the lockdown and closing of businesses, should not harm society. These actions did irreparable damage to most people, to employment, personal wealth, and the economy.

Restarting economies without treatment or a vaccine, after we frightened the public with this infodemic will be a difficult task. Parents, teachers, experts, opinion makers, the media, the trade unions and politicians advise, warn, blame, and worry about whose fault will it be if a child or a worker will contract the disease, or will succumb to it. The blame game has no limits, but government’s coffers has. Unemployment and poverty can only make this depression and the future bleaker. After this flu epidemic the media claims that life will not be the same, the question is why and at what cost.

Screening

For antigen or antibody is another thorny issue. Scientists have adopted the 1968, Wilson and Jugner [2] principles of scientific screening for disease. Screening is not a diagnostic test and it should be applied to a condition, based on sound scientific grounds. The condition should be an important health problem. It should have a known natural history and early diagnosis should have a benefit to the person and the society. Preventative strategies or early treatment should be better than the natural course of the disease or diagnosis and treatment at later stages of the disease. Screening should be effective and outweigh any potential harm to an otherwise healthy population. The test should be reliable, sensitive, and specific. The screening should be acceptable to the population. We should have a policy on management of positive tests, have a diagnostic test, a treatment, and facilities for managing positive individuals. A cost-benefit analysis should be performed to balance case funding in relation to general medical expenditure, and the screening should be a continuous process rather than once-off. In 2018 Dobrow [3] expanded on the 10 principles with a rather extensive systemic review and consensus. The screening performed worldwide, by the media, governments and opinion makers is costly, inefficient and unscientific. Besides the relative seriousness of this upper respiratory infection, contagion, acceptability, and ease of screening, none of the requirements for scientific screening or testing are fulfilled. Screening, without guidelines, without knowing the natural history of the condition, without tested and validated kits, without a sensitive and specific diagnostic test for infection or immunity, without facilities to deal with the infected persons and without treatment or a vaccine, is an expensive and futile repetitive process.

References

  1. Jones DS (2020) History in a Crisis-Lessonsfor Covid-19. N Engl J Med382: 1681-1683.[crossref]
  2. Wilson JMG and Jugner G (1968) Principles and practice of screening for disease. Geneva, Switzerland, WHO, Report No 34 (Public Health Papers)
  3. Dobrow MJ, Hagens V, Chafe R, Sullivan T, Robeneck L (2018) Consolidated principles of screening based on a systematic review and consensus review. CMAJ190: 422-429.[crossref]

Effective and Sustainable Lifestyle-Interventions to Reduce the Risk of Cardiovascular Diseases for Women from the Menopause: A Literature Review

DOI: 10.31038/AWHC.2020334

Abstract

Background: Each year 2.2 million women in Europe die from cardiovascular diseases. The risk of cardiovascular diseases increases from the onset of the menopause and may be reduced by a healthy lifestyle. However, insight in sustainable, effective lifestyle interventions targeted at women around the menopause is lacking. The aim of this study is to find sustainable, effective lifestyle interventions to reduce cardiovascular risk for women (starting) from the menopause, and to investigate effective strategies to enhance adherence.

Methods: Literature search for controlled studies on lifestyle-interventions for women around the menopause, that reported positive effects on cardiovascular risks.

Results: Two dietary interventions, eight exercise programs, three combined programs and one health coaching intervention reported a reduction of cardiovascular risk. The type of diets varies, but common features are reduction of fat and calories and application of behavioral change techniques. The exercise programs apply different types of movement, but are in general supervised group programs. All dietary and exercise interventions  are characterized by many contacts and professional guidance. Several strategies to improve treatment adherence are applied such as peer support, telephone calls for missed sessions, self-monitoring and incentives. In general, a high effort to keep women in the program seems to results in relatively good adherence.

Conclusion: Interventions that sustainably reduce cardiovascular risk factors for women starting from the menopause are characterized by intensive strategies such as strict diets, exercise programs with many weekly sessions, guidance by professionals and high efforts to increase adherence. It is the question whether these interventions, tested in a research setting, are applicable and attractive for a large population in daily practice. The challenge is to develop less intensive but sustainable effective interventions that require less strategies to guarantee adhere. Such interventions should be tailored to the specific needs and health problems of women from the menopause.

Keywords

Cardiovascular risk, women, dietary interventions, exercise, menopause, healthy lifestyle

Introduction

Cardiovascular Diseases (CVD) cause more than 4 million deaths each year across Europe, 2.2 million women and 1.8 million men [1]. There are obvious gender differences in the natural history of CVD and in risk pattern [2]. Women are older than men when they develop CVD, and present themselves with different complaints. Cardiovascular events are relatively rare in premenopausal women because of the protective activity of sex hormones during the reproductive age [3]. However, the risk of CVD increases rapidly around the menopause [4]. A healthy lifestyle may reduce this risk [5]. In established guidelines, a six-month lifestyle intervention is recommended in order to reduce cardiovascular risks [6, 7].

Worldwide about 37.5 million women are reaching or currently at the menopause [8], and women may be postmenopausal for 30– 40% of their lives [9]. The need for effective strategies or lifestyle interventions to prevent or  postpone  CVD  in  women  starting  from menopause is therefore high. However, effective lifestyle interventions may not be easy to find, since some studies indicate that lifestyle interventions like diet restriction  or  increasing  physical activity have less effect in women than in men [10-12]. It   is unclear whether these differences in effect exist because specific female physiological and psychosocial factors affect effectiveness   in itself, because women adhere less to interventions, or both. An intervention can only work if participants adhere to it and adherence is easier when an intervention is appealing and fits into one’s life  and situation [13]. Women have different psychological and social mediators of physical activity participation than men [14, 15] and female gender role responsibilities such as care for the family and older parents can lead to decreased participation in physical activity [13, 16] or difficulty with following a diet. In addition, most lifestyle programs have been designed for persons at high risk of CVD in general, and some of these interventions may be less appealing to women. This might be even more the case for women during the menopausal transition, since this period is accompanied with several physiological and psychological complaints, such as tiredness and feelings of depression and musculoskeletal pain [17-20]. Therefore, interventions tailored to this specific group by taking these specific complaints and stage of life into account may be more effective and easier to adhere to. As far as the authors are aware of, insight in sustainable, effective lifestyle interventions specifically targeting women around the menopause is lacking. The present study aims to fill this gap by a systematic search of the literature. In addition, the second objective of this study is to identify strategies that are used to increase adherence to these interventions.

The questions of this literature study are:

• What are sustainable, effective lifestyle interventions (or elements of lifestyle interventions) to reduce the risk of CVD for women starting from the menopause?

• What are effective strategies to enhance adherence to lifestyle interventions for this group of women?

Methods

Search strategy

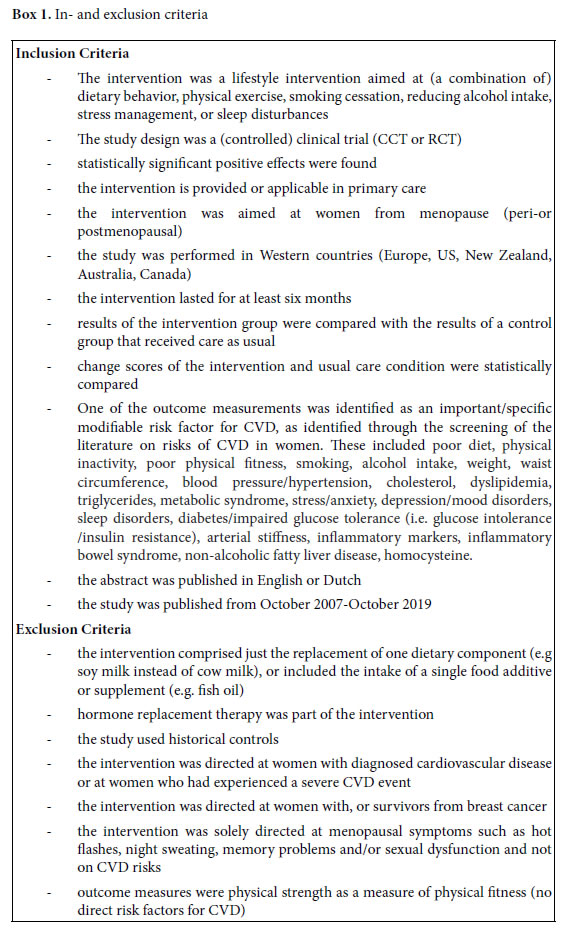
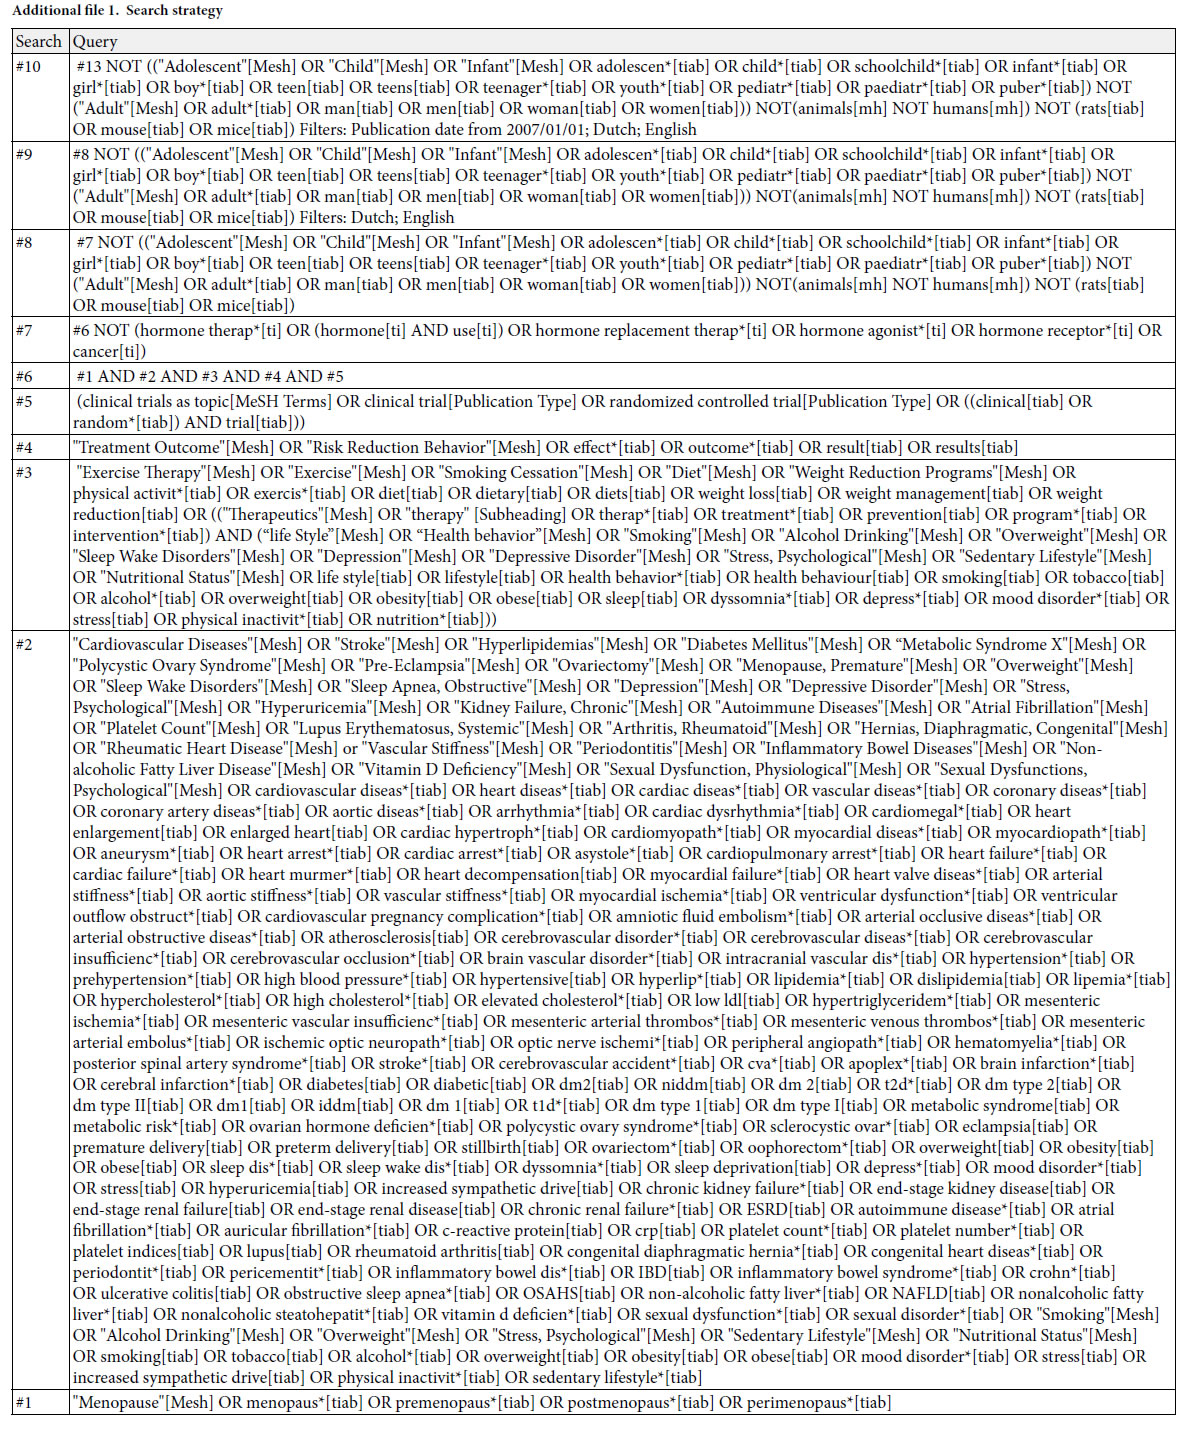
Since our primary aim was to find sustainable, effective lifestyle interventions  for  women  (starting)  from  the  menopause,   we only selected studies that reported a significantly  positive  effect and had a duration of at least six months [6, 7]. Since lifestyle is culturally determined and we searched for interventions that may   be applicable in the Dutch primary care or public health domain, only studies from Western countries were included. As preparatory step for our systematic literature search we explored which specific modifiable risk factors and symptoms should be addressed with the intervention, by screening the literature on cardiovascular risks in women [2, 9, 21-35]. Risk factors found were used as search terms in the systematic  search  for  potentially  successful  interventions. A comprehensive literature search was conducted at October 11th, 2019 in the databases Pubmed, Embase.com, the Cochrane Library, Cinahl (Ebsco), PsycINFO (Ebsco) and Sport Discus (Ebsco). The following concepts were searched (including synonyms and related terms) with controlled terms (MesH in Pubmed, Emtree in Embase, Cinahl Headings, Thesaurus terms in PsycINFO and Sport discus) and free text words: ‘menopause’ AND ‘cardiovascular diseases’ or AND ‘lifestyle interventions’ AND ‘outcome’. The complete search history is presented in the Supplement S1. Reference lists of relevant reviews were screened for additional studies (snowball method). In- and exclusion criteria are presented in Box 1.

AWHC-3-2-308-b001

Procedure

A random sample of 300 titles and abstracts were scored by one author (CL). The other authors scored each 100 titles and abstracts of this sample (JK, LvD, MV). Since no difference were found between these double scores, the remaining of TIABs were scored by the first author (CL). Scoring of the full text papers and the completion of the tables was performed by CL and checked by JK.

Results

Literature search

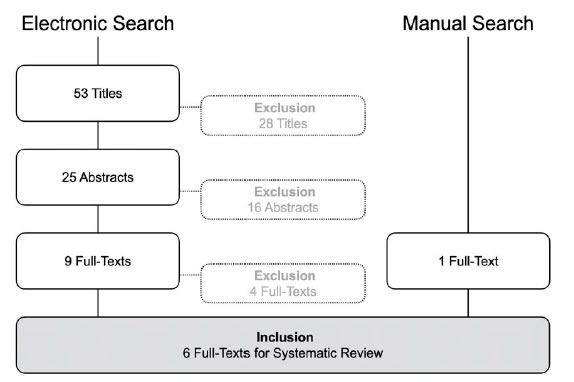
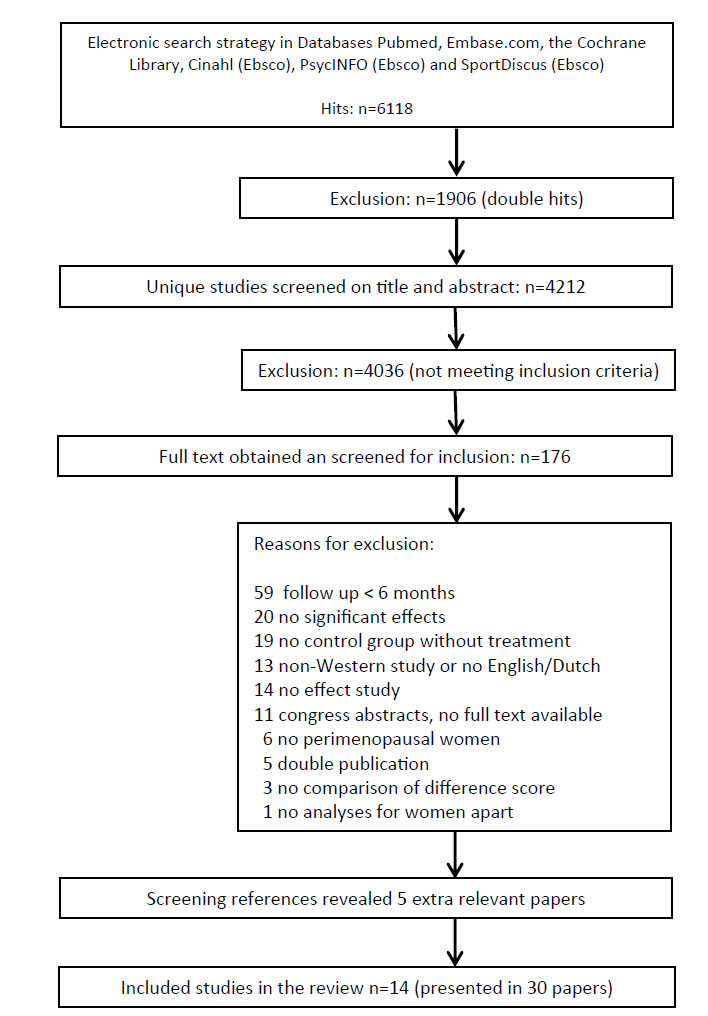
A total of 6,118 hits resulted from the electronic database searches, of which 4,212 were unique. After screening titles and abstracts, 4,036 references were excluded. Of the remaining 176 references, full text was obtained and assessed for inclusion in our study. From this search 25 publications were selected and searching reference lists provided five extra relevant publications. Finally, a total of 30 references, reporting on 13 randomized and trails and one non randomized controlled clinical trial met all inclusion criteria [36-59] (Figure 1). Of these 14 studies, seven were presented in multiple publications. Table 1 in the additional file 2 shows the main characteristics of the 30 included publications.

AWHC-3-2-308-g001

Study Population

Two  studies were found that explicitly focused on women in   the menopausal transition [36, 55]. The other studies included postmenopausal women, varying from 40 to 75 years up. For two studies (published in three publications) minimum age is unknown [55-57]. Six studies (14 publications), focused on sedentary women [38, 39, 42-47, 49-51, 54, 58, 59, 61] and four studies (11 publications), specifically on women with overweight [42-45, 49-51, 54, 55, 59]. One study specifically included women with diabetes [56, 57] while six other studies (15 publications) explicitly excluded this group of women [37, 40, 41, 43, 45-49, 51-53, 58, 61, 62]. Most studies excluded women with (a history of) severe health conditions such as cancer, heart disease, dramatically elevated blood levels or mental of psychiatric disorders [36-54, 58, 59, 61-65] or women who had medication for weight loss[43, 45, 49, 51, 55] or for lipids or blood pressure [39, 40,53] or used hormones [46, 47, 55, 58, 62]. Six studies (15 publications) excluded women with excessive alcohol intake [36, 37, 40, 41, 43, 45-49, 51-53, 58, 61]. Almeida et al. specifically included women who suffered from hot flashes [36] and Villaverde Gutiérrez [66] included women with mood problems. In general, studies included a relatively healthy, but overweight and sedentary sample of participants.

Interventions

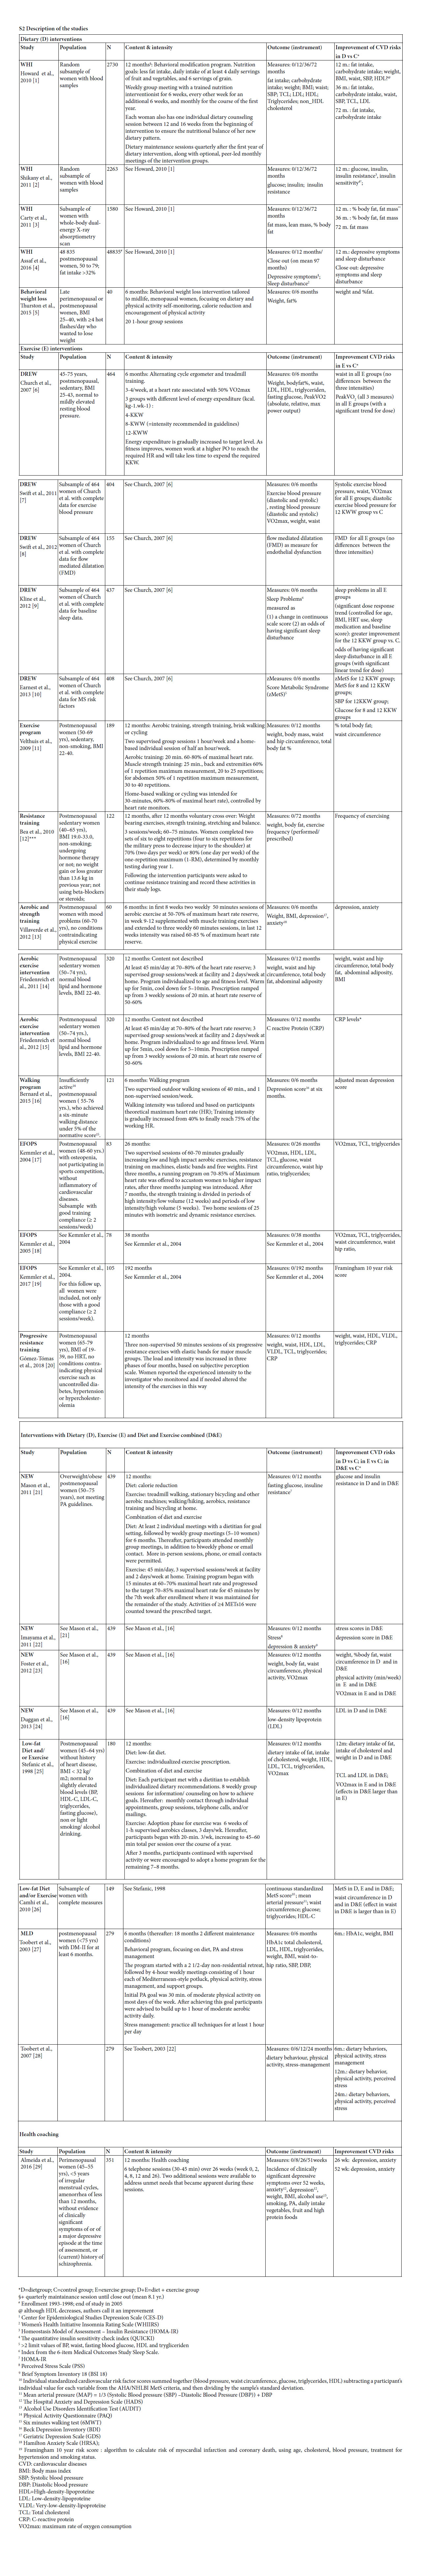
Identified lifestyle interventions can be divided in dietary interventions (Table 1) [37, 40, 41, 43, 45, 48, 49, 51-53, 55, 61] (supervised) physical exercise programs (Table 2) [38-40, 42-47,  49-51, 53, 54, 58, 59, 62-66] a combination of diet and exercise (Table 3), [40, 43, 45, 49, 51, 53, 56, 57] and health coaching (added to Table 3) [36]. Since some studies used a three arms design comparing a dietary intervention with an exercise intervention and with the combination of diet and exercise, these three armed studies are presented  in tables 1, 2 and 3. For the readability of this paper, references of the intervention studies are only presented in the tables, and not in the text of the results section.

AWHC-3-2-308-t001

AWHC-3-2-308-t002

AWHC-3-2-308-t003

Dietary interventions

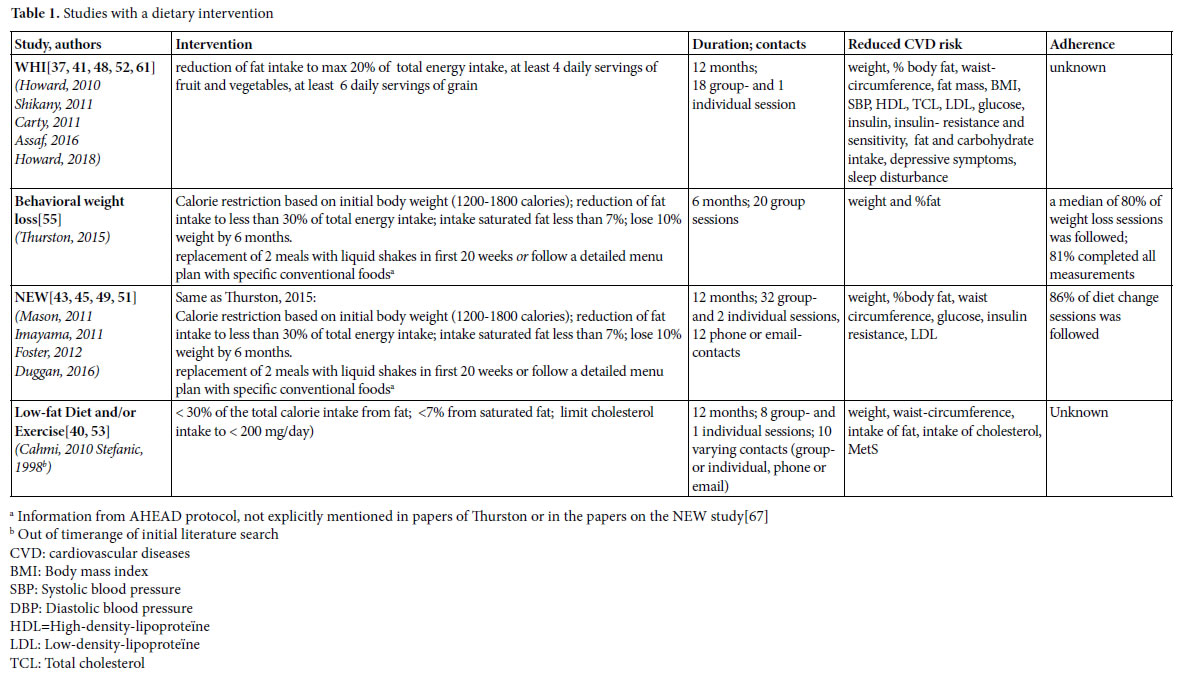
We found four studies with positive effects of a dietary intervention on the reduction of risk factors for CVD (table 1). The Women’s Health Initiative (WHI) study implements a change of eating behavior rather than a prescribed diet. The behavioral weight loss study of Thurston and the Nutrition and Exercise in Women study (NEW) were based on the Look AHEAD [67] and Diabetes Prevention Program (DPP) [68]. In the AHAED protocol, it is recommended to replace 2 meals with liquid shakes in the first 20 weeks or follow a detailed menu plan with specific conventional foods [67] a strategy that is also used in the DPP to individuals who have difficulty achieving the weight loss goal. The Low-fat Diet and/or Exercise intervention of Cahmi et al. and Stefanic et al. was based on the National Cholesterol Education Program Step II Guidelines. All these interventions focused on a reduction of calorie and (saturated) fat intake, and did not solely focus on nutritional requirements, but also addressed different behavioral components, and strategies to increase adherence.

Behavioral components and other strategies to increase adherence with dietary interventions

Because the focus in the WHI study was on changing eating behavior rather than on following a prescribed diet, behavioral components were explicitly addressed. Women were assigned to a group of 12 members in which psychological and behavioral themes such as motivation and reinforcements, social influence and support, time management, problem-solving and coping with stress, and relapse prevention were discussed. Nutrition and behavioral strategies were integrated into each session. The first sessions focused on knowledge of sources of fat and nutrition skills such as shopping and adaptation of recipes, and later sessions emphasized behavioral skills.

In the NEW study and in the behavioral weight loss intervention of Thurston each session started with a weigh-in and women were asked to fill in food dairies which were provided with feedback. Meal replacements were offered for free [67]. The behavioral weight loss intervention of Thurston et al. was a combination of individual sessions en group sessions to enhance social support. Participants were called by professionals or other group members when they missed meetings. The program was tailored to menopausal women by addressing issues such as dietary and activity choices in context of sleep loss; behavior change in the context of family, work, and caretaking demands; and physical activity choices with aging [55]. The participants in the Low-fat Diet and/or Exercise intervention of Cahmi et al. and Stefanic et al., met with a dietitian to establish individualized dietary recommendations and received  counseling  on how to achieve dietary goals through group sessions. They had monthly contact through individual appointments, group sessions, telephone calls, and/or mailings.

Effects

The dietary interventions reduce cardiovascular risks and effects are found on a variety of outcomes (table 1). Although the sizeof the effects of the studies are difficult to compare because participants and measurement procedures differ, effects seem to be small to moderate in general.

Adherence

In the behavioral weight loss study, participants followed a median of 80% of the weight loss sessions and 81% of the participants completed all measurements. In the NEW study, the participating women followed 86% of the diet change sessions. The WHI study and the Low-fat Diet and/or Exercise study reported no information on adherence.

Exercise interventions

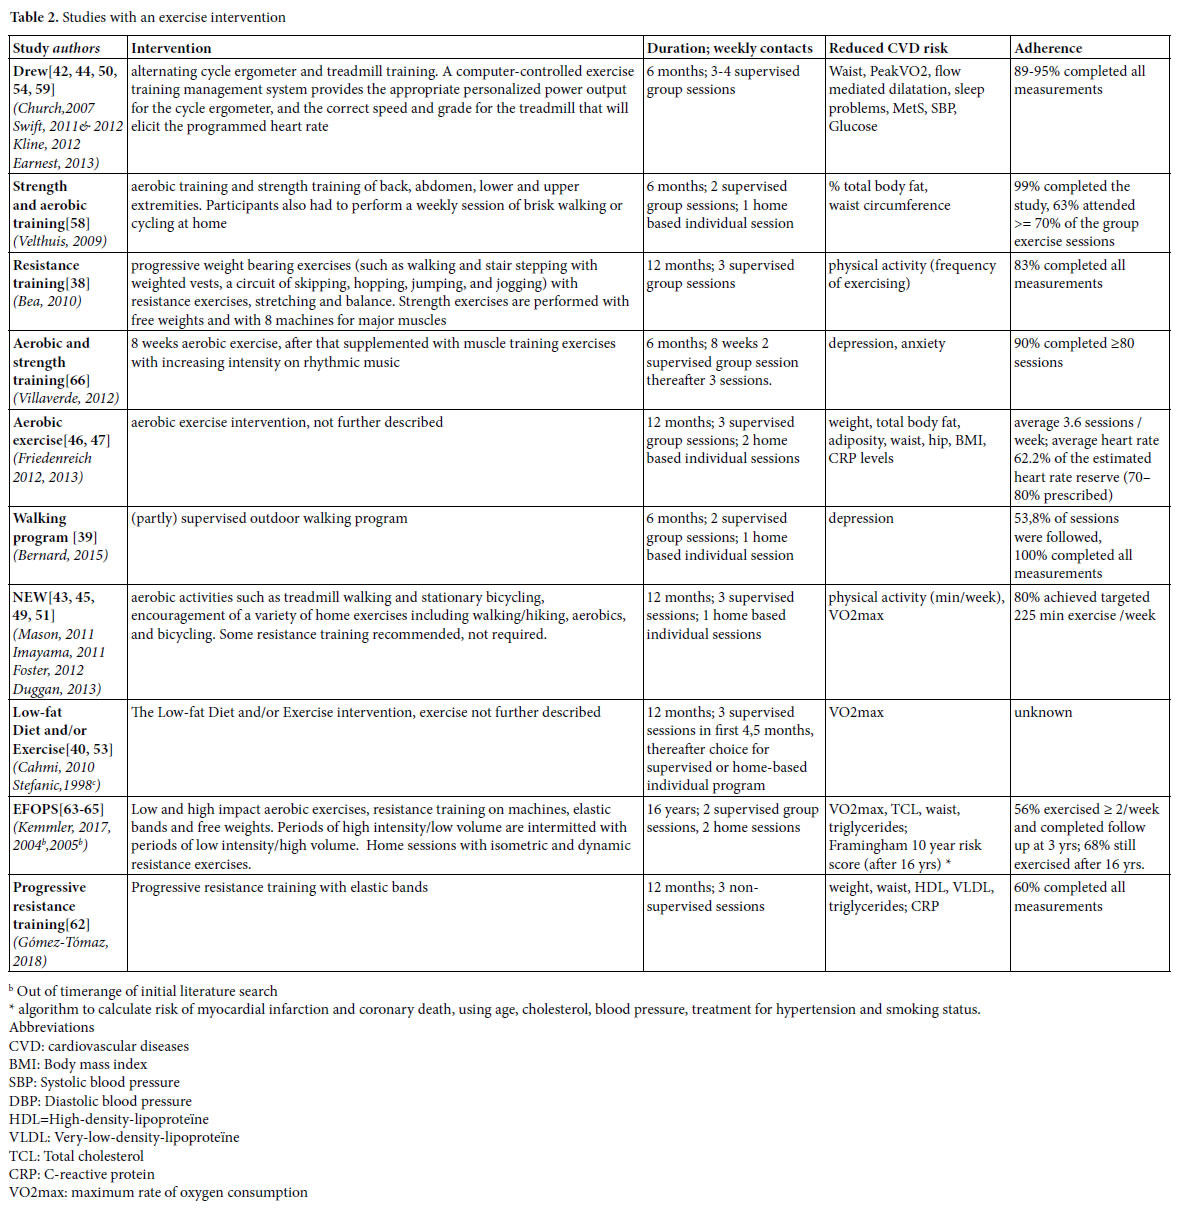
We found 10 studies (21 papers), with positive effects of an exercise intervention on the reduction of risk factors for CVD (Table 2). In the Dose Response to Exercise in Women (DREW) study, three intensities of cycle ergometer and treadmill training were compared with a control condition. The effects of strength and aerobic training were studied by Velthuis et al., by Villaverde Gutiérrez et al., in the exercise condition of the NEW study and in the EFOPS study. Friedenreich et al. studied the effects of an aerobic exercise intervention, but gave no details about the content, and also the exercise component of Low- fat Diet and/or Exercise intervention studied by Cahmi et al., and by Stefanic et al., was not described. Bea et al., and Gómez-Tomáz et al., studied the effects of progressive resistance training and Bernard et al., the effects of a walking program.

Strategies to increase adherence with exercise interventions

In the DREW study, participants started with six information sessions that emphasized the relevance of a healthy life and providing recommendations for healthy diet, stop smoking and alcohol reduction. Educational materials were distributed. Women were contacted when they missed a scheduled exercise session and heart rate monitors were distributed to monitor the (max 16) unsupervised exercise sessions that were allowed. Each woman was given up to $500 as an incentive to complete the study. In the aerobic exercise intervention studied by Friedenreich et al., heart rate monitors and weekly exercise logs were used to monitor adherence. Educational packages were provided that addressed relevant issues for women starting with exercising. The exercise program consisted of group sessions to permit interaction between participants. Women were contacted when they missed sessions and awarded when program milestones were reached.

The resistance training studied by Bea et al. encompassed a variety of reinforcement strategies to motivate participants such as education and skill development, self-efficacy, incentive programs, social support, and modeling. Participation was based on individual improvement rather than competition among participants. A social environment was created that challenged the women to improve their daily exercise performance. The support program further included exercise and goal-setting logs, regularly testing to monitor progress, and personal contracts. The strength and aerobic training of Velthuis et al., also used diverse techniques to enhance adherence such as group exercise sessions in combination with an individual program, personal feedback, realistic and regularly updated individual goals, and exercise logs to track frequency and duration of exercise. Training intensity was controlled by heart rate monitors. In the NEW study, session attendance was tracked to promote and monitor adherence. Women not meeting exercise targets were contacted to discuss barriers and approaches to increase activity. Exercise physiologists met regularly with a clinical health psychologist experienced in lifestyle behavior change to discuss participant progress and refine behavior modification goals according to each participant’s needs. Villaverde Gutiérrez et al., mentioned no specific adherence strategies other than social interaction with the group and the research team and a motivating approach from the trainer. In the EFOPS study, individual training logs were used to monitor attendance and compliance. Both The Low-fat Diet and/or Exercise study, and the study of Gómez- Tómas et al., on progressive resistance training, gave no information about adherence enhancing measures.

Effects

Just as the dietary interventions, the exercise interventions reduce cardiovascular risks. Diverse outcomes were measured with diverse instruments. Effects seem to be larger with increasing training intensity.[42, 44, 50].

Adherence

Adherence varied and was expressed in different manners, such as completion of planned measurements and/or attendance of the exercise sessions. In general, completion rates of the studies was high. In the walking program of Bernard et al., all participating women completed the measurements, in the strength and aerobic training programs 90- 99%, in the DREW study 89-95%, and in the study on resistance training 83%. In the EFOPS study, 78%, 79% and 69% of the women completed the measurements at two, three and 16 years follow up.

Attendance of sessions is measured differently. In the NEW study, 80% of the participants achieved the targeted 225 weekly minutes of exercise, in the aerobic exercise study of Friedenreich et al., women followed on average 3.6 of the required five weekly exercise sessions, in the strength and aerobic training 63% of the women attended more than 70% of the required sessions, and in the walking program 54% of the sessions were followed. In the EFOPS study, after three years 56% attended two of more training sessions and after 16 years, 69% of the women still exercised. The Low-fat Diet and/or Exercise study reported no information on adherence.

Interventions with a combination of diet and physical exercise

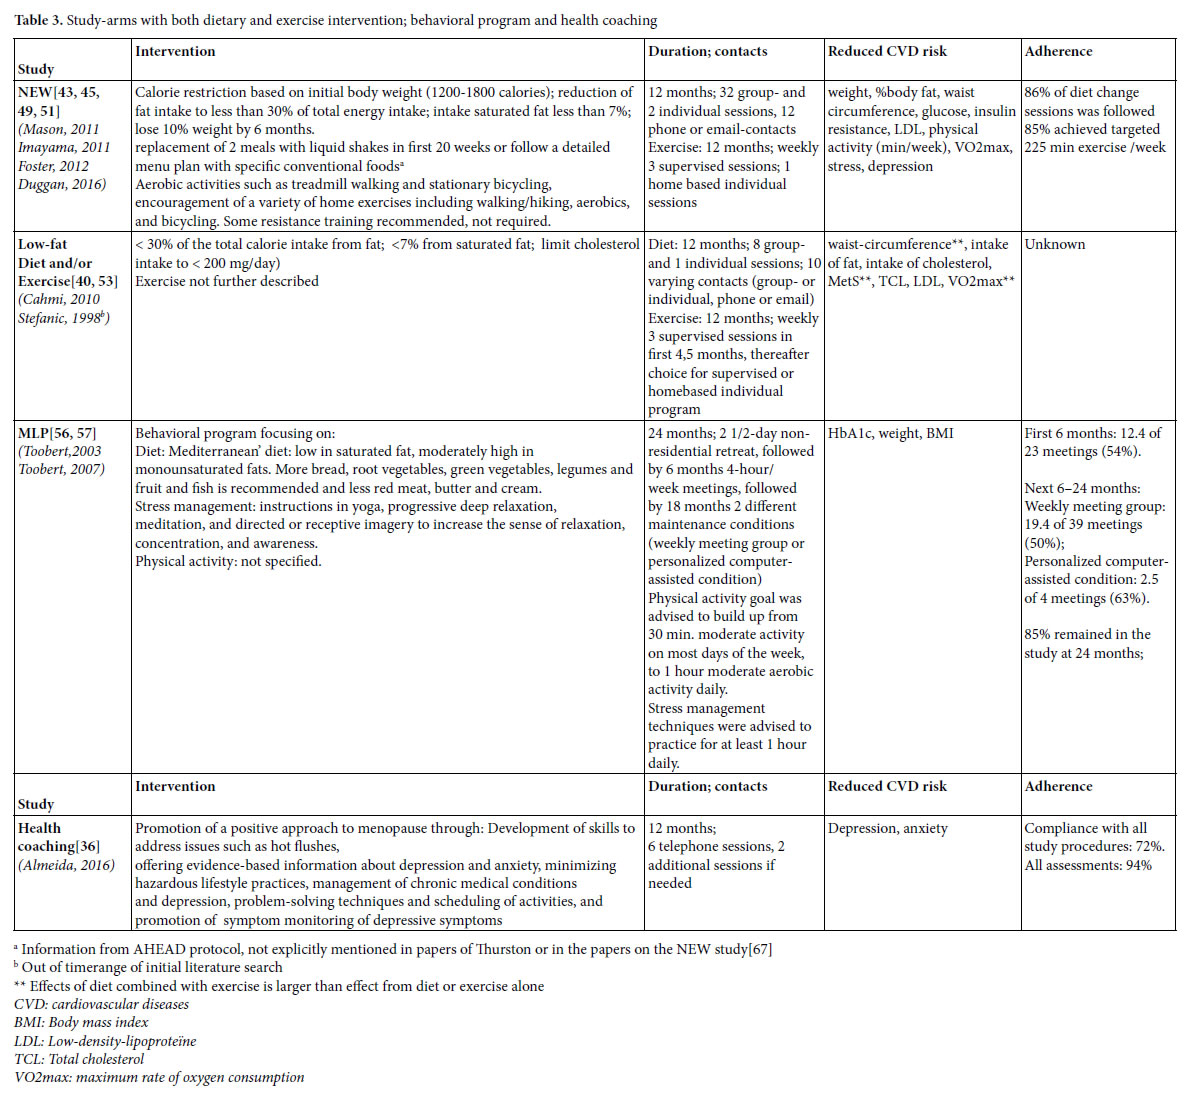
Three studies were found that combined diet and exercise (Table 3). The earlier described NEW study and Low-fat Diet and/or Exercise intervention used a three armed design and compared the effects

of diet, with those of exercise and with those of the combination of diet and exercise. Toobert et al., [56, 57] studies the effects of the Mediterranean Lifestyle Program (MLP), an intervention focusing on diet, physical exercise and stress-management together.

Behavioral components and other strategies to increase adherence

Components of the NEW study and the Low-fat Diet and/or Exercise are described earlier. The behavioral components of MLP were based on combined Social Cognitive Theory, Goal Systems, and Social Ecological Theory. Participants were able to set personal lifestyle change goals at the start of the intervention, and received ongoing peer and professional support for their goals throughout the treatment program. To enhance adherence, participants kept a log of adherence to the diet (self-monitoring), contests with cash prize were held, incentives such as small presents were given, and participants were called by professionals or group members when meetings were missed.

Effects

The combined interventions reduce cardiovascular risks and effects are found on a variety of outcomes (Table 3). In general, effects are larger than those achieved with a dietary program or physical exercise alone.

Adherence

In the NEW study 86% of diet change sessions was followed and 85% of the women complied with the targeted 225 minutes weekly exercise. In the MLP study, 85% of the women remained in the study after two years, but attendance of the meetings itself was rather poor. In the first 6 months 54% of the meetings were attended. In the next 18 months, 50% of the meetings were attended by the group that received weekly (follow up) meetings, while in the follow up condition with personalized computer-assistance attendance of the sessions was 63%. Adherence in the Low-fat Diet and/or Exercise study was not described.

Health Coaching

Almeida studied the effects of a health coaching program and found an effect on depression and anxiety. The intervention was delivered by a trained psychologist. Ninety-four percent of the women completed all measurements and 72% complied with all study procedures.

Discussion

We found 14 lifestyle interventions that report a sustainable reduction of cardiovascular risk in (post)menopausal women. These interventions apply dietary guidance, exercise programs, health coaching, or a combination of these elements. Although the type of prescribed diet varies, reduction of fat and calories are common features and all dietary interventions apply behavioral change techniques. The exercise programs vary in type of movement, but almost all are group based, supervised by a professional and performed in a fitness center, except the progressive resistance training of Gómez- Tómas et al. which was monitored on a distance by the principal investigator [62] and Bernard et al.’s walking program [39]. Exercises are in general of modest intensity.  Most interventions, dietary as  well as exercise programs, are characterized by very large number of contacts. Dietary guidance is given in group sessions, supplemented with individual face to face contacts, phone calls and/or emails. The number of exercise sessions varies from three to five times a week, with a mix of supervised exercises and home assignments. Furthermore, in all interventions participants are intensively guided by several highly educated professionals such as dietitians, fitness-trainers, physiotherapists, physiologists, stress-management instructors, and professional or lay support group leaders.

Although it is difficult to estimate the magnitude of the effects in the studies, effects seem to be small to moderate. Apparently, even a relatively small reduction of cardiovascular risks such as blood pressure and weight with lifestyle interventions requires much time and effort. However, especially in postmenopausal women even small weight loss or prevention of further weight gain and deterioration of blood values is clinically relevant [69]. Effects were largest when diet and exercise were combined, a finding that corresponds with international literature on lifestyle interventions in the general population [70]  and postmenopausal women [71]. Although the studies provide insufficient information to relate effects to the specific elements of the intervention (type of diet or exercise), a cautious conclusion may be that the exact content of an intervention matters less, as long as the interventions are intensive enough and participants adhere. This is consistent with a meta-analysis of Johnston on the effectiveness of different diet programs, who suggested that patients may best choose the diet that gives them the least challenges with adherence [72, 73]. There is little reason to believe that this is different for exercising.

It is obvious that adherence to lifestyle-interventions is an important issue, and a second aim of our study was to determine which strategies are effective to enhance adherence for women around the menopause. Although not all studies describe adherence strategies in detail, several strategies are found (Tables 1-3). Especially dietary interventions use behavioral strategies to stimulate sustainable lifestyle changes such as provision of knowledge, problem solving and coping strategies, goal setting and training of skills. Both dietary and exercise interventions used peer support to enhance adherence to   the sessions, by offering the intervention in a group, and in several studies participants were telephoned when they missed a session. Progress and adherence was measured through self-monitoring and in some studies incentives up to cash prizes of 500 dollar were given. In general, it seems that a high effort to keep women in the program results in relatively good adherence. The EFOPS study seems to be an exception to this, because no real strategies to increase adherence are applied and yet 67% of women still exercise after 16 years. Women were able to choose to participate in the exercise group themselves, and the authors interpret their results as a further indication that lifelong training is reserved for highly motivated postmenopausal women who are willing and able to attend intensive training programs [63].

The high frequency of sessions, intensive guidance of professionals and the high effort to enhance adherence in the studies indeed raise the question whether the found interventions are applicable to a large

population in daily practice. It is recognized that behavioral change such as adapting a healthy lifestyle takes time and effort. However, in the Dutch health care system, dietary guidance is reimbursed for three hours a year, unless patients are additionally insured. Most exercise programs found were performed in supervised fitness centers, and the interventions may be too expensive for some women, especially for women from a lower socioeconomic status who are more at risk for cardiovascular disease. So it is important to find other ways to achieve the same results, for example with the use of blended care in which face to face contacts with a professional in a group are combined with a Health support or through telephonic contacts such as in the health coaching intervention of Almeida [36].

In addition to possible financial barriers, it can be doubted whether such intensive physical exercise programs and diets appeal to women. Especially in the menopausal transition, women often suffer from musculoskeletal pain [17-20] which may increase with intensive exercising. Mood and stress disorders accompanying the menopause and demands from everyday family life or work, may interfere with the strict dietary demands. Remarkably, only two studies were found that focused explicitly on women in the menopausal transition and their specific health problems [36, 55]. The rather strict dietary intervention of Thurston addresses issues as dietary and activity in context of sleep loss, family, work and caretaking demands, and reduces weight and fat% [55]. Thurston also showed that women who lost weight experienced less hot flushes, and participating women reported that this was a motivator to adhere to the study.

The health coaching intervention from Almeida promotes a positive approach of the menopause  and  diminishes  depression  and anxiety [36]. The other 9 studies however, also included post- menopausal women, some of them closely around the menopause, but others up to the age of 79 years [37]. So there is obviously a gap in the literature regarding effective lifestyle programs for women in the menopausal transition. Also Jull et al. who performed a review on lifestyle interventions targeting body weight changes during the menopause transition only found one randomized (western) study from 2003 [74].

Still, we argue that the onset of the menopause could just be a good starting point for changing lifestyle, since lifestyle interventions not only reduce cardiovascular risks, but may also diminish specific symptoms of the menopause. Reductions in weight, BMI and abdominal circumference have been associated with a reduction in vasomotor symptoms and physical exercise may reduce feelings of depression and stress [55, 75, 76]. Prerequisites for such lifestyle interventions are that they are attractive for women around the menopause, take their day to day (menopausal) health problems into account and fit into women’s life and daily routines [13, 15]. In our study we have focused on interventions with sustainable, positive effects on cardiovascular risks and the result is that we have found relatively intensive interventions, that may  appeal  less to this group.  The search  for, or development  of interventions that are less intensive but still effective in reducing cardiovascular risks for women around the menopause is challenging. To reduce cardiovascular risks, people should preferably change their lifestyle for the rest of their life, so strategies need to be realistic. Based on life style coaching approaches used in the Diabetes Prevention Program, Vendetti et al assumed that problem solving approaches and self-monitoring tools are  essential to overcome  barriers to adhere  to a healthy diet and physical activity [15] so these elements should be incorporated in future interventions. Finally, we think that it is very important to take the views and experiences of the target group itself into account in the development of such strategies.

Limitations of the Study

The purpose of this study was to provide an overview of sustainable, effective lifestyle interventions to reduce the risk of CVD for women (starting) from the menopause. For that reason we selected studies that reported significant positive effects on cardiovascular risks in our target population. As a result, our study cannot be interpreted as a systematic overview of all types of interventions aiming at reducing cardiovascular risks. However, the effective interventions or elements of these interventions that were found, can be used as a starting point for further development of more feasible interventions, and by professionals in daily practice to guide women who want to decrease their CVD risk. The strength of our study is that we only selected randomized studies, which offers the highest level of evidence. A disadvantage is however, that these studies often include a relatively healthy sample of participants, which limits the generalizability to daily practice.

Conclusion

There are interventions that sustainably  reduce  cardiovascular  risk factors for women from the menopause. These interventions are characterized by intensive strategies such as meal replacements and frequent exercise sessions, frequent personal, face to face contacts, and great efforts to increase adherence. Apparently, lowering cardiovascular risks through lifestyle interventions demands considerable efforts from women, health care providers, trainers and coaches to guarantee effects and adherence. The question is whether large scale implementation is feasible with regard to costs, willingness of the target group and capacity of the professionals. The challenge is to develop sustainable effective interventions that are less intensive and require less strategies to guarantee adhere. These interventions should be tailored to the specific needs and health problems of women from the menopause, and best be developed in dialogue with the target group itself.

Supplements

S1: Search strategy. The document describes the search strategy across electronic databases and search engines.

S2: Characteristics of the included studies.

Competing Interest

Liset van Dijk received funding from Astra Zeneca, Pfizer and Abbvie for studies not related to this study; Marcia Vervloet received funding from Pfizer and Abbvie for studies not related to this study.

Funding

This research was funded  by  the  Dutch  Heart  Foundation.  The views expressed in this article are those of the authors and not necessarily those of the Dutch Heart Foundation.

Authors’Contribution

CL, JK, LvD and MV developed the design of the study and screened abstracts and titles. CL and JK screened full texts and performed the analysis. All co-authors contributed to the interpretation of the data. CL and JK drafted the manuscript and all co-authors commented on the draft and approved the final manuscript.

Acknowledgement

We would like to thank Linda Schoonmade, information specialist for designing and piloting search terms and performing the electronic searches.

References

  1. Townsend N, Wilson L, Bhatnagar P, Wickramasinghe K, Rayner M, et al., (2016) Cardiovascular disease in Europe: Epidemiological update 2016. European heart journal 37: 3232-3245. [crossref]
  2. Mosca L, Benjamin, EJ, Berra, K, Bezanson JL, Dolor RJ, et al., (2011) Effectiveness- Based Guidelines for the Prevention of Cardiovascular Disease in Women-2011 Update: A Guideline From the American Heart Association. Circulation 123: 1243- 1262.
  3. Mercuro G, Deidda M, Bina A, Manconi E, Rosano GM (2011) Gender-specific aspects in primary and secondary prevention of cardiovascular disease. Current pharmaceutical design 17: 1082-1089. [crossref]
  4. Vassalle C, Simoncini T, Chedraui P, Perez-Lopez FR (2012) Why sex matters: The biological mechanisms of cardiovascular disease. Gynecological endocrinology 28: 746-751. [crossref]
  5. Wenger NK (2011) What do the 2011 American Heart Association guidelines tell us about prevention of cardiovascular disease in women? Clinical cardiology 34: 520-523. [crossref]
  6. EXECUTIVE SUMMARY. The Third Report of the National Cholesterol Education Program (NCEP) Expert Panel on Detection, Evaluation, and Treatment of High Blood Cholesterol In Adults JAMA cardiology 2001, 285:2486-2497.
  7. Clinical Guidelines on the Identification, Evaluation, and Treatment of Overweight and Obesity in Adults. The Evidence Report. Rockville; 1998.
  8. Centers for Disease Control and Prevention, Menopause: Women’s Reproductive Health http://www.cdc.gov/reproductivehealth/WomensRH/Menopause.htm
  9. Collins P, Rosano G, Casey C, Daly C, Gambacciani M, et al., (2007) Management of cardiovascular risk in the peri-menopausal woman: A consensus statement of European cardiologists and gynaecologists. European heart journal 28: 2028-2040. [crossref]
  10. Flodgren G, Deane K, Dickinson HO, Kirk S, Alberti H, et al., (2010) Interventions to change the behaviour of health professionals and the organisation of care to promote weight reduction in overweight and obese people. The Cochrane database of systematic reviews 3: 000984. [crossref]
  11. Appelman Y, van Rijn BB, Ten Haaf ME, Boersma E, Peters SA, et al., (2015) Sex differences in cardiovascular risk factors and disease prevention. Atherosclerosis 241: 211-218. [crossref]
  12. Leblanc V, Begin C, Hudon AM, Royer MM, Corneau L, et al., (2014) Gender differences in the long-term effects of a nutritional intervention program promoting the Mediterranean diet: Changes in dietary intakes, eating behaviors, anthropometric and metabolic variables. Nutrition journal 13: 107. [crossref]
  13. Segar M, Jayaratne T, Hanlon J, Richardson CR (2002) Fitting fitness into women’s lives: effects of a gender-tailored physical activity intervention.Women’s Reproductive Health http://www.cdc.gov/reproductivehealth/WomensRH/Menopause.htm
  14. Egli T, Bland HW, Melton BF, Czech DR (2011) Influence of age, sex, and race on college students’ exercise motivation of physical activity. Journal of American college health. J Am Coll Health 59: 399-406. [crossref]
  15. Venditti EM, Wylie-Rosett J, Delahanty LM, Mele L, Hoskin MA, et al., (2014) Short and long-term lifestyle coaching approaches used to address diverse participant barriers to weight loss and physical activity adherence. The international journal of behavioral nutrition and physical activity 11: 16. [crossref]
  16. Verhoef MJ, Love EJ, Rose MS (1992) Women’s social roles and their exercise participation. Women & health 19: 15-29. [crossref]
  17. Depypere H, Pintiaux A, Desreux J, Hendrickx M, Neven P, et al., (2016) Coping with menopausal symptoms: An internet survey of Belgian postmenopausal women. Maturitas 90: 24-30. [crossref]
  18. Dugan SA, Powell LH, Kravitz HM, Everson Rose SA, et al. (2006) Musculoskeletal pain and menopausal status. The Clinical journal of pain 22: 325-331. [crossref]
  19. Frange C, Hachul H, Hirotsu C, Tufik S, Andersen ML, et al., (2018) Insomnia with Musculoskeletal Pain in Postmenopause: Associations with Symptoms, Mood, and Quality of Life. Journal of menopausal medicine 24: 17-28. [crossref]
  20. Hoga L, Rodolpho J, Goncalves B, Quirino B (2015) Women’s experience of menopause: a systematic review of qualitative evidence. JBI database of systematic reviews and implementation reports 13: 250-337. [crossref]
  21. Campesi I, Franconi F, Seghieri G, Meloni M (2017)  Sex-gender-related therapeutic approaches for cardiovascular complications associated with diabetes. Pharmacological research 119: 195-207. [crossref]
  22. Charkoudian N, Rabbitts JA (2009) Sympathetic neural mechanisms in human cardiovascular health and disease. Mayo Clinic proceedings 84: 822-830. [crossref]
  23. Collins P, Webb CM, de Villiers TJ, Stevenson JC, Panay N, et al., (2016) Cardiovascular risk assessment in women – an update. Climacteric 19: 329-336. [crossref]
  24. Di Giosia P, Passacquale G, Petrarca M, Giorgini P, Marra AM, et al., (2017) Gender differences in cardiovascular prophylaxis: Focus on antiplatelet treatment. Pharmacological research 119: 36-47. [crossref]
  25. Di Pilla M, Bruno RM, Taddei S, Virdis A (2016) Gender differences in the relationships between psychosocial factors and hypertension. Maturitas 2016, 93: 58-64. [crossreff]
  26. Katsiki N, Mikhailidis DP (2015) Emerging Vascular Risk Factors in Women: Any Differences from Men? Current medicinal chemistry 22: 3565-3579. [crossref]
  27. Llaneza P, Garcia-Portilla MP, Llaneza-Suarez D, Armott B, Pérez-López FR, et al., (2012) Depressive disorders and the menopause transition. Maturitas 71: 120-130. [crossref]
  28. McKibben RA, Al Rifai M, Mathews LM, Michos ED (2016) Primary Prevention of Atherosclerotic Cardiovascular Disease in Women. Current cardiovascular risk reports 10: 01.
  29. Mosca L, Barrett-Connor E, Wenger NK (2011) Sex/gender differences in cardiovascular disease prevention: What a difference a decade makes. Circulation 124: 2145-2154. [crossref]
  30. Pedersen LR, Frestad D, Michelsen MM, Mygind ND, Rasmusen H, et al., (2016) Risk Factors for Myocardial Infarction in Women and Men: A Review of the Current Literature. Current pharmaceutical design, 22: 3835-3852. [crossref]
  31. Prata J, Ramos S, Martins AQ, Rocha-Goncalves F, et al., (2014) Women with coronary artery disease: Do psychosocial factors contribute to a higher cardiovascular risk? Cardiology in review 22: 25-29.
  32. Roberts ME, Davis, LL (2013) Cardiovascular Disease in Women: A Nurse Practitioner’s Guide to Prevention. The Journal for Nurse Practitioners 2013: 679-687.
  33. Stranges S, Guallar E (2012) Cardiovascular disease prevention in women: A rapidly evolving scenario. Nutrition, metabolism, and cardiovascular diseases 22: 1013-1018. [crossref]
  34. Vitale C, Mendelsohn ME, Rosano GM (2009) Gender differences in the cardiovascular effect of sex hormones. Nature reviews Cardiology 6: 532-542. [crossref]
  35. Vitale C, Miceli M, Rosano GM (2007) Gender-specific characteristics of atherosclerosis in menopausal women: risk factors, clinical course and strategies for prevention. Climacteric 2: 16-20. [crossref]
  36. Almeida OP, Marsh K, Murray K, Hickey M, Sim M, et al., (2016) Reducing depression during the menopausal transition with health coaching: Results from  the healthy menopausal transition randomised controlled trial. Maturitas 92: 41-48. [crossref]
  37. Assaf AR, Beresford SA, Risica PM, Aragaki A, Brunner RL, et al., (2016) Low- Fat Dietary Pattern Intervention and Health-Related Quality of Life: The Women’s Health Initiative Randomized Controlled Dietary Modification Trial. Journal of the Academy of Nutrition and Dietetics 116: 259-271. [crossref]
  38. Bea JW, Cussler EC, Going SB, Blew RM, Metcalfe LL, et al., (2010) Resistance training predicts 6-yr body composition change in postmenopausal women. Medicine and science in sports and exercise 42: 1286-1295. [crossref]
  39. Bernard P, Ninot G, Bernard PL, Picot MC, et al., (2015) Effects of a six-month walking intervention on depression in inactive post-menopausal women: A randomized controlled trial. Aging & mental health 19: 485-492. [crossref]
  40. Camhi SM, Stefanick ML, Katzmarzyk PT, Young DR (2010) Metabolic syndrome and changes in body fat from a low-fat diet and/or exercise randomized controlled trial. Obesity (Silver Spring, Md) 18: 548-554. [crossref]
  41. Carty CL, Kooperberg C, Neuhouser ML, Tinker L, Howard B , et al., (2011) Low- fat dietary pattern and change in body-composition traits in the Women’s Health Initiative Dietary Modification Trial. The American journal of clinical nutrition 93: 516-524. [crossref]
  42. Church TS, Earnest CP, Skinner JS, Blair SN (2007) Effects of different doses of physical activity on cardiorespiratory fitness among sedentary, overweight or obese postmenopausal women with elevated blood pressure: A randomized controlled trial. Jama 29: 2081-2091. [crossref]
  43. Duggan C, Tapsoba JD, Wang CY, Campbell KL, Foster-Schubert K , et al., (2016) Dietary Weight Loss, Exercise, and Oxidative Stress in Postmenopausal Women: A Randomized Controlled Trial. Cancer prevention research (Philadelphia, Pa) 9: 835- 843. [crossref]
  44. Earnest CP, Johannsen NM, Swift DL, Lavie CJ, Blair SN, et al., (2013) Dose effect of cardiorespiratory exercise on metabolic syndrome in postmenopausal women. The American journal of cardiology 111: 1805-1811. [crossref]
  45. Foster-Schubert KE, Alfano CM, Duggan CR, Xiao L, Campbell KL, et al., (2012) Effect of diet and exercise, alone or combined, on weight and body composition in overweight-to-obese postmenopausal women. Obesity (Silver Spring, Md) 20: 1628- 1638. [crossref]
  46. Friedenreich CM, Neilson HK, Woolcott CG, Wang Q, Stanczyk FZ, et al., (2012) Inflammatory marker changes in a yearlong randomized exercise intervention trial among postmenopausal women. Cancer prevention research 5: 98-108. [crossref]
  47. Friedenreich CM, Woolcott CG, McTiernan A, Terry T, Brant R, et al., (2011) Adiposity changes after a 1-year aerobic exercise intervention among postmenopausal women: a randomized controlled trial. International journal of obesity 35: 427-435. [crossref]
  48. Howard BV, Curb JD, Eaton CB, Kooperberg C, Ockene J, et al., (2010) Low-fat dietary pattern and lipoprotein risk factors: the Women’s Health Initiative Dietary Modification Trial. The American journal of clinical nutrition 91: 860-874. [crossref]
  49. Imayama I, Alfano CM, Kong A, Foster-Schubert KE, Bain CE, et al., (2011) Dietary weight loss and exercise interventions effects on quality of life in overweight/obese postmenopausal women: a randomized controlled trial. The international journal of behavioral nutrition and physical activity 8: 118. [crossref]
  50. Kline CE, Sui X, Hall MH, Youngstedt  SD,  et al., (2012) Dose-response effects    of exercise training on the subjective sleep quality of postmenopausal women: exploratory analyses of a randomised controlled trial. BMJ open 2.
  51. Mason C, Foster-Schubert KE, Imayama I, Kong A, Xiao L, et al., (2011) Dietary weight loss and exercise effects on insulin resistance in postmenopausal women. American journal of preventive medicine 41: 366-375. [crossref]
  52. Shikany JM, Margolis KL, Pettinger M, Jackson RD, Limacher MC, et al., (2011) Effects of a low-fat dietary intervention on glucose, insulin, and insulin resistance in the Women’s Health Initiative (WHI) Dietary Modification trial. The American journal of clinical nutrition 94: 75-85. [crossref]
  53. Stefanick ML, Mackey S, Sheehan M, Ellsworth N, Haskell WL, et al., (1998) Effects of diet and exercise in men and postmenopausal women with low levels of HDL cholesterol and high levels of LDL cholesterol. The New England journal of medicine 339: 12-20. [crossref]
  54. Swift DL, Earnest CP, Blair SN, Church TS (2011) The effect of different doses of aerobic exercise training on endothelial function in postmenopausal women with elevated blood pressure: results from the DREW study. Br J Sports Medicine 46: 753- 758. [crossref]
  55. Thurston RC, Ewing LJ, Low CA, Christie AJ, Levine MD, et al., (2015) Behavioral weight loss for the management of menopausal hot flashes: a pilot study. Menopause 22: 59-65. [crossref]
  56. Toobert DJ, Glasgow RE, Strycker LA, Barrera M, Radcliffe JL, et al., (2003) Biologic and quality-of-life outcomes from the Mediterranean Lifestyle Program: a randomized clinical trial. Diabetes care 26: 2288-2293. [crossref]
  57. Toobert DJ, Glasgow RE, Strycker LA, Barrera M, Ritzwoller DP, et al., (2007) Long- term effects of the Mediterranean lifestyle program: a randomized clinical trial for postmenopausal women with type 2 diabetes. The international journal of behavioral nutrition and physical activity 4:1. [crossref]
  58. Velthuis MJ, Schuit AJ, Peeters PH, Monninkhof EM. (2009) Exercise program affects body composition but not weight in postmenopausal women. Menopause 16: 777- 784. [crossref]
  59. Swift DL, Earnest CP, Katzmarzyk PT, Rankinen T, Blair SN, et al., (2012) The effect of different doses of aerobic exercise training on exercise blood pressure in overweight and obese postmenopausal women. Menopause 19: 503-509. [crossref]
  60. Liberati A, Altman DG, Tetzlaff J, Mulrow C, Gøtzsche PC, et al. (2009) The PRISMA statement for reporting systematic reviews and meta-analyses of studies that evaluate health care interventions: explanation and elaboration. PLoS medicine 6: 1000100. [crossref]
  61. Howard BV, Aragaki AK, Tinker LF, Allison M, Hingle MD et al., (2018) A Low- Fat Dietary Pattern and Diabetes: A Secondary Analysis From the Women’s Health Initiative Dietary Modification Trial. Diabetes care 41: 680-687. [crossref]
  62. Gomez-Tomas C, Chulvi-Medrano I, Carrasco JJ, Alakhdar Y (2018) Effect of a 1-year elastic band resistance exercise program on cardiovascular risk profile in postmenopausal women. Menopause 25: 1004-1010. [crossref]
  63. Kemmler W, Kohl M, von Stengel S (2017) Long-term effects of exercise in postmenopausal women: 16-year results of the Erlangen Fitness and Osteoporosis Prevention Study (EFOPS). Menopause 24: 45-51. [crossref]
  64. Kemmler W, Lauber D, Weineck J, Hensen J, Kalender W, et al., (2004) Benefits of 2 years of intense exercise on bone density, physical fitness, and blood lipids in early postmenopausal osteopenic women: results of the Erlangen Fitness Osteoporosis Prevention Study (EFOPS). Archives of internal medicine 164: 1084-1091. [crossref]
  65. Kemmler W, von Stengel S, Weineck J, Lauber D, Kalender W, et al., (2005) Exercise effects on menopausal risk factors of early postmenopausal women: 3-yr Erlangen fitness osteoporosis prevention study results. Medicine and science in sports and exercise 37: 194-203. [crossref]
  66. Villaverde Gutierrez C, Torres Luque G, Abalos Medina GM, Argente del Castillo MJ, Guisado IM, et al., (2012) Influence of exercise on mood in postmenopausal women. Journal of clinical nursing 21: 923-928. [crossref]
  67. Look AHEAD Research Group, Wadden TA, West DS, Delahanty L, Jakicic J (2006) The Look AHEAD Study: A Description of the lifestyle intervention and the evidence supporting it. Obesity 14: 737-752. [crossref]
  68. (1999) The Diabetes Prevention Program. Design and methods for a clinical trial in the prevention of type 2 diabetes. Diabetes care 22: 623-634. [crossref]
  69. Simkin-Silverman LR, Wing RR. (2000) Weight gain during menopause. Is it inevitable or can it be prevented? Postgraduate medicine 108: 46-53. [crossref]
  70. Johns DJ, Hartmann-Boyce J, Jebb SA, Aveyard P (2014) Diet or exercise interventions vs combined behavioral weight management programs: a systematic review and meta-analysis of direct comparisons. Journal of the Academy of Nutrition and Dietetics 114: 1557-1568. [crossref]
  71. Cheng CC, Hsu CY, Liu JF (2018) Effects of dietary and exercise intervention on weight loss and body composition in obese postmenopausal women: a systematic review and meta-analysis. Menopause 25: 772-782. [crossref]
  72. Sharma AM (2015) Weight-loss diets only work when you follow them. Evidence- based medicine 20: 103-104.
  73. Johnston BC, Kanters S, Bandayrel K, Wu P, Naji F et al. (2014) Comparison of weight loss among named diet programs in overweight and obese adults: a meta-analysis. Jama 312: 923-933. [crossref]
  74. Jull J, Stacey D, Beach S, Dumas A, Strychar I, et al., (2014) Lifestyle interventions targeting body weight changes during the menopause transition: a systematic review. Journal of obesity 2014: 824310. [crossref]
  75. North American Menopause Society (2004) Treatment of menopause-associated vasomotor symptoms: position statement of The North American Menopause Society. Menopause 11: 11-33. [crossref]
  76. Huang AJ, Subak LL, Wing R, West DS, Hernandez AL, et al., (2010) An intensive behavioral weight loss intervention and hot flushes in women. Archives of internal medicine 170: 1161-1167. [crossref]

Supplementary Information

AWHC-3-2-308-s001

AWHC-3-2-308-s002

References

  1. Howard BV, Curb JD, Eaton CB, Kooperberg C, et al. Low-fat dietary pattern and lipoprotein risk factors: the Women’s Health Initiative Dietary Modification Trial. The American journal of clinical nutrition 2010, 91(4):860-874.
  2. Shikany JM, Margolis KL, Pettinger M, Jackson RD, et al. Effects of a low-fat dietary intervention on glucose, insulin, and insulin resistance in the Women’s Health Initiative (WHI) Dietary Modification trial. The American journal of clinical nutrition 2011, 94(1):75-85.
  3. Carty CL, Kooperberg C, Neuhouser ML, Tinker L, et al. Low-fat dietary pattern and change in body-composition traits in the Women’s Health Initiative Dietary Modification Trial. The American journal of clinical nutrition 2011, 93(3):516-524.
  4. Assaf AR, Beresford SA, Risica PM, Aragaki A, et al. Low-Fat Dietary Pattern Intervention and Health-Related Quality of Life: The Women’s Health Initiative Randomized Controlled Dietary Modification Trial. Journal of the Academy of Nutrition and Dietetics 2016, 116(2):259-271.
  5. Thurston RC, Ewing LJ, Low CA, Christie AJ, et al. Behavioral weight loss for the management of menopausal hot flashes: a pilot study. Menopause (New York, NY) 2015, 22(1):59-65.
  6. Church TS, Earnest CP, Skinner JS, Blair SN. Effects of different doses of physical activity on cardiorespiratory fitness among sedentary, overweight or obese postmenopausal women with elevated blood pressure: a randomized controlled trial. Jama 2007, 297(19):2081-2091.
  7. Swift DL, Earnest, C.P., Blair, S.N., Church, T.S. The effect of different doses of aerobic exercise training on endothelial function in postmenopausal women with elevated blood pressure: results from the DREW study. Br J Sports Medicine 2011, 46(10):753-758.
  8. Swift DL, Earnest CP, Katzmarzyk PT, Rankinen T, et al. The effect of different doses of aerobic exercise training on exercise blood pressure in overweight and obese postmenopausal women. Menopause (New York, NY) 2012, 19(5):503-509.
  9. Kline CE, Sui X, Hall MH, Youngstedt SD, et al. Dose-response effects of exercise training on the subjective sleep quality of postmenopausal women: exploratory analyses of a randomised controlled trial. BMJ open 2012, 2(4).
  10. Earnest CP, Johannsen NM, Swift DL, Lavie CJ, et al. Dose effect of cardiorespiratory exercise on metabolic syndrome in postmenopausal women. The American journal of cardiology 2013, 111(12):1805-1811.
  11. Velthuis MJ, Schuit AJ, Peeters PH, Monninkhof EM. Exercise program affects body composition but not weight in postmenopausal women. Menopause (New York, NY) 2009, 16(4):777-784.
  12. Bea JW, Cussler EC, Going SB, Blew RM, et al. Resistance training predicts 6-yr body composition change in postmenopausal women. Medicine and science in sports and exercise 2010, 42(7):1286-1295.
  13. Villaverde Gutierrez C, Torres Luque G, Abalos Medina GM, Argente del Castillo MJ, et al. Influence of exercise on mood in postmenopausal women. Journal of clinical nursing 2012, 21(7-8):923-928.
  14. Friedenreich CM, Woolcott CG, McTiernan A, Terry T, et al. Adiposity changes after a 1-year aerobic exercise intervention among postmenopausal women: a randomized controlled trial. International journal of obesity (2005) 2011, 35(3):427-435.
  15. Friedenreich CM, Neilson HK, Woolcott CG, Wang Q, et al. Inflammatory marker changes in a yearlong randomized exercise intervention trial among postmenopausal women. Cancer prevention research (Philadelphia, Pa) 2012, 5(1):98-108.
  16. Bernard P, Ninot G, Bernard PL, Picot MC, et al. Effects of a six-month walking intervention on depression in inactive post-menopausal women: a randomized controlled trial. Aging & mental health 2015, 19(6):485-492.
  17. Kemmler W, Lauber D, Weineck J, Hensen J, et al. Benefits of 2 years of intense exercise on bone density, physical fitness, and blood lipids in early postmenopausal osteopenic women: results of the Erlangen Fitness Osteoporosis Prevention Study (EFOPS). Archives of internal medicine 2004, 164(10):1084-1091.
  18. Kemmler W, von Stengel S, Weineck J, Lauber D, et al. Exercise effects on menopausal risk factors of early postmenopausal women: 3-yr Erlangen fitness osteoporosis prevention study results. Medicine and science in sports and exercise 2005, 37(2):194-203.
  19. Kemmler W, Kohl M, von Stengel S. Long-term effects of exercise in postmenopausal women: 16-year results of the Erlangen Fitness and Osteoporosis Prevention Study (EFOPS). Menopause (New York, NY) 2017, 24(1):45-51.
  20. Gomez-Tomas C, Chulvi-Medrano I, Carrasco JJ, Alakhdar Y. Effect of a 1-year elastic band resistance exercise program on cardiovascular risk profile in postmenopausal women. Menopause (New York, NY) 2018, 25(9):1004-1010.
  21. Mason C, Foster-Schubert KE, Imayama I, Kong A, et al. Dietary weight loss and exercise effects on insulin resistance in postmenopausal women. American journal of preventive medicine 2011, 41(4):366-375.
  22. Imayama I, Alfano CM, Kong A, Foster-Schubert KE, et al. Dietary weight loss and exercise interventions effects on quality of life in overweight/obese postmenopausal women: a randomized controlled trial. The international journal of behavioral nutrition and physical activity 2011, 8:118.
  23. Foster-Schubert KE, Alfano CM, Duggan CR, Xiao L, et al. Effect of diet and exercise, alone or combined, on weight and body composition in overweight-to-obese postmenopausal women. Obesity (Silver Spring, Md) 2012, 20(8):1628-1638.
  24. Duggan C, Tapsoba JD, Wang CY, Campbell KL, et al. Dietary Weight Loss, Exercise, and Oxidative Stress in Postmenopausal Women: A Randomized Controlled Trial. Cancer prevention research (Philadelphia, Pa) 2016, 9(11):835-843.
  25. Stefanick ML, Mackey S, Sheehan M, Ellsworth N, et al. Effects of diet and exercise in men and postmenopausal women with low levels of HDL cholesterol and high levels of LDL cholesterol. The New England journal of medicine 1998, 339(1):12-20.
  26. Camhi SM, Stefanick ML, Katzmarzyk PT, Young DR. Metabolic syndrome and changes in body fat from a low-fat diet and/or exercise randomized controlled trial. Obesity (Silver Spring, Md) 2010, 18(3):548-554.
  27. Toobert DJ, Glasgow RE, Strycker LA, Barrera M, et al. Biologic and quality-of-life outcomes from the Mediterranean Lifestyle Program: a randomized clinical trial. Diabetes care 2003, 26(8):2288-2293.
  28. Toobert DJ, Glasgow RE, Strycker LA, Barrera M, et al. Long-term effects of the Mediterranean lifestyle program: a randomized clinical trial for postmenopausal women with type 2 diabetes. The international journal of behavioral nutrition and physical activity 2007, 4:1.
  29. Almeida OP, Marsh K, Murray K, Hickey M, et al. Reducing depression during the menopausal transition with health coaching: Results from the healthy menopausal transition randomised controlled trial. Maturitas 2016, 92:41-48.

Bio-Economics of Tropical Spiny Lobster Farming in Indonesia

DOI: 10.31038/AFS.2020221

Abstract

Significant tropical spiny lobster puerulus settl ements have been found in bays around central Indonesia, leading to the development of lobster grow-out aquaculture starting in 2008. In recent years grow-out farming has all but stopped due to the development in 2013 of the export market for lobster juveniles to Vietnam, as well as the 2015 introduction of a government policy banning capture of small wild-caught lobsters. We compare results of a 2016 recall survey of 96 lobster farming households with 2011 survey data. Before the industry’s demise, lobster grow-out was only marginally profitability due to the lack of low-cost juveniles and inefficient feeding practices. We recommend lifting the government ban on wild capture of small lobster to allow the legal benefit of juvenile exports and to allow the aquaculture industry to regenerate. We suggest that the government could best serve the lobster industry by investing in research into sustainable fishing of the puerulus resource and low-cost formulated lobster diets.

Keywords

Lobster aquaculture, Indonesia, Bioeconomics, Policy

Introduction

Global production of crustaceans has been increasing exponentially since 1961 (Figure 1), almost all of which is used for human consumption. Tropical spiny lobster, also known as rock lobsters, are members of the Palinuridae family, and are highly prized throughout Asia, Europe and America, mainly due to their size and excellent meat quality [1,2]. Global demand for lobster is growing strongly, particularly in China, and prices are increasing as a consequence [3]. Farm-gate prices for wild-caught species in Indonesia are approximately USD22/kg (IDR300,000/kg) for 300-500g Panulirus homarus and USD30/kg (IDR400,000/kg) for Panulirus ornatus [3].

AFS-2-2-208-g001

Figure 1. Global production of crustaceans, 1961 – 2013 [21]

Tropical spiny lobsters are found in almost all warm seas and are particularly common in Australasia. They have an extended pelagic larval phase (up to 9 months) and their larval settlement may take place in different habitats and depths [4]. Spawning grounds for P.ornatus are considered to be in Papua New Guinea, the Philippines and, possibly, Indonesia, after which oceanography-driven connectivity causes larvae to move throughout the South-East Asian archipelago from Vietnam through Indonesia to Australia [5]. Although specific spawning aggregations for P. homarus have not been reported, larval dispersal for this species is likely to follow the same pattern. Effectively, the populations of both species in the Indo West pacific region represent a single homogeneous genetic stock [6].

Indonesian crustacean production reached 1million tonnes in 2013, of which approximately 30% was exported and 70% was consumed domestically (Figure 2). There are very few imports of crustaceans into Indonesia (approximately 12,000tonnes in 2012 and 2013). Tropical spiny lobster is a relatively small part of the crustacean sector in Indonesia, accounting for approximately 1.4% of crustacean production. There has been significant variability in capture production over the last 5 years, varying from 5,000 to17,000 tonnes (Figure 3). Export value of tropical spinylobster was approximately USD43million in 2014 [7].

AFS-2-2-208-g002

Figure 2. Production, total food supply and exports of crustaceans in Indonesia, 1961 – 2013 (FAO 2017)

AFS-2-2-208-g003

Figure 3. Tropical spiny lobster production in Indonesia, 1950 to 2016 (FAO 2018a,b)

Tropical spiny lobster production is dominated by capture production from the Western Central Pacific, and to a lesser extent, the Eastern Indian Ocean. Recorded aquaculture production of the species began in 2008, and has ranged between 161 and 488 tonnes during this time period, equating to between 2% and 6% of total tropical spiny lobster production (Figure 4). The value of production peaked at USD13million in 2013, but fell to USD2million in 2015. This data implies that spiny lobster prices have varied between USD10/kg and USD15/kg over this period. The aquaculture industry is dominated by P. homarus and P. ornatus harvested at approximately 220g, for domestic consumption. P. ornatus has significant export potential if harvest size can be increased to approximately 1kg [3].

AFS-2-2-208-g004

Figure 4. Volume and value of tropical spiny lobster aquaculture in Indonesia, 2008 – 2015 (FAO 2018b)

Aquaculture production of spiny lobster is surprisingly small compared with that of Vietnam where annual production exceeded 1,400 tonnes in 2016 [8]. The Indonesian industry is small despite a supply of puerulussettling in Indonesian coastal regionswhich is 20 times bigger than that of Vietnam [9]. Lobster aquaculture production in Indonesia was developing strongly with approximately 900tonnes of production in 2013. However, the industry has experienced a number of challenges; including a disease outbreak in 2011, reduced availability of puerulus and post-puerulus due to redirection of seed to the lucrative export market (which commenced in 2013), and lack of skills and knowledge development of best practice. The lucrative export market for seed, which promised quicker and less risky cashflow, led to the start of the downward trend in production after 2013 shown in Figure 3. This was further accentuated with the introduction, in January 2015, of the Ministry of Marine and Fisheries Regulation 1/2015 which banned the catching of Panulirus species under 8cm in carapace length. At this size, lobsters are approximately 200g. This regulation was enacted with the intention of protecting wild adult stocks from depletion and had the unintended consequence of prohibiting the taking of puerulus for aquaculture purposes.

With the collection of juvenile lobster now illegal, there are very few lobster grow-out farmers in Indonesia. This has led to loss of jobs and income for more than 5,000 peopleand associated flow-on social impacts. Ironically, despite this ban on puerulus collection, the number of puerulus caught has increased dramatically from around 600,000 seeds/year from 2008 through to 2013 to 5 million seeds/year in 2014 (before implementation of the regulation) [10] and approximately 50-60 million in 2015 (after implementation of the regulation) [11]. This spike in lobster seed export is due to development of alucrative black market for lobster seed and new sources of puerulus discovered in Sumbawa, South East Sulawesi, Java and Aceh [11]. Jones [12] argues that as the puerulus population settling in southern Java, Lombok and Sumbawa is a sink and disconnected from spawning stocks, the fishery can sustain a level of puerulusharvest without impacting the sustainability of Indonesia’s adult lobsterfishery. Unfortunately, this is benefiting the black market for exporters and Vietnam lobster grow-out producers (the destination of illegally exported puerulus from Indonesia).

The purpose of this paper is to compare the management practices and economic viability of lobster grow-out farming overtime before the introduction of the ban on puerulus collection. Factors that affect the profitability of the industry are considered in this paper and policy recommendations are made for development of a sustainable and viable lobster aquaculture industry in Indonesia into the future. The methodology is described in Section 2, results are provided in Section 3, and a discussion and conclusions are presented in Section 4.

Methodology

In 2011, Petersen et al. [13] estimated that there were approximately 1,000 lobster grow-out farmers in Indonesia. In April of that year, key informant interviews of 11 lobster households were conducted in two of the main grow-out regions in Lombok – Telong Elong/Gili Belik (5 households) and Ekas Bay (6 households) (Figure 5). All respondents were P. homarus farmers. At the time, very little lobster grow-out was conducted elsewhere in the country. The results of this survey were reported in Petersen et al. [13].

AFS-2-2-208-g005

Figure 5. Location of survey regions on Lombok Island, Indonesia

In February 2016, the same survey was implemented in the same survey region. Priyambodo et al. [11] estimates that while the number of growout producers peaked at approximately 5,000 in 2013, the number dropped to approximately 250 in 2016. The second survey was conducted with 96 randomly-selected households in the region with experience in lobster grow-out. Due to the demise of the industry, the second survey was a recall survey, asking respondents to recall data from 2014/2015. It is acknowledged that many farmers had ceased lobster production during the 12 months preceding the survey, limiting the accuracy of responses. The questionnaire contained mostly closed questions pertaining to the socio-economics of their previous lobster growout enterprise. Seventy-six percent of respondents of the 2014 survey were P. homarus farmers (73) and 34% were P. ornatus farmers (33). Ten respondents produced both P. homarus and P.ornatus.

The 2015 data generated in the second survey was inputted into a bio economic model developed and described byPetersen et al. [12] The model describes a biological model of fish growth where total biomass gain at harvest, bH, is a function of the quantity of feed during various growth phases, i, (qi) divided by the feed conversion ratio of the feed during growth phase, i, (FCRi, wet weight) as per equation (1):

This biological model is interrelated with an economic model ofcosts and returns to generate an annual enterprise gross margin, where all establishment, maintenance, and capital replacement costs were annualized. The economic model describes net revenue (NR) as total revenue (TR) (which is a function of weight of lobster production multiplied by the price of harvested lobster, minus total costs (TC) which is a function of seed, feed, labor, cage, capital, interest and contingency costs) ofper equation (2):

AFS-2-2-208-e001

AFS-2-2-208-e002

The bioeconomic model is calibrated separately using mean values from the 2011 and 2015 survey data, and output is compared. Results of the 2011 calibration are presented separately for the two regions (labelled Telong Elong and Ekas Bay), whereas the results of the 2015 calibration are presented together as East Lombok, but disaggregated by species (P. homarus and P. ornatus).

Results

The results are discussed here in seven subsections: general household information (3.1), juveniles and stocking (3.2), feeding (3.3), harvest information (3.4), bioeconomic analysis (3.5), sensitivity analysis of key model parameters (3.6), and scenario analysis of different feeding regimes and harvest sizes (3.7).Specific data are provided within the text is presented in the Appendix.

General household information

The average number of years of experience of P. homarus lobster farmers was higher in 2015 (10 years) than 2011 (4 years) reflecting the time frame between surveys. P. ornatus had approximately 6 years more experience than P. homarus households in 2015. This may reflect the origins of the Indonesian lobster aquaculture industry which drew from the success of the Vietnam lobster aquaculture industry, which specialises in P. Ornatus production. Knowledge from Vietnam was transferred through various research projects to Indonesia. The Indonesian industry later shifted to predominantly P. homarus production due to local availability of pureulus supply(Jones 2010). Reported average household size was lower in 2015 (3.1 members) than in 2011 (4.3 members). Lobster farmers have approximately 6 years of formal education.

Juveniles and stocking

The number of seacages per household and the size of these seacages, was slightly larger in Ekas Bay in 2011 compared with Telong Elong in the same year and for all respondents in 2015, leading to significantly higher seacage volume per household.

There was large variation in the price of juveniles across regions in 2011;Ekas Bay lobster farmers could source juveniles for USD0.54/juvenile (IDR3,700/juvenile) whereas Telong Elong farmers paid an average of USD1.19/juvenile (IDR8,200/juvenile). This variation was smaller in 2015. The weighted average juvenile price was found to be similar in in local currency across the years; USD0.83/juvenile in 2011 (IDR5,700/juvenile)compared with USD0.41/juvenile in 2015 (IDR5,600/juvenile). Reflecting lower juvenile prices and larger seacage capacity in Ekas bay in 2011, the number of juveniles stocked per household per year was approximately 3 times larger (1,500 juveniles/year) than in Telong Elong in 2011 (520 juveniles/year) and East Lombok in 2015 (460 juveniles/year). Stocking density was 3 times higher in Ekas Bay (24 juveniles/m3) than Telong Elong (7 juveniles/m3) in 2011, and almost 5 times higher than East Lombok in 2015 (5 juveniles/m3).

Feeding

Lobster grow-out farmers in Indonesia feed their lobsters mostly low-value finfish (also known as trash fish), most of which they catch themselves around the lobster seacages at minimal cost. Respondents found questions about the amount of feed used on a daily rate or total crop cycle to be the hardest question to answer in the questionnaires. Feeding rates and feed conversion ratios (FCRs) are provided in the Appendix with the caveat that there is reasonable uncertainty associated with these responses. Feeding rates were estimated to be approximately 5.5g/lobster/day in 2011, and significantly higher at approximately 28g/lobster/day in 2015 (with lower feeding rates for juveniles than older lobsters). With an average harvest size of 126g in 2011 and 238g in 2015, the feed conversion ratio (FCR) (quantity of food eaten divided by weight gain) was calculated to be 12 in 2011 and 25 in 2015. FCRs are high as low-value finfish lacks the complete set of nutrients required for efficient lobster growth [14]. Use of other species of molluscs and crustaceans to supplement the finfish diet may be necessary [15].

The price of purchased low-value finfish in 2011 was reported to be approximately USD0.65/KG (IDR4,500/kg), increasing in local currency terms from 2011 to 2015 (USD0.45/kg, IDR6,200/kg). However, approximately half the total quantity of feed given to lobsters was purchased, the other half caught by the farmer at minimal cost. The total quantity of feed over a grow-out season was higher in 2015 (2,200kg/grow-out season) compared with 2011 (1,000kg/grow-out season). With higher feeding rates and feed price, the cost of feed was significantly higher in 2015 (USD482/grow-out season, IDR6.6million/grow-out season) compared with 2011 (USD130/grow-out season, IDR0.9million/grow-out season).

Harvest information

The length of the grow-out season was reported to be lower in 2015 (7.0 months) compared with 2011 (8.8 months). Despite this shorter grow-out time, lobster harvest size was higher in 2015 (238g) compared with 2011 (126g). This reflects larger quantities of feed used in the later time period and possibly larger juveniles stocked. Reported survival rates have increased from an average of 70% in 2011 to 80% in 2015. Despite the smaller size of lobsters at harvest in Ekas Bay in 2011, due to the relatively large numbers of juveniles stocked and therefore harvested, total weight of household production was significantly higher (120kg) than in Telong Elong in the same year (52kg), and East Lombok in 2015 (90kg). Farm-gate prices for harvested lobster were relatively stable across years, regions and lobster species.

Bioeconomic analysis

Gross revenue (total weight of production multiplied by farm-gate price), gross costs and net revenue are presented in Figure 6. Gross revenue is higher in Ekas Bay than Telong Elong in 2011 due to significantly higher production, which in turn reflects the higher stocking rate and seacage capacity in this region. Gross costs are similar in the two regions at USD3,200/crop (IDR22million/crop). In 2015, prices and production were higher for P. homarus producers compared with P. ornatus producers (the latter due to larger seacage capacity), leading to higher gross revenue. Costs were also higher for P. homarus producers largely due to higher feeding costs.

AFS-2-2-208-g006

Figure 6. Gross revenue, gross costs and net revenue for lobster grow-out farms in Indonesia

The cost structure for lobster operations is presented in Table 1. In 2011, costs were dominated by fuel, boat, nets and other capital costs (approximately 41%). Interest and juveniles were also significant cost items (approximately 23%). In 2015, the significant cost items were also feed, boats, nets and other capital items (approximately 36%), with feed and interest being the next biggest cost items (approximately 23%). Juveniles were proportionally a smaller cost item, and feed a proportionally higher cost item, in 2015 compared with 2011.

Table 1: Cost structure (% of gross costs).

TelongElongP. homarus 2011

Ekas Bay P. homarus 2011

East Lombok P. homarus 2015

East Lombok P. ornatus 2015

Juveniles

22

24

10

11

Feed

5

3

30

19

Cages

4

2

3

3

Fuel/boat/nets

42

40

33

39

Interest

22

25

19

23

Contingency

5

5

5

5

Total

100

100

100

100

This economic analysis so far has assumed no labour costs, implying that farmers do not have other income generating opportunities for their time. This is generally not the case, as most lobster farmers also generate income from fishing.Labour has not been included so far due to uncertainty associated with the opportunity cost of their time. A sensitivity analysis is conducted on labour costs in the next section.

Net returns per crop were significantly higher in Ekas Bay than Telong Elong in 2011, and for P. homarus producers compared with P. ornatus producers in 2015. Due to poor quality and availability of juveniles in Telong Elong in 2011, stocking rates were low and net returns were negative, leading to a Benefit Cost Ratio (BCR) (gross benefits divided by gross costs) of 0.9 (Figure 7). This means that for every rupiah spent, the farmer gains 0.9 rupiah in return annually. The higher the BCR the better, and a BCR>1 is required for cost-effectiveness.With more juveniles of higher quality, Ekas Bay producers were making positive net returns (USD2,300/crop, IDR16million/crop), with a BCR of 1.7. P. Homarus production in 2015 was profitable (with net returns of approximately IDR14million/crop (USD2,000/crop) and a BCR of 1.5), while P. ornatus production was marginal (net returns approximately USD220/crop (IDR3million/crop) and a BCR of 1.2). However, including labour costs into the analysis would make P. homarus production in 2015 marginal and P. ornatus production unprofitable.For example, costing the labour of one family member atUSD800/year (IDR11million/year)(Petersen et al. 2014 accounting for inflation), leads to a labour cost of USD510/crop(IDR 7million/crop) for P. homarus and USD365/crop (IDR5million/crop) for P. ornatus, and reduces the BCR for P. homarus production to 1.2 and for P. ornatus production to 0.9.

AFS-2-2-208-g007

Figure 7. Benefit Cost Ratios for lobster grow-out farming in Indonesia

Sensitivity analysis of key model parameters

The sensitivity analysis is this section is conducted to understand the impact of low and high levels of key parameters on the BCR. Likely changes in these parameters are considered, rather than a standard percentage change, to determine the impact of realistic levels of variability in the system on cost-effectiveness.These likely changes are determined based on the authors’ knowledge of historical data for each parameter over time. In this way, the impact of possible parameter changes as observed through time are analysed. The sensitivity analysis is conducted for P. homarus and P. ornatus producers in 2015 and compared with the findings for 2011 as discussed in Petersen et al. [13]. The parameter levels used in the sensitivity analysis for P. homarus and P. ornatusare shown in columns 2 to 4 in Tables 2 and 3, respectively. Each of these parameter levels are changedindividually with all other conditions remaining the same (ceterus parabis). The impacts of this sensitivity analysis on the BCR are shown for P. Homarus in Figure 8 and P. ornatus in Figure 9. The break-even parameter levels–the parameter levels for which the BCR equals 1 –are shown in the last columns of Tables 2 and 3.

AFS-2-2-208-g008

Figure 8. Sensitivity analysis of the effect on the BCR of realistic changes in key model parameters for P. homarus production in 2015

AFS-2-2-208-g009

Figure 9. Sensitivity analysis of the effect on the BCR of realistic changes in key model parameters for P. ornatus production in 2015

Table 2: Parameter levels used in the sensitivity analysis – P. homarus.

Assumption

Low level

Standard level

High level

Break-even parameter level

Number of juveniles stocked

250

513

1,000

272

Cost of juveniles (USD/juvenile (IDR/juvenile))

0.18 (2,500)

0.37(5,100)

0.73 (10,000)

2.34 (32,000)

FCR

10

26

35

75

Feed price (USD/kg (IDR/kg))

0.11 (1,500)

0.22
(3,000)

0.44 (6,000)

0.62
(8,500)

Mortality (%/crop)

10

21

40

55

Size of harvested lobster (kg/lobster)

0.150

0.235

0.300

Through changes to the FCR

0.154

Through changes to the feeding rate

0.133

Through changes to the grow-out time-period

0.133

Harvest price (USD/kg (thousand IDR/kg))

15(200)

31(419)

58(800)

20(274)

Capital costs (USD/crop (million IDR/crop))

365(5.0)

620(8.5)

1,095(15)

1,628(22.3)

Cost of labor (USD/crop (million IDR/crop))

730(10)

1,007(13.8)

Interest (USD/crop (million IDR/crop))

182(2.5)

365(5.0)

730(10)

1,372(18.8)

Table 3: Parameter levels used in the sensitivity analysis – P. ornatus.

Assumption

Low level

Standard level

High level

Break-even parameter level

Number of juveniles stocked

150

349

700

285

Cost of juveniles (USD/juvenile (IDR/juvenile))

0.22(3,000)

0.48(6,600)

0.88(12,000)

1.20(16,500)

FCR

10

19

30

34

Feed price (USD/kg (IDR/kg))

0.11(1,500)

0.22(3,000)

0.44(6,000)

0.43(5,900)

Mortality (%/crop)

10

19

40

32

Size of harvested lobster (kg/lobster)

0.150

0.245

0.300

Through changes to the FCR

0.212

Through changes to the feeding rate

0.205

Through changes to the grow-out time-period

0.205

Harvest price (USD/kg (thousand IDR/kg))

15(200)

27(365)

44(600)

23(315)

Capital costs (USD/crop (million IDR/crop))

365(5.0)

620(8.5)

1,095(15)

876(12)

Cost of labor (USD/crop (million IDR/crop))

730(10)

255(3.5)

Interest (USD/crop (million IDR/crop))

182(2.5)

365(5.0)

730(10)

613(8.4)

As P. homarus production is more profitable than P. ornatus production, P. homarus systems are more resilient to negative changes in market, management or biological conditions. In the case of P. homarus, realistic negative changes in only a few parameters make the system unprofitable (low harvest price, number of juveniles stocked and size of harvested lobster) whereas negative impacts of almost all parameters lead to a lack of cost-effectiveness of P. ornatus production (with the exception of the cost of juveniles and the FCR). For both species, lobster grow-out farming seems to be most sensitive to harvest price. While a low harvest price can lead to poor cost-effectiveness, high harvest prices have the potential to lead to extremely good cost-effectiveness and profitability.

The results for P. homarus production in 2015 are similar to that in 2011 (Figure 10), where the system was found to be reasonably resistant to negative parameter changes (with the exception of low harvest price and high morality). In 2015, the system was also most sensitive to changes in the harvest price, with high harvest price having the potential to generate significantly high profits for lobster producers.

AFS-2-2-208-g010

Figure 10. Sensitivity analysis of the effect on the BCR of realistic changes in key model parameters for P. homarus production in Ekas Bay in 2011 [13].

The break-even labour cost for P. homarus and P. ornatus in 2015 are USD1,000/crop and USD260/crop(IDR13.8million/crop and IDR3.5million/crop), respectively. Assuming a labour cost of USD800/person/year (IDR11million/person/year), leading to a labour cost of USD510 (IDR 7million/person/crop) for P. homarus and USD365/crop (IDR5million/person/crop) for P. ornatus, the systems remain profitable until more than 2.0 people are paidin the case of P. homarus production, and more than 0.7 of a wage is paid in the case of P. ornatus production. Another perspective is that P. homarus production is equivalent to earning the wages of 2 people over the crop, and P. ornatus production is equivalent to earning the wages of 0.7 of a person.

Scenario analysis of different feeding regimes and harvest sizes

Three scenarios are considered in this section: (1) the use of pelleted feed, (2) increasing harvest size to 300g, (3) increasing the harvest size of P. ornatus to 1kg, (4) the use of pelleted feeds and increased harvest size to 300g, and (5) the use of pelleted feeds and increasing harvest size to 1kg for P. ornatus. Each of these are discussed in more detail below.

Aquaculture around the world is moving away from the use of low-value finfish to manufactured pelleted diets. Low-value finfish is relatively cheap compared with pelleted diets, although prices are increasing as finfish supply is reducing in many parts of the world. However, pelleted diets have significant advantages such as lower FCRs (due to specific nutritional formulations and reduced feed waste),reduced local pollution and water quality degradation (since a smaller mass of feed is used with greater efficiency), a longer storage life, and more stable supply (because their availability is not dependent on seasonal factors) [16]. Manufactured diets have been formulated for tropical rock lobsters, but they are not yet commercially available due to lack of demand. Petersen and Glencross [16] estimate that this kind of diet would likely cost approximately USD3/kg, which is currently equivalent to approximately USD5.80/kg (IDR40,000/kg) but was equivalent to USD3.80/kg (IDR26,000/kg) at the time their paper was written. They estimate that the FCRs of pelleted diets will be approximately 3. Scenario analysis 1 in Table 4 suggests that compared with the standard solution, at USD5.80/kg, the use of manufactured diet is likely to reduce profits of grow-out enterprises, but at USD3.80/kg, it would marginally increase profits for P. homarus producers but decrease profits for P. ornatus producers. The reduced FCR of pelleted diets is worth the extra cost for P. homarus producers, but not for P. ornatus producers who have relatively lower FCR for current diets.

Table 4: Scenario analysis for various diets and harvest sizes for P. homarus and P. ornatus production (2015).

P. homarus

P. ornatus

Net return
(USD/crop (million IDR/crop))

BCR

Net return
(USD/crop (million IDR/crop))

BCR

Standard solution

101 (13.8)

1.5

26 (3.5)

1.2

Pelleted feed

FCR=3, USD5.80/kg

74 (10.2)

1.3

-5 (-0.7)

1.0

FCR=3, USD3.80/kg

104 (14.2)

1.6

16 (2.2)

1.1

Scenario analysis 2: 300g harvest size

Through increased grow-out length

166 (22.8)a

1.8a

60 (8.2

1.4b

Through improved FCR

182 (24.9)c

2.0c

66 (9.1

1.4d

Through increased feeding rate

166 (22.7)e

1.8e

60 (8.2

1.4f

Scenario analysis 3: 1kg harvest size

Through increased grow-out length

n.a.

n.a.

501 (68.7)g

3.0g

Through improved FCR

n.a.

n.a.

594 (81.4)h

4.7h

Through increased feeding rate

n.a.

n.a.

501 (68.7)i

3.0i

Scenario analysis 4: Pelleted feed and 300g harvest size

Through increased grow-out length

169 (23.2)a

1.8a

48 (6.6)

1.3b

Through improved FCR

184 (25.2)j

2.0j

57 (7.8)k

1.3k

Through increased feeding rate

169 (23.2)l

1.8l

48 (6.6)m

1.3m

Scenario analysis 5: Pelleted feed (FCR=3, USD3.80/kg) and 1kg harvest size

Through increased grow-out length

n.a.

n.a.

463 (63.4)g

2.6g

Through improved FCR

n.a.

n.a.

585 (80.1)n

4.5n

Through increased feeding rate

n.a.

n.a.

463 (63.4)o

2.6o

n.a.=not applicable
aGrow-out period length increased from 229 to 292 days
bGrow-out period length increased from 168 to 206 days
cFCR decreased from 26.8 to 21.0
dFCR decreased from 18.6 to 15.2
eFeeding rate increased from 27.6 to 35.2g/lobster/day
fFeeding rate increased from 27.1 to 33.1g/lobster/day
gGrow-out period length increased from 5.6 to 23months
hFCR decreased from 18.6 to 4.5
iFeeding rate increased from 27.1 to 111g/lobster/day
jFCR decreased from 3.0 to 2.4
kFCR decreased from 3.0 to 2.5
lFeeding rate increased from 3.1 to 3.9g/lobster/day
mFeeding rate increased from 4.4 to 5.4g/lobster/day
nFCR decreased from 3.0 to 0.7.
oFeeding rate increased from 4.4 to 17.9g/lobster/day.

P. homarusreaches maturity at approximately 300g [17], after which growth rates decrease rapidly. This is also plate-size which is favoured by domestic consumers. Scenario analysis 2 considers the profitability of increasing harvest size of P. homarus and P. ornatus to 300g using three different methods – increasing thegrow-out period, reducing the FCR and increasing the feeding rate. In each case, profitability and cost-effectiveness is significantly improved. Of the three methods, it is most profitable for the grower to increase harvest size to 300g through improving FCRs (from 27 to 21 in the case of P. homarus, and 19 to 15 in the case of P. ornatus). However, in reality, the producer is most likely to use a combination of all three methods.

P. ornatus growth rates differ from those of P. homarus, and remain fast up until approximately 1 to 1.5kg at which size they mature [18]. Scenario analysis 3 considers the profitability of increasing the harvest size of P. ornatus to 1kg.In each case, the profitability is significantly increased, although the most profitable method for increasing harvest size is by reducing the FCR. However, this would require the FCR to decrease from 18.6 to 4.5 which is impossible for current diets of finfish. Increasing the harvest size through lengthening the grow-out period from 5.6 to 23 months is also extremely profitable, although this may be impractical and highly risky. It is just as profitable to increase harvest length by increasing feeding rates from 4.4 to 17.9g/lobster/day, although again, this is likely to be impractical. In reality, it is likely that a producer will try to do all three strategies simultaneously – reducing their FCR, increasing their grow-out length as well as increasing their feeding rates.

Scenario analyses 4 and 5 consider both a move to pelleted diets and an increase in harvest size simultaneously. In the case of P. homarus, using pelleted feeds and increasing the harvest size increases net returns, but as costs are higher, the BCRs are unchanged. In the case of P. ornatus, as the use of pelleted diets (under considered assumptions) is less profitable for the lobster businesses than current low-value finfish diets, the combination of pelleted diets and larger harvest size lead to higher profits compared with the standard solution (standard harvest size) but are not as high if the farmer focused on increasing harvest size alone (while continuing to use low-value finfish diets).

Discussion and Conclusions

Lobster grow-out aquaculture has the potential to provide a valuable income source to coastal communities where incomes are currently low and dependent on tourism and agriculture (rice and livestock production). The lobster farming industry began in 2008 and grew strongly until 2013 at which time the lucrative export market for juveniles bound for Vietnam developed. The industry’s demise was accentuated by the 2015 introduction of government regulation banning the wild capture of lobster under 8cm in carapace length (approximately 200g). Ironically, the illegal export market for juveniles has grown significantly under the regulation.

At the time of introduction of the ban on wild capture of juveniles, grow-out was profitable for P. homarus production (BCR=1.5) and marginal for P. ornatus production (BCR=1.2). However, the industry couldn’t compete with the relatively profitable activity of collecting and direct sale of puerulus for export (BCR=4.1 in 2011 [13] Hence, profitability of grow-out aquaculture was constrained by the availability of good quality seed, most of which were being exported to Vietnam. Prices of lobster seed were USD16/juvenile in Vietnam in 2013 [19] compared with USD0.50/juvenile in Indonesia.

Indonesian lobster farmers were unable to pay higher prices for seed due to the marginal profitability of their farming enterprises. Lack of skills and knowledge development of best aquaculture practices led to this poor profitability. This is most evident for feeding regimes, where lobsters are fed low-value finfish (trash fish), which do not meet their dietary requirements. Feed conversion ratios were high (27 for P. homarus, 19 for P. ornatus) and feeding rates low (although increasing) leading to low growth rates and small harvest weights (235g in the case of P. homarus, 245g for P. ornatus). Feeding rates increased between 2011 and 2015 leading to higher harvest sizes (127g compared with 238g). Yet harvest size is still smaller than the optimal 300g for P. homarus and 1kg for P. ornatus. Our research suggests that there are significant profits to be realised from increasing harvest size, and that this can be achieved through moving from finfish diets to pelleted diets (depending on the price of pelleted diets), improving the FCR of current diets, increasing the grow-out timeperiod, and increasing feeding rates. Kurniawan et al. [7] argue that harvest time is driven by the patron-client relationship, time constraints, and work complexity which may stifle a farmer’s ability to postpone harvest for higher profits. These results concur with those of Susanti et al. [20] who found that the greatest influence on the technical efficiency of lobster farming in Indonesia is the quantity of seed input, and to a lesser extent, feed inputs, experience and length to harvest time.

There is significant potential for fisheries policy reform in Indonesia. The regulation banning capture of small lobster is intended to protect wild adult lobster stocks around the Indonesian archipelago. However, adult lobster stocks, in large part, are not dependent on capture rates or size as most of the seed settling in the southern part of Indonesia have come from reproductive stocks in the Philippines and Papua New Guinea and migrate to Indonesia via ocean currents. Additional puerulus lobster populations continue to be discovered in various parts of Indonesia, including Sumbawa, South East Sulawesi, Java and Aceh. Moreover, the regulation hasn’t actually had the impact of reducing wild capture of juveniles with a thriving export black-market [21,22].

The question remains as to whether the regulation should be lifted in favour of an enforced ban on the export of juveniles. However, with extremely high prices for seed in Vietnam, enforcement of this ban would be difficult if not impossible. With such high returns to seed collection and export, it seems to be in Indonesia’s best interest to support livelihoods in Indonesia through allowing households to enjoy the benefits of high returns at low risk from this industry.

The Indonesian lobster farming industry would be well served by a comprehensive research program focussing onunderstanding the dynamics of lobster reproduction and larval dispersal to confirm the hypothesis that the puerulus population of southern Indonesia is a sink and can be exploited sustainably. Indonesia’s lobster seed resource is significantly bigger than that of Vietnam and could support a large growout industry. In future, hatchery produced seed might also contribute, but the technology for such production has remained uneconomic. Research into the production of formulated pelleted diets for lobster with low FCRs at low prices would also allow farmers to reduce their costs and increase their productivity, leading to higher harvest prices and economic returns.

We recommend that the Indonesian government remove the ban on the wild catch of seed lobsters to encourage the fledgling aquaculture industry to develop once again while allowing businesses to legally benefit from the lucrative export market. Focussing research on the sustainable fishing of naturally settling puerulus and low-cost efficient formulated lobster diets is likely to result in growth of the Indonesian lobster aquaculture industry, creating sustainable livelihood diversification opportunities for coastal communities.

Acknowledgements

This work was supported by the Australian Centre for International Agricultural Research (ACIAR) under project FIS/2014/059. We extend sincere appreciation to Ervin Nora Susanti, of Riau Kapulauan University, for conducting the key informant interviews (while at Bogor Agricultural University), and we remember the late Rina Oktaviani who was instrumental in data collection and analysis for this paper.

Funding Body

The Australian Centre for International AgriculturalResearch.

Significance Statement

This paper considers the economic profitability of lobster growout in Indonesia which grew rapidly as an industry until its demise in 2013. We make suggestions as to the cause of this demise and how the industry can regenerate again to provide valuable and sustainable livelihoods in Indonesia.

References

  1. Hart G (2009) Assessing the South-East Asian Tropical Lobster Supply and Major Market Demands. ACIAR Final Report (FR-2009-06). Canberra: Australian Centre for International Agricultural Research.
  2. Davidson A, JaineT (2006) The Oxford Companion to Food. Oxford: Oxford University Press.
  3. Ruello N (2017) A review of lobster markets and opportunities for Indonesian farmed lobster. Report presented at the annual project meeting of ACIAR FIS/2014/059 Expanding lobster aquaculture in Indonesia, Denpasar, Bali.
  4. Milton D, Satria F, Proctor CH, Prasetyo AP, Utama AA and Fausi M (2014) Environmental factors influencing the recruitment and catch of tropical Panulirus lobsters in southern Java, Indonesia. Continental Shelf Research 91: 247-255.
  5. Dao HT, Smith-Keune C, Wolanski E, Jones CM, and Jerry DR (2015a) Oceanographic currents and local ecological knowledge indicate, and genetics does not refute, a contemporary pattern of larval dispersal for the ornate Spiny Lobster, Panulirusornatus, in the south-east Asian Archipelago.  PLoSOne10: 0124568. [crossref]
  6. Dao HT, Jerry D, Smith-Keune C, Wolanski E (2015b) Genetics and recruitment of spiny lobsters Panulirusornatus and P. homarus in the Indo-West Pacific. Chapter 5.7. in: Jones, C.M. (Ed.), Spiny lobster aquaculture development in Indonesia, Vietnam and Australia. Proceedings of the International Lobster Aquaculture Symposium held in Lombok, Indonesia, 22–25 April 2014. Australian Centre for International Agricultural Research, Canberra, Australia.
  7. Kurniawan D, Oktaviani R, Sanim B, Daryanto DHK (2017) Decision analysis of harvest time for lobster businesses in Lombok Island, West Nusa Tenggara. Journal of Management and Agribusiness14: 138-151.
  8. FAO (2018b) Fishery and Aquaculture Statistics. Global aquaculture production 1950-2016 (FishstatJ). In: FAO Fisheries and Aquaculture Department, Rome.
  9. Priyambodo B (2018) The development of spiny lobster aquaculture in Indonesia through the enhancement of puerulus catch and technology transfer. PhD thesis, School of Biological, Earth and Environmental Sciences.University of New South Wales Sydney259.
  10. Jones C, Huong LL, Tuan LA, BahrawiS, and Irvan S (2015). Spiny lobster aquaculture development in eastern Indonesia, Vietnam and Australia. ACIAR Final Report (SMAR-2008-021). Canberra: Australian Centre for International Agricultural Research.
  11. Priyambodo B, Jones CM, SammutJ(2018) The status of spiny lobster aquaculture in Indonesia. Meeting presentation to the World Aquaculture Society, 24 April 2018. The University of New South Wales Sydney.
  12. Jones CM (2018). Progress and obstacles in establishing rock lobster aquaculture in Indonesia. Bulletin of Marine Science. 94 (in press).
  13. Petersen EH, Jones C, Priyambodo B (2014) Bioeconomics of spiny lobster farming in Indonesia. Asian Journal of Agriculture and Development10: 25-39.
  14. Jones CM (2010) Tropical spiny lobster aquaculture development in Vietnam, Indonesia and Australia. Journal of the Marine Biology Association of India52: 304-315.
  15. Jones CM, SuastikaM, SukadiF, SurahmanA (2007) Improving Lobster Grow-out and Nutrition in Nusa Tenggara Barat – a Feasibility Study. ACIAR-SADI Final Report. Australian Centre for International Agricultural Research.
  16. Petersen EH, Glencross B (2012) Bioeconomic Analysis of Improved Diets for Marine Aquaculture in Vietnam. Advanced Choice Economics Discussion Paper2.
  17. MehannaS, Al-Shijibi S, Al-JafaryJ, Al-Senaidi R (2012). Population dynamics and management of scalloped spiny lobster Panulirushomarus in Oman coastal waters. Journal of Biology, Agriculture and Healthcare2: 184-194.
  18. MacFarlane JW, Moore R (1986) Reproduction of the ornate rock lobsterPanulirusornatus in Papua New Guinea. Australian Journal of Marine and Freshwater Research 37: 55-65.
  19. Petersen EH, Glencross BD, Phuong TH, Tuan VA, Tuan LA (2016) Recent changes in the bioeconomics of lobster and mud crab mariculture in Vietnam. Asian Journal of Agriculture and Development13: 89-105.
  20. Susanti EN, Oktaviani R, Hartoyo S, Priyarsono DS (2017) Comparison of technical efficacy of lobster farming Panulirushomarus, sp with Panulirusornatus, sp in Lombok, West Nusa Tenggara, Indonesia. Paper presented at the annual project meeting of ACIAR FIS/2014/059 Expanding lobster aquaculture in Indonesia, Denpasar, Bali.
  21. FAO (2017a) Fishery and Aquaculture Statistics. Food balance sheets of fish and fishery products In: FAO Fisheries and Aquaculture Department. Rome.
  22. FAO (2018a) Fishery and Aquaculture Statistics. Global capture production In: FAO Fisheries and Aquaculture Department. Rome.

Extremophiles Rescue from -80°C Freeze-stocked Deep-sea Cores and Metagenomic Analysis of Living Microorganisms

DOI: 10.31038/GEMS.2020213

Abstract

The Nankai Trough, the region in which the Philippine sea plate and the Eurasian plate meet, is located off the south coast of Wakayama Prefecture, Japan. IODP drilling core samples were collected there and stored at -80 ° C in the Kochi Core Center. It is generally known that damage occurs to organisms in core samples due to the volume expansion of water during the freezing storage step. In this study, we tried to extract the bacterial flora from long-term stored core samples with an attached potential-controlled electrode. As a result, we have extracted approx. 106 cells/g of living bacteria from each core sample and analyzed the living bacterial flora in the stored deep-sea core.

Keywords

Deep sea, Extremophiles, IODP core sample, Microorganism electrical retrieval, Nankai trough

Introduction

Kochi core center (KCC) is one of four International Ocean Discovery Program (IODP) curation centers located around the world. At IODP curation centers, a lot of core samples are stored in deep freezer rooms and are provided to researchers worldwide. These are important resources for researching novel ecosystem communities, earthquake mechanisms, and methane hydrate deposits. Ideally, researchers hope to use fresh cores immediately after collection on ship. On the other hand, we know a lot of important core samples are frozen at several institute centers and we should make good use of them. In this experiment, we tried to extract the bacterial community from long-term stored core samples using an attached potential-controlled electrode. This result shows that approximately 106 cells/g of living microorganisms remained in samples stored at -80 ° C for 12 years, and that it was possible to extract living microorganism flora from the stored core samples.

Materials and Methods

Deep Sea Core Samples

The deep-sea core samples were collected by the submersible boring ship Chikyu from the Nankai Trough, Japan (Table 1 and Figure 1a, b) [1–5]. Cores 1 to 3 were collected from the Eurasia sea plate, Cores 6 to 7 from the Philippine sea plate, and Cores 4 to 5 from close to the Nankai trough (i.e., the boundary region between both plates) (Figure 1b). Prior to bacterial extraction for this research, these samples were stored at – 80 ° C at IODP Kochi Core Center (Figure 2a, b).

GEMS-2-1-403-t001

GEMS-2-1-403-g001

Figure 1. Deep-sea core collected point. a; Boring point by each expedition on the Geographical survey institute map, b; Arrow means core sampling depth.

GEMS-2-1-403-g002

Figure 2. Core Sample and Kochi Core Center (KCC). a; Frozen deep-sea core sample, b; Stored Core Sample in freezing room at KKC.

Ionic Analysis in Deep-Sea Core Samples

The core samples were suspended into PBS(-) to 0.5 g/ml. The ion composition of the deep-sea core was analyzed using the LC-20AP ionic chromatography system (Shimadzu Co.).Negative ions were separated into Shim-pack IC-SA2 (250 mm × 4.0mm) and mobile phase containing 12 mM NaHCO3 and 0.6 mM Na2CO3. Positive ions were separated into Shim-pack IC-C4 (150 mm × 4.6 mm) and mobile phase containing 3 mM oxalic acid as mobile phase. The flows were 1.0 and 1.2 ml/min at 30°C, respectively.

Attachment and Detachment of Uncultured Bacteria in the Frozen Core Sample

Wash of Electrodes and Potential Application

For metagenomic analyses of bacteria in the core samples, living bacteria were collected from the sample using an electrode chamber device. Both the Ag/AgCl electrode and the ITO/glass electrode (ABLE Co., Tokyo, JPN) (Figure 3a) were sonicated in diluted water for 5 min and immersed in 1 M NaOH for 10 min to remove any unwanted deposits. Then, the electrode chambers were sterilized by irradiation with UV light for 5 min in a clean bench.The deep-sea core samples were suspended in PBS(-) to 0.5 g/ml and stored at 4 ° C. To attach bacteria in the core sample to the ITO/glass electrode, 1 mL of the suspended core sample was poured into the chamber system and then topped up with PBS(-) until the solution touched the Ag/AgCl reference and the Pt counter electrode. The constant potential application was done using a potentiostat (ABLE Co., Tokyo, JPN) (Figure 3b). In the deep-sea core sample, −0.4 V vs. Ag/AgCl constant potential was applied to the ITO/glass electrode for 2 h at 8 ° C in PBS(-) [6].

GEMS-2-1-403-g003

Figure 3. Potential-controlled electrode. a; Ag/AgCl electrode and ITO/glass electrode, b; Potentiostat, c; Bacteria peeling device.

Detachment of Living Extremophiles Flora

The ITO/glass electrode was washed 5 times with PBS(-) at room temperature, and the bacteria attached to the electrode were detached by applying ±10-mV vs. Ag/AgCl 9-MHz triangular wave potential for 60 min with bacteria peeling device (ABLE co., Tokyo, JPN) (Figure 3c) in 10 ml of fresh PBS (-) at 8 ° C.

Fluorescence Microscopic Observation

Microorganisms were observed with a fluorescence microscope in order to count the bacteria population. The staining reagent was prepared using a LIVE/DEADBacLight Bacterial Viability Kit (Thermo Fisher Scientific K.K., Tokyo, JPN) and was added to 1 mL of the detachment sample, and then incubated at room temperature for 15 min. After being trapped on a 0.2 m black membrane filter, the microorganism survival rate was calculated by fluorescence microscopic observation (NIKON Co., Tokyo, JPN) while irradiating with wavelengths of 450 to 490 nm and 510 to 560 nm [7, 8]. Living microorganisms emit green light when irradiated with wavelengths of 450-490 nm due to the Syto9 fluorescence reagent and dead microorganisms emit red light when irradiated with wavelengths of 510-560 nm due to the PI fluorescence probe.

Metagenomic Analysis with NGS

DNA Extraction and Overhang Region Attachment

Genomic DNA of the electrically isolated microorganism in the deep-sea core was extracted using the Cetyltrimethylammonium bromide (CTAB) method [9]. The microorganism 16srRNA v4 region fragments were amplified from the CTAB extracted genomic DNA with universal primers 515F (5’-3’) and 806R (5’-3’) [10] and Q5 High-Fidelity DNA Polymerase following the recommended protocol (New England Biolabs Japan Inc., Tokyo, JPN). Both primers 515F and 806R linked overhang sequence (under line sequence) to the 5’ terminal of primers such as forward primer 5’-TCGTCGGCAGCGTCAGATGTGTATAAGAGACAGGTGCCAGCMGCCGCGGTAA-3’ and reverse primer 5’-GTCTCGTGGGCTCGGAGATGTGTATAAGAGACAGGGACTACHVGGGTWTCTAAT-3’. The following PCR program was used: 98 ° C for 30 sec, followed by 35 cycles of 98 ° C for 7 sec; 57 ° C for 20 s; and 72 ° C for 45 sec, followed by 72 ° C for 2 min. To add the index sequence to the overhang region, each 25 μl aliquot of the reaction mixture contained 5 μl of Nextera XT Index primer 1 and 2 (Illumina, Inc., San Diego, California, US) and 25 μl of 2× KAPA HiFi HotStart Ready Mix (Nippon Genetics Co.,Ltd, Tokyo, JPN) and followed thermal cycler protocol from Illumina co.[11, 12].

Metagenomic Analysis

After purification through AMPure (Beckman Coulter, Inc., Tokyo, JPN), the tagmented DNA, 5 μL freshly 0.2 N NaOH was mixed in microcentrifuge tube in order to denature the DNA.The denatured amplicon DNA was diluted to 570 μL 10 pM using the HT1 and combined with 30 μL 10 nM PhiX library. The prepared samples were then loaded onto the MiSeq, and the MiSeq program was carried out. After MiSeq program was completed, the raw data was analyzed with Geneious software (TOMY DIGITAL BIOLOGY Co., Ltd., Tokyo JPN).

Result and Discussion

Ionic Analysis in Deep-Sea Core Samples

The negative ion SO42- was markedly increased in Core 4 compared to the other core samples. That result might be due to a chemical reaction caused by the high pressure and high temperature conditions resulting from the huge friction at the plate boundary [13, 14]. Moreover, no relationship between sulfate reducing bacteria and SO42- in this Core 4 from metagenomic analysis was found. It is very interesting that none of the results showed a remarkable shift in the microorganism flora such as desulfobacteraceae, desulfobulbaceae and desulfoarculaceae families (Figure 4).

GEMS-2-1-403-g004

Figure 4. Ion concentration after ionic chromatography.

Living Microorganisms Population and Flora in the Frozen Core Sample

Negative charged electrodes work as electron donors for living microorganisms, so bacterial fimbriae contact with the ITO/glass electrode surface when a negative potential is applied [6, 15-17]. After detachment from the potential-controlled electrode, the average of living bacteria in each core sample was found to be 9.8 × 10⁵ cells/g (Figure 5) and confirmed good agreement with sequence count by metagenomic analysis. In addition, dead cells were also found in amounts corresponding to about 10% of the living cells population. Moreover, the lowest population showed in Core 4, from the deepest seafloor depth (1019.6 m), was probably caused by the extreme environment found there. This result is supported by the metagenomic analysis OTU data (Figure 6).

GEMS-2-1-403-g005

Figure 5. Bacteria population and sequence counts in each core samples after electrical retrieve.

GEMS-2-1-403-g006

Figure 6. Living bacterial flora after electrical retrieve from each core samples.

We can see the metagenomic analysis results in Figure 5. The flora composition found in Core 5 was remarkably different to the other core samples. It means an increase in the bacterial diversity. This can be seen in the pink “Others” section of the bar graph, which is much larger for Core 5 than in other core samples. Also, other bacteria grew up in this core, such as 0.9% mycobacterium, 1% oceaniserpentilla,1% halomonas, 2% Araerococcusand 1% streptophyta. Core 5 was collected from the shallow boundary region of the both plates, an environment in which it is easy to build up special bacterial flora due to the effect of external factors such as meso-pressure and the two different adjacent plates [18]. Table 2 shows the link of analyzed data by Geneious in this study. It is interesting that the chemical composition and microorganisms flora at the boundary plate region are similar to those found in extreme hot-spots in deep-sea cores. This experiment shows that we can rescue microorganism flora from core samples stored long-term at -80 ° C. The potential-controlled electrode extraction technique shows promise for the development of extremophiles research.

Table 2 : Linked URL of the metagenomic analysis result by Geneious.

Address

Core1

https://16s.geneious.com/16s/results/2d656c07-3649-4dbd-8e25-5699f6926816.html

Core2

https://16s.geneious.com/16s/results/4cd25eaf-44f3-459a-97ee-dd4f50c37dfc.html

Core3

https://16s.geneious.com/16s/results/62a825fe-d69b-4592-ac19-8b2514d3f585.html

Core4

https://16s.geneious.com/16s/results/5d7dc8ad-5907-42dd-8011-62c4fd251f06.html

Core5

https://16s.geneious.com/16s/results/f3127a1e-ca5b-4eae-b3b8-31a4f214d95c.html

Core6

https://16s.geneious.com/16s/results/1721fff5-e6be-4f26-9836-16ef810e97d9.html

Core7

https://16s.geneious.com/16s/results/f37b7765-266d-46d1-a141-e9a11fdea710.html

Acknowledgment

The authors would like to acknowledge Kochi Kore Center for supplying deep-sea core samples from IODP Expeditions 315, 316, 322, and 333 around the Nankai trough. We are grateful to Sumihiro Koyama of ABLE Co. and Biott Co. for providing method of bacterial attach and detaching technique. And we thankful for the support given by our laboratory members and David Marsh. This research was supported by KOSEN 4.0 INITIATIVE of National Institute of Technology.

References

  1. Masataka K, Harold T, Juichiro A, Gaku K, et al. (2009) Expedition 315 Site C0001.Proceedings of the Integrated Ocean Drilling Program.
  2. Masataka K, Harold T, Juichiro A, Gaku K, et al. (2009) Expedition 315 Site C0002.Proceedings of the Integrated Ocean Drilling Program.
  3. Masataka K, Harold T, Juichiro A, Gaku K, et al. (2009) Expedition 316 Site C0007.Proceedings of the Integrated Ocean Drilling Program.
  4. Saneatsu S, Michael BU, Yu’suke K, et al. (2010) Site C0011.Proceedings of the Integrated Ocean Drilling Program.
  5. Pierre H, Toshiya K, Moe Kyaw Thu, et al. (2012)SiteC0011.Proceedings of the Integrated Ocean Drilling Program.
  6. Sumihiro K, Masa-aki K, Yukari O, Tetsuya M, Yuji Hatada,et al. (2013) Attachment and Detachment of Living Microorganisms Using a Potential Controlled Electrode.Marine Biotechnology15 : 461-475. [crossref]
  7. Christine J. Bunthof, Saskia van Schalkwijk, Wilco Meijer, Tjakko Abee,HugenholtzJ, et al. (2001)Fluorescent method for monitoring cheese starter permeabilization and lysis. Appl Environ Microbiol67 : 4264-4271. [crossref]
  8. Takehiro O, Junji T, Khairul M (2012) Potentials of mouthwashes in disinfecting cariogenic bacteria and biofilms leading to inhibition of caries. Open Dent J 6 : 23-30. [crossref]
  9. Aboul-Ftooh AMN, Abdel-Sadek OH (2019) Extraction of high-quality genomic DNA from different plant orders applying a modified CTAB-based method. Bulletin of the National Research Centre 43.
  10. J. Gregory Caporaso, Christian L. Lauber, William A. Walters, et al. (2011)Global patterns of 16S rRNA diversity at a depth of millions of sequences per sample.Proceedings of the National Academy of Sciences of the United States of America108 : 4516-4522. [crossref]
  11. Bert DR, Milad A, Alice SB, Jos RW,Margot E. Smit, et al. (2014) Integration of growth and patterning during vascular tissue formation in Arabidopsis. Science345.
  12. Xin Duan, Arjun Krishnaswamy, Irina Huerta DL, Joshua R S (2014) Type II Cadherins Guide Assembly of a Direction-Selective Retinal Circuit. Cell 158 : 793-807.
  13. Sachiko W, Miho T, Masaru M (2003)Identification and determination of sulfur compounds dissolved in water from volcanic ashes of Mt. Oyama in Miyake island and their effect to the environment BUNSEKI KAGAKU52 : 997-1003.
  14. Tatsuhiko K (2015) Chemical Composition of Mantle Wedge Fluids.Journal of Geography(Chigaku Zasshi)124 : 473-501.
  15. Souichiro K (2014) Extracellular Electron Transfer: Microbial Respiration on Solid Compounds. Japanese Society of Microbial Ecology.
  16. Kengo I (2011) Microbial Extracellular Electron Transfer.Journal of Environmental Biotechnology.
  17. Gemma R, Kevin DM, Teena M, Julie SN,Mark TT, et al. (2005) Extracellular electron transfer via microbial nanowires. nature435 : 1098-1101.
  18. Takuro N, Yoshihiro T, Miho H, Shigeru S, Akiko M, et al. (2015) Hadal biosphere: Insight into the microbial ecosystem in the deepest ocean on Earth.Proceedings of the National. Academy of Sciences of the United States of America112.

Early Detection of Mycoplasma hyopneumoniae in Pigs under Field Conditions Using Tracheo-bronchial Swab Sampling

DOI: 10.31038/IJVB.2020421

Abstract

Tracheo-bronchial swab (TBS) sampling is a rapid, reliable and animal-friendly diagnostic sampling of the respiratory tract for detection of Mycoplasma hyopneumoniae (M. hyopneumoniae). This mini-review gives an overview of different diagnostic approaches for M. hyopneumoniae from clinical signs, necropsy, microscopy to detection of the pathogen by immunohistochemistry, culture and PCR techniques. Subsequently, development, validation and obtained results are described using TBS for the early detection of M. hyopneumoniae in pigs with clinical symptoms of respiratory distress from 2 weeks of age onwards. Future perspectives on the application of TBS in diagnostic concepts, epidemiology and gilt adaptions protocols are also discussed.

Keywords

Mycoplasma hyopneumoniae, Swab sampling

Introduction

Diagnostic approach for Mycoplasma hyopneumoniae

Diagnostic approach towards Mycoplasma hyopneumoniae (M. hyopneumoniae), a major pathogen in PRDC with a large economic impact on profitability of modern pig production, remains a difficult issue under practical conditions [1-3]. Throughout the years, a broad variety of diagnostic methods have been developed and evaluated for diagnosis of M. hyopneumoniae under field conditions. These diagnostic methods range from assessment of clinical signs of coughing and a coughing index [4-9], macroscopic and microscopic lesions at necropsy, including immunohistochemical [10-11] and immunofluorescent identification of M. hyopneumoniae in lung tissue samples [12-13]. Additionally, different lung scoring systems at slaughter have been developed [14]. Laboratory diagnostics include serology from complement fixation tests to ELISA based on several specific adhesion factors [15-17] and molecular identification of the pathogen in several sample types, such as lung tissue, nasal swabs (NS) [18-20], laryngeal swabs (LS), broncho-alveolar lavage fluid (BALF) [21-22] and tracheo-bronchial swabs (TBS) [22-24]. However, under field conditions and for standard monitoring purposes, swine veterinarians and routine diagnostic laboratories have limited their approach mostly to clinical signs, macroscopic and microscopic evaluation upon necropsy, including lung lesion scoring at slaughter and serological monitoring. Clinical signs and lung lesions can only give a tentative diagnosis, which needs further confirmation with laboratory tests. Recently, the use of mobile systems (SOMO; SoundTalks NV, Leuven, Belgium) for cough recording at barn level with subsequent analysis of coughing patterns have been developed and validated under field conditions [2]. This innovative tool might support early M. hyopneumoniaediagnosis, although it still remains difficult to specifically differentiate coughing by M. hyopneumoniae from other major pathogens involved in PRDC, such as IAV-S, PRRSV and A. pleuropneumoniae. Therefore, even with a positive indication on clinical M. hyopneumoniae-indicative coughing, confirmation through pathogen identification remains crucial for further implementation of treatment or preventive measures. The early detection of M. hyopneumoniae through necropsy or lung lesion scoring systems at slaughter also remains under discussion. The lesions, namely purple to grey consolidated areas affecting predominantly the apical and middle lobes and eventually the cranial part of the diaphragmatic lobes, identified in both necropsy or slaughterhouse assessment are suggestive, but not pathognomonic for M. hyopneumoniaeinfection [2]. Other pathogens such as IAV-S or P. multocida should be considered as most probable differential diagnoses [1]. Moreover, since animals are dead or slaughtered at the moment of the diagnosis, the definition of ‘early’ detection cannot really be applied and curative or preventive measures will only have an effect on the next batches of animals within the same production system. For several decades, therefore, serological tests – more specifically ELISA – have been used to detect and monitor M. hyopneumoniae at herd level. Early studies have shown a serious delay between the initial clinical signs of coughing and the first detection of M. hyopneumoniae using ELISA of about 22 days [25]. This delay in seroconversion has recently been reconfirmed for two commercially available ELISA tests, demonstrating a minimum interval of 21 days before the first incomplete seroconversion could be detected in both ELISA tests [3]. Moreover, substantial differences exist between different ELISA tests towards their reactivity following initial seroconversion [3, 17] in naive animals. Therefore, serological monitoring can neither be considered as a tool for early M. hyopneumoniae detection under field conditions. Nevertheless, for routine farm monitoring and follow-up on changes in M. hyopneumoniae infection pattern due to adaptations of management or vaccination strategy, serological tests have clearly shown their value [26].

Tracheo-bronchial swab sampling – development and validation

Taking these considerations into account, a reliable and early detection of M. hyopneumoniae in living animals under field conditions is urgently needed in order to be able to confirm an upcoming infection as early as possible. This is crucial under modern pig farming conditions to efficiently apply curative and preventive measures to omit further spread of the pathogen within the farm. Especially lactating gilts with an active M. hyopneumoniae infection present in the farrowing room imply a major risk for further transmission of M. hyopneumoniae to their offspring, resulting in a fairly high number of M. hyopneumoniae-positive piglets at weaning [18-20, 23, 27-31]. However, until recently, most M. hyopneumoniaeprevalence studies in piglets and sows have been conducted using a rather easily applicable sampling technique, namely NS [18-20, 27-28, 31]. More recently, others have applied BALF or lung tissue sampling to study M. hyopneumoniae prevalence around weaning age [29, 30] (Table 1).

Table 1 : Studies of M. hyopneumoniae prevalence at various ages (expressed as % M. hyopneumoniae-positive piglets) using different sampling techniques.

Piglet age (weeks)

Prevalence (%)
M. hyopneumoniae

Sampling technique

Reference

3

7.7-9.6

NS

Calsamiglia and Pijoan, 2000 [18]

3

2.6-13.2

NS

Ruiz et al., 2003 [27]

1-3

0.5-5.5

NS

Sibila et al., 2007 [19]

6-9

2.0-9.0

NS

Sibila et al., 2007 [19]

3

0.0-51.3

NS

Fano et al., 2007 [28]

3

10.6

BALF

Moorkamp et al., 2009 [29]

6

12.3

BALF

Moorkamp et al., 2009 [29]

2

2.0

Lung

Nathues et al., 2010 [30]

4-10

9.3

Lung

Nathues et al., 2010 [30]

3

10.7

NS

Villarreal et al., 2010 [31]

4

14.1

TBS

Fablet et al., 2012b [24]

2.5-3

3.9

NS

Nathues et al., 2013 [20]

2

1.1

TBS

Vangroenweghe et al., 2015a [33]

3-5

7.1

TBS

Vangroenweghe et al., 2015b [36]

6-11

10.9

TBS

Vangroenweghe et al., 2015b [36]

NS, nasal swab; BALF, broncho-alveolar lavage fluid; TBS, tracheo-bronchial swab

Tracheo-bronchial swab (TBS) sampling technique has been developed as a diagnostic tool to screen pigs for respiratory pathogens, such as M. hyopneumoniae, through sampling of live pigs without anesthesia at the level of the trachea-bronchial split [9, 23]. A study comparing different sampling techniques for M. hyopneumoniae recovery in piglets has demonstrated that NS have 3.89 times less sensitivity in recovering M. hyopneumoniae from infected piglets as compared to the TBS technique, with LS and BALF in an intermediate position (1.39 and 1.09 times less sensitivity compared to TBS, respectively) [23]. Moreover, the amount of DNA material recovered from TBS samples was higher as compared to other diagnostic techniques in live pigs [32-34]. Recent research into welfare aspects of respiratory tract sampling demonstrated no additional stress when sampling pigs by TBS as compared to NS [35].

Tracheo-bronchial swab sampling – technical aspects

In order to perform TBS sampling in a comfortable way, fixation of the piglet using a rope and positioning the head in a hyperextensive position is key for success. The hyperextension is important to gain easy access to the glottis to subsequently go down the trachea. A mouth opener is positioned and the catheter is passed through the mouth down to the pharyngeal region, where a slight resistance might be observed at the level of the glottis. When the piglet stops screaming, the glottis will open for inhalation and the catheter can be moved further down the trachea to the level of the trachea-bronchial split. There, the catheter tip is turned around to collect as much mucus as possible. After retraction of the catheter, the tip (max. 10 cm) is collected in a sterile transport tube (10 mL) with 1 mL of sterile physiological saline (0.9% NaCl) and transported to the analytic laboratory [33, 36] (Figure 1).

IJVB-4-2-403-g001

Figure 1.A. Set of materials needed for TBS sampling (from left under to right up), including nasal rope, sample catheter, mouth opener, scissors and a 10 mL transportation tube containing 1 mL of sterile physiological saline (0.9% NaCl) solution; B. Optimal piglet fixation and presentation to obtain a TBS sample; C. Sample catheter with mucus on the tip ready to cut in the transportation tube.

A systematic quality check can be performed during the live sampling procedure to assess for correct sampling location [37].

Tracheo-bronchial swab sampling – high detection through optimal DNA recovery

To further elaborate on the TBS sampling, performance of TBS was compared to NS and bronchial swabs (BS), BALF and lung tissue samples in relation to detection of M. hyopneumoniae [33]. Recovery of M. hyopneumoniae was overall highest (59.3%) in TBS, whereas other sampling techniques such as NS had a limited recovery rate (6.25%). All three post-mortem sampling techniques – BALF, lung tissue samples and BS – had a good recovery (46.7 to 51.0%), though as already stated earlier, for monitoring purposes, sampling techniques in live animals should be preferred. Although BALF can also be performed in live animals, to our opinion, BALF sampling technique has several disadvantages for live piglet sampling as compared to TBS. There is need to sedate animals before the procedure and a more rigid catheter is needed for the intervention, which might harm the tubular structure of trachea or larger bronchi. A major concern is the variability in recovered fluid volume from the lavage in different piglets, which might interfere with the detection limit of the M. hyopneumoniae qPCR used in these samples. Evaluation of the level of recovery of M. hyopneumoniae (based on the CT values in the qPCR) for the live piglet sampling techniques, TBS samples resulted in the lowest CT values, whereas NS had a significantly lower yield in the qPCR. Only BS samples revealed a comparable recovery to TBS with lung tissue samples and BALF obtaining intermediate results (Figure 2). However, these samples – except for BALF – can only be taken in dead animals and are therefore not suitable for the intended purpose of live monitoring to detect M. hyopneumoniae at an early stage.Another field study on fattening pigs with clinical signs typical for M. hyopneumoniae compared three sampling techniques – TBS, LS and the pharyngeal spoon technique – for their detection of M. hyopneumoniae [32, 34]. Whereas the LS collects mucus at the level of the larynx, using a speculum and a long dry cotton swab, the pharyngeal spoon technique collects mucus just cranial to the laryngeal region, using an elongated spoon. In this study, fattening pigs sampled with all three techniques were positive for M. hyopneumoniae. However, TBS consistently had the lowest CT value, indicating the highest amount of collected genetic material (DNA) from the pathogens present at the level of the respiratory tract (Figure 3).

IJVB-4-2-403-g002

Figure 2.Comparison among different diagnostic sampling techniques combined with qPCR detection for M. hyopneumoniae in relation to estimated amount of DNA material (expressed as CT value) and percentage of positively detected animals. Black bars indicate live sampling techniques, grey bars indicate sampling techniques in dead animals. NS – nasal swab; TBS – trachea-bronchial swab; BALF – broncho-alveolar lavage fluid; BS – bronchial swab; Lung – lung tissue sample (adapted from Vangroenweghe et al., 2015a).

IJVB-4-2-403-g003

Figure 3.Comparison among different diagnostic sampling techniques combined with qPCR detection for M. hyopneumoniae in relation to estimated amount of DNA material (expressed as CT value ± SEM). Different letters in superscript indicate significant differences (P = 0.046). LS – laryngeal swab; Spoon – deep pharyngeal spoon technique; TBS – tracheo-bronchial swab (adapted from Betlach et al., 2018 and Vangroenweghe et al., 2018).

Tracheo-bronchial swab sampling and early detection of M. hyopneumoniae

Early detection of M. hyopneumoniaeinfection is essential in case of SPF breeding herds. In two recent case reports, TBS-qPCR has been demonstrated to detect M. hyopneumoniae at the moment where serology and lung lesions scoring still remained negative. Therefore, TBS should be the preferred option to screen a farm for M. hyopneumoniae-free certification and to capture early introduction of M. hyopneumoniae [38-39].

Tracheo-bronchial swabs sampling: future perspectives and applications

1. Mycoplasma hyopneumoniae diagnosis should be further elaborated, especially towards the optimization of sampling protocols for specific field conditions, such as early detection of the pathogen, certification of freedom of disease or other diagnostic approaches. Nowadays, it becomes more and more important to have a rapid and reliable diagnosis and therefore PCR tests should be available wherever possible and needed. Recent evolutions towards on-farm test applications (LAMP and helicase-dependent amplification technology [40] and on-site PCR kits) should be further developed and validated in order to have immediate results. This would help to determine an efficient treatment, which could result in less antibiotic use as compared to treatment of animals already suffering from M. hyopneumoniae in a more chronic stage of the disease.

2. In the near future, technology already applied in clinical and food microbiology will become readily available for use in veterinary diagnostic laboratories. Besides automation in the form of sample-to-result instrumentation for qPCR assay, which reduces labor and limits the risk for contamination during manipulation, multiplex tests are now available that enable single specimens to be evaluated for the presence of multiple pathogens associated with various clinical syndromes. Digital PCR and next-generation sequencing will push the landscape of molecular diagnostics further, allowing for analysis of complex, polymicrobial specimens and enabling accurate quantification of organisms present at very low levels (< 0.01% of the microbial consortium) in a specimen [40]. Another promising technique is Matrix-Assisted Laser Desorption Ionization-Time to Flight MS (MALDI-TOF), which enables the identification of bacteria and other microorganisms by non-fragmenting or ‘soft ionization’ techniques [40]. If these technologies become available for M. hyopneumoniae diagnostics, faster and more accurate diagnosis can be performed, especially if combined with a sampling technique that provides a high yield of pathogenic material, such as TBS.

3. TBS combined with improved isolation methods – suchas automation of primary processing and plating, coupled with initial culture examination aided by high-resolution optics [40] – could help to improve collection of field strains to further monitor antimicrobial sensitivity (MycoPath; [41]) which in turn would assist in reducing ineffective treatments against M. hyopneumoniaein case of antimicrobial resistance.

4. Mycoplasma hyopneumoniae epidemiology remains a challenging domain of research, which still undergoes interesting new evolutions, especially within the field of early gilt exposure to M. hyopneumoniae in order to prevent excretion during lactation which might affect her piglets’ M. hyopneumoniaeinfection status. Recently, several studies have been performed to evaluate the optimal transmission of M. hyopneumoniaefrom infected to naive gilts through direct contact [42-43] or using more challenging techniques such as intra-tracheal inoculation [43] or even aerosol applications of lung homogenate [43-44]. In these cases, M. hyopneumoniae transmission success is crucial for future stability of on-farm M. hyopneumoniae infection status (Figure 4). Under these conditions, TBS could be applied to check for inoculation success in the earliest possible way. Interestingly, the above stated inoculation methods are still under development and evaluation concerning the inoculum dose, the number of subsequent exposure events and the efficacy to transmit M. hyopneumoniaeto all animals exposed [46]. Currently, no standard protocol is available and therefore, additional research should be carried out to determine the minimal exposure in order to obtain colonization of the respiratory tract. For these purposes, TBS could be applied as an early detection tool to assess inoculation success.

Table 2: Overview of M. hyopneumoniae diagnostic sampling options for specific practical situations, combined with the average interval (expressed in days) between infection moment and first possible detection moment, the positivity at first detection (expressed as % M. hyopneumoniae-positive samples) and estimated amount of DNA material collected with each specific diagnostic sampling option. Interval infection vs. positivity was based on Pieters et al., 2017.

Diagnostic sampling option and detection technique

Status
M. hyopneumoniae end of fattening period

Early
M. hyopneumoniae infection

Acute outbreak of
M. hyopneumoniae

Interval infection – positivity
(days / % positive)
M. hyopneumoniae

Estimated amount of DNA material collected

Nasal swab – PCR

±

±

5 d (14%)

+

BALF – PCR

+

++

++

5 d (19%)

++

TBS – PCR

++

+++

+++

5 d (80%)

+++

Oral fluids – PCR

+

9 – 28 d (67%)*

+

Serology – ELISA

++

21 d (12%)

N/A

Lung lesions scoring

++

N/A

N/A

* Results obtained at pen level
N/A – not available

IJVB-4-2-403-g004

Figure 4. Gilt M. hyopneumoniae exposure timeline based on the 254 days of M. hyopneumoniae detection from initial infection onwards [45] (adapted from [43]).

5. Besides the deliberate or accidental exposure of gilts to M. hyopneumoniae, checking the actual M. hyopneumoniaestatus in farms is also of major importance. A recent survey on M. hyopneumoniae gilt introduction in conventional farms revealed major room for improvement, especially towards increasing the knowledge on the M. hyopneumoniaestatus of replacement gilts at the moment of arrival into the quarantine/adaptation facilities [47]. Again, early M. hyopneumoniae detection is crucial in order to adapt the preventive measures to the current health status at gilt delivery. In case of M. hyopneumoniae-positive gilts, curative treatment might be considered, whereas in case of a M. hyopneumoniae-negative status, correct vaccination with a M. hyopneumoniae vaccine might be considered to rapidly boost the gilt’s immunity before exposure at introduction into the existing conventional M. hyopneumoniae-positive sow population [48].

6. Finally, as piglet infection status for M. hyopneumoniae at weaning is a leading indicator towards the percentage of lung lesions at slaughter [28], it still remains of major importance to monitor the M. hyopneumoniae infection status of piglets on a regular basis. Especially since it has been clearly demonstrated that between-batch variability might be high and unpredictable based on the previous batch [28]. Within these monitoring schedules focused on early detection of M. hyopneumoniae, TBS could play a predominant role in the near future. Knowledge on the ‘information’ gap between M. hyopneumoniae detection using serology and TBS is also key in case of SPF certification programs for breeding herds producing M. hyopneumoniae-free gilts, in order to guarantee continuous delivery of M. hyopneumoniae-free reproduction gilts to end-customers or for their internal replacement [36-37].

Conclusion

Early diagnosis of M. hyopneumoniae in young piglets and at first clinical symptoms can be easily performed using TBS sampling. A comprehensive overview of the different diagnostic options and their potential for early diagnosis are given in Table 2. Different diagnostic scenarios are given: M. hyopneumoniae status at the end of the fattening period, detection of early M. hyopneumoniaeinfection in piglets and in case of acute respiratory disease. Tracheo-bronchial swab sampling has the potential to both detect M. hyopneumoniae at an early stage in life and during infection, especially due to the collection of a sufficient high amount of pathogen material from the respiratory tract during sampling. This confirms TBS combined with qPCR as the preferred method for M. hyopneumoniae diagnostics.

References

  1. Sibila M, Pieters M, Molitor T, Maes D, Haesebrouck F, et al. (2009). Current perspectives on the diagnosis and epidemiology of Mycoplasma hyopneumoniae infection.Veterinary Journal181: 221-231. [crossref]
  2. Maes D, Sibila M, Kuhnert P, Segalés J, Haesebrouck F, et al. (2017) Update on Mycoplasma hyopneumoniae infections in pigs: knowledge gaps for improved disease control. Transboundary and Emerging Diseases 62: 1-15. [crossref]
  3. Pieters M, Daniels J, Rovira D (2017)Comparison of sample types and diagnostic methods for in vivo detection of Mycoplasma hyopneumoniaeduring early stages of infection. Veterinary Microbiology203: 103-109. [crossref]
  4. Morris CR, Gardner IA, Hietala SK, Carpenter TE, Anderson RJ, et al. (1995) Seroepidemiologic study of natural transmission of Mycoplasma hyopneumoniaein a swine herd. Preventive Veterinary Medicine 21: 323-337.
  5. Maes D, Deluyker H, Verdonck M, Castryck F, Miry C, et al. (1999)Risk indicators for the seroprevalence of Mycoplasma hyopneumoniae, porcine influenza viruses and Aujeszky’s disease virus in slaughter pigs from fattening pig herds. Journal of Veterinary Medicine 46: 341-352. [crossref]
  6. Thacker EL, Thacker BJ, Young TF, Halbur PG (2000) Effect of vaccination on the potentiation of porcine reproductive and respiratory syndrome virus (PRRSV)-induced pneumonia by Mycoplasma hyopneumoniae. Vaccine 18: 1244-1252. [crossref]
  7. Vicca J, Stakenborg T, Maes D, Butaye P, Peeters J, de Kruif A, Haesebrouck F (2003) Evaluation of virulence of Mycoplasma hyopneumoniae field isolates. Veterinary Microbiology97: 177-190. [crossref]
  8. Meyns T, Dewulf J, de Kruif A, Calus D, Haesebrouck F, et al. (2006) Comparison of transmission of Mycoplasma hyopneumoniae in vaccinated and non-vaccinated populations. Vaccine 24: 7081-7086. [crossref]
  9. Marois C, Le Carrou J, Kobisch M, Gautier-Bouchardon AV (2007) Isolation of Mycoplasma hyopneumoniae from different sampling sites in experimentally infected and contact SPF pigs. Veterinary Microbiology 120: 96-104. [crossref]
  10. Sarradell J, Andrada M, Ramírez AS, Fernández A, Gómez-Villamandos JC, et al. (2003)A morphologic and immunohistochemical study of the bronchus-associated lymphoid tissue of pigs naturally infected with Mycoplasma hyopneumoniae. Veterinary Pathology40: 395-404. [crossref]
  11. Rodriguez F, Ramirez GA, Sarradell J, Andrada M, Lorenzo H (2004) Immunohistochemical labeling ofcytokines in lung lesions of pigs naturally infected with Mycoplasma hyopneumoniae. Journal of Comparative Pathology 130: 306-312. [crossref]
  12. Kobisch M, Tillon J, Vannier P, Magneur S, Morvan P (1978)Pneumonie enzootique à Mycoplasma suipneumoniae chez le porc: diagnostic rapide et recherches d’anticorps. Recueil de MédecineVétérinaire 154: 847-852.
  13. Piffer I, Ross RF (1985) Immunofluorescence technique for detection of Mycoplasma hyopneumoniae in swine lungs. Pesquisa Agropecuáia Brasileira20: 877-882.
  14. Garcia-Morante B, Segalés J, Fraile L, Pérez de Rozas A, Maiti H, et al. (2016) Assessment of Mycoplasma hyopneumoniae-induced pneumonia using different lung lesions scoring systems: a comparative review. Journal of Comparative Pathology 154: 125-134. [crossref]
  15. Strait EL, Erickson BZ, Thacker EL (2004) Analysis of Mycoplasma hyopneumoniae field isolates. In: Proceedings of 35th Annual Meeting of American Association of Swine Veterinarians. Des Moines, IA. p. 95
  16. Ameri-Mahabadi M, Zhou E-M, Hsu WH (2005) Comparison of two swine Mycoplasma hyopneumoniae enzyme-linked immunosorbent assays for detection of antibodies from vaccinated pigs and field serum samples. Journal of Veterinary Diagnostic Investigation 17: 61-64. [crossref]
  17. Erlandson KR, Evans RB, Thacker BJ, Wegner MW, Thacker EL (2005) Evaluation of three serum antibody enzyme-linked immunosorbent assays for Mycoplasma hyopneumoniae. Journal of Swine Health and Production13: 198-203.
  18. Calsamiglia M, Pijoan C (2000) Colonisation state and colostral immunity to Mycoplasma hyopneumoniae of different parity sows. Veterinary Record 146: 530-532. [crossref]
  19. Sibila M, Nofrarias M, Lopez-Soria S, Segalés J, Riera P, Llopart D, Calsamiglia M (2007) Exploratory field study on Mycoplasma hyopneumoniaeinfection in suckling pigs. Veterinary Microbiology121: 352-356. [crossref]
  20. Nathues H, Woeste H, Doehring S, Fahrion AS, Doherr MG, et al. (2013) Herd specific risk factors for Mycoplasma hyopneumoniae infections in suckling pigs at the age of weaning. Acta Veterinaria Scandinavica 55: 30-42. [crossref]
  21. Kurth KT, Hsu T, Snook ER, Thacker EL, Thacker BJ, et al. (2002) Use of a Mycoplasma hyopneumoniae nested polymerase chain reaction test to determine the optimal sampling sites in swine. Journal of Veterinary Diagnostic Investigation 14: 463-469. [crossref]
  22. Marois C, Cariolet R, Morvan H, Kobisch M (2008) Transmission of pathogenic respiratory bacteria to specific pathogen free pigs at slaughter. Veterinary Microbiology129: 325-332. [crossref]
  23. Fablet C, Marois C, Kobisch M, Madec F, Rose N (2010) Estimation of the sensitivity of four sampling methods for Mycoplasma hyopneumoniae detection in live pigs using a Bayesian approach. Veterinary Microbiology143: 238-245. [crossref]
  24. Fablet C, Marois C, Dorenlor V, Eono F, Eveno E, et al. (2012) Bacterial pathogens associated with lung lesions in slaughter pigs from 125 herds. Research in Veterinary Science93: 627-630.
  25. Sørensen V, Ahrens P, Barfod K, Feenstra AA, Feld NC, et al. (1997). Mycoplasma hyopneumoniae infection in pigs: duration of the disease and evaluation of four diagnostic assays. Veterinary Microbiology54: 23-34. [crossref]
  26. Vangroenweghe F, Suls L, Van Driessche E, Maes D, De Graef E(2012)Health advantages of transition to batch management system in farrow-to-finish pig herds. Veterinarni Medicina 57: 83-91.
  27. Ruiz AR, Utrera V, Pijoan C (2003)Effect ofMycoplasma hyopneumoniae sow vaccination on piglet colonization at weaning. Journal of Swine Health and Production11: 131-135.
  28. Fano E, Pijoan C, Dee S, Deen J (2007)Effect of Mycoplasma hyopneumoniae colonization at weaning on disease severity in growing pigs. Canadian Journal of Veterinary Research71: 195-200. [crossref]
  29. Moorkamp L, Hewicker-Trautwein M, groβe Beilage E (2009)Occurrence of Mycoplasma hyopneumoniae in coughing piglets (3-6 weeks of age) from 50 herds with a history of endemic respiratory disease. Transboundary and Emerging Disease 56: 54-56. [crossref]
  30. Nathues H, Kubiak R, Tegeler R, groβe Beilage E (2010)Occurrence of Mycoplasma hyopneumoniae infections in suckling and nursery pigs in a region of high pig density. Veterinary Record166: 194-198. [crossref]
  31. Villarreal I, Vranckx K, Duchateau L, Pasmans F, Haesebrouck F, et al. (2010). Early Mycoplasma hyopneumoniaeinfections in European suckling pigs in herds with respiratory problems: Detection rate and risk factors. Veterinarni Medicina55: 318-324.
  32. Betlach A, Vangroenweghe F, Holst S, Evelsizer R, Pieters M (2018) Evaluating Mycoplasma hyopneumoniae by PCR using various sample types. In: Proceedings of Allan D. Leman Conference. Mineapolis, MN.
  33. Vangroenweghe F, Karriker L, Main R, Christianson E, Marsteller T, et al. (2015) Assessment of litter prevalence of Mycoplasma hyopneumoniaein preweaned piglets utilizing an antemorten tracheobronchial mucus collection technique and real-time polymerase chain reaction assay. Journal of Veterinary Diagnostic Investigation 27: 606-610. [crossref]
  34. VangroenwegheF, Holst S, WillemsE, Betlach A, MalasekJ, et al. (2018) Tracheobronchial swab sampling as an early diagnostic tool to confirm Mycoplasma hyopneumoniae in a central European SPF breeding herd. In: Proceedings of 5th Conference of European Association of Veterinary Laboratory Diagnosticians. Brussels, Belgium.
  35. Weiβ C, Beffort L, Renken C, Froelich S, Zoels S, et al. (2018)Effect of tracheobronchial-swabbing and other diagnostic tools on the endocrine stress response of pigs. In: Proceeding of 9th European Symposium on Porcine Health Management. Barcelona, Spain. p. 86.
  36. Vangroenweghe F, Labarque G, Piepers S, Strutzberg-Minder K, Maes D (2015)Mycoplasma hyopneumoniaeinfections in peri-weaned and post-weaned pigs in Belgium and The Netherlands: prevalence and associations with climatic conditions. Veterinary Journal205: 93-97. [crossref]
  37. Vangroenweghe F(2018)Early detection of Mycoplasma hyopneumoniae in pigs under field conditions. PhD thesis – Faculty of Bioscience Engineering, Ghent University, Ghent, Belgium.
  38. Vangroenweghe F, Willems E, Malášek J, Thas O, Maes D (2018) Use of trachea-bronchial swab qPCR test to confirm Mycoplasma hyopneumoniae seropositivity in an SPF breeding herd. Porcine Health Management4: 12-17.
  39. Vangroenweghe F, Willems E, Thas O, Maes D (2018) Confirmation of Mycoplasma hyopneumoniae in a breeding herd through tracheobronchial swab sampling and PCR. Veterinary Record183.
  40. Buchan BW, Ledeboer NA (2018) Emerging Technologies for the Clinical Microbiology Laboratory. Clinical Microbiology Reviews 27: 783-822. [crossref]
  41. Klein U, de Jong A, Moyaert H, El Garch F, Leon R, (2017) Antimicrobial susceptibility monitoring of Mycoplasma hyopneumoniae and Mycoplasma bovis isolated in Europe. Veterinary Microbiology204: 188-193. [crossref]
  42. Roos LR, Fano E, Homwong N, Payne B, Pieters M (2016) A model to investigate the optimal seeder-to-naive ratio for successful natural Mycoplasma hyopneumoniae gilt exposure prior to entering the breeding herd. Veterinary Microbiology184: 51-58. [crossref]
  43. Yeske P (2018) Mycoplasma hyopneumoniae: lateral transmission and gilt exposure methods. In: Proceedings of 49th Annual Meeting of American Association of Swine Veterinarians. San Diego, CA. p. 482-484.
  44. Nickel M, Toohill E, Lehman J (2018) Use of a hurricane fogger for Mycoplasma hyopneumoniae inoculation in nursery age gilts. In: Proceedings of 49th Annual Meeting of American Association of Swine Veterinarians. San Diego, CA. p. 97-98.
  45. Pieters M, Pijoan C, Fano E, Dee S (2009)An assessment of the duration of Mycoplasma hyopneumoniae infection in an experimentally infected population of pigs. Veterinary Microbiology 134: 261-266. [crossref]
  46. McMahon M, Garcia Morante B, Betlach A, De Abreu C, Robbins R, et al. (2020) Lung homogenate optimization for successful Mycoplasma hyopneumoniae exposure in gilts during acclimation. In: Proceedings of 51st Annual Meeting of American Association of Swine Veterinarians. Atlanta, US. p. 73.
  47. Garza-Moreno L, Segalés J, Pieters M, Romagosa A, Sibila M (2017) Survey on Mycoplasma hyopneumoniae gilt acclimatization practices in Europe. Porcine Health Management 3: 21-28.
  48. Garza-Moreno L, Segalés J, Pieters M, Romagosa A, Sibila M (2018) Acclimation strategies in gilts to control Mycoplasma hyopneumoniae infection. Veterinary Microbiology219: 23-29.

Telemedicine: Enabling Patients with Arrhythmias in Self-Care Behaviors

DOI: 10.31038/JCRM.2020326

Abstract

The study, Telemedicine: Enabling Patients with Arrhythmias in Self-Care Behaviors study is designed for early recognition and treatment of an arrhythmia and optimizing patients’ medication, activity, and arrhythmia self-efficacy. Telemedicine is a method which allows health care professionals to evaluate, diagnose, and treat patients within their homes and remote locations [1]. Connecting with patients via video and telephone visits allows the caregiver access and assists the patient in improving self-care behaviors and self-efficacy in managing arrhythmias [1,2]. This pilot telemedicine study provides earlier diagnosis of abnormal arrhythmias and increased patient involvement and self-efficacy of one’s health care solutions [2]. The Telemedicine: Enabling patients in Self-Care Behaviors study started in February 2020, prior to the onset of the Covid 19 pandemic. The study has been placed on hold since March 17, 2020. In a response to the Covid-19 pandemic (separate from this study) multiple medical and nursing practices have adopted telemedicine to maintain ongoing care appointments [3]. The study displays the complementing use of three survey tools (Medication Understanding and Self-Efficacy Tool, Functioning Self Efficacy Scale, and Arrhythmia Specific questionnaire in Tachycardia an Arrhythmia) with monitoring devices (loop recorders, Kardia-TM, pacemakers and cardioverter defibrillators-ICDs) coupled with telephone and video visits to pinpoint arrhythmia changes and exact patient reactions and discussion to reinforce self-efficacy behaviors.

Keywords

Telemedicine, arrhythmia, self-efficacy, behavior.

Introduction

The purpose of the study, Telemedicine: Enabling Patients with Arrhythmias in Self-Care Behaviors (T:EPASB) is to provide an alternative to in person visits, decreased the time of diagnosis and treatment of an arrhythmia via the internet, and enable patients to improve self-efficacy of arrhythmia care behaviors. Self-efficacy can be defined as the individual’s belief in oneself to handle a set of circumstances or changes in physical or mental well-being [2].

The first outcome of the study is to determine if subjects in a telemedicine program for the care of cardiac arrhythmias have  any difference in [1] time of arrhythmia recognition [2], time of arrhythmia diagnosis by a healthcare provider, and [3] time of treatment initiation compared with patients enrolled in standard care for cardiac arrhythmias. The second outcome of the study examines subjects’ self-efficacy of medication use, functional self-efficacy, and arrhythmia self-efficacy. A data collection tool was utilized with a simplistic check off system used to mark when one recognized changes in symptoms such as increased palpitations, fatigue, activity intolerance, shortness of breath, and any other change in symptoms associated with an arrhythmia. The tool allowed for quick responses to these symptoms with self-initiated blood pressure check, heart rate check, increased fluids, or taking an additional beta blocker, sitting down and resting, and calling the electrophysiology (EP) office for advice (Appendix A).

Background Information

University based tertiary care clinics, which  treat  irregular heart rhythms, are known as arrhythmia clinics and formally called electrophysiology departments [4]. These departments have been in existence prior to the early 1960’s and their technology has continued to evolve over time. The need to meet with patients and discuss  their abnormal and irregular heart rhythms has entailed prescribing medications to slow the heart rate, prescribing medications to eliminate abnormal heart rhythms, and implanting devices to further control the heart rhythms, known as pacemakers (PPM) and implantable cardioverter-defibrillators (ICDs) [4]. The continued improvement in technology and expansion of such departments has led to a need for increased numbers of patient appointments, dual appointments for arrhythmia management and pacemaker or ICD management, and coordinated appointments with other cardiology sub-specialties [5]. This increased frequency and duration of appointments places stress upon patients with longer drives, wait times, financial stressors of parking, food, and gas costs in reaching such appointments [6]. With such stressors, a need for computer assisted video visits has evolved [6]. The monitoring  of  arrhythmias  involves  home  monitoring via external disposable monitors which are affixed on  the chest wall, small implanted monitors (loop recorders), and utilizing the monitoring features of permanent pacemakers (PPMs) or implantable cardioverter defibrillators (ICDs).

Review of literature

The T:EPASB is based upon studies showing improved clinical outcomes with the use of telemedicine. The TRUST trial compares the use of a telephone video conference to conventional in person visits with individuals with ICDs. The TRUST trial determined the efficacy and safety for monitoring ICDs and the reduction of in person visits [7,8]. This study displayed an adverse event rates of 10.4 for each group [7,10] and no difference in the telemedicine versus the in person visit group.

The Poniente trial determined there was no difference in arrhythmia detection and functional capacity in monitoring elderly patients with pacemakers via home monitoring compared with in person monitoring [9]. The CHOICE AF was a pilot study to test the feasibility of brief telephone-based program to target improving cardiovascular risk factors and health related quality of life in patients with atrial fibrillation [11], showing great potential for a telephone- based program.

A study by Ryan et. al. (2018) [13] verified the efficacy of theory based Integrated Theory of Health Behavior Change (ITHBC) intervention utilizing a cellular phone application to increase women’s initiation and long-term maintenance of osteoporosis self-management behaviors. This study takes a chronic disease state, osteoporosis, and combines ITHBC prompted behaviors with a cellular phone application to assist women in behavior change. Suter et. al. (2011) [14] used self-efficacy as a key component in managing one’s health noting patient empowerment in the management of chronic disease conditions such as diabetes mellitus and heart failure. The study identified the essence of telemedicine in its ability to empower patients with skills in managing one’s chronic health condition.

Theoretical Framework

Integrated Theory of Health Behavior Change (ITHBC) was used in guiding this study as it notes the importance in assisting individuals in becoming increasingly involved in their own health care [2]. This theory links a relationship between the way one views one’s own health care and an overall sense of wellness. Dr. Ryan’s study of those with chronic health care diagnosis’ and improving specific health care behaviors highlighted the need to 1) have a change in how one reacts followed by 2) one’s resultant behavior with an improved sense of wellness (when assisted with behavior changes). Essential components for behavior change include a desire to change, self- reflection, positive social-influence and support required in creating the change [2].

Methods and Materials

The study is a prospective randomized controlled study, in which informed consent was obtained. Randomization included subjects picking from sealed envelopes which were numbered, labelled with a folded card within each envelop stating either standard versus telemedicine visits. The University of Michigan Hospital IRB number: IRB00001995.

Inclusion/Exclusion Criteria:

JCRM-3-2-307-g001

Methods

The study was introduced to the subjects during an initial meeting with an explanation of the study and an explanation of the consent. After the informed consent was obtained, the subjects were randomized into telemedicine or standard in person six- month visits.

With the initial visit, surveys were completed with telemedicine and standard visit groups. Telemedicine subjects received monthly visits for three consecutive months and standard received a six month return visits (Appendix B-study schematic). Interventions provided to the telemedicine group included discussion and reinforcement of medication, functional activity and arrhythmia self-efficacy, guided discussion, and social support.

The surveys utilized were the Medication Understanding and Self-Efficacy Tool, Functioning Self Efficacy Scale, and Arrhythmia Specific questionnaire in Tachycardia an Arrhythmia (MUSE, FSES, ASTA) surveys. All three surveys were provided on the first day of the study to each study group subject and on the last day of the study for each study group subject. Key questions were compared with a calculation of the mean for these questions, comparing the standard group with the telemedicine group. (Appendix C, D, E– MUSE, FSES, and ASTA surveys).

There were chart reviews and analysis of monitored data from devices  revealing  onset  of  arrhythmias,  times  of  diagnosis’  and treatments in the telemedicine group compared with the standard group. The T:EPASB utilizes the null hypothesis to demonstrate no difference in time of recognition of an arrhythmia, time to diagnosis and treatment of the arrhythmia, between the telemedicine group as compared with the standard group. The null hypothesis is be used in the Medication Understanding and Use Self- Efficacy (MUSE), ASTA (Arrhythmia Specific questionnaire in Tachycardia and Arrhythmia) and FSES (Shortened Functional Self Efficacy Scale) surveys. A paired T test with the difference in the means of answers to survey questions was utilized in calculating a P value for select survey questions (Appendix C).

Measures

Arrhythmias can be multifactorial and can cause no perceived symptoms versus serious symptoms such as palpitations, fast and pounding heart beats, sweating, chest pain and or pressure, anxiety, fear, and depression [15]. One single survey may not capture the data experienced by the subject and not every survey relates to the self- efficacy of these perceived events. The MUSE survey gives information on medication compliance, cost barriers, number of medications, physicians and pharmacies and hospitalizations. The FSES gives a scale of the subject’s self- efficacy to cope with the arrhythmia and day to day functioning. The ASTA survey is the most specific survey to arrhythmias and the symptoms associated with arrhythmias; but does not reflect the medications or functional capabilities.

The MUSE survey was tested for validity and reliability in measuring   patients’ self-   efficacy   in   understanding   and   using prescription medications [12]. FSES displayed good internal consistency and satisfactory criterion and convergent validity in assessing the degree of confidence self-functioning while facing decline in health and function [16]. ASTA, displayed content validity for all items, and internal consistency [17].

Data Collection Sheet and Demographics:

JCRM-3-2-307-g002

Pilot Study Results

From late February 2020 to March 2020, 9 patients were enrolled in the Telemedicine study and randomized to either standard visits or telemedicine visits. Three patients declined the study, one patient noted he would join the study, but only if he received a Kardia monitoring device (he was not enrolled in the study as this could not be guaranteed and he noted his intention of simply gaining the Kardia device) and was not enrolled due to ethical concerns.

All subjects signed the informed consent and received copies of the protocol and consent, including the clause that they may drop out of the study. Each subject was given instruction on filling out surveys and were given the opportunity to answer questions by the nurse practitioner (NP) in clinic and the research assistant. The surveys were reviewed and scored by the research assistant and double scored with the author of the study. The surveys pinpointed the overall arrhythmia burden, degree to which subjects felt the arrhythmia, and physical and mental coping levels in relation to the arrhythmia. The surveys gave the caregiver (Nurse Practitioners and Physician Assistants within the EP clinic) specific areas to discuss, reinforce, and empower the subject in arrhythmia behavior change. The time of recognition, diagnosis and treatment of arrhythmias was deferred due to the Covid 19 pandemic and this monitoring data is attained only for daily arrhythmia management.

Appendix D gives the overview of all survey results for T:EPASB. The overview gives the researcher a quick glimpse of any problem areas such with decreased self-efficacy of medication use, or functional capacity or arrhythmia knowledge and understanding.

Results of the MUSE survey show near complete compliance in medication use with only one missed dose of medications from one subject. MUSE tallied results also show no financial constraints to medication obtainment in all nine subjects. There was a 0.8679:1 ratio with number of number of physicians treating to number of medical diagnosis; with a mean of 2.89 physicians prescribing medications to a mean of 3.33 medical diagnosis for the 9 subjects evaluated (Appendix B). When combining the surveys, key data becomes clear. The subjects scoring the lowest functional status self-efficacy, subject 5a and subject 9a with scores of 43 and 44 respectively, scored 37 and 54 respectively on the ASTA arrhythmia burden survey. One can note poor functional self-efficacy, but not necessarily related to arrhythmia burden in subject 5a, while poor functional self-efficacy may be related to a higher arrhythmia burden in subject 9a. Another complementing data point will be specific arrhythmia logs within monitoring- devices; once this deferred data is allowed within the study. Another interesting finding is the subject 8a who has a high arrhythmia burden noted with ASTA of 46, but a very good FSES score of 64.

Discussion

The T:EPASB pilot study has shown the importance of offering an alternative to conventional in person visits, offering counseling in  managing  one’s  self-efficacy  for  arrhythmia  care,  and  providing reinforcement and social support in managing one’s arrhythmia care. The study illustrates the importance of gathering complementing data on arrhythmia management including medication use and understanding, functional self-efficacy, and arrhythmia self-efficacy. The triad of these surveys provides an excellent overview of one’s arrhythmia self-efficacy. With such data, the medical and nursing provider may offer patient specific counseling. There is an advantage of having a specifically timed event, match a corresponding subject’s complaint. The use of implanted and portable monitoring data gives an excellent overview of the subject’s associated heart rhythm abnormality. The MUSE survey used alone gives a false sense that there may not be any need for any reinforcement of self-efficacy of medication or arrhythmia understanding. When this survey is coupled with the FSES and ASTA, trends begin to develop and specific areas of intervention, such as improved daily activity levels, decreased arrhythmia burdens via medications or activity, utilization of beta or calcium channel blockers, increased fluids, and or activity training to improve arrhythmias may be discussed. The surveys when used  together  display  specific  areas  to  improve  subject’s  knowledge, one’s confidence and self-efficacy in arrhythmia management. Those with higher arrhythmia burdens in which the subject feels palpitations, fatigue, and side effects have a greater need for intervention which strengthen self-efficacy and social support for medication use, functional activities and arrhythmia management [16,17]. This pilot T:EPASB study continues to show great potential and will likely mimic the TRUST, CHOICE-AF and Poinete trials in identifying, diagnosing, and treating arrhythmias with no difference in timing of these events with telemedicine compared with in person follow up visits with prompt device monitoring. The study has already helped to pinpoint areas of difficulties with arrhythmias, medications, and functional capacity. Via interventions such as affirming knowledge, counselling medication usage, and validating activity and exercise efforts and knowledge, the caregiver  may  help  improve  the  subjects’  overall  functional  capacity in coping with one’s arrhythmia. The study’s evaluated questions have not reached significant p values, as the study has been Anecdotally, the overall response to telemedicine has been very positive with comments like, “this is so much better”, “I can concentrate on what you are teaching me, without the long drive” and “this information seems to stick much better, when I learn it at home” and “can we make more telemedicine appointments”. The T:EPASB study can in no way be fully assessed at this early point, but its potential to assist in improving patients’ self-efficacy via increased patient interaction, reinforcement of arrhythmia details, and social support will surely lead to further studies using telemedicine and a triad of survey tools.

Authorship:

Kathleen Fasing, DNP-c, MS,

ACNP Madonna University,

Livonia MI

University of Michigan, Staff ACNP, Ann Arbor, Michigan

kfasing@med.umich.edu

DNP Project Chair: Patricia Clark, DNP, RN, ACNP-BC,

ACNS- BC, CCRN, Madonna University,

pclark@madonna.edu

DNP Project Member: Rachel Mahas, PhD, MS, MPH,

Madonna University, rmahas@madonna.edu

DNP Project Member: Vicki Ashker, DNP, MSA, RN,

CCRN, Madonna University, vashker@madonna.edu

Milwaukee- Self Management Science for your great research on self- efficacy and your ITHBC theory and allowing its use.

Sara Carmel- Ben Gurion University of Negev- Public Health Faculty Member- for your behavior research and functional self- efficacy tool and allowing its use.

Ulla Walfridsson RN, PhD-Division of Nursing Science; Dept of Medicine & Health Sciences, Linkping, Sweeden- for sharing your incredible arrhythmia assessment tool and allowing its use.

Sangeeta Lathkar-Pradhan- Research Assistant for ongoing support and patience.

Rachel Wessel- Research Assistant for exacting perseverance.

Hakan Oral, MD- University of Michigan EP Director- thanks for believing in me.

Dr. Patricia Clark- DNP committee lead and advisor and patience extraordinaire.

My husband- Gregory Fasing BSN, RCIS- for his forever support.

Acknowledgements

Thank you so much for all who assisted in this project including and in equal acknowledgement.

Polly Ryan PhD, RN, CNS-BC – University of Wisconsin

References

  1. Kay, Misha, Santos, Takane (2010) Telemedicine opportunities and development in member states, Global observatory for eHealth series, virtualhospital.org.uk. (1,2). [crossref]
  2. Ryan, P. (2009) Integrated theory of health behavior change: Background and intervention development, Clinical Nurse Specialist, 23 (3): 161-172. (3, 5,18,19). [crossref]
  3. Lovett-Rockwell, K. & Gilroy, A. (2020) Incorporating telemedicine as part of COVID-19 Outbreak response systems, The American Journal of Managed Care, 26 (4): 147-148. Doi.org/10.37765/ajmc.,(4). [crossref]
  4. Fozzard (2011) History of basic science in cardiac electrophysiology, Cardiac electrophysiologycinics, 3, 1, 1-10. Doi:10.1016/j.ccep.2010.10.010,(6,7). [crossref]
  5. Phend, C. (2020) Telehealth shaping up for Covid-19- Cardiology illustrates what specialties can do to be ready, Medpage today.,(8).
  6. Maffei, R., Hudson, Y. & Skim Dunn, M. (2008) Telemedicine for urban uninsured: A pilot Framework for specialty care planning sustainability, J E health, 14(9), 925- 931 [crossref]
  7. Dalouk,  K.,  Gandhi,  N.,  Jessel,  P.,  MacMurdy,  K.  et.  al.  (2017)  Outcomes   of telemedicine  videoconferencing  clinic  versus   in-person   clinic   follow-up for implantable cardioverterdefibrillator recipients, Circulation arrhythmia electrophysiology, 10, (11,13).
  8. Varma, N., Epstein, A., Irimpen, A., Schweikert, R., & Love, C. (2010) Efficacy and safety of automatic remote monitoring for implantable cardioverter-defibrillator follow-up: The Lumos-T safely reduces routine office device follow-up, TRUST trial, Circulation, 122: 325332.,(12). [crossref]
  9. Lopez-Villegas, A., Catalan-Matamoros, D., Robles-Musso, E., & Peiro, S. (2015) Effectiveness of pacemaker tele-monitoring on quality of life, functional capacity, event detection and workload: The PONIENTE trial, Geriatrics and gerontology international, 16 (11).,(14). [crossref]
  10. Varma, N. & Ricci, R. (2013) Telemedicine and cardiac implants: what is the benefit? European heart journal, 34 (25), 1885-1895.(15).
  11. Lowres, N., Redfern, J., & Freedman, S. (2014) Choice of health options in prevention of cardiovascular events for people with  atrial  fibrillation  (CHOICE  AF):  A  pilot study, European journal of cardiovascular nursing, doiorg.proxy.lib.umich. edu/10.1177/14745114549687. (16). [crossref]
  12. Cameron, K., Ross, E., Clayman, M., Bergeron, A., et. al. (2010) Measuring patients’ self-efficacy in understanding and using prescription medication, PatientEducation Couns, 80 (3); 372376. Doi: 10.1016/j.pec.2010.06.029.,(17,21). [crossref]
  13. Ryan, P., Papanek, P., Csuka, M., Brown, M., et. al. (2018) Background and method of the striving to be strong study, a RCT test the efficacy of a mhealth self-management intervention, Contemporary Clinical Trials, 71, 80-87.,(16). [crossref]
  14. Suter, B., Suter, W. N., & Johnston, D. (2011) Theory-based telehealth and patient empowerment, Population Health Management, 14 (2).,(19). [crossref]
  15. Withers, K., Wood, K., Carolan-Rees, G, Patrick, H., et.al. (2015) Living on a knife edge- the daily struggle of coping with symptomatic cardiac arrhythmias, Health quality life outcomes, 13:86.,(20). [crossref]
  16. Tovel, H. & Carmel, S. (2015) Functional Self-Efficacy Scale- FSES: Development, evaluation, and contribution to well-being, Research on aging, 1-22. Doi: 10.1177/0164027515596583. (16,22,24). [crossref]
  17. Walfridsson, U., Arestedt, K., & Stromberg, A. (2012) Development and validation of a new arrhythmia-specific questionnaire in tachycardia and arrhythmia (ASTA) with focus on symptom burden, Health quality life outcomes, 10-44, doi: 10.1186/1477- 7525-10-44.,(23,25). [crossref]

Appendix A. Data Collection Tool- Aid for patient at home.

JCRM-3-2-307-g003

2 points each for every activity noted along the vertical axis; showing an activity taken due to the symptom noted on the horizontal axis. Subject to keep weekly log of number of symptoms and number of points for response activities.

Appendix B: Study Schematic

JCRM-3-2-307-g004

Appendix C: Three Surveys

JCRM-3-2-307-g005

JCRM-3-2-307-g006

Walfridsson, U., Arestedt, K., & Stromberg, A. (2012) Development and validation of a new arrhythmia-specific questionnaire in tachycardia and arrhythmia (ASTA) with focus on symptom burden, Health quality life outcomes, 10-44, doi: 10.1186/1477- 7525-10-44.,(23,25).

JCRM-3-2-307-g007

JCRM-3-2-307-g008

JCRM-3-2-307-g009

JCRM-3-2-307-g010

JCRM-3-2-307-g011

JCRM-3-2-307-g012

JCRM-3-2-307-g013

JCRM-3-2-307-g014

JCRM-3-2-307-g015

JCRM-3-2-307-g016

JCRM-3-2-307-g017

JCRM-3-2-307-g018

Appendix D: Scores of completed surveys:

Survey Scores: Key- Muse– Shows any difficulty in taking; or understanding medications. FSES

highest the better functional status; highest possible =65. ASTA– the highest the worse arrhythmia burden, symptoms, and mental and physical QOL.

JCRM-3-2-307-g019

Appendix D. – Answers to the above scores

Muse Survey Answers

Question 1– How many prescriptions medications do you take regularly?

Mean= 5.33 medications; Median 4 Medications; Mode 5 medications with a low answer of 2 and high answer of 19 medications.

Question 2– During the past have you forgotten to take any medication? “Only 1 yes.

Question 3– In the past did you not fill or stop taking the prescription due to cost? All answered no.

Question 4– In a typical month how many pharmacies do you use; including mail order? Six subjects answered 1/ 3 subjects answered 2.

Question 5– Have you been admitted to the hospital in the past six months? –Three subjects -yes.

Question 6– How many physicians prescribed medications for you in the past year? – mean answer 2.89.

Question 7– How many medical conditions which you are receiving treatment? – mean answer 3.33

FSES Shortened Survey * Higher scores showing better functional status

This survey gained very differing results for patient. Two subjects scored the total possible of 65 points indicating the best functional status and answered 5 (maximal score) for all 13 questions. One subject answered 3 for each of the 13 questions with a score of 39 and indicating day to day function was exactly in the middle of the survey. Other subjects gave a variable scoring with specific areas and gave a scattered response, depending upon the question. Two of the subjects gave responses in the 2 range, or lower level of functional capabilities. Scores listed in 1a-9a order: 65/ 57/ 53/ 65/ 43/ 39/ 63/ 64/ 44.

ASTA Survey The survey is scored into three categories- presence of arrhythmia, symptoms associated with the arrhythmia and Health related Quality of life (QOL)- both mental and physical. Higher the score- the higher the arrhythmia burden, more symptoms and more impact on the health related QOL. Scores listed in 1a- 9a order: 39/39/38/21/37/50/21/46/54.

Appendix E.

Average Scores Pre and Post (n=9)

JCRM-3-2-307-g020

Evidence-Based Guideline for COVID-19 Infection Control in Dental Medicine: A Systematic Review

DOI: 10.31038/JCRM.2020325

Abstract

Objective: COVID-19 became a pandemic and has caused a global emergency in the healthcare sector. Dental professionals pose high risk of viral spreading. This systematic review focused on COVID-19 infection control protocols in oral and dental medicine to derive an evidenced-based guideline.

Method: An electronic and manual search was performed for articles related to the outbreak of COVID-19 published between 2019/11/01 and 2020/03/31.

Results: Of the 53 titles retrieved by the systematic search, a total of 6 full-texts were included for data extraction.

Conclusions: Dental treatment must be limited to emergencies during the pandemic. Strict adherence to the hygiene chain is a prerequisite for the control of further transmission and protection of dental professionals. The use of aerosol-producing therapies must be minimized. Establishing regional dental emergency centers can help maintain the necessary capacities for society while maintaining appropriate hygiene standards. Personal protective equipment must be used in a resource-saving manner for dental emergencies of infectious patients.

Keywords

Corona virus, SARS-CoV-2, Pandemic, Dentistry, Public health

Introduction

The previously unknown coronavirus disease 2019 (COVID-19) and the pathogen SARS-CoV-2 (severe acute respiratory syndrome) with its specific virulence and pathogenesis quickly became  a  global pandemic [1]. The rapid spread from human-to-human through saliva, blood, and other body fluids have made it difficult to precisely determine its transmission pattern, extent of spread, and dangerousness. These factors, along with the fact that symptoms of COVID-19 infection are similar to types of viral influenza, led to an initial underestimation of the scale of the problem [2,3].

COVID-19 emerged in Wuhan City – capital of Hubei Province in China – and rapidly spread through South Korea, Japan, and Australia, then to Europe and the Middle-East, and recently North and South America [4]. The outbreak has spiraled into a global emergency for the healthcare sector, with wider economic damage and social restrictions, and unpredictable consequences in the future [5,6]. The most important characteristics of a pandemic are the spreading dynamics in time and space, the transmission rate and pathways, the incubation period, and the proportion of severe cases and mortality rate. The apparently high virulence of SARS-CoV-2, including the asymptomatic incubation period (up to 14 days), is a particular problem in this age of globalization [7,8].

Individuals with jobs that put them in close physical contact with many other people are at the greatest risk of becoming infected by

SARS-CoV-2 and for transmitting the infection onwards. The New York Times calculated the risk to be infected by SARS-CoV-2 for various occupations based on the risk of “exposure to disease” and “proximity to other humans” [9]. Healthcare workers were found to be at the greatest risk of encountering diseases and infections and typically work in close relationship to one another and their patients. In particular, dental care providers had the highest overall risk for SARS-CoV-2 infection, based on both exposure and physical proximity to others [9]. This clearly reflects the facts that dental care providers work directly with one of the known transmission routes  of SARS-CoV-2, the oral cavity, and this is exacerbated by the use of rotating instruments or ultrasonic tips with aerosol production.

The key questions currently facing dental care workers are therefore: how should we act upon the COVID-19 crisis? And what are the adequate standards required for the well-being of patients and dental staff, considering different job groups, and also for the wider protection of society?

This review aimed to systematically screen the current literature on COVID-19 infection control protocols in oral and dental medicine to derive an evidenced-based guideline for stakeholders in the dental healthcare sector.

Methods and Meterials

The systematic review was conducted in accordance with the guidelines of Preferred Reporting Items of Systematic Reviews and

Meta-Analyses (PRISMA) [10]. An electronic search strategy of PubMed was performed for all types of publications reporting on COVID-19 in the oral medicine setting. The search was limited to articles published from around the time of the start of the outbreak to the present day (2019/11/01 to 2020/03/31). All types of publications were included. Search syntax comprised a combination of Medical Subject Headings [MeSH-Terms] and free-text words in simple or multiple conjunctions: ((“COVID-19” [All Fields] OR “2019-nCoV” [All Fields] OR “SARS-CoV-2” [All Fields] OR “coronavirus” [All Fields] OR “corona” [All Fields]) AND  (“dentistry”  [All Fields] OR “dental medicine” [All Fields] OR (“dental” [All Fields] AND “medicine” [All Fields]) OR “oral medicine” [All Fields] OR (“oral” [All Fields] AND “medicine” [All Fields]) OR “oral healthcare” [All Fields] OR (“oral” [All Fields] AND “healthcare” [All Fields]))) AND (“2019/11/01” [PDAT] : “2020/03/31” [PDAT]). An additional manual search of the bibliographies of all retrieved full-text articles and related reviews, selected from the electronic search, was conducted.

Two reviewers (T.J. and N.U.Z.) independently reviewed the titles of articles retrieved by the systematic literature search. Following this, the abstracts of all agreed titles were screened to identify articles that reported COVID-19 infection control protocols in oral medicine. The full texts of selected articles were obtained and data were extracted independently by the two reviewers using a data extraction form. Disagreements at each stage of the screening process were resolved by discussion. The following information was collected from the full text articles: a) authors including year of publication; b) country; c) publication type; and c) details of the COVID-19 infection control protocols reported in the articles.

Results

Of the 53 titles retrieved by the systematic PubMed search, 25 abstracts were further screened, and the full text of nine potentially relevant articles were obtained and reviewed. A total of six full-texts were included for data extraction, comprising four full-texts obtained from the electronic search plus one additional full-text obtained from the manual search (Figure 1) [11-16].

JCRM-3-2-312-g001

Figure 1. Systematic search strategy.

Included publications were categorized as four Narrative Reviews (Li & Meng 2020; Peng et al. 2020; Tang et al. 2020; Yang et al. 2020), one Discovery Report (Meng et al. 2020), and one Letter to the Editor (Sabino-Silva et al. 2020). Key recommendations for the management of COVID-19 infection control from each publication were summarized and tabulated along with the first author name, year of publication, and country of publication (Table 1).

Table 1: Data extraction for included studies (n=6).

Authors (year)

Country

Study design

COVID-19 infection control protocol

Li and Meng (2020) [11]

China

Narrative Review

• Use of effective and strict disinfection measures in both clinical settings and public area.
• Adequate management of contaminated consumables.

Meng et al. (2020) [12]

China

Discovery Report

• Dental care provider should measure the temperature of every staff and patient as a routine procedure.
• Dental staff should strictly use personal protective equipment (PPE).
• Preoperative antimicrobial mouth rinse reduces the number of microbes in the oral cavity.
• Aerosol-generating procedures should be minimized as much as possible.
• The use of rubber dam and saliva ejectors with high volume can reduce the production of aerosols.
• Extra-oral dental radiography is an appropriate alternative during the outbreak of COVID-19.

Peng et al. (2020) [13]

China

Narrative Review

• Dental professional should be able to identify patients with suspected COVID-19 infections.
• Hand hygiene has been considered the most critical measure for reducing the risk of transmitting COVID-19.
• Procedures that are likely to induce coughing should be avoided or performed cautiously.
• The use of rubber dam can significantly minimize the production of saliva- and blood-contaminated aerosol.
• Droplet and aerosol transmission of COVID-19 are the most important concerns in dental treatments; and therefore, should be reduced whenever possible.

Sabino-Silva et al. (2020) [14]

Canada/ Brazil

Letter to the Editor

• It is crucial for dentists to refine preventive strategies to avoid the COVID-19 infection by focusing on patient placement, hand hygiene, all personal protective equipment (PPE), and caution in performing aerosol-generating procedures.

Tang et al. (2020) [15]

China

Narrative Review

• Dental professionals play great role in preventing the transmission of COVID-19 by following infection control measures during dental practice to block the person-to-person transmission routes.

Yang et al. (2020) [16]

China

Narrative Review

• Use of and strict personal disinfection of maxillofacial professionals in a huge hospital.

• Responsible handling of infectious consumables and sterilization of contaminated instruments.

Discussion

COVID-19 is a newly identified respiratory disease. The first case can be tracked back to 17 November 2019, according to Chinese government data [17]. Therefore, this systematic PubMed search was limited to publications reporting on infections caused by SARS-CoV-2 that were published after 1 November 2019. Publications focused on other SARS-related diseases were excluded.

Considering the recent and rapid development of the COVID-19 outbreak, it was not surprising that the identified publications from the systematic search were not clinical studies, but rather reports on self-learned experiences and trial and error management, mainly from research groups in China (five publications out of six) [11-16]. As COVID-19 continues to spread globally, it is assumed that confirmatory and/or new recommendations, and retrospective analyses of the effectiveness of different infection control protocols, will continue to be published from Europe and then from the USA [1,6,13].

The oral healthcare sector in particular has been hit hard by COVID-19 [12]. Confusion prevails due to the flood of information from policy stakeholders, statements from national dental associations, and press releases, accompanied by various (fake) posts on social media [17-21]. What infection control protocols should dental care provider follow during the COVID-19 crisis? And what lessons can the dental society learn from the COVID-19 pandemic to guide the precautions and preventative measures that may be required for future infectious diseases?

Based on the findings of this systematic review [11-16] and involving the expertise and experience of colleagues at the University Center for Dental Medicine in Basel (UZB), Switzerland, an evidence- based guideline was developed (Figure 2). This guideline was implemented on 2020/03/31 and will be reviewed and updated as new information on the COVID-19 outbreak comes to light. This guideline considers both the external and the internal dental ecosystems. On the one hand, the institutional infrastructures of dental care providers must be differentiated from an external point of view: i) Single Offices;Clinical Centers; and iii) Dental Hospitals with/without University setting including under- and postgraduate education, and clinical trials with voluntary participants and patients under dental treatment. On the other hand, possible routes of microbial transmission within the dental environment must be analyzed internally: i) dental and oral diagnostics including maxillofacial radiology and in particular aerosol-producing treatments; ii) patient flows plus accompanying relatives in waiting areas, restrooms and toilet facilities; as well as iii) employees’ facility rooms of daily use.

JCRM-3-2-312-g002

Figure 2. Patient flow in a centralized setting of a Dental Hospital.

In common with the rest of society, “physical distancing” is the top priority. In this context, the catchment radius of potential patients and dental staff must be taken into account for the decision who should maintain the dental care mandate during a crisis. Reducing the number of employees needed to deliver emergency dental treatments is the ultimate goal to reduce contact between people and diminish the risk of viral spreading. This will also help to preserve the supply of personal protective equipment for the protection of the high-risk group of dental care providers. Moreover, the range of dental treatments that will be delivered during the pandemic should be transparently communicated to both the dental society and to patients.

Centralization of dental emergency treatments in regional Dental Hospital settings is the key for maintain dental healthcare standards during pandemic crisis. In contrast to primary healthcare, dental procedures are usually elective. All non-urgent dental treatments must be postponed. Supplies of personal protective equipment needed by clinical staff who are treating critically ill patients in General Hospitals are critically low. If all dental care providers store and use these items for non-urgent treatments, frontline healthcare workers will be left unprotected. In case of COVID-19, it is not possible to reliably identify patients who are asymptomatically infected and most of the dental treatments produce aerosols that is known to increase exposure potential if patients are infected.

We recommend that dental care providers should focus on the management of conditions that require immediate attention to relieve severe pain and/or risk of infection and to alleviate the burden on hospital emergency departments. These comprise:

• Severe dental pain from pulpal inflammation;

• Acute exacerbation of chronic apical periodontitis;

• Acute necrotizing ulcerative gingivitis or periodontitis;

• Painful mucosal changes;

• Pericoronitis of third molars;

• Post-operative osteitis and dry-socket phenomenon;

• Infections with intra-/extra-oral swelling or abscess, particularly those potentially compromising the patient’s airway;

• Facial and/or dental trauma with avulsion, dislocation and/ or fracture;

• Uncontrolled bleeding;

• Dental treatment required prior to critical medical procedures;

• Fixation or removal of broken prosthodontic or orthodontic appliances to avoid injuries or foreign body aspiration.

If dental diagnostics and/or treatments cannot be delayed and have to be carried out related to the above list of indications, strict adherence to the hygiene chain is mandatory. In addition to the routine patient history, contactless temperature measurement using infrared thermometers should now be employed as an initial step to identify patients who are potentially infected with SARS-CoV-2.

For essential emergency treatment of patients with confirmed COVID-19, or patients with a strong suspicion of an acute infection, the following protocol should be applied by the dental care providers:

• Patients should wear masks in public and in the hospital setting;

• Patients with suspected or confirmed infection should wait in separate rooms and use indicated rest-rooms;

• Dental treatment should be conducted in an isolated and well- ventilated room (100% fresh air supply of the ventilation or air condition system instead of recirculating air is pursued);

• Use of personal protective equipment is mandatory, comprising respirators for filtering inspired air, face masks and goggles, double-layered gloves, and protective clothing, including safe disposal of used consumables;

• Patients should use pre-operative antimicrobial mouth rinse with 1% hydrogen peroxide for 30 seconds (peroxide dissolves the virus protein);

• Extra-oral dental radiographs can be used as alternatives to intra-oral imaging during the outbreak of COVID-19 to avoid any coughing of the patients;

• Emergency treatments should be as minimally invasive as possible and reduced in length and in spread of oral fluids (rubber dam and high-volume saliva ejectors to minimize aerosol);

• Treatment rooms and other areas, and used instruments, should be cleaned with appropriate virostatic agents;

• The number of dental care providers in the facility should be limited; and staff should work in weekly shifts and should be separated from household family members if they are at risk;

• Tele-healthcare should be used (whenever possible).

In addition, human resource management should consider different scenarios for work deployment plans in the Dental Hospital settings during the crisis. Tandems consisting of one dentist and one dental assistant should work together in blocks of weekly shifts to reduce interactions with other colleagues and the risk of infection. If a member of a team becomes infected, or an infection is suspected, the team should be replaced by a new tandem. Those dental personnel who have previously been infected with SARS-CoV-2, and have evidence of immunity in the form of antibodies to the virus, could take over the emergency treatments to protect the susceptible colleagues. Moreover, it must be considered whether routine testing of the dental staff should or could be carried out to clarify the infectious status of the staff in order to help prevent further transmission of the virus.

Conclusion

What lessons can dental stakeholders learn from the current COVID- 19 pandemic?

The dental profession and its special environment pose high risk of viral spreading and cross infections between patients and dental care providers. Strict adherence to the hygiene chain is a prerequisite for the control of further transmission. Dental treatment must be limited to emergencies during the pandemic. Positively tested patients or symptomatic patients with a strong suspicion of an acute infection must be treated under personal protective conditions of the dental professionals. Any aerosol-producing therapy must be reduced to a minimum.

After the successful fight against the pandemic, international standards need to be defined by a task force with experts from the public health sector, health economists, and politicians, in order to develop standard operating procedures for quickly coordinating and coping with future public health emergencies. Dental treatments are usually elective procedures. During a pandemic, it is important to establish regional dental emergency centers as quickly as possible to provide the necessary capacities for society and to ensure appropriate hygiene standards. Personal protective equipment must be used for dental emergencies of infectious patients and in a resource-saving manner.

Author Contributions

Conceptualization, Methodology, Writing-Original Draft, Writing-Review and Editing, Supervision and Project Administration:

T.J. and N.U.Z.; both authors have read and agreed to the published version of the manuscript.

Declaration of Interests

The authors declare no conflict of interest.

Acknowledgements

The authors express their gratitude to Mr. James Ashman for proofreading the final manuscript. This research received no external funding.

References

  1. Tuite AR, FismanDN(2020) Reporting, Epidemic Growth, and Reproduction Numbers for the 2019 Novel Coronavirus (2019-nCoV) Epidemic. Ann Intern Med,[Crossref]
  2. Cheng, ZJ,ShanJ (2020) 2019 Novel coronavirus: where we are and what we know. Infection, [Crossref]
  3. Habibzadeh P,StonemanEK (2020)The Novel Coronavirus: A Bird’s Eye View. Int J Occup Environ Med, 11(2): 65-71. [Crossref]
  4. Hui DS(2020)The continuing 2019-nCoV epidemic threat of novel coronaviruses to global health – The latest 2019 novel coronavirus outbreak in Wuhan, China. Int J Infect Dis, 91: 264-266. [Crossref]
  5. Dey SK(2020) Analyzing the epidemiological outbreak of COVID-19: A visual exploratory data analysis approach. J Med Virol, [Crossref]
  6. Wu, JT, LeungK, LeungGM(2020) Nowcasting and forecasting the potential domestic and international spread of the 2019-nCoV outbreak originating in Wuhan, China: a modelling study. Lancet, 395(10225): 689-697. [Crossref]
  7. Yang W(2020) Clinical characteristics and imaging manifestations of the 2019 novel coronavirus disease (COVID-19):A multi-center study in Wenzhou city, Zhejiang, China. J Infect, 80(4): 388-393. [Crossref]
  8. Zhou F(2020) Clinical course and risk factors for mortality of adult inpatients with COVID-19 in Wuhan, China: a retrospective cohort study. Lancet, [Crossref]
  9. Gamio L (2020)The workers who face the greatest coronavirus risk. The New York Times,
  10. Moher D(2009) Preferred reporting items for systematic reviews and meta-analyses: the PRISMA statement. PLoS Med, 6(7):e1000097. [Crossref]
  11. Li ZY,MengLY (2020) [The prevention and control of a new coronavirus infection in department of stomatology]. Zhonghua Kou Qiang Yi XueZaZhi, 55(0): E001. [Crossref]
  12. Meng L,Hua F,BianZ (2020) Coronavirus Disease 2019 (COVID-19): Emerging and Future Challenges for Dental and Oral Medicine. J Dent Res. [Crossref]
  13. Peng X(2020) Transmission routes of 2019-nCoV and controls in dental practice. Int J Oral Sci, 12(1): 9. [Crossref]
  14. Sabino-Silva R,JardimACG, SiqueiraWL (2020) Coronavirus COVID-19 impacts to dentistry and potential salivary diagnosis. Clin Oral Investig,
  15. Tang, HS, YaoZQ,WangWM (2020) [Emergency management of prevention and control of novel coronavirus pneumonia in departments of stomatology]. Zhonghua Kou Qiang Yi XueZaZhi, 55(0): E002. [Crossref]
  16. Yang Y(2020) Experience of Diagnosing and Managing Patients in Oral Maxillofacial Surgery during the Prevention and Control Period of the New Coronavirus Pneumonia. Chin J Dent Res, 23(1):57-62. [Crossref]
  17. Davidson H (2020) First Covid-19 case happened in November, China government records show. Guardian Weekly,
  18. COVID-19 Infection Control Protocols and Procedures. 2020; Available from: https://www.ada.org/en/member-center/coronavirus-resource-toolkit-for-ada-members/covid-19-infection-control-protocols-and-procedures-webinar?utm_source=adaorg&utm_medium=vanityurl&utm_content=safety&utm_campaign=covid-19.
  19. Zhejiang University School of Medicine C, Handbook of COVID-19 Prevention and Treatment. 2020.
  20. Coronavirus disease (COVID-19) Pandemic. 2020; Available from: https://www.who.int/emergencies/diseases/novel-coronavirus-2019.
  21. Dossier: AktuelleInformationenzum Coronavirus. 2020; Available from: https://www.sso.ch/home/coronavirus.html.

How are We Going to Restart Elective Bariatric and Metabolic Surgery after the Peak of Covid-19 Pandemic?

DOI: 10.31038/SRR.2020312

Abstract

Background: The pandemic pattern of COVID-19 in some countries appears to have started a deceleration stage. It is recommended to restart as soon as the situation is under control and some tools exist for interpreting the ICU capacity under conditions of health system stress. However, there are no clear guidelines or a strategy to restart Bariatric and Metabolic (B&M) surgery.

Objective: To present a protocol proposal to assist surgeons in restarting elective B&M surgery after the outbreak.

Method: This document presents a recommended protocol based on experts’ opinions, reviews of small series and publications from previous different viral epidemic outbreaks.

Results: Priority is for patients who would benefit most from a B&M procedure with limited risk. Patients being eligible for surgery must be screened for COVID-19. Only patients with negative results will have surgery. Radiofrequency/electro thermal bipolar devices are recommended. A smoke evacuator machine with a closed-circuit system should be used. All patients must be treated as if they are suspected to be COVID-19 positive. Proper personal protective equipment should be applied. Post-operative follow-up consultations should be via telemedicine. The RT-PCR screening test should be repeated for legal documentation purposes and to make sure that the patient is COVID-19 free.

Conclusion: The resumption of elective B&M surgeries during deceleration stage of COVID-19 must be gradual and prudent. This scholarly protocol can be adjusted according to the regulations established by the local health departments and with the increased acquisition of new knowledge; there would be changes in the current recommendations.

Keywords

Covid-19 pandemic, Metabolic surgery, Sleeve gastrectomy, Bariatric and metabolic surgery

Introduction

The future and aftermath of the COVID-19 global pandemic is unknown but will be dependent on how the medical societies and governments react to the current situation. Many of the international health organizations and federations have combined efforts to fight against the COVID-19. European and American guidelines as well as IFSO recommendations have been issued and most elective surgeries were postponed, as a cautious measure to minimize the spread of the infection and to cope with the emerging scarcity of health care resources, particularly ventilators and other critical care equipment [1,2]. The American College of Surgeons (ACS) issued COVID-19 elective case triage guidelines for surgical care, including (B&M) surgery. The guidelines recommended delaying the elective cases, even for months [1].

The worldwide numbers of patients’ morbidity, mortality as well as the timelines to peak incidence are very inconsistent. The pandemic pattern in some countries appears to have started a deceleration stage. Epidemiology expertise across the globe expect to see a flattening of the COVID-19 infection curve. The virus is not expected to vanish suddenly, but more slowly through a transitional period.

This document presents a scholarly protocol for surgeons to assist them in restarting elective B&M surgery after the COVID-19 outbreak is on the decline and it is deemed safe to do so. It is recommended to restart as soon as the situation is under control. There should be few newly diagnosed cases and the hospitals do not receive a surge of COVID-19 patients. It will likely be variable between countries and even between B&M surgery programs within the same country. Surgeons should be aware of the regional health care status and the hospital beds capacity. Some tools exist for interpreting the Intensive Care Unit (ICU) beds capacity under conditions of health system stress. Criticon was designed by a UK critical care network to interpret the ICU capacity during the influenza pandemic and remains in modified use [3]. Also, healthcare workers in the US launched an interactive data platform that allows people to analyze and monitor US hospital beds capacity during the COVID-19 outbreak.

Discussion

The benefits to restart performing elective B&M surgeries

Bariatric surgeons and patients eagerly look forward to restarting the elective surgeries. There are indisputable benefits of early surgical intervention for patients with morbid obesity. Delaying elective B&M surgery may adversely affect the benefits of surgery for achieving a resolution of obesity and its complications.

There is a worldwide concern about the severity of COVID-19 when contracted by patients with morbid obesity. The history of previous pandemics of different viral influenza-like illnesses revealed a strong association between morbid obesity and the severity of the illness and hospital and ICU admissions [4,5]. Additionally, it has been reported anecdotally by a number of surgeons that patients who have had successful bariatric surgery that resulted in significant weight loss and the resolution of co-morbid conditions such as hypertension and diabetes, have been able to overcome the COVID-19 disease and its pulmonary complications.

The elective B&M surgeries

According to ACS guidelines, the elective B&M surgeries are primary gastric bypass, sleeve gastrectomy, duodenal switch, gastric banding, revisions or conversions for weight gain [1] and endoscopic bariatric procedures. Prioritization of the elective list aims to avoid a bad outcome if COVID-19 infection occurs:

• Patients with controlled comorbidity but who may deteriorate over time.

• Semi-elective urgent cases: Revisional cases (for dysphagia, severe Gastro esophageal Reflux Disease (GERD), dehydration/malnutrition, slipped band, gastric band erosion, anastomotic strictures at risk for aspiration), patients pending surgery requiring pre-operative weight loss (transplant, etc..), endoscopic procedures: balloon removal [1].

A hidden or acquired infection during the perioperative period could be fatal. A recent study reported that out of four gastric bypass surgery patients who developed COVID-19, two (50%) were admitted to the ICU, although all survived [6]. A Careful risk/benefit assessment in collaboration with the anesthesiologists would be beneficial. There should be a priority to identify patients who will benefit most from B&M surgery while keeping the risks as low as possible. The surgeons must rely on their clinical sense, realize their surgical capabilities, and consider the available facilities.

Eligibility

• Asymptomatic patients (no flu-like symptoms, shortness of breath, fever, and/or GI symptoms)

• No history of COVID-19 positivity

• Age: 20 – 50 years

• BMI ≤ 50 kg/m2

• No co-morbidities: (i.e., Diabetes, Hypertension, Cardiac diseases)

• Controlled comorbidities that may deteriorate over time

• No Pulmonary diseases: (i.e., OSA, Asthma, Respiratory diseases)

• Non-smokers.

Hospital Course

This document targets hospitals under the non COVID-19 category. Specialized B&M surgery centers are preferred. We recommend gradual restarting and only performing1-2 cases per day. Hospital admission on the same day of surgery minimizes the hospital stay. As many pre-operative medical consultations should be via telemedicine and video phone calls as possible. The surgical consent should explain that the patients are at an increased risk of acquiring a COVID-19 infection during their hospital course. Patients should not allowed to be accompanied by relatives/co-patients during the hospital course and must agree on self-quarantine post-operatively for a minimum of 14 days (Figure 1).

SRR-3-1-303-g001

Figure 1. Protocol to restart performing elective bariatric and metabolic surgery after the peak of the COVID-19 pandemic.

Screening Test: (What and When)

Patients being considered for elective B&M surgery must be screened for COVID-19, twenty-four hours before the admission. Only patients with negative results will have surgery. Baseline screening is medically and legally essential. The virus RNA (SARS-CoV-2 RNA) is detected by Reverse-Transcription Polymerase Chain Reaction (RT- PCR). Authors from China reported the highest sensitivity rate of viral RNA tests was from bronchoalveolar lavage, followed by sputum [7]. Patients being considered for B&M surgery are asymptomatic and may not be able to produce sputum. A nasopharyngeal swab test would also be of benefit. A nasopharyngeal swab is more sensitive than an oropharyngeal one [7]. RT-PCR reports a false negative result in up to 30% of cases [7]. Both the RT-PCR and the antibodies serology tests are recommended for more accurate results. The World Health Organization assumes there is no evidence that COVID-19 antibodies protect from potential re-infection. A positive serology test excludes the patient from surgery during this transitional period. In case only one test is feasible, the RT-PCR is mandatory. The serology tests detect antibodies which are generated in blood a week or two after exposure to the virus, at which time the virus should have been cleared from the system.

Radiological screening: chest ultrasound is a highly sensitive tool in diagnosing the early COVID-19 patients. It is a less aggressive alternative without subjecting the patients to the high radiation exposure of a CT- chest or even a plain chest x-ray [8]. Some authors suggested that the lung characteristics of patients with COVID-19 are ideal for imaging with ultrasound. In addition, in contrast to the CT device, the ultrasound device is portable, easier to sterilize and decreases the risk of cross-infection. The ultrasound device also minimizes the number of personnel exposed to the risk of cross- infection [9,10].

OR settings and Operative technique

The current ventilator systems found in almost all Operating Rooms (OR) are positive pressure systems. However, negative pressure systems decrease the risk of infection [11]. It is important to operate in a negative pressure OR when available. During this pandemic, some hospitals solved this issue of OR ventilation to avoid or minimize the positive pressure by shutting down the ventilatory system intermittently during operations for approximately 60 minutes each time.

The transmission of aerosols and droplets is very risky. They remain in the OR environment for up to 20 minutes after the procedure [12]. Staff who is not essential for the procedure should leave the OR during surgery and not return until 20 minutes after an Aerosol Generating Procedure (AGP) is completed. AGPs include endotracheal intubation, gastrointestinal endoscopy, and the evacuation of pneumoperitoneum and aspiration of body fluids during laparoscopic procedures.

Elective B&M surgeries are AGPs and generate a large amount of smoke. Up to our knowledge, there is no evidence of the presence of SARS-CoV-2 in the air of the abdominal cavity (laparoscopic pneumoperitoneum). However, small incisions and setting the intraperitoneal pressure to the minimum effective for safe surgery (10-12 mmHg), or even less is advised to avoid escaping of CO2. The surgical smoke produced during laparoscopic surgery is composed of 5% (cellular debris, aerosols, plume, chemicals, viruses and bacteria) and 95% steam or water [13]. Studies reported that the smoke produced from radiofrequency/electrocautery devices is less harmful [14,15]. The surgical plume production from an ultrasonic scalpel was in larger quantities and contained larger cellular debris when compared with that from electro cautery [13]. The plume produced by Sonicision obstructed 4% of the laparoscopic field whereas the ACE generated plume obstructed 25% [16]. We recommend using frequency/ electrothermal bipolar devices (e.g., LigaSure (LS; Covidien, Mansfield, MA), and Enseal G2 (ES; Ethicon Endo surgery), and not the ultrasonic coagulating devices.

Nevertheless, the preference of using radiofrequency energy device versus ultrasonic remains a scientific controversy. If an electrothermal device is used, a smoke evacuator machine must be used or connect the insufflation system to a filter. It minimizes the possible risk of infection through aerosolization [11]. Available commercial smoke evacuator options include: the Medtronic RapidVac, Stryker Pneumo Clear, ConMed Airseal®, MEGADYNE and Valley lab Smoke Evacuators. The smoke evacuation systems in a closed-circuit are highly recommended in case of specimen removal and during Co2 extraction at the end of the procedure. In certain commonly used insufflator systems (ConMed Airseal®), there is a modality with criteria of stabilizing the intra-peritoneal pressure. The surgeons should not use this modality, it creates significant leakage and escape of CO2 which may increase the risk of infection [17]. In the setting of limited financial resources, surgeons may create a simple, very low-cost filtration system from available components in the operating room. Mintz and his colleagues utilized the standard electrostatic filter used in the ventilation machines for this purpose [18]. Surgeon competency is crucial. Only experienced surgeons should be operating in this time. It is well-known that the more skillful and experienced the surgeon is, the faster the procedure is performed, leading to a shorter operative time and less exposure to the aerosol.

Personal Protective Equipment (PPE)

Though the patient will be COVID-19 negative, 30% of the tests give false negative results. Accordingly, during this delicate transitional period, all patients must be treated as if they are suspected to be COVID-19 positive. Proper PPE should be applied. This will protect the medical staff and the patient from the risk of transmitting infection. A minimum number of surgeons, nurses and anesthetists should be present in the OR. The staff must follow all hand hygiene instructions at all times and follow the contact, airborne and droplet precautions (Table 1) explains the dress code of the medical staff in the OR during each step of the operation [19]. Studies have proven that there is no difference between N95 masks and powered air purifying respirators in protection against aerosols and droplets [17]. All OR personnel should always wear gloves. No trainees or observers should be allowed in the OR.

Table 1: Recommended personal protective equipment during elective bariatric and metabolic surgery after the peak of COVID-19 pandemic.

Precautions

When to Apply

What to Wear

Contact Handling the patient, positioning, transfer from and to OR room, etc…

(A); Gloves, waterproof apron and fluid resistant surgical mask

Droplet During anesthesia.
All lines (IV, arterial, central).
During non AGP.
(B); Consider (A) plus
-Fluid-resistant, surgical gown.
– Eye protection (face shield, goggles, etc.)
Airborne Intubation/Extubation.
During the elective B&M surgery (AGP).
20 minutes after the procedure
(AGP).
Consider (B) plus
-N95 mask.
-Double gloves.
-Shoe cover.

AGP: Aerosol Generating Procedure.

Post-Operative Course

All protective contact precautions should be applied during the patient’s hospital stay. The patient should be discharged as soon as possible. We recommend 36-48 hours (or less) of hospital stay. The RT-PCR screening test should be repeated for legal documentation purposes and to make sure that the patient is COVID-19 free when he/she leaves the hospital. All post-operative follow-up consultations should be via telemedicine and video phone calls. Some hospitals created a service of home delivery of medications to reduce the numbers of unnecessary hospital visits.

The first few weeks post B&M surgery are critical. Surgery may not only cause immediate impairment of the immune function, but also induces early systemic inflammatory response and more severe course in case of COVID-19 [20]. Additionally, the rapid loss of weight following bariatric surgery alter the patients’ immune system and may lead to the development of subclinical underlying immune disorders [21]. Therefore, a self-quarantine is recommended for a minimum of 14 days post- operatively. However, a period of up to 1 month is advisable.

Limitations

Data related to the subject of COVID-19 and elective surgery is limited. Most of the included studies in this protocol are based on experts’ opinions, reports of small series and publications from previous different viral epidemic outbreaks. It is possible that, with the passage of time and the increased acquisition of new knowledge, there would be changes in the current recommendations.

Conclusion

The resumption of elective B&M surgeries during the deceleration stage of COVID-19 is a delicate process, that must be gradual and prudent. There should be a priority for patients who would benefit most from a B&M procedure. The use of smoke evacuation machines is essential. The preference of using radiofrequency energy device versus ultrasonic remains controversial. This scholarly protocol can be adjusted according to the regulations established by the local health departments and available facilities. This paper is intended only as a recommendation to professionals and can in no way be used as an argument for possible legal claims.

Acknowledgement

The authors acknowledge Dr. Rossella Palma for her great help in preparation for this subject.

Disclosures

Drs. Luigi Angrisani, Nesreen Khidir, Juan Pujol Rafols, Michel Suter, Nicola Di Lorenzo, Ashraf Haddad, Miguel F Herrera and Lilian Kow have nothing to disclose.

Dr. Philippe Topart received teaching honoraria from Medtronic and Olympus, grant support from Ethicon and Leo pharmaceuticals.

Prof. Scott Shikora is the Editor-in Chief of Obesity Surgery.

References

  1. COVID-19: Elective Case Triage Guidelines for Surgical Care. Available at https://www.facs.org/covid-19/clinical-guidance/elective-case/metabolic-bariatric
  2. Yang W, Wang C, Shikora S. et al. Recommendations for Metabolic and Bariatric Surgery During the COVID-19 Pandemic from IFSO. OBES SURG (2020). https://doi.org/10.1007/s11695-020-04578-1[Crossref]
  3. Criticon designed by Critical Care Network-North West London. Available at https://www.londonccn.nhs.uk/managing-the-unit/capacity-escalation/critcon/
  4. Moser JS, Galindo-Fraga A, Ortiz-Hernández AA, et al. Underweight, overweight, and obesity as independent risk factors for hospitalization in adults and children from influenza and other respiratory viruses. Influenza Other Respir Viruses. 2019;13(1):3–9. doi:10.1111/irv.12618[Crossref]
  5. Simonnet A, Chetboun M, Poissy J et. Al. High prevalence of obesity in severe acute respiratory syndrome coronavirus‐2 (SARS‐CoV‐2) requiring invasive mechanical ventilation. Obesity (Silver Spring). 2020 Apr 9. doi: 10.1002/oby.22831.
  6. Aminian A, Kermansaravi M, Azizi S, et al. Bariatric Surgical Practice During the Initial Phase of COVID-19 Outbreak [published online ahead of print, 2020 Apr 20]. Obes Surg. 2020;1‐4. doi:10.1007/s11695-020-04617-x[Crossref]
  7. Wang W, Xu Y, Gao R, et al. Detection of SARS-CoV-2 in Different Types of Clinical Specimens. JAMA. Published online March 11, 2020. doi:10.1001/jama.2020.3786.[Crossref]
  8. PoggialiE ,Dacrema A, Bastoni D. Et.al Can Lung US Help Critical Care Clinicians in the Early Diagnosis of Novel Coronavirus (COVID-19) Pneumonia? Radiology. Mar 13 2020https://doi.org/10.1148/radiol.2020200847[Crossref]
  9. Huang, Y, Wang S, Liu Y et al. A preliminary study on the ultrasonic manifestations of peripulmonary lesions of non-critical novel coronavirus pneumonia (COVID-19). SSRN 2020. Epub 28 February. doi.org/10.2139/ssrn.3544750 (accessed 06/04/2020).
  10. Soldati G, Smargiassi A, Inchingolo R, et al. Is there a role for lung ultrasound during the COVID-19 pandemic? Journal of Ultrasound in Medicine 2020. Epub 20 March. doi.org/10.1002/jum.15284
  11. Chow TT, Yang XY. Ventilation performance in operating theatres against airborne infection: review of research activities and practical guidance. Journal of Hospital Infection. 2004;56(2):85-92.[Crossref]
  12. Brat GA, Hersey SP, Chhabra K, Gupta A, Scott J. Protecting Surgical Teams During the COVID-19 Outbreak: A Narrative Review and Clinical Considerations. Annals of surgery. (March 2020) available at https://journals.lww.com/annalsofsurgery/Documents/COVID%20Surgery_VF.pdf[Crossref]
  13. Liu Y, Song Y, Hu X, Yan L, Zhu X. Awareness of surgical smoke hazards and enhancement of surgical smoke prevention among the gynecologists. J Cancer. 2019;10(12):2788–2799. Published 2019 Jun 2. doi:10.7150/jca.31464[Crossref]
  14. Devassy R, Gopalakrishnan S, De Wilde RL. Surgical Efficacy Among Laparoscopic Ultrasonic Dissectors: Are We Advancing Safely? A Review of Literature. J ObstetGynaecol India. 2015;65(5):293–300. doi:10.1007/s13224-015-0774-x[Crossref]
  15. In SM, Park DY, Sohn IK, Kim CH, Lim HL, Hong SA, Jung DY, Jeong SY, Han JH, Kim HJ.Experimental study of the potential hazards of surgical smoke from powered instruments.Br J Surg. 2015 Nov; 102(12):1581-6.[Crossref]
  16. Kim FJ, Sehrt D, Pompeo A, Molina WR. Comparison of surgical plume among laparoscopic ultrasonic dissectors using a real-time digital quantitative technology. SurgEndosc. 2012;26(12):3408–3412. doi:10.1007/s00464-012-2351-z[Crossref]
  17. Resources for Smoke & Gas Evacuation During Open, Laparoscopic, And Endoscopic Procedures. March 31, 2020 by EAES- SAGES joint recommendations. Available at https://eaes.eu/resources-on-smoke-gas-evacuation-during-open-laparoscopic-and-endoscopic-procedures/
  18. Mintz Y, Arezzo A, Boni L, Chand M, Brodie R, Fingerhut A and the Technology Committee of the European Association for Endoscopic Surgery. A Low Cost, Safe and Effective Method for Smoke Evacuation in Laparoscopic Surgery for Suspected Coronavirus Patients. Annals of surgery 2020 April.[Crossref]
  19. Personal Protective Equipment (PPE) to protect you from COVID-19. What to wear and when. Available at https://icmanaesthesiacovid-19.org/.
  20. Lei S, Jiang F, Su W, et al. Clinical characteristics and outcomes of patients undergoing surgeries during the incubation period of COVID-19 infection [published online ahead of print, 2020 Apr 5]. EClinicalMedicine. 2020;100331. doi:10.1016/j.eclinm.2020.100331[Crossref]
  21. Tobón GJ. Ospina FE, PabloSuso J, et.al. Autoantibodies production and immunological abnormalities after bariatric surgery. Journal of Translational Autoimmunity 2019 Dec. https://doi.org/10.1016/j.jtauto.2019.100024

Dental perspective on radioactive nuclides in humans living on the premisses of uranium mining facilities

DOI: 10.31038/JDMR.2020321

Abstract

During the last 20 years, several regional indoor radon assessment campaigns were carried out in Transilvania (Romania), evaluating the conditions in more than 2000 buildings. The area with the highest indoor radon concentration in Transilvania, is represented by Ştei-Băiţa (Bihor County), located in the perimeter of several uranium mines, were values up to 4000Bq/m3 were recorded. Our research meant to identify the radioactive nuclides present in the dental tissues of the native population in the mentioned area. Gamma-spectroscopy was used to identify the nuclides out of the powder resulted from milling extracted teeth. Previously teeth were split into 3 groups according to the individual’s age. No radioactive elements’ nuclides were identified in the teeth structures. Authors assume that either the radiation is too low to induce hard tissue contamination or the locally identified elements (uranium, thorium, radon, radium) don’t affix in these tissues.

Keywords

nuclide, radioactive, radon, uranium, dental, teeth

Introduction

Radon is a radioactive gas, generated by uranium deposits. It is emitted normally by rocks, earth’s crust, and it can delve inside the buildings through planking, wall cracks, or along the pipes [1]. It can be present not only in the air but also in soil and construction materials. In areas with high potential risk (i.e. uranium mines), radon’s air concentration can reach high values due to both soil and construction materials [2]. Recent researches showed that radon is the main source of population’s natural irradiation, contributing with approximately 57% to the effective annual radiation dose and it can rise, in certain areas, to a contribution of 95%, cases in which the exposure to natural radiation is 5-10 times higher than the medium exposure value of 2,2 mSv/year [2,3].

During the last 20 years, several regional indoor radon assessment campaigns were carried out in Transilvania (Romania), evaluating the conditions in more than 2000 buildings [4]. The area with the highest indoor radon concentration in Transilvania is represented by Ştei-Băiţa (Bihor County), located in the perimeter of several uranium mines, were values up to 4000Bq/m3 were recorded [5]. World Health Organization recommends security limits regarding radon exposure inside buildings, between 100-200Bq/m3 [2]. On the upper course of the Black Cris river at approximately 25 km from the city of Ştei, the uranium deposit from Băiţa was exploited between 1950 and 2000, is considered the biggest uranium deposit in Romania.In Băiţa-Plai village there are more dump tailings coming from the mine, containing uranium waste which was used by the locals as construction materials for buildings, houses, annex households, etc. Subsequently, Radon-222, Radium-226, Uranium, Thorium concentrations were found as overcoming the limits allowed by rules in force. About 30% of the measured values are significantly higher than the recommended level of 200Bq/m3. Therefore, Ştei-Băiţa mining area is proposed to be included on the “hot-spot” list by the Ministry of Environment, by the radon contamination point of view [1].

Aim

The population in the above-mentioned area is approximately 700 individuals, adults and children, 99 in Băiţa-Plai, 599 in Băiţa, respectively, according to the last population census in 2012 [6]. Considering the radioactive environment that people from Băiţa and Băiţa-Plai live in, authors assumed that radioactive nuclides from the environment may be captured by human dental tissue and evidenced through specific analysis. Thus, aim of the present study was to determine the presence of these radio-nuclides in human dental tissue, in residential population. Excluding criteria: children who’s exposure time is relatively short compared with adults.

Materials and Methods

82 permanent teeth with severe destruction were extracted from mature people aged between 25 and 73, who worked or lived in the mining area for at least 10 years. Teeth were collected, cleaned in warm water (500C) and dried at room temperature. Three sample groups were created according to patients’ age, as follows: group 1 – individuals below 0-30 years, including 27 teeth, group 2 – individuals between 30 and 60 years including 30 teeth, group 3 – individuals over 60 years including 25 teeth. Thus this study included more than 10% of the population living in the exploitation’s neighborhood.

Teeth from all the 3 groups were milled using Pulverisette 7 ball-mill (Fritsch Laborgeräte GmbH, Idar-Oberstein, Germany) at a relative rotational speed of the grinding bowls of 2200rpm, resulting in a fine powder with particles having 100nm (10-9m). Then sample material was then subjected to gamma spectrometry analysis.

The gamma spectrometer used in this study (Fig.1) consisted in: a detection probe containing thallium-doped sodium iodide NaI(Tl) scintillation counters with photomultipliers that convert the light into electrons and then amplify the electrical signal provided by those electrons; a multichannel analyzer (MCA) with 1024 channels with a PCAP-plus interface; Assayer Oxford WIN-MCA spectra acquisition software; RadiationHelper data analysis software; Desktop computer as data readout device, to generate, display and store the spectrum; the lead shield that isolates the detector from being contaminated by natural radioactivity; Sarpagan boxes which respect the geometry of measuring. This spectrometric ensemble has an efficiency of 3,5% at 662keV and a resolution of 7% at the same voltage. The samples as powder were poured in the Sarpagan box and placed onto the detecting chamber. Considering that the expected amount of nuclides was very small, the reading time for each sample’s gamma spectrum was set to 20 hours. After the mentioned time, the measured spectrum was analyzed searching for uranium, thorium, cesium, and potassium elements and determining the peaks according to their maximum level. Energy is identified for each peak (Ei), meanwhile determining the corresponding isotopes for each energy, with the aid of the energy calibration curve. The activity of each gamma nuclide is computed using the characteristic photo-peaks.

JDMR-3-2-304-g001

Figure 1. Schematic laboratory equipment for gamma spectroscopy.

Results

The study included more than 10% of the population living in the area of the investigation. The results of the present study are reported in Table 1. The values shows the identity and quantity of gamma emitters present in the gamma source, in this case, the milled tooth hard tissue.

Table 1: Valuesiforithe i3isamples

ELEMENTS

Sample

K(Potassium)

U(uranium)

Th(thorium)

Cs(cesium)

1

< i9iBq/kg

< i110iBq/kg

< i41iBq/kg

< i30iBq/kg

2

< i9iBq/kg

< i110iBq/kg

< i41iBq/kg

< i30iBq/kg

3

< i9iBq/kg

< i110iBq/kg

< i41iBq/kg

< i30iBq/kg

According to our findings, although natural and artificial radiation were identified as exceeding the recommended values in the mentioned area, this kind of pollution did not have an effect on tooth structure, did not affix in dental tissue regardless the age of individuals or the time of exposure at locally measured radioactivity.  For all 3 groups the gamma spectrum had similar values and the same graphical area (Fig.2-4). Gamma spectrometry found no significant differences among the 3 groups, as that searched elements and their nuclides are absent in analyzed dental tissues.

JDMR-3-2-304-g002

Figure 2. Gamma spectrum of sample group i1.

JDMR-3-2-304-g003

Figure 3. Gamma spectrum of sample group 2.

JDMR-3-2-304-g004

Figure 4. Gamma spectrum of sample group 3.

Although our research didn’t find any signs of nuclides retained in dental tissues, this means that either the radioactivity and environmental pollution with such elements aren’t high enough to leave a mark in human hard tissue, or these elements simply aren’t deposited in these tissues (bones, teeth). Even so, the pollution is registered and proved by systematic measurements. According to the county’s Public Health Department which is periodically surveying the area, numbers of newly detected cancer cases were 27 in 2011, 23 in 2012, 24 in 2013, 16 in 2014, and 6 newly diagnosed cancer cases in 2015. These data include the cities of Stei and Nucet along with the Baita and Baita-Plai villages.

Factors that favor the increase of indoor radon in buildings from Băiţa and Băiţa Plai are:

• rock’s high radioactive potential from the subsoil in that area, porosity, permeability, and their finishing grade;

• use of some materials recovered from the mining chambers, as materials for households(mine wood, rails, pipes) or ornamental rocs kept in the house [2,8].

Measurements were carried out by the Public Health Department over the years, assessing the global-α, global-β, radioactive Radium-226 separation, and natural Thorium radiations. Mine water samples were collected from the following three galleries: 23, 11, and “Good luck”. Surface water was collected from Baita Cris river, which collects the mine watercourses from all around the Baita Plai mines, the Black Cris river, where the mine waters are collected, respectively.

Tap water pipes were checked in Fanate, Campani, Baita, Stei, and Nucet villages, proved to be safe for the population, with values that are consistent with those recommended for consumption (Law 458/2002) [9].

As may be seen in Table 2, increased values of nuclides, compared with tap water, were found in residual water in the mine galleries, and in the Valea Plaiului river which is tributary to Baita Cris river.

Table 2: Radioactivity check on environment samples collected in the area of the nuclear facility’siimpact zone

Nr.

SAMPLEiTYPE

YEAR

TotaliNr.iofisamples

Samplesiwithiexceededivalues

1

mineiwater

2007

8

8

2008

10

10

2009

12

12

2010

15

15

2011

12

12

2012

14

14

2013

3

3

2014

2

2

2015

4

4

2

depositiwater

2007

2

2

2008

2

2

2009

1

1

2010

2

2

2011

4

4

2012

4

4

2013

4

4

2014

2

2

2015

1

1

3

surfaceiwater

2007

11

3

2008

14

4

2009

23

4

2010

23

3

2011

30

5

2012

30

5

2013

10

2

2014

13

2015

15

2

4

spontaneousivegetation

2007

14

12

2008

20

17

2009

18

11

2010

11

6

2011

16

8

2012

35

21

2013

11

5

2014

5

2

2015

6

3

5

atmosphericideposition

2010

1

2011

5

2012

3

2013

1

2014

2

2015

2

6

Food

2010

3

2011

13

2012

5

2013

6

2014

2

2015

7

drinkingiwater

2008

2

2009

2

2010

4

2011

6

2012

6

2013

6

2014

6

2015

2

Discussion

Gamma-ray spectroscopy is a non-invasive, quantitative study of the energy spectra of gamma-ray sources, in such as the nuclear industry, geochemical investigation, and astrophysics. Most radioactive sources produce gamma rays, which are of various energies and intensities. When these emissions are detected and analyzed with a spectroscopy system, a gamma-ray energy spectrum can be produced. A detailed analysis of this spectrum is typically used to determine the identity and quantity of gamma emitters present in a gamma source, and is a vital tool in radiometric assay. The gamma spectrum is characteristic of the gamma-emitting nuclides contained in the source, just as in optical spectroscopy, the optical spectrum is characteristic of the material contained in a sample. Gamma spectroscopy detectors are passive materials that wait for a gamma interaction to occur in the detector volume. The most important interaction mechanisms are the photoelectric effect, the Compton effect, and pair production. When a gamma ray undergoes a Compton interaction or pair production, and a portion of the energy escapes from the detector volume without being absorbed, the background rate in the spectrum is increased by one count. This count will appear in a channel below the channel that corresponds to the full energy of the gamma ray. Larger detector volumes reduce this effect. The voltage pulse produced by the detector (or by the photomultiplier in a scintillation counter) is shaped by a multichannel analyzer (MCA). The multichannel analyzer takes the very small voltage signal produced by the detector, reshapes it into a Gaussian or trapezoidal shape, and converts that signal into a digital signal. In some systems, the analog-to-digital conversion is performed before the peak is reshaped [7].

According to our findings, although natural and artificial radiation were identified as exceeding the recommended values in the mentioned area, this kind of pollution did not have an effect of tooth structure, did not affix in dental tissue regardless the age of individuals or the time of exposure at locally measured radioactivity. Considering that teeth belong to all age categories, authors assume that the study is pretty representative and that there is no significant nuclear contamination in researched area. Measured values are even lower than the natural radioactivity.

In a quite similar study carried out in the same geographical area [10], authors used temporary teeth’s(not mentioned how many) enamel to identify radio-nuclides, without any success, assuming that temporary teeth have an insufficient lifetime on the arches to be contaminated by this kind of pollution. Hereby, we can confirm their findings, mentioning that even a long time exposure is insufficient to determine a nuclide accumulation in human hard tissue. It seems that this is a nuclide and radiation level-sensitive issue, assuming that uranium and all the other elements followed here are retained only after a higher level of exposure and that may be an exposure to other radioactive nuclides (ex. Cesium) at the same level of radioactivity is absorbed quicker and deeper in the human organism.

In all phases of the technological processes involved in the exploitation of the uranium ore (exploitation, transport, storing the radioactive materials) high concentration radon is released in the environment [2]. Radon inside buildings represents the main source of human exposure to ionizing radiation in the world. Studies in many countries have shown that high levels of indoor radon increase the risk of lung cancer [1]. Recent epidemiologic studies proved the correlation between lung cancer and radon concentration even in so-considered normal concentrations of 40-300Bq/m3. The conclusion emphasized that radon inside buildings is responsible for lung cancer in 9% of the cases [11,12,13]. In high quantities radon can cause severe respiratory deficiencies, being considered the second cause of lung cancer, after smoking according to IARC, ICRP, WHO, UNSCEAR [2,14,15,16,17]. It is recognized as impossible to eliminate exposure to radon, only to limit the exposure to it. The critical situation requires detailed monitoring of all houses in Bǎiţa area to implement methods to reduce indoor radon levels [1].

The use of uranium waste from the uranium mines that were in use between 1950-1990 as construction materials, constructions on soil with high permeability and foundation structures that allows radon infiltration from the soil towards the inner space of the houses, are the main causes of the increased indoor radon concentrations in this specific area [1]. The magnitude of exposure to radon, in 303 buildings located nearby the mine, is 3,5 times higher than the medium concentration value of indoor radon which is 82,5Bq/m3, reported for Transilvania [1,4,5]. The results are indicating high levels of radon in Baita area, arguing that the percent of mortality caused by lung cancer attributable to radon exposure is the highest from Romania and Europe [1,6,11]. As a result, the population’ health is affected by the environment’s pollution, so that higher mortality rates, raised lung cancer rate, and decreased life expectancy is noticeable in areas like this [2]. Therefore we can conclude that this kind of radiation is exploitation(natural) one, not an artificial one, generated either by nuclear fusion or disruption, which damages more severely the living organisms. Its effect is a long term one, in this case affecting the lungs, due to lung depositing of these elements. Also, it is worthy of mentioning that there are two kinds of radioactive contamination, affixed and un-affixed. In our case we are witnessing un-affixed contamination in teeth and affixed contamination in the lungs.

Conclusion

Therefore we can conclude that this kind of radiation is exploitation (natural) one, not an artificial one, generated either by nuclear fusion or disruption, which damages more severely the living organisms. Its effect is a long term one, in this case affecting the lungs, due to lung depositing of these elements. Also, it is worthy of mentioning that there are two kinds of radioactive contamination, affixed and un-affixed. In our case we are witnessing un-affixed contamination in teeth and affixed contamination in the lungs.

References

  1. Alexandra CucoşD, Cosma C, Dicu T,Papp B, NiţǎDC et al. (2011). Actual situation of indoor radon measurements and the perspective of remedial actions in Baita-Bihor mining area. Ecottera 8: 25-32
  2. Constantin Cosma, Sainz C, Alexandra Cucos, Dicu T, Begy R et al. (2011). Implementation of remedial techniques for radon in dwellings from baita uranium mine area. Concept of Radioprotection culture” and its role in population and environment protection- National Confference Bucharest.
  3. Cosma C, Dicu T, Dinu A, Begy R (2009) Radon and lung cancer, Ed. Quantum, Cluj-Napoca 166.
  4. Cosma C, Szacsvai K, Dinu A, Ciorba D, Dicu T et al. (2009) Preliminary integrated indoor radon measurements in Transilvana. Isotopes in Environmental and Health Studies 45: 1-10. [crossref]
  5. Sainz C, Dinu A, Dicu T, Szacsvai K, Cosma C et al. (2009) Comparative risk assessment of residential radon exposures in two radon – prone areas, Stei (Romania) and Torrelodones (Spain). Science of The Total Environment 407: 4452-4460. [crossref]
  6. INS, http://www.insse.ro/
  7. Wikipedia https://en.wikipedia.org/wiki/Gamma_spectroscopy
  8. Dinu A (2009) Correlations between indoor radon and lung cancer incidence in Stei-Baita mining area”. phd thesis, Cluj Napoca.
  9. http://www.ms.ro/wp-content/uploads/2017/02/Proiect-Lege-modcompl.458.pdf
  10. Porumb A, Romanul I, Bungău S (2012) The determination of impurities, coming from radioactive pollution, in temporary teeth samples, using the neutrons activation analysis method. AnimalHusbandry and Food Industries Technologies 11: 191-196
  11. Ferlay J, Autier P, Boniol M, Heanue M, Colombet M et al. (2007) Estimates of the cancer incidence and mortality in Europe 2006. Annals of Oncology18: 581-592. [crossref]
  12. Field RWKrewski DLubin JHZielinski JMAlavanja M et al. (2006) An overview of the North American case-control studies of residential radon and lung cancer. J Toxicol Environ A 69: 599-631. [crossref]
  13. Darby S, Hill D, Deo H, Auvinen A, Barros-Dios JM et al. (2006) Residential radon and lung cancer-detailes results of a collaborative analysis of individual data on 7148 persons with lung cancer and 14208 persons without lung cancer from 13 epidemiologic studies in Europe”.Scandinavian Journal of Work Environment and Health32: 1-84. [crossref]
  14. IARC International Agency for Research on Cancer (1988) Man-made Mineral Fibres and Radon”. Monographs on the Evaluation of Carcinogenic Risks to Humans 43: 309.
  15. ICRP International Comission on Radiological Protection (1994). Protection against Radon-222 at home and at work, Publication 65 23: 45.
  16. UNSCEAR United Nation Scientific Commitee on the Effects of Atomic Radiation (2000). Sources and Effects of Ionizing Radiation, Report to General Assembly with Scientific Annexes 1: 654
  17. World Health Organization http://www.WHO.int/whosis/database/

Achieving Treatment Free Prolonged Response in ITP patients Treated with Thrombopoietin Receptor Agonists (TPO-RAs)

DOI: 10.31038/JCRM.2020324

Mini Review

Over the past ten years, Thrombopoietin Receptor Agonists (TPO-RAs) have become a popular treatment choice for Immune Thrombocytopenia (ITP) patients who have either failed or suffered from side effects of steroids therapy. Currently, three have been licensedfor the treatment of ITP,namely Romiplostim (Nplate, Amgen, Thousand Oaks, CA, USA), eltrombopag (Promacta, Novartis, Basel, Switzerland) and avatrombopag (Doptelet, Dova, Durham, NC, USA). Romiplostim is administered subcutaneously on a weekly schedule [1], while both eltrombopag and avatrombopag are small molecules that can be administered orally on a once-daily schedule [2, 3]. All three TPO-RAs are well tolerated with response rate defined as platelet count over 50 x109/L during a finite period of time, of 60-90%. Most ITP subjects will maintain a steady platelet count with improvement of bleeding symptoms while they continue TPO-RA therapy. However, when are stopped, the platelet counts will return to base-line levels. As TPO-Ras treatment is quite expensive, prolonged use will create a significant financial burden on the health care system or patients. Recently, there were increasing reports of treatment-free durable responses after discontinuation of thrombopoietin receptor agonist.Mahevaset al [4] studied 54 adults ITP patients treated with at least one Tpo-RA over a 5-year period in France. TPO-RAs were discontinued in 20 patients who achieved a complete response and eight patients showed a mean treatment free response of 13·5 months (range 5-27 months), giving an overall off-therapy sustained response rate of 14.8%(8/54). Gonzales et al [5] evaluated treatment free response after discontinuing eltrombopag in 49 out of a cohort of 260 chronic ITP patients. Among these 49 patients, 26 maintained a platelet count ≥100×109/L for at least 6 months after stopping eltrombopag without any additional ITP therapy, while 23 relapsed giving an overall sustained response rate of 10% (26/260). These 26 subjects were all chronic ITP patients who had received an average of 4 (range 2-5) prior therapies. In another study [6], Gonzales et al studied 30 newly diagnosed ITP, 30 persistent ITP and 160 chronic ITP subjects for treatment free response after discontinuing eltrombopag.Five newly diagnosed (16.6%), four persistent (13.3%) and thirty-five chronic (22%) ITP were able to achieve off therapy response of ≥ 6 months.In another study of adult ITP treated with romiplostim by Newland et al, 75 subjects with ITP of ≤ 6 months and who had  received romiplostim for ≤ 12 months have treatment discontinued and treatment-free durable responses (platelet counts >50×109/L lasting at least six months) was observed in 23 (32%) subjects [7].

Zhang et al [8] conducteda pilot study to evaluate whether a 12-week course of eltrombopag plus 1-3 courses of pulsed dexamethasone as first line therapy for ITP patients could increase the proportion of patients with platelets >50×109/Loff therapyat 6 months. Eligible subjects had confirmed ITP and platelet counts < 30×109/L or platelet counts < 50×109/Land significant bleeding symptoms (WHO bleeding scale 2 or above). Patients must have no prior ITP treatment. Treatment consisted of eltrombopag 25-75 mg daily according to platelet response for 12 weeks plus pulsed dexamethasone, 40 mg daily for 4 consecutive days every 4 weeksfor 1-3 courses. Fiftysubjects with primary ITPwere successfully enrolled from November 2014 to January 2019.In an intention to treat analysis, 26/50 (52%) had achieved the primary endpoint of platelet counts > 50×109/L for more than 6 months after discontinuation of treatment. Three subjects had withdrawn consent before starting treatment, one was withdrawn because of protocol violations and one subject subsequently was diagnosed amegakaryocytic thrombocytopenia. Excluding these 5 subjects, the treatment free response rate would be 57.7%. Among these 26 patients, 17 had maintained platelet count over 100 x109/L for longer than 18 months (mean 41.1, range 19-55 months). Age, sex, clinical features, average daily dose of eltrombopag and number of courses of dexamethasone of these 17 subjects were not significantly different from the rest of the subjects. Among remaining 9 subjects, three had relapsed with satisfactory response to 4- week course of eltrombopag plus pulsed dexamethasone. The remaining six had platelet counts fluctuating between 40-60x×109/L without any significant bleeding symptoms or further ITP treatment (manuscript submitted). Even though this was only a single arm study, the treatment free response rate was the highest reported so far. Also, the mean duration of the treatment free response was also among the longest reported. These data suggested that 12-week of eltrombopag plus dexamethasone as first line treatment may result in prolonged response off therapy in nearly half of ITP subjects.

Treatment free prolonged response can be achieved in 10-50 % of ITP subjects treated with TPORAs. We suggested that ITP subjects who have achieved a steady platelet counts of > 50x x 109/L with minimal bleeding symptoms after 3 or more months of treatment with a stable dose of should have gradually taperingof the TPORAs every 2 weeks the minimum amount required to maintain an adequate platelet count for minimal bleeding symptoms. In 10-30% of ITP subjects, the TPORAs can be tapered off to achieve treatment free prolonged response. In treatment naïve ITP subjects, eltrombopag plus pulsed dexamethasone is a promising treatment choice for achieving treatment free response.

References

  1. Amgen INplate(2017) romiplostim. Thousand Oaks, CA: Amgen.
  2. Glaxo-Smith-Kline Promacta (2017) eltrombopag. NC: Research Triangle Park.
  3. Pharmaceuticals D Doptelet (2018) avatrombopa. tablets: US prescribing information.
  4. Mahevas M, Fain O, Ebbo M, et al. (2014) The temporary use of thrombopoietin-receptor agonists may induce a prolonged remission in adult chronic immune thrombocytopenia. Results of a French observational study. Br J Haematol.165:865–869.
  5. Gonzalez-Lopez TJ, Pascual C, Alvarez-Roman MT, et al. (2015) Successful discontinuation of eltrombopag after complete remission in patients with primary immune thrombocytopenia. Am J Hematol90: E40–43.
  6. Gonzalez-Lopez TJ, Fernandez-Fuertes F, Hernandez-Rivas JA, et al.(2019)  Efficacy and safeof eltrombopag in persistent and newly diagnosed ITP in clinical practice. International Journal of Hematology106:508-516.
  7. Newland A, Godeau B, Priego V, et al. (2016) Remission and platelet responses with romiplostim in primary immune thrombocytopenia: final results from a phase 2 study. Br J Haematol172:262–273.
  8. Zhang L, Zhang M, DuX, Cheng Y, and Cheng G (2020) Safety and efficacy of eltrombopag plus pulsed dexamethasone as first‐line therapy for immune thrombocytopenia. British Journal of Hematology.