DOI: 10.31038/AFS.2020221
Abstract
Significant tropical spiny lobster puerulus settl ements have been found in bays around central Indonesia, leading to the development of lobster grow-out aquaculture starting in 2008. In recent years grow-out farming has all but stopped due to the development in 2013 of the export market for lobster juveniles to Vietnam, as well as the 2015 introduction of a government policy banning capture of small wild-caught lobsters. We compare results of a 2016 recall survey of 96 lobster farming households with 2011 survey data. Before the industry’s demise, lobster grow-out was only marginally profitability due to the lack of low-cost juveniles and inefficient feeding practices. We recommend lifting the government ban on wild capture of small lobster to allow the legal benefit of juvenile exports and to allow the aquaculture industry to regenerate. We suggest that the government could best serve the lobster industry by investing in research into sustainable fishing of the puerulus resource and low-cost formulated lobster diets.
Keywords
Lobster aquaculture, Indonesia, Bioeconomics, Policy
Introduction
Global production of crustaceans has been increasing exponentially since 1961 (Figure 1), almost all of which is used for human consumption. Tropical spiny lobster, also known as rock lobsters, are members of the Palinuridae family, and are highly prized throughout Asia, Europe and America, mainly due to their size and excellent meat quality [1,2]. Global demand for lobster is growing strongly, particularly in China, and prices are increasing as a consequence [3]. Farm-gate prices for wild-caught species in Indonesia are approximately USD22/kg (IDR300,000/kg) for 300-500g Panulirus homarus and USD30/kg (IDR400,000/kg) for Panulirus ornatus [3].
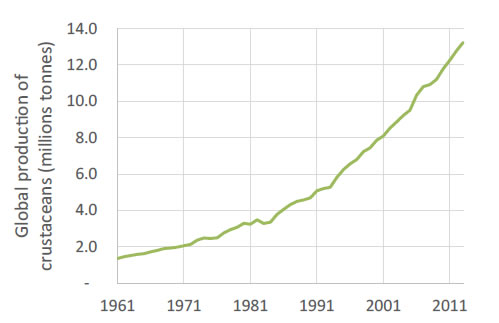
Figure 1. Global production of crustaceans, 1961 – 2013 [21]
Tropical spiny lobsters are found in almost all warm seas and are particularly common in Australasia. They have an extended pelagic larval phase (up to 9 months) and their larval settlement may take place in different habitats and depths [4]. Spawning grounds for P.ornatus are considered to be in Papua New Guinea, the Philippines and, possibly, Indonesia, after which oceanography-driven connectivity causes larvae to move throughout the South-East Asian archipelago from Vietnam through Indonesia to Australia [5]. Although specific spawning aggregations for P. homarus have not been reported, larval dispersal for this species is likely to follow the same pattern. Effectively, the populations of both species in the Indo West pacific region represent a single homogeneous genetic stock [6].
Indonesian crustacean production reached 1million tonnes in 2013, of which approximately 30% was exported and 70% was consumed domestically (Figure 2). There are very few imports of crustaceans into Indonesia (approximately 12,000tonnes in 2012 and 2013). Tropical spiny lobster is a relatively small part of the crustacean sector in Indonesia, accounting for approximately 1.4% of crustacean production. There has been significant variability in capture production over the last 5 years, varying from 5,000 to17,000 tonnes (Figure 3). Export value of tropical spinylobster was approximately USD43million in 2014 [7].
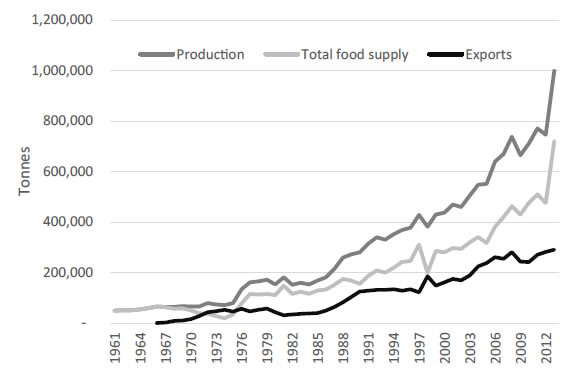
Figure 2. Production, total food supply and exports of crustaceans in Indonesia, 1961 – 2013 (FAO 2017)
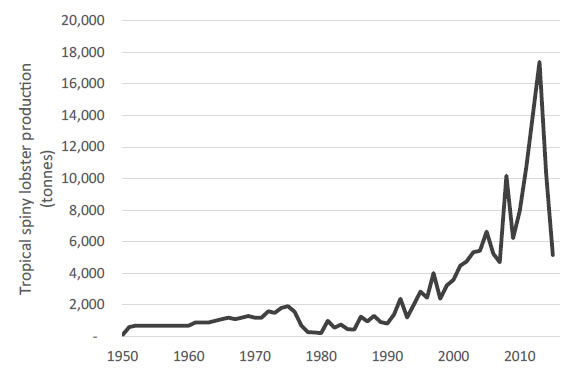
Figure 3. Tropical spiny lobster production in Indonesia, 1950 to 2016 (FAO 2018a,b)
Tropical spiny lobster production is dominated by capture production from the Western Central Pacific, and to a lesser extent, the Eastern Indian Ocean. Recorded aquaculture production of the species began in 2008, and has ranged between 161 and 488 tonnes during this time period, equating to between 2% and 6% of total tropical spiny lobster production (Figure 4). The value of production peaked at USD13million in 2013, but fell to USD2million in 2015. This data implies that spiny lobster prices have varied between USD10/kg and USD15/kg over this period. The aquaculture industry is dominated by P. homarus and P. ornatus harvested at approximately 220g, for domestic consumption. P. ornatus has significant export potential if harvest size can be increased to approximately 1kg [3].
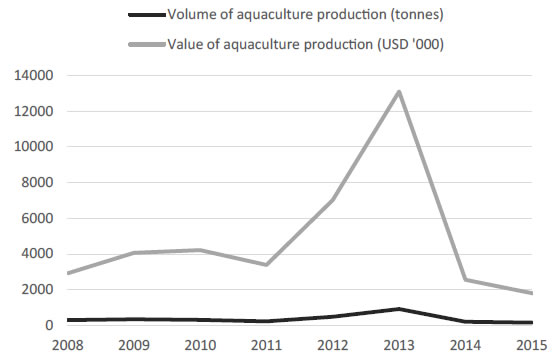
Figure 4. Volume and value of tropical spiny lobster aquaculture in Indonesia, 2008 – 2015 (FAO 2018b)
Aquaculture production of spiny lobster is surprisingly small compared with that of Vietnam where annual production exceeded 1,400 tonnes in 2016 [8]. The Indonesian industry is small despite a supply of puerulussettling in Indonesian coastal regionswhich is 20 times bigger than that of Vietnam [9]. Lobster aquaculture production in Indonesia was developing strongly with approximately 900tonnes of production in 2013. However, the industry has experienced a number of challenges; including a disease outbreak in 2011, reduced availability of puerulus and post-puerulus due to redirection of seed to the lucrative export market (which commenced in 2013), and lack of skills and knowledge development of best practice. The lucrative export market for seed, which promised quicker and less risky cashflow, led to the start of the downward trend in production after 2013 shown in Figure 3. This was further accentuated with the introduction, in January 2015, of the Ministry of Marine and Fisheries Regulation 1/2015 which banned the catching of Panulirus species under 8cm in carapace length. At this size, lobsters are approximately 200g. This regulation was enacted with the intention of protecting wild adult stocks from depletion and had the unintended consequence of prohibiting the taking of puerulus for aquaculture purposes.
With the collection of juvenile lobster now illegal, there are very few lobster grow-out farmers in Indonesia. This has led to loss of jobs and income for more than 5,000 peopleand associated flow-on social impacts. Ironically, despite this ban on puerulus collection, the number of puerulus caught has increased dramatically from around 600,000 seeds/year from 2008 through to 2013 to 5 million seeds/year in 2014 (before implementation of the regulation) [10] and approximately 50-60 million in 2015 (after implementation of the regulation) [11]. This spike in lobster seed export is due to development of alucrative black market for lobster seed and new sources of puerulus discovered in Sumbawa, South East Sulawesi, Java and Aceh [11]. Jones [12] argues that as the puerulus population settling in southern Java, Lombok and Sumbawa is a sink and disconnected from spawning stocks, the fishery can sustain a level of puerulusharvest without impacting the sustainability of Indonesia’s adult lobsterfishery. Unfortunately, this is benefiting the black market for exporters and Vietnam lobster grow-out producers (the destination of illegally exported puerulus from Indonesia).
The purpose of this paper is to compare the management practices and economic viability of lobster grow-out farming overtime before the introduction of the ban on puerulus collection. Factors that affect the profitability of the industry are considered in this paper and policy recommendations are made for development of a sustainable and viable lobster aquaculture industry in Indonesia into the future. The methodology is described in Section 2, results are provided in Section 3, and a discussion and conclusions are presented in Section 4.
Methodology
In 2011, Petersen et al. [13] estimated that there were approximately 1,000 lobster grow-out farmers in Indonesia. In April of that year, key informant interviews of 11 lobster households were conducted in two of the main grow-out regions in Lombok – Telong Elong/Gili Belik (5 households) and Ekas Bay (6 households) (Figure 5). All respondents were P. homarus farmers. At the time, very little lobster grow-out was conducted elsewhere in the country. The results of this survey were reported in Petersen et al. [13].
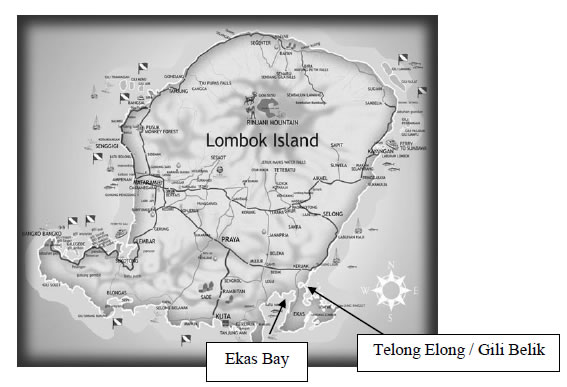
Figure 5. Location of survey regions on Lombok Island, Indonesia
In February 2016, the same survey was implemented in the same survey region. Priyambodo et al. [11] estimates that while the number of growout producers peaked at approximately 5,000 in 2013, the number dropped to approximately 250 in 2016. The second survey was conducted with 96 randomly-selected households in the region with experience in lobster grow-out. Due to the demise of the industry, the second survey was a recall survey, asking respondents to recall data from 2014/2015. It is acknowledged that many farmers had ceased lobster production during the 12 months preceding the survey, limiting the accuracy of responses. The questionnaire contained mostly closed questions pertaining to the socio-economics of their previous lobster growout enterprise. Seventy-six percent of respondents of the 2014 survey were P. homarus farmers (73) and 34% were P. ornatus farmers (33). Ten respondents produced both P. homarus and P.ornatus.
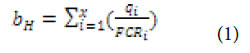
The 2015 data generated in the second survey was inputted into a bio economic model developed and described byPetersen et al. [12] The model describes a biological model of fish growth where total biomass gain at harvest, bH, is a function of the quantity of feed during various growth phases, i, (qi) divided by the feed conversion ratio of the feed during growth phase, i, (FCRi, wet weight) as per equation (1):
This biological model is interrelated with an economic model ofcosts and returns to generate an annual enterprise gross margin, where all establishment, maintenance, and capital replacement costs were annualized. The economic model describes net revenue (NR) as total revenue (TR) (which is a function of weight of lobster production multiplied by the price of harvested lobster, minus total costs (TC) which is a function of seed, feed, labor, cage, capital, interest and contingency costs) ofper equation (2):
![]()
The bioeconomic model is calibrated separately using mean values from the 2011 and 2015 survey data, and output is compared. Results of the 2011 calibration are presented separately for the two regions (labelled Telong Elong and Ekas Bay), whereas the results of the 2015 calibration are presented together as East Lombok, but disaggregated by species (P. homarus and P. ornatus).
Results
The results are discussed here in seven subsections: general household information (3.1), juveniles and stocking (3.2), feeding (3.3), harvest information (3.4), bioeconomic analysis (3.5), sensitivity analysis of key model parameters (3.6), and scenario analysis of different feeding regimes and harvest sizes (3.7).Specific data are provided within the text is presented in the Appendix.
General household information
The average number of years of experience of P. homarus lobster farmers was higher in 2015 (10 years) than 2011 (4 years) reflecting the time frame between surveys. P. ornatus had approximately 6 years more experience than P. homarus households in 2015. This may reflect the origins of the Indonesian lobster aquaculture industry which drew from the success of the Vietnam lobster aquaculture industry, which specialises in P. Ornatus production. Knowledge from Vietnam was transferred through various research projects to Indonesia. The Indonesian industry later shifted to predominantly P. homarus production due to local availability of pureulus supply(Jones 2010). Reported average household size was lower in 2015 (3.1 members) than in 2011 (4.3 members). Lobster farmers have approximately 6 years of formal education.
Juveniles and stocking
The number of seacages per household and the size of these seacages, was slightly larger in Ekas Bay in 2011 compared with Telong Elong in the same year and for all respondents in 2015, leading to significantly higher seacage volume per household.
There was large variation in the price of juveniles across regions in 2011;Ekas Bay lobster farmers could source juveniles for USD0.54/juvenile (IDR3,700/juvenile) whereas Telong Elong farmers paid an average of USD1.19/juvenile (IDR8,200/juvenile). This variation was smaller in 2015. The weighted average juvenile price was found to be similar in in local currency across the years; USD0.83/juvenile in 2011 (IDR5,700/juvenile)compared with USD0.41/juvenile in 2015 (IDR5,600/juvenile). Reflecting lower juvenile prices and larger seacage capacity in Ekas bay in 2011, the number of juveniles stocked per household per year was approximately 3 times larger (1,500 juveniles/year) than in Telong Elong in 2011 (520 juveniles/year) and East Lombok in 2015 (460 juveniles/year). Stocking density was 3 times higher in Ekas Bay (24 juveniles/m3) than Telong Elong (7 juveniles/m3) in 2011, and almost 5 times higher than East Lombok in 2015 (5 juveniles/m3).
Feeding
Lobster grow-out farmers in Indonesia feed their lobsters mostly low-value finfish (also known as trash fish), most of which they catch themselves around the lobster seacages at minimal cost. Respondents found questions about the amount of feed used on a daily rate or total crop cycle to be the hardest question to answer in the questionnaires. Feeding rates and feed conversion ratios (FCRs) are provided in the Appendix with the caveat that there is reasonable uncertainty associated with these responses. Feeding rates were estimated to be approximately 5.5g/lobster/day in 2011, and significantly higher at approximately 28g/lobster/day in 2015 (with lower feeding rates for juveniles than older lobsters). With an average harvest size of 126g in 2011 and 238g in 2015, the feed conversion ratio (FCR) (quantity of food eaten divided by weight gain) was calculated to be 12 in 2011 and 25 in 2015. FCRs are high as low-value finfish lacks the complete set of nutrients required for efficient lobster growth [14]. Use of other species of molluscs and crustaceans to supplement the finfish diet may be necessary [15].
The price of purchased low-value finfish in 2011 was reported to be approximately USD0.65/KG (IDR4,500/kg), increasing in local currency terms from 2011 to 2015 (USD0.45/kg, IDR6,200/kg). However, approximately half the total quantity of feed given to lobsters was purchased, the other half caught by the farmer at minimal cost. The total quantity of feed over a grow-out season was higher in 2015 (2,200kg/grow-out season) compared with 2011 (1,000kg/grow-out season). With higher feeding rates and feed price, the cost of feed was significantly higher in 2015 (USD482/grow-out season, IDR6.6million/grow-out season) compared with 2011 (USD130/grow-out season, IDR0.9million/grow-out season).
Harvest information
The length of the grow-out season was reported to be lower in 2015 (7.0 months) compared with 2011 (8.8 months). Despite this shorter grow-out time, lobster harvest size was higher in 2015 (238g) compared with 2011 (126g). This reflects larger quantities of feed used in the later time period and possibly larger juveniles stocked. Reported survival rates have increased from an average of 70% in 2011 to 80% in 2015. Despite the smaller size of lobsters at harvest in Ekas Bay in 2011, due to the relatively large numbers of juveniles stocked and therefore harvested, total weight of household production was significantly higher (120kg) than in Telong Elong in the same year (52kg), and East Lombok in 2015 (90kg). Farm-gate prices for harvested lobster were relatively stable across years, regions and lobster species.
Bioeconomic analysis
Gross revenue (total weight of production multiplied by farm-gate price), gross costs and net revenue are presented in Figure 6. Gross revenue is higher in Ekas Bay than Telong Elong in 2011 due to significantly higher production, which in turn reflects the higher stocking rate and seacage capacity in this region. Gross costs are similar in the two regions at USD3,200/crop (IDR22million/crop). In 2015, prices and production were higher for P. homarus producers compared with P. ornatus producers (the latter due to larger seacage capacity), leading to higher gross revenue. Costs were also higher for P. homarus producers largely due to higher feeding costs.
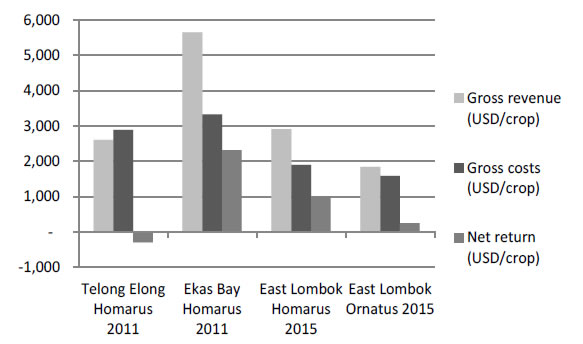
Figure 6. Gross revenue, gross costs and net revenue for lobster grow-out farms in Indonesia
The cost structure for lobster operations is presented in Table 1. In 2011, costs were dominated by fuel, boat, nets and other capital costs (approximately 41%). Interest and juveniles were also significant cost items (approximately 23%). In 2015, the significant cost items were also feed, boats, nets and other capital items (approximately 36%), with feed and interest being the next biggest cost items (approximately 23%). Juveniles were proportionally a smaller cost item, and feed a proportionally higher cost item, in 2015 compared with 2011.
|
Table 1: Cost structure (% of gross costs). |
||||
|
TelongElongP. homarus 2011 |
Ekas Bay P. homarus 2011 |
East Lombok P. homarus 2015 |
East Lombok P. ornatus 2015 |
|
|
Juveniles |
22 |
24 |
10 |
11 |
|
Feed |
5 |
3 |
30 |
19 |
|
Cages |
4 |
2 |
3 |
3 |
|
Fuel/boat/nets |
42 |
40 |
33 |
39 |
|
Interest |
22 |
25 |
19 |
23 |
|
Contingency |
5 |
5 |
5 |
5 |
|
Total |
100 |
100 |
100 |
100 |
This economic analysis so far has assumed no labour costs, implying that farmers do not have other income generating opportunities for their time. This is generally not the case, as most lobster farmers also generate income from fishing.Labour has not been included so far due to uncertainty associated with the opportunity cost of their time. A sensitivity analysis is conducted on labour costs in the next section.
Net returns per crop were significantly higher in Ekas Bay than Telong Elong in 2011, and for P. homarus producers compared with P. ornatus producers in 2015. Due to poor quality and availability of juveniles in Telong Elong in 2011, stocking rates were low and net returns were negative, leading to a Benefit Cost Ratio (BCR) (gross benefits divided by gross costs) of 0.9 (Figure 7). This means that for every rupiah spent, the farmer gains 0.9 rupiah in return annually. The higher the BCR the better, and a BCR>1 is required for cost-effectiveness.With more juveniles of higher quality, Ekas Bay producers were making positive net returns (USD2,300/crop, IDR16million/crop), with a BCR of 1.7. P. Homarus production in 2015 was profitable (with net returns of approximately IDR14million/crop (USD2,000/crop) and a BCR of 1.5), while P. ornatus production was marginal (net returns approximately USD220/crop (IDR3million/crop) and a BCR of 1.2). However, including labour costs into the analysis would make P. homarus production in 2015 marginal and P. ornatus production unprofitable.For example, costing the labour of one family member atUSD800/year (IDR11million/year)(Petersen et al. 2014 accounting for inflation), leads to a labour cost of USD510/crop(IDR 7million/crop) for P. homarus and USD365/crop (IDR5million/crop) for P. ornatus, and reduces the BCR for P. homarus production to 1.2 and for P. ornatus production to 0.9.
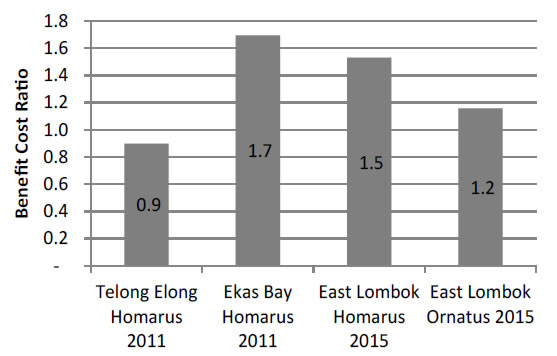
Figure 7. Benefit Cost Ratios for lobster grow-out farming in Indonesia
Sensitivity analysis of key model parameters
The sensitivity analysis is this section is conducted to understand the impact of low and high levels of key parameters on the BCR. Likely changes in these parameters are considered, rather than a standard percentage change, to determine the impact of realistic levels of variability in the system on cost-effectiveness.These likely changes are determined based on the authors’ knowledge of historical data for each parameter over time. In this way, the impact of possible parameter changes as observed through time are analysed. The sensitivity analysis is conducted for P. homarus and P. ornatus producers in 2015 and compared with the findings for 2011 as discussed in Petersen et al. [13]. The parameter levels used in the sensitivity analysis for P. homarus and P. ornatusare shown in columns 2 to 4 in Tables 2 and 3, respectively. Each of these parameter levels are changedindividually with all other conditions remaining the same (ceterus parabis). The impacts of this sensitivity analysis on the BCR are shown for P. Homarus in Figure 8 and P. ornatus in Figure 9. The break-even parameter levels–the parameter levels for which the BCR equals 1 –are shown in the last columns of Tables 2 and 3.
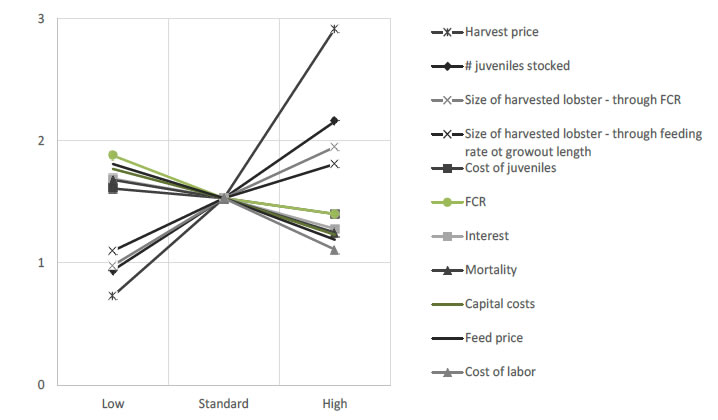
Figure 8. Sensitivity analysis of the effect on the BCR of realistic changes in key model parameters for P. homarus production in 2015
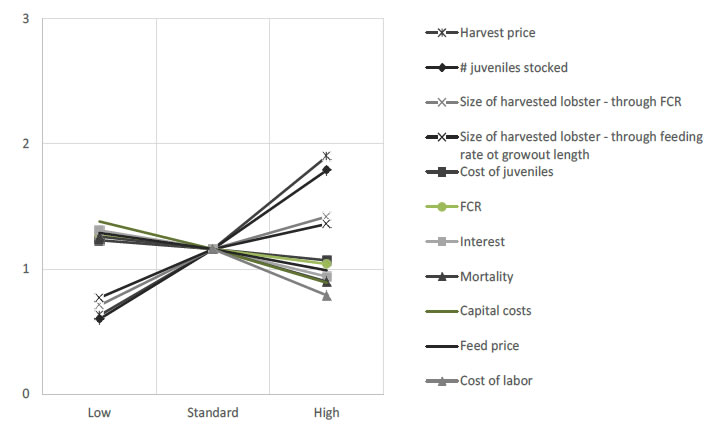
Figure 9. Sensitivity analysis of the effect on the BCR of realistic changes in key model parameters for P. ornatus production in 2015
|
Table 2: Parameter levels used in the sensitivity analysis – P. homarus. |
||||
|
Assumption |
Low level |
Standard level |
High level |
Break-even parameter level |
|
Number of juveniles stocked |
250 |
513 |
1,000 |
272 |
|
Cost of juveniles (USD/juvenile (IDR/juvenile)) |
0.18 (2,500) |
0.37(5,100) |
0.73 (10,000) |
2.34 (32,000) |
|
FCR |
10 |
26 |
35 |
75 |
|
Feed price (USD/kg (IDR/kg)) |
0.11 (1,500) |
0.22 |
0.44 (6,000) |
0.62 |
|
Mortality (%/crop) |
10 |
21 |
40 |
55 |
|
Size of harvested lobster (kg/lobster) |
0.150 |
0.235 |
0.300 |
|
|
Through changes to the FCR |
|
|
|
0.154 |
|
Through changes to the feeding rate |
|
|
|
0.133 |
|
Through changes to the grow-out time-period |
|
|
|
0.133 |
|
Harvest price (USD/kg (thousand IDR/kg)) |
15(200) |
31(419) |
58(800) |
20(274) |
|
Capital costs (USD/crop (million IDR/crop)) |
365(5.0) |
620(8.5) |
1,095(15) |
1,628(22.3) |
|
Cost of labor (USD/crop (million IDR/crop)) |
– |
– |
730(10) |
1,007(13.8) |
|
Interest (USD/crop (million IDR/crop)) |
182(2.5) |
365(5.0) |
730(10) |
1,372(18.8) |
|
Table 3: Parameter levels used in the sensitivity analysis – P. ornatus. |
||||
|
Assumption |
Low level |
Standard level |
High level |
Break-even parameter level |
|
Number of juveniles stocked |
150 |
349 |
700 |
285 |
|
Cost of juveniles (USD/juvenile (IDR/juvenile)) |
0.22(3,000) |
0.48(6,600) |
0.88(12,000) |
1.20(16,500) |
|
FCR |
10 |
19 |
30 |
34 |
|
Feed price (USD/kg (IDR/kg)) |
0.11(1,500) |
0.22(3,000) |
0.44(6,000) |
0.43(5,900) |
|
Mortality (%/crop) |
10 |
19 |
40 |
32 |
|
Size of harvested lobster (kg/lobster) |
0.150 |
0.245 |
0.300 |
|
|
Through changes to the FCR |
|
|
|
0.212 |
|
Through changes to the feeding rate |
|
|
|
0.205 |
|
Through changes to the grow-out time-period |
0.205 |
|||
|
Harvest price (USD/kg (thousand IDR/kg)) |
15(200) |
27(365) |
44(600) |
23(315) |
|
Capital costs (USD/crop (million IDR/crop)) |
365(5.0) |
620(8.5) |
1,095(15) |
876(12) |
|
Cost of labor (USD/crop (million IDR/crop)) |
– |
– |
730(10) |
255(3.5) |
|
Interest (USD/crop (million IDR/crop)) |
182(2.5) |
365(5.0) |
730(10) |
613(8.4) |
As P. homarus production is more profitable than P. ornatus production, P. homarus systems are more resilient to negative changes in market, management or biological conditions. In the case of P. homarus, realistic negative changes in only a few parameters make the system unprofitable (low harvest price, number of juveniles stocked and size of harvested lobster) whereas negative impacts of almost all parameters lead to a lack of cost-effectiveness of P. ornatus production (with the exception of the cost of juveniles and the FCR). For both species, lobster grow-out farming seems to be most sensitive to harvest price. While a low harvest price can lead to poor cost-effectiveness, high harvest prices have the potential to lead to extremely good cost-effectiveness and profitability.
The results for P. homarus production in 2015 are similar to that in 2011 (Figure 10), where the system was found to be reasonably resistant to negative parameter changes (with the exception of low harvest price and high morality). In 2015, the system was also most sensitive to changes in the harvest price, with high harvest price having the potential to generate significantly high profits for lobster producers.
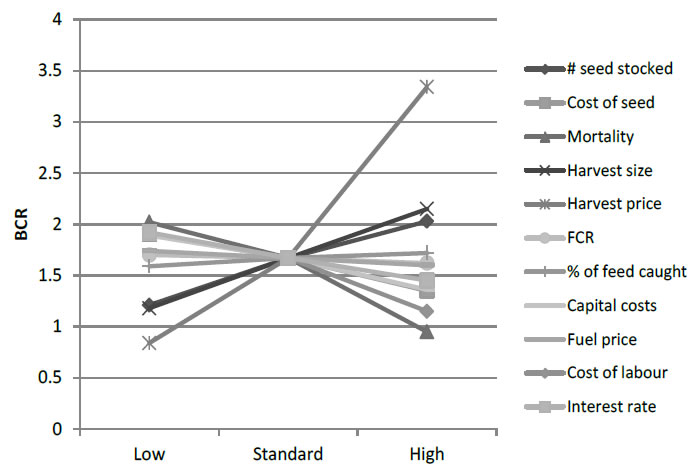
Figure 10. Sensitivity analysis of the effect on the BCR of realistic changes in key model parameters for P. homarus production in Ekas Bay in 2011 [13].
The break-even labour cost for P. homarus and P. ornatus in 2015 are USD1,000/crop and USD260/crop(IDR13.8million/crop and IDR3.5million/crop), respectively. Assuming a labour cost of USD800/person/year (IDR11million/person/year), leading to a labour cost of USD510 (IDR 7million/person/crop) for P. homarus and USD365/crop (IDR5million/person/crop) for P. ornatus, the systems remain profitable until more than 2.0 people are paidin the case of P. homarus production, and more than 0.7 of a wage is paid in the case of P. ornatus production. Another perspective is that P. homarus production is equivalent to earning the wages of 2 people over the crop, and P. ornatus production is equivalent to earning the wages of 0.7 of a person.
Scenario analysis of different feeding regimes and harvest sizes
Three scenarios are considered in this section: (1) the use of pelleted feed, (2) increasing harvest size to 300g, (3) increasing the harvest size of P. ornatus to 1kg, (4) the use of pelleted feeds and increased harvest size to 300g, and (5) the use of pelleted feeds and increasing harvest size to 1kg for P. ornatus. Each of these are discussed in more detail below.
Aquaculture around the world is moving away from the use of low-value finfish to manufactured pelleted diets. Low-value finfish is relatively cheap compared with pelleted diets, although prices are increasing as finfish supply is reducing in many parts of the world. However, pelleted diets have significant advantages such as lower FCRs (due to specific nutritional formulations and reduced feed waste),reduced local pollution and water quality degradation (since a smaller mass of feed is used with greater efficiency), a longer storage life, and more stable supply (because their availability is not dependent on seasonal factors) [16]. Manufactured diets have been formulated for tropical rock lobsters, but they are not yet commercially available due to lack of demand. Petersen and Glencross [16] estimate that this kind of diet would likely cost approximately USD3/kg, which is currently equivalent to approximately USD5.80/kg (IDR40,000/kg) but was equivalent to USD3.80/kg (IDR26,000/kg) at the time their paper was written. They estimate that the FCRs of pelleted diets will be approximately 3. Scenario analysis 1 in Table 4 suggests that compared with the standard solution, at USD5.80/kg, the use of manufactured diet is likely to reduce profits of grow-out enterprises, but at USD3.80/kg, it would marginally increase profits for P. homarus producers but decrease profits for P. ornatus producers. The reduced FCR of pelleted diets is worth the extra cost for P. homarus producers, but not for P. ornatus producers who have relatively lower FCR for current diets.
|
Table 4: Scenario analysis for various diets and harvest sizes for P. homarus and P. ornatus production (2015). |
||||
|
|
P. homarus |
P. ornatus |
||
|
|
Net return |
BCR |
Net return |
BCR |
|
Standard solution |
101 (13.8) |
1.5 |
26 (3.5) |
1.2 |
|
Pelleted feed |
|
|
|
|
|
FCR=3, USD5.80/kg |
74 (10.2) |
1.3 |
-5 (-0.7) |
1.0 |
|
FCR=3, USD3.80/kg |
104 (14.2) |
1.6 |
16 (2.2) |
1.1 |
|
Scenario analysis 2: 300g harvest size |
||||
|
Through increased grow-out length |
166 (22.8)a |
1.8a |
60 (8.2 |
1.4b |
|
Through improved FCR |
182 (24.9)c |
2.0c |
66 (9.1 |
1.4d |
|
Through increased feeding rate |
166 (22.7)e |
1.8e |
60 (8.2 |
1.4f |
|
Scenario analysis 3: 1kg harvest size |
||||
|
Through increased grow-out length |
n.a. |
n.a. |
501 (68.7)g |
3.0g |
|
Through improved FCR |
n.a. |
n.a. |
594 (81.4)h |
4.7h |
|
Through increased feeding rate |
n.a. |
n.a. |
501 (68.7)i |
3.0i |
|
Scenario analysis 4: Pelleted feed and 300g harvest size |
||||
|
Through increased grow-out length |
169 (23.2)a |
1.8a |
48 (6.6) |
1.3b |
|
Through improved FCR |
184 (25.2)j |
2.0j |
57 (7.8)k |
1.3k |
|
Through increased feeding rate |
169 (23.2)l |
1.8l |
48 (6.6)m |
1.3m |
|
Scenario analysis 5: Pelleted feed (FCR=3, USD3.80/kg) and 1kg harvest size |
||||
|
Through increased grow-out length |
n.a. |
n.a. |
463 (63.4)g |
2.6g |
|
Through improved FCR |
n.a. |
n.a. |
585 (80.1)n |
4.5n |
|
Through increased feeding rate |
n.a. |
n.a. |
463 (63.4)o |
2.6o |
n.a.=not applicable
aGrow-out period length increased from 229 to 292 days
bGrow-out period length increased from 168 to 206 days
cFCR decreased from 26.8 to 21.0
dFCR decreased from 18.6 to 15.2
eFeeding rate increased from 27.6 to 35.2g/lobster/day
fFeeding rate increased from 27.1 to 33.1g/lobster/day
gGrow-out period length increased from 5.6 to 23months
hFCR decreased from 18.6 to 4.5
iFeeding rate increased from 27.1 to 111g/lobster/day
jFCR decreased from 3.0 to 2.4
kFCR decreased from 3.0 to 2.5
lFeeding rate increased from 3.1 to 3.9g/lobster/day
mFeeding rate increased from 4.4 to 5.4g/lobster/day
nFCR decreased from 3.0 to 0.7.
oFeeding rate increased from 4.4 to 17.9g/lobster/day.
P. homarusreaches maturity at approximately 300g [17], after which growth rates decrease rapidly. This is also plate-size which is favoured by domestic consumers. Scenario analysis 2 considers the profitability of increasing harvest size of P. homarus and P. ornatus to 300g using three different methods – increasing thegrow-out period, reducing the FCR and increasing the feeding rate. In each case, profitability and cost-effectiveness is significantly improved. Of the three methods, it is most profitable for the grower to increase harvest size to 300g through improving FCRs (from 27 to 21 in the case of P. homarus, and 19 to 15 in the case of P. ornatus). However, in reality, the producer is most likely to use a combination of all three methods.
P. ornatus growth rates differ from those of P. homarus, and remain fast up until approximately 1 to 1.5kg at which size they mature [18]. Scenario analysis 3 considers the profitability of increasing the harvest size of P. ornatus to 1kg.In each case, the profitability is significantly increased, although the most profitable method for increasing harvest size is by reducing the FCR. However, this would require the FCR to decrease from 18.6 to 4.5 which is impossible for current diets of finfish. Increasing the harvest size through lengthening the grow-out period from 5.6 to 23 months is also extremely profitable, although this may be impractical and highly risky. It is just as profitable to increase harvest length by increasing feeding rates from 4.4 to 17.9g/lobster/day, although again, this is likely to be impractical. In reality, it is likely that a producer will try to do all three strategies simultaneously – reducing their FCR, increasing their grow-out length as well as increasing their feeding rates.
Scenario analyses 4 and 5 consider both a move to pelleted diets and an increase in harvest size simultaneously. In the case of P. homarus, using pelleted feeds and increasing the harvest size increases net returns, but as costs are higher, the BCRs are unchanged. In the case of P. ornatus, as the use of pelleted diets (under considered assumptions) is less profitable for the lobster businesses than current low-value finfish diets, the combination of pelleted diets and larger harvest size lead to higher profits compared with the standard solution (standard harvest size) but are not as high if the farmer focused on increasing harvest size alone (while continuing to use low-value finfish diets).
Discussion and Conclusions
Lobster grow-out aquaculture has the potential to provide a valuable income source to coastal communities where incomes are currently low and dependent on tourism and agriculture (rice and livestock production). The lobster farming industry began in 2008 and grew strongly until 2013 at which time the lucrative export market for juveniles bound for Vietnam developed. The industry’s demise was accentuated by the 2015 introduction of government regulation banning the wild capture of lobster under 8cm in carapace length (approximately 200g). Ironically, the illegal export market for juveniles has grown significantly under the regulation.
At the time of introduction of the ban on wild capture of juveniles, grow-out was profitable for P. homarus production (BCR=1.5) and marginal for P. ornatus production (BCR=1.2). However, the industry couldn’t compete with the relatively profitable activity of collecting and direct sale of puerulus for export (BCR=4.1 in 2011 [13] Hence, profitability of grow-out aquaculture was constrained by the availability of good quality seed, most of which were being exported to Vietnam. Prices of lobster seed were USD16/juvenile in Vietnam in 2013 [19] compared with USD0.50/juvenile in Indonesia.
Indonesian lobster farmers were unable to pay higher prices for seed due to the marginal profitability of their farming enterprises. Lack of skills and knowledge development of best aquaculture practices led to this poor profitability. This is most evident for feeding regimes, where lobsters are fed low-value finfish (trash fish), which do not meet their dietary requirements. Feed conversion ratios were high (27 for P. homarus, 19 for P. ornatus) and feeding rates low (although increasing) leading to low growth rates and small harvest weights (235g in the case of P. homarus, 245g for P. ornatus). Feeding rates increased between 2011 and 2015 leading to higher harvest sizes (127g compared with 238g). Yet harvest size is still smaller than the optimal 300g for P. homarus and 1kg for P. ornatus. Our research suggests that there are significant profits to be realised from increasing harvest size, and that this can be achieved through moving from finfish diets to pelleted diets (depending on the price of pelleted diets), improving the FCR of current diets, increasing the grow-out timeperiod, and increasing feeding rates. Kurniawan et al. [7] argue that harvest time is driven by the patron-client relationship, time constraints, and work complexity which may stifle a farmer’s ability to postpone harvest for higher profits. These results concur with those of Susanti et al. [20] who found that the greatest influence on the technical efficiency of lobster farming in Indonesia is the quantity of seed input, and to a lesser extent, feed inputs, experience and length to harvest time.
There is significant potential for fisheries policy reform in Indonesia. The regulation banning capture of small lobster is intended to protect wild adult lobster stocks around the Indonesian archipelago. However, adult lobster stocks, in large part, are not dependent on capture rates or size as most of the seed settling in the southern part of Indonesia have come from reproductive stocks in the Philippines and Papua New Guinea and migrate to Indonesia via ocean currents. Additional puerulus lobster populations continue to be discovered in various parts of Indonesia, including Sumbawa, South East Sulawesi, Java and Aceh. Moreover, the regulation hasn’t actually had the impact of reducing wild capture of juveniles with a thriving export black-market [21,22].
The question remains as to whether the regulation should be lifted in favour of an enforced ban on the export of juveniles. However, with extremely high prices for seed in Vietnam, enforcement of this ban would be difficult if not impossible. With such high returns to seed collection and export, it seems to be in Indonesia’s best interest to support livelihoods in Indonesia through allowing households to enjoy the benefits of high returns at low risk from this industry.
The Indonesian lobster farming industry would be well served by a comprehensive research program focussing onunderstanding the dynamics of lobster reproduction and larval dispersal to confirm the hypothesis that the puerulus population of southern Indonesia is a sink and can be exploited sustainably. Indonesia’s lobster seed resource is significantly bigger than that of Vietnam and could support a large growout industry. In future, hatchery produced seed might also contribute, but the technology for such production has remained uneconomic. Research into the production of formulated pelleted diets for lobster with low FCRs at low prices would also allow farmers to reduce their costs and increase their productivity, leading to higher harvest prices and economic returns.
We recommend that the Indonesian government remove the ban on the wild catch of seed lobsters to encourage the fledgling aquaculture industry to develop once again while allowing businesses to legally benefit from the lucrative export market. Focussing research on the sustainable fishing of naturally settling puerulus and low-cost efficient formulated lobster diets is likely to result in growth of the Indonesian lobster aquaculture industry, creating sustainable livelihood diversification opportunities for coastal communities.
Acknowledgements
This work was supported by the Australian Centre for International Agricultural Research (ACIAR) under project FIS/2014/059. We extend sincere appreciation to Ervin Nora Susanti, of Riau Kapulauan University, for conducting the key informant interviews (while at Bogor Agricultural University), and we remember the late Rina Oktaviani who was instrumental in data collection and analysis for this paper.
Funding Body
The Australian Centre for International AgriculturalResearch.
Significance Statement
This paper considers the economic profitability of lobster growout in Indonesia which grew rapidly as an industry until its demise in 2013. We make suggestions as to the cause of this demise and how the industry can regenerate again to provide valuable and sustainable livelihoods in Indonesia.
References
- Hart G (2009) Assessing the South-East Asian Tropical Lobster Supply and Major Market Demands. ACIAR Final Report (FR-2009-06). Canberra: Australian Centre for International Agricultural Research.
- Davidson A, JaineT (2006) The Oxford Companion to Food. Oxford: Oxford University Press.
- Ruello N (2017) A review of lobster markets and opportunities for Indonesian farmed lobster. Report presented at the annual project meeting of ACIAR FIS/2014/059 Expanding lobster aquaculture in Indonesia, Denpasar, Bali.
- Milton D, Satria F, Proctor CH, Prasetyo AP, Utama AA and Fausi M (2014) Environmental factors influencing the recruitment and catch of tropical Panulirus lobsters in southern Java, Indonesia. Continental Shelf Research 91: 247-255.
- Dao HT, Smith-Keune C, Wolanski E, Jones CM, and Jerry DR (2015a) Oceanographic currents and local ecological knowledge indicate, and genetics does not refute, a contemporary pattern of larval dispersal for the ornate Spiny Lobster, Panulirusornatus, in the south-east Asian Archipelago. PLoSOne10: 0124568. [crossref]
- Dao HT, Jerry D, Smith-Keune C, Wolanski E (2015b) Genetics and recruitment of spiny lobsters Panulirusornatus and P. homarus in the Indo-West Pacific. Chapter 5.7. in: Jones, C.M. (Ed.), Spiny lobster aquaculture development in Indonesia, Vietnam and Australia. Proceedings of the International Lobster Aquaculture Symposium held in Lombok, Indonesia, 22–25 April 2014. Australian Centre for International Agricultural Research, Canberra, Australia.
- Kurniawan D, Oktaviani R, Sanim B, Daryanto DHK (2017) Decision analysis of harvest time for lobster businesses in Lombok Island, West Nusa Tenggara. Journal of Management and Agribusiness14: 138-151.
- FAO (2018b) Fishery and Aquaculture Statistics. Global aquaculture production 1950-2016 (FishstatJ). In: FAO Fisheries and Aquaculture Department, Rome.
- Priyambodo B (2018) The development of spiny lobster aquaculture in Indonesia through the enhancement of puerulus catch and technology transfer. PhD thesis, School of Biological, Earth and Environmental Sciences.University of New South Wales Sydney259.
- Jones C, Huong LL, Tuan LA, BahrawiS, and Irvan S (2015). Spiny lobster aquaculture development in eastern Indonesia, Vietnam and Australia. ACIAR Final Report (SMAR-2008-021). Canberra: Australian Centre for International Agricultural Research.
- Priyambodo B, Jones CM, SammutJ(2018) The status of spiny lobster aquaculture in Indonesia. Meeting presentation to the World Aquaculture Society, 24 April 2018. The University of New South Wales Sydney.
- Jones CM (2018). Progress and obstacles in establishing rock lobster aquaculture in Indonesia. Bulletin of Marine Science. 94 (in press).
- Petersen EH, Jones C, Priyambodo B (2014) Bioeconomics of spiny lobster farming in Indonesia. Asian Journal of Agriculture and Development10: 25-39.
- Jones CM (2010) Tropical spiny lobster aquaculture development in Vietnam, Indonesia and Australia. Journal of the Marine Biology Association of India52: 304-315.
- Jones CM, SuastikaM, SukadiF, SurahmanA (2007) Improving Lobster Grow-out and Nutrition in Nusa Tenggara Barat – a Feasibility Study. ACIAR-SADI Final Report. Australian Centre for International Agricultural Research.
- Petersen EH, Glencross B (2012) Bioeconomic Analysis of Improved Diets for Marine Aquaculture in Vietnam. Advanced Choice Economics Discussion Paper2.
- MehannaS, Al-Shijibi S, Al-JafaryJ, Al-Senaidi R (2012). Population dynamics and management of scalloped spiny lobster Panulirushomarus in Oman coastal waters. Journal of Biology, Agriculture and Healthcare2: 184-194.
- MacFarlane JW, Moore R (1986) Reproduction of the ornate rock lobsterPanulirusornatus in Papua New Guinea. Australian Journal of Marine and Freshwater Research 37: 55-65.
- Petersen EH, Glencross BD, Phuong TH, Tuan VA, Tuan LA (2016) Recent changes in the bioeconomics of lobster and mud crab mariculture in Vietnam. Asian Journal of Agriculture and Development13: 89-105.
- Susanti EN, Oktaviani R, Hartoyo S, Priyarsono DS (2017) Comparison of technical efficacy of lobster farming Panulirushomarus, sp with Panulirusornatus, sp in Lombok, West Nusa Tenggara, Indonesia. Paper presented at the annual project meeting of ACIAR FIS/2014/059 Expanding lobster aquaculture in Indonesia, Denpasar, Bali.
- FAO (2017a) Fishery and Aquaculture Statistics. Food balance sheets of fish and fishery products In: FAO Fisheries and Aquaculture Department. Rome.
- FAO (2018a) Fishery and Aquaculture Statistics. Global capture production In: FAO Fisheries and Aquaculture Department. Rome.