Monthly Archives: June 2017

WHR is a Better Predictor of Type 2 DM Among Urban Adults in Jos, North Central, Nigeria

DOI: 10.31038/EDMJ.2017123

Abstract

Background

Obesity is considered the strongest risk factor for Type 2 DM and numerous studies have demonstrated this association

Objective

To compare the Body mass index (BMI), the Waist Circumference (WC) and the Waist Hip-Ratio (WHR) in predicting Type 2 Diabetes

Methods

This is a cross sectional study involving 709 subjects recruited from a multi-stage sampling method in the study location. Demographic data and anthropometric variables were obtained according to a standard protocol. Plasma glucose analysis in the fasting state and 2hours after ingestion of 75g glucose were done. We estimated the predictive value of obesity parameters WC, WHR, BMI in the prediction of diabetes. Receiver- Operator Characteristic (ROC) curves were used to determine the predictive power of each variable.

Results

The age range off our subjects was 20-89. There were 308 males (43.4%) and 401 females (56.6%). We documented 29 subjects with incident diabetes (previously undiagnosed) comprising 14 males and 15 females. The ROC curve showed that WHR had the highest AUC.

Conclusion

The ROC curve analysis indicated that WHR was better than WC and BMI in predicting type 2 diabetes.

Introduction

Obesity is an important risk factor for cardio metabolic diseases, including diabetes, hypertension, dyslipidaemia and coronary heart disease (CHD). Obesity is considered the strongest risk factor for type 2 diabetes [1]. Several leading health institutions including the WHO and the National Institute of Health (U.S.A) have provided guidelines for classifying weight status based on BMI [2, 3]. These have agreed that men and women who have a BMI ≥30kg/m2 are considered obese and are generally at higher risk for adverse health events than are those who are considered overweight (BMI between 25.0 and 29.9kg/m2) or lean (BMI between 18.5 and 24.9kg/m2). Therefore, BMI has become the gold “standard” for identifying patients at increased risk for adiposity – related adverse health outcomes [4].

Body fat distribution is also an important risk factor for obesityrelated diseases. Excess abdominal fat (also known as central or upper body fat) is associated with an increased risk of cardiometabolic disease.

Waist Circumference (WC) is often used as a surrogate marker of abdominal fat mass, because WC correlates with abdominal fat mass (subcutaneous and intra-abdominal) [5] and with cardiometabolic disease risk [6]. Men and Women who have waist circumference greater than 102cm and 88cm, respectively are considered to be at increased risk for cardiometabolic disease [7].

IDF recently proposed new waist circumference cut off points as criteria for central obesity [8, 9]. The values are ethnic and gender specific. European values are 94cm for men and 80cm for women, for Asians 90cm for men and 80cm for women. Sub-Saharan Africans are to use European values until more specific data are available.

Methods

We analysed the data of a population based cross-sectional study of 800 urban adults in jos, North Cental, Nigeria. In brief, a multistage sampling technique was used to select 800 subjects who met the inclusion criteria.In the first stage, Jos Municipality was selected ,and in second stage, 2 wards were selected randomly from 40 wards by simple balloting and then in third stage a household survey was done and 800 subjects from 340 households selected systematically(every second household) were identified and invited to participate in the study.

The study procedure was explained to all subjects and written informed consent was obtained from each subject. A questionnaire (Appendix C) was administered to obtain relevant demographic, social and medical history. The questionnaire for data collection, physical measurements and biochemical parameters was adapted and modified from WHO STEPS instrument [10]. All anthropometric measurements were done standardized. The following anthropometric measurements were taken:

i. Weight (kg): Was measured to the nearest 0.1kg with subjects in minimal clothing and without shoes using a standard weighing scale.

ii. Height (m): Was measured to the nearest 0.1cm with a stadiometer with subjects barefoot and without headgear.

iii. Body Mass Index (BMI): Was calculated as weight in kg divided by the square of height in meters (m2 ) i.e. kg/m2 .

iv. Waist circumference (cm): Was measured to the nearest 0.1 cm using a non-stretch metric tape as the horizontal level at the mid-point between the lowest rib and the iliac crest.

v. Hip circumference (cm): Was measured to the nearest 0.1cm as the largest circumference of the gluteal region or as the maximal circumference around the buttocks (posteriorly) and the pubic symphysis (anteriorly).

vi. Waist – to – Hip Ratio (WHR): Was calculated as the waist circumference (cm) divided by the hip circumference (cm).

Fasting blood sugar was measured after 8-12 hours of overnight fast in the morning by the glucose oxidase method. Diabetes was diagnosed as Fasting plasma glucose ≥ 7.0 mmol/l and/or 2 hours plasma glucose ≥11.1 mmol/l after a 75g oral anhydrous glucose load.

The WHO criteria for Obesity with BMI was used. BMI of 18.5- 24.9 for normal, 25.0-29.9 overweight and ≥ 30.0 as obese. Abnormal WC was done with IDF criteria of less than in males and less than in females. Abnormal WHR was determined using……

Statistical analyses was done with SPSS version 16. The Receiver Operator Characteristic (ROC) curve analysis was used to determine which of the anthropometric indices best correlates with glucose intolerance.

Results

Age and Sex distribution of Subjects

Eight hundred subjects were enrolled into the study, of whom 709 responded and participated in the survey giving a response rate of 88.6%. A total of 308 (43.4%) male subjects and 401 (56.6%) female subjects participated in the study giving a male to female ratio of 1: 1.3. The mean (SD) age of study subjects was 43.21 (14.73) years with a range of 20 to 89 years. The mean (SD) age of the male subjects was 42.19 (15.3) years while that of female subjects was 43.99 (14.39) years, females being slightly older, however this difference was not significant,(t=1.62, p=0.10). The age and sex distribution of the study subjects is shown in Table 1.

Table 1. Age and Sex distribution of Study Participants (Responders)

      Age (Years)                   Sex              Total    Percentage (%)
Males Females
20-29

30-39

40-49

50-59

60-69

≥70

76

78

50

59

29

16

77

91

90

61

54

28

153

169

140

120

83

44

21.6

23.8

19.8

16.9

11.7

6.2

Total 308(43.4%) 401(56.6%) 709(100%) 100

X2=11.26 , P=0.046

The comparative ability of the Indices to correctly identify Diabetes mellitus was tested using the Receiver Operator Characteristic (ROC) Curve analysis.

The ROC Curves for DM in Male subjects

The ROC Curves of the Anthropometric Indices associated with the presence of DM in Male subjects are shown in Figure 1. The AUC’s for BMI, WC, WHR were 0.79(p<0.001), 0.83(p<0.001),0.87(p<0.001) respectively showing that although all the studied indices had significant abilities to identify DM in male subjects, WHR was the best in this population.

Figure 1. ROC Curves of the anthropometric Indices associated with the presence of DM in male subjects.

Figure 1. ROC Curves of the anthropometric Indices associated with the presence of DM in male subjects.

All the indices had significant AUC compared to the Null hypothesis true area of 0.5. Since WHR had the highest AUC (0.87), as seen in the curves, it has the best predictive ability for DM in males.

Discussion

The ROC curve analysis for type 2 diabetes in men in this study had AUC’s of 0.79, 0.83, 0.87 for BMI, WC, WHR respectively while that of women in this study had AUC’s of 0.74, 0.69, 0.74 for BMI, WC, WHR respectively.

The findings of this study showed that all the studied anthropometric Indices had significant ability to identify subjects with DM, however WHR was superior to both WC and BMI in predicting Diabetes in men. In women, the WHR yielded equal predictive ability with BMI and both were superior to WC in predicting diabetes in women.

This contrasts with Caucasian studies [11,12]where WC performed better than WHR as a predictor of type 2 DM. The ROC curve analysis for type 2 diabetes in men in this study had AUC’s of 0.79, 0.83, 0.87 for BMI, WC, WHR respectively. These AUC’s are higher than the ones obtained in the EPIC-Potsdam study [13] for type 2 diabetes in men with AUC’s of 0.75, 0.76, 0.74 for BMI, WC, WHR respectively. For men, WHR had the highest AUC in this study while WC had the highest AUC in the EPIC-Potsdam study. In women, for type 2 diabetes, the AUC’s in this study were 0.74, 0.69, 0.74 which was lower than the AUC’s in the EPIC-Potsdam study, 0.80, 0.83, 0.81 for BMI, WC and WHR respectively. BMI and WHR had the highest AUC in this study while WC had the highest AUC in the EPIC-Potsdam study.

In the D.E.S.I.R. study, [14] for type 2 diabetes, in men, BMI had a higher AUC than WC or WHR (0.77 as against 0.74 and 0.66) while in women, WC had a higher AUC than BMI or WHR (0.82 as against 0.77 and 0.77). This differs also from this study which in men, WHR had a higher AUC than BMI or WC (0.87 as against 0.83 and 0.79) and in women, BMI and WHR had higher AUC’s than WC (0.74 as against 0.69) [Figure 1].

Thus while WC co-relates better and appears to be more sensitive than BMI or WHR in identifying type 2 diabetes in Caucasians, WHR co-relates better and probably more sensitive than BMI or WC in identifying type 2 diabetes in our study population. We observed that in our subjects while some had normal BMI and WC, such subjects may have abnormal WHR. This is reflected in the fact that Obesity was commonest using WHR in our study population. This was in agreement with the general observation that native Africans tend to have smaller physical frame than their Caucasian counterpart. This finding suggests that native Africans deposit fat differently from Caucasians whom appear to have larger waist circumference than Africans. Hoffman et al, found that Caucasians had a greater visceral adipose tissue mass and smaller subcutaneous adipose tissue mass compared with African-americans respectively [15]. Mechanisms to explain the racial difference in visceral adipose tissue content are lacking [15]. BMI performed least in its discriminative ability to identify DM in men but performed better than WC in women. BMI is unable to differentiate between fat mass and muscle mass and does not identify abdominal obesity which has been shown to correlate more strongly with obesity related health risks than peripheral obesity [16]. Some Nigerian studies also showed that BMI compared to other anthropometric indices performed poorly as an index of obesity among Nigerian adults with diabetes mellitus [17]. In our subjects with DM, body fat distribution represented by WHR was more sensitive than WC or BMI in identifying them. WHR may be a better measure of central obesity than WC in this population.

Conclusion

The results of our study contrasts with earlier studies in Caucasians with WHR predicting diabetes better than BMI and WC and also discriminated diabetic from nondiabetic subjects with higher accuracy in men. Since obesity, metabolic syndrome, diabetes and cardiovascular diseases are highly prevalent in our population, this results emphasize the application of WHR as an appropriate discriminative tool for identification of diabetes.

References

  • WHO Expert Committee on Diabetes Mellitus: second report (1980). World Health Organ Tech Rep Ser 646: 1-80. [crossref]
  • World Health Organization (1998) Obesity: Preventing and managing the Global Epidemic: Report of a WHO consultation on Obesity. Geneva, WHO.
  • National Institute of Health (1998): National Heart, Lung and Blood Institute. Clinical guidelines on the identification, evaluation, and treatment of overweight and obesity in adults – the evidence report. Obes Res 6 (Suppl.2): S51 – S209.
  • Klein S, Allison D, Heymsfield SB, Kelley DE, et al. (2007) Waist circumference and cardiometabolic risk. A consensus statement from shaping America’s Health: Association for Weight Management and Obesity Prevention: NAASO, the Obesity Society, the American Society for Nutrition; and the American Diabetes Association. Diabetes Care 30: 1647 – 1652.
  • Pouliot MC, Depes JP, Lemieux S (1994) Waist circumference and abdominal saggital diameter: Best simple anthropometric indices of abdominal visceral adipose tissue accumulation and related cardiovascular risk in men and women. AM J Cardiol 73: 460 – 468.
  • Kissebah AH, Vydelingum N, Murray R, Evans DJ, Hartz AJ, et al. (1982) Relation of body fat distribution to metabolic complications of obesity. J Clin Endocrinol Metab 54: 254-260. [crossref]
  • Wang Y Rimm EB, Stampfer MJ, Willett WC, Hu FB (2005) Comparison of abdominal adiposity and overall obesity in predicting risk of type 2 diabetes among men. Am J Clin Nutr 81: 555-563. [crossref]
  • Alberti KG, Zimmet P, Shaw J; IDF Epidemiology Task Force Consensus Group (2005) The metabolic syndrome–a new worldwide definition. Lancet 366: 1059-1062. [crossref]
  • Alberti KG, Zimmet P, Shaw J (2006) Metabolic Syndrome-a new worldwide definition. A Consensus Statement from the International Diabetes Federation. Diabet Med 3: 469-480.
  • World Health Organisation (2008) WHO STEPwise approach to chronic disease risk factor surveillance- Instrument version 2.0, Questionnaire file. Department of Chronic Diseases and Health promotion.
  • Wei M, Gaskill SP, Haffner SM, Stern MP (1997) Waist circumference as the best predictor of Noninsulin dependent diabetes mellitus (NIDDM) compared to body mass index, waist hip ratio and other anthropometric measurements in Mexican Americans- a 7-year prospective study. Obes Res 5: 16-23.
  • Falkenberg M (2001) Check your waist circumference! Overweight, obesity and abdominal obesity risk factors of type 2 diabetes. Lakartidningen 98: 3520- 3522.
  • Schuleze SB, Heidemann C, Schienkiewitz A, Bergmann MM, Hoffmann K, Boeing H (2006) Comparison of Anthropometric characteristics in predicting the incidence of Type 2 Diabetes in the EPIC – Potsdam study. Diabetes care 29: 1921 – 1923.
  • Balkau B, Sapinho D, Petrella A, Mhamdi L, Cailleau M, Arondel D, et al. (2006) and the D.E.S.I.R. Study group: Prescreening tools for diabetes and obesity-associated dyslipidemia: Comparing BMI, Waist and WHR. The D.E.S.I.R Study. Eur J Clin Nutri 60: 295 – 304.
  • Hoffman DJ, Wang Z, Gallagher D, Heymsfield SB (2005) Comparison of visceral adipose tissue mass in adult African Americans and whites. Obes Res 13: 66-74. [crossref]
  • Kahn SE, Prigeon RL, Schwartz RS, Fujimoto WY, Knopp RH, et al. (2001) Obesity, body fat distribution, insulin sensitivity and Islet beta-cell function as explanations for metabolic diversity. J Nutr 131: 354S-60S. [crossref]
  • Okubadejo N, Fasanmade A (2004) Concomitant hypertension and type 2 diabetes mellitus in Nigerians: Prevalence of obesity and its indices compared to normotensive diabetics. Niger Med J 45:79-83.

Low-Dose Molecular Breast Imaging Using Tc-99m Sestamibi: The Impact of Isotope Decay, Tracer Washout and Body Habitus on Image Count Density

DOI: 10.31038/CST.2017224

Abstract

Aim: The aim of this study was to examine the factors influencing count density in low-dose molecular breast imaging and their impact on image quality.

Methods: One hundred patients scheduled for a diagnostic MBI procedure were imaged using a commercially available MBI system following the SNM Practice Guideline for Breast Scintigraphy, with one modification. Each 20 mCi (740 MBq) diagnostic dose of Tc-99m sestamibi was separated into two syringes, with each containing 10 mCi (370 MBq) or with one containing 5 mCi (185 MBq) and the other containing 15 mCi (555 MBq). Patients were randomly injected with 5 mCi, 10 mCi, or 15 mCi and imaged bilaterally in the craniocaudal (CC) view. The remaining fraction of the 20 mCi was then injected, followed by a standard four-view study.

Results: The two sets of CC view images were analyzed to determine the average count density for a given acquisition time and injected activity, after application of an effective half-life correction factor to account for the time-related combined effect of radioactive decay and cellular washout. The average count density of the MBI images was reduced by radiopharmaceutical decay and washout and imaging time should be adjusted accordingly in low dose imaging.

Conclusions : It was observed that the patient weight was one physical characteristic that should be considered for optimal image quality, with the dose increasing in proportion to the patient weight.

Keywords:

Breast Cancer, Breast Specific Gamma Imaging, Molecular Breast Imaging, Low Dose Imaging, Dense Breasts

Introduction

Imaging procedures can be classified into two groups: screening exams and diagnostic exams. The term “screening” is applied to imaging examinations performed on patients without signs or symptoms of disease while “diagnostic” examinations are conducted in response to clinical signs and symptoms present in a particular patient. The majority of medical imaging procedures are performed as diagnostic examinations, however the use of imaging to screen for disease, as is the case in mammography, has significantly increased in recent decades [1]. Mammography does have limitations in its ability to detect breast cancer in women with dense breast tissue [3]. The use of breast MRI has been proposed as an alternative screening examination [4]. Due to the high cost per procedure, its use continues to be limited to high-risk screening populations for whom costeffectiveness has been established [5]. Studies have suggested wholebreast ultrasound as a means to improve cancer detection in patients with dense breast and as a screening examination in women with high risk. Because of its low positive-predictive value and lower sensitivity than MRI, its use has not been broadly accepted [6].

There has been significant interest in the use of nuclear medicine imaging to detect breast malignancies [7, 8] with numerous peerreviewed published articles examining various aspects of its use. Molecular breast imaging (MBI), is a relatively new method for breast cancer detection employing gamma cameras specifically designed to image the breast, primarily using the radiotracer Tc-99m sestamibi [9, 10]. These studies indicate that its sensitivity for the detection of breast malignancies, especially in dense breasts, is comparable to that of MRI and is much higher than that of mammography and ultrasound. The primary limitation to this effort has been the radiation dose to patients (6.7 mSv from the 20 mCi of Tc-99m sestamibi). This dose is acceptable in a diagnostic population where the likelihood of malignancy is significantly higher. However, dose reductions should be achieved if it is to be used for screening; an effort that is being investigated [11]. The purpose of this prospective trial was to evaluate the hypothesis that the count density of MBI breast images scales linearly with the administered dose and to examine patient characteristics that influence the count density when performing low-dose MBI studies to maintain sufficient image quality.

Materials and methods

Study Design

A total of 100 patients scheduled for a routine diagnostic MBI procedure were invited to participate in the prospective dosereduction protocol. The study has been approved by the institutional review board and all subjects signed an informed consent form. Patients enrolling were imaged using a commercially available MBI system (Dilon Technologies, Newport News, Virginia) and imaging was conducted following the SNM Practice Guideline for Breast Scintigraphy with one modification [12]. Each 20 mCi diagnostic dose was separated into 2 syringes containing either two 10 mCi doses or a 5 and a 15 mCi dose. Patients were randomized into initially receiving doses of 5, 10 or 15 mCi, followed by bilateral craniocaudal (CC) acquisitions of 10 minutes. The remaining fraction of the full 20 mCi dose was then delivered and a normal 4-view imaging procedure consisting of bilateral CC and mediolateral oblique (MLO) images was conducted with an acquisition time of 10 minutes for each view. This protocol allowed for a direct comparison between low-dose and normal-dose CC images for each breast of each patient.

Prior to each injection, the activity in each syringe was measured in a dose calibrator. The activity of each dose, the time of each injection and the time between injections were recorded. For the last 60 patients (patients 41-100) the activity remaining in the syringe after the injection was also measured. The patients were typically injected in the arm contralateral to the side of clinical concern, if any, and imaging was performed on the suspicious breast first. Imaging was typically initiated about 10 minutes after injection of the radiopharmaceutical.

Image Analysis

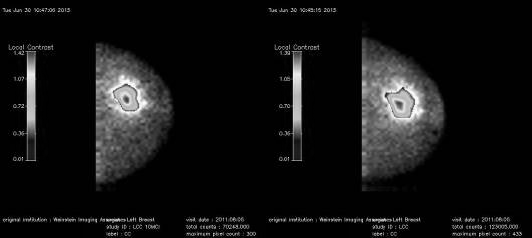
A region-of-interest (ROI) encompassing the breast was drawn on each low-dose and normal-dose image. The total counts and the number of pixels in the ROI were recorded. The average count/pixel was determined and that value was divided by the pixel area (0.1024 cm2/pixel) to determine the average count density (in counts/cm2). Most images were taken for a total of 10 minutes (600 seconds). For images taken for times other than the nominal 10 minutes, the average count density was normalized to a 10-minute acquisition for comparison purposes. The low-dose photon density was compared to the normal-dose photon density for each patient, with each patient serving as her own control. An example set of images showing the region-of-interest and the corresponding average count/pixel value for both the low-dose and normal-dose images is shown in Figure 1.

Figure1. Examples of breast images taken at a low dose and at the normal dose showing the regions used to determine the average count density in each.  The total counts in the region and the number of pixels in the region were used to calculate the average count/pixel value.

Figure 1. Examples of breast images taken at a low dose and at the normal dose showing the regions used to determine the average count density in each. The total counts in the region and the number of pixels in the region were used to calculate the average count/pixel value.

A dose-normalized count density (counts/cm2/mCi) was calculated for the images by dividing the count density by the injected dose. The injected dose was determined by a measurement of the activity immediately before the injection and in some cases that dose was reduced by a measurement of the dose remaining in the syringe after the injection. Only the last 60 patients had post-injection measurements taken. The injected dose for the normal-dose image was the sum of the injected dose for the low-dose image plus the injected dose from the remaining fraction of the full 20 mCi dose.

Six images were typically recorded for each patient; two at low dose (left and right CC) and four at the normal dose (bilateral CC and MLO). The relationship between the count density in the image and the injected dose, which is typically assumed in nuclear medicine and fundamental to any effort to lower the radiation dose to the patient, was explored using two comparisons. First, the ratio of the count density in the low-dose image to the count density in the normaldose image was compared with the ratio of the measured injected low dose to the measured injected normal dose. Second, the ratio of the count density to the measured injected dose (dose normalized count density) was compared for the low dose and normal dose cases. In each case the comparison was done on a patient-by-patient basis such that each normal-dose image could serve as a control for the low-dose image (Figure 2).

Figure 2.  Examples of breast images taken at a low dose and at the normal dose showing the area where the local contrast was calculated.  The algorithm calculates the average counts in the breast and then highlights the pixels in areas where this average value is exceeded and calculates the contrast.

Figure 2. Examples of breast images taken at a low dose and at the normal dose showing the area where the local contrast was calculated. The algorithm calculates the average counts in the breast and then highlights the pixels in areas where this average value is exceeded and calculates the contrast.

Dose Corrections

To account for known time-related changes to the injected dose due to both physical effects (radioactive half-life) and physiological effects (radiotracer washout), radioactive decay and tissue washout corrections must be applied to determine the actual activity of tracer remaining in the breast tissue at the time of imaging. The decay correction is based on the well-known half-life of Tc-99m (361.2 minutes):

Decay Correction = D × 0.8909^T

where T = time in hours and D = Dose

The washout correction is based on modeling of Sestamibi washout from breast tissue as measured in previously published literature [13], assuming a half-life of Sestamibi in the breast tissue of 3 hours:

Washout Correction = D × exp(-T/3)

When used together, these corrections permit the direct comparison of images take at various time points.

Results

Dose Measurements

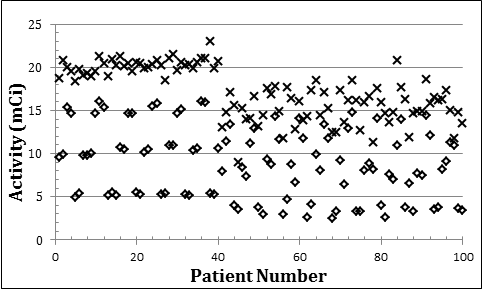
One hundred patients were enrolled in the study. The activity in the syringe prior to injection of the patient was recorded for both portions of the divided dose. The protocol was modified after the first 40 patients, to record the dose remaining in the syringe after each injection. This remaining dose was subtracted from the dose measured in the syringe prior to the injection to determine the actual injected dose. The total dose administered to the 100 patients is shown in the graph in Figure 3, for both the first 40 patients where no postinjection measurement was made and the last 60 patients where the dose remaining in the syringes was subtracted from the pre-injection dose. For the last 60 patients, the average actual dose injected for the 5 mCi, 10 mCi, and 15 mCi low dose groups was 3.4 mCi (SD=.5 mCi), 8.2 mCi (SD=1.1 mCi), and 12.5 mCi (SD=1.6 mCi), respectively. The average actual total dose injected for all groups in the last 60 patients was 15.3 mCi (SD=2.1 mCi). The percentage of the dose administered to the various dose groups was: 66% (SD= 10%) for the 5 mCi group, 78% (SD=9%) for the 10 mCi group, 80% (SD=9%) for the 15 mCi group and 74% (SD = 9%) for the normal-dose (20 mCi) group. These results indicated that the dose remaining in the syringe after the injection was a significant fraction of the initial dose prior to injection for this group of 60 patients and are consistent with previously reported values [14] where 20% (+- 8%) was retained in syringes of various types.

CST 2017-209_Fig3

Figure 3. Graph showing the dose administered to the patients. Diamonds indicate the low dose and crosses indicate the normal dose. For the first 40 patients, the dose remaining in the syringe was not recorded and therefore the initial dose measured in the syringe prior to the injection was used for these patients. For the last 60 patients, the dose remaining in the syringe was subtracted from the initial dose and the actual delivered dose was calculated.

Image Count Density

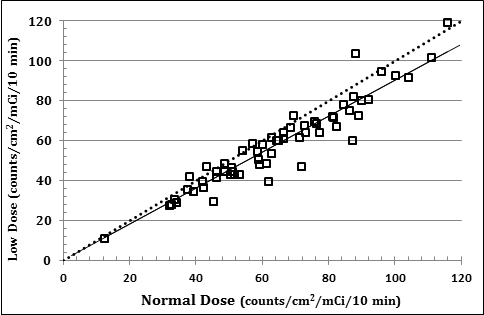
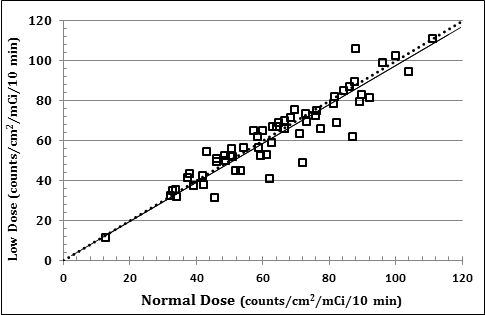
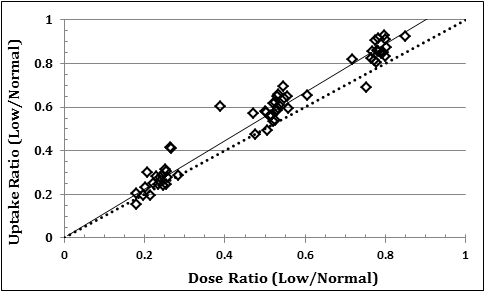
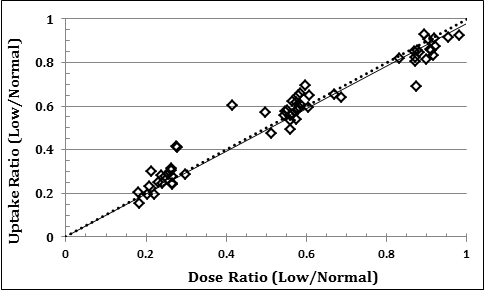
The count density for the low-dose and normal-dose images were determined for the right CC image for each patient as described earlier. The ratio of the low-dose and normal-dose count densities was then compared with the ratio of the doses. A plot of this relationship is shown in Figure 4a for the last 60 patients, for which post-injection measurements of the dose remaining in the syringe were made. The quantitative analysis was restricted to these patients with complete information. A linear fit to these results indicates a coefficient of 1.11 (R2=0.96), i.e. slightly higher than 1. This implies that as the dose is increased, there is an 11% larger increase in the uptake. This represents a result that is contrary to what is typically assumed in nuclear medicine imaging and warrants further study. As discussed previously, both physical and physiological corrections were used to adjust the injected low dose for that dose remaining at the time of the second dose. After applying the corrections discussed earlier, a linear coefficient of 0.98 (R2=0.94) was determined, significantly close to a coefficient of 1 (see Figure 4b).

Figure 4a

Figure 4a

Figure 4b

Figure 4b

Figure 4. Comparison of the dose normalized count density for the low dose and normal dose images. The results show the relationship a) before and b) after the normal dose was corrected for the decay of the isotope and washout of the radiopharmaceutical. The dashed line represents a slope of 1 and the solid line is a fit to the data (see text).

For the second comparison, the count density (as determined from the average counts per cm2 in the 10-minute breast image) was divided by the dose to determine the dose normalized count density (in counts/cm2/mCi). This value is independent of dose and should be the same for both the low-dose and normal dose-images, for any given patient. This relationship is shown in Figure 5a for the last 60 patients in the study. A linear fit to these data indicated a coefficient of 0.90 (R2 = 0.89). This deviation from a linear slope of 1 again indicates the fact that low-dose and high-dose injections give different count densities in the resulting images. After applying the corrections to the normal dose calculation, a linear coefficient of 0.98 (R2 = 0.87) is obtained for the same patient results (see Figure 5b).

Figure 5a

Figure 5a

Figure 5b

Figure 5b

Figure 5. Comparison of the ratio of the low and normal uptake to the ratio of the low and normal dose. The results show the relationship a) before and b) after the normal dose was corrected for the decay of the isotope and washout of the radiopharmaceutical. The dashed line represents a slope of 1 and the solid line is a fit to the data (see text).

Discussion

The data suggest that after correcting for the decay and washout of the radiopharmaceutical there is a linear relationship between the injected dose and the count density in the image.There was, however, a variation of uptake among patients given the approximate same doses. This can be seen in Figure 4b, where the average dose-normalized count density was 64.5 counts/cm2/ mCi, but with standard deviation of 21.5 counts/cm2/mCi. This represents a +- 33% variation in the uptake.

Various factors potentially have an influence upon this uptake, some related to patient metabolism and others to the clinical protocol used to administer the dose and perform the imaging. Recent papers have shown that patient fasting and peripheral warming increases the count density in the images and exercise causes a drop in count density in the images [15]. Another study indicated that menopausal status and postmenopausal hormone therapy increased the count density in the images [16] and there is a weak dependence of the count density on breast density and phase of the patient’s menstrual cycle when the imaging is performed [17]. These factors were not recorded as part of this study and potentially contributed to the wide variation in the measured photon density in the images.

CST 2017-209_Fig6

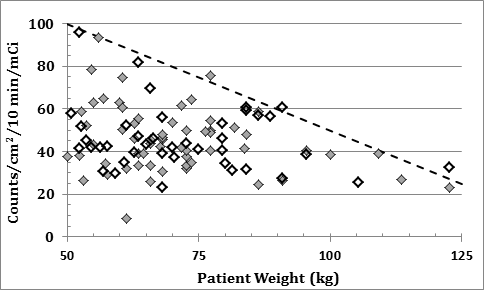
Figure 6. The dose normalized count density for various patients’ weights. The dose values for the first 40 patients (hollow diamonds) have been corrected for the dose remaining in the syringe after the injections, such that they can be compared to the last 60 patient (filled diamonds). The results indicate that there is an upper limit on the count density that decreases with patient weight which is shown by the dashed line in the graph.

The dose-normalized count density measured in the right MLO images versus patient weight for all patients in the study is shown in Figure 6.The count density measurements for the first 40 patients were reduced by 25%, which was the mean fraction of activity remaining in the syringe after injection for the last 60 patients for whom postinjection activity measurements were made. This was done to estimate the actual injected dose for those patients. Of particular note was the fact that there appeared to be an upper limit on the dose-normalized count density in the images, which decreased with patient weight. A line indicating this approximate upper limit has been included in the graph. The equation representing this line is given by:

Uptake (counts/cm2/mCi) = 150 – weight (kg)

This allows us to derive an equation that can be used to adjust the dose given to patients so that image quality can be maintained for heavier patients:

Weighted Dose = Base Dose * (100 / (150-Weight (kg) ) ) for [50< Weight < 125]

Conclusion

The relationship between the count density in the image and the injected dose is typically assumed in nuclear medicine and fundamental to any effort to lower the radiation dose to the patient. Quantitative measurements of the count density (counts/cm2) in gamma camera images of the breast acquired in 100 patients after two subsequent injections of Sestamibi confirm that there is a linear relationship between the image count density and the injected dose only after the decay of the isotope and washout of the agent were considered. This indicates that the decay of the isotope and the washout of the agent between the two injections have a measurable effect on quantitative measurements of the count density. The half-life of the Tc99m isotope is approximately 6 hours, which results in an 11% decrease in the activity over a typical 1-hour imaging sequence. The washout of the Sestamibi varies with the patients’ metabolism, but is typically more rapid than the decay of the isotope. A conservative estimate of 3 hours was used for the calculations in this study. This means that up to 20% of the Sestamibi could washout during a one-hour imaging sequence. In consideration of this decay and washout, the imaging time for each image in a sequence should be adjusted such that all the images in the sequence have approximately the same count density.

Also important in quantifying the actual dose delivered to the patient is a measurement of the dose remaining in the syringe after the injection. In the 60 patients for whom a post-injection measurement was made, an average of 25% of the initial measured dose remained in the syringe after the injection. Therefore, in a typical 20 mCi administered dose, only 15 mCi is actually received by the patient.

While a direct correlation between observed count density and patient weight was not observed, the appearance of an upper limit in the measured count density for a given weight was observed. This upper limit was described by the relationship:

Uptake (counts/cm2/mCi) = 150 – weight (kg)

Consideration of this relationship should dictate that the administered dose be increased as patient weight increases, so that a more constant count density can be achieved for all patient weights. Low-dose imaging can also be hampered by the fact that certain patients exhibit low uptake of tracer compared with other patients of the same weight. As previously discussed, this may be related to various metabolic or physiologic factors. A potential solution would be to adjust the acquisition time to achieve a standard count density in the image on a real-time basis during the acquisition. This requires monitoring the average pixel value during the acquisition and having the acquisition terminate based on that value.Alternatively, efforts have been made to increase the count density in the images by increasing the sensitivity of the MBI camera system through collimator design [18] or by using two detector heads, one on either side of the breast [19]. In this geometry, the reduction in spatial resolution with distance is compensated by the proximity of any area of interest to one of the two detectors [20]. Image combination method can also be used with a two-camera system to enhance the detectability of lesions either by enhancement of the signal to background [18].

An alternative to increase the performance of the molecular breast imaging procedure is to transition from two-dimensional imaging to three-dimensional imaging. Previously suggested concepts have shown increased performance for three-dimensional dedicated SPECT systems and quasi-three-dimensional tomosynthesis systems [21]. These systems have demonstrated superior performance but have yet to be widely implemented. A simple but elegant design that may gain acceptance is the concept of a variable-angle slanthole (VASH) collimator [22]. This type of concept could be easily retrofitted to existing MBI systems, could be used for molecular breast tomosynthesis (MBT), and be easily adapted to perform gammaguided biopsies. Analogous to the leap in diagnostic value seen by the recent transition from digital mammography to digital breast tomosynthesis, the transition from planar molecular breast imaging to 3-dimensional MBT may be a similarly important advancement in diagnosing cancers in the underserved population of high-risk women with dense breast tissue.

This study of 100 patients indicated that the average count density of the MBI images was reduced by radiopharmaceutical decay and washout and imaging time should be adjusted accordingly in low dose imaging. It was also observed that the patient weight was one physical characteristic that should be considered for optimal image quality, with the dose increasing in proportion to the patient weight.

Disclosures:

Benjamin Welch is an employee of Dilon Technologies and possess Dilon stock

Douglas Kieper is a previous employee of Dilon Technology and retains Dilon stock

Marcela Böhm-Vélez has nothing to disclose

Thomas Chang has nothing to disclose

Antoinette Cockroft has nothing to disclose

IRB statement:

This study has been approved by an institutional review board and all subjects signed an informed consent form.

References

  • Van Steen A, Van Tiggelen R (2007) Short history of mammography: a Belgian perspective. JBR-BTR 90: 151-153. [crossref]
  • Hendrick RE (2010) Radiation doses and cancer risks from breast imaging studies. Radiology 257: 246-253. [crossref]
  • Kolb TM, Lichy J, Newhouse JH (2002) Comparison of the performance of screening mammography, physical examination, and breast US and evaluation of factors that influence them: an analysis of 27,825 patient evaluations. Radiology 225: 165-175. [crossref]
  • Saslow D, Boetes C, Burke W, Harms S, Leach MO, et al. (2007) American Cancer Society guidelines for breast screening with MRI as an adjunct to mammography. CA Cancer J Clin 57: 75-89. [crossref]
  • Mainiero MB, Lourenco A, Mahoney MC, Newell MS, Bailey L, et al. (2013) ACR Appropriateness Criteria Breast Cancer Screening. J Am Coll Radiol 10: 11-14. [crossref]
  • Lee CH, Dershaw DD, Kopans D, et al. (2010) Breast cancer screening with imaging: recommendations from the Society of Breast Imaging and the ACR on the use of mammography, breast MRI, breast ultrasound, and other technologies for the detection of clinically occult breast cancer. J Am Coll Radiol 7:18-27.
  • Liberman M, Sampalis F, Mulder DS, Sampalis JS (2003) Breast cancer diagnosis by scintimammography: a meta-analysis and review of the literature. Breast Cancer Res Treat 80: 115-126. [crossref]
  • Sun Y, Wei W, Yang HW, Liu JL (2012) Clinical usefulness of breast-specific gamma imaging as an adjunct modality to mammography for diagnosis of breast cancer: a systemic review and meta-analysis. Eur J Nucl Med Mol Imaging Nov 14, 2012.
  • Rhodes DJ, Hruska CB, Phillips SW, Whaley DH, O’Connor MK (2011) Dedicated dual-head gamma imaging for breast cancer screening in women with mammographically dense breasts. Radiology 258:106-118.
  • Holbrook A, Newell MS (2015) Alternative Screening for Women with Dense Breasts: Breast Specific Gamma Imaging (Molecular Breast Imaging). AJR 204:252-256.
  • Mettler FA Jr, Huda W, Yoshizumi TT, Mahesh M (2008) Effective doses in radiology and diagnostic nuclear medicine: a catalog. Radiology 248: 254-263. [crossref]
  • Goldsmith SJ, Parsons W, Guiberteau MJ, Stern LH, Lanzkowsky L, et al. (2010) SNM practice guideline for breast scintigraphy with breast-specific gamma-cameras 1.0. J Nucl Med Technol 38: 219-224. [crossref]
  • Del Vecchio SD, Ciarmello A, Pace P, et al. (1997) Fractional retention of technetium-99m-sestamibi as an index of p-glycoprotein expression in untreated breast cancer patients. J Nucl Med 38: 1348-51.
  • Swanson TN, Troung DT, Paulsen A, Hruska CB, O’Conner MK (2013) Adsorption of Tc-99m sestamibi onto Plastic Syringes: Evaluation of Factors Affecting the Degree of Adsorption and Their Impact on Clinical Studies. J Nucl Med Technol 41: 247-252.
  • O’Connor MK, Hruska CB, Tran TD, Swanson T, Conners AL, et al. (2015) Factors influencing the uptake of 99mTc-sestamibi in breast tissue on molecular breast imaging. J Nucl Med Technol 43: 13-20. [crossref]
  • Hruska CB, Rhodes DJ, Conners AL, Jones K, Carter RE, et al. (2015) Background Parenchymal Uptake During Molecular Breast Imaging and Associated Clinical Factors. AJR 204: March 2015.
  • Hruska CB, Conners AL, Vachon CM, O’Connor MK, Shuster LT, et al. (2015) Effect of menstrual cycle phase on background parenchymal uptake at molecular breast imaging. Acad Radiol 22: 1147-1156. [crossref]
  • Keller EL (1968) Optimum dimensions of parallel-hole, multi-aperture collimators for gamma-ray cameras. J Nucl Med 9: 233-235. [crossref]
  • Kieper D, Majewski S, Welch B (2008) Method to improve cancerous lesion detection sensitivity in a dedicated dual-head scintimammography system.
  • Weinmann AL, Hruska CB, O’Connor MK (2009) Design of optimal collimation for dedicated molecular breast imaging systems. Med Phys 36: 845-856. [crossref]
  • Williams MB, Judy PG, Gunn S, Majewski S (2010) Dual-modality breast tomosynthesis. Radiology 255: 191-198. [crossref]
  • Gopan O, Gilland D, Weisenberger A, Kross B, Welch B (2014) Molecular Imaging of the Breast Using a Variable-Angle Slant Hole Collimator, IEEE Transactions on Nuclear Science 6: 1143-1152.

Synthesis and Evaluation of Novel Hydroxamic Acid Based Histone Deacetylase Inhibitors as Anti-Cancer Agents

DOI: 10.31038/CST.2017223

Abstract

Background: HDAC inhibition is known to modulate expression of tumour suppressor genes and induce cell differentiation, growth arrest and apoptosis. The aim of this study was to evaluate the efficacy of a novel series of hydroxamic acid based HDAC inhibitors in cell based assays and tumour xenograft models.

Material and Methods: A series of novel hydroxamate derivatives were synthesized and evaluated. HDAC enzyme inhibitory activity was measured using Hela nuclear extracts. Anti-proliferative activity was assessed in a panel of cancer cell lines. Anti-apoptotic activity was evaluated by caspase-3 activation. In vivo efficacy was evaluated in lung adenocarcinoma xenograft model.

Results: The compounds showed potent HDAC inhibitory activity and anti-proliferative activity in several cancer cell lines. In an in vivo A549 lung xenograft model, the compounds exhibited significant tumor growth inhibition.

Conclusion: The novel HDAC inhibitors showed anti-proliferative activity against several human cancer cell lines and also anti-tumor activity in a Mouse xenograft model.

Keywords:

Histone deacetylation, HDAC inhibitor, Vorinostat

Introduction

Histone acetylation/deacetylation is mediated by a class of enzymes known as Histone acetyl transferase (HATs) and histone deactylases (HDACs). HDACs (histone deacetylases) are important enzymes in the regulation of gene expression in eukaryotic cells [1]. HDACs are key enzymes involved in the regulation of histone and non-histone proteins [2]. Increased levels of HDACs in tumor cells are known to be closely associated with tumor initiation, progression and metastasis [3-4]. Inhibition of Histone deacetylases is known to play an important role in epigenetic regulation by inducing cell death, apoptosis, and cell cycle arrest in cancer cells.

Histone deacetylase (HDAC) inhibitors are a diverse group of small molecule drugs that induce a broad range of effects on cancer cells, including cell cycle arrest, apoptosis, cell differentiation, autophagy and anti-angiogenic effects [5]. Histone deacetylase inhibitors (HDACi) have emerged as a class of therapeutic agents that induce tumor cell cytostasis, differentiation and apoptosis in various hematologic and solid malignancies [6-7]. These drugs inhibit HDAC, and several of them have been developed as anti-cancer agents as they have a significant effect specifically on tumor-cell proliferation compared to non-malignant cells.

HDACs inhibitors can be divided into four major structural classes: (1) small molecular weight carboxylates; (2) hydroxamic acids; (3) benzamides; and (4) cyclic peptides [8-9]. Vorinostat (Zolinza) and Romidepsin (Istodax) are the only HDACs inhibitors currently approved by the U.S. Food and Drug Administration (FDA) for the treatment of refractory cutaneous T-cell lymphoma (CTCL) [10-11].

Most of the HDAC inhibitors that have entered clinical trials have limitations, including low bioavailability, low potency, cardiovascular safety issues, and potential for drug-drug interactions through cytochrome P450 inhibition [12]. Therefore, there is still a clinical opportunity for novel, orally available efficacious HDAC inhibitors with a wider safety margin. HDAC inhibitors exhibit anti-proliferative activity in both in vitro and in vivo pre-clinical models of cancer, with many of them being evaluated as anticancer therapeutics in the clinic. However, keeping in mind the poor bioavailability and efficacy in solid tumors, there still remains an unmet medical need to discover newer HDAC inhibitors derived from novel structural classes of compounds.

In the present paper, we report the identification of novel hydroxamic acid based small-molecule HDAC inhibitors by mediumthroughput screening of a compound library using a fluorescence based assay with Hela Nuclear extracts as the enzyme source. A focused library of about 100 compounds was designed and synthesized, among which several compounds showed equivalent or higher potencies against HDAC as compared to Vorinostat. The hit compounds from the primary screening were evaluated for their effects on cellular proliferation in a panel of human cancer cell lines. We identified four compounds which showed a potent GI50 in the low micromolar range. Several of these novel HDAC inhibitors could be promising new lead structures for further development as improved anticancer drugs. In conclusion, the screening of a library of compounds for HDAC inhibitory activity and anti-proliferative effect in cancer cells has identified several promising new leads for further development.

Materials and methods:

Synthesis of HDAC inhibitors

The compound library was obtained from the Medicinal chemistry department at Anthem Biosciences.

Based on general formula 1, about 100 hydroxamic acid derivatives were designed and synthesized.

General formula I

General formula I

These compounds were synthesized as described in below synthetic scheme 1.

Scheme 1

Scheme 1

Reactions of the compound 1 with sodium azide in dimethylformamide at 40 oC resulted compound 2. Then the compound 3 was synthesized by standard click chemistry by reacting the compound 2 with appropriate alkyne in the presence of copper iodide and Hunig’s base in dimethylformamide [13]. Reaction of the compound 3 with hydroxyl amine in the presence of suitable bases such as sodium methoxide in methanol yielded the compounds of general formula I.

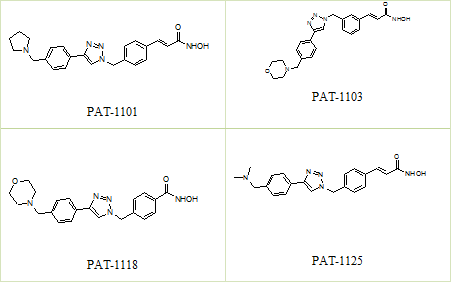
Out of nearly 100 compounds synthesized, 4 compounds i.e. PAT-1101, PAT-1103, PAT-1118 and PAT-1125 were identified as hit molecules from the primary screening. Suitable salts of the four compounds were prepared to improve their drug like properties.

Preparation of Hela Nuclear extracts:

Nuclear fractions prepared from Hela cells as per established protocols were used as a source of HDAC enzyme. Hela cells obtained from ATCC were cultured in complete growth medium containing 10% fetal bovine serum supplemented with antibiotics. Subconfluent cells were harvested and washed in phosphate buffered saline (PBS). 1×10⁷ cells were resuspended in 1 mL of cold lysis buffer containing 10 mM Tris HCl (pH 7.5), 10 mM NaCl, 15 mM MgCl2, 250 mM Sucrose, 0.1 mM EGTA and 0.5% NP-40. The cell lysate was then maintained on ice for 15 min. To the lysate, 4 mL of Sucrose buffer containing 30% sucrose, 10 mM Tris HCl (pH 7.5), 10 mM NaCl and 3 mM MgCl2 was added and the resultant mixture was centrifuged at 1500 rpm for 10 min at 4 deg C. The resultant pellet was resuspended in 1 mL of Tris-HCl buffer (10 mM Tris-HCl, pH 7.5, 10 mM NaCl) and recentrifuged at 1500 rpm for 10 min at 4 deg C. The resultant supernatant was discarded and the isolated nuclei was resuspended in 100 µL of cold extraction buffer containing 50 mM HEPES pH 7.5, 420 mM NaCl, 5 mM EDTA, 1mM EGTA, and 10% glycerol. The solution was sonicated for 30 sec and incubated on ice for 30 min following which it was centrifuged at 10000 rpm for 10 min at 4 deg C. The supernatant was collected and used as the enzyme source for HDAC assay.

In vitro HDAC inhibition Assay:

HDAC inhibition assay was performed using a fluorescence based assay with a fluorescent substrate (Boc-Lys (Ac)-AMC Substrate) as reported previously [14-15]. Stock solutions of the compounds were prepared in 100% DMSO. 3 µg of the nuclear extracts was preincubated with the compounds for 10 min at 30 deg C. The substrate was diluted in 50 µL of assay buffer (25 mM Tris HCl pH 8.0, 137 mM NaCl, 2.7 mM KCl, 1mM MgCl2) and added to a 96-well plate. The plate was incubated for a further 45 min at 30 deg C. The reaction was terminated by the addition of 50 µL of developer and incubated for 15 min at 30 deg C. The fluorescent deacetylated substrate was detected at lexc of 340/40 and lemi of 460/40 using a Microplate Reader (BioTek Instrument Inc.). The fluorescent signal was compared with the DMSO treated wells and the percentage inhibition was determined. IC50 (50% HDAC inhibitory concentration) was determined by testing in a wide concentration range of 0.001, 0.01, 0.1, 1 and 10μM.

Cell proliferation assays:

Anti-proliferative activity of the compounds was tested against a panel of cancer cell lines including Lung, Cervix, Colon, Brain, Renal, Leukemia, Prostate, Pancreas, Skin, Bone, Breast, Ovary cancer by using a standard MTT assay. Human cancer cell lines (American Type Culture Collection) were cultured in complete media containing 10% heat inactivated fetal bovine serum and 100 U/ml Penicillin, 100 µg/ml Streptomycin in a 37°C, 5% CO2 humidified incubator and passaged twice weekly. Cells were seeded in 96-well plates at a density of 3X10³ cells per well in 100 µL and were allowed to attach for 24 h. Stock concentrations of the compounds were made in DMSO. 100 µL of media containing various concentrations of compounds (1, 10 and 100 µM) were added to the cells and were incubated for 48 hours. Vorinostat was tested as a reference compound in the assay. On the day of termination, 50 µL of MTT (3-(4,5-dimethylthiazol- 2-yl)-2,5-diphenyl-2H-tetrazolium bromide) (Sigma, St Louis, MO, USA) solution (5mg/mL) was added to the medium and the cells were incubated for 3 hours. The medium was then aspirated and 100% DMSO was added to solubilize the violet MTT-formazan product. The absorbance at 570 nm was measured on a 96-well plate reader by spectrophotometry (Biotek Synergy HT). Assays were performed in duplicates for each concentration. Results are expressed as percentage of growth inhibition with respect to the DMSO treated control wells. A dose response curve was generated and GI50 values were interpolated from the growth curves using GraphPad Prism software.

Apoptosis assay (Caspase-3 activation):

Caspase-3 activity was measured in HT-29 cells using a commercially available kit (Sigma- Aldrich). Briefly, HT-29 cells were cultured in McCoy’s 5a medium containing 10% FCS and antibiotics. On the day of the study 10,000 cells were seeded into each well of a 96 well plate and incubated for 12-16 h. The compounds were added at concentrations ranging from 0.1 µM to 30 µM and incubated for 48 h. The cells were then lysed in lysis buffer and the lysates were used to perform the assay according to the manufacturer’s instruction. The assay is based on the hydrolysis of acetyl Asp-Glu-Val-Asp 7-amido- 4-methylcoumarin (Ac-DEVD-AMC) by caspase 3, resulting in the release of the fluorescent 7-amino-4-methylcoumarin (AMC) which is measured at an excitation and emission wavelength of 360 nm and 460 nm respectively.

In vivo anti-tumor activity in A549 lung adenocarcinoma xenograft model:

All experimental procedures involving animals were approved by the Institutional Animal Ethics Committee of Anthem Biosciences. In vivo anti-tumor activity of the HDAC inhibitors was assessed in 6 week old Athymic Nude mice. Animals were purchased from Harlan Laboratories, Indianapolis IN (presently Envigo) and housed in individually ventilated cages under controlled conditions and maintained on a 12-h light/12-h dark cycle, with food and water supplied ad libitum. A549 (lung adenocarcinoma) obtained from ATCC were cultured in RPMI-1640 growth medium containing 10% FBS and antibiotics. Sub-confluent monolayers were harvested and a cell suspension of >90% viability was prepared in 1X HBSS, pH 7.4 (Hank’s Balanced Salts Solution, Sigma) and mixed with an equal volume (1: 1) of ice cold Matrigel® (Corning Life Sciences). 0.1 mL of the cell suspension containing 1×10⁶ cells was injected into the flank region of the animals under isoflurane anesthesia. Animals were monitored daily during the period between inoculation and palpable tumor growth. Tumor volume was calculated using the formula, Tumor volume = (length × width2)/2. Tumor bearing mice were randomized into control and treatment groups (n=8) when the tumor volume reached ~100 mm3. The compounds were formulated in a vehicle containing 0.5% Carboxy methyl cellulose and 0.1% Tween 80 in water and administered by oral gavage to tumor bearing mice once daily for 21 days. The compounds were tested at 150 mg/kg. The Control group received the vehicle alone. Clinical signs were observed daily and tumor volume and was body weight was measured twice weekly during the study.

Data Analysis:

The terminal tumor volumes from in vivo xenograft studies were subjected to one-way ANOVA analysis followed by Dunnett’s test when there were multiple treatment groups. Results were considered statistically significant when P < 0.05.

Results

HDAC enzyme inhibition:

The biological activity of the HDAC inhibitors was assessed in vitro using a cell free HDAC enzymatic assay. Several compounds exhibited potent HDAC-inhibitory activity with IC50 values of in the nanomolar range (Table 1). Our results indicate that the in vitro HDAC inhibition potency is higher than the reference compound Vorinostat (Figure 1).

Table I. Characterization of hit compounds

Compound M. Wt. (g/mol) Molecular

Formula

HDAC IC50 (nM)
PAT-1101 403.49 C23H25N5O2.HCl 4
PAT-1103 419.49 C23H25N5O3.HCl 1
PAT-1118 393.45 C21H23N5O3.HCl 23
PAT-1125 377.45 C21H23N5O2.HCl 4
Vorinostat 264.32 C14 H20 N2 O3 78

HDAC inhibitory activity of synthesized compounds was measured using Hela cell nuclear extract as the enzyme source by a fluorescence based assay as described under the Materials and Methods section. IC50 was calculated from concentration versus percentage inhibition plotted using Graph Pad Prism software.

Figure 1. Structures of compounds

Figure 1. Structures of compounds

Anti-proliferative activity in cancer cells:

The growth-inhibitory activity of 4 compounds identified through the primary HDAC inhibitory screening was assessed in vitro in a panel of Human cancer cell lines. Cells were treated with the HDAC inhibitors at various concentrations and GI50 was determined. All the 4 compounds identified resulted in a dose-dependent inhibition of cellular proliferation at low micro molar concentrations in most of the cell lines tested (Table 2). The inhibitory effect of PAT-1101, PAT- 1103, PAT-1118, PAT-1125 on the proliferation of cancer cells was comparable or superior to that of Vorinostat against several cell lines under our experimental conditions.

Table 2. Anti-proliferative activity of hit compounds expressed as Mean Growth inhibitory concentration (GI50 in µM) in a panel of cancer cell lines

Tissue Cell line Growth inhibition: GI50 concentration (µM)
PAT-1101 PAT-1103 PAT-1118 PAT-1125 Vorinostat
Colon


Colo-205 0.31 ± 0.06 0.2 ± 0.03 0.3 ± 0.071 0.4 ± 0.04 1.6 ± 0.1
HCT-116 0.10 ± 0.11 0.2 ± 0.05 1.2 ± 0.018 0.2 ± 0.04 2.2 ± 0.0
HT-29 0.15 ± 0.13 0.4 ± 0.13 1.5 ± 0.65 2.1 ± 0.46 3.6 ± 2.6
Lung A549 1.58 ± 1.1 2.0 ± 1.52 4.5 ± 2.33 2.2 ± 2.22 5.9 ± 2.4
NCI-H23 0.52 ± 0.04 0.4 ± 0.09 2.3 ± 1.14 0.5 ± 0.24 3.2 ± 1.0
NCI-H460 0.3 ± 0.04 0.45 ± 0.28 2.4 ± 0.85 1.9 ± 0.74 4.4 ± 1.4
Prostate DU-145 0.079 ± 0.04 0.1 ± 0.03 0.3 ± 0.124 0.1 ± 0.04 1.3 ± 0.0
PC-3 3.5 ± 2.7 1.7 ± 1.02 13.4 ± 3.3 4.8 ± 1.4 8.3 ± 0.6
Ovary SK-OV-3 0.04 ± 0.016 0.5 ± 1.2 1.8 ± 0.20 1.7 ± 0.16 4.4 ± 1.5
PA-1 0.08 ± 0.04 0.04 ± 0.01 0.2 ± 0.037 0.1 ± 0.01 0.3 ± 0.05
Cervix Ca Ski 0.42 ± 0.15 0.4 ± 0.28 1.2 ± 0.22 1.1 ± 0.73 6.0 ± 5.3
Hela-229 1.0 ± 0.27 0.6 ± 0.38 1.4 ± 0.26 0.7 ± 0.47 4.7 ± 3.2
Hela-S3 0.23 ± 0.12 0.2 ± 0.02 0.6 ± 0.16 0.2 ± 0.08 2.9 ± 0.5
Brain IMR-32 0.25 ± 0.07 0.2 ± 0.02 0.9 ± 0.201 0.2 ± 0.04 1.8 ± 0.2
U-87-MG 0.76 ± 0.66 1.1 ± 0.73 2.7 ± 0.74 1.0 ± 0.33 6.7 ± 1.1
SH-SY-5Y 0.34 ± 0.033 0.2 ± 0.03 0.2 ± 0.06 0.1 ± 0.0 0.8 ± 0.4
Breast MCF-7 3.5 ± 2.6 2.1 ± 2.63 5.7 ± 1.62 5.5 ± 1.2 5.5 ± 1.2
Renal ACHN 0.09 ± 0.02 0.2 ± 0.08 0.7 ± 0.11 0.1 ± 0.04 1.6 ± 0.5
786-O 2.65 ± 0.08 1.5 ± 0.70 2.5 ± 1.01 2.0 ± 1.1 4.4 ± 2.0
Leukemia RPMI-8226 0.15 ± 0.05 0.2 ± 0.25 0.5 ± 0.43 0.3 ± 0.16 2.2 ± 2.3
K562 0.19 ± 0.05 0.2 ± 0.08 0.3 ± 0.074 0.2 ± 0.04 2.2 ± 0.7
Pancreas PANC-1 1.03 4 6.6 1.4 21.9
Skin A431 0.28 ± 0.05 0.2 ± 0.03 1.2 ± 0.533 0.4 ± 0.08 1.9 ± 1.0
Bone KHOS 11.7 ± 1.1 4.6 ± 0.55 2.8 ± 0.36 10.3 ± 3.26 29.3 ± 7.2

Anti-proliferative effect of the compounds in a panel of cancer cell lines obtained from ATCC using MTT reagent as described under Materials and Methods. Results are represented as GI50 or the concentration of the compound which inhibits 50% of cell growth. GI50 was calculated using GraphPad Prism software. The Mean GI50 was derived from individual assays performed in triplicates

Induction of Apoptosis in Human Cancer Cells:

We further investigated the compounds’ ability to induce apoptosis in cancer cells and to determine if the apoptosis was caspase dependent. In this regard, compound induced Caspase-3 activation in HT-29 cells was measured using a fluorescence based assay. The compounds significantly activated caspase-3 enzyme with an EC50 which was similar to that of Vorinostat (Table 3).

Table 3.Caspase-3 activation assay

Compound EC50 (µM)
PAT-1101 6.59
PAT-1103 3.62
PAT-1118 1.50
PAT-1125 4.09
Vorinostat 4.52

Anti-tumor Activity in Human Tumor Xenograft Models:

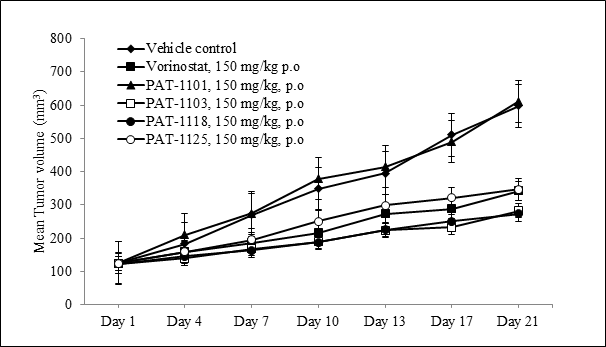
To assess the tumor growth inhibitory activity of the HDAC inhibitors in vivo, we evaluated their effect in a subcutaneous human xenograft model in Athymic Nude mice. The anti-tumor efficacy was evaluated in mice engrafted with A549 lung adenocarcinoma cells. Once daily oral administration of PAT-1103, PAT-1118 and PAT-1125 resulted in a significant tumor growth inhibition (TGI) after 21 days (Figure 2). The tumor growth inhibition (TGI) achieved as a result of treatment was between 67 and 69% at 150 mg/Kg dose. The efficacy was superior to that of Vorinostat which produced 54% tumor growth inhibition at the same dose (Table 4). Furthermore, there were no adverse clinical signs and no significant reduction in body weight in the treated mice compared to the vehicle control group.

Figure 2. Anti-tumor efficacy of HDAC inhibitors in A549 lung tumor xenograft

Figure 2. Anti-tumor efficacy of HDAC inhibitors in A549 lung tumor xenograft
Tumor growth kinetics in Nude mice subcutaneously implanted with 1×10⁶ A549 cells and treated with HDAC inhibitors or Vorinostat at 150 mg/kg, p.o,( n=8 in each group) once daily for 21 days.

Table 4.Tumor growth Inhibition (TGI) in subcutaneous A549 lung tumor xenograft models established in Nude mice

Compound Dose (mg/Kg, p.o) Mean Tumor volume (mm3)  on Day 21 % TGI
Control (Vehicle) 0 598.5 ± 72.9
PAT-1101 150 611.8 ± 125.4 3
PAT-1103 150 282.0 ± 34.7** 68
PAT-1118 150 272.4 ± 42.8** 67
PAT-1125 150 346.4 ± 67.9** 69
Vorinostat 150 342.10 ± 42.80* 54

TGI: Tumor growth inhibition was calculated with respect to the Vehicle treated Control group on Day 21. *P<0.05, **P<0.001, One way ANOVA followed by Dunnett’s test compared to Control

Discussion

We have synthesized and identified a series of hydroxamic acid derivatives designed to inhibit HDAC resulting in anti-cancer activity. In vitro mechanism of action studies demonstrate that the compounds are able to inhibit HDAC with nanomolar potency and activate apoptosis pathways such as caspaze-3 enzyme activation and cause cell death in a wide range of cancer cell lines. Four compounds PAT-1101, PAT-1103, PAT-1118 and PAT-1125 that were identified from the primary screening were tested against a panel of cancer cell lines. All the compounds exhibited anti-proliferative activity against the cancer cell types, with greater or similar potency than that of leading HDAC inhibitors in development. The compounds being novel HDAC inhibitors with good cytotoxic activity against a variety of Human tumor cell lines. Studies to evaluate the drug-likeness of the compounds such as pharmacokinetic profiling and in vivo safety studies would help in developing them as anti-cancer drugs. Improved bioavailability and safety profile of these compounds would help in determining their potential to be more effective in clinical trials than other HDAC inhibitors with poor pharmacokinetic properties and dose limiting side effects.

Acknowledgements

The Authors sincerely thank the management of Anthem Biosciences for their constant support and encouragement in carrying out this study.

Conflict of interest: None

References

  • Hildmann C, Riester D, Schwienhorst A (2007) Histone deacetylases–an important class of cellular regulators with a variety of functions. Appl Microbiol Biotechnol 75: 487-497. [crossref]
  • Witt O, Deubzer HE, Milde T, Oehme I (2009) HDAC family: What are the cancer relevant targets? Cancer Lett 277: 8-21. [crossref]
  • Haberland M, Johnson A, Mokalled MH, Montgomery RL, Olson EN (2009) Genetic dissection of histone deacetylase requirement in tumor cells. Proc Natl Acad Sci U S A 106: 7751-7755. [crossref]
  • Weichert W (2009) HDAC expression and clinical prognosis in human malignancies. Cancer Lett 280: 168-176. [crossref]
  • Marks PA (2010) The clinical development of histone deacetylase inhibitors as targeted anticancer drugs. Expert Opin Investig Drugs 19: 1049–1066.
  • Mercurio C, Minucci S, and Pelicci PG (2010) Histone deacetylases and epigenetic therapies of hematological malignancies. Pharmacol Res 62:18-34.
  • Stimson L, Wood V, Khan O, Fotheringham S, La Thangue NB (2009) HDAC inhibitor-based therapies and haematological malignancy. Ann Oncol 20: 1293-1302. [crossref]
  • Drummond DC, Noble CO, Kirpotin DB, Guo Z, Scott GK (2005) Clinical development of histone deacetylase inhibitors as anticancer agents. Annual Review of Pharmacology and Toxicology 495–528
  • Marks PA, Richon VM, Rifkind RA (2000) Histone deacetylase inhibitors: inducers of differentiation or apoptosis of transformed cells. Journal of the National Cancer Institute 15: 1210–1216.
  • Prince HM, Bishton MJ, Harrison SJ (2009) Clinical studies of histone deacetylase inhibitors. Clinical Cancer Research 12: 3958–3969.
  • Marks PA, Breslow R (2007) Dimethyl sulfoxide to vorinostat: development of this histone deacetylase inhibitor as an anticancer drug. Nature Biotechnology 25: 84–90.
  • Piekarz RL, Frye R, Turner M, et al. (2009) Phase II multi-institutional trial of the histone deacetylase inhibitor romidepsin as monotherapy for patients with cutaneous T-cell lymphoma. Journal of Clinical Oncology 32: 5410–5417.
  • Elaut G, Rogiers V, Vanhaecke T (2007)The pharmaceutical potential of histone deacetylase inhibitors. Curr Pharm Des 13: 2584-2620. [crossref]
  • Das, Jagattaran, Natesan, Selvakumar; Trehan, et al. (2003) Preparation of triazolyl-phenyl substituted morpholine/thiomorpholine derivatives as antibacterial agents. PCT Int Appl 2003059894.
  • Dennis Wegener, Christian Hildmann, Daniel Riester, Andreas Schober, Franz-Josef Meyer-Almes, et al. (2008) Identification of novel small-molecule histone deacetylase inhibitors by medium-throughput screening using a fluorigenic assay. Biochemical Journal J 413:143-150;

Evaluation of antioxidant and polyphenolic content of a Sri Lankan poly herbal formulae and assessment of its in vitro antiproliferative activity on RD and MCF-7 cancer cells compared to healthy CC1 cells

DOI: 10.31038/CST.2017231

Abstract

Background: Evidence of cancer cure or improvement of quality of life in cancer patients has been reported using prescriptions based on traditional knowledge, but not scientifically investigated. The objectives of the current study is to evaluate the anti-proliferative action of a poly herbal drug which is currently used in traditional medicine name “Le Pana Guliya (LPG)”

Methods: The aqueous extract of LPG was freeze dried. Total phenolic content was assayed using Folin Ciocalteu reagent. Antioxidant activity of the extract was evaluated using DPPH radical scavenging assay in vitro. Brine shrimp assay was conducted to determine the cytotoxicity (LD50) of the LPG. The cell viability was determined by MTT assay and cytotoxicity by LDH leakage assay after 24 and 48 hours incubation with LPG. Morphological Changes after the treatment of the drug was observed using an inverted light microscope. RD, MCF-7 cells and CC1 cells were used in all experiments.

Results: The TPC of the LPG was 5.31 ± 0.14 W/W% of GAE and antioxidant capacity is comparable to ascorbic acid. LPG exhibited strong cytotoxic activity against RD and MCF-7 cell lines with MTT assay. A 50% leakage of LDH was observed at concentrations less than 30μg/mL and 10 μg/mL for both RD and MCF-7 cells respectively after 24 hour exposure. While, LPG exhibited strong cytotoxic activity against RD and MCF-7 cells the brine shrimp and CC1 cells results (EC50>100μg/mL) suggest that the LPG have minimum cytotoxicity towards the normal healthy cells.

Conclusion: The present study provides evidence for potent anti cancer activity of LPG on RD and MCF-7 cells. The brine shrimp bio-assay and CC1 cells results suggests that the extract have minimum cytotoxicity towards the normal healthy cells.

Keywords

Anti-proliferative activity, Cytotoxicity, MTT assays, LDH assay, Brine shrimp assay, Light microscopy, RD cells, MCF-7, CC1, DPPH

Introduction

Natural products have played an imperative role in the lead-finding of candidates for the development of present-day cancer chemotherapy due to their low toxicity and side effects. They offer a valuable source of a wide variety of chemical structures with biological activities (lead molecules) for the development of novel drugs [1]. Approximately 60% of all drugs currently undergoing clinical trials for cancer treatment are natural products or compounds derived from natural products [2, 3]. These substances embrace some of the most exciting new chemotherapeutic agents currently available for use in a clinical setting [3].

Sri Lanka is gifted with many plants which have vast medicinal value. Use of plants for medicinal preparations is a primary part of the Sri Lankan cultural life and this is implausible to change in the years to come. The Sri Lankan traditional medicine system shows extensive use of plant products in cancer treatment. A significant surge of interest in chemoprevention research has thus led to the discovery of many phytochemicals as successful chemo preventive agents.

Many traditional healers and folklore medical practitioners in the country have been treating cancer patients for many years using various medicinal plant species. There is evidence of case reports on cancer cure using traditional knowledge, but they are not scientifically investigated. In addition to use of a single plant, poly herbal formulations of drugs are intensively used in Sri Lanka. The poly herbal drug ‘Le Pana Guliya’ (LPG) found in Ola leaf inscriptions is prescribed to treat different types of cancers by traditional doctors.This study was aimed at investigating of its cytotoxic effect against two different cancer cell lines compared with healthy CC1 cells.

Materials And Methods

Chemicals and equipment

Chemicals needed for cell culture and cytotoxicity studies were purchased from Sigma –Aldrich (St Louis, MO63178, USA). 1-Diphenyl-2-picrylhydrazyl (DPPH), TritonX-100, was purchased from Fluka. Tris base was purchased from Promega (Madison, WI 53711–5399, USA). All chemicals used were of analytical grade.
Shimadzu UV 1601 UV visible spectrophotometer (Kyoto, Japan) was used to measure the absorbance. LFT 600 EC freeze dryer was used to obtain the freeze dried powder of the poly herbal drug. Cells were incubated at 37°C in a humidified CO2 incubator (SHEL LAB/Sheldon manufacturing Inc. Cornelius, OR 97113, USA). Inverted fluorescence microscope (Olympus Optical Co. Ltd. 1X70-S1F2, Japan) for observation of cells, and photographs were taken using microscope digital camera (MDC200 2M PIXELS, 2.0 USB). Deionized water from UV ultra-filtered water system (Waterproplus LABCONCO Corporation, Kansas city, Missouri 64132–2696) and distilled water was used in all experiments.

Cell cultures

Human Rhabdomyosarcoma cell line (RD), and human breast adenocarcinoma cell line (MCF-7) were cultured in Dulbecco’s Modified Eagle Medium (DMEM), supplemented with 10% heat inactivated fetal bovine serum (FBS), penicillin (100 U/mL) and streptomycin (100 U/mL). The cells were maintained in 25 cm2 plastic tissue culture flasks at 37oC in a humidified atmosphere containing 5% CO2 in air. Exponentially growing cells were used in all experiments. The normal rat fibroblast (CC1) cell line was employed as the control.

Preparation of poly-herbal extract

The poly herbal drug (5 g) soaked in distilled water (100 mL) was kept in the rotary shaker for 48 hours in an air tight dark bottle. The extract was then filtered through a layer of muslin cloth and filtrate was centrifuged at 3,000 rpm for 15 minutes at 4oC to remove any debris.

The supernatant was freeze dried, and stored at -20°C in an air tight vial until used. The freeze dried extract was reconstituted with distilled water for experimental purposes.

Antioxidant activity

The DPPH assay was used to determine the radical scavenging activity of the extract, as reported previously by Perera (2008) [4]. Briefly different concentrations of plant extract (100 µL) was mixed with DPPH reagent prepared in absolute ethanol (100 µM, 900 µL) and incubated for 30 minutes in darkness at 37oC, in a water bath. The percentage of de-colorization was obtained spectro-photometrically at 517 nm. The control was prepared as above without adding extract while L-ascorbic acid was used as the positive control.

At least three independent tests were performed for each sample. Percentage inhibition was calculated from the following formula:

CST 2017-214 Fomula1

The effective concentration of the sample required to scavenge the respective radical by 50% (EC50) was calculated using the linear segment of the curve obtained with percentage inhibition against concentration.

Total phenolic content (TPC)

The total phenolic content of the lyophilized sample (n = 6) of the poly herbal drug was determined using the Folin-Ciocalteu method [5].

Brine shrimp bioassay

Brine shrimp assay was conducted to determine the cytotoxicity (LD50) of the poly herbal drug as explained previously by Soysa (2014) and Middleton (2005) [6, 7].

Briefly, dried cysts of brine shrimps (10 mg) were allowed to hatch at room temperature in sterile sea water. After 24 hours the free nauplii were selected and 10 were added to each petridish containing different concentrations of the extract in sea water. After 24 and 48 hours, the petridishes were observed using a magnifying glass and the number of survived nauplii in each petridish was counted.

The mortality end-point of this bioassay was defined as the absence of controlled forward motion during 30 seconds of observation [7].

The percentage lethality was determined by comparing the surviving larvae of the test and the control. The percentage survival was calculated as:

CST 2017-214 Fomula2

Cell viability assay

The effect of aqueous extract of the drug on the cell viability was determined by MTT assay. The live cells reduce yellow MTT to purple formazan crystals by mitochondrial dehydrogenase enzyme [8]. Cells were suspended in the growth medium and seeded in 24-well plates at 2 x 10⁵ cells/well for overnight. The cells were then treated with different concentrations of the drug at 37oC for 24 and 48 hours. A positive control with cyclohexamide (50 g/mL) and a negative control without the drug were simultaneously conducted.

Percentage viability of the cells treated with the drug was calculated comparing the viability of the un-treated cells.

After 24/48 hours, the utilized growth media was subsequently replaced with 1.0 mL of minimum essential media (MEM), and 100 µL of MTT (5 mg/mL in PBS). The cells were incubated at 37o C for 4 hours and the medium was carefully removed. The formazan product was dissolved in acidified isopropanol (0.05 M HCl in isopropyl alcohol (IPA); 750 µL) and absorbance was read at 570 nm. Cell survival was expressed as a percentage of viable cells of treated samples to that of untreated cells (negative control). The drug extracts were prepared in triplicate and each experiment was performed in triplicates to each preparation.

Lactate dehydrogenase (LDH) activity

Cytotoxicity induced by the LPG evaluated by lactate dehydrogenase (LDH) leakage into the culture medium, as explained in Fotakis and Timbrell (2006) [9]. Cells seeded in 24 well plates (2 x 10⁵ cells/well) were exposed to different concentrations of the drug. After 24/48 hours incubation the culture medium was aspirated and centrifuged at 4000 rpm for 5 min in order to obtain a cell free supernatant. The cell lysate was prepared by treating the cells with Triton X 100 (0.1%; 1 mL) and sonicating the contents for 20 seconds. The final suspension was centrifuged at 4000 rpm for 5 minutes. Medium and the lysate were subjected to LDH assay. The activity of LDH in the medium was determined using a commercially available, LDH assay kit (HUMAN).

Negative control and positive control with cyclohexamide (50g/mL) were also carried out along with the experiment to measure the percentage LDH leakage.

The absorbance was measured at 340 nm at intervals of 15 seconds for 1.5 minutes using an air blank. The rate of decline (gradients of the graphs) of NADH concentration was used to calculate the LDH activity in the supernatant and the lysate.

The percentage LDH leakage to the medium was calculated using the following equation.

CST 2017-214 Fomula3

Where total LDH activity = LDH activity of supernatant + LDH activity of the lysate.

Light microscopy

RD, MCF-7 and CC1 cells grown at 70% confluence were treated with different concentrations of aqueous drug extracts for 24, 48 and 72 hours and observed under phase-contrast inverted fluorescence microscope (40X). The changes in morphology were compared with positive and negative controls.

Statistical analysis

All the results of the experiments were expressed as the mean ± standard deviation (Mean ± SD). The measurements were performed in triplicate and values shown are representatives of at least three independent experiments. Least square linear regression analysis was applied using Microsoft excel to determine the EC50/LD50 values and for the calibration curves.

R2 > 0.99 was considered as linear for the calibration curves.
Significant differences of each test result were statistically analyzed using “Mann-Whitney U” test significances with 95% significance using SPSS version 16.

Results

Anti-oxidant capacity and total Phenolic content

The aqueous extracts of the poly herbal drug showed moderate free radical scavenging activity with a value of EC50 = 68.0 ± 2.8 g/mL with compared to the positive control, L- ascorbic acid (3.4±0.9g/mL; n=6).
The percentage total phenolic content of the aqueous extract of the poly herbal drug was 5.3 ± 0.1 W/W % of Gallic Acid Equivalence (GAE).

Brine shrimp bioassay

LPG shows no lethality towards the brine shrimp even after 48 hours exposure up to a concentration of 10 to 2000 μg/mL. This results show that the aqueous extract either does not possess any significant (p>0.05) alterations in the cellular functions or no significant cytotoxity.

Cell viability assay

The effect of LPG on cell viability of RD, MCF-7 and CC1 cells was evaluated by tetrazolium assay (MTT).
Multiple concentrations of the aqueous extract of the poly herbal drug were used and effective concentrations were calculated for each cell line (EC50) from dose response curve. The percentage cell viability of RD, MCF-7 and CC1 are shown in Figure 1.
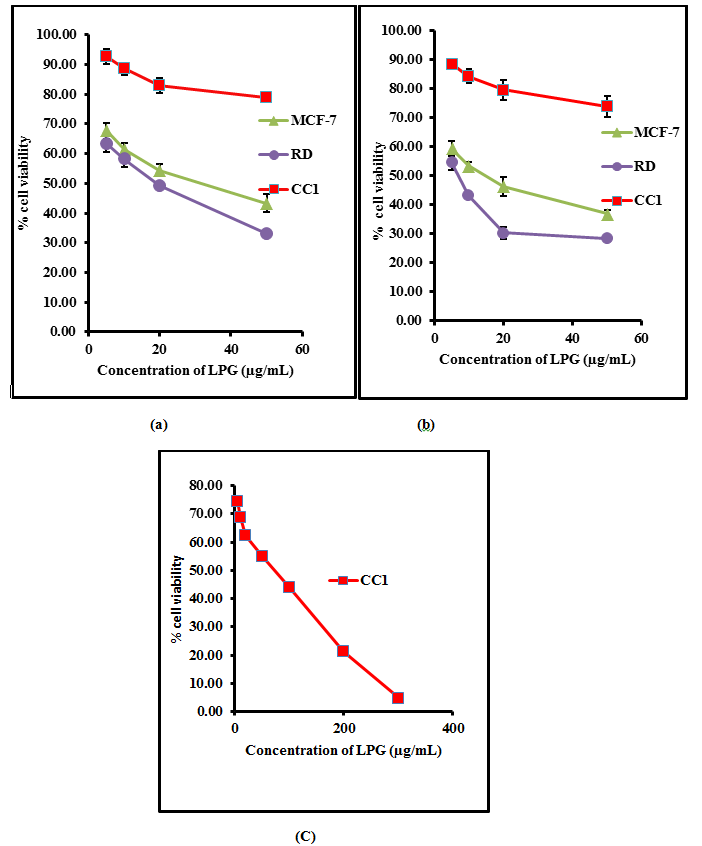
CST 2017-214 Figure1

Figure 1. The percentage cell viability of on RD, CC1 and MCF-7 cell lines as determined by MTT assay, (a) after 24 hours treatment (b) 48 hours and (c) 72 hours with aqueous extract of the poly herbal drug. The data are presented as mean ± SD of six independent experiments.

The aqueous extract of the LPG exhibited no significant cytotoxic activity (p>0.05) against CC1 cell line, achieving an EC50 of 85.3 ± 9.8 µg/mL after 72 hour incubation.

On the contrary, the aqueous extract of the poly herbal drug exhibited significant cytotoxic activity (p<0.05) against RD and MCF-7 cell lines compared to the CC1 cells as shown in Table I.

Table I. EC50 values obtained for MTT assay for the three different cell lines.
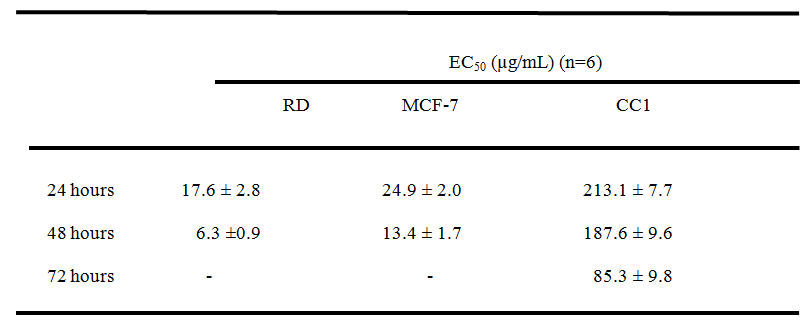
CST 2017-214 Table1

*All results were mean of 6 independent measurements ± standard deviation. “Mann-Whitney U” test at 95% confidence level showed a significant difference (p < 0.05) in both RD and MCF-7 cells compared to CC1 cells.

After 24 and 48 hour incubation with Cyclohexamide (Positive control) at a concentration of 50µg/mL, the percentage viability showed by tested cells depicted in Table 2. The percentage cell viability obtained for MTT assay at a concentration of 50µg/mL of LPG was calculated using respective regression equations to compare the capacity to inhibit cell proliferation, with that of the positive control. The values are shown in Table 2.These results exhibited the significant cytotoxicity (p< 0.05) exert by the aqueous extract of LPG against cancer cells compared to CC1 cells as determined by MTT assay.

Table 2. Percentage cell viability obtained by MTT assay at 50 µg/mL Cyclohexamide (+ve Control) and 50 µg/mL LPG after 24 hours and 48 hours exposure
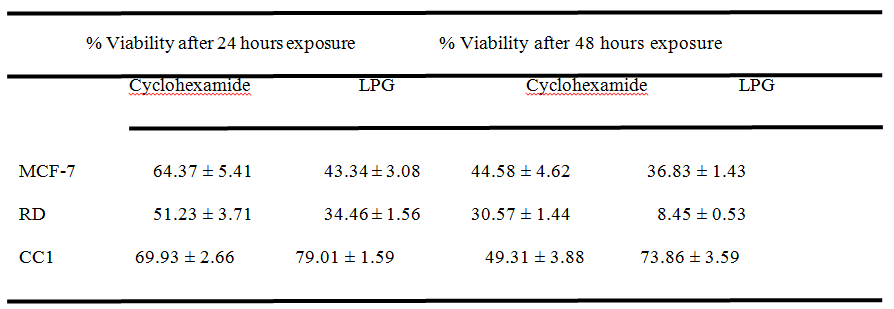
CST 2017-214 Table2

*All results were mean n=6 measurements ± standard deviation in three independent experiments.

Lactate dehydrogenase (LDH) assay

Measurement of LDH activity is also an indicator of cell viability through evaluation of the cell membrane permeability. The enzyme activity is measured externally, as it leaks from dead cells which lose their membrane integrity. The LDH release curves for RD, MCF-7 and CC1 cell lines treated with different concentrations of the LPG suggested that the cytotoxic effect of the extract was concentration dependent (Figure 2).
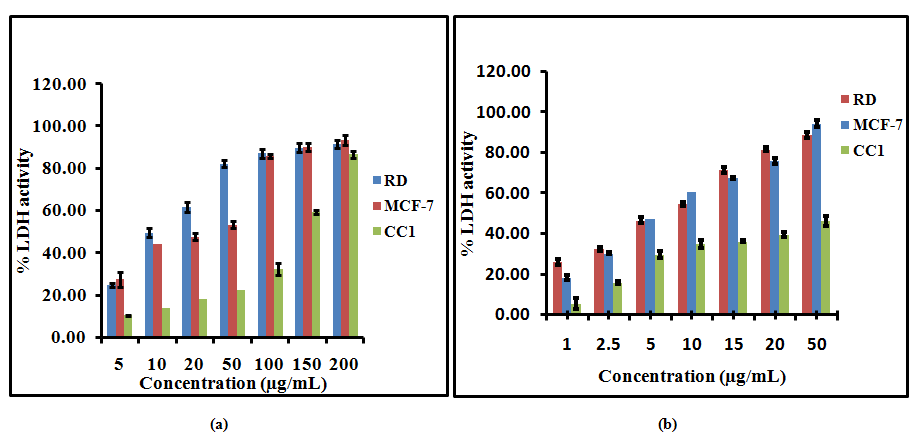
CST 2017-214 Figure2

Figure 2. Lactate Dehydrogenase (LDH) release from RD, MCF-7 and CC1 cells with aqueous extract of the poly herbal drug, (a) after 24 hour, (b) after 48 hour incubation. The data are presented as mean ± SD of six independent experiments.

Fifty percent leakage of LDH to the media was observed at 26.9± 1.6 and 30.5 ±2.8μg/mL for RD and MCF-7 cells after 24 hour incubation respectively. After 48 hours of incubation with LPG the EC50 values further decreased and 50% LDH leakage arise at 8.2± 0.2 and 6.0± 0.2 μg/mL for RD and MCF-7 cells respectively. In contrast to RD and MCF-7 cells the CC1 cells showed 50% leakage of LDH at 159.3± 3.1 and 103.1 ±5.2μg/mL LPG concentrations after 24 and 48 hours respectively.

Light microscopy

Morphological alterations of RD, MCF-7 and CC1 cell lines upon exposure to the aqueous extract of the poly herbal drug was observed under the phase contrast inverted microscope. The microscopic observations revealed that the aqueous extract has a significant cytotoxic effect on RD and MCF-7 cells compared to the negative control. However CC1 cells treated with the drug did not show significant cell death (Figure 3).
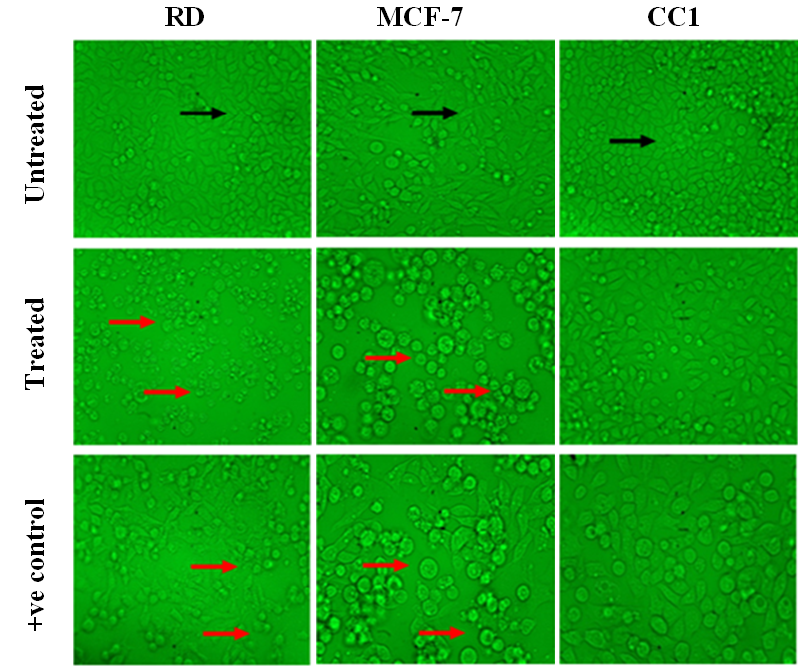
CST 2017-214 Figure3

Figure 3. Light microscopy images of RD, MCF-7 and CC1 cells treated with their respective EC50 values of LPG, with magnification of 40X. (Black arrow – indicates healthy spindle shape cells; Red arrow – dead and shrinkage cells due to the LPG treatment).

Discussion

Cancer has become the most leading cause of death worldwide. It has become an emerging health problem affecting both developing and developed countries. According to the World Health Organization reports published in 2014, 8.2 million patients have died from cancer in 2012 and the number of annual cancer cases reported in 2012 was 14 million. It has been also estimated that the number of annual cancer cases would have increased from 14 million in 2012 to 22 million within the next two decades [10]. The most effective treatment approaches in cancer are chemotherapy and radiotherapy. Nevertheless, the higher incidence in side effects, have made investigators engage in finding novel anticancer compounds with less adverse effects. As a result of this, plants and other natural sources have provided nearly 60% of anti cancer agents which are currently in use [11]. Especially the most novel chemotherapeutic agents more than ever before are botanical in kind [2].

Traditional folklore medicine which involves the use of natural elements uses either single or multiple herbs as a mixture (polyherbs) for treatment of diseases. The use of polyherbal formulation is found to be more effective than the use of a single herb as the active phytochemical constituents of the individual plants are insufficient to achieve the desirable therapeutic effect. But when combining the herbs in a particular ratio the synergistic effect produced by the active phytochemicals of several plants give a better therapeutic effect [12].

Polyherbal preparations are used worldwide for treatment of various disease conditions including cancer. As the polyherbal formulations have gained more attention, many studies have been conducted to identify the mechanism of action and the efficacy of these polyherbal preparations. A latest study [13] which gives a global perspective on polyherbal formulations reports that for the past six years, only 2 publications have been made regarding polyherbal formulations that show/have anticancer activity.

Zyflamend® used in China [14], Sho-saiko-to® used in Japan [15] and Arbudhcure® used in India [16] are few of the polyherbal preparations used for cancer treatment where attempts have been made to validate scientifically for their mechanism of action and therapeutic efficacy.

With compared to the aforementioned poly herbal drugs the polyherbal LPG is not commercialized and no scientific research has been carried out up to this study to identify its mechanism of action or evaluate its effectiveness on treatment of cancer even though it is being used to treat 32 different types of cancer in traditional medicinal system in Sri Lanka.

Secondary metabolites of plants including phenolic compounds are very important for their essential functions in reproduction, growth and in defense mechanisms [17]. Phenolic compounds also provide natural antioxidants for protection against many diseases including cancers. It has been reported that antioxidant effects of plants are mainly attributed to the radical scavenging activity of phenolic compounds such as flavonoids, polyphenols, tannins, and phenolic terpenes. The polyphenols have the capability to scavenge ROS as well as oxidatively generated free radicals which derive from bio-molecules [18].

As depicted in results the quantitative measurement of poly phenolic content obtained in the present study showed that the water extract of LPG has moderate levels of polyphenols. Similarly the EC50 values obtained for the different samples of LPG for DPPH assay showed higher values compared to EC50 of ascorbic acid which evidently indicate that the LPG has a lower anti-oxidant capacity.

It was reported by several authors, that the proliferation of cancer cells are inhibited by the high antioxidant and poly phenolic content present in plant extracts [14, 19]. This probable fact that presence of low polyphenolic content and low antioxidant potential was explained in Hamberger and Hastettman 1991[20], as possible changes occurring in the chemical composition of the plant materials during the processes of the drug manufacturing that could result in a reduced pharmacological activity in mixtures. Thus it can be suggested that even though the LPG exerts an effective antiproliferative activity and cytotoxicity, the mechanism of action must be in a different pathway compared to most of the other traditional medicinal drugs which exert antiproliferative activity via the phenolics and antioxidants.

Cytotoxic action in brine shrimp assay is brought about by the active ingredients present in the drug by disturbing the fundamental mechanisms associated with cell growth, mitotic activity, differentiation and function [21]. According to previous reports a crude plant extract is toxic (active) if it has an LD50< 1000 µg/mL while non-toxic (inactive) if LD50> 1000 µg/mL [22]. The present study evidently indicates that the aqueous extract of LPG shows no lethality towards the brine shrimp even after 48 hours of exposure within the concentrations tested ranging 10 to 2000 µg/mL. This results show that the aqueous extract either does not possess any significant (p>0.05) alterations in the cellular functions or no significant cytotoxicity. Similar results were observed in a previous study which shows anticancer activity of the plant extract of Flueggea leucopyrus against HEp 2 cells but no toxicity for brine shrimps [6].

In this study the cell viability of the tested cell lines were determined by the MTT reduction assay. Each cell type was treated with different concentration of LPG extract and incubated for 24 and 48 hours. The EC50 value was obtained from the graph between the percentages of cell viability versus concentrations of LPG extract (Figure 1). The values were used to describe the degree of cytotoxicity of the extract towards cell lines. The cell viability of CC1 cells were further determined after 72 hours due to the high viability of the cells at 48 hours of incubation (187.58 ± 9.59 µg/mL).

It was established by the American National Cancer Institute (NCI), that if a crude extract shows EC50< 30 µg/mL after an incubation of 72 hours it is considered as cytotoxic [23]. However crude extract with EC50 less than 20µg/mL after 48 hours incubation is supposed to be highly cytotoxic [24]. Present study shows a potent cytotoxic effect on RD and MCF-7 cells with the aqueous extract of the LPG even at 24 hours which is much lower than the value specified by the NCI. However, the extract was less cytotoxic towards normal mouse fibroblast cell line CC1.

After 24 and 48 hours of incubation with Cyclohexamide (Positive control) at a concentration of 50μg/mL, the percentage viabilities of the tested cells are showed in Table 2. In contrast, the percentage viability obtained for MTT assay at the same concentration of LPG (50 μg/mL) treatment was markedly lower for RD and MCF-7 cells (Table 2).The EC50values obtained for MTT assay indicate that the cytotoxicity of the LPG extract against the cancer cell lines is within the limit of cytotoxicity (EC50 < 30 μg/mL), as reported by the American National Cancer Institute (NCI) over 72 hour post exposure and it is beyond the limits for CC1 cells (Table 1) Thus LPG shows significant anti-proliferative activity on cancer cells studied compared to the standard anti cancer drug. Cyclohexamide showed a % cell viability of 69.93 ± 9.26% and 49.31 ± 3.88% for 24 and 48 hours respectively for CC1 cells, suggesting its high toxicity towards the normal cells compared to the LPG (Table 2).

It is reported that the poly herbal anticancer drug Zyflamend® shows an EC50 value of 200 µg/mL against prostate cancer cell line (PCC) after an incubation period of 96 hours [14]. Japanese poly herbal drug Sho-saiko-to® shows an EC50 value of 353.5 µg/mL against human hepatocellular carcinoma (HCC-KIM) at 72 hour incubation [15], while Arbudhcure® shows an EC50 of 33.0 µg/mL against HeLa cells for 48 hours post exposure to the respective drug [16]. The current study demonstrates that LPG shows higher anti-proliferative activity on four different cancer cell lines investigated in the present study in comparison with aforementioned polyherbal drugs.

Measurement of LDH activity is another indicator of cell viability through evaluation of the cell membrane permeability. Previous studies suggest that LDH is a more reliable and accurate marker of cytotoxicity, since damaged cells is fragmented completely during the course of prolonged incubation with substances [25]. The intracellular LDH release to the medium is a measure of irreversible cell death. Xia (2007) [26] reported that there is a correlation between the direct involvement of LDH up regulation and subsequent induction of apoptosis, which is ideal for an effective anti cancer drug.

Fifty percent leakage of LDH to the media was observed at 26.9± 1.6 and 30.5 ±2.8μg/mL for RD and MCF-7 cells after 24 hour incubation respectively. After 48 hours of incubation with LPG the EC50 values further decreased and 50% LDH leakage arise at 8.2± 0.2 and 6.0± 0.2 μg/mL for RD and MCF-7 cells respectively. In contrast to RD and MCF-7 cells the CC1 cells showed 50% leakage of LDH at 159.3± 3.1 and 103.1 ±5.2μg/mL LPG concentrations after 24 and 48 hours respectively. These results indicate that the LPG is having minimal cytotoxic effect on control cells while it possesses a remarkable cytotoxicity on two cancer cell types studied.

Morphological alterations of RD, MCF-7 and CC1 cell lines upon exposure to the aqueous extract of the LPG revealed that even at low concentrations the morphology of the RD and MCF-7 cells changed into an irregular shape with extremely condensed nuclear contents, signs of membrane blebbing, suggesting an autophagic mechanism of cell death. The untreated cells (negative control)of RD and MCF-7 cell lines show cells with normal morphology (Spindle shape/ elongated cells) that adhered to the culture plate with no signs of cells death and growth disorders.

The positive control also shows the typical morphological changes which indicate the cellular damage in RD and MCF-7 cells. In contrast to the RD and MCF-7 cells the CC1 cells do not show any significant morphological changes even after 72 hour incubation with the extract.

Conclusions

The present study provides strong evidence for potent anti-cancer activity of the poly herbal drug “Le Pana Guliya” on RD and MCF-7 cells compared to controls. The brine shrimp and CC1 cells results suggest that the extract has minimum cytotoxicity towards the normal healthy cells. This calls for further studies on the active components and the mechanism of action involved in cytotoxicity of the chemotherapeutic action of LPG.

Acknowledement: The financial support by World Class University Research Grant No. AP/3/2012/CG/10is highly acknowledged.

Conflict of Interest: No conflict of interest between authors.

References

  • Vuorelaa P, Leinonenb M, Saikkuc P, Tammelaa P, Rauhad JP, Wennberge T and Vuorela H (2004) Natural products in the process of finding new drug candidates. Current Medicinal Chemistry11:1375-1389.
  • Biswas J, Roy M and Mukherjee A (2015) Anticancer Drug Development Based on Phytochemicals. Journal of Drug Discovery, Development and Delivery 2: 1012.
  • Hosseini A and Ghorbani A (2015) Cancer therapy with phytochemicals: evidence from clinical studies. Avicenna Journal of Phytomedicine 5:84-97.
  • Perera MGAN, Soysa SSSB, Abeytunga DTU and Ramesh R (2008) Antioxidant cytotoxic properties of three traditional decoctions used for the treatment of cancer in Sri Lanka. Pharmacognosy Magazine 4: 172-181.
  • Velioglu, YS, Mazza G, Gao L and Oomah BD (1998) Antioxidant activity and total phenolics in selected fruits, vegetables, and grain products. Journal of Agricultural Food & Chemistry 46: 4113–4117.
  • Soysa P, De Silva IS and Wijayabandara J (2014) Evaluation of antioxidant and antiproliferative activity of FlueggealeucopyrusWilld (katupila). BMC Complementary and Alternative Medicine 14:274.
  • Middleton P, Stewart F, Al-Qahtani S, Egan P, O’Rourke C and Sarker SD (2005) Antioxidant, antibacterial activities and general toxicity of Alnusglutinosa, Fraxinus excelsior and Papaverrhoeas. Iranian Journal of Pharmaceutical Research 2:81-86.
  • Mosmann T (1983) Rapid colorimetric assay for cellular growth and survival: application to proliferation and cytotoxicity assays. Journal of Immunological Methods 65:55-63.
  • Fotakis G and Timbrel J (2006) A In vitro cytotoxicity assays: Comparison of LDH, neutral red, MTT and protein assay in hepatoma cell lines following exposure to cadmium chloride. Toxicology Letters 160: 171–177.
  • World Cancer report 2014. International Agency for Research on Cancer (IARC) 2014, World health organization.
  • Cragg GM and Newman DJ (2000) Antineoplastic agents from natural sources: achievements and future directions. Expert Opinion on Investigational Drugs 9:2783-2797.
  • Parasuraman S, Thing GS and Dhanaraj SA (2014) Polyherbal formulation: Concept of ayurveda. Pharmacognosy Reviews 8:73-80.
  • Aslam MS, Ahmad MA, Mamat AS, Ahmad MZ and Salam F (2016) An Update Review on Polyherbal Formulation: A Global Perspective. Systematic Reviews in Pharmacy 7:35-41.
  • Zhao Y, Donohoe D, Huang EC and Whelan J (2015) Zyflamend, a polyherbal mixture, inhibits lipogenesis and mTORC1 signalling via activation of AMPK. Journal of Functional Foods 18:147-158.
  • Yano H, Mizoguchi A, Fukuda K, Haramaki M, Ogasawara S, Momosaki S and Kojiro M (1994) The herbal medicine sho-saiko-to inhibits proliferation of cancer cell lines by inducing apoptosis and arrest at the G0/G1 phase. Cancer Research 54: 448-454.
  • Pankajaakshan PK and Hashim KM (2014) Anti-cancer activity of Arbudhcure prepared from Aswathy medical hall. European Journal of Experimental Biology 4:22-25.
  • Prior RL, Wu, X and Schaich, K (2005) Standardized methods for the determination of antioxidant capacity and phenolics in foods and dietary supplements. Journal of Agriculture and Food chemistry 53: 4290-4302.
  • Valko M, Leibfritz D, Moncola J, Cronin MTD, Mazura M and Telser J (2007) Free radicals and antioxidants in normal physiological functions and human disease. Review. International Journal of Biochemistry and Cell Biology 39: 44-84.
  • Suryavanshi S, Choudhari A, Deshpande R, Kulkarni O and Kaul-Ghanekar R (2011) Analyzing the antioxidant potential of aqueous and ethanolic preparations of an herbal composition (HC9) and evaluating their cytotoxic activity in breast cancer cell lines. Biotechnology, Bioinformatics and Bioengineering 1:513-522.
  • Hamberger M, Hastettman K (1991) Bioactivity in plants: the link between phytochemistry and medicine. Phytochemistry 30:3864-3874.
  • Meyer BN, Ferrigni NR, Putnam JE, Jacobsen LB, Nichols DE and McLaughlin JL (1982) Brine shrimp: A convenient general bioassay for active plant constituents. Journal of Planta Medica 45: 31-34.
  • Olowa LF and Nuñeza OM (2013) Brine Shrimp Lethality Assay of the Ethanolic Extracts of Three Selected Species of Medicinal Plants from Iligan City, Philippines. International Research Journal of Biological Sciences 2: 74-77.
  • Abdel-Hameed ES, Salih A, Bazaid SA, Shohayeb MM, El- Sayed MM and El-Wakil EA (2012) Phytochemical studies and evaluation of antioxidant, anticancer and antimicrobial properties of Conocarpus erectus L. growing in Taif, Saudi Arabia. European Journal of Medicinal Plants 2: 93-112.
  • Mahavorasirikul W, Viyanant V, Chaijaroenkul W, Itharat A, Na-Bangchang K (2010) Cytotoxic activity of Thai medicinal plants against human cholangiocarcinoma, laryngeal and hepatocarcinoma cells in vitro. BMC Complement Altern Med 10: 55. [crossref]
  • Sarveswaran S, Marati RV and Marathaiveeran PB (2006) Effects of Terminalia arjuna bark extract on apoptosis of human hepatoma cell line (HEPG2). Journal of Gastroenterology 12: 1015-1024.
  • Xia GH, Chen BA, Shao ZY, Lu HX, Konstanze D and Hartmut D (2007) Mechanism of 2-methoxyestradiol-induced apoptosis in myelodysplastic syndrome MUTZ-1 cell line. Zhongguo Shi Yan Xue Ye Xue Za Zhi 15:296-301.
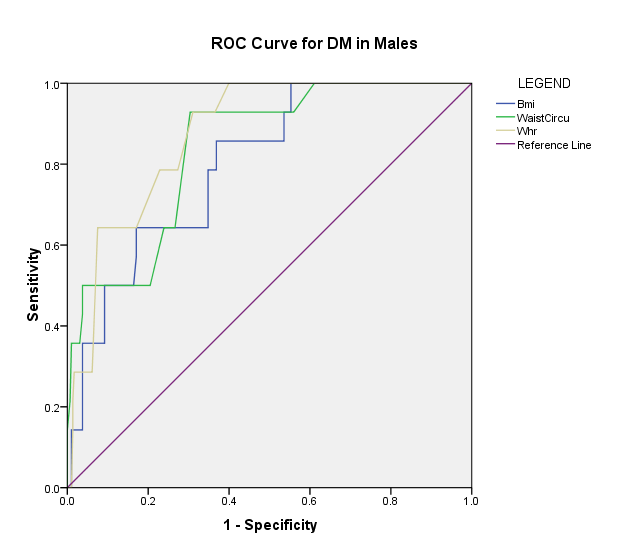
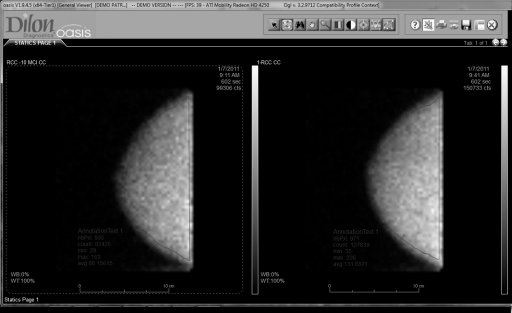
Bridging the Gap: Incorporating Exercise Evidence into Clinical Practice in Breast Cancer Care in Ontario-A Pilot Randomized Control Trial Protocol

DOI: 10.31038/CST.2017222

Abstract

Background: Breast cancer (BC) and its treatments lead to numerous side effects that affect a person’s life for years after treatment has ended. Research shows that regular exercise limits many of these side effects.However, less than 30% of BC survivors regularly exercise due to many barriers at both the patient and health care professional level. The purpose of this pilot trial is to assess the feasibility and effectiveness of conducting a novel KT intervention using exercise and self-management versus usual care among BC survivors.

Methods: Study Design: Pilot randomized controlled trial. Eligibility: Women older than 18 years who are currently undergoing chemotherapy treatment for BC. Intervention: The intervention group includes an 8-session multi-component intervention with a structured aerobic exercise program plus SM supervised by a physiotherapist. Randomization: Participants will be randomly allocated using a 1: 1 allocation ratio to receive the intervention of structured exercise plus SM program or usual care. Outcomes: The primary feasibility outcomes include recruitment rate, retention rate, and adherence rate. The secondary outcomes include exercise knowledge and behavior, HRQoL and resource utilization. Analysis: A blinded assessor will assess outcomes at baseline, post intervention, at 2- and 4-month follow up. Intervention feasibility and effectiveness will be assessed using descriptive statistics and analysis of covariance for continuous outcomes.

Discussion: This study aims to assess the feasibility of a novel KT intervention to close the current KT gap and increase exercise awareness for women with BC. This project will assess process and resource variables before implementation of a larger scale intervention. The overall project goal is to promote sustainable exercise behaviour to help manage the burden of BC.

Trial Registration: This trial was registered on ClinicalTrials.gov on March 21, 2017 (Identifier: NCT03087461).

Keywords:

Breast neoplasms, exercise, translational medical research, pilot study, rehabilitation

Introduction

Breast cancer (BC) and its treatments lead to numerous side effects that affect a person’s quality of life (QOL) for years after treatment has ended [1-5]. Research has shown that regular exercise limits many of these side effects and can prevent disease recurrence [5-10]. However, less than 30% of survivors participate in regular exercise [11-13]. Previous research conducted by our team has shown that over 80% of BC survivors in southwestern Ontario are unaware of the benefits of exercise and are not educated on the need to stay physically active [11], health professionals face many institutional, personal, and patient-related barriers to promoting exercise [14], and there is a need for novel knowledge translation (KT) strategies within cancer institutions that focus on easy-to-access exercise interventions and education by physiotherapists (PTs) [15].

Moreover, the societal burden of this disease is projected to increase substantially over the next two decades. The Canadian Cancer Society’s 2015 Statistics report [16] suggests that the number of new cancer cases in women will increase by 74% by the year 2032 due to the aging Canadian population. The number of new cases of BC is projected to increase by more than 10,000 in this same time period [16]. Fortunately, due to improved screening and treatment techniques, survival rates for BC are increasing [3]. However, physical and functional sequelae prevent survivors from returning to their activities associated with work, leisure, and domestic roles [3]. Exercise is an effective, safe, and cost-efficient way to manage this burden and return women to their pre-cancer activity levels. Therefore KT research is needed to determine how to best translate and integrate this research knowledge into clinical practice in order to elicit sustainable behaviour change for this population. Pilot work completed for this project has shown that in order to change clinical practice, implementation strategies using accessible exercise options and education are needed within the institution to maximize women’s engagement with exercise information provided and to partake in this behaviour [15]. Along with this, self-management (SM) programs have been shown to improve QOL and physical side effects in BC survivors, however, the implementation of these programs in clinical practice is scarce [17]. The current knowledge to practice gap in the field of BC rehabilitation shows that novel KT strategies are needed.

A pilot study is an, “investigation designed to test the feasibility of methods and procedures for later use on a large scale or to search for possible effects and associations that may be worth following up in a subsequent larger study” [18]. For this project, a pilot study is needed as the first step in order to assess process and resource variables before implementation of a large scale intervention [19]. Process variables include measuring recruitment rate, retention rate, and adherence rates to the intervention provided [19]. Resource variables include determining the centers willingness and capacity to house a specific intervention, equipment availability, intervention location, and budget concerns [19]. There is currently a lack of pilot trials for a novel KT intervention of this sort and therefore this pilot study will aid in shaping and guiding a larger, phase III trial.

Methods & materials

Study Purpose:

The purpose of this study is to determine whether KT strategies, focusing on accessible exercise locations and SM education by PTs using technology, are feasible and impact exercise knowledge and behaviour, QOL, and need for additional health care services among women with BC. Specifically, the objectives of this project are to: (1) Determine the feasibility (through recruitment, retention and adherence rates) of providing a complex KT intervention designed specifically for women with BC using technology, and (2) Determine preliminary estimates of effects of the KT intervention on levels of exercise knowledge and behaviour, health related quality of life and, resource utilization, among BC survivors over a four month period.

Study Design & Participants:

This study is a pilot randomized controlled trial. Eligible participants will include community-dwelling, English-speaking women, over 18 years, who are currently undergoing chemotherapy for Stage 1-3 BC and have been cleared by their oncologist to participate in moderate intensity aerobic exercise. Participants will be excluded from the study if they have another chronic disease, cognitive impairment or injury that prevents them from participating independently in moderate intensity exercise.

Recruitment:

Medical oncologists and Primary Care Nurses at the Juravinski Cancer Centre (JCC) will recognize possible participants for this study within their patient caseload. For those they think are eligible, the health care professional will briefly discuss the study with their patient and get consent for the patient to be contacted by a member of the research team. Possible participants will be contacted by phone to discuss eligibility and potential study enrollment. The Hamilton Integrated Research Board approved this study (reference #: 3124) in April 2017. All participants will provide written informed consent on the approved consent forms prior to enrollment in this study.

Intervention:

This pilot project will implement a multi-dimensional KT intervention including an exercise and SM program. Refer to Figure 1 for study flow chart.

Figure 1. Study Flow Chart

                                                            Figure 1. Study Flow Chart

The exercise intervention will involve an evidence-based moderate intensity aerobic exercise program, using recumbent bikes, delivered within the cancer institution. Results from participants in our focus group run during the pilot work for this project suggest that exercise programs should be delivered in the institution where women are waiting for their chemotherapy. Delivering the program in this environment will increase the accessibility of the services and we anticipate this approach will increase exercise awareness. Participants will take part in the 30-minute, moderate intensity (50-70%HRmax or 4-6/10 on Rate of Perceived Exertion scale) aerobic exercise program for 8 sessions. The intervention will be supervised by a PT educated in cancer rehabilitation and who has been trained in the specific protocol used and in working with women with BC.

The SM component will include educational modules created by a PT. Participants will view these 30 minute modules prior to each exercise intervention, over the same 8 sessions. Content provided within the program will include information on the benefits of exercise during and after BC treatment, safe exercise prescription, how to self-monitor exercise levels, action planning for specific exercise strategies, and precautions related to exercise and BC. Refer to Table 1 for details of SM content for each week of the program. A variety of tools will be used in the SM program, including a mobile app and e-health resources for BC. Having numerous sessions will allow the PT to provide consultation in respect to exercise adaptation, parameters, and programming in order to facilitate long-term exercise engagement and participation. Adherence and fidelity to the specified exercise and self-management protocol will be monitored through random observation by study investigators. (Figure 1, Table 1).

Table 1. Self-Management Content

Session Content
1 Introductions.

What are the side effects of treatment? Why do they happen?

Benefits of exercise for women with breast cancer.

Types of exercise and safety precautions during exercise (how to monitor BP, HR, RPE)

What is self-management?

How to participate in effective self-management.

Self-management and breast cancer.

Introduction to goal setting/action planning.

2 Review of previous week goal/action plan.

The importance of posture for women with breast cancer (common postural issues, how to assess posture, how to ensure optimal posture).

Relaxation and breathing techniques to manage anxiety and stress.

Set goal/action plan for week.

3 Review of previous week goal/action plan.

Appropriate exercise techniques to maintain/increase endurance:

–                      Description of aerobic exercise

–                      Types of aerobic exercise

–                      Parameters for aerobic exercise

Set goal/action plan for week.

4 Review of previous week goal/action plan

Appropriate exercise techniques to maintain/increase strength

–                      Description of strengthening exercise

–                      Types of strengthening exercise

–                      Parameters for strengthening exercise

Set goal/action plan for week.

5 Review of previous week goal/action plan

Other forms of Exercise (flexibility, yoga, Tia Chi, etc)

Appropriate exercise techniques to maintain/increase flexibility:

–                      Description of flexibility exercises

–                      Types of flexibility exercises

–                      Parameters for flexibility exercise

Description of other forms of exercise:

–                      Types of other forms of exercise

–                      Parameters of other forms exercise

Set goal/action plan for week.

6 Review of previous week goal/action plan.

Self-monitoring physical activity levels:

–                      Introduction to Breast Cancer Physio Guide (App)

–                      Introduction to Stanford Action Planning App

–                      Other techniques to monitor physical activity levels

Set goal/action plan for week.

7 Review of goal/action plan.

Communicating with others (family, health professionals) about exercise and physical activity.

Available exercise programs in the community.

How to move forward: how to evaluate progress.

Set goal/action plan for week.

8 Review of goal/action plan.

Summary of self-management program.

How did you use self-management information?

Questions/comments.

Outcomes:

Primary Outcomes: The feasibility and effectiveness of the KT intervention will be assessed using quantitative outcomes. The primary outcomes of feasibility variables will be assessed at baseline and post intervention, where applicable. Feasibility will be assessed by measuring recruitment (percentage (%) of eligible patients recruited), retention (% of consented patients who complete the intervention), and adherence rates (% of sessions attended) to the intervention).

Secondary Outcomes: Secondary effectiveness outcomes will be assessed at four time points: baseline, post intervention, and at 2 and 4 month follow up. At baseline, participants will be instructed on how to complete each self-report measure by an assessor blinded to participant group allocation. All post-intervention, 2 and 4 month follow up, assessments will be mailed to participants to complete and return to study investigators using pre-paid postage envelops. No identifiers will be used on these assessments and therefore assessors performing the analysis of data will be blinded to participant group allocation. Hard copies of the completed outcome measures will be stored in a locked filing cabinet only accessible by the study investigators at McMaster University and data entered into statistical analysis software will be stored on a password protected computer.

Level of exercise knowledge and behaviour will be assessed using a Theory of Planned Behaviour (TPB) [20] based questionnaire. The TPB has been used extensively to determine levels of intention and behaviour for various health behaviours, including exercise [21,22].

Quality of life will be measured using the FACT-B [23], a selfreport measure designed to assess multi-dimensional QOL specifically for women with BC.

Need for additional health care services will be measured using the EQ-5D [24] and a piloted self-report questionnaire assessing health care facility visits, doctor visits, procedures received, support services used, loss of work, and prescription medications used.

Sample Size:

Debate exists as to whether sample size calculations for pilot studies are necessary. Some authors suggest that no calculation is needed as long as the pilot study is large enough to provide useful information about the aspects that are being examined for feasibility [19]. However other authors suggest using a percentage of the sample required for a full study [25,26], or to use a confidence interval (CI) to establish feasibility [19,26]. For this project we have decided to calculate sample size based on the proportion of success of the primary outcome of feasibility (using estimates for adherence rates) [19,25,26].

Therefore, using a Z value from the standard normal distribution to reflect a 95% confidence interval (1.96), E as the desired margin of error (0.2), and p as the proportion of successes in the population (0.75-estimated adherence rates), the sample size for this pilot study will be at least 18 participants (9/group). With an expected drop out rate of 25%, based on previous exercise based literature with this population, the final sample size for this project should be 23 participants. In order to ensure an even number of individuals can be randomized to each group, this will be rounded up to a total of 24 participants (12/group).

Randomization-Sequence Generation:

Prior to participant randomizations, all eligible participants will complete the following forms: (a) patient information form, (b) Godin leisure time exercise questionnaire, (c) consent form, and (d) baseline measures. All participants will be informed verbally in person and in writing that they have equal chance of being randomized into the intervention or control group. They will not be made aware of the study hypotheses. Randomization to intervention or control group will be completed by a member of the research team who is independent of the intervention on a record by record basis using a computer software program (STATA/MP v14). This researcher will remain blind to the identity of each treatment group (by randomizing only to group A or B) during the randomization process. Participants may withdraw from the study at any time. Investigators may withdraw a participant from the research study if circumstances arise which warrant doing so (for example, safety).

Allocation Concealment & Implementation:

Allocation of participant randomization will be concealed in sequentially numbered, opaque, sealed envelops. The envelops will be opened sequentially by the researchers only after participant details have been written on the envelop by the researcher who completed randomization. If the participant is allocated to the intervention group, they will receive a phone call to organize details of the first intervention session (such as time and location).

Blinding:

Due to the nature of this knowledge translation study, participants and persons administering the intervention will not be blinded to group assignment. However, the assessor receiving the self-reported outcome measures will be blind to group allocation and will not be involved in running of the intervention. A researcher blinded to the group allocation of the participants will conduct all statistical analysis.

Statistical Methods:

Participant characteristics will be analyzed at baseline to ensure no significant differences exist between groups. Means and standard deviations (SD) will be used to report continuous variables and t-tests will be used to assess differences between the two groups for these variables. Frequencies will be used to report categorical variables and Pearsons X2 test will be used to assess differences between groups for these variables. All statistical analysis will be completed using STATA/ MP 14. Refer to Table 2 for a summary table of study objective and methodology.

Research Questions 1: Descriptive statistics will be used to measure feasibility (recruitment rate, retention rate, and adherence rates). Recruitment rates will be calculated by determining the percentage of eligible patients that were actually enrolled in the study. A recruitment log will be kept, detailing reasons for non-participation of eligible patients. Retention rate will be defined by calculating the percentage of enrolled patients who complete the intervention. Adherence rates will be calculated as a percentage of total sessions attended. Attendance will be tracked on the feasibility data collection sheet and reasons for non-participation on scheduled intervention days will be documented using an adherence log.

Table 2. Summary Table

Objective Hypothesis Outcome Analysis Method
Determine the feasibility (through recruitment, retention and adherence rates) of providing a complex KT intervention including accessible exercise programs delivered within the cancer institution and a SM program designed specifically for women with BC using technology Implementing and providing a complex KT intervention for women with BC is feasible (recruitment, retention, and adherence rates are 50%, 75%, and 75% respectively). Recruitment Rate Descriptive statistics (percentage (%) of eligible patients recruited). Recruitment logs will be kept, detailing reasons for non-participation of eligible patients.
Retention Rate Descriptive statistics (% of consented patients who complete the intervention).
Adherence Rate Descriptive statistics (% of sessions attended). Adherence rates will be tracked using the data collection sheet. Reasons for non-participation on scheduled intervention days will be documented using adherence logs.
Determine preliminary estimates of effects of the KT intervention of exercise plus SM versus usual care among BC survivors over a four-month period. Compared to the control group, BC survivors participating in the KT intervention will have higher levels of exercise knowledge and behaviours and QOL, and less need for additional health care services.


Levels of exercise knowledge and behaviour (using a Theory of Planned Behaviour  based questionnaire) An analysis of covariance will be used to determine within and between group differences. An intention to treat analysis will be used for these analyses.
Health related quality of life (using the FACT-B)
Resource utilization (using the EQ-5D and a piloted self-report questionnaire assessing health care facility visits, doctor visits, procedures received, support services used, loss of work, and prescription medications used)

Research Question 2: Effectiveness outcomes will be assessed at four time points: baseline, 12 weeks (post intervention), and at 2 and 4 month follow. An analysis of covariance will be used to determine within and between group differences. An intention to treat analysis will be used for these analyses. (Table 2)

Discussion

There is a small risk of participant injury during the exercise intervention. While it has been well documented that exercise is safe for this population if proper screening and precautions are followed, minor injuries have the potential to occur in any active intervention. In order to ensure safety, all participants will need medical clearance to participate in moderate intensity exercise from their medical oncologists and will be supervised by a physiotherapist during each session. Heart rate, blood pressure, rate of perceived exertion and oxygen saturation measurement tools will be present and used during each exercise session. While uncommon, all side effects secondary to exercise will be tracked using Exercise logs. Type, intensity, duration, and management of any side effect will be documented using these logs.

The findings of this KT pilot study will help to determine the feasibility and preliminary effectiveness of a novel implementation strategy. This project will inform a larger intervention trial which has the potential to change the way rehabilitation services are provided in clinical practice and impact all levels of BC prevention; secondary and tertiary prevention of treatment-related side effects, and primary prevention of disease recurrence through sustained behaviour change. The results from this pilot project should be interpreted with an understanding of the potential threats to the generalizability of the results. Specifically, the results of this pilot study will only be relevant to the implementation of a larger intervention at sites comparable to the JCC and will be specific to the unique characteristics of women with BC. As the intervention process and management is more extensive with larger numbers of participants, the researcher team will have to take into consideration additional time and resource needs when implement the larger scale project.

Trial status

Protocol Version Number: 3. Date: April 11, 2017. Approximate recruitment start date: June, 2017. Approximate recruitment end date: August, 2017. Any trial modifications will be updated in a timely manner on ClinicalTrials.gov and sent via email to appropriate parties.

Funding

The Hamilton Division of the Ontario Physiotherapy Association funds this project. This funding body has no role in the design of the study, collection, analysis or interpretation of data, or in writing of this or future manuscripts.

References

  • Shapiro SL, Lopez AM, Schwartz GE, Bootzin R, Figueredo AJ, et al. (2001) Quality of life and breast cancer: relationship to psychosocial variables. J Clin Psychol 57: 501-519. [crossref]
  • Wengström Y, Häggmark C, Strander H, Forsberg C (2000) Perceived symptoms and quality of life in women with breast cancer receiving radiation therapy. Eur J Oncol Nurs 4: 78-88. [crossref]
  • Ewertz M, Jensen AB (2011) Late effects of breast cancer treatment and potentials for rehabilitation. Acta Oncol 50: 187-193. [crossref]
  • Knobf MT, Sun Y (2005) A longitudinal study of symptoms and self-care activities in women treated with primary radiotherapy for breast cancer. Cancer Nurs 28: 210-218. [crossref]
  • Cella D, Fallowfield LJ (2008) Recognition and management of treatment-related side effects for breast cancer patients receiving adjuvant endocrine therapy. Breast Cancer Res Treat 107:167–180.
  • Cormie P, Pumpa K, Galvao D, et al. (2013) Is is safe and efficacious for women with lymphedema secondary to breast cancer to lift heavy weights during exercise: a randomized controlled trial. J Cancer Surviv 7:413-424.
  • Pastakia K,  Kumar S (2011) Exercise parameters in the management of breast cancer: a systematic review of randomized controlled trials. Physiother Res Int 16: 237-244. [crossref]
  • Chan D, Lui L, So W (2010) Effectiveness of exercise programmes on shoulder mobility and lymphedema after axillary lymph node dissection for breast cancer: systematic review. J Adv Nurs 66:1902-1914.
  • Bicego D,  Brown K, Ruddick M, Storey D, Wong C, et al. (2009) Effects of exercise on quality of life in women living with breast cancer: a systematic review. Breast J 15: 45-51. [crossref]
  • McNeely ML,  Campbell KL, Rowe BH, Klassen TP, Mackey JR, et al. (2006) Effects of exercise on breast cancer patients and survivors: a systematic review and meta-analysis. CMAJ 175: 34-41. [crossref]
  • Fernandez S, Franklin J, Amlani N, et al. (2015) Physical activity and cancer: A cross-sectional study on the barriers and facilitators to exercise during cancer treatment. Can Oncol Nurs J 42:37-72.
  • Courneya KS,  Katzmarzyk PT, Bacon E (2008) Physical activity and obesity in Canadian cancer survivors: population-based estimates from the 2005 Canadian Community Health Survey. Cancer 112: 2475-2482. [crossref]
  • Cheifetz O (2013) Clinician’s Commentary on Singh et al.(1.). Physiother Can 65: 192-193. [crossref]
  • Smith-Turchyn J, Richardson J, McNeely M, et al. (2017) Physical activity and breast cancer: A study on the barriers and facilitators to exercise promotion from the perspective of health care professionals. Physiother Can
  • Smith-Turchyn J, Richardson J, Tozer R, et al. (2016) Physical activity and breast cancer: Results of a focus group to devise novel exercise interventions for women with breast cancer. (currently under review in the journal “Rehabiliation Oncology”)
  • Canadian Cancer Society’s Advisory Committee on Cancer Statistics. Canadian Cancer Statistics 2015. Toronto, ON, Canadian Cancer Society, 2015.
  • Boogaard L, Gater L, Mori M, et al. (2016) Efficacy of self-management programs in managing side effects of breast cancer: A systematic review and meta-analysis of randomized control trials. Rehabil Oncol 34:14-26.
  • Everitt B (2006) Medical Statistics from A to Z: A Guide for Clinicians and Medical Students. Cambridge University Press: Cambridge.
  • Thabane L,  Ma J, Chu R, Cheng J, Ismaila A, et al. (2010) A tutorial on pilot studies: the what, why and how. BMC Med Res Methodol 10: 1. [crossref]
  • Ajzen I (1991) The theory of planned behavior. Organ Behav Hum Dec 50:179-211.
  • McEachan RR, Conner M, Taylor NT, Lawton RJ (2011) Prospective prediction of health- related behaviours with the Theory of Planned Behaviour: a meta-analysis. Health Psych Rev 5:97-144.
  • Smith-Turchyn J, Richardson J (2015) Critical Review of the Theory of Planned Behavior to Predict and Explain Exercise Behavior in Women with Breast Cancer. Crit Rev Phys Rehabil Med 27
  • Brady MJ,  Cella DF, Mo F, Bonomi AE, Tulsky DS, et al. (1997) Reliability and validity of the Functional Assessment of Cancer Therapy-Breast quality-of-life instrument. J Clin Oncol 15: 974-986. [crossref]
  • Pickard AS, Wilke CT, Lin HW, Lloyd A (2007) Health utilities using the EQ-5D in studies of cancer. Pharmacoeconomics 25: 365-384. [crossref]
  • Hertzog MA (2008) Considerations in determining sample size for pilot studies. Res Nurs Health 31: 180-191. [crossref]
  • Cocks K, Torgerson DJ (2013) Sample size calculations for pilot randomized trials: a confidence interval approach. J Clin Epidemiol 66: 197-201. [crossref]

Identification Potency of Clinical Isolates in Aspergillus Species Using MALDI-TOF MS

DOI: 10.31038/IMROJ.2017223

Abstract

It is important to make accurate identification of genus Aspergillus including cryptic species, because they could exhibit drug resistance to multiple antifungal agents. Recent advances in molecular diagnosis extended to clinical mycology, and matrix-assisted laser desorption/ionization time-offlight mass spectrometry (MALDI-TOF MS) has been applied as an attractive methodology. Herein we evaluated the ability of MALDI-TOF MS for the identification of genus Aspergillus. A total of 42 strains of Aspergillus were genetically identified by the sequence analysis of PCR amplicons and simultaneously followed by MALDI-TOF MS. The concordance rate for Aspergillus using MALDI-TOF MS was 90.5 % in comparison with sequencing of PCR amplicons. Thirty eight registered strains in the MALDI Biotyper standard library showed the perfect concordance rate (100%). Notablely, azolesresistant Aspergillus lentulus and Aspergillus felis, which were not registered in the MALDI Biotyper standard library, failed to be identified as the correct species. Moreover, these species with low score values in the MALDI-TOF MS analysis potentially resisted to a variety of antifungal agents. These results suggest that additional drug susceptibility testing should be further considered in poor yields with MALDI-TOF MS analysis.

Keywords:

matrix-assisted laser desorption/ionization time-of-flight mass spectrometry; Aspergillus felis; Aspergillus lentulus; Aspergillus tubingensis; cryptic species

Introduction

The genus Aspergillus is one of the ubiquitous fungi that exhibit wide clinical spectrums of diseases in humans. It is a causative pathogen from an allergic response to subacute invasive life-threatening diseases, depending on the host immune conditions. Chronic aspergillosis including aspergilloma is usually found in patients with previously formed lung cavities and/or with mild immunocompromised status. Especially the lives of immunocompromised patients (receiving organ transplantation and anti-cancer chemotherapy) could be threatened by invasive aspergillosis (IA). Additionally, as IA often results in a fatal outcome, the early diagnosis and immediate treatment for IA with optimal chemotherapy lead to improvement of patient’s prognosis [1,2].

Antifungal agents often exhibit variable activities against fungal organisms. For example, a few strains of genus Aspergillus could acquire drug resistance to multiple antifungal drug classes in accordance with failure of the antifugal treatment [3]. In addition, it has also been reported that azole-resistant cases of Aspergillus fumigatus have been increasing in number with several mutations in azole target genes [4]. Furthermore, cryptic species of A. fumigatus tend to resist azole antifungals, leading to the reduced treatment efficacy [5]. Therefore, in an effort to survey aspergillosis appropriately and to treat the patients with optimal antifungals, it is quite important to make accurate identification of genus Aspergillus including cryptic species.

Recently, matrix-assisted laser desorption ionization-time-offlight mass spectrometry (MALDI-TOF MS) (Bruker Daltonics, BD, Bremen, Germany) has also been applied to the identification of fungal pathogens in clinical settings [6]. This methodology is based on applying a laser to the mixed crystals of the clinical specimens and matrix, before implementing acceleration with an electric field [7]. The flight time is then measured to determine the molecular weight of specimens and the pathogens could be identified with the reference of the previously registered molecular patterns in the library. While the use of MALDI-TOF MS has a great potential as one of the reliable methods to detect pathogens, the information on its detection sensitivity and specificity remains to be limited. In this study, we demonstrate the possibility and the current limitation for MALDITOF MS-mediated identification of genus Aspergillus.

Materials and methods

Our current study was conducted with clinical strains of genus Aspergillus that were previously isolated and identified in our hospital between April 2014 and August 2016. The isolated strains, cultured at 37°C on Sabouraud dextrose broth for 2 days, were suspended in Sabouraud dextrose broth with 20% glycerol and then were stored at -80°C until the use.

For genetic identification of genus Aspergillus, stored samples were re-harvested on Potato Dextrose Agar (PDA) for 3 days, and each obtained colony was washed with 3 mL of phosphate buffered saline (PBS). DNA was then extracted from the pellet using the DNeasy plant mini kit (Qiagen, Hilden, Germany) according to the manufacturer’s instructions. The extracted DNA was used for the conventional sequence analysis of the following PCR products for the identification of genus Aspergillus. Segments of the internal transcribed spacer (ITS) and D1/D2 region were amplified using the primers ITS1 and NL4 [8], a segment of the beta-tubulin gene was amplified using the primers bT2a and bT2b [9] and a segment of the calmodulin gene was additionally amplified using the primers cmd5 and cmd6 [10]. The sequencing analysis of these PCR products with blastn (v2.5.0) algorism against database nucleotide collection (nr/nt) confirmed the species of Aspergillus. Additionally, to distinguish Aspergillus oryzae and Aspergillus flavus, a segment of the transcriptional regulator gene of the aflatoxin biosynthesis genes was additionally amplified and performed sequencing analysis using the primers aflR F2 and aflR R2 [11].

Analysis with the MALDI-TOF MS system was applied to above obtained each colony according to the manufacturer’s instructions with a MALDI Biotyper 3.1 RTC software and MALDI Biotyper 4.0 standard library (Bruker Daltonics, Bremen, Germany). Any score value (SV) of less than 1.7 was deemed insufficient for identification.

Drug susceptibilities were confirmed in accordance with the modified M38-A2 method, which is the standard protocol of the Clinical and Laboratory Standards Institute (CLSI) [12], with the lowest concentration of antibiotics without visible growth on the microplate of the Yeast-like Fungus DP Eiken Kit (Eiken Chemical, Tokyo, Japan): micafungin (MCFG), caspofungin (CPFG), amphotericin B (AMPH-B), itraconazole (ITCZ) and voriconazole (VRCZ) [12,13]. The breakpoint of each antifungal agent for Aspergillus was determined using the EUCAST Antifungal Agents Breakpoint tables for interpretation of minimum inhibitory concentrations (MICs) v. 8.0 [14]. For the epidemiological cut-off value (ECV) have been prescribed in this study as follows; 0.5 μg/mL was considered for CPFG [15]. The quality control was ensured by concurrent testing with the strain of A. fumigatus ATCC MYA-3626, which is a recommended strain of CLSI [12].

Results

A total of 42 strains of Aspergillus were genetically identified ( ≥99% identity) based on the sequence analysis of PCR amplicons from clinical specimens (Table 1). They consisted of 27 A. fumigatus, 7 Aspergillus niger, 3 Aspergillus terreus, 2 Aspergillus lentulus, and an each of A. oryzae, Aspergillus tubingensis and Aspergillus felis. To verify whether the results identified by MALDI-TOF MS could match the results by sequencing analysis, all isolates were simultaneously analysed by MALDI-TOF MS. As showin in Table 1, 38 out of 42 isolates (90.5 %) were mached as same spiceses of the genus Aspergillus. However, 2 specimens from cryptic species of A. fumigatus (A. lentulus and A. felis) showed very low score values (below 1.7) in MALDI-TOF MS analysis. Of note, these were not registered in the MALDI Biotyper standard library, and were unable to be correctly identified as its species. The score values for A. tubingensis, one of cryptic species of A. niger, were also below 1.772 and it was identified incorrectly as A. niger.

Table 1. Sequence analysis of Aspergillus isolates and application with MALDI-TOF MS

Section Species No. of isolates confirmed with PCR No. of matched isolates

with TOF MS (%)

Fumigati Aspergillus fumigatus 27 27 (100)
Aspergillus lentulus 2 0 (0)
Aspergillus felis 1 0 (0)
Nigeri Aspergillus niger 7 7 (100)
Aspergillus tubingensis 1 0 (0)
Terrei Aspergillus terreus 3 3 (100)
Flavi Aspergillus oryzae 1 1 (100)
total 42 38 (90.5)

We further addressed those drug susceptibilities in isolates that was incorrectly identified using MALDI-TOF MS. Results of the drug susceptibilities for Aspergillus section Fumigati were indicated in Table 2. For CPFG (ECV: 0.5 μg/mL), the obtained MIC values of cryptic species for A. fumigatus ranged to above 4 μg/mL (A. lentulus) and 2 μg/mL (A. felis), whereas no resistance to CPFG was noted in A. fumigatus. For AMPH-B, 2 specimens of A. lentulus were resistant. For ITCZ, all specimens were ranged lower than breakpoint MIC. However, for VRCZ, the obtained MIC values even in two isolates of A. fumigatus ranged over the breakpoint. Furthermore, in each isolate of A. lentulus and A. felis, the obtained MIC value was 4 or 8 μg/mL [13-17].

Table 2. Antifungal susceptibility for Aspergillus section Fumigati

Aspergillus fumigatus
minimum inhibitory concentration (microgram/mL)
<0.008 0.015 0.03 0.06 0.12 0.25 0.5 1 2 4 8
MCFG 21 6
CPFG 22 5
AMPH-B 15 12
ITCZ 10 16 1
VRCZ 13 10 2 1 1
Aspergillus lentulus
minimum inhibitory concentration (microgram/mL)
<0.008 0.015 0.03 0.06 0.12 0.25 0.5 1 2 4 8
MCFG 1 1
CPFG 2
AMPH-B 2
ITCZ 2
VRCZ 1 1
Aspergillus felis
minimum inhibitory concentration (microgram/mL)
<0.008 0.015 0.03 0.06 0.12 0.25 0.5 1 2 4 8
MCFG 1
CPFG 1
AMPH-B 1
ITCZ 1
VRCZ 1

Abbreviations:
MCFG, micafungin; CPFG, caspofungin; AMPH-B, amphotericin-B; ITCZ, itraconazole; VRCZ, voriconazole.

Discussion

Recently, application of MALDI-TOF MS allowed accurate identification for pathogens at species levels and it is possible to discriminate them at strain levels including relatively genus Aspergillus 6,16,17) as well as common fungi (e.g., Candida spp. and Cryptococcus spp.) [18-20]. In this study, we demonstrated that the identification for Aspergillus with MALDI-TOF MS could obtain a high concordance rate (90.5 %), compared with the genetic identifications using PCR. However, some strains belonging to cryptic species remain not to be discriminated in this protocol. As the reason of this limitation in cryptic Aspergillus species, we raised that taxonomic references of those species were absent in the MALDI Biotyper standard library. Since cryptic Aspergillus species have emerged in clinical settings worldwide and they have high possibility to be resistant to azole and/ or polyene antifungal agents, more Aspergillus spp. including cryptic species should be resistered into the library of MALDI-TOF MS 5).

Aspergillus felis showed the lowest score values in our anlaysis, and others also failed the identification 21). A. lentulus and A. tubingensis were also unable to be identified and A. tubingensis was incorrectly identified as A. niger. Notablely, A. lentulus and A. felis showed the high MIC value for VRCZ (Table 2), and these results appeared to be consistent with the findings of previous studies [21,22]. Thus, we should consider further to perform drug resistance testing as confirmation for its susceptibilities, when the obtained score value (SV) is less than 1.7 or the pathogen identification failed based on the results of MALDI-TOF MS.

In conclusion, reconfiguration of database of MALDI-TOF MS in house is still required. As rare Aspergillus spp. including cryptic species have potencies of various antifungal resistance, additional drug susceptibility testing should be considered in poor yields with MALDI-TOF MS analysis.

Acknowledgements: None

Conflict of Interest: None

References

  • Lin SJ, Schranz J, Teutsch SM (2001) Aspergillosis case-fatality rate: systematic review of the literature. Clin Infect Dis 32: 358-366. [crossref]
  • Herbrecht R, Denning DW, Patterson TF, Bennett JE, Greene RE, Oestmann JW, et al. (2002) Voriconazole versus amphotericin B for primary therapy of invasive aspergillosis. N Engl J Med 347:408-415.
  • Arendrup MC (2014) Update on antifungal resistance in Aspergillus and Candida. Clin Microbiol Infect 20 Suppl 6: 42-48. [crossref]
  • Snelders E, Karawajczyk A, Schaftenaar G, Verweij PE, Melchers WJ (2010) Azole resistance profile of amino acid changes in Aspergillus fumigatus CYP51A based on protein homology modeling. Antimicrob Agents Chemother 54:2425-2430.
  • Alastruey-Izquierdo A, Alcazar-Fuoli L, Cuenca-Estrella M (2014) Antifungal susceptibility profile of cryptic species of Aspergillus. Mycopathologia 178:427-433.
  • Alanio A, Beretti JL, Dauphin B, Mellado E, Quesne G, Lacroix C, et al. (2011) Matrix-assisted laser desorption ionization time-of-flight mass spectrometry for fast and accurate identification of clinically relevant Aspergillus species. Clin Microbiol Infect 17:750-755.
  • Tanaka K, Waki, H, Ido Y, Akita S, Yoshida Y, Yoshida T (1988) Protein and polymer analysis up to m/z 100000 by laser ionization time-of flight mass spectrometry. Rapid Communication in Mass Spectromeroty 2:151-153.
  • O’Donnell K, Sutton DA, Fothergill A, McCarthy D, Rinaldi MG, Brandt ME, et al. (2008) Molecular phylogenetic diversity, multilocus haplotype nomenclature, and in vitro antifungal resistance within the Fusarium solani species complex. J Clin Microbiol 46:2477-2490.
  • Glass NL, Donaldson GC (1995) Development of primer sets designed for use with the PCR to amplify conserved genes from filamentous ascomycetes. Appl Environ Microbiol 61: 1323-1330. [crossref]
  • Hong SB, Go SJ, Shin HD, Frisvad JC, Samson RA (2005) Polyphasic taxonomy of Aspergillus fumigatus and related species. Mycologia 97: 1316-1329. [crossref]
  • Tominaga M, Lee YH, Hayashi R, Suzuki Y, Yamada O, Sakamoto K, et al. (2006) Molecular analysis of an inactive aflatoxin biosynthesis gene cluster in Aspergillus oryzae RIB strains. Appl Environ Microbiol 72:484-490
  • Clinical and Laboratory Standards Institute (2008) Reference method for broth dilution antifungal susceptibility testing for filamentous fungi; approved standard. Document M38-A2. Wayne, PA: Clinical and Laboratory Standards Institute.
  • Toyotome T, Fujiwara T, Kida H, Matsumoto M, Wada T, Komatsu R (2016) Azole susceptibility in clinical and environmental isolates of Aspergillus fumigatus from eastern Hokkaido, Japan. J Infect Chemother 22:648-650.
  • European Committee on Antimicrobial Susceptibility Testing (2015) Breakpoint tables for interpretation of MICs Version.
  • Espinel-Ingroff A, Fothergill A, Fuller J, Johnson E, Pelaez T, Turnidge J (2011) Wild-type MIC distributions and epidemiological cutoff values for caspofungin and Aspergillus spp. for the CLSI broth microdilution method (M38-A2 document). Antimicrob Agents Chemother 55:2855-2859.
  • Cassagne C, Ranque S, Normand AC, Fourquet P, Thiebault S, Planard C, et al. (2011) Mould routine identification in the clinical laboratory by matrix-assisted laser desorption ionization time-of-flight mass spectrometry. PLoS One 6:e28425.
  • Lau AF, Drake SK, Calhoun LB, Henderson CM, Zelazny AM (2013) Development of a clinically comprehensive database and a simple procedure for identification of molds from solid media by matrix-assisted laser desorption ionization-time of flight mass spectrometry. J Clin Microbiol 51:828-834.
  • Marklein G, Josten M, Klanke U, Muller E, Horre R, Maier T, et al. (2009) Matrix-assisted laser desorption ionization-time of flight mass spectrometry for fast and reliable identification of clinical yeast isolates. J Clin Microbiol 47:2912-2917.
  • Rosenvinge FS, Dzajic E, Knudsen E, Malig S, Andersen LB, et al. (2013) Performance of matrix-assisted laser desorption-time of flight mass spectrometry for identification of clinical yeast isolates. Mycoses 56: 229-235. [crossref]
  • Tarumoto N, Sakai J, Kodana M, Kawamura T, Ohno H, Maesaki S (2016) Identification of Disseminated Cryptococcosis Using MALDI-TOF MS and Clinical Evaluation. Med Mycol J 57:E41-46.
  • Barrs VR, van Doorn TM, Houbraken J, Kidd SE, Martin P, et al. (2013) Aspergillus felis sp. nov., an emerging agent of invasive aspergillosis in humans, cats, and dogs. PLoS One 8: e64871. [crossref]
  • Tamiya H, Ochiai E, Kikuchi K, Yahiro M, Toyotome T, Watanabe A, et al. (2015) Secondary metabolite profiles and antifungal drug susceptibility of Aspergillus fumigatus and closely related species, Aspergillus lentulus, Aspergillus udagawae, and Aspergillus viridinutans. J Infect Chemother 21:385-39.

A Pilot Case-Cohort Study of Lung Cancer in Poultry and Control Workers: Non-Occupational Findings

DOI: 10.31038/CST.2017221

Abstract

The objective of this study was to obtain preliminary information on which non-occupational risk factors are responsible for the excess of lung cancer deaths seen in a cohort of workers in poultry slaughtering & processing plants, and to investigate whether established non-occupational risk factors for lung cancer mortality can be replicated. We conducted a pilot case-cohort study within a cohort of 43,904 poultry and non-poultry plant workers alive in 1990 and followed up to the end of 2003. Cases were 125 lung cancer deaths that occurred between 1990-2003 for whom interviews were successfully obtained. Controls (N=152) were derived from a random sample of the cohort in 1990. Statistical analysis was by logistic and Cox proportional hazards regression. The study successfully identified many of the established risk factors for lung cancer, and a few new ones were identified. The study demonstrates that valid case-cohort studies in this occupational group are feasible, and also successfully identified non-occupational risk factors that may need to be adjusted for in future planned large-scale studies of this occupational group.

Keywords

Chickens; meat; lung cancer; diet; non-occupational

Introduction

Workers in poultry slaughtering/processing plants have high exposures to oncogenic viruses that naturally infect and cause cancer in poultry. They also have exposures to chemical carcinogens at work. We initially performed three cohort mortality studies of 30,411 poultry workers and 16,405 non-poultry workers who were members of the United Food and Commercial Workers unions in the United States (N=46,816). An excess of lung cancer was consistently observed in the poultry workers [1-4]. We next conducted a pilot case-cohort study of lung cancer within a subset of 43,904 subjects of the 46,816 subjects that were alive in 1990, and followed them up to the end of 2003. The findings for occupational exposures have been published, [5] and the corresponding literature reviewed [6]. Here we present the results for non-occupational exposures. The study provides a unique opportunity for examining whether established non-occupational risk factors for lung cancer can be replicated in this group of workers who are among the lowest paid workers in industry. Also, if established risk factors for lung cancers are confirmed in this study, this will be strong evidence that future planned large full-scale studies to investigate lung cancer occurrence in this occupational group will give valid results.

Material & Methods

Cases were the first 125 lung cancer deaths out of 552 (23%) that occurred in the cohort between 1990 and 2003, for whom telephone interviews were obtained. Controls were similarly the first 152 subjects (10%) for whom telephone interviews were obtained. They originate from a random sample of 1,516 persons in the cohort that were alive in 1990. A telephone questionnaire was administered to the next-of-kin of study subjects if they were deceased (all cases, and 13% of controls) or to live control subjects themselves. Statistical analyses were conducted using both logistic regression and Cox proportional hazards regression methods as previously described [5].

Ethics: The study was approved by the University of North Texas Health Science Center’s Institutional Review Board

Results

The results are summarized in Tables 1&2.

Table 1. Poultry associated non-occupational exposures: Associations with lung cancer mortality, 1990-2003

Adjusted Logistic Regression ORs Adjusted Cox Proportional HRs
  Cases

(n=125)

Controls

(n=152)

OR (95% CI) HR (95% CI)
LIFESTYLE
Ever smoked tobacco 113 135 7.1 (2.8-18.0) 3.7 (1.8-7.4)
Mostly prepared own food 118 147 0.5 (0.2-1.1) 0.5 (0.3-0.9)
Ever drunk wine 113 146 0.4 (0.2-0.9) 0.6 (0.4-0.9)
Swam at least once a month for more than one year 115 147 0.4 (0.1-0.9) 0.5 (0.3-0.9)
Regularly performed any exercise 117 147 0.3 (0.1-0.5) 0.5 (0.3-0.7)
MEDICAL HISTORY  
Ever treated with radiation therapy 106 141 16.6 (6.8-40.8) 5.3 (3.5-8.1)
Ever treated with radiation therapy for cancer 67 21 1.6 (0.5-5.4) 1.1 (0.6-1.9)
Ever treated with radiation therapy for skin/scalp conditions 68 20 1.0 (0.1-11.9) 1.5 (0.6-3.9)
Ever treated with radiation therapy for arthritis 70 20 0.5 (0.1-1.9) 0.8 (0.4-1.5)
Tuberculosis 102 144 9.0 (0.3-304.9) 2.2 (0.9-5.4)
Cirrhosis 112 147 7.8 (0.7-82.6) 2.0 (0.8-5.0)
Pancreatic inflammation 111 146 6.2 (0.7-55.5) 1.2 (0.5-2.8)
Infectious mononucleosis 109 147 3.6 (0.3-51.5) 1.7 (0.4- 6.9)
Cold sores on lip 114 145 0.6 (0.3-1.2) 0.6 (0.4-0.9)
Diabetes 114 148 0.3 (0.1-0.8) 0.4 (0.2-0.9)
Allergic to pollen 113 145 0.2 (0.1-0.5) 0.3 (0.2-0.7)
Allergy to drug medications 110 144 0.1 (0.0-0.4) 0.2 (0.1-0.5)
FOOD CONSUMPTION
Ate beef once every two weeks for most of life 114 144 14.9 (1.8-123.0) 9.6 (1.3-69.0)
Ate bacon every week for most of life 112 141 12.1 (4.2-35.1) 5.1 (2.4-11.2)
Ate uncooked fish/shellfish every week for most of life 111 142 2.0 (0.4-10.0) 1.4 (0.5-3.8)
Ate spicy foods every week for most of life 110 142 1.7 (0.9-3.4) 1.3 (0.9-1.9)
Ate chicken once every two weeks for most of life 116 144 1.7 (0.4-7.4) 1.5 (0.6-3.6)
Ate pork once every two weeks for most of life 114 144 1.6 (0.7-3.6) 1.4 (0.8-2.4)
Ate lamb once every two weeks for most of life 115 144 1.6 0.5-5.2) 1.1 (0.6-2.2)
Ate turkey once every two weeks for most of life 115 144 1.0 (0.5-1.9) 1.0 (0.7-1.5)
Ate fruits every week for most of life 108 143 0.8 (0.3-2.0) 0.9 (0.5-1.5)
Ate freshwater fish at least once a month 115 142 0.7 (0.4-1.4) 0.8 (0.5-1.2)
Ate cheese every week for most of life 109 142 0.7 (0.3-1.7) 0.8 (0.5-1.4)
Ate raw eggs at least once every two weeks for most of life 114 143 0.6 (0.1-3.9) 0.7 (0.3-2.1)
Ate veggies every week for most of life 111 143 0.5 (0.3-1.1) 0.6 (0.2-1.7)
Ate seafood once every two weeks for most of life 111 144 0.5 (0.2-0.9) 0.7 (0.4-1.0)
Ever ingested herbal leaves, drinks, medications at least once a week for >1yr 111 140 0.3 (0.1-0.9) 0.4 (0.2-1.0)
Ever adhered to a vegetarian diet for more than a year 114 143 0.2 (0.0-3.8) 0.3 (0.0-2.1)
Method of cooking meats  
Ate meat fried at least once every two weeks for most of life 113 144 2.6 (1.0-6.6) 1.9 (1.0-3.8)
Ate meat salted at least once every two weeks for most of life 109 144 2.4 (1.2-4.8) 1.5 (1.0-2.2)
Ate meat raw at least once every two weeks for most of life 111 144 1.6 (0.2-11.3) 1.9 (0.7-5.3)
Ate meat barbequed at least once every two weeks for most of life 112 144 1.5 (0.8-2.9) 1.1 (0.7-1.6)
Ate meat smoked at least once every two weeks for most of life 110 144 1.3 (0.6-2.8) 1.0 (0.6-1.6)
DRUG USE  
Use vitamins at least every week for more than a year 103 140 0.4 (0.2-0.8) 0.6 (0.4-1.0)
Ever had general anesthesia during surgery 108 140 0.4 (0.2-0.7) 0.6 (0.4-0.9)
Ever used hormone replacement therapy continuously for at least a year 24 57 0.2 (0.0-0.8) 0.3 (0.1-0.9)
FAMILY HISTORY OF CONDITIONS  
Reported cancer in children 114 139 1.7 (0.5-6.4) 1.1 (0.6-1.9)
Reported cancer in parents 107 135 0.8 (0.4-1.6) 0.8 (0.5-1.2)
Reported cancer in spouse 113 139 0.8 (0.3-2.0) 1.1 (0.7-1.8)
IMMUNIZATIONS  
Typhoid 46 127 2.1 (0.8-5.5) 1.4 (0.7-2.7)
Pneumococcal infections 48 127 1.7 (0.6-4.3) 1.4 (0.7-2.7)
Yellow fever 41 127 1.7 (0.5-5.6) 0.9 (0.4-2.2)
Ever received gamma globulin 56 131 1.6 (0.3-8.7) 1.8 (0.6-6.0)
Measles 42 124 1.5 (0.6-3.5) 1.0 (0.5-2.0)
Small pox 64 128 1.4 (0.6-3.1) 1.0 (0.6-1.7)
Diphtheria 55 120 1.3 (0.6-3.2) 1.0 (0.5-1.8)
Mumps 43 123 1.3 (0.5-3.0) 0.9 (0.5-1.7)
OTHER  
Ever owned a cell phone 115 141 0.2 (0.1-0.4) 0.3 (0.1-0.6)

† Odds ratios (OR) were adjusted for smoking, gender, and age by the Logistic Regression Method
‡ Hazard ratios (HR) were adjusted for smoking, gender, and”> age by the Cox Proportional Hazard Method
@ For ever smoked tobacco, adjustment was for age and gender.

Table 2. Lung cancer mortality associated with frequent consumption of Beef and Bacon, adjusted for occupational exposures, meat preparation type, tobacco smoking, age, gender, and union site – (1990-2003)

                Ate a lot of Beef               Ate a lot of Bacon
  Case/control HR (95% CI) Case/control HR (95% CI)
OCCUPATIONAL EXPOSURES        
History of working in stockyard 56/99 56/98 2.7 (1.1-6.7)
Ever killed chickens at work 105/143 8.9 (1.2-64.6) 103/140 4.7 (2.1-10.3)
History of working in deli department 66/99 66/98 3.1 (1.3-7.4)
History of working in meat department 66/99 66/98 3.1 (1.3-7.1)
MEAT PREPARATION        
Ate a lot of meat raw 109/144 9.8 (1.3-71.1) 108/141 4.8 (2.2-10.5)
Ate a lot of meat fried 111/144 8.9 (1.2-64.8) 110/141 4.7 (2.1-10.3)
Ate a lot of meat BBQ 111/144 9.7 (1.3-70.4) 109/141 5.0 (2.3-10.9)
Ate a lot of meat smoked 109/144 9.5 (1.3-69.0) 109/141 5.1 (2.3-11.2)
Ate a lot of meat salted 107/144 8.5 (1.2-62.0) 106/141 4.5 (2.0-10.1)

*HR = hazard ratio; CI = confidence interval; NOTE: Questionnaire defined a lot as “once every two weeks for most of life”

Discussion

With regard to lifestyle, established associations in the literature with cigarette smoking, drinking of wine and exercise were confirmed [7-9]. The significant association with radiation exposure may be real and consistent with well-documented reports of this association [7,10]; but it is also likely that it reflects using radiation treatment for the lung cancer, since no significant associations were seen for treating other conditions with radiation. The elevated but not statistically significant risk for tuberculosis seen is consistent with the findings of a comprehensive review [11]. Protective effects were seen for history of cold sores, diabetes, and allergy to pollen and medications. These are consistent with reports of allergies being protective risk factors for the disease [12-14].

Frequent consumption of beef and bacon were significantly associated with increased lung cancer risk, and the risks persisted after adjusting for occupational exposures that were associated with increased risks [5] Table 2. The risks also persisted irrespective of whether the beef or bacon was eaten raw, fried, barbecued, smoked, or salted – Table 2. The method of preparation of any of the different meats (beef, pork, poultry, etc.) was not an independent risk factor for lung cancer (data not shown) except for salted chicken, turkey and lamb for which the hazard ratios were 1.4 (95% CI, 1.0-2.2), 1.5 (95% CI, 1.0-2.2) and 1.5 (95% CI, 1.0-2.2), respectively. These associations with beef and bacon and salted meats are well documented in the literature [7,15-18], and mere consumption of these meats seem to be the most important factor.

Risk estimates for eating of seafood, ingestion of herbal leaves, drinks or medications, adherence to vegetarian diet, vitamin intake, hormone replacement therapy, and history of diabetes and general anesthesia were all below the null. These protective associations have been previously reported [7,19-21], except for history of diabetes and general anesthesia for which we have no explanation. The results for cellphone use are likely due to systematic bias resulting from cases (all deceased) dying during earlier periods when cellphone use was not in existence or infrequent while controls most of whom were alive, lived long enough into the more recent period of popular use; moreover, this reduced risk was also seen for the other cancers (liver, pancreas, brain) investigated [22,23].

Conclusion

The findings in this study are important for three reasons: 1) in spite of its small size, the study remarkably was able to confirm many of the reported non-occupational risk factors in the literature for lung cancer in this low-income population. This indicates that future planned case-cohort studies nested within occupational cohorts of workers in poultry slaughtering and processing plants that are assembled to investigate cancer occurrence in this industry, are feasible and capable of giving valid results. Such studies can provide valuable information on both occupational and non-occupational risk factors for various cancers. Secondly, this study has successfully identified non-occupational exposures that are risk factors for lung cancer in this specific population of poultry workers. These constitute some important potential confounding factors that may need to be adjusted for when investigating the role of occupational carcinogenic exposures (especially oncogenic viruses) in the occurrence of lung cancer in poultry slaughtering & processing plant workers in future full-scale large case-cohort studies. Finally, this small study indicates that established risk factors for lung cancer are equally applicable for this group of minimum-wage workers who belong to the lowest socioeconomic group.

Acknowledgements

Our appreciation and thanks go to the United Food & Commercial Workers International Union for their continuing support and collaboration over the years without which this research would not have been possible.

Funding Source

The study was funded by a grant 1 RO1 OH008071 from the National Institute for Occupational Safety & Health.

Competing interests: None

References

  • Johnson ES, Fischman HR, Matanoski GM, Diamond E (1986) Occurrence of cancer in women in the meat industry. Br J Ind Med 43: 597-604. [crossref]
  • Johnson ES, Shorter C, Rider B, Jiles R (1997) Mortality from cancer and other diseases in poultry slaughtering/processing plants. Int J Epidemiol 26:1142-1149.
  • Netto GF, Johnson ES (2003) Mortality in Workers in Poultry Slaughtering/Processing Plants – The Missouri Poultry Cohort Study. Occup Environ Med 60:784-788.
  • Johnson ES, Ndetan H, Lo K-M (2010) Cancer Mortality in Poultry Slaughtering/Processing Plant Workers Belonging to a Union Pension Fund. Environ Res 110:588–594.
  • Felini M, Preacely N, Shah N, Christopher A, Sarda V, et al. (2012) A case-cohort study of lung cancer in poultry and control workers: occupational findings. Occup Environ Med 69: 191-197. [crossref]
  • Johnson ES, Choi KM (2012) Lung cancer risk in workers in the meat and poultry industries–a review. Zoonoses Public Health 59: 303-313. [crossref]
  • Boffetta P, Trichopoulos D (2002) Cancer of the Lung, Larynx, and Pleura, in: H.O. Adami, D. Hunter, D. Trichopoulos (Eds.), Textbook of Cancer Epidemiology, New York City NY, Oxford University Press :248-280.
  • Benedetti A, Parent ME, Siemiatycki J (2006) Consumption of alcoholic beverages and risk of lung cancer: results from two case-control studies in Montreal, Canada, Cancer Causes Control 17:469-480.
  • Chao C (2007) Associations between beer, wine, and liquor consumption and lung cancer risk: a meta-analysis. Cancer Epidemiol Biomarkers Prev 16: 2436-2447. [crossref]
  • Boice JD, Jr, Land CE, Preston DL (1996) Ionizing radiation, in: D. Schottenfeld, J.F. Fraumeni, Jr., (Eds). Cancer Epidemiology and Prevention, 2nd Edition. New York, Oxford University Press 319-354.
  • Aoki K (1993) Excess incidence of lung cancer among pulmonary tuberculosis patients. Jpn J Clin Oncol 23: 205-220. [crossref]
  • Gorlova OY, Zhang Y, Schabath MB, Lei L, Zhang Q, et al. (2006) Never smokers and lung cancer risk: a case-control study of epidemiological factors. Int J Cancer 118: 1798-1804. [crossref]
  • Schabath MB, Delclos GL, Martynowicz MM, Greisinger AJ, Lu C, et al. (2005) Opposing effects of emphysema, hay fever, and select genetic variants on lung cancer risk. Am J Epidemiol 161: 412-422. [crossref]
  • McDuffie HH, Cockcroft DW, Talebi Z, Klaassen DJ, Dosman JA (1988) Lower prevalence of positive atopic skin tests in lung cancer patients. Chest 93: 241-246. [crossref]
  • Sinha R, Kulldorff M, Curtin J, Brown CC, Alavanja MC, et al. (1998) Fried, well-done red meat and risk of lung cancer in women (United States). Cancer Causes Control 9: 621-630. [crossref]
  • Deneo-Pellegrini H, De Stefani E, Ronco A, Mendilaharsu M, et al. (1996) Meat consumption and risk of lung cancer; a case-control study from Uruguay, Lung Cancer 14:195-205.
  • Lam TK, Cross AJ, Consonni D, Randi G, Bagnardi V, et al. (2009) Intakes of red meat, processed meat, and meat mutagens increase lung cancer risk. Cancer Res 69: 932-939. [crossref]
  • Alavanja MC, Field RW, Sinha R, Brus CP, Shavers VL, et al. (2001) Lung cancer risk and red meat consumption among Iowa women. Lung Cancer 34: 37-46. [crossref]
  • Chen X, Cai L (2009) [Meta-analysis of the effects on hormone replacement therapy and oral contraceptives associated with female lung cancer risk]. Wei Sheng Yan Jiu 38: 672-676. [crossref]
  • Schwartz AG, Wenzlaff AS, Prysak GM, Murphy V, Cote ML, et al. (2007) Reproductive factors, hormone use, estrogen receptor expression and risk of non small-cell lung cancer in women. J Clin Oncol 25: 5785-5792. [crossref]
  • La Vecchia C (2006) Hormone replacement therapy in menopause and lung cancer: an update. Eur J Cancer Prev 15:283-284.
  • Felini M, Johnson E, Preacely N, Sarda V, Ndetan H, et al. (2011) A pilot case-cohort study of liver and pancreatic cancers in poultry workers. Ann Epidemiol 21: 755-766. [crossref]
  • Gandhi S, Felini MJ, Ndetan H, Cardarelli K, Jadhav S, et al. (2014) A pilot case-cohort study of brain cancer in poultry and control workers. Nutr Cancer 66: 343-350. [crossref]

Changes in Cerebral Blood Flow and Prolonged Disturbances in Cerebral Autoregulation in Critically ill Children with Diabetic Ketoacidosis

DOI: 10.31038/EDMJ.2017122

Abstract

Objective: Intracerebral complications are the most common cause of morbidity and mortality in children with diabetic ketoacidosis (DKA). Emerging evidence suggests that ischemic injury may be a factor in the development of cerebral edema. This study was designed to evaluate cerebral hemodynamics and autoregulation during DKA in critically ill children using transcranial Doppler ultrasound (TCD).

Design: Prospective observational study

Setting: Tertiary care pediatric intensive care unit (PICU)

Patients: Patients ≤18 years admitted to the PICU with moderate to severe DKA (serum glucose > 200 mg/dl, pH < 7.15, bicarbonate < 15 mmol/L, and urine ketones).

Measurements and Main Results: Within 4 hours of admission the flow velocities in the middle cerebral arteries (MCA) and basilar artery (BA) were measured using TCD. Cerebral autoregulation was evaluated using the transient hyperemic response ratio (THRR), with values ≥ 1.1 defined as normal. TCD was repeated after resolution of DKA. 26 patients were studied [median age 10 yrs (0.75-18), median initial glucose 558 (289-1018) g/dL, median initial pH 6.98 (6.78-7.13)]. Mean MCA flow velocities were unchanged when compared to previously published normal values. Mean BA flow velocities were significantly lower than these normal values during and after resolution of DKA, p = 0.001. Cerebral autoregulation during DKA was impaired in 92% of patients [median THRR on right 0.97 (0.65-1.14), left 0.98 (0.39-1.26)] and remained abnormal in 64% after resolution of DKA. Patients with clinical and imaging evidence of cerebral edema had lower BA mean flow velocities than patients without cerebral edema (p = 0.06).

Conclusions: Our data shows decreased basilar artery flow velocities and prolonged impairment of cerebral autoregulation in children with DKA. Understanding these disruptions in cerebral blood flow may lead to future therapeutic targets and should be further studied in hopes of improving neurologic outcomes in diabetic children experiencing DKA.

Keywords

diabetic ketoacidosis, blood flow velocity, cerebral blood flow, transcranial Doppler ultrasonography, cerebral edema, diabetes complications

Introduction

Cerebral edema and intracerebral complications are the most common cause of morbidity and mortality in children with diabetic ketoacidosis (DKA) [1-4]. While symptomatic cerebral edema has been reported in approximately 1% of children with DKA, recent literature suggests that subclinical cerebral edema during DKA may be a more common occurrence than previously appreciated and may occur in up to 50% of children [1-8]. In one magnetic resonance imaging (MRI) study of children with DKA, 54% of children had decreased ventricular size, which suggested the presence of subtle cerebral edema despite a lack of neurologic symptoms [7]. Additionally, long term memory deficits in children with type I diabetes mellitus (DM) are strongly associated with a past history of DKA, regardless of their overall glycemic control; this finding suggest that subtle neurological injury occurs during this critical time [9, 10].

The underlying mechanism for cerebral edema in children with DKA is unknown. Emerging evidence suggests that ischemic injury resulting from dehydration and hyperventilation due to acidosis may be an inciting factor [11-15]. Hypoperfusion and reperfusion injury with associated cerebral edema may develop as dehydration is correction and carbon dioxide levels normalize with treatment [6, 16-18]. Additionally, hyperglycemia and ketosis increase the risk of hyperemia during correction of carbon dioxide in animal studies [19]. Impaired cerebral autoregulation in other neurologic conditions such as stroke and traumatic brain injury is known to be associated with an increased risk of secondary injury and reperfusion injury [20, 21]. A transient impairment of cerebral autoregulation in DKA has been reported but overall data about changes in cerebral hemodynamics and autoregulation are limited in children with DKA [16, 22].

Understanding changes in cerebral hemodynamics during DKA and its impact upon neurologic injury may be useful to inform treatment strategies to optimize cerebral blood flow to minimize cerebral edema. Transcranial Doppler ultrasound (TCD) is a noninvasive test that can be used at the bedside to evaluate real time changes in cerebral hemodynamics and autoregulation. TCD is an established clinical tool in neurocritical care with applications that include monitoring for vasospasm after aneurysm subarachnoid hemorrhage, emboli detection during carotid endarterectomy, and screening for evidence of sickle cell vasculolopathy [23]. As a research tool, TCD has provided insight into cerebral blood flow patterns in a variety of neurological conditions such as acute ischemic stroke and traumatic brain injury.

We designed a study using TCD to evaluate blood flow patterns and changes in critically ill children with moderate to severe DKA. We hypothesized that decreased cerebral blood flow velocity and impaired autoregulation occurs early in DKA.

Materials and Methods

We performed a prospective observational study at a pediatric tertiary care center between 2011-2014. This study was approved by our institutional review board. Patients ≤ 18 years old with moderate to severe DKA admitted to our pediatric intensive care unit (ICU) were screened. Patients were eligible for the study if they had a serum glucose > 200 mg/dl, venous or capillary pH < 7.15, bicarbonate level < 15 mmol/L, and ketones in their urine. We excluded patients with previously diagnosed diseases known to alter cerebral hemodynamics (e.g. Sickle cell disease). Informed consent was obtained from the patient’s parent or guardian and assent was obtained from the patient when applicable.

Within 4 hours of admission to the intensive care unit, TCD was performed at the bedside using a 2-MHz pulsed probe and commercially available TCD ultrasonography unit (Sonara Digital TCD, Carefusion, Middleton, WI) to measure the systolic, diastolic and mean flow velocities of the middle cerebral arteries (MCA) and basilar artery (BA). Arteries were insonated at 1millimeter (mm) intervals using previously described methods [24, 25]. Cerebral autoregulation was evaluated using the transient hyperemic response ratio (THRR) bilaterally, as previously described [26-28]. A THRR < 1.1 was considered abnormal. Measurements were repeated after resolution of DKA which was defined as pH > 7.3, blood gas carbon dioxide > 35 mmHg, bicarbonate > 15 mmol/L or normalized anion gap and transition off of the insulin infusion to intermittent insulin with a regular diet.

Baseline characteristics of the patients including age, Glasgow Coma Scale (GCS), blood pH, blood glucose, bicarbonate, carbon dioxide, and neuroimaging results were recorded at the time of each study.

Treatment strategy, including choice and rate of fluids and imaging, was left to the discretion of the clinical team. The general practice within our institution utilizes an initial 10 milliliter per kilogram bolus of 0.9 normal saline followed by a two bag system with 0.9 normal saline based intravenous fluids at 1.5 to 2 times maintenance flow rate and an insulin drip of 0.1 units per kilogram per hour. The fluids are titrated to decrease blood glucose by approximately 100 mg/ dl per hour.

Statistical analysis was performed using GraphPad Prism© (La Jolla, California). Descriptive statistics were calculated for baseline characteristics. Wilcoxon matched pairs test was used for comparisons. Each patient served as their own control and blood flow velocities obtained during DKA were compared with their values after resolution of DKA and also to previously published age and gender matched normal values. Baseline demographics and blood flow velocities for patients with cerebral edema versus those without cerebral edema were compared using non-parametric t-tests.

Results

Baseline Characteristics

26 total patients were enrolled. 15 patients were female (57%). 17 patients (65%) had newly diagnosed diabetes. Baseline characteristics are displayed in Table 1. The median time from presentation to the emergency room to initial TCD study was 4.5 hours (2-6.5). Only the first study was obtained for 2 patients as they were discharged before the second TCD study was performed. Information for the first study for both of these patients was included in the data analysis.

Table 1. Baseline Patient Characteristics

Median Range
Age (Years) 10 0.75-18
Initial glucose (milligram/deciliter) 558 289-1018
Initial pH 6.98 6.78-7.13
Initial carbon dioxide  (milliequivalent/liter) 17 7-28
Initial bicarbonate

(milliequivalent/liter)

< 5 < 5 – 8
Initial serum osmolality (calculated) 313 278-368
Sodium at time of 1st study 144 134-157
Sodium at time of 2nd study 142 136-166
Initial Glasgow Coma Scale (GCS) 14 9-15

Middle cerebral artery flow velocities

No difference was found for systolic, diastolic or mean blood flow velocities for either middle cerebral artery during DKA compared to previously published age matched normal values (Figure 1). Additionally, there was no significant difference between the patients’ systolic, diastolic or mean blood flow velocities for the right or left middle cerebral artery when comparing flow during the acute phase of DKA to flow after resolution of DKA in the same patients.

EDMJ 2017-201 Fig1

Figure 1. Mean flow velocities for intracranial blood vessels during diabetic ketoacidosis: Mean flow velocities are shown here as percentage of the expected value for the patient’s age and gender. Median and interquartile ranges are displayed on the figure. No difference was found in the mean flow velocities of the right and left middle cerebral arteries during diabetic ketoacidosis compared to previously published age and gender matched normal values. Basilar artery mean flow velocity was significantly lower during DKA than expected (p = 0.001).

Basilar artery flow velocities

Basilar artery mean flow velocity was significantly lower during DKA than expected (median 47% of normal, range 33-129%, p = 0.001) and remained significantly lower than normal after resolution of DKA (p = 0.001) (Figure 2).

EDMJ 2017-201 Fig2

Figure 2. Mean flow velocities for intracranial blood vessels after resolution of diabetic ketoacidosis: Mean flow velocities are shown here as percentage of the expected value for the patient’s age and gender. Median and interquartile ranges are displayed on the figure. No difference was found in the mean flow velocities of the right and left middle cerebral arteries during diabetic ketoacidosis compared to previously published age matched normal values. Basilar artery mean flow velocity was significantly lower after resolution of DKA than expected (p = 0.001).

Cerebral autoregulation/THRR

THRR data was obtained in 24 of the 26 patients; 2 patients did not tolerate testing due to agitation. THRR was abnormal, consistent with impaired cerebral autoregulation, in 92% of patients during DKA (Figure 3a and b) and remained abnormal in 64% of patients on the second evaluation after DKA had resolved.

EDMJ 2017-201 Fig3A

EDMJ 2017-201 Fig3B

Figure 3A & 3B. Cerebral autoregulation for the middle cerebral arteries: Cerebral autoregulation was impaired during diabetic ketoacidosis in 92% patients as measured by the transient hyperemic response. A response of ≥ 1.1 is defined as normal. a) The median transient hyperemic response on the right was 0.97 (0.65-1.14) and b) on the left was 0.98 (0.39-1.26). Follow-up testing was done in all but 2 patients after resolution of DKA and cerebral autoregulation remained abnormal in 64% of the patients.

Patients with abnormal imaging

10 patients had head imaging on presentation. 6 patients had evidence of cerebral edema (CE) and 1 of these patients also had a left basal ganglia infarction. The mean basilar artery flow velocities were lower in patients with clinical and radiographic evidence of CE than patients without CE (p = 0.06). No difference was seen in the middle cerebral artery flow velocities in patients with and without CT abnormalities. Initial GCS was significantly lower in patients with CE (median 10) than patients without edema [14], p = 0.01. There was no difference in age, initial pH, glucose, bicarbonate or CO2 between patients with and without CE.

Discussion

DKA resulting in cerebral edema is a leading cause of immediate morbidity and mortality in children with diabetes mellitus. Episodes of DKA may contribute to long-term morbidity and cognitive impairment in these children with diabetes mellitus as well [2-4, 9, 10]. Changes that occur in the brain that lead to cerebral edema and long-term neurological injury after DKA are poorly understood. In order to develop strategies to minimize and prevent the neurologic sequelae of DKA, we must first understand the alterations in cerebral blood flow that occur during DKA and which changes are maladaptive. This study provides further insight into the changes in cerebral blood flow and autoregulation in critically ill children with DKA that may contribute to intracranial complications.

No difference from expected age and gender matched normal values was found in the cerebral blood flow velocities of the left and right middle cerebral artery (MCA) during DKA. This is an interesting finding as these flow velocities were within the normal range for age and gender despite acidosis and hypocapnea, which should presumably result in decreased cerebral blood flow. This may represent an adaptive response of the child to try to maintain an adequate cerebral perfusion pressure. Prior studies including TCD studies by Roberts et al reported hyperemia as early as 2 hours into treatment for DKA [16, 29, 30]. The difference in our study results versus the Roberts et al. study may be related to what was considered a normal cerebral blood flow velocity for the patient. We compared the cerebral blood flow velocities to previously published age and gender matched normal values [24, 25]. The authors of the Roberts et al. study compared the measured blood flow velocities to values that were corrected for the patient’s carbon dioxide level and reported a relative hyperemia for a given carbon dioxide level; patients in this study were assumed to have intact CO2 reactivity, which may not have been true. We also compared each patient’s cerebral flow velocities during DKA to their flow velocities after resolution DKA and found no difference between values during and after DKA. This use of each patient as their own control also suggests that patients were not significantly hyperemic during DKA. The patients with cerebral edema on neuroimaging were not any more likely to have hyperemia on their TCDs than patients without clinical or imaging evidence of cerebral edema.

Unlike the MCAs, the mean flow velocities for the basilar artery were significantly lower than expected both during and after resolution of DKA; this study is the first to report changes in the BA flow velocity in children with DKA. These lower blood flow velocities may represent a relative failure of the posterior circulation to increase cerebral blood flow to maintain a constant cerebral perfusion pressure in a hypocarbic state. These diminished flows may result in ischemia during DKA. Glaser et al. reported that in magnetic resonance imaging of children during DKA, the occipital lobes had lower apparent diffusion coefficient values during DKA than other areas of the brain and those values continued to be lower during treatment [31]. Low apparent diffusion coefficient values suggest cytotoxic edema. Furthermore, children with cerebral edema also had significantly lower basilar flow velocities than patients with DKA but without cerebral edema in this study, which suggests that these abnormalities in cerebral flow may be a key feature in the development of intracranial injury during DKA. Notably, the hippocampus, which is important in cognition and formation of memories, is supplied by the posterior circulation; thus it is possible that hypoperfusion to the hippocampus contributes to the long term cognitive and memory deficits in patients with a history of DKA.

Our findings in combination of those of Glaser et al. suggest that the posterior circulation and occipital lobe may have a unique vulnerability to initial and prolonged cerebral ischemia during DKA in children. It is unclear why only the posterior circulation showed a difference in our study but this result may be due to limited power from the small sample size. Alternatively, glucose dysregulation may preferentially affect the posterior circulation involvement since hypoglycemia is known to predominantly cause parietal-occipital lobe ischemia [32, 33]. A recent study of children with type I diabetes also found that > 50% of them had focal slowing in the bilateral posterior region on electrocephalogram at the time of diagnosis; this finding also suggests sensitivity of the posterior brain to injury with abnormalities in glucose homeostasis [34].

Cerebral autoregulation was impaired in almost all patients in this study and remained abnormal in the majority of patients after correction of lab abnormalities. In other studies, autoregulation has been found to be abnormal in patients with type II diabetes and possibly longstanding type I diabetes presumably due to chronic endothelial injury and inflammation [16]. However, this is not the most likely explanation for impaired autoregulation in this study as the majority of the patients were newly diagnosed with diabetes. Abnormal autoregulation as seen in this study is more likely an acute change related to DKA. The reasons for this are not completely clear but one explanation may be that this prolonged loss of cerebral autoregulation is due to the fact that the cerebrospinal buffering system normalizes slowly in comparison to the faster normalization of the serum bicarbonate and pH. Two prior studies have looked at cerebral autoregulation during DKA in children. The first study reported that autoregulation, based upon the autoregulatory index, was abnormal in 5 of 6 patients during DKA but that cerebral autoregulation normalized by 30 hours from presentation [16]. A follow-up study by this group reported impairment in 40% of the patients with DKA and normalization of cerebral autoregulation in the majority of patients by 36-72 hours of therapy [22]. In contrast, our study found that a prolonged abnormality in cerebral autoregulation in the majority of our patients persisted even after labs had normalized. The difference in our results from those previously published by Ma et. al. may be related to how autoregulation was evaluated. In the Ma et al study, the method used to evaluate autoregulation utilized changes in the position of the head of the bed; however, with this approach, measurements can be confounded by the fact that intracranial pressure also may be influenced by bed position. The technique utilized in our study with transient compression of the internal carotid artery does not directly influence ICP.

Under normal conditions, cerebral autoregulation allows the brain to maintain a steady cerebral blood flow despite changes in blood pressure. With loss of normal autoregulation, patients are at risk for cerebral ischemia or hyperemia with small changes in blood pressure. A recent study by Deeter at al. reported of children with DKA found that 19 of 33 patients had hypertension before treatment and 82% had hypertension within the first 6 hours of admission [35]. About a quarter of the patients had continued hypertension after discharge. This observation of increased blood pressure may represent a physiologic response of the body during DKA to try to maintain cerebral blood flow in opposition to cerebral vasoconstriction due to hypocapnea. However, if patients have vasomotor paralysis as seen in our study, then this adaptive hypertension may cause harm by resulting in hyperemia and cerebral edema. These results suggest that patients may benefit from prolonged neuroprotective strategies such as tight blood pressure control because of persistent impairment in cerebral autoregulation even after lab values normalize.

These prolonged abnormalities in cerebral blood flow in the posterior circulation and cerebral autoregulation may contribute to the subtle cerebral injury and thus the longstanding cognitive and behavioral deficits that have been reported in children with DKA [36-38]. A single episode of DKA has been shown to been associated with cognitive dysfunction in rats [39]. There also is evidence of permanent cerebral injury after DKA in children. Patients with a single episode DKA have evidence of decreased gray matter and decreased N-acetylaspartate/creatine ratios on imaging [38, 40]. Thus, these acute derangements in cerebral hemodynamics even with a single episode of DKA may have long-term implications for the children’s neurologic outcome.

This pilot study is limited primarily by the small sample size and confirmation of our findings in larger studies of children with DKA need to be performed. Future studies should evaluate whether there is a correlation in neuropsychological measures with decreased basilar flow in patients. Also, future studies should evaluate children days and weeks out from presentation of DKA to determine how long alterations in cerebral autoregulation persist after resolution of DKA.

Conclusion

Basilar artery blood flow was decreased during DKA in our study and remained low after resolution of DKA. This may contribute to ischemic injury in these patients. Our data also suggests prolonged impairment of cerebral autoregulation occurs in children during DKA and persists after correction of lab abnormalities. Future larger studies are needed to further characterize the timing and changes to cerebral hemodynamics during DKA and any association with acute and long term neurological consequences for children with type 1 DM. Understanding these disruptions in cerebral blood flow may lead to future therapeutic targets with the goal to improve morbidity and cognitive outcomes of these children.

Financial support for study: none

References

  • Bello FA, Sotos JF (1990) Cerebral oedema in diabetic ketoacidosis in children. Lancet 336: 64. [crossref]
  • Edge JA, Jakes RW, Roy Y, et al. (2006) The UK case-control study of cerebral oedema complicating diabetic ketoacidosis in children. Diabetologia 49:2002-2009
  • Lawrence SE, Cummings EA, Gaboury I, Daneman D (2005) Population-based study of incidence and risk factors for cerebral edema in pediatric diabetic ketoacidosis. J Pediatr 146: 688-692. [crossref]
  • Hanas R, Lindgren F, Lindblad B (2007) Diabetic ketoacidosis and cerebral oedema in Sweden–a 2-year paediatric population study. Diabet Med 24: 1080-1085. [crossref]
  • Edge JA, Hawkins MM, Winter DL, Dunger DB (2001) The risk and outcome of cerebral oedema developing during diabetic ketoacidosis. Arch Dis Child 85: 16-22. [crossref]
  • Figueroa RE, Hoffman WH, Momin Z, et al. (2005) Study of subclinical cerebral edema in diabetic ketoacidosis by magnetic resonance imaging T2 relaxometry and apparent diffusion coefficient maps. Endocr Res 31:345-355
  • Glaser NS, Wootton-Gorges SL, Buonocore MH, Marcin JP, Rewers A, et al. (2006) Frequency of sub-clinical cerebral edema in children with diabetic ketoacidosis. Pediatr Diabetes 7: 75-80. [crossref]
  • Muir AB, Quisling RG, Yang MC, et al. (2004) Cerebral edema in childhood diabetic ketoacidosis: natural history, radiographic findings, and early identification. Diabetes Care 27:1541-1546
  • Krane EJ, Rockoff MA, Wallman JK, Wolfsdorf JI (1985) Subclinical brain swelling in children during treatment of diabetic ketoacidosis. N Engl J Med 312: 1147-1151. [crossref]
  • Ghetti S, Lee JK, Sims CE, Demaster DM, Glaser NS (2010) Diabetic ketoacidosis and memory dysfunction in children with type 1 diabetes. J Pediatr 156: 109-114. [crossref]
  • Yuen N, Anderson SE, Glaser N, Tancredi DJ, O’Donnell ME (2008) Cerebral blood flow and cerebral edema in rats with diabetic ketoacidosis. Diabetes 57: 2588-2594. [crossref]
  • Wootton-Gorges SL, Buonocore MH, Kuppermann N, et al. (2007) Cerebral proton magnetic resonance spectroscopy in children with diabetic ketoacidosis. AJNR Am J Neuroradiol 28:895-899
  • Salem MA, Matta LF, Tantawy AA, et al. (2002) Single photon emission tomography (SPECT) study of regional cerebral blood flow in normoalbuminuric children and adolescents with type 1 diabetes. Pediatr Diabetes 3:155-162
  • Foster JR, Morrison G, Fraser DD (2011) Diabetic ketoacidosis-associated stroke in children and youth. Stroke Res Treat 2011: 219706. [crossref]
  • Duckrow RB (1995) Decreased cerebral blood flow during acute hyperglycemia. Brain Res 703: 145-150. [crossref]
  • Vavilala MS, Souter MJ, Lam AM (2005) Hyperemia and impaired cerebral autoregulation in a surgical patient with diabetic ketoacidosis. Can J Anaesth 52: 323-326. [crossref]
  • Vavilala MS, Richards TL, Roberts JS, et al. (2010) Change in blood-brain barrier permeability during pediatric diabetic ketoacidosis treatment. Pediatr Crit Care Med 11:332-338
  • Vavilala MS, Marro KI, Richards TL, et al. (2011) Change in mean transit time, apparent diffusion coefficient, and cerebral blood volume during pediatric diabetic ketoacidosis treatment. Pediatr Crit Care Med 12: e344-349
  • Glaser N, Bundros A, Anderson S, Tancredi D, Lo W, et al. (2014) Brain cell swelling during hypocapnia increases with hyperglycemia or ketosis. Pediatr Diabetes 15: 484-493. [crossref]
  • Jaeger M, Schuhmann MU, Soehle M, et al. (2006) Continuous assessment of cerebrovascular autoregulation after traumatic brain injury using brain tissue oxygen pressure reactivity. Crit Care Med 34:1783-1788
  • Lang EW, Czosnyka M, Mehdorn HM (2003) Tissue oxygen reactivity and cerebral autoregulation after severe traumatic brain injury. Crit Care Med 31: 267-271. [crossref]
  • Ma L, Roberts JS, Pihoker C, et al. (2014) Transcranial Doppler-based assessment of cerebral autoregulation in critically ill children during diabetic ketoacidosis treatment. Pediatr Crit Care Med 15:742-749
  • Sloan MA, Alexandrov AV, Tegeler CH, et al. (2004) Assessment: transcranial Doppler ultrasonography: report of the Therapeutics and Technology Assessment Subcommittee of the American Academy of Neurology. Neurology 62:1468-1481
  • Bode H, Eden A (1989) Transcranial Doppler sonography in children. J Child Neurol 4 Suppl: S68-76. [crossref]
  • Bode H, Wais U (1988) Age dependence of flow velocities in basal cerebral arteries. Arch Dis Child 63: 606-611. [crossref]
  • Aaslid R, Newell DW, Stooss R, et al. (1991) Assessment of cerebral autoregulation dynamics from simultaneous arterial and venous transcranial Doppler recordings in humans. Stroke 22:1148-1154
  • Smielewski P, Czosnyka M, Kirkpatrick P, McEroy H, Rutkowska H, et al. (1996) Assessment of cerebral autoregulation using carotid artery compression. Stroke 27: 2197-2203. [crossref]
  • Giller CA (1991) A bedside test for cerebral autoregulation using transcranial Doppler ultrasound. Acta Neurochir 108:7-14
  • Glaser NS, Tancredi DJ, Marcin JP, et al. (2013) Cerebral hyperemia measured with near infrared spectroscopy during treatment of diabetic ketoacidosis in children. J Pediatr 163:1111-1116
  • Roberts JS, Vavilala MS, Schenkman KA, et al. (2006) Cerebral hyperemia and impaired cerebral autoregulation associated with diabetic ketoacidosis in critically ill children. Crit Care Med 34:2217-2223
  • Glaser NS, Wootton-Gorges SL, Marcin JP, Buonocore MH, Dicarlo J, et al. (2004) Mechanism of cerebral edema in children with diabetic ketoacidosis. J Pediatr 145: 164-171. [crossref]
  • Tam EW, Widjaja E, Blaser SI, et al. (2008) Occipital lobe injury and cortical visual outcomes after neonatal hypoglycemia. Pediatrics 122:507-512
  • Vijay K, Agarwal A (2010) Neonatal hypoglycemia resulting in occipital cerebral injury. Pediatr Radiol 40 Suppl 1: S178. [crossref]
  • Mackay MT, Molesworth C, Northam EA, et al. (2015) Diabetic ketoacidosis and electroencephalographic changes in newly diagnosed pediatric patients. Pediatr Diabetes 17:244-248
  • Deeter KH, Roberts JS, Bradford H, et al. (2011) Hypertension despite dehydration during severe pediatric diabetic ketoacidosis. Pediatr Diabetes 12:295-301
  • Nadebaum C, Scratch SE, Northam EA, et al. (2012) Clinical utility of mental state screening as a predictor of intellectual outcomes 6 months after diagnosis of type 1 diabetes. Pediatr Diabetes 13:632-637
  • Northam EA, Anderson PJ, Jacobs R, Hughes M, Warne GL, et al. (2001) Neuropsychological profiles of children with type 1 diabetes 6 years after disease onset. Diabetes Care 24: 1541-1546. [crossref]
  • Cameron FJ, Scratch SE, Nadebaum C, et al. (2014) Neurological consequences of diabetic ketoacidosis at initial presentation of type 1 diabetes in a prospective cohort study of children. Diabetes Care 37:1554-1562
  • Glaser N, Anderson S, Leong W, Tancredi D, O’Donnell M (2012) Cognitive dysfunction associated with diabetic ketoacidosis in rats. Neurosci Lett 510: 110-114. [crossref]
  • Wootton-Gorges SL, Buonocore MH, Caltagirone RA, et al. (2010) Progressive decrease in N-acetylaspartate/Creatine ratio in a teenager with type 1 diabetes and repeated episodes of ketoacidosis without clinically apparent cerebral edema: Evidence for permanent brain injury. AJNR 31:780-781