DOI: 10.31038/CST.2017224
Abstract
Aim: The aim of this study was to examine the factors influencing count density in low-dose molecular breast imaging and their impact on image quality.
Methods: One hundred patients scheduled for a diagnostic MBI procedure were imaged using a commercially available MBI system following the SNM Practice Guideline for Breast Scintigraphy, with one modification. Each 20 mCi (740 MBq) diagnostic dose of Tc-99m sestamibi was separated into two syringes, with each containing 10 mCi (370 MBq) or with one containing 5 mCi (185 MBq) and the other containing 15 mCi (555 MBq). Patients were randomly injected with 5 mCi, 10 mCi, or 15 mCi and imaged bilaterally in the craniocaudal (CC) view. The remaining fraction of the 20 mCi was then injected, followed by a standard four-view study.
Results: The two sets of CC view images were analyzed to determine the average count density for a given acquisition time and injected activity, after application of an effective half-life correction factor to account for the time-related combined effect of radioactive decay and cellular washout. The average count density of the MBI images was reduced by radiopharmaceutical decay and washout and imaging time should be adjusted accordingly in low dose imaging.
Conclusions : It was observed that the patient weight was one physical characteristic that should be considered for optimal image quality, with the dose increasing in proportion to the patient weight.
Keywords:
Breast Cancer, Breast Specific Gamma Imaging, Molecular Breast Imaging, Low Dose Imaging, Dense Breasts
Introduction
Imaging procedures can be classified into two groups: screening exams and diagnostic exams. The term “screening” is applied to imaging examinations performed on patients without signs or symptoms of disease while “diagnostic” examinations are conducted in response to clinical signs and symptoms present in a particular patient. The majority of medical imaging procedures are performed as diagnostic examinations, however the use of imaging to screen for disease, as is the case in mammography, has significantly increased in recent decades [1]. Mammography does have limitations in its ability to detect breast cancer in women with dense breast tissue [3]. The use of breast MRI has been proposed as an alternative screening examination [4]. Due to the high cost per procedure, its use continues to be limited to high-risk screening populations for whom costeffectiveness has been established [5]. Studies have suggested wholebreast ultrasound as a means to improve cancer detection in patients with dense breast and as a screening examination in women with high risk. Because of its low positive-predictive value and lower sensitivity than MRI, its use has not been broadly accepted [6].
There has been significant interest in the use of nuclear medicine imaging to detect breast malignancies [7, 8] with numerous peerreviewed published articles examining various aspects of its use. Molecular breast imaging (MBI), is a relatively new method for breast cancer detection employing gamma cameras specifically designed to image the breast, primarily using the radiotracer Tc-99m sestamibi [9, 10]. These studies indicate that its sensitivity for the detection of breast malignancies, especially in dense breasts, is comparable to that of MRI and is much higher than that of mammography and ultrasound. The primary limitation to this effort has been the radiation dose to patients (6.7 mSv from the 20 mCi of Tc-99m sestamibi). This dose is acceptable in a diagnostic population where the likelihood of malignancy is significantly higher. However, dose reductions should be achieved if it is to be used for screening; an effort that is being investigated [11]. The purpose of this prospective trial was to evaluate the hypothesis that the count density of MBI breast images scales linearly with the administered dose and to examine patient characteristics that influence the count density when performing low-dose MBI studies to maintain sufficient image quality.
Materials and methods
Study Design
A total of 100 patients scheduled for a routine diagnostic MBI procedure were invited to participate in the prospective dosereduction protocol. The study has been approved by the institutional review board and all subjects signed an informed consent form. Patients enrolling were imaged using a commercially available MBI system (Dilon Technologies, Newport News, Virginia) and imaging was conducted following the SNM Practice Guideline for Breast Scintigraphy with one modification [12]. Each 20 mCi diagnostic dose was separated into 2 syringes containing either two 10 mCi doses or a 5 and a 15 mCi dose. Patients were randomized into initially receiving doses of 5, 10 or 15 mCi, followed by bilateral craniocaudal (CC) acquisitions of 10 minutes. The remaining fraction of the full 20 mCi dose was then delivered and a normal 4-view imaging procedure consisting of bilateral CC and mediolateral oblique (MLO) images was conducted with an acquisition time of 10 minutes for each view. This protocol allowed for a direct comparison between low-dose and normal-dose CC images for each breast of each patient.
Prior to each injection, the activity in each syringe was measured in a dose calibrator. The activity of each dose, the time of each injection and the time between injections were recorded. For the last 60 patients (patients 41-100) the activity remaining in the syringe after the injection was also measured. The patients were typically injected in the arm contralateral to the side of clinical concern, if any, and imaging was performed on the suspicious breast first. Imaging was typically initiated about 10 minutes after injection of the radiopharmaceutical.
Image Analysis
A region-of-interest (ROI) encompassing the breast was drawn on each low-dose and normal-dose image. The total counts and the number of pixels in the ROI were recorded. The average count/pixel was determined and that value was divided by the pixel area (0.1024 cm2/pixel) to determine the average count density (in counts/cm2). Most images were taken for a total of 10 minutes (600 seconds). For images taken for times other than the nominal 10 minutes, the average count density was normalized to a 10-minute acquisition for comparison purposes. The low-dose photon density was compared to the normal-dose photon density for each patient, with each patient serving as her own control. An example set of images showing the region-of-interest and the corresponding average count/pixel value for both the low-dose and normal-dose images is shown in Figure 1.
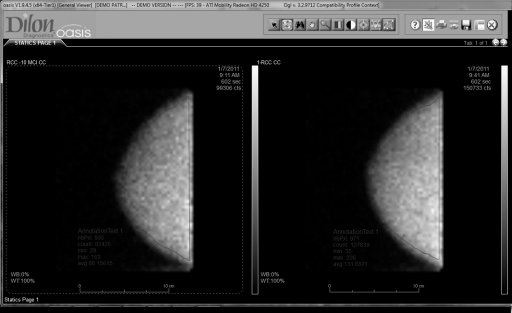
Figure 1. Examples of breast images taken at a low dose and at the normal dose showing the regions used to determine the average count density in each. The total counts in the region and the number of pixels in the region were used to calculate the average count/pixel value.
A dose-normalized count density (counts/cm2/mCi) was calculated for the images by dividing the count density by the injected dose. The injected dose was determined by a measurement of the activity immediately before the injection and in some cases that dose was reduced by a measurement of the dose remaining in the syringe after the injection. Only the last 60 patients had post-injection measurements taken. The injected dose for the normal-dose image was the sum of the injected dose for the low-dose image plus the injected dose from the remaining fraction of the full 20 mCi dose.
Six images were typically recorded for each patient; two at low dose (left and right CC) and four at the normal dose (bilateral CC and MLO). The relationship between the count density in the image and the injected dose, which is typically assumed in nuclear medicine and fundamental to any effort to lower the radiation dose to the patient, was explored using two comparisons. First, the ratio of the count density in the low-dose image to the count density in the normaldose image was compared with the ratio of the measured injected low dose to the measured injected normal dose. Second, the ratio of the count density to the measured injected dose (dose normalized count density) was compared for the low dose and normal dose cases. In each case the comparison was done on a patient-by-patient basis such that each normal-dose image could serve as a control for the low-dose image (Figure 2).
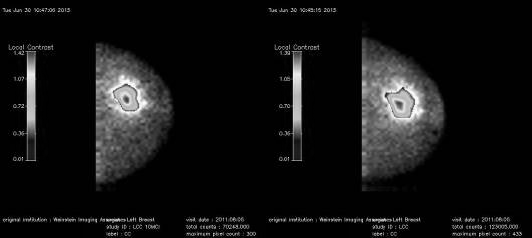
Figure 2. Examples of breast images taken at a low dose and at the normal dose showing the area where the local contrast was calculated. The algorithm calculates the average counts in the breast and then highlights the pixels in areas where this average value is exceeded and calculates the contrast.
Dose Corrections
To account for known time-related changes to the injected dose due to both physical effects (radioactive half-life) and physiological effects (radiotracer washout), radioactive decay and tissue washout corrections must be applied to determine the actual activity of tracer remaining in the breast tissue at the time of imaging. The decay correction is based on the well-known half-life of Tc-99m (361.2 minutes):
Decay Correction = D × 0.8909^T
where T = time in hours and D = Dose
The washout correction is based on modeling of Sestamibi washout from breast tissue as measured in previously published literature [13], assuming a half-life of Sestamibi in the breast tissue of 3 hours:
Washout Correction = D × exp(-T/3)
When used together, these corrections permit the direct comparison of images take at various time points.
Results
Dose Measurements
One hundred patients were enrolled in the study. The activity in the syringe prior to injection of the patient was recorded for both portions of the divided dose. The protocol was modified after the first 40 patients, to record the dose remaining in the syringe after each injection. This remaining dose was subtracted from the dose measured in the syringe prior to the injection to determine the actual injected dose. The total dose administered to the 100 patients is shown in the graph in Figure 3, for both the first 40 patients where no postinjection measurement was made and the last 60 patients where the dose remaining in the syringes was subtracted from the pre-injection dose. For the last 60 patients, the average actual dose injected for the 5 mCi, 10 mCi, and 15 mCi low dose groups was 3.4 mCi (SD=.5 mCi), 8.2 mCi (SD=1.1 mCi), and 12.5 mCi (SD=1.6 mCi), respectively. The average actual total dose injected for all groups in the last 60 patients was 15.3 mCi (SD=2.1 mCi). The percentage of the dose administered to the various dose groups was: 66% (SD= 10%) for the 5 mCi group, 78% (SD=9%) for the 10 mCi group, 80% (SD=9%) for the 15 mCi group and 74% (SD = 9%) for the normal-dose (20 mCi) group. These results indicated that the dose remaining in the syringe after the injection was a significant fraction of the initial dose prior to injection for this group of 60 patients and are consistent with previously reported values [14] where 20% (+- 8%) was retained in syringes of various types.
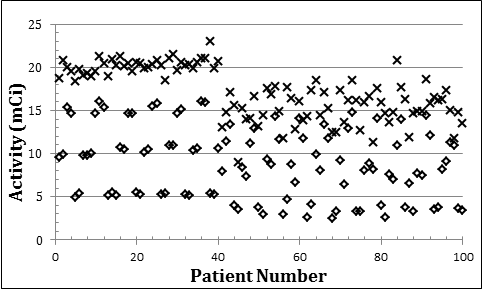
Figure 3. Graph showing the dose administered to the patients. Diamonds indicate the low dose and crosses indicate the normal dose. For the first 40 patients, the dose remaining in the syringe was not recorded and therefore the initial dose measured in the syringe prior to the injection was used for these patients. For the last 60 patients, the dose remaining in the syringe was subtracted from the initial dose and the actual delivered dose was calculated.
Image Count Density
The count density for the low-dose and normal-dose images were determined for the right CC image for each patient as described earlier. The ratio of the low-dose and normal-dose count densities was then compared with the ratio of the doses. A plot of this relationship is shown in Figure 4a for the last 60 patients, for which post-injection measurements of the dose remaining in the syringe were made. The quantitative analysis was restricted to these patients with complete information. A linear fit to these results indicates a coefficient of 1.11 (R2=0.96), i.e. slightly higher than 1. This implies that as the dose is increased, there is an 11% larger increase in the uptake. This represents a result that is contrary to what is typically assumed in nuclear medicine imaging and warrants further study. As discussed previously, both physical and physiological corrections were used to adjust the injected low dose for that dose remaining at the time of the second dose. After applying the corrections discussed earlier, a linear coefficient of 0.98 (R2=0.94) was determined, significantly close to a coefficient of 1 (see Figure 4b).
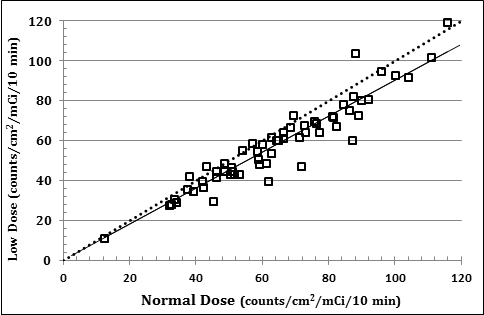
Figure 4a
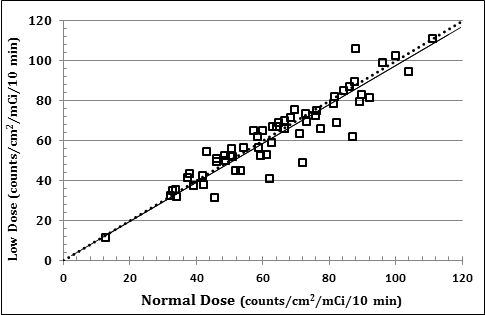
Figure 4b
Figure 4. Comparison of the dose normalized count density for the low dose and normal dose images. The results show the relationship a) before and b) after the normal dose was corrected for the decay of the isotope and washout of the radiopharmaceutical. The dashed line represents a slope of 1 and the solid line is a fit to the data (see text).
For the second comparison, the count density (as determined from the average counts per cm2 in the 10-minute breast image) was divided by the dose to determine the dose normalized count density (in counts/cm2/mCi). This value is independent of dose and should be the same for both the low-dose and normal dose-images, for any given patient. This relationship is shown in Figure 5a for the last 60 patients in the study. A linear fit to these data indicated a coefficient of 0.90 (R2 = 0.89). This deviation from a linear slope of 1 again indicates the fact that low-dose and high-dose injections give different count densities in the resulting images. After applying the corrections to the normal dose calculation, a linear coefficient of 0.98 (R2 = 0.87) is obtained for the same patient results (see Figure 5b).
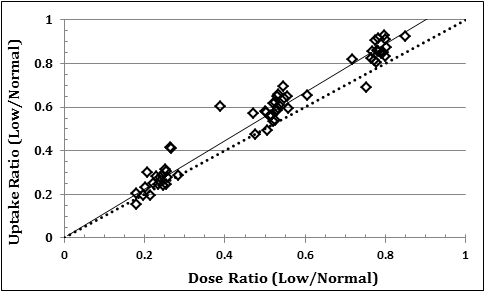
Figure 5a
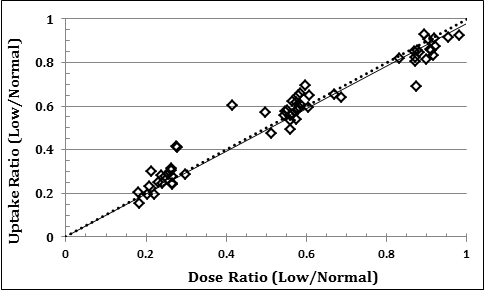
Figure 5b
Figure 5. Comparison of the ratio of the low and normal uptake to the ratio of the low and normal dose. The results show the relationship a) before and b) after the normal dose was corrected for the decay of the isotope and washout of the radiopharmaceutical. The dashed line represents a slope of 1 and the solid line is a fit to the data (see text).
Discussion
The data suggest that after correcting for the decay and washout of the radiopharmaceutical there is a linear relationship between the injected dose and the count density in the image.There was, however, a variation of uptake among patients given the approximate same doses. This can be seen in Figure 4b, where the average dose-normalized count density was 64.5 counts/cm2/ mCi, but with standard deviation of 21.5 counts/cm2/mCi. This represents a +- 33% variation in the uptake.
Various factors potentially have an influence upon this uptake, some related to patient metabolism and others to the clinical protocol used to administer the dose and perform the imaging. Recent papers have shown that patient fasting and peripheral warming increases the count density in the images and exercise causes a drop in count density in the images [15]. Another study indicated that menopausal status and postmenopausal hormone therapy increased the count density in the images [16] and there is a weak dependence of the count density on breast density and phase of the patient’s menstrual cycle when the imaging is performed [17]. These factors were not recorded as part of this study and potentially contributed to the wide variation in the measured photon density in the images.
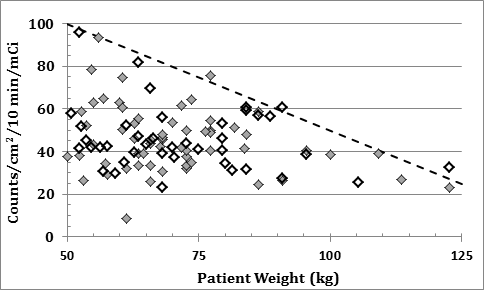
Figure 6. The dose normalized count density for various patients’ weights. The dose values for the first 40 patients (hollow diamonds) have been corrected for the dose remaining in the syringe after the injections, such that they can be compared to the last 60 patient (filled diamonds). The results indicate that there is an upper limit on the count density that decreases with patient weight which is shown by the dashed line in the graph.
The dose-normalized count density measured in the right MLO images versus patient weight for all patients in the study is shown in Figure 6.The count density measurements for the first 40 patients were reduced by 25%, which was the mean fraction of activity remaining in the syringe after injection for the last 60 patients for whom postinjection activity measurements were made. This was done to estimate the actual injected dose for those patients. Of particular note was the fact that there appeared to be an upper limit on the dose-normalized count density in the images, which decreased with patient weight. A line indicating this approximate upper limit has been included in the graph. The equation representing this line is given by:
Uptake (counts/cm2/mCi) = 150 – weight (kg)
This allows us to derive an equation that can be used to adjust the dose given to patients so that image quality can be maintained for heavier patients:
Weighted Dose = Base Dose * (100 / (150-Weight (kg) ) ) for [50< Weight < 125]
Conclusion
The relationship between the count density in the image and the injected dose is typically assumed in nuclear medicine and fundamental to any effort to lower the radiation dose to the patient. Quantitative measurements of the count density (counts/cm2) in gamma camera images of the breast acquired in 100 patients after two subsequent injections of Sestamibi confirm that there is a linear relationship between the image count density and the injected dose only after the decay of the isotope and washout of the agent were considered. This indicates that the decay of the isotope and the washout of the agent between the two injections have a measurable effect on quantitative measurements of the count density. The half-life of the Tc99m isotope is approximately 6 hours, which results in an 11% decrease in the activity over a typical 1-hour imaging sequence. The washout of the Sestamibi varies with the patients’ metabolism, but is typically more rapid than the decay of the isotope. A conservative estimate of 3 hours was used for the calculations in this study. This means that up to 20% of the Sestamibi could washout during a one-hour imaging sequence. In consideration of this decay and washout, the imaging time for each image in a sequence should be adjusted such that all the images in the sequence have approximately the same count density.
Also important in quantifying the actual dose delivered to the patient is a measurement of the dose remaining in the syringe after the injection. In the 60 patients for whom a post-injection measurement was made, an average of 25% of the initial measured dose remained in the syringe after the injection. Therefore, in a typical 20 mCi administered dose, only 15 mCi is actually received by the patient.
While a direct correlation between observed count density and patient weight was not observed, the appearance of an upper limit in the measured count density for a given weight was observed. This upper limit was described by the relationship:
Uptake (counts/cm2/mCi) = 150 – weight (kg)
Consideration of this relationship should dictate that the administered dose be increased as patient weight increases, so that a more constant count density can be achieved for all patient weights. Low-dose imaging can also be hampered by the fact that certain patients exhibit low uptake of tracer compared with other patients of the same weight. As previously discussed, this may be related to various metabolic or physiologic factors. A potential solution would be to adjust the acquisition time to achieve a standard count density in the image on a real-time basis during the acquisition. This requires monitoring the average pixel value during the acquisition and having the acquisition terminate based on that value.Alternatively, efforts have been made to increase the count density in the images by increasing the sensitivity of the MBI camera system through collimator design [18] or by using two detector heads, one on either side of the breast [19]. In this geometry, the reduction in spatial resolution with distance is compensated by the proximity of any area of interest to one of the two detectors [20]. Image combination method can also be used with a two-camera system to enhance the detectability of lesions either by enhancement of the signal to background [18].
An alternative to increase the performance of the molecular breast imaging procedure is to transition from two-dimensional imaging to three-dimensional imaging. Previously suggested concepts have shown increased performance for three-dimensional dedicated SPECT systems and quasi-three-dimensional tomosynthesis systems [21]. These systems have demonstrated superior performance but have yet to be widely implemented. A simple but elegant design that may gain acceptance is the concept of a variable-angle slanthole (VASH) collimator [22]. This type of concept could be easily retrofitted to existing MBI systems, could be used for molecular breast tomosynthesis (MBT), and be easily adapted to perform gammaguided biopsies. Analogous to the leap in diagnostic value seen by the recent transition from digital mammography to digital breast tomosynthesis, the transition from planar molecular breast imaging to 3-dimensional MBT may be a similarly important advancement in diagnosing cancers in the underserved population of high-risk women with dense breast tissue.
This study of 100 patients indicated that the average count density of the MBI images was reduced by radiopharmaceutical decay and washout and imaging time should be adjusted accordingly in low dose imaging. It was also observed that the patient weight was one physical characteristic that should be considered for optimal image quality, with the dose increasing in proportion to the patient weight.
Disclosures:
Benjamin Welch is an employee of Dilon Technologies and possess Dilon stock
Douglas Kieper is a previous employee of Dilon Technology and retains Dilon stock
Marcela Böhm-Vélez has nothing to disclose
Thomas Chang has nothing to disclose
Antoinette Cockroft has nothing to disclose
IRB statement:
This study has been approved by an institutional review board and all subjects signed an informed consent form.
References
- Van Steen A, Van Tiggelen R (2007) Short history of mammography: a Belgian perspective. JBR-BTR 90: 151-153. [crossref]
- Hendrick RE (2010) Radiation doses and cancer risks from breast imaging studies. Radiology 257: 246-253. [crossref]
- Kolb TM, Lichy J, Newhouse JH (2002) Comparison of the performance of screening mammography, physical examination, and breast US and evaluation of factors that influence them: an analysis of 27,825 patient evaluations. Radiology 225: 165-175. [crossref]
- Saslow D, Boetes C, Burke W, Harms S, Leach MO, et al. (2007) American Cancer Society guidelines for breast screening with MRI as an adjunct to mammography. CA Cancer J Clin 57: 75-89. [crossref]
- Mainiero MB, Lourenco A, Mahoney MC, Newell MS, Bailey L, et al. (2013) ACR Appropriateness Criteria Breast Cancer Screening. J Am Coll Radiol 10: 11-14. [crossref]
- Lee CH, Dershaw DD, Kopans D, et al. (2010) Breast cancer screening with imaging: recommendations from the Society of Breast Imaging and the ACR on the use of mammography, breast MRI, breast ultrasound, and other technologies for the detection of clinically occult breast cancer. J Am Coll Radiol 7:18-27.
- Liberman M, Sampalis F, Mulder DS, Sampalis JS (2003) Breast cancer diagnosis by scintimammography: a meta-analysis and review of the literature. Breast Cancer Res Treat 80: 115-126. [crossref]
- Sun Y, Wei W, Yang HW, Liu JL (2012) Clinical usefulness of breast-specific gamma imaging as an adjunct modality to mammography for diagnosis of breast cancer: a systemic review and meta-analysis. Eur J Nucl Med Mol Imaging Nov 14, 2012.
- Rhodes DJ, Hruska CB, Phillips SW, Whaley DH, O’Connor MK (2011) Dedicated dual-head gamma imaging for breast cancer screening in women with mammographically dense breasts. Radiology 258:106-118.
- Holbrook A, Newell MS (2015) Alternative Screening for Women with Dense Breasts: Breast Specific Gamma Imaging (Molecular Breast Imaging). AJR 204:252-256.
- Mettler FA Jr, Huda W, Yoshizumi TT, Mahesh M (2008) Effective doses in radiology and diagnostic nuclear medicine: a catalog. Radiology 248: 254-263. [crossref]
- Goldsmith SJ, Parsons W, Guiberteau MJ, Stern LH, Lanzkowsky L, et al. (2010) SNM practice guideline for breast scintigraphy with breast-specific gamma-cameras 1.0. J Nucl Med Technol 38: 219-224. [crossref]
- Del Vecchio SD, Ciarmello A, Pace P, et al. (1997) Fractional retention of technetium-99m-sestamibi as an index of p-glycoprotein expression in untreated breast cancer patients. J Nucl Med 38: 1348-51.
- Swanson TN, Troung DT, Paulsen A, Hruska CB, O’Conner MK (2013) Adsorption of Tc-99m sestamibi onto Plastic Syringes: Evaluation of Factors Affecting the Degree of Adsorption and Their Impact on Clinical Studies. J Nucl Med Technol 41: 247-252.
- O’Connor MK, Hruska CB, Tran TD, Swanson T, Conners AL, et al. (2015) Factors influencing the uptake of 99mTc-sestamibi in breast tissue on molecular breast imaging. J Nucl Med Technol 43: 13-20. [crossref]
- Hruska CB, Rhodes DJ, Conners AL, Jones K, Carter RE, et al. (2015) Background Parenchymal Uptake During Molecular Breast Imaging and Associated Clinical Factors. AJR 204: March 2015.
- Hruska CB, Conners AL, Vachon CM, O’Connor MK, Shuster LT, et al. (2015) Effect of menstrual cycle phase on background parenchymal uptake at molecular breast imaging. Acad Radiol 22: 1147-1156. [crossref]
- Keller EL (1968) Optimum dimensions of parallel-hole, multi-aperture collimators for gamma-ray cameras. J Nucl Med 9: 233-235. [crossref]
- Kieper D, Majewski S, Welch B (2008) Method to improve cancerous lesion detection sensitivity in a dedicated dual-head scintimammography system.
- Weinmann AL, Hruska CB, O’Connor MK (2009) Design of optimal collimation for dedicated molecular breast imaging systems. Med Phys 36: 845-856. [crossref]
- Williams MB, Judy PG, Gunn S, Majewski S (2010) Dual-modality breast tomosynthesis. Radiology 255: 191-198. [crossref]
- Gopan O, Gilland D, Weisenberger A, Kross B, Welch B (2014) Molecular Imaging of the Breast Using a Variable-Angle Slant Hole Collimator, IEEE Transactions on Nuclear Science 6: 1143-1152.