Abstract
The Variscan Ehrenfriedersdorf tin deposit (Germany) is a classic example of extreme enrichment of Sn and associated elements in granite–pegmatite systems. This study investigates the statistical distributions of major and trace elements derived from melt and fluid inclusion data, with particular emphasis on Gaussian, Lorendian, Voigt, and idealized Dirac-like distributions. These distributions provide quantitative insight into the physicochemical processes governing ore formation. A key result is the identification of weakly asymmetric pseudobinary solvus curves in the silicate melt–H2O (±B2O3) system, defined by water concentration versus temperature. Both granite- and pegmatite-related solvus curves exhibit closely similar critical points (≈25–30 % H₂O), despite differences in bulk composition. The region around these critical points coincides with pronounced enrichment of economically important elements, whose concentrations follow characteristic Gaussian, Lorendian, or mixed (Voigt) distributions when plotted against water content of the melt inclusion glass. Gaussian distributions reflect relatively well-mixed systems governed by multiple small-scale processes, whereas Lorendian distributions indicate rare but powerful enrichment events driven by lifetime-limited, interaction-based processes. The frequent occurrence of Lorendian behavior for elements such as Sn, Li, Be, Ta, and W points to episodic supercritical fluid or melt pulses. Extremely high, δ-like “runaway” concentrations are interpreted as the result of trapping stoichiometric daughter minerals during the transition from supercritical to undercritical conditions. These observations demonstrate that solvus geometry, element distribution functions, and critical phenomena are fundamentally linked. The data provide compelling evidence that supercritical, water-rich melts and fluids—likely derived from mantle–crust interaction—play a decisive role in redistributing elements and forming ore in the Ehrenfriedersdorf deposit and comparable Variscan systems.
Introduction
In recently published papers [1,2], in part results from melt and fluid inclusions were used to explain the formation of Sn, Ta, Nb deposits by extraction at the magmatic stages in porphyry deposits, the formation of pegmatites, and the growth of gems from extremely hard fluids (Li, Be, and B). This author and coauthors use a very different model to explain the formation of mineral deposits in general. According to the first author’s research in the last 30 years, especially after the development of a method for the determination of water in glasses and melt inclusions [3], an idea about the extreme element enrichment near the solvus crest of the pseudo binary silicate melt–water system in the form of Gaussian, Lorentzian, and Voigt element distributions was born. The Gaussian, Lorentzian, and Voigt distributions are key to understanding the behavior of silicate melts during ore-forming processes in the famous tin deposit of Ehrenfriedersdorf, Germany. Basic results are in Thomas et al. 2019 [4] and 2022 [5]. Figure 1 shows the generalized pseudobinary solvus curves for the Ehrenfriedersdorf granites and pegmatites. The solvus of the granites (blue curve) of the Ehrenfriedersdorf area is remarkably small due to high concentrations of fluorine, phosphorus, and alkalies (Li, Na, K, Rb, Cs). This curve shows some similarity to the phase diagram of the haplogranite-H2O system according to Bureau and Keppler (1999) [6], due to the strong deviation of the actual composition from the haplogranite system, resulting in significantly lower pressure (see also Sowerby and Keppler, 2002) [7]. The water content at the critical points (CP) of both curves (850°C, 25 % H2O and 712°C, 27.7 % (H2O+B2O3) is nearly identical.
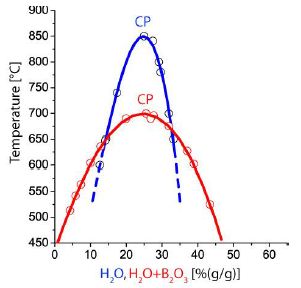
Figure 1: Pseudobinary solvus curves of evolved granites (blue) and pegmatites (red) for the Ehrenfriedersdorf tin deposit. CP – critical point. The critical point for the F-rich granites is 850°C and 25% H2O, and for the pegmatites, the CP is 712°C and 27.7% (H2O + B2O3).
The solvus curves of the granites and pegmatites determine the main processes for the enrichment of ore-forming and rare elements. As we will show below, the region around the critical point is where the crucial processes occur. To discuss the processes, we will first briefly define the relevant element distribution types in our case, including the Diracian distribution used by Vigneresse (2026) [2].
Gaussian, Lorentzian, Voigt, and Diracian distributions (see Linford, 2014 [8], and References in it)
Gaussian Distribution – “Normal Distribution” Natural Variability
The Geochemical meaning of a Gaussian (normal) distribution indicates that many small, random, additive processes produce element variability. That is the most common pattern in geochemistry. This kind of distribution results from measurement noise and multiple small-scale processes adding up (Central Limit Theorem). A Gaussian pattern suggests the system was relatively well-mixed and governed by many equal, independent factors – not dominated by rare or extreme processes. The standard Gaussian frequency distribution (distribution of an element) will not be considered here. We consider, in the following, the frequency distribution relative to another reference of the same sample (melt inclusion), for example, water (H2O) or (H2O+B2O3), which holds for the Lorentzian distribution (see further below). All points forming the corresponding curves are Gaussian distributed, which results from instrumental noise, sample heterogeneity, and counting statistics. In our case, the peak center corresponds to the sulvus crest, the water concentration at the critical point of the solvus curve. The area under the curve is proportional to the element concentration – giving us, in our case, information on the deviation from the corresponding Clarke concentration (see Rösler and Lange, 1975) [9].
Lorentzian Distribution — Presence of Outliers or Resonant Processes
A Lorentzian distribution has fatter tails than a Gaussian. That indicates occasional large excursions (outliers) and processes dominated by a few strong influences rather than many small ones. Typical causes are supercritical pulses that strongly enrich a trace element, forming a sharp element anomaly. For Lorentzian processes, “lifetime” effects (analogous to Lorentzian broadening in spectroscopy) are characteristic. A Lorentzian pattern implies that rare but powerful events influenced the chemical system. The “heavy tails” correspond to unusually high concentrations due to supercritical pulses. A Lorentzian distribution of an element indicates lifetime-limited or interaction-driven processes. It is important to note that, in our case, the Lorentzian curve is not a classic peak but a curve over another element concentration. Typical causes of the Lorentzian distribution are pressure- or collision-broadening and strong matrix or chemical interactions. The “peak” height becomes unreliable, but the area under the curve remains proportional to concentration.
Voigt Distribution
A Voigt profile is a convolution of Gaussian and Lorentzian effects, meaning both random noise and physical broadening mechanisms are important. The Voigt distribution, as a realistic concentration model, provides information about the instrumental noise (Gaussian component) and the physical or chemical broadening (Lorentzian component).
Dirac (δ) Distribution — Highly Uniform or Idealized Single-Value Concentrations
A Dirac delta distribution represents all values concentrated at one exact number – a perfect spike or an idealized, infinitely sharp line. That is, in our case, not attainable. In reality, this almost never occurs, but it is used conceptually to represent single transition energies or states in analog physical systems (e.g., δ-like spectral lines in the absence of broadening). A Dirac-like pattern suggests a geochemical reservoir with practically no heterogeneity, a mineral phase with stoichiometric composition, and an element controlled by a single dominant process (supercritical process) with negligible variability. An example is the appearance of ideal stoichiometric, however unusual, minerals in melt and fluid inclusions. In natural datasets, a δ distribution rarely occurs; it is more of a reference ideal. We call this distribution here because Vigeresse (2026) [2] used it for his very schematic interpretation.
Typical Examples of Distributions Obtained from Melt Inclusions in Quartz of Pegmatite and Pegmatite-Like Rocks from the Ehrenfriedersdorf Sn Deposit
It is important here that we correlate the distribution of trace and major elements with the water content of the melt inclusions, determined by micro-Raman spectroscopy [3]. The trace and major elements were determined using different analytical methods (microprobe, SIMS, LA-ICP-QMS, synchrotron radiation XRF, and Raman spectroscopy) – see Borisova et al. (2012) [10] and Thomas et al. (2019, 2022) [4,5]. First, we show the Rb vs. H2O distributions for a pegmatite from the Sauberg mine near Ehrenfriedersdorf, Central Erzgebirge, Germany. We see a distribution of Rb vs. H2O in melt and fluid inclusions, forming a solvus-like curve in the silicate-water range (up to about 50% H2O), and a distribution of Rb in the fluid phase at high water concentration (filled triangles).
A similar relationship holds for the B2O3-H2O and F-H2O systems of the Ehrenfriedersdorf pegmatite [11]; Thomas and Rericha, 2023). That means at least that the solvus curve obtained for the pegmatites related to the Variscan granites of the Ehrenfriedersdorf region is determined primarily by H2O, B2O3, Rb as well as by F. We will see that at least all elements forming Gaussian and Lorentzian curves over the water concentration take part in the formation of the characteristic solvus curves, because this refrains from the region around the critical point, the fringes fit well with the solvus curves. A similar plot result for antimony (Sb) vs. water. The Sb data for this plot were obtained using the Synchrotron radiation XRF technique with Monte Carlo-based quantification [12,13]. This plot clearly shows that trace elements like Sb also follow the solvus crest of the pegmatite-H2O system. In the fluid part of the system, even 700-900 ppm Sb is possible [10], obviously related to chlorine complexes.
We will later see that, around the critical point of the solvus, Gaussian and Lorentzian element distribution curves are sitting. That means the solvus, the Gaussian, and the Lorentzian curves are not independent. Figures 2 and 3 clearly show that, generally, on the right side of the solvus curves, a fluid phase coexists with the corresponding curve [14]. That means the coexistence of two melt inclusion types (A- and B-type MI) with fluid phases containing different daughter phases, often Al- and Si-bearing (topaz, muscovite). Now we will show a Gaussian distribution curve. As an example of such a Gaussian element distribution, see Figure 4: the distribution of Be versus water content in the measured melt inclusions.
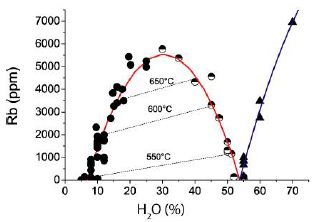
Figure 2: Plot of the Rb concentration in melt and fluid inclusions versus the water content. Black points represent the so-called A-type melt inclusions, and half-filled points represent the water-rich B-type melt inclusions, and the black triangles stand for fluid inclusions. The isotherms are drawn in for both melt inclusion types.
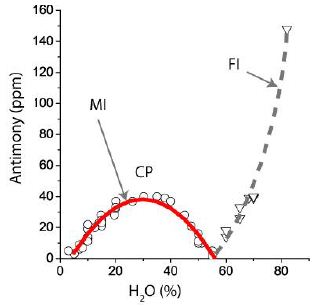
Figure 3: Distribution of antimony (Sb) in melt (red) and fluid (grey line) inclusions.
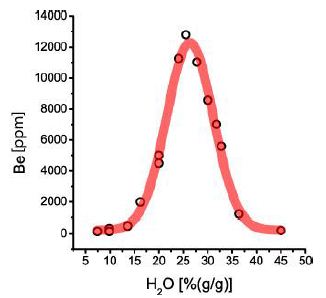
Figure 4: Gaussian distribution of Be versus the water content of melt inclusions in pegmatite quartz from Ehrenfriedersdorf (beryl-quartz vein in the Sauberg mine). The center is at 26.4% H2O, the half-maximum distance is at 9.5% water, the maximum of the Gaussian curve is at 12075 ppm Be, and the offset corresponds to 214 ppm Be. The offset represents the regional enrichment of Be for the given mineralization.
Gaussian curves are rare in Ehrenfriedersdorf Sn deposits. Most of the studied elements follow a Lorentzian distribution, as shown in Figure 5. The relationship between the solvus curve of pegmatite-like mineralizations is presented by Thomas and Rericha (2024) [15]. In this paper, the authors also establish a clear relationship between the solvus curve and the Lorentzian distribution of Sn, as well as a generalization of the Lorentzian distribution using normalized element concentrations CA/CA-crit versus the normalized water concentration of the solvus H2O/H2O-crit. This correlation enables the estimation of the Lorentzian distribution of any element from only a couple of measurements (Table 1).
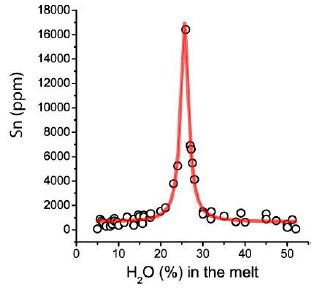
Figure 5: The figure shows the Lorentzian distribution of Sn vs. H2O, and in Table 1 are the resulting fitting data summarized. The center (25.7 % H2O) is the position of the peak’s center, which corresponds to the critical point of the solvus curve and the maximum (height) of the Sn concentration (here, 16400 ppm Sn). Width is the half-width at half-maximum (HWHM). The offset refers to the displacement of the Lorentzian curve from its original position along the x-axis (H2O concentration) corresponding to 644 ppm.
Table 1: Lorentzian fit of Sn, determined in silicate melt inclusions from the pegmatite system of the Sauberg mine near Ehrenfriedersdorf (46 measuring points). Each point is the mean of 5 to 10 single measurements. The values in the second data row are calculated (see Thomas 2025a).
| Area | Center | Width | Offset | Height | R2 | |
| A | xc | w | yo | Io | ||
| Measured | 57799 ppm2 | 25.7% H2O | 2.3% H2O | 644 ppm Sn | 16295 ppm Sn | 0.9843 |
| Calculated | 58871 ppm2 | 25.7% H2O | 2.3% H2O | (603 ppm Sn) | 16295 ppm Sn | 1.0000 |
Thomas (2025a) [16] also discusses the Lorentzian distribution in more detail. In this contribution, the Lorentzian data for the 10 elements Be, B, P, Cl, Zn, As, Cs, Sn, Ta, and W are tabulated. More elements of other mineralizations are in Thomas et al. 2019, 2022. Here, we will include the results of another element, which is of great economic significance at the time: Li.
Table 2 summarizes the Lorentzian data for Li shown in Figure 6. According to Rösler and Lange (1975) [9], the mean of granitic rocks is 40 ppm.
Table 2: Lorentzian fit of Li, determined in silicate melt inclusions from the pegmatite system of the Sauberg mine near Ehrenfriedersdorf.
| Area | Center | Width | Offset | Height | R2 |
| A | xc | w | yo | Io | |
| 273330 ppm2 | 25.1% H2O | 6.53% H2O | 1363 ppm Li | 26660 ppm Li | 0.9821 |
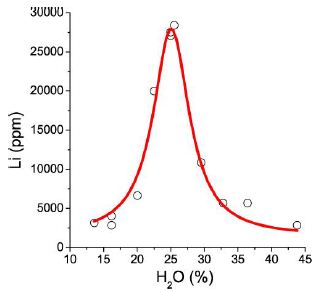
Figure 6: Lorentzian distribution of Li versus the water content in melt inclusions in pegmatite quartz from the Sauberg mine, Ehrenfriedersdorf/Germany.
In contrast to Sn, the width of Li is almost three times as large, and the value at the center (water content at the critical point) is 666.5 times that of the normal granite. The large width of the Li curve is a hint for the participation of Li in the formation of the solvus curve. Sometimes we also observe overlapping Lorentzian curves for a single element, as shown here for Be (Figure 7 and Table 3) [5].
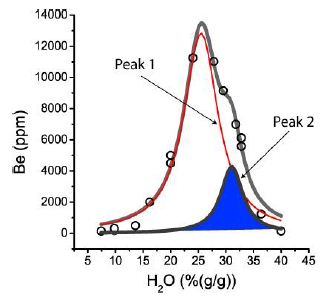
Figure 7: Distribution of Be in some melt inclusions in pegmatite quartz from Ehrenfriedersdorf (sample Qu8). The sum curve (grey) results from the overlapping of two Lorentzian components caused by different Be species in the melt inclusions. Peak 1 is representative of beryllonite [NaBePO4], and peak 2 (blue) is for hambergite [Be2BO3(OH,F)] as a daughter mineral.
Table 3: Lorentzian fit parameters for both Be curves.
| Center | Width | Height | |
| Peak 1 | 25.5% H2O | 7.5% H2O | 12840 ppm Be |
| Peak 2 | 31.0% H2O | 4.8% H2O | 4280 ppm Be |
In a single-melt inclusion, we found up to 71500 ppm Be as a large daughter crystal of beryllonite. That would, after the classic idea, be a (however real!) runaway value. This observation is typical for Lorentzian element distribution curves: peak height becomes unreliable. We see that the positions of the second Lorentzian Be peaks shift to higher H2O values with increasing bulk volatile concentration. This observation confirms the term “critical range.”
The fourth distribution, the Diracian distribution, is characterized by a signal that represents an idealized, infinitely sharp line. We often found extremely high concentrations at the centers of the Lorentzian distributions (mostly at the solvus crest). Such behavior is very typical for the Ehrenfriedersdorf case and does not approach the pure Lorentzian distribution. The distribution of tin (Figure 5) already suggests such a distribution. Also, the high Be value of 71500 ppm Be in the case of the first peak form, at least a so-called runaway value, which cannot be ignored. In the past, we often encountered so-called runaway data during our analytical work, which irritated us and others because it was mostly uncorrelated with other elements. See the extended discussion of our data by London and Evensen (2002) [17]. The first such example we found during the development of the first SYXRF-microprobe spectrometer at DESY/Hamburg in 1995, Thomas et al. (1995) [18], on a melt inclusion in quartz from the Sauberg mine near Ehrenfridersdorf. In the first studied melt inclusion, we found high Rb and Cs concentrations and extremely high Sn values, which could be traced to a cassiterite daughter mineral phase, as indicated by microscopic studies.
The so-called “Runaway-Points” can be explained very simply: At the transition of a supercritical fluid to the undercritical state, insoluble cassiterite microcrystalls form, are suspended in the melt, and are trapped by the change. A similar process can also be observed in the case of Be distribution, where different large beryllonite daughter crystals are trapped quite by chance. A completely different case is the sporadic occurrence of diamond crystals in the typical greisen rock of the Ehrenfriedersdorf tin deposits. The appearance of spherical diamonds (Raman peak at 1326 ± 9.8 cm-1, n = 13 different crystals) in such a typical crustal rock is clear proof of interaction with supercritical fluids coming from the Earth’s mantle. Another or additional explanation for the presence of diamonds in crustal rocks is the formation of extreme shock-like pressure at the transition of a supercritical fluid or melt into the undercritical state (see the whisker-like diamond needles in quartz crystals from Zinnwald, Thomas (2025b) [19]. Another surprising discovery is the presence of graphite and diamond aggregates or crystals (see Figure 8) in quartz, characterized by numerous melt and fluid inclusions, as the second explanation underline (Table 4).
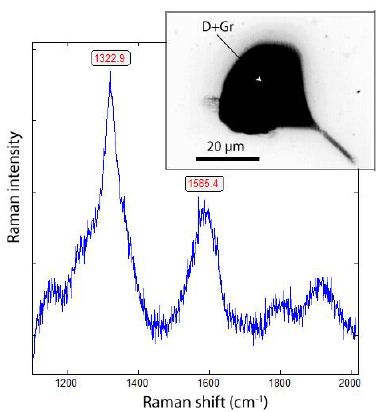
Figure 8: Raman spectrum of diamond (D)-containing graphite (Gr) in pegmatite quartz (Qu8) from the Sauberg mine near Ehrenfriedersdorf. The leaf-like graphite (right at the top) is 80 µm deep from the sample surface. The FWHM is 77 cm-1 (FWHM is Full Width at Half Maximum).
Table 4: Results of the Raman spectroscopic determination of diamond in pegmatite quartz (Qu8) from the Saubach mine near Ehrenfriedersdorf, Central-Erzgebirge/ Germany.
| Sample | Mean | 1s | FWHM | 1s | n |
| leaf-like graphite | 1324.4 | 2.9 | 75.9 | 5.0 | 10 |
1s: Standard Deviation, FWHM: Full Width at Half Maximum, n: Measured Points (at different points of the leaf; see Figure 8).
Discussion
In this contribution, we show, using the well-studied example from Ehrenfriedersdorf/Germany, that melt inclusions provide important information about element distribution. During the determination of water by Raman spectroscopy [3], a natural example of a solvus curve (water versus temperature) is identified for the first time. Further studies on the same example (Ehrenfriedersdorf) brought more information about the behavior of a couple of elements. Important ore-deposit-forming elements exhibit characteristic distributions that are Gaussian, Lorentzian, or mixed, such as the Voigt distribution. Very important points are the critical ones. It is remarkable that this point ± coincidence with all solvus, Gaussian, Lorentzian, and Voigt curves. Why is that so?. It is well known that, above the critical point, the matter is in the supercritical state. The presence of a Gaussian and/ or Lorentzian distribution indicates that we have not only a sharp peak but also a relatively large temperature range, from about 850 to 600°C (see Figure 1). Unusual physicochemical properties characterize this range: extremely low viscosity and extremely high diffusivity (see Thomas et al., 2019 [4], 2022 [5], 2023 [20]). These conditions enable the extreme enrichment of normally rare elements. By the transition of the supercritical fluid or extremely water-rich melt from the mantle region into under-critical conditions at the crustal level, a first crystallization of ore-forming minerals occurs – the trapping of such minerals (e.g., cassiterite, beryllonite, hambergite, and others with stochiometric composition) follows the Lorentzian distribution. A single dominant process with negligible variability controls such minerals. Similar processes also occur during a high-temperature hydrothermal stage (see Borisova et al. 2012) [10]: the trapping of Zn-rich minerals (88, 121, and 46,049 ppm) in two fluid inclusions, only some micrometers apart, in pegmatite quartz. The trapped mineral phase, according to Raman (room temperature), is a daughter crystal of K2[ZnCl4] (flinteite) in both fluid inclusions in pegmatite quartz (Qu8) from the Ehrenfriedersdorf tin deposit, with high Rb, Cs, and Br concentrations in the flinteite formula.
The finding of co-trapped high-pressure minerals, including diamond, moissanite, coesite, lonsdaleite, kumdykolite, reidite, as well as high-pressure orthorhombic cassiterite, in nearly all parts of the Ehrenfriedersdorf deposit (diamonds and BN also in the greisen part), underscores the significance of the supercritical state and the decisive role of supercritical fluids or extreme water-rich melts (see e.g. Thomas and Trinkler, 2024) [21]. First hints of such a scenario were discussed by Schütze et al. 1983 [22]. These authors, based on their studies, conclude that the inducing processes are subduction- or subfluence-related and involve older ocean crust. Our studies provide evidence that supercritical, water-rich melts and/or fluids have a significant influence on the entire Variscan ore mineralization in the Central Erzgebirge and elsewhere. The often-cited evidence that, for example, a large part of the tin is transported as orthorhombic cassiterite underscores the active interaction between mantle and crust. By the existence of orthorhombic cassiterite crystals in the supercritical fluid, it is plausible that this fluid is also saturated in Sn. That is compatible with the new discussion that a lot of water is concentrated in the deep Earth (see, for example, Mohn et al., 2025) [23-25] and may move episodically from the mantle deeps into the crust (see also Thomas et al., 2025a) [15].
Acknowledgments
We thank Jean-Louis Vigneresse for initiating this contribution, which will address some differences in his viewing and our understanding of the meaning of melt inclusions for ore-forming processes.
References
- Vigneresse J-L, Poddar A, Chattaraj PK (2025) Felsic trans-porphyry deposits and associated ore (Sn, Ta, Nb, pegmatites) viewed from physics, chemistry (cDFT) and geologic Lithos 514-515: 1-15.
- Vigneresse J-L (2026). Specificity of ore generation (tin, pegmatites, and gems) in trans-porphyry deposits. Minerals 16: 1-32.
- Thomas R (2000) Determination of water contents of granitic melt inclusions by confocal laser Raman microprobe American Mineralogist 85: 868-887.
- Thomas R, Davidson P, Appel K (2019) The enhanced element enrichment in the supercritical states of granite-pegmatite systems. Acta Geochim 38: 335-349.
- Thomas R, Davidson P, Rericha A, Voznyak DK (2022) Water-rich melt inclusions as “frozen” samples of the supercritical state in granites and pegmatites reveal extreme element enrichment resulting under non-equilibrium Mineralogical Journal (Ukraine) 44: 3-15.
- Bureau H, Keppler H (1999) Complete miscibility between silicate melts and hydrous fluids in the upper mantle: experimental evidence and geochemical Earth and Planetary Science Letters 165: 187-196.
- Sowerby JR, Keppler H (2002) The effect of fluorine, boron and excess sodium on the critical curve in the albite-H2O Contrib Mineral Retrol 143: 32-37.
- Linford MR (2014) The Gaussian-Lorentzian sum, product, and convolution (Voigt) functions used in peak fitting XPS narrow scans, and an introduction to the impulse Vacuum Technology & Coating 8(2): 1–6.
- Rösler HJ, Lange H (1975) Geochemische VEB Deutscher Verlag für Grundstoffindustrie. Leipzig 675 Pg.
- Borisova AY, Thomas R, Salvi S, Candaudap F, Lanzanova A, Chmeleff J (2012) Tin and associated metal and metalloid geochemistry by femtosecond LA-ICP-QMS microanalysis of pegmatite-leucogranite melt and fluid inclusions: new evidence for melt-melt-fluid Mineralogical Magazine 76: 91-113.
- Thomas R, Förster HJ, Heinrich W (2003) The behaviour of boron in a peraluminous granite-pegmatite system and associated hydrothermal solutions: a melt and fluid-inclusion study. Contrib Mineral Petrol 144: 457-472.
- Rickers K, Thomas R, Heinrich W (2004) Trace-element analysis of individual synthetic and natural fluid inclusions with synchrotron radiation XRF using Monte Carlo simulation for Eur J Mineral 16: 23-35.
- Rickers K, Thomas R, Heinrich W (2006) The behavior of trace elements during the chemical evolution of the H2O-, B-, and F-rich granite-pegmatite-hydrothermal system at Ehrenfriedersdorf, Germany: a SXRF study of melt and fluid Miner Deposita. 41: 229-245.
- Vogel R (1959) Die heterogenen Leipzig. Pg: 728.
- Thomas R, Rericha A (2024) Meaning of supercritical fluids in pegmatite formation and critical-element Geol Earth Mar Sci 6: 1-5.
- Thomas R (2025a) Interpretation of the Lorentzian distribution of tin in the Variscan Ehrenfriedersdorf deposit/Germany. Geol Earth Mar Sci 7: 1-5.
- London D, Evensen JM (2002) Beryllium in silicic magmas and the origin of beryl-bearing Reviews in Mineralogy & Geochemistry 50: 445-486.
- Thomas R, Klemm W, Haller M, Knöchel A, Radtke M (1995) First results on melt inclusions in geological samples using SYXRF-microprobe. Hamburger Synchrotronstrahlungslabor HASYLAB am Deutschen Elektronen-Synchrotron Jahresbericht II, 961-962.
- Thomas R (2025b) The change from supercritical fluid-melt system into the undercritical stage: The Zinnwald Geol Earth Mar Sci 7: 1-9.
- Thomas R, Davidson P, Rericha A, Recknagel U (2023) Ultrahigh-pressure mineral inclusions in a crustal granite: Evidence for a novel transcrustal transport mechanism. Geoscience 94: 1-13.
- Thomas R, Trinkler M (2024) Monocrystalline lonsdaleite in REE-rich fluorite from Sadisdorf and Zinnwald/E-Erzgebirge, Germany. Geol Earth Mar Sci 6: 1-5.
- Schütze H, Stiehl G, Wetzel K, Beuge P, Haberland R, et al. (1983) Isotopen-undelementgeochemische sowie radiogeochronologische Aussagen zur Herkunft des Ehrenfriedersdorfer Granits-Ableitung erster ZFI-Mitteilungen 76: 232-254.
- Mohn CE, Caracas R, Conrad CP (2025) Lower mantle water distribution from ab initio proton diffusivity in Earth Planet Sci Lett 649: 1-10.
- Thomas R, Brümmer G, Scheiblauer K (2025) Paradigm change of pegmatite formation – Where does the water come from?. Geol Earth Mar Sci 7: 1-7.
- Thomas R, Webster JD, Davidson P (2011) Be-daughter minerals in fluid and melt inclusions: implications for the enrichment of Be in granite-pegmatite systems. Contrib Mineral Petrol 161: 483-495.