Abstract
Natural topaz crystals from the Schneckenstein deposit, Vogtland, Germany, were examined by optical microscopy and low-power Raman spectroscopy to characterize rare colorless spherical inclusions associated with previously reported diamond-bearing topaz. The inclusions, commonly up to about 25 µm in diameter and including smaller examples near 5 µm, occur within the topaz matrix and are therefore unlikely to represent surface contamination. Raman spectra obtained at low laser power show a characteristic band near 471 cm-1, together with additional bands that are broadly consistent with boron-rich phases or boron-bearing Al–B–C microdomains. Spectral similarities are noted with rhombohedral boron, AlB12-type compounds, and boron carbide components, but these assignments remain tentative because several possible phases have overlapping Raman features. Bands near 1331–1332 cm-1 and around 1450 cm-1 may indicate boron-doped diamond or related carbon-bearing phases, although alternative interpretations cannot yet be excluded. The unexpected optical transparency of the inclusions, possible pressure-related band shifts, and the use of Raman spectroscopy as the principal method make the phase identification preliminary. Overall, the observations provide preliminary Raman evidence for unusual boron-rich Al–B–C microphases in Schneckenstein topaz and may be compatible with high-pressure processes and transport by supercritical fluids or melts during Variscan mineralization. Confirmation by complementary structural and chemical methods remains essential
Keywords
Topaz, Schneckenstein, Vogtland, Raman spectroscopy, Boron-rich inclusions, Rhombohedral boron, AlB12, Boron carbide, Boron-doped diamond, High-pressure mineralization, Supercritical fluids.
Summary
In summary, the Schneckenstein topaz contains rare, water-clear spherical inclusions whose Raman spectra indicate a complex association of boron-rich phases, possible AlB12-type components, boron carbide, and boron-doped diamond. Their occurrence within unprepared natural topaz excludes preparation-related contamination and points to an unusually high-pressure mineral assemblage preserved in the topaz matrix. Although the phase assignments remain provisional, the observations strengthen the interpretation that supercritical fluids or melts played an important role in transporting mantle-derived or ultrahigh-pressure components into the Variscan crustal mineralization system.
Introduction
The Schneckenstein deposit in Vogtland, Germany, is a classical occurrence of natural topaz and has long attracted mineralogical interest because of the quality, transparency, and unusual inclusion inventory of its crystals [1,2]. Earlier work on Schneckenstein topaz included determinations of the fluorine content and studies of fluid inclusions, which revealed boric-acid-rich fluids and provided evidence for complex postmagmatic processes during Variscan mineralization [3]. Recent Raman spectroscopic investigations have expanded this picture by reporting micrometer-sized spherical diamond crystals in Schneckenstein topaz (see Table 1 ), together with additional high-pressure or high-temperature mineral relics [4]. Ti-rich topaz relics with the idealized composition Al2(TiO4)F2 were also described and interpreted as possible indicators of unusual formation conditions. These observations suggest that Schneckenstein topaz may preserve a more complex inclusion assemblage than previously recognized, although the pressure–temperature significance of individual phases remains to be tested carefully. During further microscopic screening of natural, unprepared topaz cleavages, rare water-clear spherical inclusions were observed that differ from diamond in their Raman spectra. The present contribution focuses on these inclusions. Using optical microscopy and low-power Raman spectroscopy, the study documents their occurrence, compares their spectra with reference data for boron-rich phases, and evaluates whether they may represent unusual boron-bearing Al–B–C microphases preserved in the topaz matrix.
Table 1: Results of the Raman measurement in the first-order range of diamond from Schneckenstein [4].
|
Diamond |
FWHM | G-band | FWHM | n |
|
Topaz from Schneckenstein |
||||
|
1326.6 ± 4.2 cm-1 |
41.6 ± 25.4 cm-1 | 1597.3 ± 2.8 cm-1 | 61.2 ± 3.5 cm-1 | 14 |
| 1304.2 ± 1.9 cm-1 | 22.7 ± 1.7 cm-1 | not present | – |
7 |
FWHM – Full Width at Half Maximum. n – number of measured crystals.
Sample Material
The Schneckenstein topaz samples were collected during a visit to Schneckenstein in October 1960, together with Peter Haupt. In this study, only centimeter-sized natural crystal cleavages, generally perpendicular to the c-axis, were used (Figure 1). Descriptions of the Schneckenstein occurrence are given by Rösler et al. (1968) [1] and Lahl (2012) [2]. The general appearance of the free topaz crystals is shown in Figure 1.
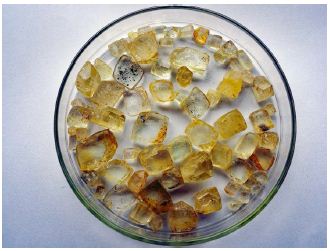
Figure 1: Topaz crystals from Schneckenstein. The Petri dish has a lower diameter of 9 cm. Most specimens have crystal cleavages perpendicular to the c-axis.
A typical Raman spectrum of topaz from Schneckenstein is shown in Figure 2. According to Thomas (2026a [6], 2026b [4], the topaz from Schneckenstein contains 19.26 ± 0.74.% F; earlier measurements yielded 19.15 ± 0.14 % F (Thomas 1982) [3]. The notation % F means [% (g/g)], because wt.% is not a correct and allowed unit (IUPAC 1988), see Ebel et al. (2004) [5]. The Schneckenstein samples are ideal for optical measurements and the study of diamonds, as no preparation is required. Therefore, we can exclude contamination from diamond-bearing tools.
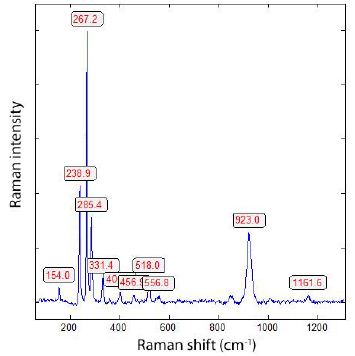
Figure 2: Typical Raman spectrum of topaz from Schneckenstein (532 nm laser, 0.9 mW on sample).
The topaz crystals are generally wine-yellow and water-clear. Only a few crystals contain visible black spots, mostly composed of rutile. The topaz is also rich in fluid inclusions, with homogenization temperatures of 407 ± 25°C (n = 54) and critical behavior [3]. The fluid inclusions are rich in boric acid and are arranged along planes perpendicular to the c-axis. Based on their overall character, they are interpreted as secondary inclusions.
Figure 2 shows a typical Raman spectrum of topaz from Schneckenstein, obtained with the 532 nm laser and a typical sample power of 0.9 mW.
A strong triplet characterizes the Raman spectrum of topaz at approximately 239, 267, and 285 cm-1, and by a medium-intensity band at 923 cm-1. This topaz triplet overlaps with the low-frequency Raman range studied for the inclusions.
Microscopy and Raman Spectroscopy: Methodology
Preliminary studies of the samples were performed with a Zeiss JENALAP pol equipped with a universal stage UT 124 and various compensators (Brace-Köhler and Ehringhaus). We performed all microscopic and Raman spectroscopic studies with a petrographic polarization microscope (BX 43) with a rotating stage coupled with the EnSpectr Raman spectrometer R532 (Enhanced Spectrometry, Inc., Mountain View, CA, USA) in reflection and transmission. We used Raman spectroscopy as the main tool for characterizing the inclusion crystals (diamond, DLC, graphite, carbon), as well as the newly identified boron-bearing phases. The Raman data presented here were acquired using an EnSpectr Raman microscope (RamMics R532). Measurements covered the spectral range from 0 to 4000 cm⁻¹ and were conducted with a single-mode 532 nm laser operating at a maximum output of 50 mW. Analytical settings included a 20 µm entrance aperture, a holographic grating of 1800 g mm⁻¹, and a spectral resolution of approximately 4 cm⁻¹ (generally for the whole range). For most analyses, a long-working-distance Olympus LMPlanFL 100× objective is used. Laser power at the sample surface was continuously adjustable down to 0.02 mW. Higher powers (up to 50 mW) were applied only for overview measurements. Generally, for all Raman measurements during this study, we used 0.9 mW of the 532nm laser on the sample over the whole range (0-4000 cm-1) to prevent local heating, which is particularly critical for boron solids. Raman band positions were calibrated before and after each measurement series using the Si band of a semiconductor-grade single-crystal silicon chip. Based on 20 repeated measurements, run-to-run reproducibility was ± 0.2 cm⁻¹ for silicon (520.2 ± 0.2 cm⁻¹) in the measuring range 100 to 1450 cm-1. As a second reference, we used a water-clear diamond crystal from Brazil. For the first order diamond line, we obtained (1330.1 ± 0.6) cm-1 with a FWHM = 5.1 ± 0.1 cm-1. FWHM stands for Full Width at Half Maximum.
Attention: High Risk of Thermal Phase Alteration
The green lasers possess high energy density and are highly absorbed by dark, ceramic phases like B4C and α-AlB12 or sp2-rich
DLC:
- Laser-Induced Oxidation: If the laser power is set too high (typically above 5–10 mW at the sample surface), the localized focal spot can rapidly heat up in That converts the sample into B2O3or α-Al2O3 right under the beam.
- Spectral evidence of burning: The sudden, irreversible emergence of sharp peaks at 378 and 418 cm-1(α-Al2O3) or the widening of the boron peaks mid-scan indicate that the laser power is too high.
- Fix: Drop the laser power down to 1–2 mW and use longer acquisition times to collect a clean spectrum Therefore, we generally use a laser power of 0.9 mW on the sample.
For example, the fingerprint Raman line at 471.5 cm-1 (0.9 mW) shifts to 477.6 cm-1 at 30 mW and to 477.8 cm-1 at 50 mW; at 50 mW, the characteristic lines of α-Al2O3 at 377.4 and 419.5 cm-1 appear.
Results
Careful screening of the topaz crystals revealed, in addition to spherical diamond crystals, colorless spherical crystals that differ strongly from diamond by Raman spectroscopy. Figure 3 shows a typical crystal. Such large inclusions, about 25 µm in diameter, are rare; smaller ones are relatively widespread. The inset in Figure 3 shows a small inclusion (5 µm) not much wider than the large one, with the same Raman characteristics as the larger one.
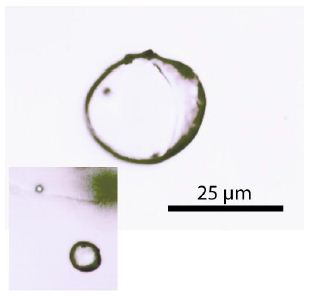
Figure 3: Inclusion in topaz. The inclusion is covered by a thin topaz (Toz) layer (36 µm thick). The inserted figure on the left shows the same inclusion, and the smaller one (13 µm depth) on the top left is more typical.
The depth in the topaz matrix shows clearly that the spherical crystals are not surface contamination.
Figure 4 shows the Raman spectrum of an inclusion part not covered with a topaz layer (this inclusion lies directly on the surface.
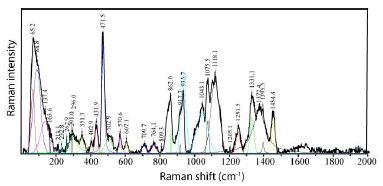
Figure 4: Overall view of the Raman spectrum of the large inclusion, similar to the crystal-like Figure 3. The Raman band between 1300 and 1500 cm-1, according to Zaitsev (2001) [9], is observed in boron-doped diamond films around the inclusion.
The Raman spectrum has, in addition to the broad and intense band under 200 cm-1 (of unclear origin), an intense Raman peak at 471.5 cm-1, which may serve as a fingerprint of β-rhobohedral boron [7]. Raman spectra from the inclusion in natural topaz from Schneckenstein show bands compatible with boron-rich Al–B or Al–B–C structures. Although a direct assignment to α-AlB12 or γ-AlB12 is not yet possible, the spectra suggest the presence of unusual boron-bearing inclusions or microphases that warrant further structural and chemical investigation. Table 2 (first column) shows the measured results for 0.9 mW laser power on the sample, compared with the data presented by Werheit et al. (2010) [7]. In Table 2, the Raman band corresponding to boron-doped diamond, indicated by the strong band at 1452.8 ± 2.5 cm-1, is not shown. The diamond line is from 10 different inclusions at 1331.2 ± 0.6 cm-1, the FWHM = 26.3 ± 4.2 cm-1. The Raman spectrum of the spherical crystal 5 is shown in Figure 5. A strong Raman fingerprint band at 471.6 cm-1 also characterizes C-doped β-rhombohedral boron. The bands at 261, 848, and 925 cm-1 belong to the topaz matrix.
Table 2: Results of the Raman measurements on 10 different spherical crystals in topaz (this work) and comparison with data from Werheit et al. (2010) [7] and Jay et al (2023) [8] for B4.3C. Data in cm-1. Laser: 532 nm, 0.9 mW on sample.
|
Thomas |
Werheit et al. (2010) [7] and Jay et al. (2023) [8] | ||||
|
First-order Raman lines |
|||||
|
|
α-rh. boron | β-rh. boron | a-AlB12 | π-AlB12 | B4.3C |
| 282 |
270 |
||||
|
297.4 ± 9.6 |
309 | 294 | 294 | ||
|
321 |
|||||
|
351.0 ± 1.6 |
357 | 357 | 346 | ||
|
376 |
|||||
|
|
391 | ||||
| 431.7 ± 1.1 | 414 | 416 | 414 |
417 |
|
|
|
456 | ||||
| 471.1 ± 0.9 | 480 | 472 | 476 |
477, 488 |
|
|
493.1 ± 9.8 |
494 | 495 | 495 | ||
| 527 | 516 | 516 |
529, 536 |
||
|
570.3 ± 3.2 |
552 | 565 | 561 | 562 | |
| 589 | 594 | 578 |
575 |
||
|
607.9 ± 2.9 |
615 | 615 | |||
| 630 | 632 |
633 |
|||
|
|
656 | 652 | |||
| 694 | 685 | 680 |
699 |
||
|
714.2 ± 3.8 |
713 | 711 | 709 | 719 | |
| 762.1 ± 1.8 | 750 |
773 |
|||
|
778 |
768 | ||||
| 795 | 805 |
815 |
|||
|
813 |
844 | 841 | |||
| 854.0 ± 4.4 | 873 | 885 | 866 |
867 |
|
|
|
905 | ||||
| 925.0 ± 3.6 | 934 | 927 |
932 |
||
|
987 |
994 | ||||
| 1044.3 ± 2.5 | 1039 | 1035 |
1042 |
||
|
1075.3 ± 4.6 |
1097 | 1058 | 1058 | 1071 | |
| 1094 |
1096 |
||||
|
1114.9 ± 9.7 |
1125 | 1125 | 1125 | 1131 | |
|
1160 |
|||||
|
1187 |
|||||
| 1201 | 1219 |
1223 |
|||
|
1251.1 ± 2.6 |
1238 | 1217 | 1248 |
1252 |
|
|
Second-order Raman lines |
|||||
| 1452.8 ± 2.5 |
1464 |
||||
|
1719 |
1710 |
||||
a-rh. boron – a-rhombohedral boron, b-rh. boron – b-rhombohedral boron, α-AlB12 and π-AlB12 – two different crystal modifications of aluminumdodecaboride (AlB12), and B4.3C – boron carbide.
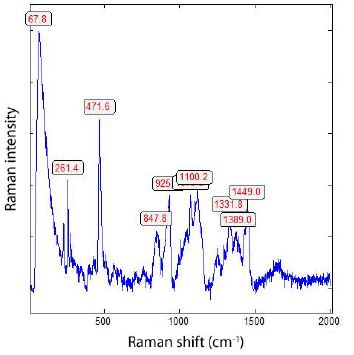
Figure 5: Raman spectrum of spherical crystal 5. The bands around 261 cm-1 are due to the matrix topaz. The strong band at 471.6 cm-1 is the fingerprint line, possibly of the α-AlB12 molecule, and the band at 1100 cm-1 can be assigned to the β-rhombohedral boron. The Raman band at 67.8 cm-1 (about 52.5 cm-1 lower) may result from the E2g mode of hexagonal h-BN.
If we take a Raman spectrum over the range 0-200 cm-1, we observe a Raman band at 51.8 cm-1, which is well fit to the E2g interlayer mode of h-BN. The bands at 1331.8 and 1450 cm-1 are due to B-doped diamond [9]. Because the spherical crystals (inclusions) are completely transparent, it is not possible to achieve high sp2 content. Because we have found more than three such oval-to-spherical crystals in one remnant of Ti-topaz (Figure 2 in Thomas 2026b [4], we can assume that the β-rhombohedral boron is doped with Ti (see also Werheit et al. 2010) (Figures 6 and 7) [7].
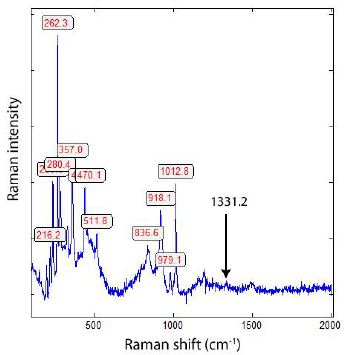
Figure 6: Raman spectrum of a small (5µm) colorless inclusion in topaz, mainly composed of rhombohedral boron. The presence of a diamond (1331.2 cm-1) component is only outlined.
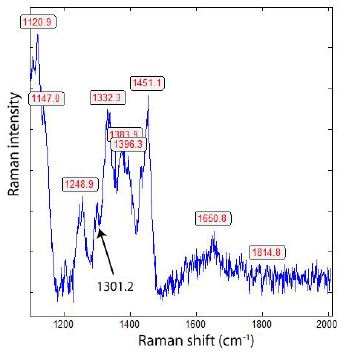
Figure 7: Part of the Raman spectrum (Figures 4 and 5), which, according to Zaitsev (2001) [7], is interpreted as boron-doped diamond.
Another interpretation is more probable (because no phase boundary in the inclusion can be seen): the bands at 1121, 1147, and 1249 cm-1 can be assigned to a-AlB12 (see also Table 2); the 1332.3 cm-1 band corresponds to diamond, and the 1301 cm-1 band may be attributed to cubic BC2N.
Interpretation
The interpretation is only provisional because, with Raman alone, a straightforward interpretation is difficult. A large complication is the water-clear transparency of the studied inclusions. Boron is a black semimetal. Under high pressure between 19 and 89 GPa, the B-atoms in different crystal structures can rearrange [10], which is associated with changes in the optical properties. Nearby, all aluminum borides are not transparent [11]. That is also the case for boron carbides [10]. According to the same author [10], for example, e-boron became colorless and fully optically transparent at 62 GPa. A further complication is that the Raman line positions of boron carbides shift under high pressure, not all of them reversibly. At high pressure (27–40 GPa), the crystal structure changes significantly, and the material becomes increasingly transparent. A further complication arises from the possibility of orthorhombic boron oxide [12], which shows a small number of Raman lines that coincide with those of our transparent spherical crystals. Because at room temperature complete transparent spheres with Raman lines of boron and AlB12 are present, we interpret the transparent spheres as a mixture of α- and β-rhombohedral boron with small amounts of B4.3C, which moved by supercritical fluids or melts from mantle depths into the crust. Due to the rapid transport, some high-pressure Raman signatures did not relax.
Discussion
The results are very difficult to discuss because of the straightforward classification. Interpreting the obtained Raman spectroscopic results is not straightforward. Although the spherical inclusions in topaz from Schneckenstein appear homogeneous and water-clear, this poses a significant problem for boron compounds listed in Table 2. All are at room temperature, black, metallic, or very deep red translucent. The origin of this discrepancy may be phase transitions at 27–40 GPa, associated with an increase in transparency [10]. After that, the author observed that e-boron became colorless and fully optically transparent at 62 GPa. All these observations, together with the diamond spheres, demonstrate that the topaz is not a single crustal formation. The participation of mantle components via supercritical fluids (SCF) or supercritical melts (SCM) is necessary. The study of the Schneckenstein topaz shows that during the Variscan period, SCF and/or SCM contributed to mineralization to a greater extent than expected. The author has, in the last four years, shown many examples that proof there influence on the ore deposits [13-20], and references in it. Furthermore, the Schneckenstein topaz is not the only host for such spherical boron minerals. Figure 8 shows a similar Raman spectrum from an inclusion in cassiterite (Sn-58, Magdalena vein, Sauberg mine, Ehrenfriedersdorf; Sn-70; Sn-81) – see Thomas, 1982. Other cassiterites with orthorhombic cassiterite spheres (CaCl2-and cotunnite-types) often contain such B-inclusions, for example, in cassiterite (Sn-70; Thomas, 2024) [21-26]. Also, the cassiterite from Zinnwald contains rhombohedral boron spheres beside diamond, graphite, orthorhombic cassiterites and coesite.
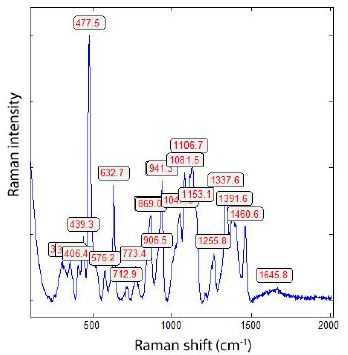
Figure 8: Raman spectrum of a spherical boron mineral mixture in cassiterite from Ehrenfriedersdorf (Sn-58).
Generally, such boron spheres in the Variscan topaz and cassiterites are not rare. By careful screening, such boron minerals cannot be overlooked and demonstrate that the interaction between mantle domains and crust via SCF and/or SCM is a common process that must be borne in mind in any genetic discussion of the Variscan tin and related deposits. These observations are consistent with the preservation of unusual boron-rich Al–B–C microphases in Schneckenstein topaz and may point to high-pressure processes and transport by supercritical fluids or melts during Variscan mineralization; however, confirmation by complementary structural and chemical methods remains essential.
Acknowledgment
I thank all my colleagues with whom I could discuss the problems of interaction between SCF and SCM from the mantle region into the crust.
References
- Rösler HJ, Baumann L, Jung W (1968) Postmagmatic mineral deposits of the northern edge of the Bohemian Massif (Erzgebirge-Harz). International Geological Congress XXIII Session, Guide to Excursion 22 AC © German Democratic Republic. ZGI Berlin. Pg: 57.
- Lahl, B (2012) Königliche Topase vom Schneckenstein: Edelstein aus dem Chemnitzer Verlag. Pg: 141.
- Thomas R (1982) Ergebnisse der thermobarometrischen Untersuchungen an Flüssigkeitseinschlüssen in Mineralen der postmagmatischen Zinn-wolfram-mineralisation des Freiberger Forschungshefte (FFH) C370: 5-85. + I-XVI.
- Thomas R (2026b) Diamond in pycnite-rock from Altenberg and in the topaz from the famous Schneckenstein Geol Earth Mar Sci 8: 1-7.
- Ebel HF, Bliefert C, Russey WE (2004) The Art of Scientific Writing. Wiley-VCH-Verlag GmbH, Weinheim (second Edition). Pg: 1-595.
- Thomas R (2026a) Raman spectroscopic determination of fluorine in topaz. Geol Earth Mar Sci 8: 1-8.
- Werheit H, Filipov V, Kuhlmann U, Schwarz U, Aermbrüster M, et (2010) Raman effect in icosahedral boron-rich solids. Sci Technol Adv Mater 11: 1-27.
- Jay A, Dupare OH, Sjakste J, Vast N (2023) Theoretical Raman spectrum of boron carbide B43C under pressure. Elsevier, Acta Materialia. HALId: hal-04294014: 1-11.
- Zaitsev AM (2001) Optical Properties of Diamond -A Data Berlin, Heidelberg, New York. Springer. Pg: 502.
- Parakhonskiy G (2012) Synthesis and investigation of boron phases at high pressure and Dissertation, University of Bayreuth/Germany. Pg: 117.
- Kohn JA (1960). Crystallography of the Aluminum In: Kohn JA, Nye WF, Gaulé GK (eds) Boron Synthesis, Structure, and Properties. Springer, Boston, MA.
- Cherednichenko KA, Godec YL, Kalinko A, Mezouar M, Solozhenko VL (2016) Orthorhombic boron oxide under pressure: in situ study by X-ray diffraction and Raman J Appl Phys 120: 1-24.
- Thomas R (2026) Diamond in pycnite-rock from Altenberg and in the topaz from the famous Schneckenstein Geol Earth Mar Sci 8: 1-7.
- Thomas R, Rericha A (2025) Strong isotope fractionation between 13C and 12C in the supercritical fluids related to the Variscan mineralizations in Erzgebirge, Slavkovsky Les (Kaiserwald), and Lusatian Mountains, Germany, and the Czech Republic and some remarks on the low-pressure formation of diamond. Geol Earth Mar Sci 5: 1-5.
- Thomas R, Davidson P, Rericha A, Recknagel U (2022a) Water-rich coesite in prismatine-granulite from Waldheim/Saxony. Veröffentlichungen Museum für Naturkunde Chemnitz 45: 67-80.
- Thomas R, Davidson P, Rericha A, Recknagel U (2022b) Discovery of stishovite in the prismatine-bearing granulite from Waldheim, Germany: A possible role of supercritical fluids of ultrahigh-pressure origin. Geoscience 12: 1-13.
- Thomas R, Davidson P, Rericha A, Recknagel U (2023a) Ultrahigh-pressure mineral inclusions in a crustal granite: Evidence for a novel transcrustal transport mechanism. Geoscience 94: 1-13.
- Thomas R, Recknagel U, Rericha A (2023b) A moissanite-diamond-graphite paragenesis in a small beryl-quartz vein related to the Varsican tin-mineralization of the Ehrenfriedersdorf deposit, Aspects in Mining & Mineral Science 11: 1310-1319.
- Thomas R (2023a) Growth of SiC whiskers in beryl by a natural supercritical VLS Aspects in Mining & Mineral Science 11: 1292-1297.
- Thomas R (2023b) Unusual cassiterite mineralization, related to the Variscan tin-mineralization of the Ehrenfriedersdorf deposit, Aspects in Mining & Mineral Sciences 11: 1233-1236.
- Thomas R (2024) The CaCl2 to rutile phase transition in SnO2 from high to low pressure in Geol Earth Mar Sci 6: 1-4.
- Hubble OHW, Kudryashov I, Solozhenko VL, Zinin PV, Sharma SK, Ming LC (2004) Raman studies of cubic BC2N, a new superhard phase. Journal of Raman Spectroscopy 35: 822-825.
- Thomas R (2024a) The CaCl2-to-rutile phase transition in SnO2 from high to low pressure in Geol Earth Mar Sci 6: 1-4.
- Thomas R (2024b) Rhomboedric cassiterite as inclusions in tetragonal cassiterite from Slavkovský les – North Bohemia (Czech Republic). Earth Mar Sci 6: 1-6.
- Thomas R (2025a) Extremely 13C-rich diamond in orthorhombic cassiterites in the Variscan Erzgebirge, Saxony/Germany. Earth Mar Sci 7: 1-5.
- Thomas R (2025b) Diamond, diamond whisker, graphite, carbon, and coesite in a quartz crystal from Zinnwald, E-Erzgebirge. Geol Earth Mar Sci 7: 1-6.