Abstract
In this short contribution, we show the complexity of mineral-forming processes using the example of the Variscan Ehrenfriedersdorf tin deposit and, by way of a further unexpected example, the occurrence of typical alkaline mineralization as an alkaline remnant of vuoriyarvite-K in fluorite in the tin paragenesis.
Keywords
Raman spectroscopy, Vuoriyarvite-K, Strong Alkalinity, Variscan Tin Mineralisation, Ehrenfriedersdorf
Introduction
The author and coauthors have previously shown that exceptional minerals are present in the classic tin deposit of Ehrenfriedersdorf. To these belong nepheline crystals (Figure 1), and the high-pressure minerals diamond, moissanite, orthorhombic cassiterite, and others [1]. In granite quartz, there are melt inclusions of peralkaline granitic composition [2]. That means, at last, that the famous and very rich tin deposits from the Variscan granites around Ehrenfriedersdorf are not the result of a single granite intrusion or a single mineral-forming process. Also, supercritical fluids and melts participate in mineral-forming processes. In Thomas and Rericha (2023) [3], a new microphotograph of nepheline (Figure 4) is presented, and the nepheline composition and that of the surrounding K-feldspar are tabulated. According to melt inclusion studies, there are generally two granite trends: the peraluminous and the peralkaline, as well as an alkaline mineralization, which are detectable to varying degrees and are roughly equal in abundance. In Figure 1, exemplarily shown are the nepheline aggregates in quartz from Ehrenfriedersdorf (Sauberg mine). The figure is from Thomas et al. (2006) [2] and serves as a reminder that nepheline is not typically present or possible in a granite environment; it is nevertheless present!
Furthermore, we will show that remnants of older mineral inclusions in younger ones demonstrate that multi-stage processes are responsible for the exceptional tin-rich deposit. One such example is the occurrence of vuoriyarvite-K [K2(Nb,Ti)2(Si4O12)(O,OH)2 · 4H2O]. Simple one-sided geochemical studies cannot solve the complex puzzle of mineral-forming processes.
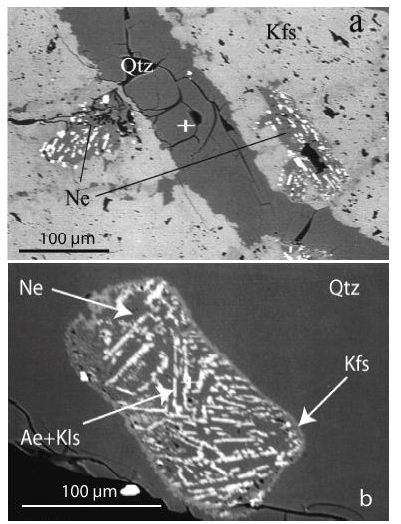
Figure 1: Back-scattered electron images of nepheline inclusions in feldspar (a) and quartz (b) from the Ehrenfriedersdorf pegmatite. Nepheline shows kalsilite and aegirine exsolution lamellae. Ae – aegirine, Kfs- K-feldspar, Kls – kalisilite, Ne-nepheline, Qtz – quartz.
Methods and Samples
Raman Spectroscopy
Raman spectra were recorded with the EnSpectr Raman microscope RamMics R532 in the spectral range of 0 – 4000 cm-1 using a 50 mW single-mode 532 nm laser, an entrance aperture of 20 μm, a holographic grating of 1800 g/mm, and a spectral resolution of 4 cm-1. Depending on the grain size, we used microscope objectives with magnifications between 3.2x and 100x. As 100x objective, we used the long-distance LMPLFLN100x from Olympus. The laser energy on the sample can continuously be adjusted down to 0.02 mW. Generally, we used 30 mW on the sample for the present study. The positions of the Raman bands were controlled before and after each series of Si-band measurements using a single-crystal semiconductor-grade silicon chip. The run-to-run repeatability of the line position (from 20 measurements each) was ± 0.3 cm-1 for Si (520.4 ± 0.3 cm-1) and 0.5 cm-1 for diamond (1332.3 ± 0.5 cm-1 over the range 80 – 2000 cm-1), respectively. As a diamond reference, we used a water-clear natural diamond crystal (from Brazil). An essential advantage of the Raman spectrometer is the simple zero-point calibration. For the identification of minerals using Raman microspectroscopy, we used the RRUFF database and the Crystal Sleuth program [4].
Reference Sample
As a reference for our study, we used crystals of vuoriyarvite-K [K2(Nb,Ti)2(Si4O12)(O,OH)2 · 4H2O] from Pitkäranta (Lupikko shaft) on the northern shore of Lake Ladoga, Karelian SSR/Russia, which were proven with X-ray techniques (sample from Crystal-Treasure, Kassel).
Figure 2 shows an example of the nearby colorless reference vuoriyarvite-K material from Pitkäranta. The spectrum of reference vuoriyarvite-K is given in Figure 3. The RRUFF data file (RRUFF ID R070703 for a 532 nm laser) of vuoriyarvite-K is a little different, but similar. The sample is from another place: Kirov Mine, Kuukisvumchorr Mt. Khininy Massif, Kola Peninsula, Russia.
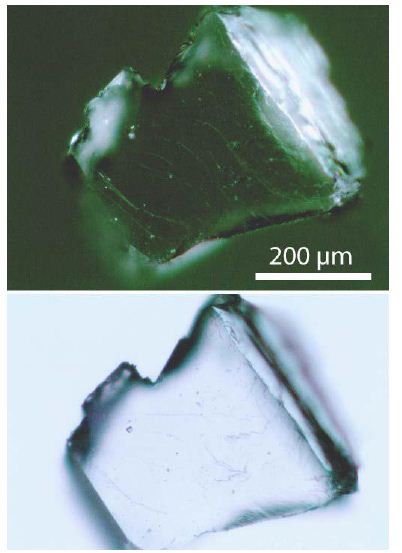
Figure 2: Reference crystals of vuoriyarvite-K from Pitkäranta/Lake Ladoga, Russia. The spectrum of reference vuoriyarvite-K is given in Figure 3.
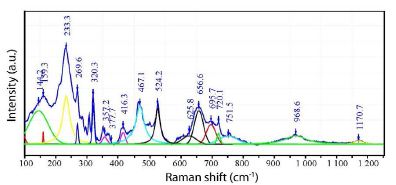
Figure 3: Reference Raman spectrum of the vuoriyarvite-K [K2(Nb,Ti)2(Si4O12)(O,OH)2 4H2O] from Pitkäranta (Lupikko shaft) on the northern shore of Lake Ladoga, Karelian SSR/Russia, which was proven with X-ray techniques.
Sample
As a sample, we used a polished mostly green fluorite crystal from a cassiterite paragenesis (Sn-70 from the Prinzler ancillary vein) with a small violet rim at one end, measuring about 2.5 x 2.6 x 0.2 cm. Figure 4 shows the used sample.
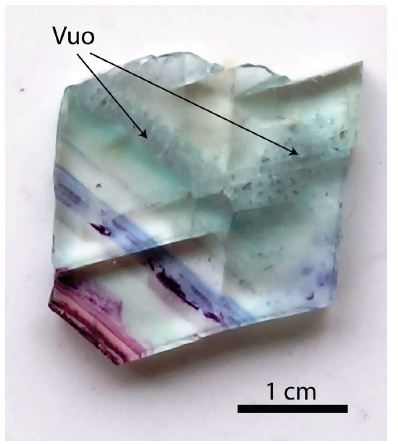
Figure 4: Double-sided polished fluorite sample. The green part contains many remnants of vuoriyarvite-K (Vuo). In the fluorite part, the market with arrows contains a high concentration of this mineral.
Results – Key Observations
The Raman spectrum of the fluorite host is given in Figure 5. According to Chukanov and Vigasina (2020) [5], the fluorite is characterized by a single strong Raman band at about 322 cm1.
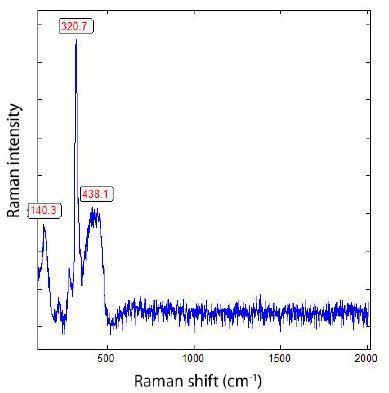
Figure 5: Raman spectrum of the fluorite host of vuoriyarvite-K. The lines beside the strong, sharp fluorite line at 320.7 cm-1 may be fluorescence lines.
The fluorit sample contains many small corroded crystal remnants of vuoriyarvite-K. By the refractive index (fluorite n = 1.44, vuoriyarvite-K = 1.73), the crystals under the microscope are well seen. During the study of the large fluorite crystal, unusual, corroded, and more or less colorless vuoriyarvite-K crystals were observed (Figures 6 and 7).
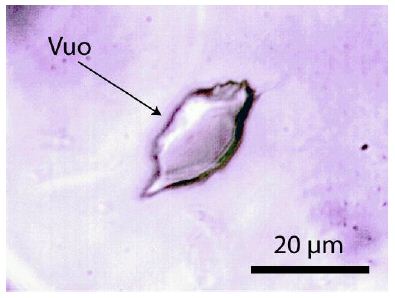
Figure 6: Vuoriyarvite-K (Vuo) remnant in the fluorite matrix.
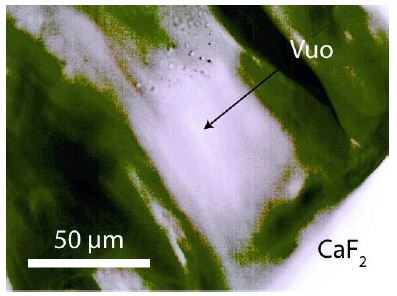
Figure 7: A larger vuoriyarvite-K (Vuo) crystal in fluorite (CaF2) surrounded by dark, undefined material (product of decomposition – maybe oxides of Nb).
Figures 8 and 9 show the Raman spectra of the vuoriyarvite-K-like mineral.
Rastsvetaeva and Chukanov (2002) [6] reported that the labuntsovite group contains more than 20 minerals, with compositions that vary widely. For example, K2O can vary from 0 to 15%. From most minerals of this group, there are no Raman spectra. Therefore, the interpretation of the labuntsovite-group minerals by Raman and IR spectroscopy is very difficult.
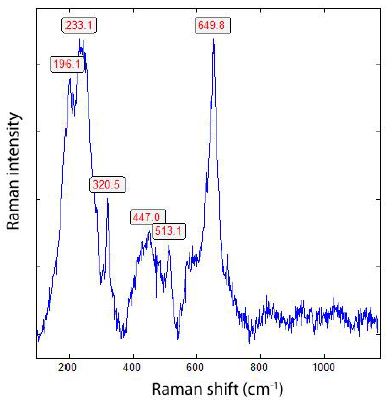
Figure 8: Raman spectrum of vuoriyarvite-K-like mineral in fluorite from the Ehrenfriedersdorf tin deposit, Sauberg mine. The sharp line at 320.5 cm-1 is from the fluorite host.
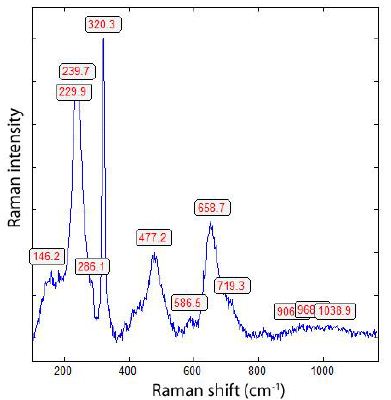
Figure 9: Raman spectrum of a vuoriyarvite-K-like mineral. This spectrum corresponds well to the RRUFF ID R070703 (Lafuente et al., 2016). The 320.3 cm-1 Raman band comes from the fluorite host.
Discussion
The labuntsovite group minerals, with the here described vuoriyarvite-K, are typical of alkaline massifs of the Kola Peninsula and Greenland [6,7]. Here in the Variscan tin deposit of Ehrenfriedersdorf in the Central-Erzgebirge, Germany, are the occurrences of such minerals as nepheline, kalisilite, and vuoriyarvite-K-like minerals, at first sight untypical. However, they clearly demonstrate that the classic tin mineralization is not the result of a single enrichment process from the surrounding Sn-granite. The formation of the tin deposit results from multiple evolutionary stages, including alkaline stages and the interaction of supercritical fluids coming from Earth’s mantle. In such fluids, chromatographic processes of element enrichment and depletion can occur.
References
- Thomas R, Recknagel U, Rericha A (2023) A Moissanite-diamond-graphite paragenesis in a small beryl-quartz vein related to the Variscan tin-mineralization of the Ehrenfriedersdorf deposit, Geosciences. 13: 1-13.
- Thomas R, Webster JD, Rhede D, Seifert W, Rickers K, et al. (2006) The transition from peraluminous to peralkaline granitic melts: Evidence from melt inclusions and accessory Lithos 91: 137-149.
- Thomas R, Rericha A (2023) The function of supercritical fluids for the solvus formation and enrichment of critical Geol Earth Mar Sci. 5(8): 1-4.
- Lafuente B, Downs RT, Yang H, Stone N (2016) The power of database: The RRUFF In Highlights in Mineralogical Crystallography; Armbruster T, Danisi RM (Eds.). De Gruyter: Berlin, München, Boston. 1-30.
- Chukanov NV, Vigasina MF (2020) Vibrational (Infrared and Raman) spectra of minerals and related compounds. Springer Mineralogy. Pg: 1376.
- Rastsvetaeva PK, Chukanov NV (2002) X-ray diffraction and IR spectroscopy study of the labuntsovite-group Crystallography reports. 47: 939-945.
- Pekov IV (2000) Lovorzero Massif. Moscow. Pg: 480.