Abstract
To determine what young people (ages 13–27) feel about the prospects of students after they leave school, we investigated systematically varied vignettes about schools. The vignettes comprised statements (elements) about teachers, the students, the response of the community to the school, and the behavior of the students, respectively, the elements combined according to an experimental design. The data suggest that it is the specific messages, not the general categories of messages, which drive the expectations of good versus poor performance. There is evidence for at least two mind-sets, those focused on the teacher-student relationship versus those focused on the teacher-community relationship. We present the PVI, personal viewpoint identifier, to assign new students to one of the two mind-sets.
Introduction
The world of education is critical for the future of a nation. Educators realize that, and struggle with the appropriate way to educate the student. The issues are complex, the struggles to educate real, and the complexities baffling. The situation is made even more complicated by the realization that education is not just the role of the student and the teacher, but is influenced by society, local and national, by economics, and by the nature of the social matrix from which the student originates. Any introduction should stop there. The literature is too vast.
A cursory review of the truly vast literature reveals the deep concerns with the outcome of education, and the natural consequence, studies of what drives a good outcome. The factors can be as diverse as the nature of the teacher, and especially the preparation for teaching [1], the involvement of the community [2, 3, 4] and of course the nature of the student [5, 6, 7, 8]. The focus of these studies is on outcomes, with the search to discover what factors produce the best outcome. The studies are sociological in nature, however, and do not give a sense of the inner thinking and feeling [9] What is missing from most of these studies, if not all, is a study of the mind of the student, in terms of what motivates the student.
Author Moskowitz applied the approach presented here to study how students want to study mathematics [10]. The objective was to work from the inside of the mind of the student to the outside, to discover the granular features of experience to which a student attends when thinking about what she or he wants in when learning mathematics. This study follows the same approach, working from the inside of the mind of the student to the outside, to discover what a student thinks will drive success five years hence. The approach is psychological in nature, combining projective techniques [11] and applied experimental design (conjoint measurement; [12, 13, 14] a new synthesis embodied in the emerging science of Mind Genomics [15].
The topic of this paper is education, or more specifically the expectations of young paper (ages 13–27) of future success or failure as a function of reading about systematically constructed descriptions of ‘softer aspects’ of the educational situation, primarily dealing with emotions and relations, not on pedagogy. The education situations comprise systematically constructed combinations of answers to four questions, specifically:
The race of the teacher:
The response of the student to the teacher’s race
The economic status of the school area
The reaction of those in the community
Mind Genomics Method
Mind Genomics is a newly emerging science, dealing with the analysis of quotidian, everyday experiences, and how people judge the different aspects of these experiences [15] The objective of the Mind Genomics studies is to identify which aspects of a situation are most relevant to the individual. Mind Genomics uses small, easy-to-run, affordable, rapid, and manageable experiments to understand how a person evaluates the different aspects of experience to arrive at a judgment. Experiments mean that Mind Genomics ends up tracing responses to specific independent variables. For the case of education in the study reported here, the experiment allows us to trace how a person’s estimate of student performance in five years relates to a variety of independent variables,, such as the race of the teacher, the reaction of students to the teacher, the nature of the students, and the nature of the local community in which the school is located.
It should become obvious from the description above that Mind Genomics differs profoundly from the analyses of education appearing in the scientific literature. The traditional approaches to education focus on a description of ‘what happened’ (description) and ‘what should happen’ (prescription.) These approaches work in the world of the external. Mind Genomics moves insight, looking at how people think and feel about the everyday. Thus, Mind Genomics provides a new direction by which to understand education specifically in this paper, but a person’s thinking in general. Mind Genomics follows a series of well-defined steps, using a combination of raw materials developed by a Socratic approach, evaluation by respondents of vignettes comprising mixtures of these materials (field work), and then the deconstruction of the responses into the contributions of the individual elements (analysis.) The results reveal what the respondents feel to be the most important factors for future success. Mind Genomics works at the granular level, so the results can lead both to knowledge and to application.
Test stimuli
The test stimuli comprise a series of questions which tell a story. The questions never appear in the study but are only inserted into the Socratic process to give the test stimuli, the vignettes, a structure. (Figure 1) shows the screen shot of the program, giving a sense of how the researcher is guided in critical thinking. For each question the researcher is prompted to give four different answers, the answers being simple stand-alone phrases communicating different ideas appropriate for the question. (Figure 2) shows a screen shot of the program, showing how the researcher is guided to give the four answers to one question. The structure of the underlying technology is limited to four questions, each with four answers. That structure was designed to allow researchers to work in ‘real time,’ identify a topic, phrase the four questions, provide the answers, and launch the study, all within a period 30–45 minutes, with the answers coming back an hour or two after launch. Such speed and a process, which essentially constitutes a complete circle, can only be accomplished by following a simple template, such as the template followed here. The four answers comprise just enough text to convey the answer, and no more. The Mind Genomics system encourages the researcher to focus on the idea, not on an elegant, dense paragraph of information. The ingoing assumption is that the respondent will graze, rather than read each test stimulus, and so the answer must be simple and ‘punchy.
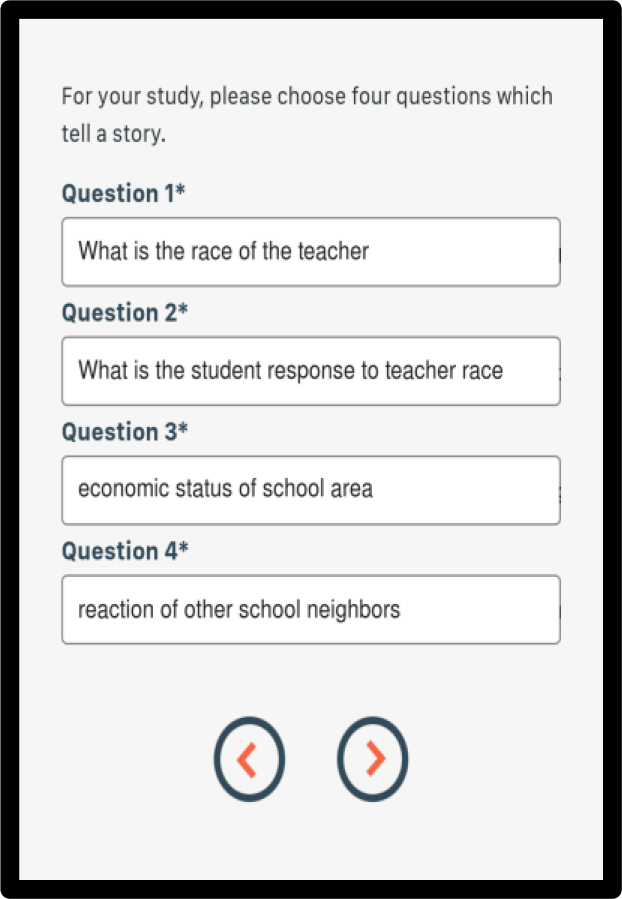
Figure 1. The set-up program, requiring the respondent to create the four questions.
(Table 1) shows the four questions, and the four answers to each question. The objective of Mind Genomics studies of this type is to explore and map an area, either a large area in general with little detail, or very meticulously and great deal for a small, circumscribed, limited areas. It is vital, however, that researchers avoid the deadly ‘analysis paralysis’ which affects so much consumer research, wherein one has only one study to discover the answers. The Mind Genomics system is iterative, so that the set of questions and answers can be revised on a second iteration, and on further iterations, to achieve a granular understand of the problem.
Table 1. The four questions and the four answers to each question.
|
|
Question A: What is the race of the teacher |
|
A1 |
teacher is black |
|
A2 |
teacher is Caucasian |
|
A3 |
teacher is Asian |
|
A4 |
teacher is Hispanic |
|
|
Question B: What is the student response to teacher race |
|
B1 |
students are docile |
|
B2 |
students are antagonistic towards teacher |
|
B3 |
students identify with teacher race |
|
B4 |
students are accepting of the teacher |
|
|
Question C: economic status of school area |
|
C1 |
school in depressed area |
|
C2 |
school in gentrified area |
|
C3 |
school in established middle class area |
|
C4 |
school in area with many new immigrants |
|
|
Question D: reaction of other school neighbors |
|
D1 |
community supports educators |
|
D2 |
community indifferent to educators |
|
D3 |
community hostile to educators |
|
D4 |
community embraces educators |
Experimental Design:
Mind Genomics works by combining the answers (but not the questions) into short, easy-to-read combinations called vignettes or concepts. Each vignette comprises at most one answer from a question. The four questions need not contribute an answer to the vignette. The experimental design, really a ‘recipe book’ prescribes the specific set of 24 vignettes to be presented to a respondent. Some of the vignettes comprised four answers, one answer from each of the four questions. The experimental design also prescribes some vignettes to have three answers, with the answer from one of the questions absent. Some vignettes comprise only two questions. The creation of such ‘incomplete’ vignettes enables the 16 answers to be statistically independent of each other, and thus analyzable by OLS (ordinary least squares) regression. Each respondent evaluated a unique set of 24 vignettes. The underlying experimental design was maintained, but the specific combinations changed, doing so according to a permutation scheme which defined new combinations [16]. By permuting the combinations, the Mind Genomics experiment with its 50 respondents covers many alternative combinations, the so-called design space. The rationale for testing many combinations, each with about 1–2 ratings, rather than testing the same set of 24 vignettes with 50 ratings, emerges from the worldview of Mind Genomics, which is based in the notion of cartography of the mind. The objective is to explore different aspects of how we make decisions, rather than to explore one specific aspect using many replicate judgments to average out ‘noise.’
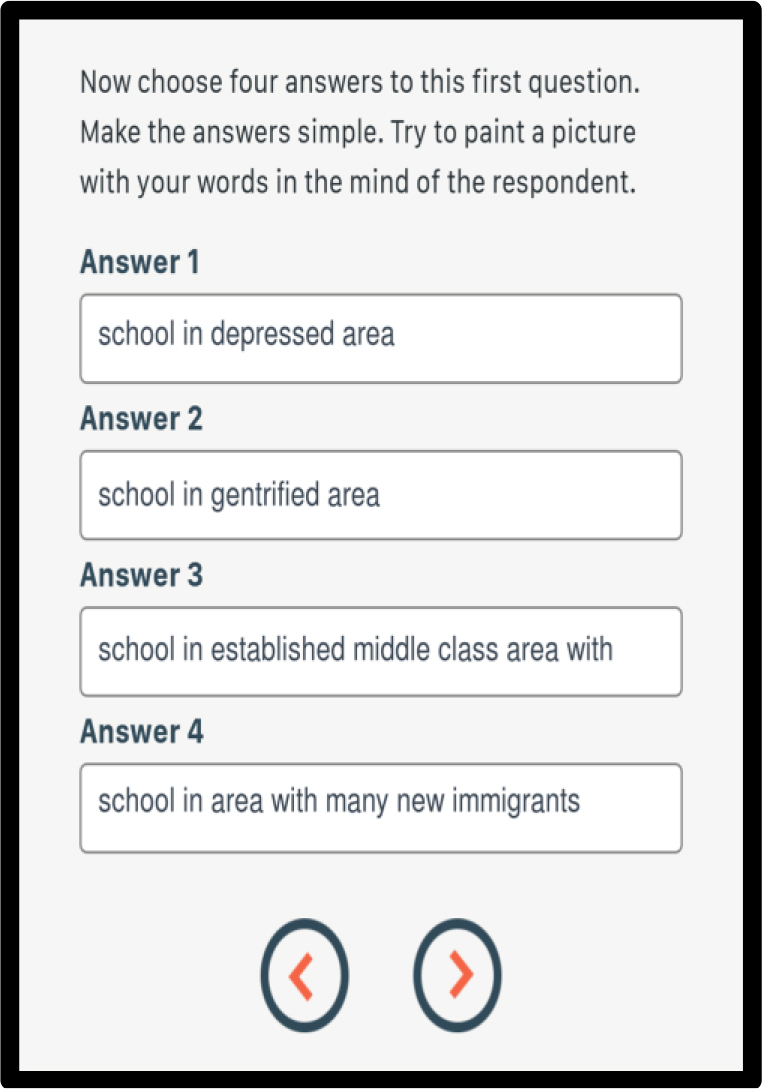
Figure 2. Screen shot showing how the researcher is guided to assign four answers to one question.
The vignettes
The test stimuli comprised vignettes. The vignette presented a short orientation statement at the top, and then the requisite 2–4 answers or elements prescribed by the underlying experimental design. There was not effort to make the 2–4 answers or elements ‘flow together’, by constructing a paragraph. Rather, the 2–4 answers were presented as simple phrases, stacked one atop another, without concern for the ‘sense’ of the combination. This simple and austere structure makes the respondent’s job easier. The respondent simply inspects the vignette and assigns a rating. With 24 vignettes to rate it is important to make the experience pleasant, not onerous It is important to avoid the dense paragraphs, constructed with connectives, paragraphs which are grammatically correct but difficult to read, and increasingly aversive as the respondent ‘plows through’ paragraph after paragraph. The Mind Genomics layout, stark as it is, reduces the onerous task.
Rating Scale
The 5-point rating scale, shown in (Table 2), allows the respondent to tell the researcher how she or he feels about the student, after reading the vignette. In psychological terms, the study actually invokes aspects of a projective test, where the respondent looks at a picture and tells a story. This projective method enables the researcher to understand the mind of the respondent, since the respondent is given no specific information about the students in the vignette, other than what is presented about the school situation itself. The only way that the respondent can assign a rating to the vignette is by projecting her or his feelings onto the situation as described.
Table 2. The 5-point rating scale and the two anchors.
|
Rating question: |
The student LIFE SKILLS in 3 years |
|
Low Anchor: Rating question |
1=remain the same |
|
High Anchor: Rating question |
5=big positive change |
Running the Experiment
The on-line study was run with 50 respondents, ages 13–27, half 13–19, half 20–27. The respondents for these studies are members of a very large group of on-line panels, connected by Luc.id, Inc., the strategic partner of Mind Genomics. The respondents (more than 20 million in total in the United States alone) have agreed to participate in these studies, for ‘considerations’ which increase their motivation to participate. The respondent identity and terms of agreement to participate are not relevant to the effort. The respondents are invited by Luc.id on behalf of the research project. The financial incentives and the panel make the research process go smoothly, with the entire study complete within 1–2 hours, with the data ready to report, or available for reanalysis, as was done here. The study was completed early June 2019, in one afternoon.
Moving From the Ratings to A Binary Scale
Mind Genomics follows the general approach of consumer research in terms of working with scales. Consumer researchers who use Likert scales, such the 5-point scale featured here, do not necessarily know what the scale means, even when the scale is anchored at both ends. A strategy to circumvent the problem of lack of understanding yet keep the scale for subsequent analyses, transforms the 5-point scale to a binary scale, with the convention that ratings of 1–3 are transformed to 0, and ratings of 4–5 are transformed to 100, respectively. The transformation produces a binary scale, understandable by those who use the scale, and easy to communicate.
In this study we transformed the 5-point rating in two ways:
Good Outcome: Ratings of 1–3 are transformed to 0 to denote a ‘not good outcome.’ Ratings of 4–5 are transformed to 100 to denote a ‘good outcome.’
Poor Outcome: Ratings of 1–2 are transformed to 100 to a denote a ‘poor outcome’. Ratings of 3–5 are transformed to 0 to denote a ‘not poor outcome.’
Note that a ‘not good outcome’ is not the same as a ‘poor outcome,’ and a ‘not poor outcome’ is not the same as a ‘good outcome.’
Relating the Presence/Absence of the Answers/Elements to the Binary Rating 0/100
Once the ratings are transformed, one can use OLS (ordinary least-squares) regression to relate the presence/absence of the 16 elements to the binary rating. Each respondent tested a variant of the basic experimental design, with the design ensuring that all he 16 elements or answers were statistically independent of each other. The design itself, and the permutation on top of the basic design, ensures that the OLS regression will be working with data appropriate for OLS regression. (Table 3) shows the parameters emerging from the OLS models from the total panel, comprising 1200 observations or cases (50 respondents, 24 observations or datapoints for each respondent.)
Table 3. Coefficients from the total panel for the model relating the outcome to the presence/absence of the 16 elements.
|
|
|
MODEL FOR |
|
|
|
Total Panel |
Good Outcome |
Poor Outcome |
|
|
Additive constant |
37 |
23 |
|
D1 |
community supports educators |
11 |
-8 |
|
B4 |
students are accepting of the teacher |
10 |
-8 |
|
D4 |
community embraces educators |
9 |
-5 |
|
A2 |
teacher is Caucasian |
7 |
-2 |
|
B3 |
students identify with teacher race |
6 |
0 |
|
C2 |
school in gentrified area |
6 |
-3 |
|
C4 |
school in area with many new immigrants |
5 |
-4 |
|
C3 |
school in established middle class area |
4 |
0 |
|
A1 |
teacher is black |
2 |
-2 |
|
B1 |
students are docile |
2 |
1 |
|
A3 |
teacher is Asian |
1 |
-3 |
|
A4 |
teacher is Hispanic |
1 |
-6 |
|
C1 |
school in depressed area |
-5 |
7 |
|
D2 |
community indifferent to educators |
-5 |
5 |
|
D3 |
community hostile to educators |
-11 |
15 |
|
B2 |
students are antagonistic towards teacher |
-17 |
22 |
Additive constant: Expected percent of the time that the response will be ‘good outcome’ or ‘poor outcome’ in the absence of elements. All 24 vignettes evaluated by a respondent comprised 2–4 elements by design, so that additive constant is a purely estimated parameter. Nonetheless, the additive constant gives a good sense of the likelihood of a positive or negative response, almost a ‘baseline’ likelihood. Coefficient: Each element generates its own coefficient from the OLS regression. The results do not surprise. The table shows the strong performing elements. Statistical tests as well as observations from real life using the data suggest that coefficients of 8 or higher are associated with strong outcomes, whether positive or negative.
Key elements driving a perceived likelihood of a good outcome:
community supports educators
students are accepting of the teacher
community embraces educators
Key elements driving a perceived likelihood of a poor outcome:
community hostile to educators
students are antagonistic towards teacher
Positive Outcomes – Models by Who The Respondent IS:
The support data for these observations come from (Table 4). When we look at the respondents by gender, we find that, to begin with, men are more optimistic than women (additive constant 44 for men versus 30 for women). Women respond to many of the specifics, however, whereas men do not. To the women, the most important element is that the community support educators, an element which is not particularly relevant to men. When we look at respondents by age, we again see differences. The younger respondents are less optimistic about a positive outcome than are the older respondents (additive constant 34 versus 44.) There are no dramatic differences by age, however, at least differences that can be explained easily. When we look at the neighborhood from which the respondent comes, we find that respondents from neighborhoods that they define as poor are less optimistic than the respondents from rich neighborhoods, and they, in turn, are less optimistic than respondents from up and coming neighborhoods (additive constant 31 vs 37 vs 42.) Respondents from the poor neighborhoods believe that it is both the student response to the teacher and the community response to the teacher which will generate a positive outcome for the student.
Table 4. Relation between the presence/absence of elements and the likelihood of a POSITIVE outcome for the student. The columns refer to who the person IS.
|
|
|
Gender |
Age |
Neighborhood |
||||
|
|
Positive outcome |
Male |
Female |
13–19 |
20–27 |
Poor |
Up & coming |
Rich |
|
|
Additive constant |
44 |
30 |
34 |
44 |
31 |
42 |
37 |
|
A1 |
teacher is black |
-4 |
9 |
3 |
1 |
-15 |
1 |
14 |
|
A2 |
teacher is Caucasian |
3 |
10 |
13 |
0 |
-7 |
8 |
12 |
|
A3 |
teacher is Asian |
-14 |
15 |
-1 |
1 |
2 |
-3 |
4 |
|
A4 |
teacher is Hispanic |
-7 |
9 |
4 |
-4 |
-6 |
-3 |
9 |
|
B1 |
students are docile |
5 |
-2 |
1 |
2 |
19 |
-2 |
-3 |
|
B2 |
students are antagonistic towards teacher |
-13 |
-20 |
-19 |
-15 |
-2 |
-17 |
-28 |
|
B3 |
students identify with teacher race |
7 |
7 |
0 |
11 |
20 |
4 |
2 |
|
B4 |
students are accepting of the teacher |
5 |
15 |
6 |
13 |
22 |
7 |
14 |
|
C1 |
school in depressed area |
-1 |
-10 |
-3 |
-8 |
0 |
-5 |
-22 |
|
C2 |
school in gentrified area |
5 |
5 |
1 |
9 |
8 |
5 |
2 |
|
C3 |
school in established middle class area |
2 |
6 |
3 |
2 |
9 |
4 |
-5 |
|
C4 |
school in area with many new immigrants |
4 |
5 |
7 |
1 |
3 |
3 |
5 |
|
D1 |
community supports educators |
3 |
19 |
10 |
12 |
21 |
4 |
23 |
|
D2 |
community indifferent to educators |
-7 |
-4 |
-10 |
-2 |
-3 |
-10 |
5 |
|
D3 |
community hostile to educators |
-5 |
-16 |
-8 |
-14 |
1 |
-12 |
-14 |
|
D4 |
community embraces educators |
5 |
14 |
11 |
6 |
15 |
8 |
14 |
Negative outcomes:
(Table 5) shows the results when we look at the scale in the opposite directions, with ratings of 1–2 (poor outcome) transformed to 100. The additive constants are all low, meaning that in general there is not an overwhelming negative feeling among the respondents. Yet there are some dramatic differences in baseline negativity among complementary groups. Females are more pessimistic than males (additive constant 31 for females versus 13 for males.) Younger respondents are more pessimistic than older respondents (additive constant 30 versus 14.) Those respondents coming from a self-defined poor neighborhood are more pessimistic than respondents coming from an up and coming neighborhood and a rich neighborhood (additive constant 38 vs 18 and 14)
Table 5. Relation between the presence/absence of elements and the likelihood of a NEGATIVE outcome for the student. The columns refer to who the person IS.
|
|
|
Gender |
Age |
Neighborhood |
||||
|
|
Negative outcome |
Male |
Female |
13–19 |
20–27 |
Poor |
Up & coming |
Rich |
|
|
Additive constant |
13 |
31 |
30 |
14 |
38 |
18 |
14 |
|
A1 |
teacher is black |
1 |
-6 |
-3 |
-2 |
-4 |
0 |
0 |
|
A2 |
teacher is Caucasian |
4 |
-8 |
-7 |
3 |
4 |
0 |
-6 |
|
A3 |
teacher is Asian |
5 |
-10 |
-2 |
-4 |
-1 |
3 |
-9 |
|
A4 |
teacher is Hispanic |
1 |
-13 |
-8 |
-4 |
-13 |
-1 |
-8 |
|
B1 |
students are docile |
-2 |
4 |
1 |
2 |
-2 |
0 |
5 |
|
B2 |
students are antagonistic towards teacher |
18 |
25 |
24 |
20 |
24 |
16 |
37 |
|
B3 |
students identify with teacher race |
2 |
-3 |
-3 |
2 |
-10 |
-3 |
11 |
|
B4 |
students are accepting of the teacher |
-4 |
-11 |
-8 |
-6 |
-20 |
-4 |
-5 |
|
C1 |
school in depressed area |
7 |
9 |
4 |
11 |
6 |
8 |
11 |
|
C2 |
school in gentrified area |
-6 |
1 |
3 |
-8 |
-4 |
-1 |
0 |
|
C3 |
school in established middle class area |
1 |
1 |
-2 |
4 |
0 |
3 |
-1 |
|
C4 |
school in area with many new immigrants |
-6 |
0 |
-5 |
-1 |
-7 |
-2 |
-11 |
|
D1 |
community supports educators |
1 |
-16 |
-15 |
1 |
-19 |
-4 |
-5 |
|
D2 |
community indifferent to educators |
11 |
0 |
4 |
7 |
10 |
7 |
1 |
|
D3 |
community hostile to educators |
12 |
19 |
|
|
13 |
13 |
20 |
|
D4 |
community embraces educators |
5 |
-14 |
|
|
-12 |
-3 |
-7 |
The keys to a poor future from the set investigated here are similar across groups)
students are antagonistic towards teacher
community hostile to educators
school in depressed area (except for those respondents coming from a self-described poor area)
Interactions between pairs of elements (scenario analysis)
A recurring question in the assessment of attitudes through experimentation is whether it is possible to identify interactions between ideas. We know from everyday life that changing the framework of a story from one venue to another may shift the way one evaluates the events in the story. Lawyers know the value of reframing to affect the nature of the facts of events, and perhaps affect the way a judge or jury evaluates the other facts. The foundations of Mind Genomics in permuted experimental design allowed for the evaluation of interactions when the design was constructed to account for those interactions. Conventional experimental design deals with a limited number of different variables, making it necessary to ‘build in’ the appropriate test stimuli in order to capture these interactions. The key is that the researcher must know the interactions to explore ahead of time, knowledge which guides the specific combination. The permutation algorithm of Mind Genomics creates many different combinations, a side benefit of which is the ability to test the interactions of pairs of elements in an efficient manner. The approach has been called scenario analysis [15].
In simple terms, one identifies a specific question (e.g., Question C; where the school is), and recodes every one of the cases with one of five numbers, depending upon the answer to the question as it appears in the vignette. Putting this into operation we sort the 1200 vignettes into five strata or groups, depending upon the value of the answer to Question C. There will be vignettes which lack any mention of the area of the school (C=0), vignettes which mention that the school is in a depressed area (C1), vignettes which mention that the school is in a gentrified area (C2), vignettes which mention that the school is in an established middle class area (C3), and finally vignettes which mention that the school is in an area with many new immigrants (C4). The foregoing stratification allows us to apply OLS regression to each stratum separately. The model comprises the additive constant, and 12 predictor variables, rather than the original 16. The model immediately shows how the mention of an area where the school IS affects the coefficients.
(Table 6) shows the results for the total panel, for the positive outcomes. (Table 7) shows the results for the total panel for the negative outcomes. The elements are sorted by the coefficient value when ‘no area mentioned.’ (Table 6) shows some noteworthy interactions When no area is mentioned, the additive constant is 83. Students are very positive. Without any information about the area, the expectation is almost 100% for a positive outcome when we talk about a positive community. Moving to mentions of areas generates far lower additive constants, at least half the magnitude of the additive constant when the fixed message is school in a depressed area, and a quarter the size of the additive constant when the fixed message is school with many new immigrants. When the school is in a depressed area, the respondents feel that it will be the community which can help. When the school is in a gentrified area, the respondents feel that a Caucasian teacher will be best for the student future. When the school is in an established middle-class area and when the school is in an area with many new immigrants, there will be many factors which drive an expectation of a positive future. When we look at the negative outcomes, we find that the expectations are low for negative outcomes, except for mentioning that the school is in an area with many new immigrants (high additive constant = 40.) There are only a few elements which are consistently problematic, and bode badly for the students:
students are antagonistic towards teacher
community hostile to educators
Table 6. How specifying the location of the school interacts with other elements of the vignette to drive a POSITIVE expected outcome for the student.
|
|
Positive Outcome |
no area mentioned |
school in depressed area |
school in gentrified area |
school in established middle class area |
school in area with many new immigrants |
|
|
Additive constant |
83 |
42 |
42 |
35 |
21 |
|
D4 |
community embraces educators |
18 |
5 |
4 |
-2 |
28 |
|
D1 |
community supports educators |
12 |
12 |
5 |
8 |
21 |
|
D2 |
community indifferent to educators |
6 |
-11 |
-1 |
-16 |
1 |
|
A2 |
teacher is Caucasian |
-4 |
-2 |
14 |
9 |
17 |
|
A3 |
teacher is Asian |
-6 |
-5 |
-4 |
13 |
10 |
|
D3 |
community hostile to educators |
-13 |
-11 |
-22 |
-11 |
3 |
|
A1 |
teacher is black |
-16 |
-2 |
6 |
10 |
14 |
|
A4 |
teacher is Hispanic |
-18 |
-1 |
-2 |
12 |
10 |
|
B3 |
students identify with teacher race |
-26 |
-6 |
7 |
19 |
11 |
|
B4 |
students are accepting of the teacher |
-34 |
3 |
15 |
19 |
13 |
|
B1 |
students are docile |
-47 |
8 |
5 |
4 |
9 |
|
B2 |
students are antagonistic towards teacher |
-52 |
-18 |
-6 |
-17 |
-19 |
Table 7. How specifying the location of the school interacts with other elements of the vignette to drive NEGATIVE expected outcome for the student.
|
|
Negative Outcome |
no area mentioned |
school in depressed area |
school in gentrified area |
school in established middle class area |
school in area with many new immigrants |
|
|
Additive constant |
22 |
17 |
8 |
27 |
40 |
|
B2 |
students are antagonistic towards teacher |
15 |
33 |
21 |
19 |
17 |
|
D3 |
community hostile to educators |
15 |
19 |
27 |
10 |
5 |
|
B1 |
students are docile |
8 |
1 |
1 |
-2 |
0 |
|
A4 |
teacher is Hispanic |
6 |
-4 |
-13 |
-6 |
-12 |
|
A3 |
teacher is Asian |
3 |
-5 |
-3 |
-3 |
-12 |
|
A1 |
teacher is black |
2 |
-1 |
5 |
1 |
-15 |
|
D2 |
community indifferent to educators |
2 |
16 |
7 |
4 |
-5 |
|
A2 |
teacher is Caucasian |
1 |
1 |
-10 |
9 |
-13 |
|
B3 |
students identify with teacher race |
-1 |
7 |
7 |
-10 |
-4 |
|
B4 |
students are accepting of the teacher |
-4 |
2 |
2 |
-19 |
-13 |
|
D1 |
community supports educators |
-16 |
3 |
9 |
-16 |
-17 |
|
D4 |
community embraces educators |
-18 |
-3 |
12 |
6 |
-22 |
Mind-Sets
One of the ongoing features of the emerging science of Mind Genomics is the search for mind-sets, defined as different ways of thinking about the same ideas. We are all familiar with different patterns of preferences for food. People may perceive food in the same way in terms of the sensory aspects, but some people love the food, whereas others may feel indifferent or even dislike the food. The same differences in opinion occur for ideas, such as one’s perception of the causes of positive versus negative outcomes for students, the topic studied here. Mind Genomics uncovers these different mind-sets, or viewpoints, by creating individual-level equations for each of the respondents, and then clustering the respondents using the pattern of the coefficients. Translating the approach to our data, the algorithm for uncovering mind-sets begins by creating 50 equations relating the presence/absence of the 16 elements or answers to the rating. Each respondent generates a unique set of coefficients, a straightforward process because the 24 vignettes evaluated by each respondent constituted an experimental design. The process then finds the ‘distance’ between each pair of the respondents, putting the respondents into two and then three non-overlapping groups so that the ‘distances’ are small between pairs of respondents within a group, and the distance is large between the averages of groups (different mind-sets).
Clustering is a well-accepted process in statistics [17]. The outcome of clustering is a set of different groups, created by mathematical, not intuitive criteria. The mind sets should be as few as possible (parsimony), so that they can lead to differential actions when the knowledge of the mind-sets becomes available (e.g., different messaging), and interpretable, so that the clustering makes sense. (Table 8) suggests two different mind-sets, focus on the teacher, and focus on the community. The mind-sets are named in accordance with the nature of the elements or answers to questions generating the highest coefficients. The radical difference between the relatively low values for the highest coefficients from the total panel (Table 4) suggest that within the population we end up with ‘damped’ or suppressed results because there are opposing forces that we cannot see, mutually contradicting each other. Knowing these mind-sets enables the researcher to assess the results from other studies, first by putting the students into the proper mind-set, and then determine whether the measured outcome co-varies with mind-set in a meaningful way.
Table 8. Mind-Set differences in the relation between the presence/absence of elements and the likelihood of both positive and negative outcomes.
|
|
|
Positive Outcome |
|
Negative Outcome |
||
|
|
|
Teacher – Student |
Teacher -Community |
|
Teacher – Student |
Teacher -Community |
|
|
Additive constant |
28 |
44 |
|
29 |
17 |
|
|
Mind Set 1 – Focus on the teacher-student interaction |
|
|
|
|
|
|
B4 |
students are accepting of the teacher |
23 |
-1 |
|
-11 |
-4 |
|
B3 |
students identify with teacher race |
21 |
-7 |
|
-7 |
6 |
|
C3 |
school in established middle class area |
17 |
-8 |
|
-6 |
6 |
|
B1 |
students are docile |
14 |
-8 |
|
2 |
1 |
|
C2 |
school in gentrified area |
11 |
1 |
|
-5 |
-2 |
|
C4 |
school in area with many new immigrants |
11 |
-1 |
|
-3 |
-4 |
|
A3 |
teacher is Asian |
9 |
-7 |
|
-8 |
3 |
|
A2 |
teacher is Caucasian |
8 |
5 |
|
-8 |
2 |
|
|
Mind Set 2 – Focus on the teacher-community interaction |
|
|
|
|
|
|
D1 |
community supports educators |
0 |
22 |
|
-6 |
-10 |
|
D4 |
community embraces educators |
1 |
17 |
|
-6 |
-4 |
|
D3 |
community hostile to educators |
-19 |
-1 |
|
17 |
12 |
|
C1 |
school in depressed area |
6 |
-13 |
|
9 |
6 |
|
B2 |
students are antagonistic towards teacher |
-6 |
-26 |
|
19 |
25 |
|
|
Not relevant to either Mind Set |
|
|
|
|
|
|
A1 |
teacher is black |
-1 |
5 |
|
-7 |
1 |
|
D2 |
community indifferent to educators |
-15 |
4 |
|
5 |
5 |
|
A4 |
teacher is Hispanic |
4 |
-3 |
|
-6 |
-5 |
Finding These Mind-Sets In The Population
A commonly held misconception is that WHO a person IS determines how the person thinks. That is, a great deal of marketing and policy behavior assumes that those who are similar on easy-to-measure variables are similar to each other in terms of the way they think. Sometimes this approach can generate an unduly number of clusters, or personas, in attempt to be general across many areas, yet sufficiently granular to be ‘actionable’ so that the recommendations are specific. The Mind Genomics ‘project’ continues to suggest that there are well-defined mind-sets, emerging not so much from who the person is as from the way the person responds to a specific set of messages. Membership in a mind-set for one topic area does not predict (as yet) membership in another mind-set created for a different topic area.
(Table 9) shows the breakdown of membership in the two mind-sets. It is very difficult to identify a variable which predicts mind-set membership in this newly discovered pair of complementary mind-sets. Furthermore, in the world of everyday experience, there are so many different types of experiences, and so much granularity that the effort to assign new people to the discovered mind-sets will probably not be very successful if the only data is WHO the person is, or WHAT the person does. A different approach is represented by the PVI, the personal viewpoint identifier. The PVI is constructed for a specific topic by identifying the elements which best differentiate between or among mind-sets, converting them to questions, with a binary response scale, and then computing the full set of possible patterns of responses, and the mind-set to which each pattern of response most likely belongs. (Figure 3) presents the PVI. The respondent and/or the group commissioning the study receive the feedback about the respondent, shown for example in (Figure 4). The same information can be sent to the respondent.
Figure 3. The six question PVI for mind-sets in education. As of this writing (September, 2019) the PVI is located at this website: https://www.pvi360.com/TypingToolPage.aspx?projectid=91&userid=2018
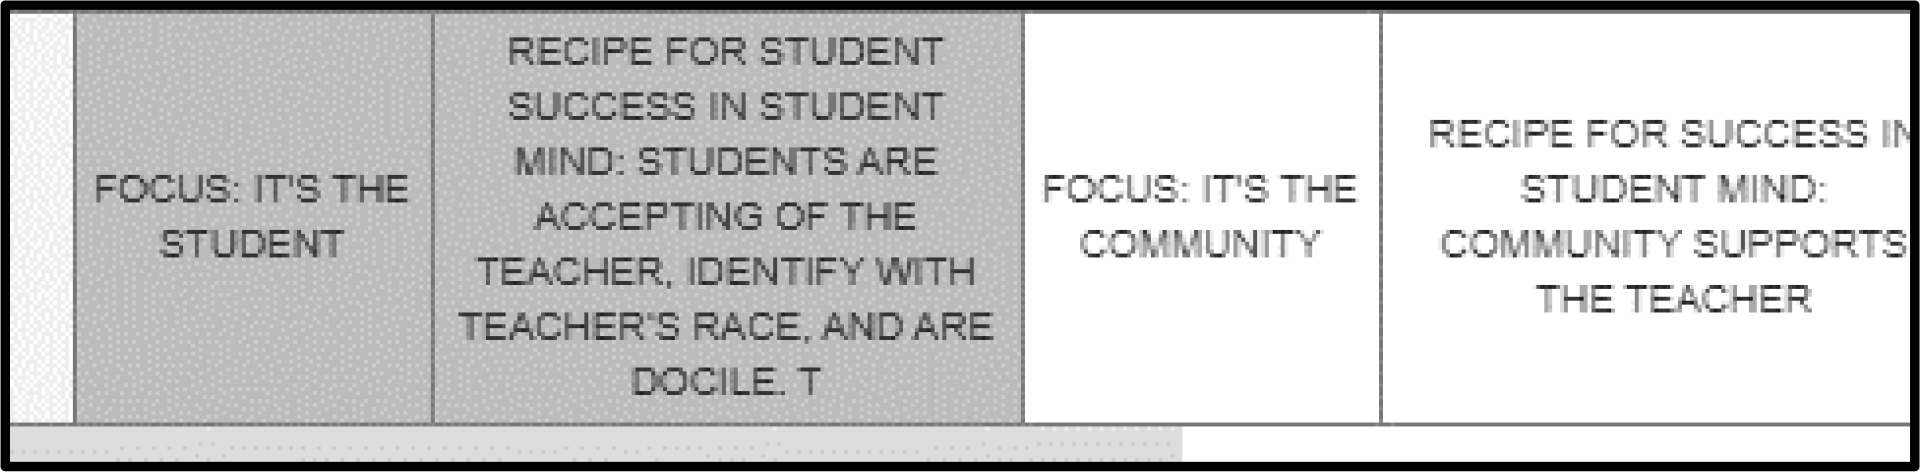
Figure 4. The feedback page to the respondent. The respondent, a new individual, is assigned to the mind-set that is shaded based upon the pattern of answers to the first six questions in Figure 3.
Table 9. Classification profiles of the total panel and the two mind-sets.
|
|
Total |
Mind-Set Teacher |
Mind-Set Community |
|
Total |
50 |
23 |
27 |
|
|
|
|
|
|
Male |
25 |
10 |
15 |
|
Female |
25 |
13 |
12 |
|
|
|
|
|
|
Age 13–19 |
24 |
10 |
14 |
|
Age 20–27 |
26 |
13 |
13 |
|
|
|
|
|
|
Total |
50 |
23 |
27 |
|
Poor |
10 |
8 |
2 |
|
Rich |
11 |
2 |
9 |
|
Up-Coming |
24 |
9 |
15 |
Messages Which Engage- Response Time and Attention
In the history of experimental psychology there has been a movement to measure non-cognitive variables, such as response time (reaction time), heart rate, and so forth, with the belief that these measures somehow ‘reveal’ other processes of decision-making, processes which are not under conscious control, and thus somehow ‘more true.’ [18] talks about the original efforts of experimenters such as Wilhelm Wundt, to understand these deep psychological processes by measuring the time between the presentation of a stimulus and the time needed for the observer (respondent) to react. The longer response or reaction times were assumed to be filled with unconscious decision processes. Following this worldview, we introduce the response time measure as a way to estimate the length of time required for a respondent to ‘process’ the information in a vignette. The approach follows the analytic structure done for the binary transformed ratings. The only differences are that the dependent variable is the response time in seconds (to the nearest tenth of a second), and the regression equation does not have an additive constant. The rationale for no additive constant comes from the reasoning that in the absence of any elements in the vignette the response time is 0 seconds. (Table 10) shows the estimated response time for total panel, gender, age, neighborhood, and finally the two mind-sets. To make discovery easier, we have sorted the response time from long to short (more engaged to less engaged) by the total panel and highlighted in shaded cells all response times of 1.3 seconds or longer for an element. The choice of 1.3 seconds is arbitrary, but represents quite a long processing time for an element, consistent with other research findings which show that studies of socially and personally relevant issues generate long response times, whereas studies of messaging about commercial products and services generate quite short response times, rarely longer than 0.5 seconds.
Table 10. Response time (in seconds) to the 16 elements, by Total Panel and key subgroup.
|
|
|
|
Gender |
Age |
Neighborhood |
Mind-Set |
|||||
|
|
|
Total |
Male |
Female |
13–19 |
20–27 |
Poor |
Up & Coming |
Rich |
Focus Teacher |
Focus Community |
|
B4 |
students are accepting of the teacher |
1.3 |
1.2 |
1.3 |
1.4 |
1.1 |
0.8 |
1.6 |
1.2 |
1.0 |
1.5 |
|
B3 |
students identify with teacher race |
1.3 |
1.1 |
1.4 |
1.2 |
1.2 |
1.1 |
1.2 |
1.3 |
1.3 |
1.2 |
|
D2 |
community indifferent to educators |
1.1 |
0.9 |
1.4 |
1.5 |
0.8 |
1.4 |
1.0 |
1.3 |
1.0 |
1.3 |
|
B2 |
students are antagonistic towards teacher |
1.0 |
1.0 |
1.0 |
1.3 |
0.8 |
0.6 |
1.1 |
1.0 |
0.8 |
1.2 |
|
D3 |
community hostile to educators |
1.0 |
0.9 |
1.2 |
1.4 |
0.7 |
1.5 |
1.0 |
0.8 |
1.0 |
1.1 |
|
D4 |
community embraces educators |
1.0 |
1.0 |
1.0 |
1.4 |
0.7 |
1.4 |
0.8 |
0.8 |
0.9 |
1.1 |
|
C2 |
school in gentrified area |
1.0 |
1.1 |
1.0 |
1.1 |
1.0 |
0.8 |
1.2 |
0.7 |
1.2 |
0.9 |
|
C3 |
school in established middle class area |
1.0 |
0.7 |
1.3 |
1.1 |
1.0 |
0.9 |
0.8 |
1.3 |
1.1 |
0.9 |
|
D1 |
community supports educators |
0.9 |
0.9 |
0.8 |
1.5 |
0.2 |
1.1 |
1.1 |
0.4 |
0.5 |
1.2 |
|
C4 |
school in area with many new immigrants |
0.9 |
0.6 |
1.2 |
1.0 |
0.7 |
0.3 |
1.1 |
0.5 |
0.9 |
0.8 |
|
C1 |
school in depressed area |
0.9 |
0.5 |
1.3 |
1.1 |
0.7 |
1.2 |
0.7 |
0.4 |
1.2 |
0.6 |
|
B1 |
students are docile |
0.8 |
0.7 |
0.8 |
0.9 |
0.6 |
0.3 |
0.9 |
0.9 |
0.5 |
1.0 |
|
A4 |
teacher is Hispanic |
0.7 |
0.6 |
0.8 |
0.1 |
1.3 |
1.1 |
0.5 |
1.7 |
0.8 |
0.6 |
|
A2 |
teacher is Caucasian |
0.6 |
0.3 |
0.9 |
0.3 |
1.0 |
0.4 |
0.6 |
1.5 |
0.5 |
0.7 |
|
A1 |
teacher is black |
0.6 |
0.4 |
0.7 |
0.2 |
1.0 |
0.8 |
0.3 |
1.3 |
0.6 |
0.6 |
|
A3 |
teacher is Asian |
0.4 |
0.5 |
0.4 |
-0.1 |
0.9 |
0.6 |
0.3 |
1.4 |
0.6 |
0.4 |
The patterns emerging can be summarized as follows:
Total panel – Only one element engages
students are accepting of the teacher
Males – No element engages attention for the requisite 1.3 seconds
Females – No clear pattern, but appear to read the material in greater depth than do males
students identify with teacher race
community indifferent to educators
students are accepting of the teacher
school in established middle class area
school in depressed area
Age 13–19 – Respond to many elements about the community
community indifferent to educators
community supports educators
students are accepting of the teacher
community hostile to educators
community embraces educators
students are antagonistic towards teacher
Age 20–27 – Only one element engages
teacher is Hispanic
Poor Neighborhood – Elements having to do with the community
community hostile to educators
community indifferent to educators
community embraces educators
Up & Coming Neighborhood
students are accepting of the teacher
Rich Neighborhood – Focus on the nature of the teacher
teacher is Hispanic
teacher is Caucasian
teacher is Asian
students identify with teacher race
community indifferent to educators
school in established middle class area
teacher is black
Mind-Set 1 – Focus on Teacher
students identify with teacher race
Mind-Set 2 – Focus on Community – no clear pattern
students are accepting of the teacher
community indifferent to educators
Discussion and Conclusions
As of this writing, there is an increasing focus on the educational system, in terms of its ability to prepare the students. There are those who believe that the education system is ‘fine,’ because it complies with specific government objectives, and therefore there is little to worry about. There are others who believe that the education system is, in fact, a mess, resulting from the teacher’s focusing on ‘performance of standardized tests,’ and not on real teaching. Almost sixty years ago, educator Dr. Banesh Hoffmann, mathematics professor at Queens College and education refeormer, called out the education establishment in his controversial book, ‘The Tyranny of Testing.’ [19]. (Full disclosure; Professor Hoffmann was the major mathematics professor of author Moskowitz in 1964–1965, and contributed to the thinking which appears in this chapter) Today, there is an opportunity to reform education, to improve. The world has changed dramatically, the availability of technical aids to education and to creative thought has never been greater. The students of everyday are becoming increasingly sophisticated with computer electronics and even with coding thanks first to the widespread use of smartphones, and the social approbation given to coding.
When we step back, from the specifics to the general, and work with young people ages 13–27, we see that we have two groups. One group of young people feel that success is due to the interaction between the teacher and the student. Another group, a bit larger, feels that the success of a student is due far more to the interaction between the teacher and the community, specifically the community actively supporting the teacher. From the point of view of policy, it might well be a good idea to use this type of information to craft a dual message, how the teacher is a key, positive support to the student, and the community is a key, positive support to the teacher and the student. This PR campaign needs the specific words to use, a next step in the research effort reported here.
Acknowledgement
Attila Gere thanks the support of Premium Postdoctoral Research Program of the Hungarian Academy of Sciences.
References
- Hollins ER (2011) Teacher preparation for quality teaching. Journal of Teacher education 62: 395–407.
- Epstein JL and Sheldon SB (2006) Moving forward: Ideas for research on school, family, and community partnerships. SAGE handbook for research in education: Engaging ideas and enriching inquiry Pg No. 117–138.
- Kuh GD (2001) Organizational culture and student persistence: Prospects and puzzles. Journal of College Student Retention: Research Theory & Practice 3: 23–39.
- Kuh GD (1995) The other curriculum: Out-of-class experiences associated with student learning and personal development. The Journal of Higher Education 66: 123–155.
- Berger JB (2001) Understanding the organizational nature of student persistence: Empirically-based recommendations for practice. Journal of College Student Retention: Research Theory & Practice 3: 3–21.
- Bickel R and Papagiannis G (1988) Post-high school prospects and district-level dropout rates. Youth & Society 20: 123–147.
- Jordan WJ and Cooper R (2003) High school reform and Black male students: Limits and possibilities of policy and practice. Urban Education 38: 196–216.
- Kao G and Thompson JS (2003) Racial and ethnic stratification in educational achievement and attainment. Annual review of sociology 29: 417–442
- Heath AF, Rothon C, Kilpi E (2008) The second generation in Western Europe: Education, unemployment, and occupational attainment. Annual Review of Sociology 34: 211–235.
- Moskowitz HR and Park B (2015) How students want to study mathematics. Unpublished observations.
- Steinman RB (2009) Projective techniques in consumer research. International Bulletin of Business Administration 5: 37–45.
- Box GE, Hunter WG, Hunter JS (1978) Statistics for experimenters, New York, John Wiley.
- Green PE and Rao VR (1971) Conjoint measurement for quantifying judgmental data. Journal of Marketing Research 8: 355–363.
- Green PE and Srinivasan V (1990) Conjoint analysis in marketing: new developments with implications for research and practice. The Journal of Marketing 54: 3–19.
- Moskowitz HR and Gofman A (2007) Selling blue elephants: How to make great products that people want before they even know they want them. Pearson Education.
- Gofman A and Moskowitz H (2010) Isomorphic permuted experimental designs and their application in conjoint analysis. Journal of Sensory Studies 25: 127–145.
- Dubes R and Jain AK (1980) Clustering methodologies in exploratory data analysis. Advances in Computers 19: 113–238.
- Boring EG (1929) A History of Experimental Psychology. The Century Company, NY.
- Hoffmann B and Barzun J (2003) The tyranny of testing. Courier Corporation.