Abstract
We have visually described and analyzed by means of quantifed EEG (qEEG) a highly unusual EEG pattern, not associated with cognitive or any other symptomatology. This pattern consists in an asymmetric highly stationary and highly synchronized trace through all the scalp, mainly composed by alpha-band rhythms. This anomalous pattern appears during quiet-basal and active wakefulness and alternates with more physiological patterns.
We demonstrate that there are not features of epileptic or irritative and show that alpha rhythms are the main component of this pattern. Conclusion: it is essential to be familiarized with objective and numerical measures in EEG clinical practice to sustain results that can be related with basic neurophysiological research. Just approaches like this, we will increase the theoretical foundations of EEG, improving its utility and increasing its accuracy.
Keywords
Alpha rhythm, Quantified EEG, Scalp EEG, Synchronization
Introduction
The electroencephalogram (EEG) during relaxing wakefulness is dominated by alpha rhythm, maximum at occipital lobes when eyes are closed [1]. There is an increasing evidence that it is linked to important aspects of perception, as maximal interstimulus interval for perceived simultaneity or reaction time [2,3]. Alpha activity is also present at central regions, where is known as mu-rhythm. However, other cerebral rhythms are present to at different scalp regions [4,5]. Several kinds of EEG patterns have been described, both in physiological and pathological conditions by means of de visu description and by means of quantitative EEG (qEEG). This method allows an objective description of several features and can be extremely helpful, especially when patterns are highly complex [6-9].
EEG is especially adequate to study epileptic condition, both during interictal as during ictal states. Irritative activity is a synonymous of epileptiform activity and its morphology denotes cortical hyperexcitability. Generally, it is spike-like shaped, with a faster ascend than descend phase, associated with some background slowness and monopolar or dipolar field configuration, at least when activity is focal [10]. Among irritative patterns is the fixation-off sensitivity (FOS), characterized by: i) occipital or generalized epileptic discharges, ii) that constantly occur after closing the eyes and last as long as the eyes are closed and iii) they are induced by the elimination of central vision and disappear with fixation [11,12].
EEG is highly effective to discriminate between irritative and non-irritative activities, although sometimes this is difficult, especially when pattern is not common or well described. In this case, qEEG can be extremely useful [7]. In this work, we describe and quantify an EEG pattern highly unusual during wakefulness and misdiagnosed as FOS and epileptic, probably by the unusual of presentation. We demonstrate that there are not features of epileptic or irritative and show that alpha rhythms are the main component of this pattern.
Materials And Methods
Clinical Case
A 41-year-old female, right hand dominance with premorbid conditions of hypothyroidism, irritable bowel syndrome, chronic migraine, and epilepsy was admitted telemetry unit for presurgical evaluation. In a different center was diagnosed as generalized epilepsy with FOS. Te patient was being treated with 3 antiepileptic drugs.
Study was made with fully informed consent as specified by the Declaration of Helsinki and approved by local La Prinesa review board.
EEG Recording and Quantification
EEGs records were performed using a 32-channel digital system (EEG32U, NeuroWorks. XLTEK®, Oakville, Canada) with 19 electrodes placed according to 10-20 international system. In addition, the differential derivation I of Einthoven for ECG was placed. Recordings were performed at 512 Hz sampling rate, a filter bandwidth 0.5 to 70 Hz and notch filter at 50 Hz. Electrode impedances were usually below 15 kΩ.
Artifact-free periods (e.g. electro-oculogram -EOG- electromyography -EMG- or movement) were selected when possible and exported in ASCII file. Sometimes, analysis was done in the presence of some artifact (e.g. during non-basal awake state). The algorithm used has been previously published [7-9]. Briefly, areas under the power spectrum (PS), obtained by fast Fourier transform, were computed for classical EEG bands delta (0.5-4 Hz), theta (4-8 Hz), alpha (8-13 Hz) and beta (13-30 Hz). Stationary periods were mostly used to obtain average PS, although sometimes non-stationary periods were deliberately analyzed. Pearson’s correlation coefficient (r) was also calculated. One second Hanning windowing 10% superimposed were used to compute all of these measurements. Exported records were between 120 and 300 s, which allowed a minimum of 130 and a maximum of 330 windows to be computed. For every channel, the average and the standard error of mean (SEM) of whole the PS analyzed were computed. A group of 20 adults neither neurological pathology nor pharmacological treatment (43 ± 5 years-old) was used as control. Synchronization values form this group were probed to be gaussian by means of Kolmogorov-Smirnoff’s test. Comparison between patient’s PS and averaged from control group was assessed after normalization of all channels to the area of the occipito-parietal lobes (P3-O1/P4-O2). Numerical analysis of EEG recordings was performed with custom-made Matlab® R2019 software (MathWorks, Natic, MA, USA).
Statistical comparison with control group was performed using the Student’s t-test because normality was probed. However, when normality failed, the Mann-Whitney test was used. When possible, paired data were used. The significance level was set at p = 0.05.
Results
De visu Description of EEG
De visu basal eyes-closed EEG showed an apparently symmetric high-voltage pattern, highly homogeneous without antero-posterior gradient (Figure 1A). Periods of several minutes showed a high stationarity (Figure 1A). Eyes opening sometimes removed this pattern, returning after closing eyes back (Figure 1B), but not always. Neither real spikes nor sharp-waves were observed (Figure 1C). Hyperventilation o photic stimulation did not modify the pattern. We have named this state as shyncronized (EEGsyn). Neither signs nor symptoms were claimed during the long-lasting periods of EEGsyn recorded.
During active wakefulness, sometimes EEG showed a physiological desynchronized pattern (Figure 1D and 2C). However, this desynchronized pattern (EEGdesyn) usually alternated with EEGsyn even during periods of mental work (e.g. reading or watching screen, see below). Patient stayed more than 50% of wakefulness period in EEGsyn.
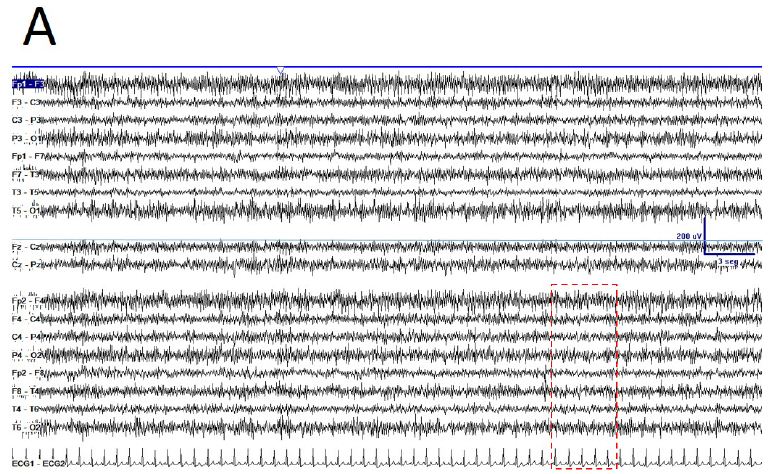
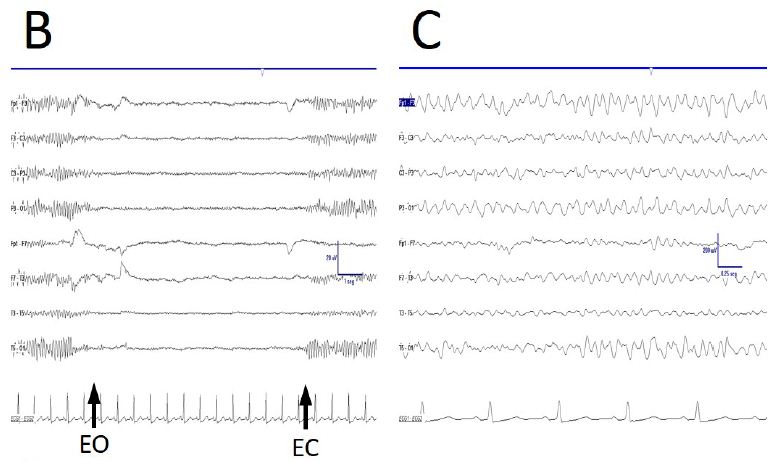
Figure 1: De visu description of wakeful trace. A) Medium-lasting trace during EEGsyn in basal state (eye closed) near 1 minute duration. A high amplitude, apparently symmetric and without antero-posterior gradient pattern is evident. B) Disappearing of EEGsyn pattern after eyes closure (EC) and re-appearing after eyes opening (EO). Only channels from right hemisphere are shown. C) Detail of the boxed-period form figure A. Neither spikes nor sharp-waves or any other epileptic elements are present. D) Physiological desynchronized pattern during active wakefulness. Short-lasting, small amplitude burst of alpha rhythm are present at occipital lobes.
Some anomalies in physiological responsiveness have been observed, as the blocking of mu rhythm with eyelid (Figure 2A), although a more frequent physiological vanish with movement of the contralateral upper limb has yet been observed (Figure 2B).
As previously stated, FOS appears always eyes are closed. However, this was not the case, because sometimes a truly physiological alpha rhythm vanished after eyes opening and appeared after eyes closing (Figure 2C). Moreover, EEGsyn pattern did not disappeared with gaze fixation, on the contrary, a highly stationary pattern remains during long-lasting periods of reading or gaze fixation onto screen.

Figure 2: De visu description of some properties during EEGdesyn. A) Anomalous blocking of right mu-rhythm with eyes closing, indicated by EOG potential. B) Physiological vanishing of mu-rhythm with movement of contralateral hand (arrow). C) Physiological EEGdesyn pattern with a suitable antero-posterior gradient and an alpha occipital rhythm during eyes closure (EC), adequately blocked by eyes opening (EO).
Numerical Characterization of EEG
Normalized PSs from basal resting state of EEGsyn was compared with the average from control-group. From Figure 3A we can observe a pattern completely different from control group (black lines), not only for the slower peak of posterior dominant rhythm, but for the great difference between anterior and posterior regions. In fact, in frontal and temporal lobes there is a significant reduction of delta activity. Although can be an effect of the channel used to normalization, what is clear is the great difference between physiological PS and those obtained from EEGsyn.
From Figure 3B we can observe the absence of physiological antero-posterior gradient. Through all the scalp there is three well-defined main components, one at 5.5 Hz in the theta band and two others in the alpha band at 9 and 11.5 Hz. The posterior dominant frequency (PDF) is 9 Hz. A faster component at 18 Hz (beta band) can be observed at occipito-temporal regions and can be a harmonic of PDF. Another relevant fact is that, although not observed from de visu description (Figure 1A), there is a great asymmetry between hemispheres, especially for parieto-occipital regions. Finally, it is remarkable the magnitude of PS, ranging even up to 400 µV2/Hz, at least one order of magnitude higher than usual PS.
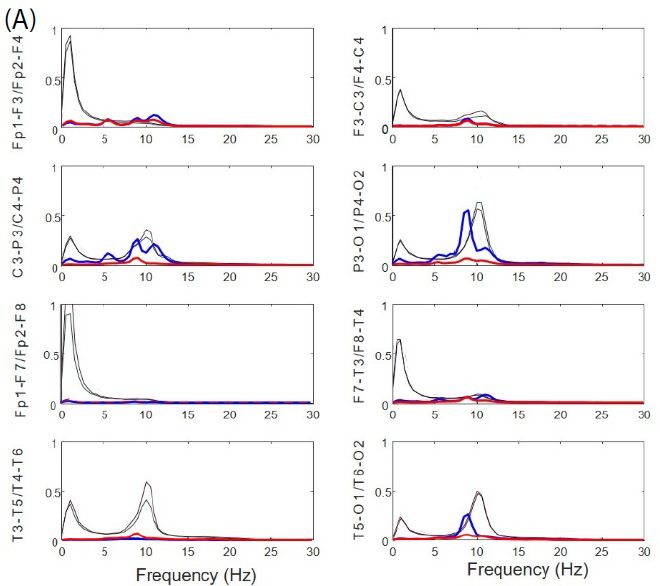
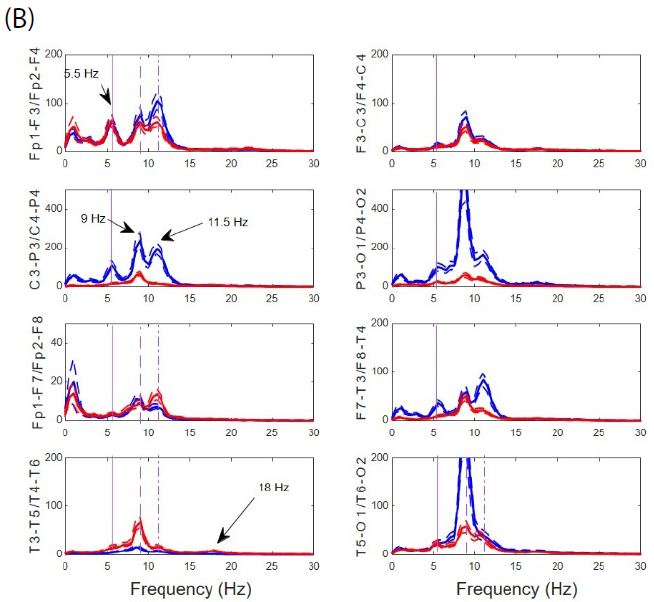
Figure 3: Anomalous structure of EEGsyn. (A) Comparison between average normalized PS from control group (black lines) and normalized PS from patient; (B) Detailed comparison between PS from patient. Dotted lines mean SEM. Red lines = right hemisphere; Blue lines = left hemisphere. Vertical lines mark frequencies of the most relevant components at 5.5, 9 and 11.5 Hz. Y-axis units in µV2/Hz.
We have coined the term synchronized for this pattern because r values for whole hemispheres were higher than for control group. However, not all the regions were hypersynchronized than control group. In fact, left frontal and parieto-occipital lobes were relatively desynchronized, as can be observed from Figure 4. It’s also notably the significant asymmetry in synchronization between hemispheres for frontal and parieto-occipital lobes at all the three states (p < 0.001 for paired Student-t test).
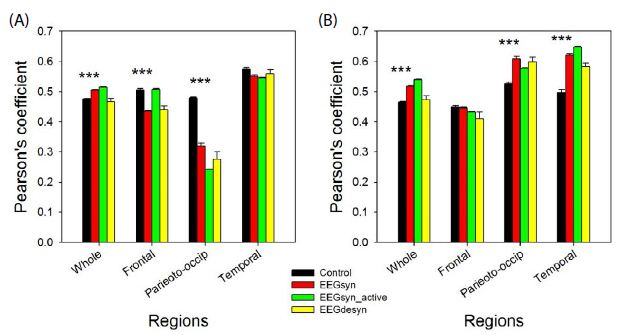
Figure 4: Average synchronization at several states for different regions for (A) left and (B) right hemisphere. Black = control group; red = EEGsyn in basal state; green = EEGsyn during active awake; yellow = EEGdesyn. *** p < 0.001 for Student-t test between control group and EEGsyn.
Hypersynchronized state not only appeared during closed eye periods, but also during cognitive task-performance (e.g. reading, writing, or watching t.v.). During these periods, de visu appearance of trace and PS was similar to that of basal state (Figure 5), as was also the mean PSs for channels. The main difference is the disappearence of the higher alpha components at fronto-polar regions (11 Hz) and the slight increase of the mean generalized alpha component to 10 Hz. The theta 5 Hz component is also present at both states. However, as can be observed from Figure 4, r average was higher (p < 0.001, Mann-Whitney test) for both hemispheres with similar values for frontal lobes, but desynchronization in left parieto-occipital (p < 0.001 Mann-Whitney test) and temporal lobes (p < 0.05 Mann-Whitney test) and hypersynchronization for right parieto-occipital (p < 0.01 Mann-Whitney test) and temporal lobe (p < 0.001 Mann-Whitney test).
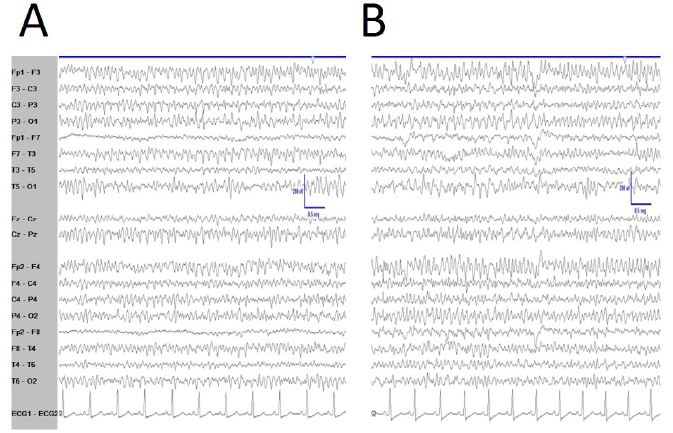
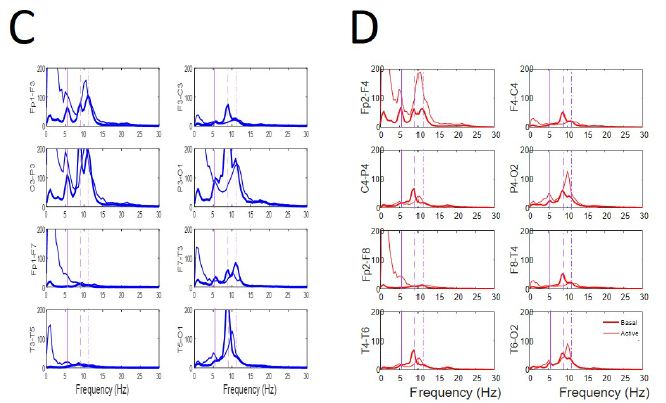
Figure 5: Similar pattern during EEGsyn states. (A) Raw traces from quiet wakeful basal eye-closed state and (B) from active wakeful eye-open state. (C) Superposition of average PS for both states at every channel from left (D) and right hemisphere. Thick lines from quiet and thin line from active states respectively. Vertical lines are the same that in Figure 3B. Delta component during active EEGsyn at anterior regions reflects artifact from EOG.
Alpha Dependence of EEGsyn
We have addressed how EEGsyn appeared from EEGdesyn state. As can be observed for every state, alpha activity is remarkably similar for occipital and central regions (mu-rhythm). This late component spreads over neighbor regions, mixing with occipital dominant rhythm until affect whole scalp (Figure 6A). The generalized alpha component of PS but mainly located at frontal lobes (mu-alpha rhythm) increased clearly for all channels around the 10 Hz dominant frequency. The only component of new apparition during EEGsyn was the 5 Hz theta component asymmetrically distributed (Figure 6B and 6C). This last component, as stated above was always present during EEGsyn states, quiet and active.
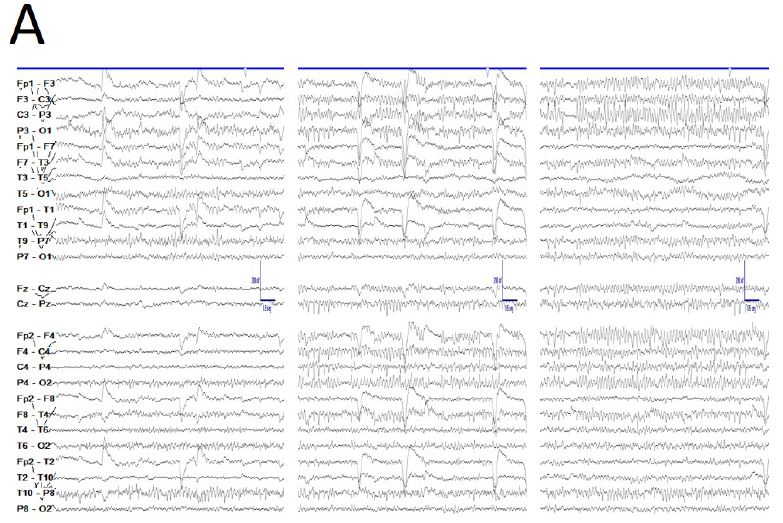
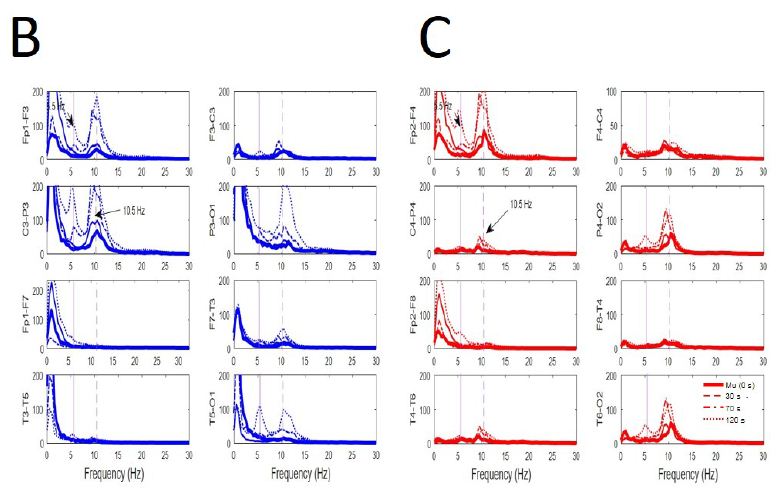
Figure 6: Evolution from mu-alpha rhythm during EEGdesyn. (A) Raw traces during wakeful active eye-open state (EEGdesyn) showing mu-alpha and alpha occipital rhythms (left column at t = 0 s), 30 s later (middle column) and at 120 s (right column), when EEGsyn pattern is present. (B) Superposition of average PSs at different times for channels from left and (D) right hemisphere. Thick lines = 0 s; sliced line = 30 s; dotted-sliced = 70 s and dotted line = 120 s. Vertical lines are the same that in Figure 3B. Delta component during active EEGsyn at anterior regions reflects artifact from EOG.
During active wakefulness with mental activity sudden transitions between EEGsyn and EEGdesyn were observed (Appendix, Figure 1). The most dramatic change observed during these transitions was a decrease in alpha and in a lesser degree, beta bands (see Appendix, Figure 1C and 1D).
Discussion
We have described and analyzed a highly unusual EEG pattern, not associated with cognitive or any other symptomatology. This pattern consists in an asymmetric highly stationary and highly synchronized trace through all the scalp, mainly composed by alpha-band rhythms. This anomalous pattern appears during quiet-basal and active wakefulness and alternates with more physiological patterns.
The regulation of the EEG bands is carried out by different brain structures [13,14]. This complex neuroanatomic homeostatic system is probably genetically determined and regulates baseline levels of local synchronization, global interactions between different regions and spectral composition of the signal [15-18]. It is commonly believed that beta activity is originated from cortico-cortical interactions, meanwhile alpha implies thalamo-cortical activity. According to the International League against Epilepsy, an epileptic seizure is a transient occurrence of signs and/or symptoms due to abnormal excessive or synchronous neuronal activity in the cortex of the brain [19]. Therefore, we must expect that ictal activity would be associated with increase in the frequency of scalp activity, by increasing the beta activity [7]. We have showed that the EEGsyn pattern is composed by an asymmetric mixture of theta to beta components not changing during long period of time. In fact, there is a pattern highly stationary, not changing its PSs practically nothing during periods as long as tens of minutes. Synchronization, although higher than control, neither changes along the time. Therefore, once the pattern is stablished from EEGdesyn, neither evolution of frequency nor synchronization change is observed. This highly stationary pattern is not compatible with epileptic seizure dynamics [20,21]. Taking into account that EEGsyn was present during more than 50% of wakefulness and neither cognitive nor behavioral symptoms/signs were observed, no epileptic features can be associated with this state. Therefore, we can rule out that this would be a kind of ictal pattern.
In the same way, we must discard EEGsyn as FOS, and therefore as irritative. We have shown that waveforms have not irritative morphology, pattern does not constantly occur after closing eyes, in fact frequently appears during eyes opening and does not disappear with gaze fixation, and on the contrary, it’s commonly present during reading or watching screens. Therefore, none of the features defining FOS are present at EEGsyn pattern [11,12].
There is increasingly evidence showing that alpha rhythms are generated at thalamus [22-24] although the participation of occipital cortex is debated [25]. In fact, alpha, theta and also delta frequencies are elicited by acetylcholine and glutamate at thalamic lateral geniculate talamo-cortical (TC) neurons [22]. In mammal models, a convincing model of interplay between TC rely cells and interneurons, coupled by gap junctions and chemical synapses has been described [24]. It can be speculated that an abnormal network of TC neurons/interneurons (not necessary viewed as a morphological alteration) can be responsible of the EEGsyn pattern in this patient. This could explain why despite the anomalous structure of the EEG, neither cognitive complaint nor behavioral changes are observed during the pattern. Obviously, more studies would be needed to try this hypothesis (e.g. functional connectivity by MR, detailed cognitive evaluation or evoked potentials at different states).
To the best knowledge of authors, this pattern has not been previously described and we have not found beforehand in our experience (more than 25000 EEG along the last 25 years). Then, we do not expect that publish of this kind of pattern would be of great interest to neurophysiologists to keep in mind as a possible differential diagnosis. However, what is important in practical terms is to use objective concepts in EEG practice, allowing a differentiation between epileptic and non-epileptic patterns, because misdiagnosis can lead to an iatrogenic climbing with disastrous results for the patient. EEG is considered highly subjective (discussed at. [9]) and therefore, a basic theory of EEG is poorly developed. Therefore, it is essential to be familiarized with objective and numerical measures in EEG clinical practice to sustain results that can be related with basic neurophysiological research. Just approaches like this, we will increase the theoretical foundations of EEG, improving its utility and increasing its accuracy.
References
- Berger H (1933) Über das Electrenkephalogramm des Menschen Siebente Mitteilung (7th report). Psychiat. Nervenkr 103: 444-445.
- Van Rullen R, Koch C (2003) Is pereception discrete or continuous? Trends Cogn. Sci 7: 207-213. [crossref]
- Mathewson KE, Gratton G, Fabiani M, Beck DM, Ro T (2009) To see or not to see: prestimulus alpha phase predicts visual awareness. Neurosci 29: 2725-2732. [crossref]
- Klass DW, Westmoreland BF (2002) Electroencephalography: general principles and adult electroencephalogram. In: Clinical Neurophysiology, 2nd J. R. Daube. Oxford University Press, New York, 77-107.
- Schomer DL, Lopes Da Silva F (2011) Niedermeyer’s Electroencephalography, 6th Eds: D.L: Schomer, F. Lopes Da Silva. Wolters Kluver, Philadelphia.
- Sutter R, Kaplan PW (2013) Clinical and electroencephalographic correlates of acute encephalopathy. J Clin Neurophysiol 30: 443-53. [crossref]
- Vega-Zelaya L, Martín Abad E, Pastor J (2020) Quantified EEG for the characterization of epileptic seizures versus periodic activity in critically ill patients. Brain Sci 10: 158. [crossref]
- Pastor J, Vega-Zelaya L, Martin Abad E (2020) Specific EEG encephalopathic pattern in SARS-CoV-2 patients. Clin. Med 9: 1545. [crossref]
- Pastor J, Vega-Zelaya L, Martin Abad E. Necessity of quantitative EEG for the daily practice. In: Electroencephalography. Ed: H. Nakano. InTech. ISBN 978-1-83968-289-6.
- Hamer HM, Katsarou N (2004) Noninvasive EEG in the definition of the irritative zone. In: Presurgical Assessment of the Epilepsies with Clinical Neurophysiology and Functional Imaging. Eds: F. Rosenow, HO Lüders. Academic Press, Elsevier. 3.
- Brigo F, Rossini F, Stefani A, Nardone R, Tezzon F, et al (2013) Fixation-off sensitivity. Clinical Neurophysiology 124: 221-227. [crossref]
- Caputo D, Trivisano M, Vigevano F, Fusco L (2018) CHD2-epilepsy: Polygraphic documentation of self-induced seizures due to fixation-off sensitivity. Seizure 57: 8-10.
- John ER (2002) The neurophysics of consciousness. Brain Res Brain Res Rev 39: 1-28. [crossref]
- Kropotov JD (2009) EEG Rhythms. Quantitative EEG, event related potentials and neurotherapy. Elsevier, Amsterdam.
- Szava S, Valdes P, Biscay R, Galan L, Bosch J, et al. (1994) High resolution quantitative EEG analysis. Brain Topogr 6: 211-219. [crossref]
- Hughes JR, John ER (1999) Conventional and quantitative electroencephalography in psychiatry. Neuropsychiatry Clin. Neurosci 11: 190-208. [crossref]
- Kondacs A, Szabo M (1999) Long-term intra-individual variability of the background EEG in normals Neurophysiol 110: 1708-1716. [crossref]
- Buzsáky G (2006) Rhytms of the brain. Oxford university press, New York.
- Fisher RS, Acevedo C, Arzimanoglou A, Bogacz A, Cross JH, et al. (2014) ILAE official report: a practical clinical definition of epilepsy. Epilepsia 55: 475-82. [crossref]
- Sanz-García A, Vega-Zelaya L, Pastor J, Sola RG, Ortega G (2017) Towards operational definition of postictal stage: spectral entropy as a marker of seizure ending. Entropy 19.
- Vega-Zelaya L, Pastor J, Tormo I, Sola RG, Ortega GJ (2015) Assessing the equivalence between etomidate and seizure network dynamics in temporal lobe epilepsy. Clinical Neurophysiology 127: 169-178. [crossref]
- Hughes SW, Lörincz M, Cope DW, Blethyn KL, Kékesi KA, et al. (2004) Synchronized oscillations at alpha and theta frequencies in the lateral geniculate nucleus. Neuron 42: 253-288. [crossref]
- Hughes SW, Lörincz ML, Blethyn K, Kékesi KA, Juhász G, et al. (2011) Thalamic gap junctions control local neuronal synchrony and influence macroscopic oscillation amplitude during EEG alpha rhythms. Frontiers in Psychology 193. [crossref]
- Lörincz ML, Kékesi KA, Juhász G, Crunelli V, Hughes SW (2009) Temporal framing of thalamic relay-mode firing by phasic inhibition during the alpha rhythm. Neuron 63: 683-696. [crossref]
- Halgren M, Ulbert I, Batuji H, Fabó D, Eröss L, et al. (2019) The generation and propagation of the human alpha rhythm. PNAS 116: 23772-23782. [crossref]
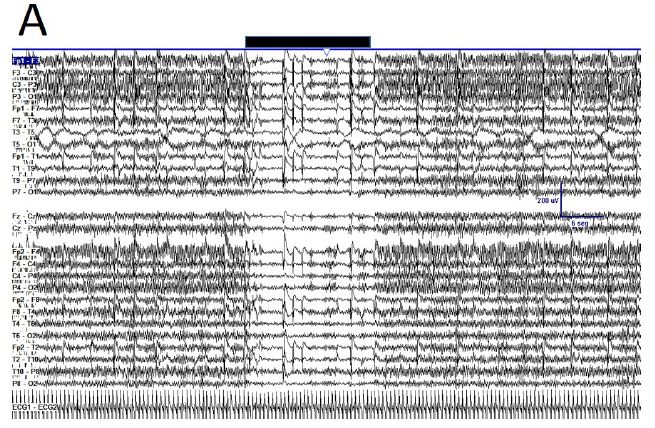
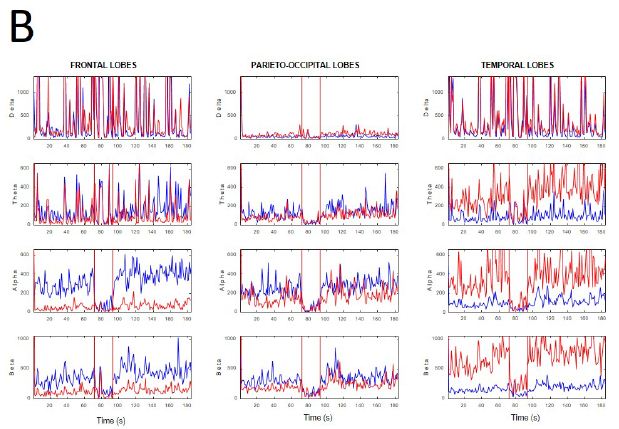
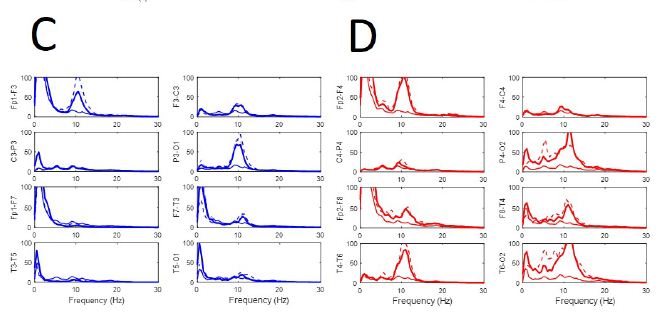
Figure 1: Fluctuation between EEGsyn and EEGdesyn during mental activity in awake state (A) Raw traces meanwhile the patient is reading at screen, change head to watch and hold the cellular phone (upper horizontal solid bar) and later return to reading onto screen; (B) Dynamical of EEG bands grouped by lobes during whole the period. Vertical lines denoted the change from screen to cellular phone. Red = right hemisphere; blue = left hemisphere; (C) Average PSs for all the tree periods from left and (D) right hemisphere. Thin lines = first EEGsyn period; thick lines = EEGdesyn (cellular phone) and dotted lines = second EEGsyn period. Observe that delta activity is due by EOG and is mainly located at fronto-temporal areas. Considering the active state of the patient, obviously there is no change in the eye movements during the three periods.