Abstract
This paper responds to a Linked In post by Matt Lerner, regarding efforts by PayPal, Inc. to segment the market, identify personas, and move towards more actionable marketing efforts. The reported disappointing results came after thousands of interviews, a period of one year to design the research, collect the data, and analyze the results, with an expenditure of 1mm dollars. Using the same challenge, to provide a company such as PayPal with powerful, actionable information, the study of 100 people using artificial intelligence embedded in Mind Genomics, generated results and insights presented here, doing so in approximately two hours from start to finish, at an out-of-pocket cost slightly above $400. The results are presented as an exemplar of easy-to-create databases of the human mind on topics that range from profound to quotidian events, the everyday situations that escape notice but could contribute to a deeper knowledge of people and society.
Introduction
In early March 2023, the following post appeared in Linked In, a social media site specializing in business connections. The tonality of the post coupled with the specific information provides an implicit challenge to today’s methods to build systematic knowledge databases. Lerner moved from the standard methods of developing personas in segmentation [1] to the important approach called JTDB (jobs to be done), a contribution by the late Harvard business professor, Clayton Christensen [2]. Figure 1 presents a screen shot of the first part of the Linked In post, leaving out the details about the JTDB.
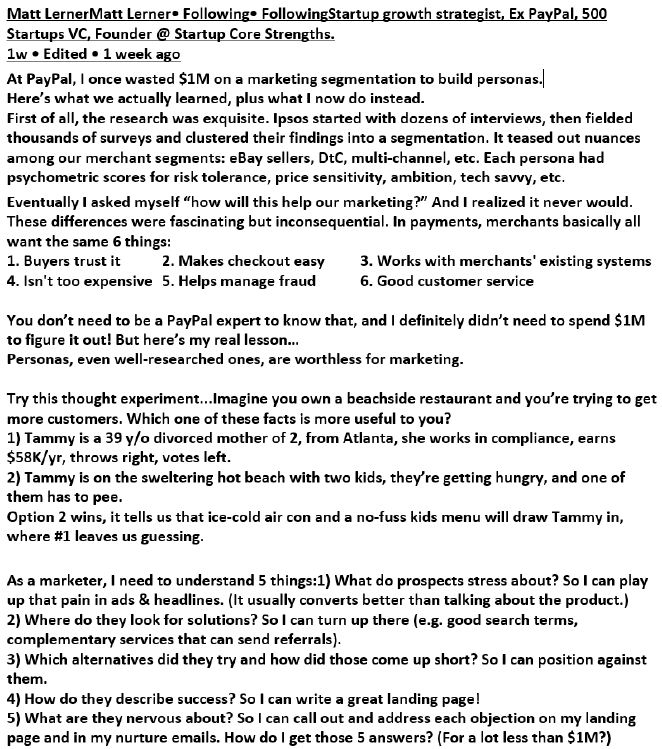
Figure 1: Screen shot of post by Matt Lerner regarding PayPal
The post by Lerner immediately generated a cluster of strong reactions, as perhaps it was meant to do. The most important reaction was the sense that here was an opportunity to demonstrate what could be done in an hour or two to solve the same problem, albeit with a different worldview (experimentation rather than hypothesis generation). We chose the road ‘less trodden,’ viz., describe and attempt to provide direct business solutions using a combination of simple thinking, direct experimentation, artificial intelligence, focusing almost on the basis of the business issue for PayPal, namely solving a problem (reducing impediments to customer usage and customer retention).
We offer this paper as an example of what can be done today (2023) in about 1-3 hours, at a cost of a few hundred dollars. This alternative approach involves thinking, reduces the cycle time for learning, demands far lower investments for the knowledge, and produces databases of knowledge, local, generally, in the moment, or over time to provide time-based, geography-based knowledge. Rather than providing a different approach to the specific problem, the authors present a general re-thinking of the issue as one of the ‘production of useful information’. The paper is not a solution as much as a stimulant for discussion. We present our approach to tackling the PayPal issue, this time using Mind Genomics. Mind Genomics is an experimenting science of decision making and behavior, tracing its origins to experimental psychology (psychophysics), statistics (experimental design), and public opinion and consumer research.
Psychophysics, the oldest branch of psychology, is the study of the relation between physical stimuli and subjective reactions to those stimuli. The objective is to measure the perception of the stimulus, viz, a subjective measurement, and then relate that measure to the nature and magnitude of the physical stimulus. Harvard Professor of Psychophysics, S.S Stevens, called this discipline the ‘outer psychophysics’. Mind Genomics focuses on what Stevens called the ‘inner psychophysics,’ the structure and measurement of relations between ideas [3].
Statistics provides a way of dealing with the world, analyzing the measures, finding relations, defining order of magnitude and the evidence of effects of one variable on another. Statistics also allow us to find ‘order’ in nature, and in some cases help us interpret the order. The discipline of experimental design allows us to create test combinations of stimuli, those stimuli being combinations of phrases or ingredient [4], or even combinations of other variables, such as combinations of pictures to study responses to a package [5]. Experimental design lets us understand relations between variables in a clear fashion, moving the world of ‘insights’ out from disciplined description to quasi-engineering. Finally, consumer research and opinion polling focus on the nature of what is being measured. Rather than looking for general principles of behavior, deep behaviors, often needing artificial situations in which these deep principles can be illustrated, consumer research works with the quotidian, the everyday, the granular in which life is lived and experienced [6]. The consumer researcher is interested in the reactions to the world of the everyday, as the world is constituted, rather than concentrating on unusual combination, structured in an unusual fashion to illustrate an effect. Our stated goal for the project was to see how quickly and how inexpensively we could ‘solve’ the problem, or at least contribute materially to the solution. The ‘real’ goal, however, was to create a series of templated steps to solve the problem and offer those steps to the world community as an ‘algorithm’ to approach the creation of new knowledge about decision making, assuming the effort to start with absolutely no knowledge at all. Rather than theorizing about the best steps, opining about what should be done and why, we began with the belief that the best approach would be simply ‘do it’, and see what happens. In this spirit, we offer the reader our templated approach, with results, and with the delight that the effort lasted about two hours, cost about $400 (but could have been less), and that that effort produced clear, understandable, testable results. The final delight is that had the initial effort been less successful there was another two-hour slot immediately afterwards to build on the partially successful first effort.
How Mind Genomics Works
Mind Genomics differs from the traditional questionnaire. In the traditional approach, the researcher presents the respondent with a phrase or other test stimulus and instructs the respondent to rate that single stimulus. The pattern of responses to many such stimuli provides the raw materials. Such a system might at first seem to be the very soul of good research, because the stimulus is isolated, and rated one at a time. In some cases that might be the case, but when we deal with real people we are faced with the ongoing desire for the respondent to ‘game’ the system, to provide what is believed to be the ‘right answer’, perhaps an answer that the respondent feels to be one that the researcher will more readily accept. The published literature recognizes these types of response biases, and has done for at least 60 years, and more like 80 years [7,8].
Mind Genomics operates differently. Mind Genomics works by combining phrases, presenting combinations of these phrases to respondents, obtaining a rating of the combination, and then deconstructing the response to the combination in order to understand how each phrase drives the response. In a Mind Genomics study the respondent evaluates different combinations, generally 24 different combinations of phrases. Each combination or ‘vignette’ in turn comprises 2-4 phrases (elements), with these elements appearing five times in the 24 vignettes evaluated by each respondent and absent 19 times in the 24 vignettes.
Often researchers who look at the Mind Genomics studies complain that it seems to be almost impossible to ‘do this study correctly.’ The inability to ‘guess’ the right answer because of the apparently random combinations of elements irritates many professionals, who feel that the respondent has to cope with a ‘blooming, buzzing confusion,’ the term that psychologist William James used to describe the perceptual world of the newborn child [9]. The reality, however, is that most respondents who think they are guessing actually do quite well, as they negotiate through the 24 vignettes. They pay attention to what is important to them. The result is a clear pattern, often a pattern which might surprise them by its correctness and clarity in the light of their experience with these combinations of messages that seemed so random.
The Mind Genomics Steps – from Chaos to Tentative Structure
We present the Steps in Mind Genomics, assuming that we start with virtually no knowledge at all about the issues involved with PayPal, other than possible customer issues which may or may not end up in ‘churn.’ The reality of the process is far deeper than one might imagine. Virtually all research conducted by author Moskowitz since first starting a career in 1969 has revealed that most researchers in the business community do not really profoundly understand how to solve specific problems, although with a bit of study many learn to discern the relevant aspects of a problem, and eventually move towards a solution, whether that solution be optimal or not. Thus, the need for an algorithmic approach to problem design and problem solution, a solution which can be implemented even by a young person (e.g., age 10 or so).
The authors of this paper are all reasonably senior or beyond. In order to keep to the vision of an algorithmic solution doable quickly and easily by anyone, we have limited all of the effort to working with artificial intelligence as a provider of substantive materials for questions and answers pertaining to PayPal and its issues.
Step 1: Choose a Name (Figure 2, Top Left Panel)
Naming requires that the researcher focus on what is to be studied. Choosing a name is generally simple, but not always. Even in this study there was a bit of hesitation about what to call the study. Such hesitation is revealing. It means that the researcher may have a general idea about the topic but must focus. That focus can be a bit discomforting at first, because it means deliberately limited the effort, almost hypothesizing at the start of the project about what is the real ‘goals’ Figure 2 (top left panel) shows the screen where the respondent names the study.
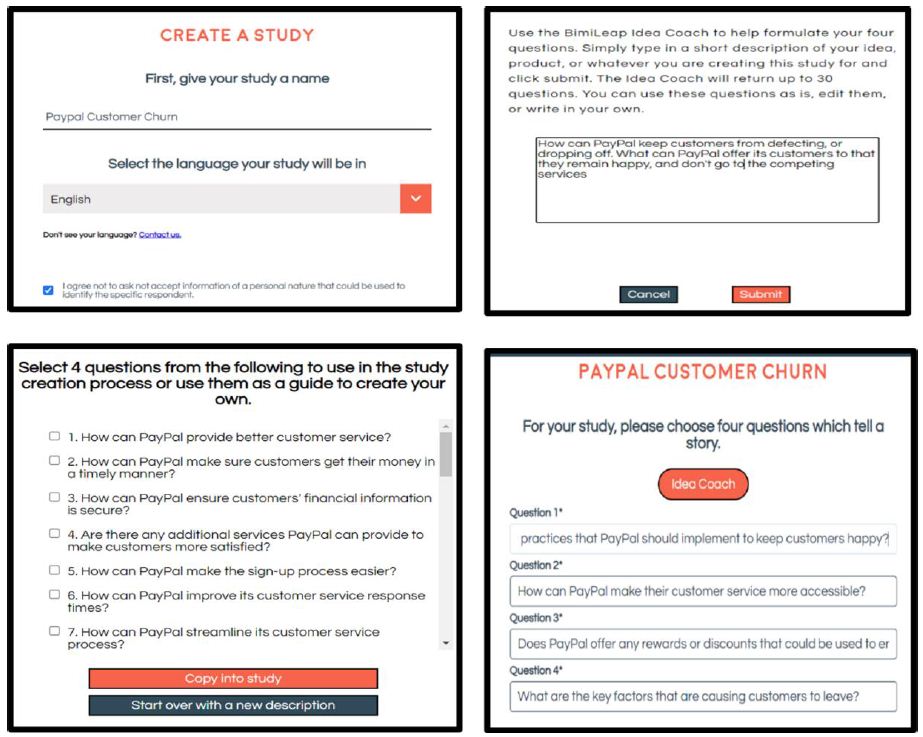
Figure 2: Set-up screen shots. Top Row Left Panel = select a name for the study, Top Row Right panel = Idea Coach input to provide questions. Bottom Row Left panel = 7 of 30 questions generated by Idea Coach, Bottom Row Right Panel = The four questions finally chosen (screen shot shows partial text).
Step 2: Choose Four Questions Which ‘Tell a Story’
The objective here is to lay the groundwork for a set of test elements or messages that will be shown to the respondent in systematically varied combinations. Rather than simply drawing these test elements out of the ‘ether’ and having respondents rate each one, Mind Genomics instructs the research to create a story, beginning with questions flowing in a logical sequence. Those questions will be used to generate answers. A recurrent problem faced by researchers using Mind Genomics is that the ordinary, unskilled professional often gets lost at this early stage. It is daunting to think of questions. Answers are easy; we are accustomed to answering questions from our early and later education. It is the questions which are difficult. We are not accustomed to thinking of good questions, except when we debate in a competitive way, and have to hone down our answers, or perhaps when we begin higher education after college. Before then, college and earlier, our expertise is answering, not asking. It is no wonder that many would-be researchers attempting to follow the steps of Mind Genomics simply throw up their hands at this step.
Our ‘demo study’ on PayPal is a perfect example. We know the problem. But what are four relevant questions that we should ask? We are not accustomed to thinking about questions, and so we need an extra ‘hand’ to pass through this Step 2. The approach we use employs AI, artificial intelligence, embedded in the Idea Coach. The researcher describes the problem (Figure 2, top right panel), lets Idea Coach use the description to produce sets of 30 questions (Figure 2, bottom left), and across several uses of Idea Coach. The research will end up with four questions (Figure 2 bottom right).
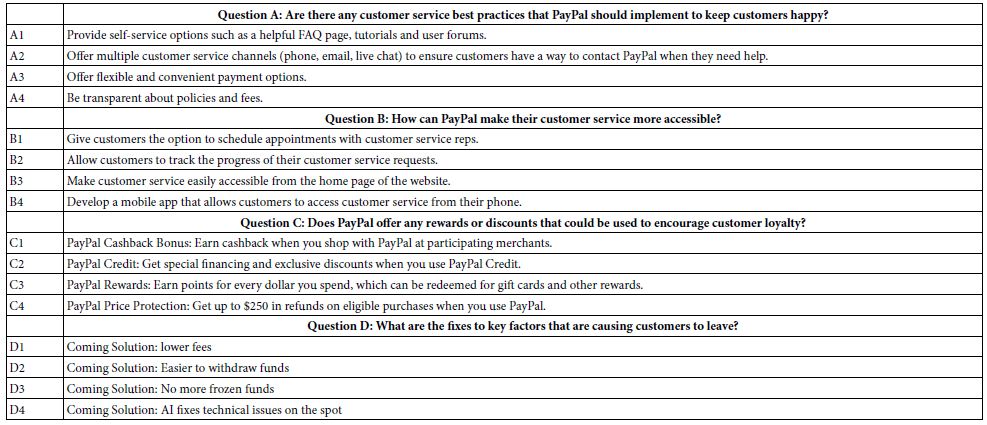
The important thing to keep in mind is that the researcher can interact with the AI driven Idea Coach. The briefing given to Idea Coach (Figure 2 top right panel) can be run several times, each time with different questions emerging, along with repeat questions. The briefing can be changed, and the Idea Coach is re-run, again producing different sets of 30 questions. Finally, the questions which emerge from Idea Coach can themselves be changed by the user. Table 1 shows the four questions in their final text form, along with the four answers to each question.
Table 1: The four final questions, and the four answers to each question. Questions and answers emerged from Idea Coach, powered by AI.
Step 3: Select Four Answers to Each Question
Once the researcher selects the questions, the BimiLeap program presents each question 2, with a request to provide four answers. Figure 3 shows this third step. The top left panel in Figure 3 shows the layout, presenting the first question for the researcher, and requesting four answers. Often researchers find this step easy. For those who want to use Idea Coach, the question is already selected, but can be edited, and then Idea Coach invoked (Figure 3, Top Row, Right screen). Each request to Idea Coach uses the question as Idea Coach currently finds it. As the researcher learns more about the topic from Idea Coach, the researcher can run many requests to get the four answers, or change the question, and rerun the Idea Coach. The Bottom Row (left panel) shows 7 of the 15 answers.
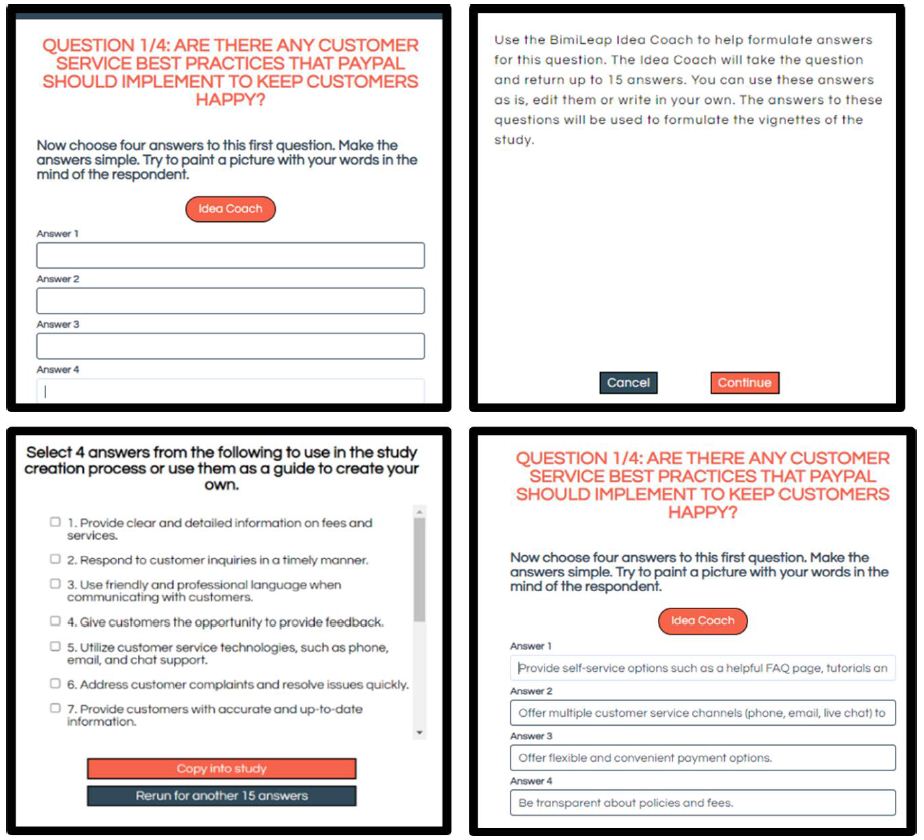
Figure 3: Creating four answers for a single question, showing the contribution of Idea Coach
The Bottom Row (right panel) shows the four answers selected or written in. Once again, the answers can be used as Idea Coach provides them, or edited, or even some answers can be provided by the researcher without using Idea Coach. As the researcher becomes more familiar with the Mind Genomics templated process it becomes easier to skip the Idea Coach steps, at least when providing answers.
Step 4: Create an Orientation Page and a Rating Scale
Respondents in the Mind Genomics study will be presented with vignettes, viz., with combinations of messages. The respondent has to be instructed what to do. In most studies it suffices to instruct the respondent to read the vignette. Figure 4 (Top Left Panel) shows the orientation page, presented at the start of the study. Right below (Figure 4, Bottom Left Panel,) appear the instructions accompanying each test stimulus (vignette, described below), along with the set-up page to define the scale. The five-point scale used here is a simple Likert scale, with the middle scale point reserved for ‘don’t know.’ Respondents find this scale easy to use.
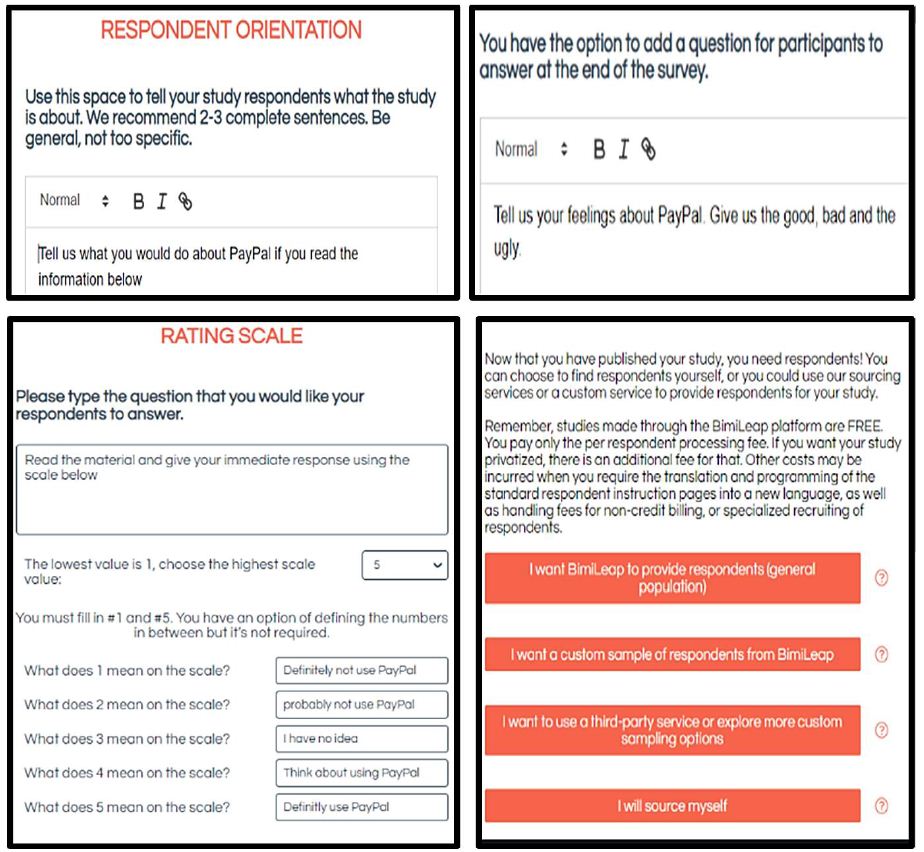
Figure 4: Left panels show the orientation to the respondent (Left Panel, Top Row), and the rating scale to be used for each vignette (Left Panel, Bottom Row). Right panel Top Row shows the instructions for the open-end question regarding feelings about PayPal. Right Panel Bottom Row shows the instructions regarding the acquisition of respondents.
There is little guidance given to the respondent, the reason being that it is the elements which must convey the information, not the instruction. Only in situations where it is necessary for the respondent to understand the background facts more deeply, e.g., law cases, does the respondent orientation move beyond the basics of ‘read and rate.
Step 5: Launch the Study
Once the study is created, a process requiring about 30-40 minutes, the final task is to launch the study. In the interests of efficiency, the BimiLeap program provides the researchers with four builds in options, as shown in Figure 4 (Bottom Row, Right Panel). The standard approach is to use a built-in link to the panel provider (Luc.id), for easy-to-find respondents of specific gender, age, income, education, country, etc. This standard approach is made easy. All the research need do it select the top bar in the screen shot. The researcher ends up paying about $4.00/respondent for respondents in most geographies. Below are other options, such as a custom sample of respondents, a third-party provider of respondents (e.g., not Luc.id, Inc.), and finally the ability to source one’s own respondents at the fee of $2.00/respondent processed. In all cases but the first, with BimiLeap providing the respondent, it is the researcher who must assume the responsibility of finding respondents. For this study, the request was for n=100 respondents, males and females, ages 18-54.
The Mind Genomics process works best with respondents who are part of a panel. The panel comprises many hundreds of thousands, perhaps millions of individuals, whose qualifications are known, and who have agreed to participate in these types of studies. The field service (Luc.id Inc., for this study) sends out invitations to respondents who fit the criteria requested by the researcher. The entire mechanism is automated. In the interests of cost and efficiency, it is almost always better to work with standard respondents provided by BimiLeap. The time between launch and completion of Mind Genomics sessions, one per respondent, is generally 50-60 minutes for the respondents specified here.
In the end, Steps 1-5 required about a little less than two hours from start of the study with ‘no knowledge’. The results are returned by email, the detailed analysis along with summarization through AI contained in an Excel report.
Step 6: The Respondent Experience
The respondents receive an email invitation. Those who click on the embedded invitation link are led to the study. The first screens introduce the topic, obtain information about the respondent. The standard information is gender and age. The third self-profiling question was the respondent’s experience-with/opinion-of PayPal.
The actual experience comprises a set of 27 screens.
- Welcome.
- Self-profiling classification (gender, age, attitude/experience regarding PayPal. The self-profiling classification has room for a total of 10 questions, each question with 10 possible answers.
- Introduction to the issue.
- Presentation of 24 screens, each screen comprising 2-4 rows of elements, and the rating scale below.
The noteworthy thing to keep in mind about the experience is that each respondent evaluates a set of vignettes which comprise seemingly unconnected elements, as Figure 2 shows. To many respondents and to virtually all professionals who inspect the 24 vignettes, the array of 2-4 elements in vignette after vignette speaks of a ‘blooming, buzzing confusion’ in the words of the revered Harvard psychologist, William James, writing at the end of the 19th century. Nothing, however, could be further from the truth. The 24 vignettes are set up in an specific array, called an experimental design,, with the property that the 16 elements are presented an equal number of times, that they are statistically independent of each other, that the data emerging from any single set of 24 vignettes from one respondent can be analyzed by OLS (ordinary least squares) regression, and finally the coefficients have ratio scale properties. The design is called a permuted design.
Figure 5 shows the content of the three vignettes recorded after the evaluation, and just before deconstruction in to the record-by-record database used in the statistical analysis. The figure shows the respondent number, the order of the vignettes, the text of the vignette as presented to the respondent, followed by the rating scale and the response time. The rating scale is taken from Figure 4 (bottom left panel).
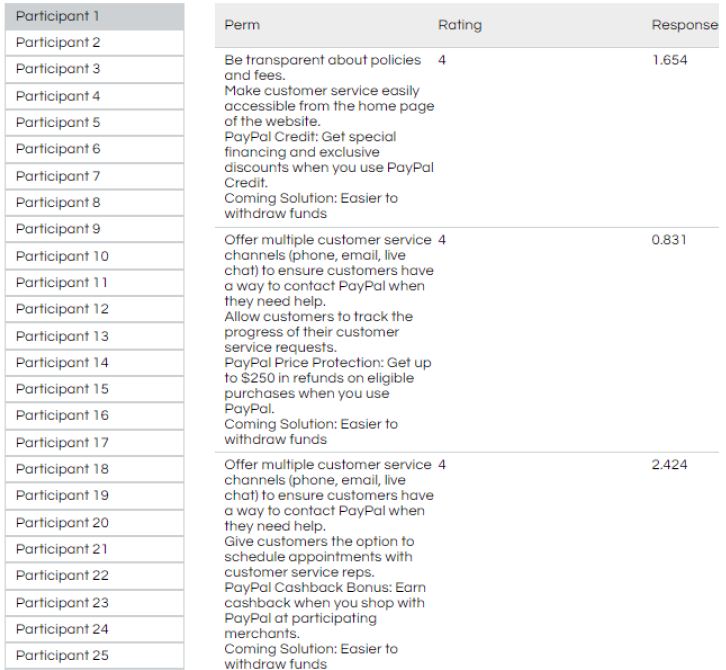
Figure 5: Content of three vignettes, as recorded by the BimiLeap program, showing the respondent (participant), the text of the vignette, the rating, and the response time in thousands of a second.
The respondents are oriented with what ends up being very little information, but after the first evaluation the respondent find the evaluation easy to do. Figure 6 shows the average response time by each position of the 24 positions. By the time the third or really fourth vignette is evaluated, the respondent feels comfortable with the process, and settles down to a about 2-2.5 seconds per vignette. One of the unexpected implications of these results is that the initial set of responses may be unstable, at least in terms of the externally measured variable of response time. It may be that the decreasing response time is due to the time taken to develop an automatic point of view, one which may not change during the last 20 or so vignettes. If this is the case, then we might not want to look at the data from the first part of the study simply because the processing of the information has not reached ‘steady’ state.’ The implications call for a rethink of just how to measure attitudes when the ratings for the first few questions are labile as a point of view emerges and solidifies, unbeknownst to the respondent and to the researcher alike. This is an interesting finding, and reinforces the good research practice of randomizing the different test stimuli.
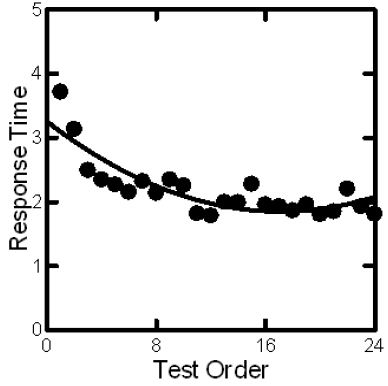
Figure 6: How average response time to the vignettes varies with test order
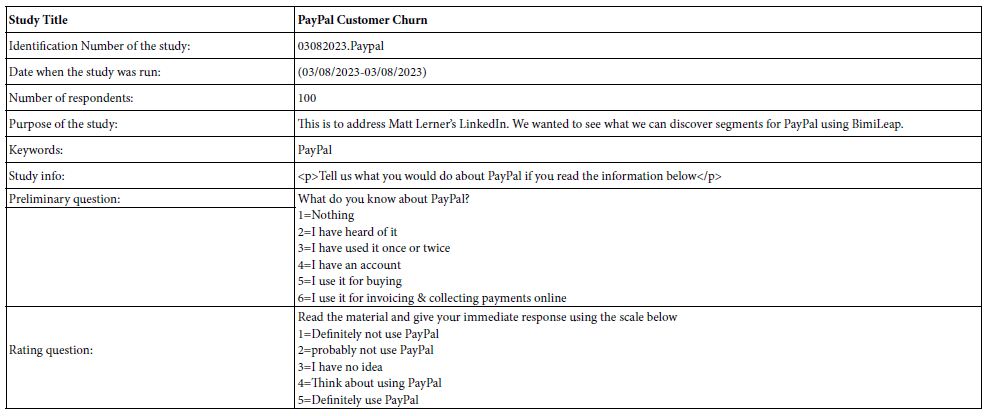
Table 2 presents the final information recorded for the study, including name, number of respondents, etc. This table is presented for archival purposes in every report of the study returned to the researcher.
Table 2: Final specifics of the study, based upon the input for the researcher
Step 7: Create the Database in Preparation for Statistical Analysis
All of the set up and research steps become preparations for a database that can be accessed by statistical analysis. The database is ‘flat,’ with all of the relevant information in one file. Thus, beyond the automatic analysis of the data to be done by the BimiLeap program, the raw data are available for further custom analysis by the researcher.
The database comprises one record or row for each vignette. Thus, 100 respondents, each of whom evaluate 24 different vignettes, generate a database of 100 x 24 or 2400 rows. The entries in the database are usually numbers ready for immediately statistical analyses, or easily converted to new variables for additional analysis.
First set of columns – correspond to the study name and the information about the respondent, including a respondent identification number unique for the Mind Genomics system, as well as a sequence number for the particular study. The data in this first set of columns correspond to information which remains the same across all 24 vignettes.
Second set of numbers – change according to the vignette. The first number is the order number, from 01 (first vignette in the set of 24) to 24 (the 24th vignette in the 24). The ‘actual first vignette’ is used as training, data not recorded. The actual first vignette is repeated to become the 24th of 24 vignettes whose data are recorded. The next set of 16 elements, 2nd to 17th, correspond to the 16 elements. For a specific row or vignette, the elements which appear in that vignette are coded ‘1’, the elements absent from that vignette are coded ‘0.
Third set of numbers – vary according to the 5-point rating assigned by the respondent, and then the response time in thousandths of a second elapsing between the time that the vignette appeared on the screen and the time that the respondent assigned a rating using the 5-point scale.
The fourth set of numbers is created by the program or by the researcher working with the raw data. This fourth set of numbers is called the binary transformed data. The objective of the binary transformation is to move from a scale to a yes/no measurement. The reason for doing so is pragmatic, based on the history of consumer research and public opinion polling. Those who use the scales, such as managers in companies find it difficult to understand how to interpret the average value of a scale, such as our 5-point scale. For example, just what does a 4.2 mean on the scale? Or a 2.1? And so forth. The question is not whether two scale values ‘differ’ from each other in a statistical sense, but rather just what does this mean tell the manager? Is it a good score? A bad score? How does on interpret the scale value, the average rating, and communicate its real meaning to others?
The consumer researcher and public opinion pollsters have realized that the ordinary person can easily deal with concepts such as ‘a lot of people were positive’ or the message convinced some of the people to change their attitude from mildly positive to deeply negative. To simplify the interpretation, these researchers and pollsters have transformed the 5-point scale (or other scales like in) into discrete scale, such as ‘positive to an idea’ versus ‘negative to an idea’. The typical transformation on a 5-point scale (5 = agree, 1 = disagree) is that the ratings of 4 and 5 are ‘agree with / positive to an idea, whereas the ratings of 1.2, and 3 agree ‘not agree with / positive to an idea’. Following this train of thought, the binary transformation would be ratings of 5 and 4 are transformed to 100, whereas ratings of 3,2 and 1 are transformed to 0 This transformation produces 100’s and 0’s. The transformation is called, not surprisingly, ‘TOP2’. In other studies, there might be several transformations, such as BOT2 (Ratings 1,2 → 100, Ratings 3,4,5 → 0). A vanishingly small random number (<10-5) is added to each transformed number, to ensure that the binary transformed variables exhibit some variation, a variation that will be necessary for analysis by OLS (ordinary least-squares) regression.
Step 8: Relate the Presence/Absence of Elements to the Binary Transformed Variable, TOP2
The underlying objective of Mind Genomics is to relate subjective feelings (responses) to the underlying messages. The entire thinking, preparation and field execution is devoted to the proper empirical steps needed to discover how the different ideas embodied in the elements drive the response.
The TOP2 variable is the positive response to PayPal selected after reading the vignette (Definitely/Probably use PayPal). How does each of our 16 elements ‘drive’ that feeling. And, what it the pattern across the different genders, ages and PayPal-related attitudes and self-described behaviors?
The analysis uses OLS (ordinary least-squares) regression analysis, colloquially known as curve fitting, although the model here is strictly linear, with no curvature [10]. We express the dependent variable, Binary Transformed Variable, TOP2 as a weight sum of the elements, or more correctly, the weights of ‘positive feeling’ (ratings 4 and 5) contributed by each of the 16 elements. Each element is going to contribute to the positive feeling when that element is present in the vignette, or perhaps take away from the positive feeling.. The real question is ‘how much weight or how big is the contribution’.
OLS uses the regression model to create the simple equation: TOP2 = k0 + k1(A1) + k2(A2)…k16(D4).
We interpret the model as follows:
Additive constant (k0) is the estimated percent of ratings of 5 and 4 (TOP2) in the absence of elements. Of course, the experimental design ensures that each respondent will evaluate vignettes with a minimum of two elements and a maximum of four elements. There is never a vignette actually experienced with no elements. Yet, the OLS regression estimates that value. The additive constant ends up being a ‘baseline’ value, the underlying likelihood of a TOP2 rating. The additive constant is high when most of the vignettes are rated 4 or 5, not 1 or 2 or 3. The additive constant is low when most of the vignettes are rated 1 or 2 or 3.
The coefficients k1-k16 show us the estimated percent of positive ratings (TOP2) when the element is incorporated into the vignette. Statisticians use inferential statistics to study the statistical significance of the coefficients. Typical standard errors of the coefficients are around 4-5 for base sizes of 100 respondents.
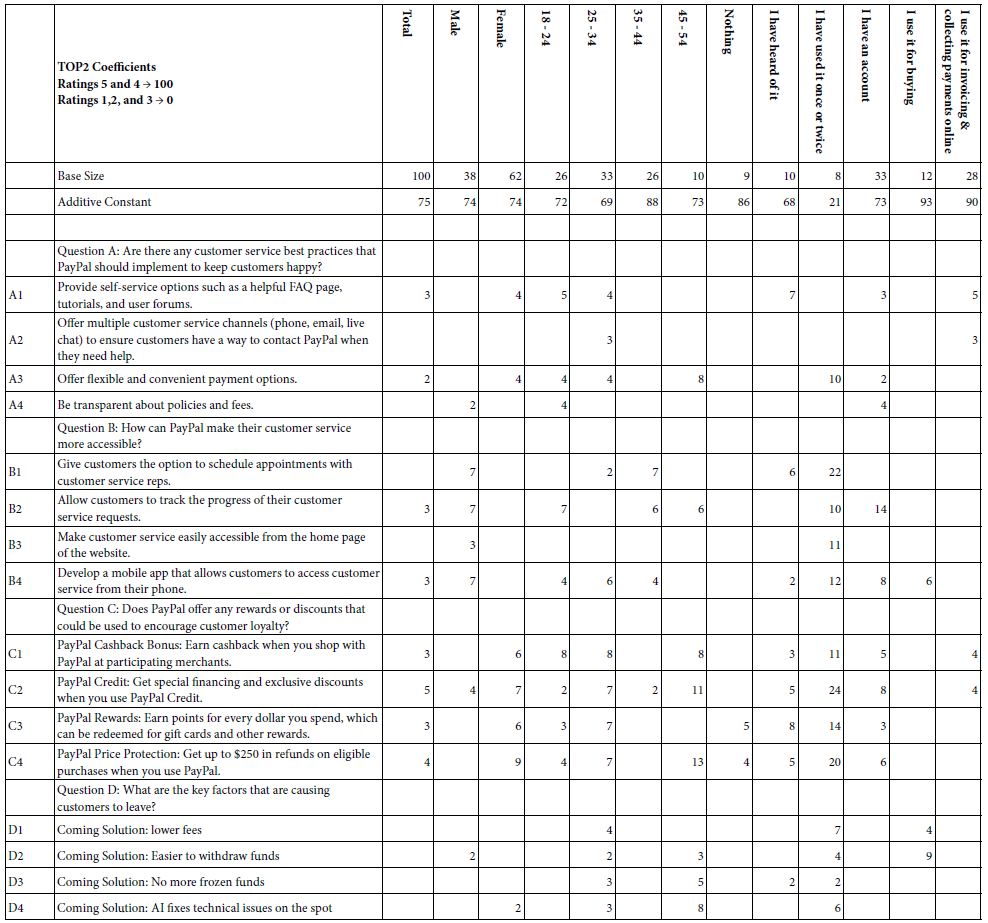
Mind Genomics returns with a great deal of data, almost a wall of numbers, such as that shown in Table 3. To allow the patterns to emerge we blank out all coefficients of +1 or lower and highlight through shading coefficients of +7 or higher.
Table 3 shows us high additive constants for all respondents except those who define themselves as having used PayPal once or twice. The 8 respondents generate an additive constant of 21, quite different from the high additive constants for the regular users.
Table 3 further shows a great number of positive coefficients, as well as very strong performing elements. Our goal here is not to describe the underlying rationales of what might be occurring, but rather in the spirit of an applied effort with limit budget and short time frames identify ‘what to do.’ The science exists and can be developed at one’s leisure.
Table 3: Parameters of the models for Total Panel and for panelist who identify themselves by gender, age, and experience/attitude regard PayPal.
Step 9: Create Individual Level Models and Use Clustering to Discover Mind-sets
A hallmark analysis of Mind Genomics is to cluster the respondents on the basis of the pattern of their 16 element coefficients, in order to discover new to the world mind-sets, viz., patterns of reactions to the different elements. Underlying this strategy of clustering is the worldview of Mind-Genomics that it is the pattern of responses to the activities of the everyday which teach us a great deal.
A word of explanation is in order here. Researchers accept the fact that people differ from each other, and that the nature of these differences is important to understand, for either basic science of human behavior., or for applications. The conventional methods of dividing people fall into at least three different classes, namely WHO the person is, what the person THINKS/BELIEVES, and finally what the person DOES, viz., how the person behaves. These divisions are not considered to be hard and fast, but rather simple heuristics to divide people into meaningful groups. The studies leading to these groups in, these clusters, are generally large, expensive, and work at the higher level of abstraction. That is, the focus is on how people think in general about a topic. The topic of these ways of understanding people has been written about many times, in popular books, but also in scientific tomes [11-13].
A key problem of conventional division of people into the large groups is how to apply this group information to the world of the specific, granular, every day. Faced with a real-world problem, such as our PayPal issues, can we use these large-scale studies to illuminate the issue with what to do with PayPal. In other words, what are these issues when the topic is the whole world, but rather the quotidian, daily efforts of people in the world of ‘PayPal.
The Mind Genomics approach to the problem of individual differences is to work at the level of the granular, finding groups of respondents who show different patterns of responses to the same test stimuli, with these patterns of responses being both parsimonious (the fewer the better) and interpretable (the patterns must make sense). Generally, as the researcher extracts more groups of smaller size from the population the groups are increasingly interpretable, but at the same time the effort ends up with many groups, often too many to use in any application.
The approach used by Mind Genomics ends up being very simple, but often such simplicity generates powerful, actionable results. The researcher follows these steps:
- Generate a model, viz., equation, for each individual respondent, following the same form as the equation for the total panel and each subgroup. It will be straightforward to create this model for each respondent because the vignettes, test combinations evaluated by the respondent, were created to follow an experimental deign at the level of the individual respondent. Furthermore, even when the respondent rates every one of the 24 vignettes similarly (e.g.,, ll rated 5 or 4, transformed to 100 for TOP2), the vanishingly small random number added to eh transformed value of TOP2 ends up ensuring sufficient variation I the dependent variable, in turn preventing the regression program from crashing.
- The regression generates 100 models or equation one for each respondent, with 17 parameters (additive constant, 16 coefficients)
- Using only the 16 coefficients, compute a correlate coefficient between each pair of respondents. The correlation coefficient measures how ‘linearly related’ are two individuals, based upon the measures of the 16 correlations. This is called the Pearson R, which varies from a high of +1 when the 16 pairs of coefficients line up perfectly, to a low of -1 when the 16 pairs of coefficients are perfectly but inversely related to each other.
- Create a measure of ‘dissimilarity’ or ‘distance’, defined here as (1-Pearson R). The quantity (1-Pearson R) is one of many distance measures that could be used. (1-Pearson R) varies from of a low of 0 when two set of 16 coefficients correlate perfectly (1-R) becomes 0 because for perfect linear correlation R =1. In contrast, when two sets of 16 coefficients move in precise opposite direction (1-R) becomes 2 because R= -1
- The k-means regression program [14] attempts to classify the respondent, first into two groups (clusters, mind-sets,) and then into three groups, using strictly mathematical criteria. The solution is approximately. The program does not use the meanings of the elements as an aid.
- It remains the job of the researcher to choose the number of clusters and then to name the clusters. In keep with the orientation of Mind Genomics, namely, to find out how people think, the clusters emerging from the k-means clustering exercise are named Mind-Sets.
- Once each respondent has been assigned by the clustering program to only one of two emergent mind-sets, or one of three emergent mind-sets, the researcher ca easily rerun the regression models, two times for the two mind-sets (once per mind-set) or three times for the three mind-sets, respectively.
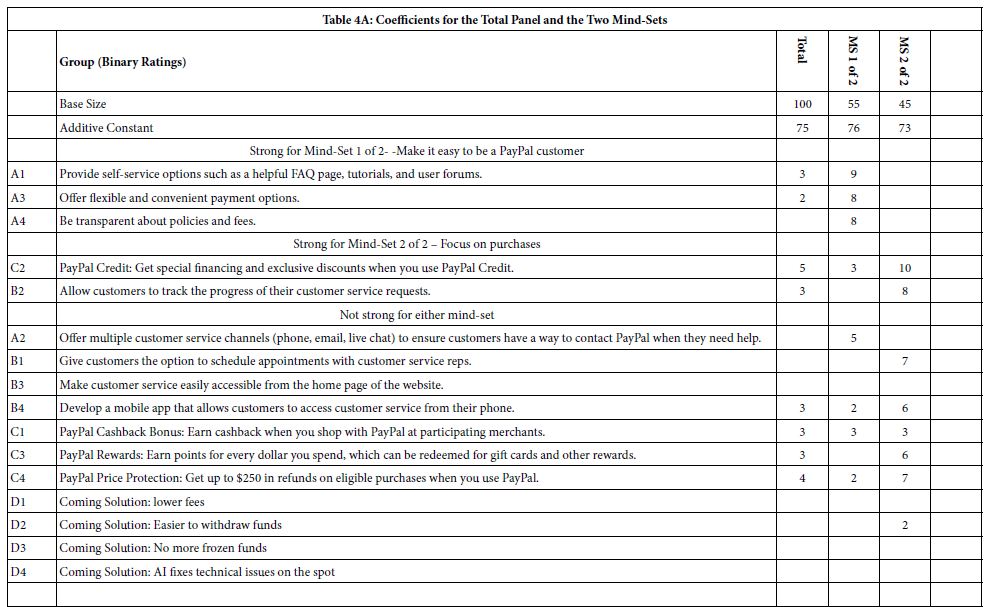
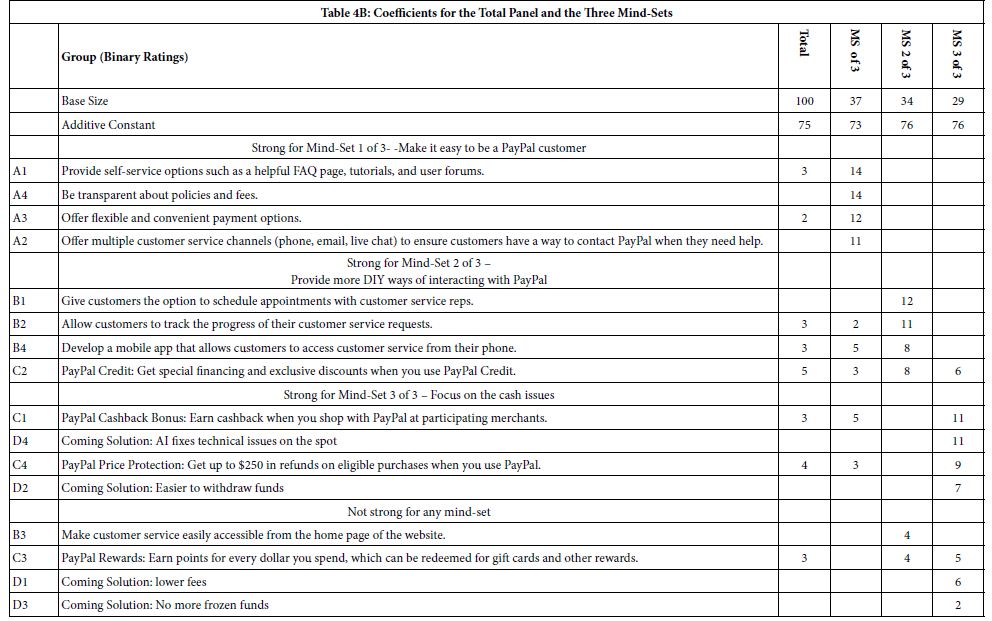
- Table 4 shows the data array in the form to which we have become accustomed. The rows are the elements, the columns are the respondents. The top of Table 4 (Table 4A) shows the results from the two mind-set-clustering. The bottom of Table 4 (Table 4B) shows the results from the three mind-set-clustering. As before, only positive coefficients are show. Negative coefficients and coefficients of 0 and 1 are also omitted. The stronger coefficients of 7 or higher are shown in shaded cells.
- Howard TW (2015) Are personas really usable? Communication Design Quarterly Review 3: 20: 6.
- Christensen, Clayton M, Taddy Hall, Karen Dillon, David S. Duncan. (2016) Know your customers’ jobs to be done. Harvard Business Review 94: 54-62.
- Lubashevsky I (2019) Psychophysical laws as reflection of mental space properties. Physics of Life Reviews 31: 276: 303.
- Moskowitz HR, Gofman A (2007) Selling Blue Elephants: How to Make Great Products that People Want Before They Even Know They Want Them.
- Gofman A, Moskowitz H (2010) Isomorphic permuted experimental designs and their application in conjoint analysis. Journal of Sensory Studies 25: 27-145.
- Gofman A, Moskowitz HR, Mets T (2010) Accelerating structured consumer‐driven package design. Journal of Consumer Marketing27: 157-168.
- Suchman E (1962) An analysis of” bias” in survey research.” Public Opinion Quarterly 26: 102-111.
- Deming WE (1944) On errors in surveys. American Sociological Review 9: 359-369.
- James W (1892) H. Holt.
- Watson GS (1967) Linear least squares regression. The Annals of Mathematical Statistics 38: 1679-1699.
- Kahle LR (1986) The nine nations of North America and the value basis of geographic segmentation. Journal of Marketing 50: 37-47.
- Wells WD (1975) Psychographics: A critical review. Journal of Marketing Research 12: 196-213.
- Wells WD (ed) (2011) Life Style and Psychographics, Chapter 13: Life Style and Psychographics: Definitions, Uses, and Problems. Marketing Classics Press.
- Likas A, Vlassis N, Verbeek JJ (2003) The global k-means clustering algorithm. Pattern Recognition 36: 451-461.
- OpenAI (2023) Introducing ChatGPT, accessed March 25, 2023.
- Chintalapati S, Pandey SK (2022) Artificial intelligence in marketing: A systematic literature review. International Journal of Market Research 64: 38-68.
- De Bruyn A, Viswanathan V, Beh YS, Brock JKU, Von Wangenheim F (2020) Artificial intelligence and marketing: Pitfalls and opportunities. Journal of Interactive Marketing 51: 91-105.
- Feng CM, Park A, Pitt L, Kietzmann J, Northey G (2021) Artificial intelligence in marketing: A bibliographic perspective. Australasian Marketing Journal 29: 252-263.
- Huang MH, Rust RT (2021) A strategic framework for artificial intelligence in marketing. Journal of the Academy of Marketing Science 49: 30-50.
- Gkikas DC, Theodoridis PK (2019) (Artificial intelligence (AI) impact on digital marketing research. In Strategic Innovative Marketing and Tourism: 7th ICSIMAT, Athenian Riviera, Greece. 1251-1259.
- Wirth N (2018) “Hello marketing, what can artificial intelligence help you with?.” International Journal of Market Research 60: 435-438.
- Bowers DK (1998) The new research Tool. Marketing Research,10: 34-38
- Mendoza C, Mendoza C, Rappaport S, Deitel Y, Moskowitz HR (2023), Empowering young researchers: Cognitive economics and the features associated with minimum wage. Ageing Science Mental Health Studies 7: 1-9.
- Pitt C, Eriksson T, Cabirian A, Vella J (2018) “Elementary, my dear Watson: the use of artificial intelligence in marketing research: an abstract.” In Boundary Blurred: A Seamless Customer Experience in Virtual and Real Spaces: Proceedings of the 2018 Academy of Marketing Science (AMS) Annual Conference 46, 325-325. Springer International Publishing.
Table 4 shows the elements with positive coefficients and the strong performing elements. The names of the mind-sets are used as a mnemonic. The reality is that the respondents are identified by mind-sets for convenience only. It is the content of the message which is important/.
Table 4: Parameters of the models for Total Panel and for panelist who identify themselves by gender, age, and experience/attitude regard PayPal.
Step 10: How Well Did We Do, the Index of Divergent Thought (IDT)
A continuing issue in research is the need to measure how ‘good’ the ideas are. Just because the researcher can quantify the ideas using experimental design and regression, the results can be useless. In consumer research one often hears about the quality of ‘insights’, and that it takes a seasoned professional to know what to do. The effort in consumer research and its sister disciplines such as sensory analysis is to follow a set of procedures, doing so meticulously. Yet, to reiterate, just how good are the results?
S.S. Stevens, the aforementioned Professor of Psychophysics at Harvard University from the 1940’s to the early 1970’s, would often proclaim the truism that ‘validity is a matter of opinion.’ Stevens was actually ‘on to something.’ How does one know the validity of the data, the quality of insights.
The notion of IDT, the Index of Divergent Thought, was created with the notion that ‘divergent’ is a qualitative number. Divergent means attractive to different groups, rather than divergent from 0. Low IDT values mean that the ideas are simply weak for people who think differently (viz., the mind-sets) High IDT values mean that the ideas are strong among people who think differently. The term ‘divergent’ refers to the nature of the ideas, the different that ideas can take.
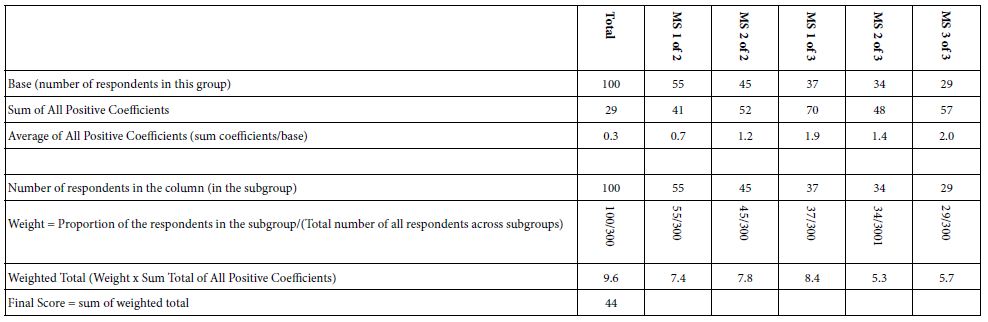
To answer this question, we present one bookkeeping approach shown in Table 5. The idea is to calculate the weighted sum of positive coefficients (1 or higher), based upon the results from the six clearly defined groups: Total, MS1 of 1, MS2 of 2, MS1 of 3, MS2 of 3, and MS3 of 3, respectively. Each group generates a sum of positive coefficients, emerging from the study. Each group has a defined base size from the study. The data in Table 4 suffice to create a weight sum of positive coefficients. The value of the IDT is 44. The IDT is only an indexed value. Other studies have shown IDT values both above and below. High IDT value corresponds to studies with high or even very high coefficients among a relatively sizeable subgroup in the study. These high coefficients belong to elements that respondents believe to be important, elements which should draw attention.
Table 5: The Index of Divergent Thought (IDT)
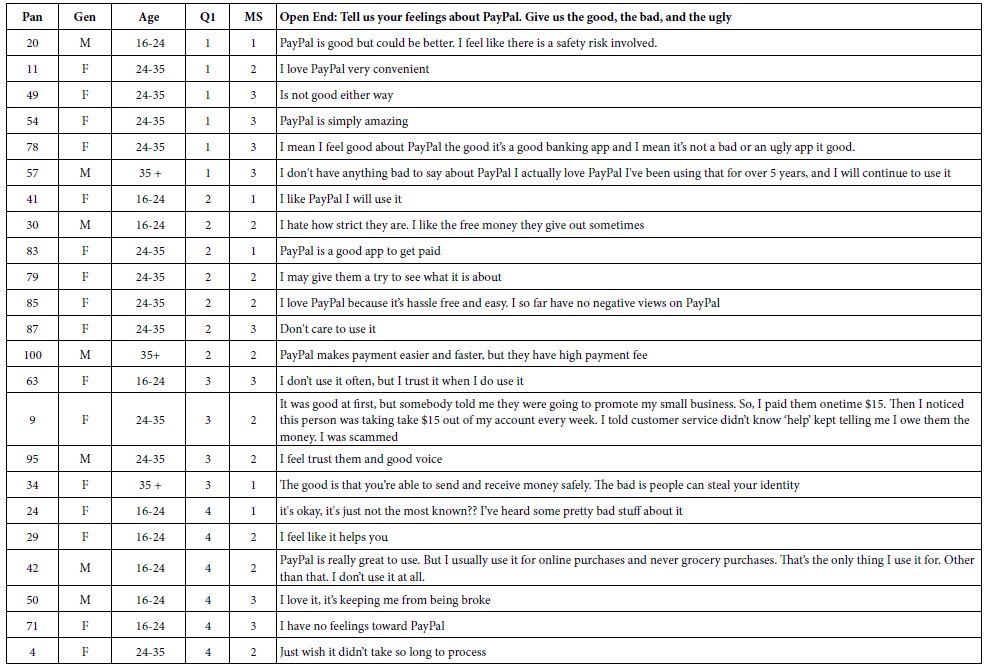
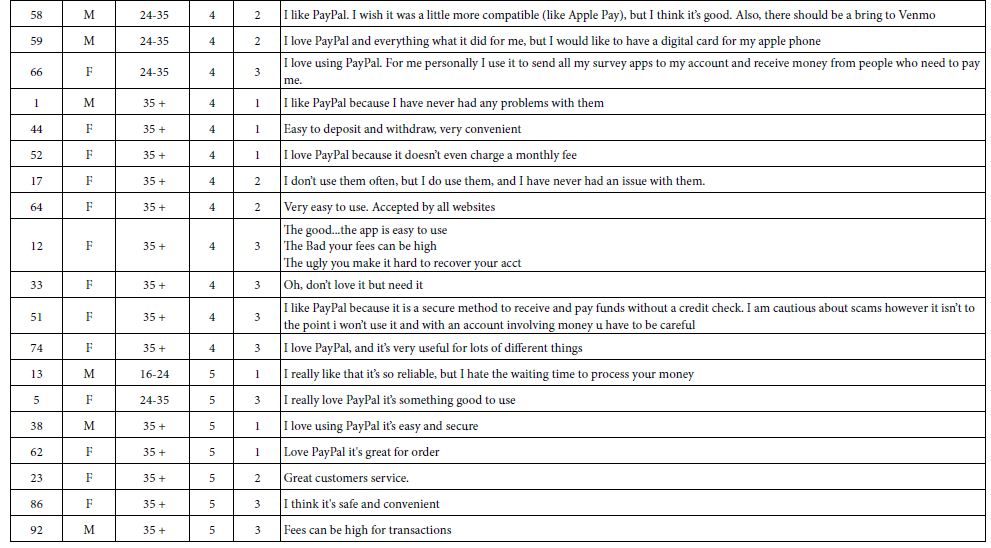
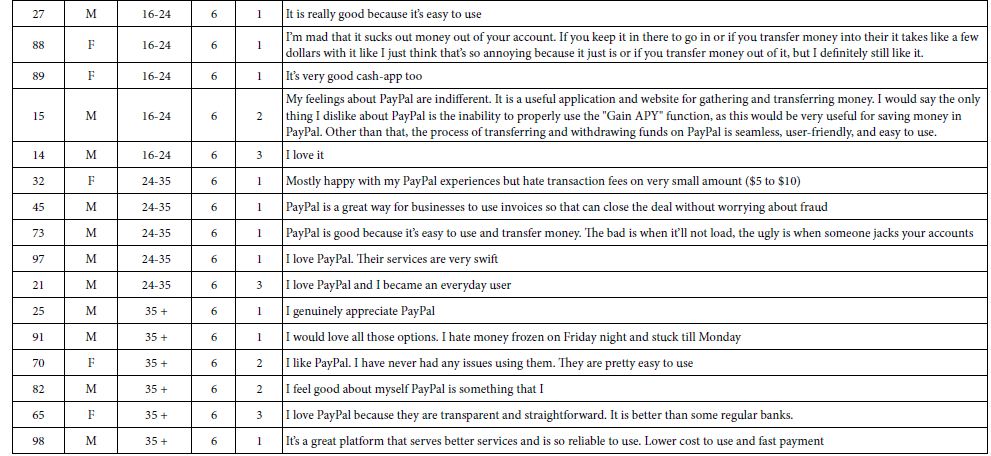
Step 11: Responses to the Open-ended Question
Our final empirical section involves the open ends. Respondents were instructed to write about their feelings towards PayPal. Step 11 provides an edited version of the open ends, for those respondents who wrote a ‘reasonable’ answer. The open end response is accompanied by the respondent number, gender, age, Q1 (attitude about PayPal), and membership in one of the three mind-sets. Table 6 presents the open-ended responses. The open-ended questions are presented here as background to the analysis of open-ended questions by artificial intelligence, later on in Step xxxx.
Table 6: Responses to the open-ended question
Bringing Generative AI into the World of Mind Genomics and Insights
During the past year or two the idea of artificial intelligence as a critical aspect of intelligence gathering and insights development t seems to be at the tips of everyone’s tongue. From an esoteric approach wonderful to throw around at cocktail parties and business meetings to create an ‘image’, AI has burst on the scene to become a major player. Unlike some of the other hype technologies, ranging from Big Data to neuromarketing, AI seems to be able to deliver beyond its hype.
As part of the evolution of Mind Genomics as a science and BimiLeap as a program, we have instituted artificial intelligence in the Idea Coach to provide ideas, questions, and answer. The approach works well, or at least seems to do when the task is to generate disparate questions and disparate answers to reasonably well formulated inputs, such as a specific description of a problem to generate questions, or a specific question to generate answer.
The next step in the use of AI in Mind Genomics may be the interpretation of the winning element of defined subgroups. The elements tell what ideas rise to the topic, but don’t tell us a pattern. Can AI discern patterns, and report them without human guidance?
The four final tables are more of a demonstration of the AI enhancements to Mind Genomics and placed in the appendix to this paper. It’s important to note that the BimiLeap software used by Mind Genomics instructs the AI using a defined set of pre-programmed templated prompts to learn about the mind-set segments, Total panel, subgroups, and questions and answers themselves generated by Idea Coach.. The prompts command the AI to write summaries that tell a story and aim for completeness in thinking. For example, the prompts ask for “what’s missing,” alternative points of view, and groups or audiences that might hold opposing views. In other words, the summarizer equips researchers not just with data interpretation but adds different perspectives and counterarguments that may be helpful in assessing their results, anticipating disagreements, or suggesting further research.
Appendix 1 shows us the use of AI to understand the winning elements of each mind-set.
Appendix 2 shows the use of AI to understand the open-end questions.
Appendix 3 shows the use of AI to digest and summarize the output of Idea Coach during the creation of the 30 questions. Each separate query to generate 30 question using Idea Coach will produce its own page, to digest and to summarize that particular set of 30 questions generated by Idea Coach.
Appendix 4 shows the use of AI to digest and summarize the 15 answers produced by Idea Coach for a single question.
Appendices 3 and 4 show summaries by artificial intelligence of somewhat disconnected ideas, specifically ideas produced by a previous query to the artificial intelligence engine represent by Idea Coach.
Discussion and Conclusions
A Google Scholar® search of the combined terms ‘marketing research’ and ‘artificial intelligence’ generates 982,000 ‘hits’, most hits appearing during the past few years as the interest in artificial intelligence has exploded, and the potential applications have expanded due to the widespread availability of AI tools, such as Chat GPT4. A deeper look at these references shows that the term ‘marketing research’ really devolves down to marketing, not research. Indeed, it is hard to find good reference about the use of AI in marketing research as we know marketing research to be. A parallel can be drawn with the introduction of the ‘web’ into the world of the computer, and the interest, but not really ‘new’ applications for the capabilities of ‘on-line research’. There were issues about the ‘quality’ of data that would be obtained in this new and more rapid fashion, and many issues emerging about validating the interviews, but sadly, few truly new vistas emerging in market research. In both the emergence of the internet and the growth of artificial intelligence marketing research has focused primarily on data acquisition, rather than on vistas of a truly new nature [15-22].
It is on the vision of ‘new’ to the world of marketing research, the world ‘new’ reserved for a new vision of what could be, not just simply a possibly threat of technology to the ‘best practices’ endorsed by the thought leads and the status quo. The focus of this paper has been on the use of a templated system to enhance insights and solutions about a problem, the specific problem here being the self-declared lack of information about solutions to a marketing problem. As the paper unfolds, however, it becomes increasingly clear that the paper moves away from the traditional approaches, best-practice, and wisdom of the consumer research and other insight-based communities, such as sensory evaluation in the world of food, cosmetics, and other consumer products. Rather, the paper moves towards a systemized approach which requires absolutely no knowledge about a topic, an approach easy to use even by school children as young as eight years old [23,24]. The focus is on a process which requires literally no expertise to master, a process which starts with questions and exports actionable answers. In other words, the vision of democratizing research, and liberating it from the bonds of best practices.
References