Introduction
The geodynamic evolution of central Chile-Argentina is mainly controlled by the subduction of the oceanic Nazca plate beneath the continental South American lithosphere (Figure 1a). In particular, between 29°S and 34°S, the Nazca plate exhibits a flat-slab subduction (Figure 1b) around 100 km of depth, that extends eastward for hundreds of km before returning to a downward descent (Cahill and Isacks 1992). This condition causes an interruption in the Andean volcanic arc and an intense crustal deformation that continues toward the craton, beyond the foreland thrust belt. The outcome is a very active crustal seismicity and complicated structural framework. Despite the recent advances achieved through geological, seismological and geodetic studies (e.g. Siame et al. 2006; Anderson et al. 2007 and references therein), several aspects related to the geometry, type and contributions of each fault and its seismogenic rule, as well as of the slab geometry, have still not been satisfactorily explored. In order to study the seismotectonic characteristics of this flat-slab region, we analyzed data recorded by a local network, performing a simultaneous inversion of both the velocity structure and the hypocentre parameters. The availability of accurate hypocentre locations and finely tuned velocity structure allows us to improve the earthquake source characterization and the knowledge on the ongoing seismotectonics of the region (Figure 1).
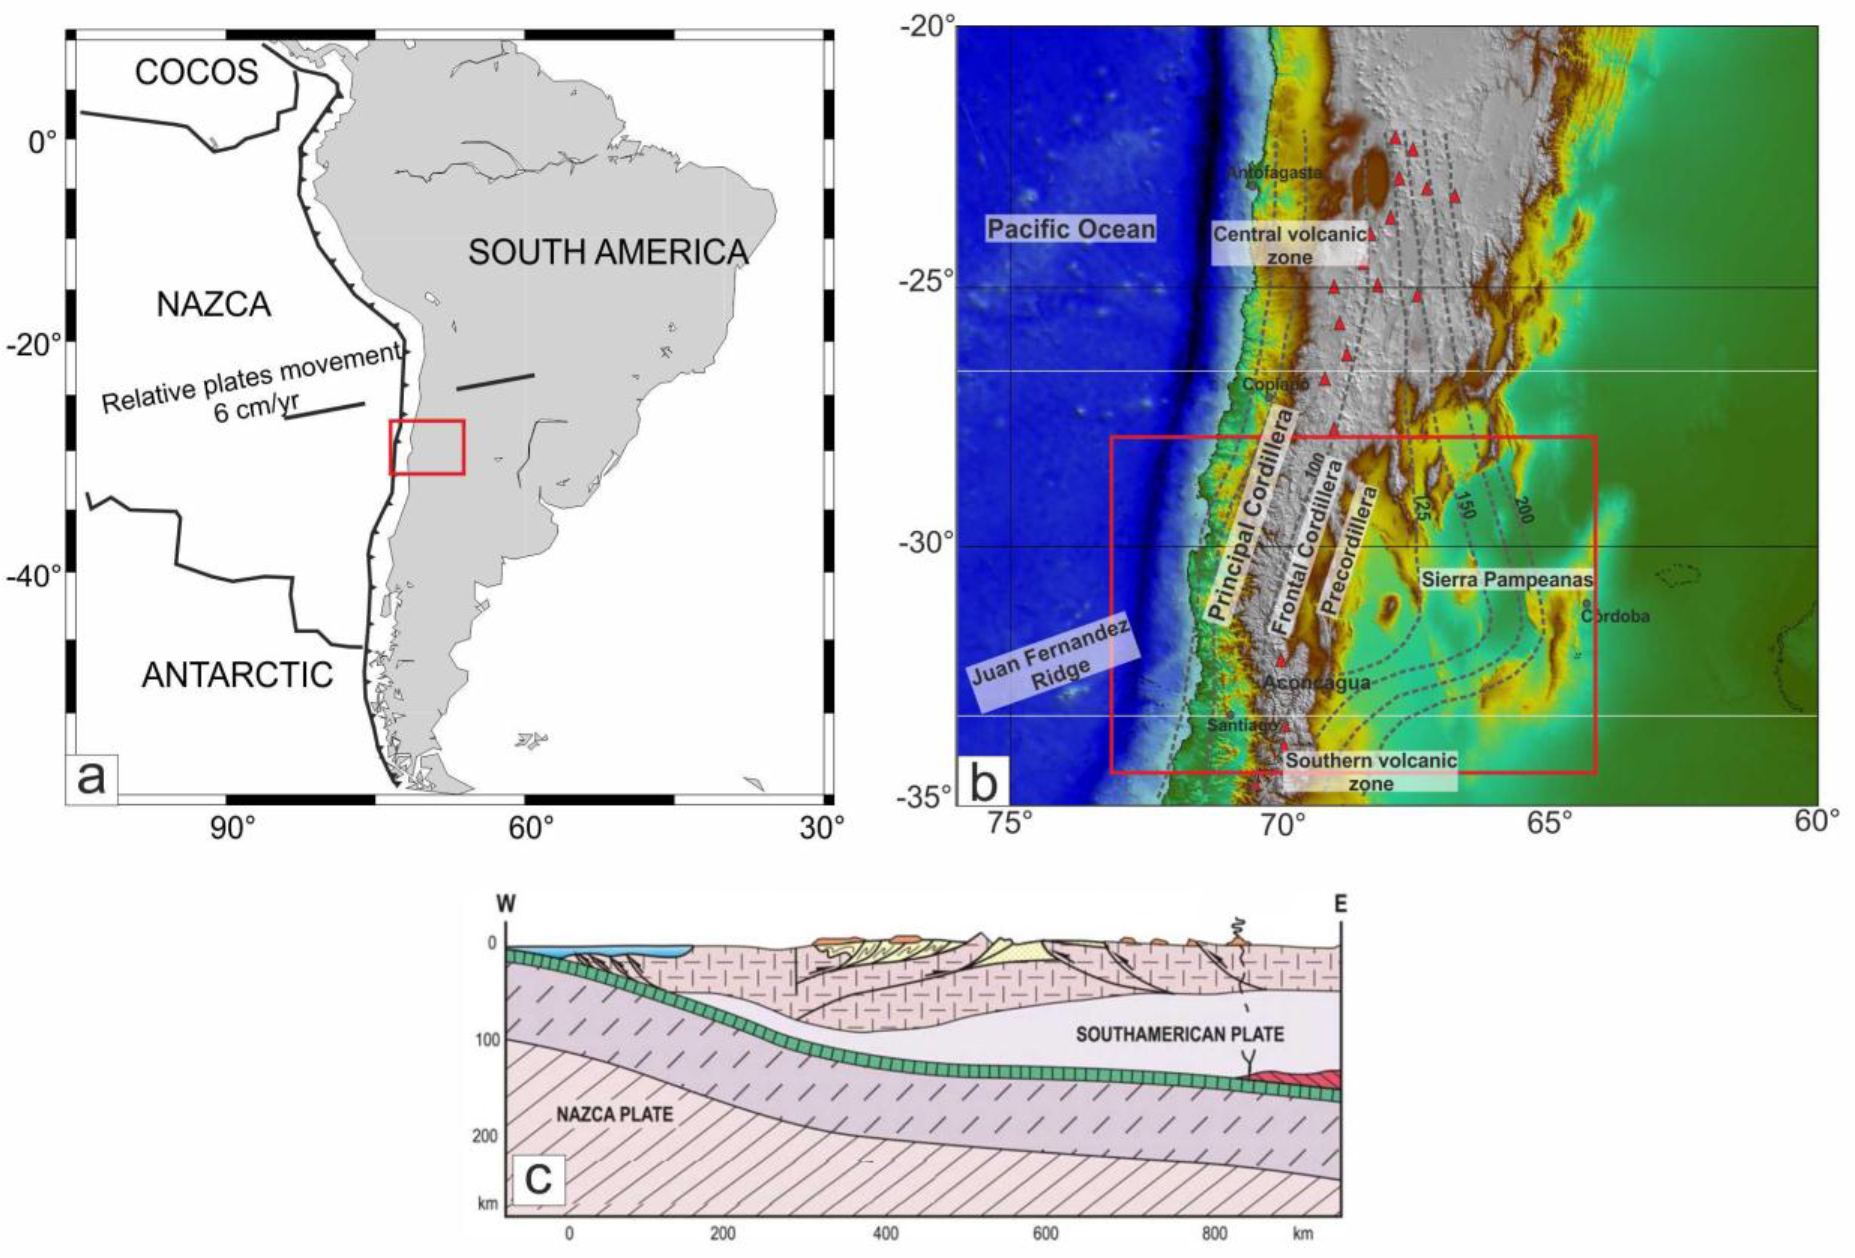
Figure 1. (a) Map of the global South American tectonics and (b) Nazca plate iso-depth contours after Ramos et al., 2002 (dashed lines). Red triangles represent active volcanic edifice; red rectangle marks the studied area. (c) Schematic tectonic cross-section showing the eastward migration of the main volcanic centres during the shallowing of the oceanic slab (after Ramos and Folguera 2009).
Tectonic Settings
The studied region, between 29° and 34° S, corresponds to a complex surface setting made up of the Principal Cordillera and Frontal Cordillera, which form the main part of the Andes, and, eastward, of the Precordillera, which is a thin-skinned thrust and fold belt, and Sierras Pampeanas, considered as crystalline basement uplifts (Figure 1b). The basement blocks of these geological provinces uplifted during the shallowing of the slab since 25 Ma, while the flat-subduction produced a progressive eastward migration of the orogenic front and volcanic arc. The gap in the volcanic arc, spatially correlated with the sub-horizontal subduction zone, has led some authors to infer that the flat subduction changes the thermal structure of the margin, displacing the hot asthenospheric wedge away from the trench and producing a progressive eastward migration of the orogenic front and the volcanic arc (see e.g. Gutscher, 2002). Earthquakes are distributed in two separate depth ranges: i) events with hypocentral depths of about 100 km are related to the Wadati-Benioff zone of the subducting slab; ii) earthquakes with hypocentral depth ranging down to about 40 km correspond to the crustal seismicity (Cahill & Isacks 1992).
Data
We analyzed seismicity recorded by the local network operated by 23 short period, vertical component, seismic stations, from the ‘‘Red Sismologica Zonal Nuevo Cuyo’’ belonging to ‘‘Red Nacional de Estaciones Sismologicas’’ of the INPRES (Instituto Nacional de Prevención Sísmica, Argentina). The initial data-set consists of more than 450 earthquakes with a magnitude between 3.4 and 4.8, occurring in the period 1995–1999. Because large uncertainties in the hypocentre locations can introduce instabilities in the inversion process, before including the earthquakes in the joint inversion, we filtered our database to match minimum requirements with respect to location quality criteria (i.e. GAP<240°, a minimum number of 8 P-phase recordings and travel time residuals < 0.5 s). The resulting data-set consists of about 290 earthquakes with 2965 P- and 2513 S-wave readings (Figure 2).
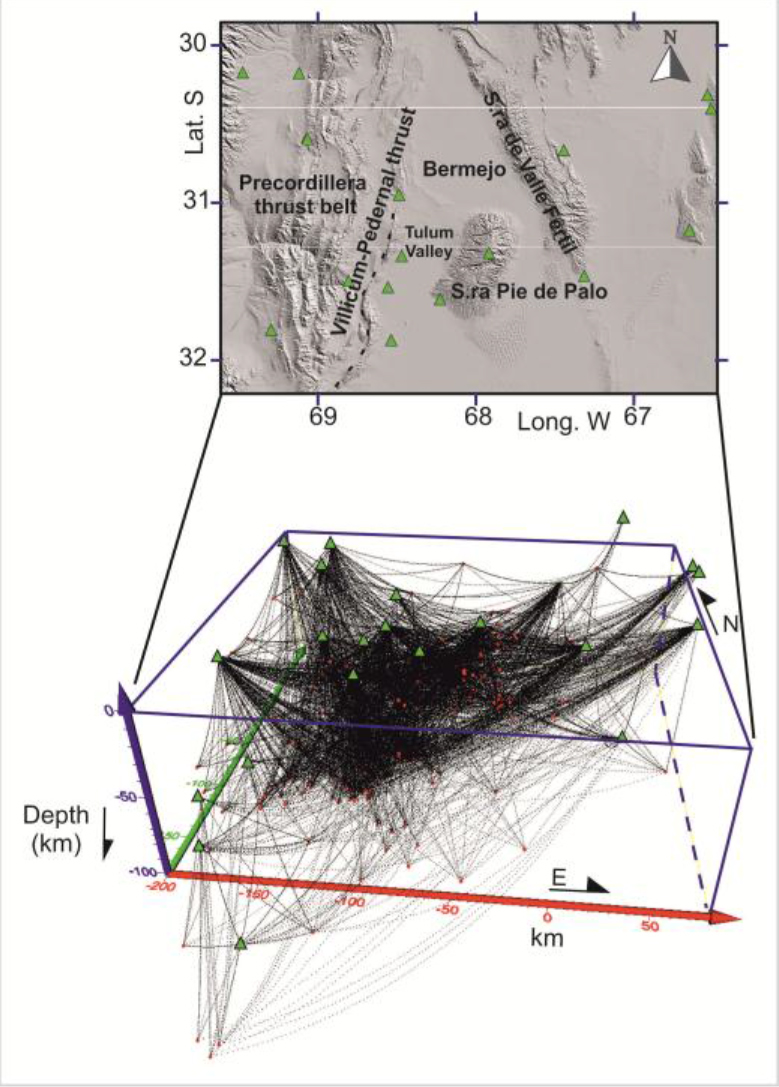
Figure 2. Digital elevation model of the studied area (top) and a 3-D sketch of P-wave ray paths traced in the a-priori velocity model. Earthquakes and seismic stations are indicated by red circles and green triangles, respectively.
Calculation of the 3D velocity model and event locations
Seismic velocity modelling was carried out by the program LOTOS (Koulakov, 2009) that automatically sets up the inversion mesh according to the distribution of the seismic rays. Specifically, given a regular grid step, which should be smaller than the presumed size of the anomalies, the software is able to not install any node in the case of absence of rays, whereas in areas of higher ray number, it can increase the grid density up to the maximum value (in our case, 10 and 5 km for the horizontal and vertical direction, respectively). The inversion solution is further controlled by smoothing parameters which reduce the difference in the final values of neighbouring nodes. The ability to build such a dense (quasi continuous) mesh is fundamental for a “local earthquake tomography” in order to reduce the bias of the resulting models due to the grid configuration (i.e. too large spacing between nodes to suitably image earth heterogeneities). Fine-tuning of the inversion was then obtained by discarding events with travel-time residuals of more than 1.5 s for P- and 2.5 s for S-rays. Before performing the tomography, it has been necessary to define a set of parameters and in particular a preliminary guess for the 1D seismic velocities, which was derived from the model optimized for the same area by Scarfì et al. (2012). The accuracy of the final 3D model was assessed by numerical tests (see e.g. Scarfì et al., 2018), whose results clearly indicate that the VP structure is adequately recovered in the central zone of the studied region down to a depth of 50 km. Finally, earthquake locations were further enhanced by the tomoDDPS algorithm (Zhang et al., 2009) and the obtained 3D velocity model. This code has the advantage of using a combination of both absolute and differential arrival time readings. In case of clustered events, additional information is used to improve the relative locations: i.e., since the uncertainty of the velocity model along the station-hypocenter path is the same for all the earthquakes, the travel-time differences found at a common station can be attributed to the spatial offset between the events. This procedure produced better clustering and further reduced the residuals (RMS) of about 33%, with an average of 0.25 sec.
Results
Figure 3 shows the final hypocentre locations of all 264 well-locatable events and highlights that seismicity is mainly located in two clearly separate depth ranges: the first between 0 and 40 km and the second between 90 and 130 km. Representative cross-sections of the 3D VP model are shown in Figure 4. The obtained velocity images highlight vertical and lateral crustal heterogeneities which can be associated with the main tectonic features of the region. In particular, the sharp velocity contrasts along with the relocated events are consistent with previously recognized or supposed active faults in the area of Sierra Pie de Palo. We can hypothesize that at Sierra Pie de Palo seismicity mainly originates from an active west-dipping fault, striking in NNE-SSW direction and extending from its eastern boundary to about 30 km of depth, where, probably, it intercepts another sub-horizontal structure (see also Scarfì et al., 2012 and references therein). Other events are aligned along the Villicum-Pedernal thrust in the eastern Precordillera (Figures 3, 4).
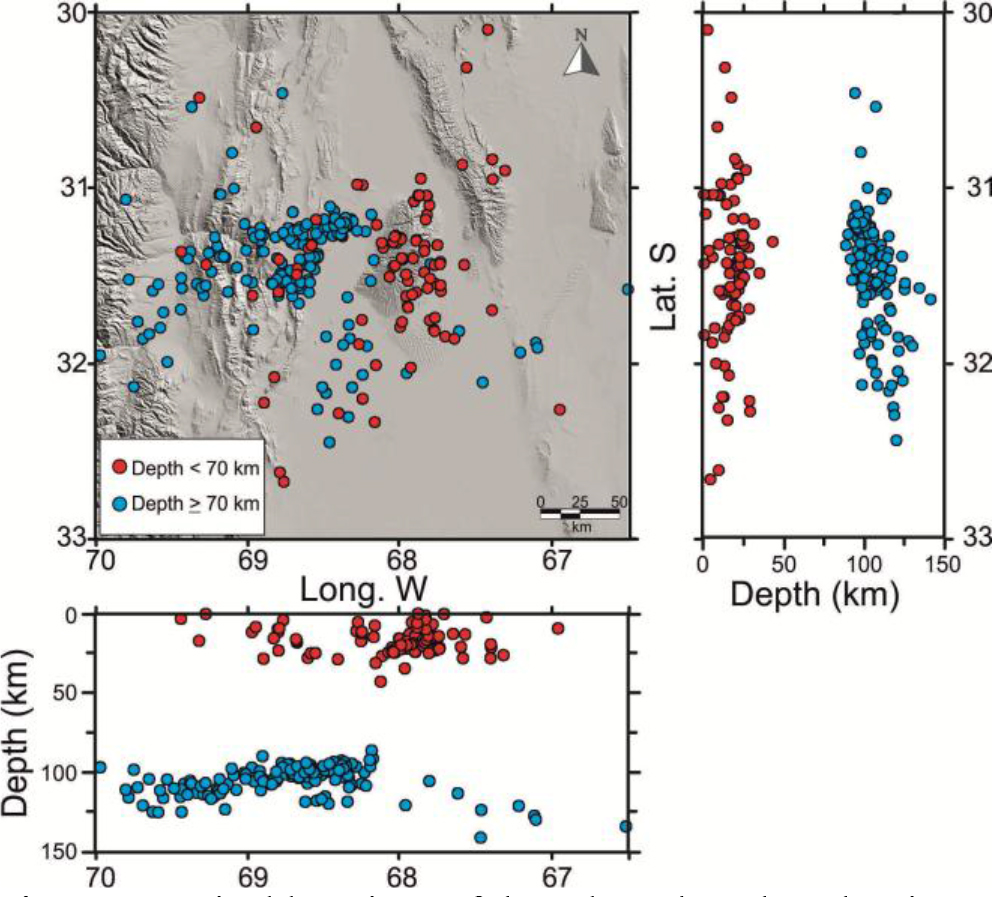
Figure 3. Final locations of the selected earthquakes in map view, N-S and W-E cross sections.
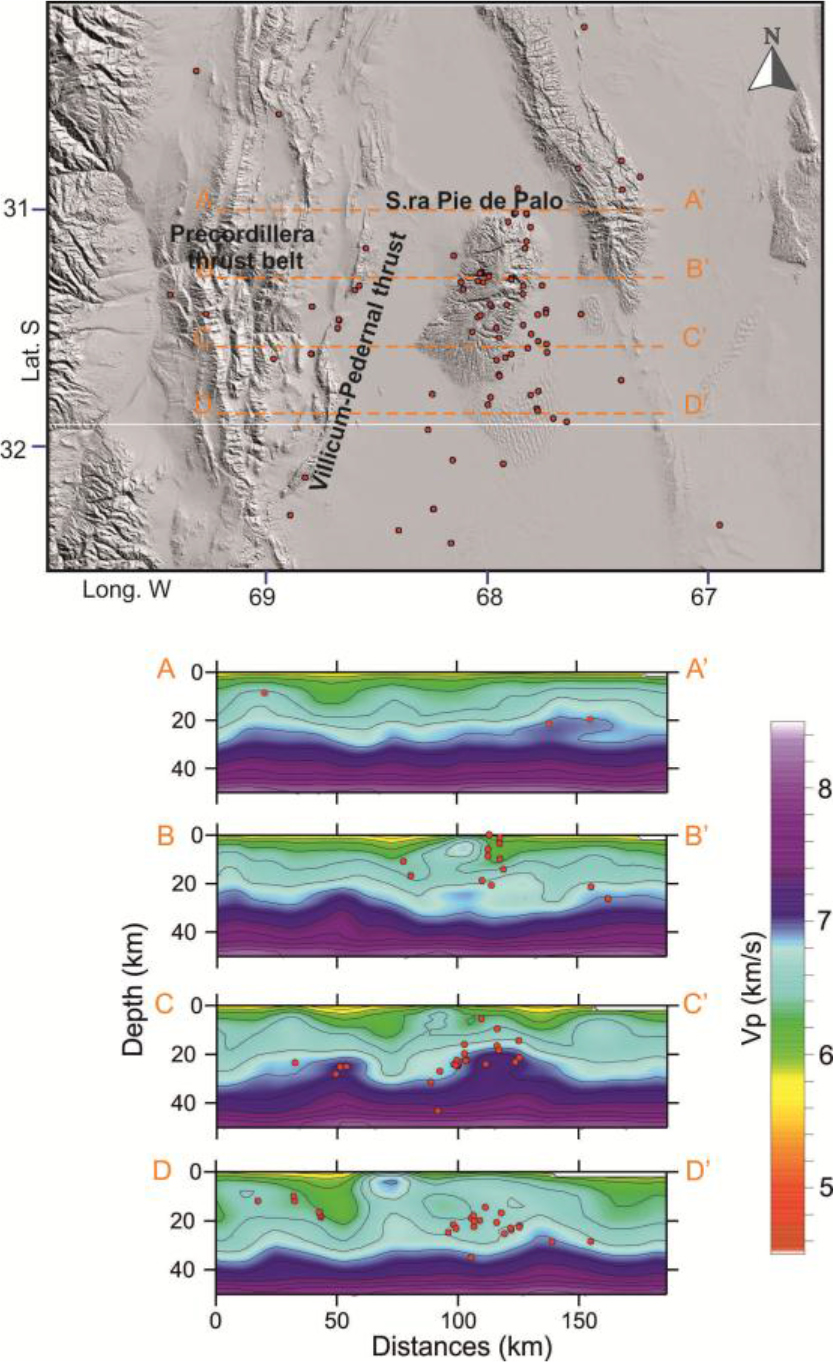
Figure 4. Vertical sections through the P-wave velocity model. The trace of the section is reported in the sketch map. Contour lines are at 0.2 km/s intervals. Relocated earthquakes, within +/-15 km from the sections, are plotted as red circles.
Concerning the intermediate-depth seismicity of the Wadati-Benioff zone, we note that our relocated events are fairly well clustered between the Precordillera and Sierra Pie the Palo (Figure 5). The hypocentres highlight two sub-zones characterized by slightly different focal depths, i.e., the shallower events (90–100 km deep) are located in the eastern zone, the deeper events (depth of 100–120 km) lie in the western zone. This distribution suggests the formation of a bent in the slab geometry (Figure 3, 5).
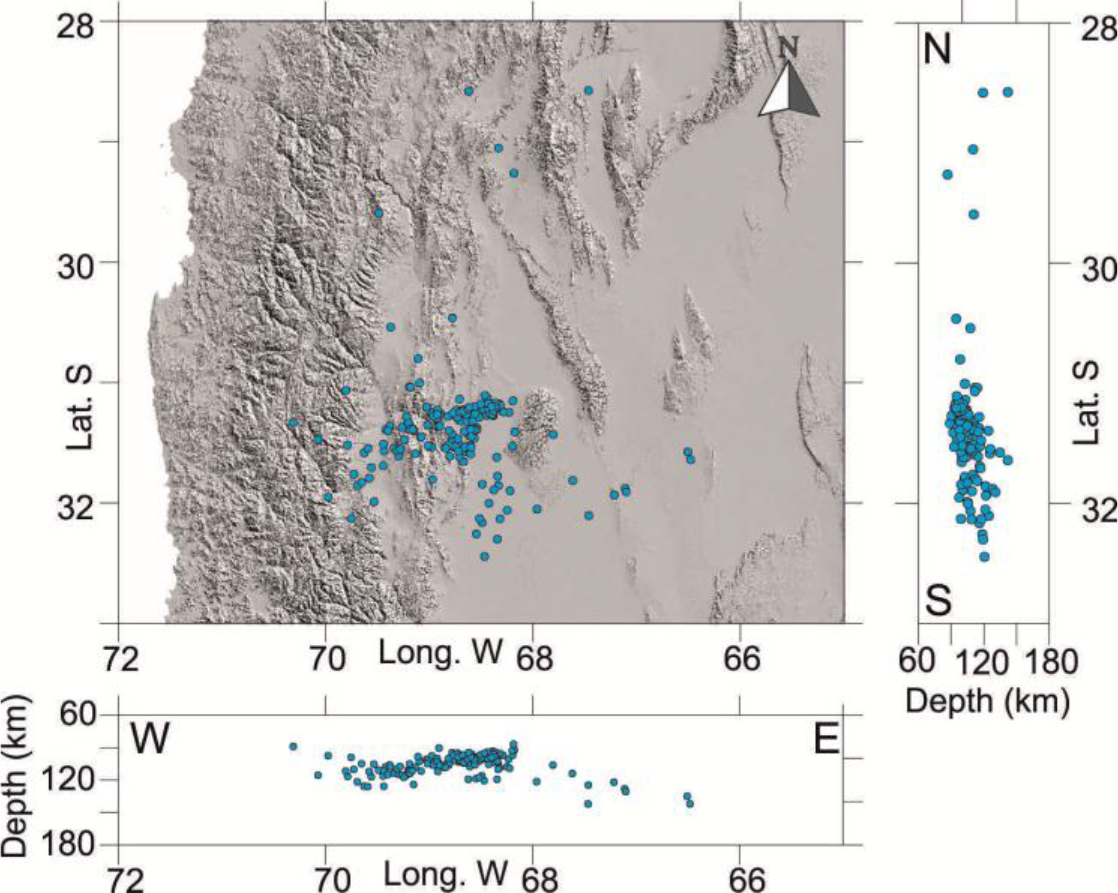
Figure 5. Final location of the whole dataset of the Wadati-Benioff zone events obtained by the calculated 3D velocity model, in map view, N-S and W-E cross sections.
Conclusion
Applying the techniques of the joint inversion of velocity and hypocentral parameters, we obtained precise and reliable hypocentre locations and information about the velocity structure within the area monitored by the “Red Sismologica Zonal Nuevo Cuyo” network. The results depict important structural features in the Sierra Pie de Palo area and also provide new constraints on the geometry of the subducted slab, within the limits of the study area. In conclusion, our specific analyses contribute to the understanding of the tectonic picture of the Southern-Central Andes region; however, further in depth studies and more data are needed to gain a better interpretation of the tectonic processes acting in the area.
Acknowledgement
We are especially grateful to G. Badi, from the Universidad Nacional de La Plata, and to M. Araujo, from the Instituto Nacional de Prevención Sísmica, Argentina, who provided the data.
References
- Anderson M, Alvarado P, Zandt G, Beck S (2007) Geometry and brittle deformation of the subducting Nazca Plate, Central Chile and Argentina. Geophysical Journal International 171: 419–434.
- Cahill T, Isacks BL (1992) Seismicity and shape of the subducted Nazca plate. Journal of Geophysical Research 97: 17503–17529.
- Gutscher MC (2002) Andean subduction styles and their effect on thermal structure and interplate coupling. J. South Am. Earth Sci. 15: 3–10.
- Koulakov I (2009) LOTOS code for local earthquake tomographic inversion: Benchmarks for testing tomographic algorithms. Bull. Seismol. Soc. Am. 99: 194–214.
- Ramos VA, Cristallini EO, Pérez DJ (2002) The Pampean flat-slab of the central Andes. Journal of South American Earth Sciences 15: 59–78.
- Ramos VA, Folguera A (2009) Andean flat-slab subduction through time. In: Murphy JB, keppie JD, Hynes AJ (eds). Ancient Orogens and Modern Analogues, Geological Society, London, Special Publications 327: 31–54.
- Siame LL, Bellier O, Sébrier M (2006) Active tectonics in the Argentina Precordillera and Western Sierra Pampeanas. Revista de la Associacion Geologica Argentina 61: 604–619.
- Scarfì L, Raffaele R, Badi G, Ibanez JM, Imposa S et al. (2012) Seismotectonic features from accurate hypocentre locations in southern central Andes (western Argentina). Tectonophysics 518–521: 44–54.
- Scarfì L, Barberi G, Barreca G, Cannavò F, Koulakov I, et al. (2018) Slab narrowing in the Central Mediterranean: the Calabro-Ionian subduction zone as imaged by high resolution seismic tomography. Scientific Reports 8.
- Zhang H, Thurber C, Bedrosian P (2009) Joint inversion for Vp, Vs, and Vp/Vs at SAFOD, Parkfield, California. Geochem Geophys Geosyst 10.