Monthly Archives: September 2019

Comparison of Inositol, Metformin and Oral Contraceptives in Polycystic Ovary Syndrome

DOI: 10.31038/EDMJ.2019352

Abstract

Polycystic Ovary Syndrome (PCOS) is a common endocrine disorder that affects women in reproductive age and associates variable degrees of hyperandrogenism, anovulation and/or Polycystic Ovary Morphology (PCOM), generating different phenotypes. Due to its heterogenic etiology, there is no general treatment, but rather an individual approach for each case.

The aim of this study is to detect possible variations in clinical and biochemical outcome in PCOS cases, after treatment with combined oral contraceptive pills, metformin or inositols.

This prospective study presents 56 patients in fertile age (18–36 years old), diagnosed with PCOS, which received treatment with oral contraceptives (30mg Etinylestradiol+Dienogest), metformin (2x500mg) or inositols (2g Myoinositol). Patients were evaluated clinically and biochemically at baseline, at 3 and 6 months.

In patients treated with contraceptive pills, LH levels decreased by 77.71% after 3 months, and LH:FSH ratio with 54.01% (p=0.0005) after 6 months. There was a 52% improvement in PCOM at ultrasound examination from 3 months treatment on (p<0.0001), but no significant decrease in menstrual cycle length. Metformin proved superior in decreasing abdominal circumference and HbA1c. The inositol group had the most significant improvement after 3 months, all parameters being significantly improved apart from Ferriman-Gallwey score; menstrual cycle pattern improved significantly after 3 months of treatment (54.7%, p=0.0008).

There were significant differences in outcomes for clinical and biochemical parameters between the different treatments, yet none of them turned out superior in all main signs and symptoms, (hyperandrogenism, ovarian dysfunction and polycystic morphology). Treatment in PCOS patients should be individualised to patient’s symptoms and needs.

Keywords

Hyperandrogenism, PCOS phenotypes, Inositol, Metformin, Contraceptives

Introduction

Although polycystic ovary syndrome (PCOS) represents one of the most common endocrine disorders, affecting about one in ten women in fertile age (8-13%), it is still under diagnosed and its mechanisms not completely understood. Implications are wide and include metabolic, reproductive and psychological components. Infertility, insulin resistance and increased cardiovascular risk are the main concerns when managing these patients [1-3].

PCOS is mostly an exclusion diagnosis. Conditions like thyroid disorders, 21-hydroxylase deficiency, hyperprolactinemia, Cushing’s syndrome, hyper androgenic tumors (ovarian or adrenal), ovarian stromal hyperplasia, ovaries with physiological follicles, or the use of virilizing drugs need to be ruled out [4-6].

The confirmation of PCOS diagnosis is still made using the Rotterdam criteria and must include minimum two out of the three criteria: oligomenorrhea / Ovulatory Dysfunction (OD), clinical or biochemical evidence of hyperandrogenism (HA) and Polycystic Ovary Morphology (PCOM). In accordance with the variation of symptoms, four different phenotypes have been described. Phenotype A comprises all three elements for diagnosis (HA, OD and PCOM), phenotype B includes HA and OD, phenotype C – HA and PCOM and phenotype D, with OD and PCOM, but not HA. The first two are considered ”classic forms” of PCOS and are more frequently associated (up to 85%) with insulin resistance and variable metabolic alterations, as opposed to phenotype D (”non-HA”), where metabolic impairment was found in fewer patients, being at a lower risk to develop diabetes [1,3,7,8].

When diagnosing a new case of PCOS, phenotype assessment is required, being highly suggestive for future possible complications and more importantly for choosing the most appropriate and individualized therapeutic approach. Treatment in PCOS is long-term and may need adjustments in evolution. Treatment should target weight loss, ameliorate hormonal and reproductive disturbances and prevent comorbidities [9].

Patients should be counseled to make diet and lifestyle changes, as PCOS usually progresses with weight gain, which can precipitate development of comorbidities. Also, physical activity has been found to improve fertility and live births in women with reproductive problems [10].

Pharmacological intervention is needed in most cases, its use in PCOS is off-label but it is evidence-based. Oral Contraceptive Pills (OCPs) are recommended for women with HA and oligomenorrhea who do not target pregnancy, with favorable outcomes on hirsutism, acne, alopecia, menstrual cycle length and decreasing chance of developing endometrial hyperplasia. For achieving fertility, first-line treatment is Letrozole, with a lower risk of multiple pregnancies, but clomiphene citrate and/or metformin can be considered. Metformin is an insulin sensitizer used with success in patients with metabolic disease; it has been proved to reduce HA, normalize menstrual cycle and restore ovulation. Inositols, represented by Myo-Inositol (MI) and D-chiro-Inositol (DCI) are molecules that act as insulin messengers. Correcting a possible deficiency may improve HA, ovulatory and metabolic aspects of PCOS, but there is not enough evidence of their benefits [1,6,11-13].

The aim of the present study was to detect possible variations in clinical and biochemical outcomes in PCOS cases, after treatment with combined oral contraceptives (30mg Etinylestradiol + Dienogest), metformin (2 × 500mg) or inositols (2g Myo-Inositol). Clinical and biochemical parameters were compared at baseline, at 3 and 6 months follow up and a correlation was studied for each treatment choice.

Materials and Methods

Seventy-four women in fertile age (between 18 – 36 years old), diagnosed with PCOS, were included in the study starting with January 2017. The patients were recruited from Dr. D Medical Center in Timisoara, Romania.

Inclusion Criteria. Patients with a clear diagnosis of PCOS were included in the study (minimum 2 out of 3 Rotterdam criteria: HA, OA, PCOM), who agreed to evaluation and stayed compliant to the given treatment for the following 6 months (metformin, inositols or OCPs); other disorders causing hyperandrogenism (ovarian or pituitary tumors, Cushing’s disease, iatrogenic causes) have been excluded.

Each participant signed a written informed consent and the ethics committee approved the study of the Medical Center.

All subjects were evaluated clinically, biochemically and with imaging techniques.

Initial hormonal evaluation included Luteinizing Hormone (LH), Follicle Stimulating Hormone (FSH), LH: FSH ratio, free testosterone, Dehydroepiandrosterone sulfate (DHEA-S), prolactin (PRL), cortisol and hemoglobin A1c(HbA1c).

Clinical examinaton was performed at baseline, 3 and 6 months, including anthropometric measurements: height, weight, body mass index (BMI) and abdominal circumference. Hirsutism was evaluated using the Modified Ferriman-Gallwey score; a value ≥ 8 was assessed as hirsutism [14].

The maximum time of amenorrhea was assessed as a measure of OD at baseline. In the follow-up examination at 3 and 6 months, the maximum time of amenorrhea was exchanged by menstrual cycle length, as a measure of OD. When comparing maximum time of amenorrhea with menstrual cycle length, the number of months was multiplied by 28 to yield the consecutive time in days.

In order to determine presence of PCOM, transvaginal ultrasound of the ovaries was performed. Positive for PCOM were considered cases with more than twelve follicles or an ovarian volume greater than 10 ml [1].

A prospective evaluation of clinical parameters was made: BMI, Ferriman-Gallwey (FG) score, menstrual cycle’s assessment. Hormonal and metabolic parameters were re-evaluated after 6 months of treatment, as well as ultrasound appearance.

The Therapeutic Intervention. The therapeutic intervention included three treatment choices and the study group was subdivided in 3 groups, according to their treatment option: 24 patients in study group 1 were treated with inositols (2g Myo-Inositol). 25 patients in study group 2 were treated with OCPs (30mg Etinylestradiol + Dienogest), and 25 patients in study group 3 were treated with metformin (Metformin 2 x 500mg).

Statistical Analysis was carried out using SPSS and a threshold value for probability (p) < 0.05 was considered statistically significant in order to reject the null hypothesis. The data was expressed as mean values and standard deviations. The clinical and biochemical characteristics were compared to each other between the study groups using the unpaired t-test; the paired t-test was applied for different parameters comparison at baseline and post-treatment. Multifactorial analysis of variance (ANOVA) test was used univariate to compare the three study group parameters at baseline, then it was applied multivariate to compare outcomes for all study groups and to detect differences in parameter values at baseline, 3 and 6 moths of follow-up.[15]

Results

The entire study group included 74 patients with a mean age of 26.91 ± 3.92, between 18 and 36 years old. The cases were subdivided in 3 categories as follows: study group 1 represents the patients that received treatment with Inositol and includes 24 patients, study group 2 is made up of 25 patients treated with OCPs and study group 3 includes 25 patients that received treatment with Metformin.

The evaluated characteristics for the three study groups at baseline are presented in Table 1 as mean value ± standard deviation as well as the comparison of parameters at baseline between all three study groups using the monofactorial ANOVA test.

Table 1. Clinical and biochemical characteristics at baseline and value comparison using monofactorial ANOVA test for all studied parameters between study groups 1–3

Parameters

Group 1

Group 2

Group 3

F value

p value

Critical f value

BMI (kg/m²)

31.35
±5.52

25.71
±5.44

31.70
±4.45

10.77

0.0001

3.12

FG score

17.75
±2.21

16.84
±3.01

12.12
±3.15

28.92

< 0.0001

3.12

Max amenorrhea (months)

3.38
±2.14

1.24
±1.28

3.26
±1.82

11.55

< 0.0001

3.12

Abdominal circumference (cm)

100.00
±12.76

81.04
±12.74

99.92
±13.41

2.44

0.094

3.12

Free testosterone (mIU/ml)

0.02
±0.003

0.02
±0.01

0.0
1±0.01

7.72

0.001

3.12

DHEAS (mg/dl)

413.54
±30.25

411.44
±108.25

337.24
±95.62

6.52

0.003

3.12

PRL (mIU/ml)

591.46
±152.30

550.44
±117.36

374.12
±219.67

11.87

< 0.0001

3.12

LH (mIU/ml)

13.00
±3.75

13.996
±3.77

14.13
±3.80

0.68

0.508

3.12

FSH (mIU/ml)

5.27
±0.99

6.16
±1.59

5.54
±1.26

1.16

0.323

3.20

LH:FSH ratio

2.50
±0.78

2.37
±0.74

2.64
±0.74

0.79

0.459

3.12

Cortisol (mg/dl)

18.77
±4.13

17.15
±5.27

21.75
±5.00

5.90

0.004

3.12

HbA1c (%)

6.02
±0.59

5.85
±0.54

6.16
±0.74

1.49

0.233

3.12

A significant difference (p-value <0.05) was found in BMI (p=0.0001), FG score (p<0.0001), maximum amenorrhea (p<0.0001), testosterone level (p=0.001), DHEA-S level (p=0.003), prolactin (PRL) (p<0.0001) and cortisol levels (p=0.004).

Figure 1 presents the mean value of the studied parameters in group 1 (24 patients) at baseline and the evolution of parameters (mean values) after they started treatment with inositol, at 3 and 6 months follow-up.

EDMJ 2019-123 - Laura Cotoi Romania_F1

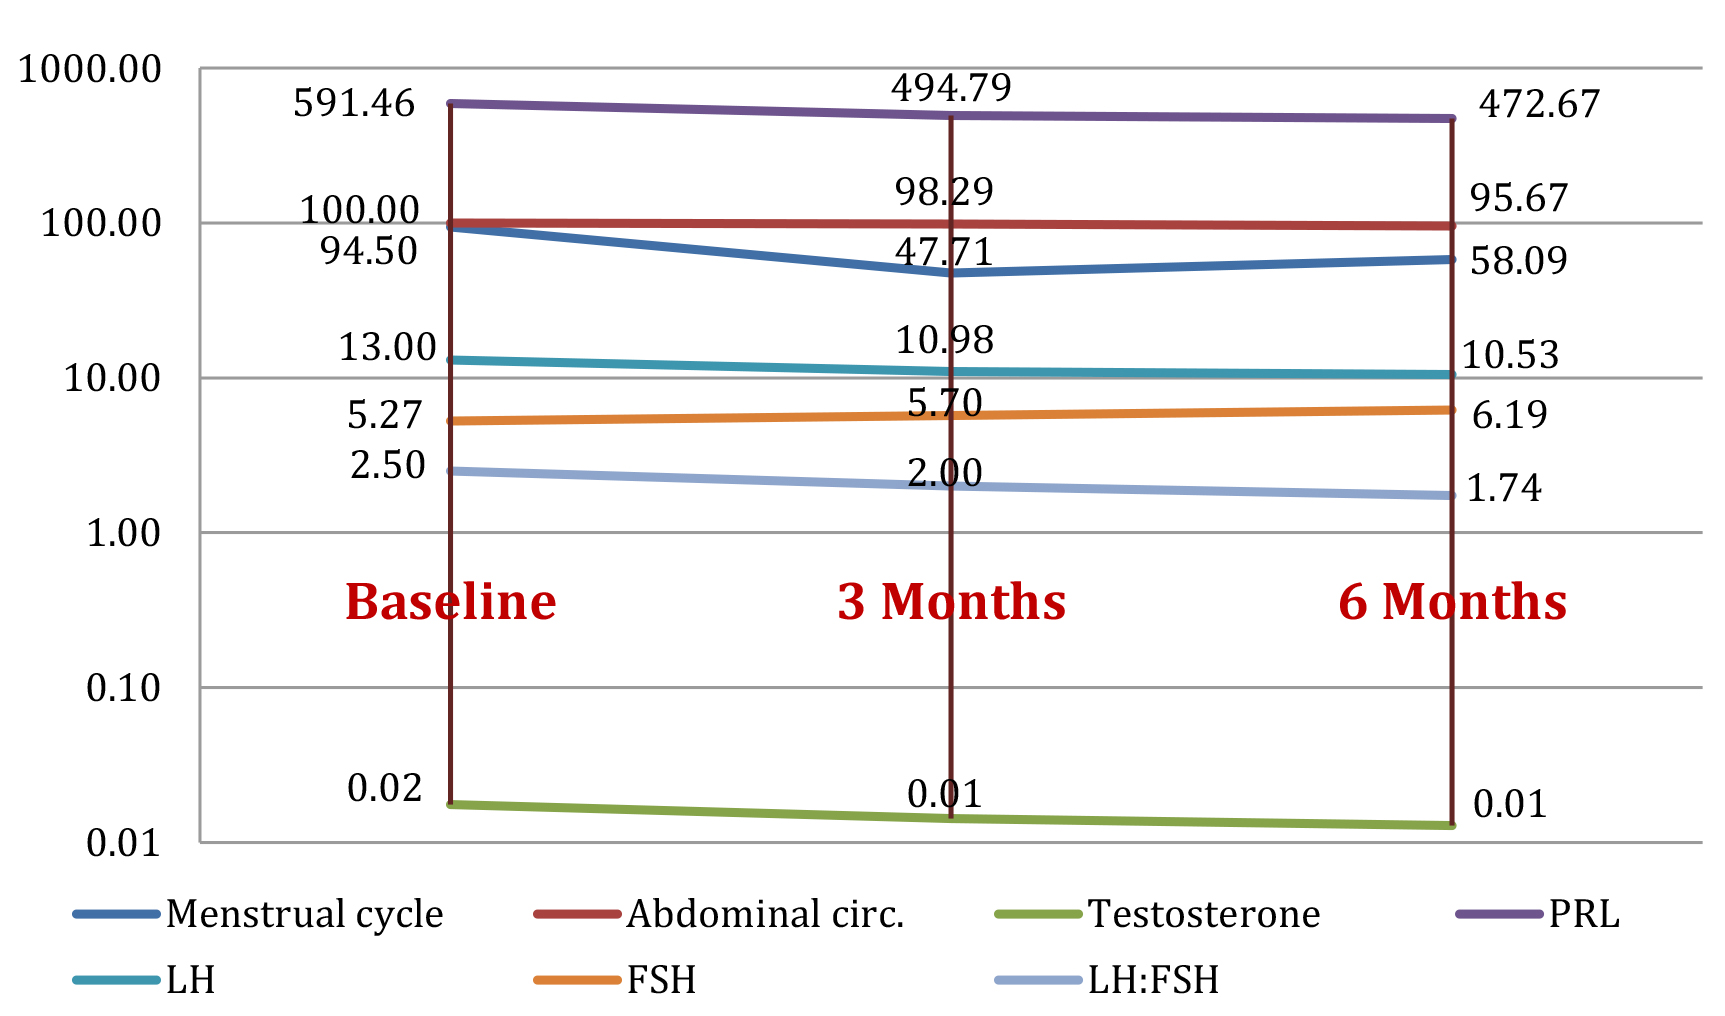
Figure 1. Study group 1: evolution of parameters (mean value) at baseline, and at 3 months and 6 months after initiating treatment with inositols

Figure 2 shows evolution for the mean value of the parameters for the 25 cases in group 2 initially and as tested parameters change after being treated with OCPs at3 and 6 months follow-up.

EDMJ 2019-123 - Laura Cotoi Romania_F2

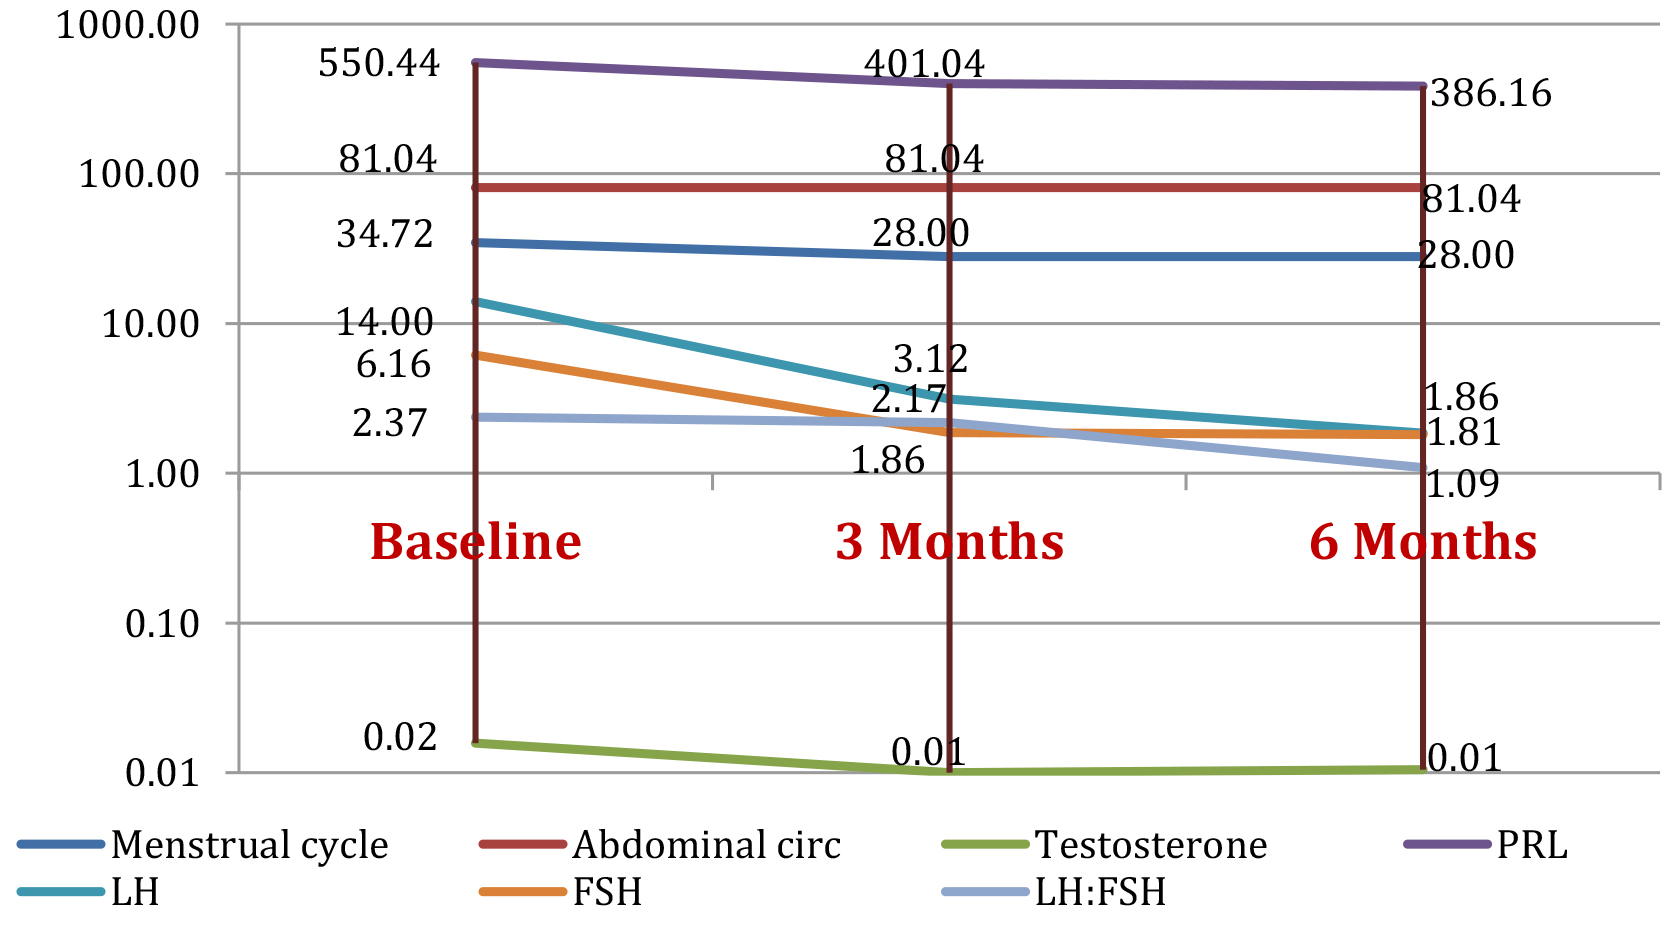
Figure 2. Study group 2: evolution of parameters (mean value) at baseline, and at 3 months and 6 months after initiating OCP treatment

Figure 3 presents the summarized means of the parameters in group 3 after the 25 patients entered the program and were treated with metformin, changes in their testing parameters could be observed at respectively 3 and 6 months follow up.

EDMJ 2019-123 - Laura Cotoi Romania_F3

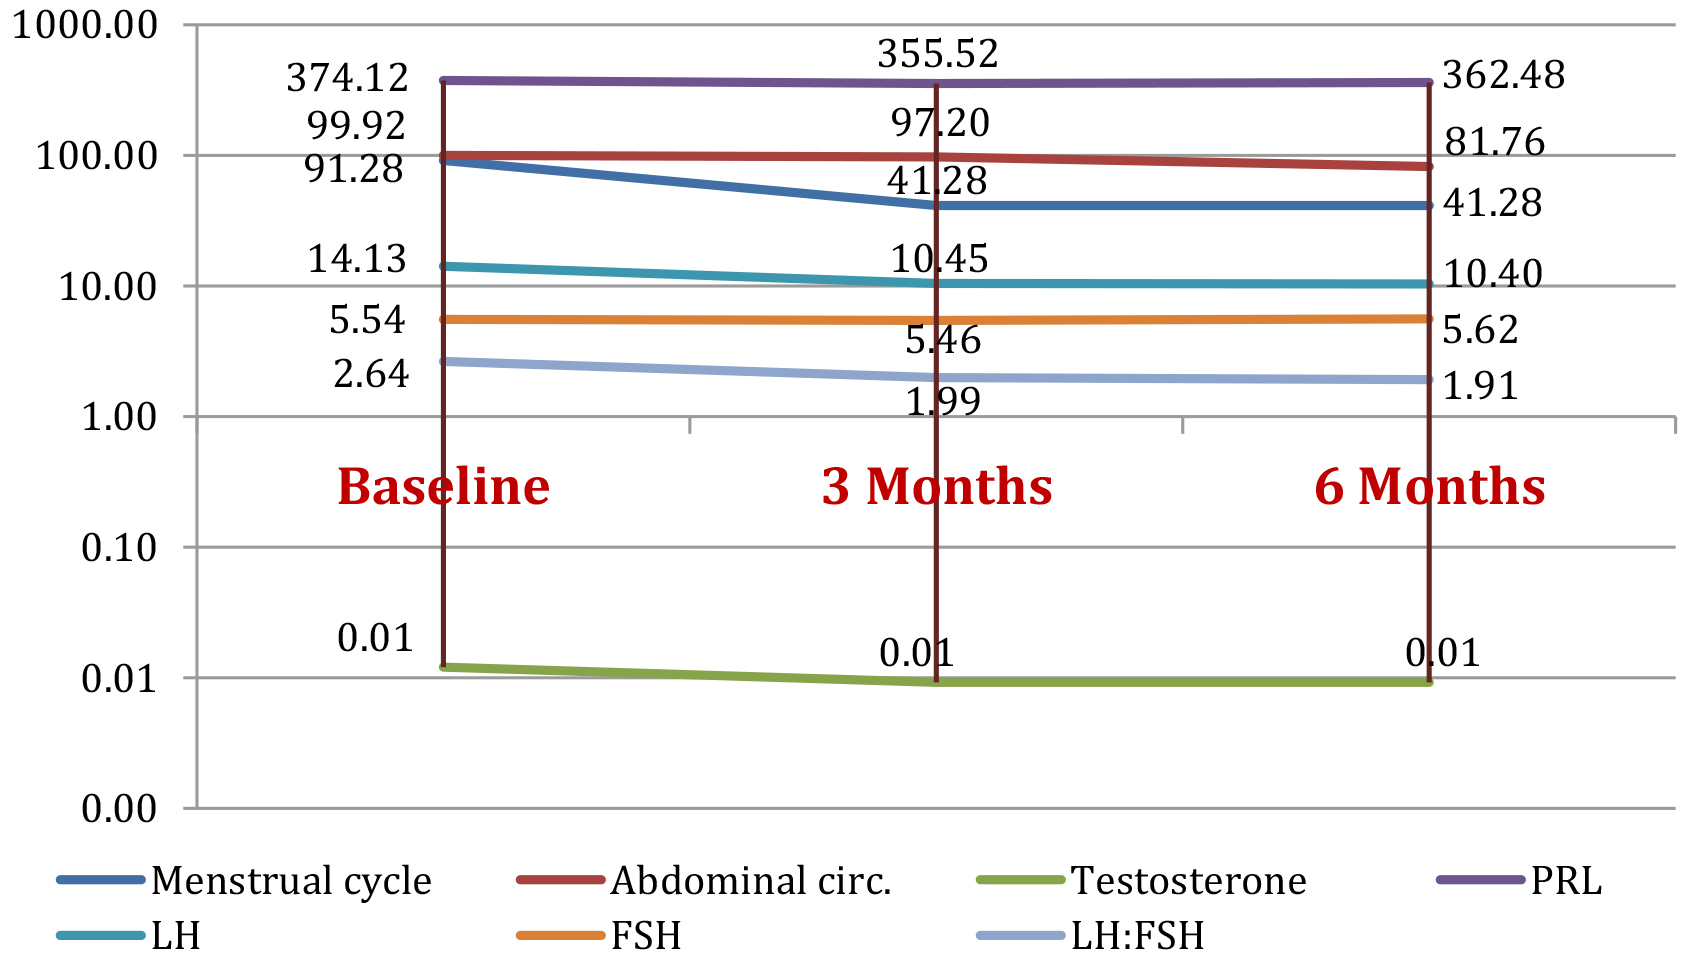
Figure 3. Study group 3: parameters evolution (mean value) at baseline and at 3 months and 6 months after metformin treatment

Data in Table 2 shows the presence of PCOM on ultrasound evaluation in study groups 1-3 at baseline and in evolution after starting each type of treatment respectively, at 3 and 6 months follow-up. For group 1, all 24 patients (100%) were positive at baseline examination, after 3 months the positive cases were reduced to 16 and 8 negatives and continued to decrease to 12 positives (50%) and 12 negatives at 6 months follow-up. For group 2, only 12 patients (48%) out of the total 25 were positive for PCOM at initial exam, and all of them became negative at 3 and 6 months after OCP treatment. In group 3, nineteen patients (76%) were PCOM positive at baseline, after 3 months of this reduced to 13 positives (52%) and 12 negatives and decreased further to 9 positives (36%) and 16 negatives at 6 months follow up.

Table 2. Ultrasound PCOM evaluation at baseline, 3 months and 6 months follow up in study groups 1-3

Parameter

Group 1 (inositol)

Group 2 (OCP)

Group 3 (metformin)

Evaluation

B

3m

6m

B

3m

6m

B

3m

6m

PCOM

Positive

24

16

12

12

0

0

19

13

9

100%

66.6%

50%

48%

0%

0%

76%

52%

36%

Negative

0

8

12

13

25

25

6

12

16

0%

33.4%

50%

52%

100%

100%

24%

48%

64%

In Table 3 the patient parameters are compared at baseline and 3 months of treatment in all three-study groups using the paired T-test. A cut-off for the p-value of 0.05 was considered as statistically significant. For study group 1, treated with inositol there was no change in FG score values. Statistically significant differences were seen in menstrual cycle length (p=0.006), abdominal circumference (p=0.01), testosterone levels (p<0.0001), PRL levels (p=0.011), LH levels (p=0.0002), FSH levels (p=0.013), LH:FSH ratio (p=0.001), HbA1c levels (p<0.0001) and at PCOM ultrasound evaluation (p=0.003). In group 2 that received OCPs as therapy for three months, significant differences have been detected for menstrual cycle length, PRL, LH, FSH levels and PCOM and for the metformin-treated group 3 statistically significant differences were found in menstrual cycle length, abdominal circumference, testosterone, LH levels and LH:FSH ratio.

Table 3. Statistical analysis: T-Test initial vs 3 months in study groups 1,2 and 3

Parameters

Group 1

Group 2

Group 3

t score

p value

        t score

p value

      t score

p value

Menstrual cycle

3.00

0.006

8.22

< 0.0001

3.81

0.0008

Abdominal circ

2.82

0.010

0.93

0.359

5.35

< 0.0001

Testosterone

5.91

< 0.0001

0.90

0.377

3.89

0.0007

PRL

2.75

0.011

5.00

< 0.0001

0.41

0.6836

LH

4.49

0.0002

9.53

< 0.0001

4.66

0.0001

FSH

-2.68

0.013

10.35

< 0.0001

0.23

0.8197

LH:FSH

3.84

0.001

0.28

0.783

4.05

0.0005

HbA1c

7.13

< 0.0001

-0.10

0.918

6.76

< 0.0001

PCOM

3.39

0.003

4.71

0.0001

1.6

0.1102

When comparing baseline group characteristics with the ones at 6 months of treatment (see Table 4 below), the improvement continued for all categories. In the inositolgroup 1, statistically significant values were attained for all evaluated parameters. In the 2nd group, treated with OCPs, significant improvement was found in menstrual cycle (p<0.0001), testosterone levels (0.047), PRL, FSH, LH levels and LH:FSH ratio, A1c and PCOM (p<0.0001) Abdominal circumference was also lower, but not significantly. For group 3, that received metformin treatment, statistically significant differences were seen in menstrual cycle length (p=0.0008), abdominal circumference (p<0.0001), testosterone levels (p=0.0003), LH levels (p=0.0001), LH:FSH (p=0.0002) and at ultrasound (p=0.0049).

Table 4. Statistical analysis: T-Test baseline vs 6 months of treatment for study groups 1,2 and 3

Parameters

Group 1

Group 2

Group 3

t score

p value

        t score

p value

      t score

p value

Menstrual cycle

3.00

0.006

8.88

< 0.0001

3.81

0.0008

Abdominal circ

5.77

< 0.0001

0.93

0.359

6.79

< 0.0001

Testosterone

8.09

< 0.0001

2.09

0.047

4.28

0.0003

PRL

3.24

0.004

6.00

< 0.0001

0.26

0.7993

LH

4.97

0.0001

14.92

< 0.0001

4.52

0.0001

FSH

-3.75

0.001

11.63

< 0.0001

-0.25

0.8071

LH:FSH

5.07

< 0.0001

7.18

< 0.0001

4.49

0.0002

HbA1c

4.80

0.0001

4.71

0.0001

3.10

0.0049

PCOM

3.00

0.006

8.88

< 0.0001

3.81

0.0008

Table 5 presents the difference between the three study groups for each parameter at baseline and 6 months, using the MANOVA test.

Table 5. MANOVA test: baseline vs 6 months – differences between groups

Parameters

F value

p value

Critical f value

Menstrual cycle

19.68

< 0.0001

3,06

Abdominal circ.

4.38

0.014

3,06

Testosterone

7,24

0,001

3,06

PRL

19,54

<0,0001

3,06

LH

30,53

<0,0001

3,06

FSH

34,85

<0,0001

3,06

LH:FSH

9,96

0,0001

3,06

eco PCOS

21,20

<0,0001

3,06

The data was compared initially and at 3 months of therapy for the study groups two by two, as shown in Table 6. When the inositol and OCP groups are compared, statistically significant differences are found for FG score, menstrual cycles, abdominal circumference, PRL, LH, FSH and ultrasound polycystic morphology. When groups 1 and 3 were compared, differences were only noticed for testosterone, PRL and menstrual cycles length and as for comparing groups 2 and 3 significant for FG score, menstrual cycles, abdominal circumference, LH, FSH and PCOM.

Table 6. T-Test baseline vs 3 months – study groups comparison

Parameters

group 1 vs group 2

group 1 vs group 3

group 2 vs group 3

t test

p value

t test

p value

t test

p value

FG score

5.40

< 0.0001

0.79

0.431

2.77

0.008

Menstrual cycle length

3.28

0.003

7.26

< 0.0001

-2.45

0.022

Abdominal circ.

4.89

< 0.0001

0.32

0.751

-4.62

< 0.0001

Testosterone

0.43

0.674

5.07

< 0.0001

1.12

0.275

PRL

3.33

0.002

4.74

< 0.0001

1.34

0.185

LH

7.90

< 0.0001

0.67

0.505

-7.72

< 0.0001

FSH

13.92

< 0.0001

0.63

0.530

-10.82

< 0.0001

LH:FSH

-0.24

0.809

0.07

0.948

0.26

0.796

HbA1c

-0.43

0.671

-0.42

0.679

-0.02

0.981

PCOM

6.78

< 0.0001

1.03

0.306

-5.10

< 0.0001

Groups were compared again after 6 months of treatment using the unpaired t-test. Results are shown in Table 7.

Table 7. T-Test baseline vs 6 months – study groups comparison

Parameters

group 1 vs group 2

group 1 vs group 3

group 2 vs group 3

t test

p value

t test

p value

t test

p value

Menstrual cycle length

6.84

< 0.0001

2.45

0.018

-2.45

0.022

Abdominal circ.

4.32

0.0001

4,08

0,0002

-0.20

0.843

Testosterone

0,93

0,361

5,13

<0,0001

0.77

0.445

PRL

4,56

0,0000

4,39

0,0001

0.92

0.363

LH

16,91

0,0000

0,18

0,856

-15.60

< 0.0001

FSH

16,51

0,0000

1,71

0,094

-14.85

< 0.0001

LH:FSH

5,48

0,0000

-1,22

0,230

-5.59

< 0.0001

PCOM

4,80

0,0001

0,98

0,333

-3.67

0.001

Discussion

A number of studies attempted to compare different treatment approaches for women with PCOS and data is still inconclusive, outcomes depending individually. While metformin and OCPs have been extensively studied, literature data on inositol therapy is still poor and needs further study. The present study aimed to compare inositol with the more commonly used metformin and oral contraceptives and determine whether one of them is superior to others. No real differences were found when comparing the results of the different forms of T-Test with the results of ANOVA and MANOVA tests.

As for OCPs, normal menstrual cycles were restored at 3-month follow-up in 100% of cases, but the decrease in menstrual cycle length was not significant (19.35%, p=0.359). Improvement in ultrasound aspect of the ovaries was found in all patients as soon as 3 months of treatment (p<0.0001). FG score was also significantly improved after 6 months of treatment and PRL status at 6 months after initiation of OCPs (29,85%, p<0.0001). Our findings show a decrease in testosterone levels by 50%, in LH levels by 77,71% after 3 months and of 69.81% (p<0.0001) in FSH levels from 3 month follow up on. LH to FSH ratio decreased consecutively by 54.01% (p=0.0005) after 6 months. This confirms existing data on improving testosterone levels and LH-FSH profile. OCPs have been also found to normalize free androgen index and SHBG values. Abdominal circumference did not seem to improve in the OCP group, but this could be explained by the baseline value close to the normal upper limit for the studied group. There is also literature data showing a negative impact of OCPs on BMI. Adding metformin to therapy was proposed in order to attenuate this effect [1,16,17].

Regarding metformin therapy, its role in reducing symptoms of PCOS is supported by literature, with the exception of hirsutism, although in some studies it was proven  to reduce acne, hirsutism and improve fertility. Menstrual cycle pattern normalized significantly by 54,78% at 3 months follow-up (p=0.0008) and remained stable at 6 months. There was a clear improvement in free testosterone after treatment with metformin starting from 3 months follow-up (p=0.0007) and continuing to decrease and a decrease of LH:FSH ratio by 27.65%  (p=0.0002) for patients treated with metformin for 6 months. Other studies support our data with similar results. One study described a decrease in ovarian volume by 10% (p=0.001) marking an improvement at ultrasound examination, which was also found in our study after 6 months (47,37%, p=0.0049). Metabolic parameters were, as expected, improved with metformin therapy in the majority of studies. A decrease by 4.81 % in HbA1c after only 3 months of treatment (p<0.0001) was noticed, while literature data shows differences of up to 15% after 6 months. Abdominal circumference decreased by 8.17% (p<0.0001) after the same time period [7,18-25].

More research papers on use of inositols in women with PCOS have been published for the past couple of years. Our paper aimed to bring a contribution to current knowledge. The most significant improvement in all our study groups was assessed for the inositol group at 3-month follow-up. All the monitored parameters, both endocrine and metabolic, have been significantly improved with the exception of FG score. Other publications have found an improvement with inositol therapy even for this parameter. A decrease of 38,53% (p=0.006) in menstrual cycle length was found, which is extremely comparative other literature findings, but mean length value is still greater than normal. PRL levels decreased by 20,08% (p=0.004) after 6 months treatment, LH levels recorded a 15,54% decrease (p=0.0002) after 3 months and FSH up to 17.46% (p=0.001) after 6 months of treatment; we did not find a significant improvement for FSH values in other publications. LH:FSH ratio decreased by 20% (p=0.001) after 3 months of treatment, which was similar to other findings. Testosterone levels improved by 50%. A decrease by up to 4.33% (p<0.0001) was documented for abdominal circumference, also for HbA1c  a significant 3.82% decrease was found (p=0.010). Our work supports other papers findings, a decrease in BMI and in HbA1c have also been reported. As to ultrasound examination, we found a statistically significant improvement of 25% (p=0.003, p=0.0001) regarding PCOM with each 3 months, yet to our knowledge other studies could not find a significant improvement [26-29].

OCPs vs Metformin

The present study showed favorable outcomes for OCPs after 3 months of treatment, a statistically significant difference in effectiveness was in favor of OCP treatment in regard to decreasing FG score and LH levels. When evaluating of PCOM aspect evolution, OCPs are also superior (all patients were negative after 3 months), but there was a significant difference in initial parameters which favored the OCP group.Metforminhad better results in decreasing abdominal circumference and menstrual cycle length, but it should be taken into account that the values for the OCP group were closer to normal at baseline and this could benefit the metformin group to achieve a greater improvement. Regarding HbA1c, metformin was also superior compared to OCP, which did not attain a significant improvement.

Multiple studies compared efficacy of these two agents, most of the result were comparable to ours. Metformin has been shown to improve most metabolic parameters, but also OD and fertility in some cases, while OCPs had better outcomes in ameliorating HA symptoms and endocrine parameters [1,22].

Metformin vs Inositol

Combining the stastical results after 3 month follow-up, inositols clearly showed to be superior in decreasing abdominal circumference, improving PRL levels, and twice as effective regarding PCOM aspect. There was a statistically significant difference in effectiveness in favor of metformin for menstrual cycle length; for HbA1c, metformin was superior but not statistically significant.

There is only few literature data in this regard and results are conflicting. Some recent studies found improvements in the endocrine and clinical outcomes in clear favor to metformin while other report the two are equally effective in normalizing both metabolic and clinical characteristics. Given the lack of conclusive data, current guidelines do not support use of inositols in treating women with PCOS and considers its use still experimental.[1,26,27,29]

Inositol vs OCPs

Currently there is no data comparing inositols and oral contraceptive outcomes. Our findings show superior results for OCPs on endocrine parameters: PRL, LH and LH:FSH. OCPs were also quicker in improving PCOM (100% negative for PCOM at 3 months). Worth mentioning that initial values have already been started in favor of the OCP group at baseline. The inositol group took at least twice as long reach the same improvement (%). Similarly to metformin, the insulin sensitizer was better than OCPs in improving abdominal circumference and menstrual cycle length.

The multiple initial differences between the study groups, the relatively short follow-up of only 3 months for HbA1c and FG score, the different time from diagnosis and the lack in monitoring lifestyle intervention are some of the limitations of this study. One of its strengths was comparing OCP treatment with inositol, which to our knowledge was not done to this extent.

Conclusion

The findings of this study showed superior outcomes for OCPs in improving endocrine parameters: PRL, LH, FSH, LH:FSH ratio and polycystic morphology aspect on ultrasound. Inositols and metformin also improved these parameters, but to a lower extent.

Both insulin sensitizers (metformin and inositol) turned out triumphant in reducing abdominal circumference and menstrual cycle length, with better results for metformin in restoring menstrual cycle pattern, while an exceptional performance was described for the inositol group in improving abdominal circumference, testosterone and PRL levels.

Some of the results may have been influenced by a distribution closer to the normal range that could benefit certain therapy outcomes. A randomization at baseline might be of help in future studies.

Given the little data and the big potential of inositol treatment, there is a real need for more extensive research in this regard. Up until now, studies showed great outcomes for inositols, and considering the absence of the typical gastrointestinal side effects of metformin, they may be considered a real alternative to metformin or as complementary therapy to OCPs.

Significant differences in clinical and biochemical parameters have been found between outcomes for the diverse treatment choices, still none of them turned out superior in ameliorating all main components (HA, OD and PCOM). The treatment in each case of PCOS should be individualized to the patient’s symptoms and needs.

Abbreviations

PCOS – Polycystic ovary syndrome

MI – Myo-Inositol

DCI – D-chiro-Inositol

OCP – Oral contraceptive pills

PCOM – Polycystic ovarian morphology

FG score – Ferriman-Gallwey score

HA – Hyperandrogenism

OD – Ovarian dysfunction

MANOVA – Multifactorial analysis of variance

References

  1. Teede H, Misso M, Costello M, Dokras A, Laven J, et al (2018) International evidence-based guideline for the assessment and management of polycystic ovary syndrome. National Health and Medical Research Council (NHMRC) 2018.
  2. Goodman NF, Cobin RH, Futterweit W, Glueck JS, Legro RS, et al (2015) American Association Of Clinical Endocrinologists, American College Of Endocrinology, And Androgen Excess And Pcos Society Disease State Clinical Review: Guide To The Best Practices In The Evaluation And Treatment Of Polycystic Ovary Syndrome – Part 1. Endocr Pract.
  3. Azziz R (2016) Introduction: Determinants of polycystic ovary syndrome. Fertil Steril.
  4. Karkanaki A, Vosnakis C, Panidis D (2011). The clinical significance of anti-müllerian hormone evaluation in gynecological endocrinology. Hormones.
  5. Meier RK (2018) Polycystic Ovary Syndrome. Nursing Clinics of North America.
  6. S.m S, K.a P (2014). Epidemiology, diagnosis, and management of polycystic ovary syndrome Clin Epidemiol.
  7. H.J. T, M.L. M, M.F. C, A. D, J. L, et al (2018) Recommendations from the international evidence-based guideline for the assessment and management of polycystic ovary syndrome. Hum Reprod.
  8. Bani Mohammad M, Majdi Seghinsara A. Polycystic Ovary Syndrome (PCOS), Diagnostic Criteria, and AMH. Asian Pac J Cancer Prev 18:17–21.
  9. LJ M, SK H, RJ N, HJ T, Moran Lisa J et al (2011). Lifestyle changes in women with polycystic ovary syndrome. Cochrane Database Syst Rev.
  10. Mena GP, Mielke GI, Brown WJ (2019). The effect of physical activity on reproductive health outcomes in young women: a systematic review and meta-analysis. Hum Reprod Update.
  11. Jin P, Xie Y (2018). Treatment strategies for women with polycystic ovary syndrome. Gynecological Endocrinology.
  12. Kalra B, Kalra S, Sharma JB (2016) The inositols and polycystic ovary syndrome. Indian J Endocrinol Metab 20: 720–4.
  13. Bednarska S, Siejka A (2017) The pathogenesis and treatment of polycystic ovary syndrome: What’s new? Adv Clin Exp Med.
  14. Aswini R, Jayapalan S (2017) Modified Ferriman–Gallwey score in hirsutism and its association with metabolic syndrome. Int J Trichology.
  15. Kissling GE (2017) Statistical methods. In: The Clinical Chemistry of Laboratory Animals, Third Edition.
  16. Feng W, Jia YY, Zhang DY, Shi HR (2016). Management of polycystic ovarian syndrome with Diane-35 or Diane-35 plus metformin. Gynecol Endocrinol.
  17. Luque-Ramírez M, Nattero-Chávez L, Ortiz Flores AE, Escobar-Morreale HF (2018). Combined oral contraceptives and/or antiandrogens versus insulin sensitizers for polycystic ovary syndrome: A systematic review and meta-analysis. Hum Reprod Update.
  18. Jaganmohan C, Vannan M, Ali A, S P (2017) Evaluation of Clinical Efficacy of Metformin Therapy in Polycystic Ovary Syndrome. J Young Pharm.
  19. Pasquali R, Gambineri A (2013) THERAPY OF ENDOCRINE DISEASE: Treatment of hirsutism in the polycystic ovary syndrome. Eur J Endocrinol.
  20. Dardzińska JA, Rachoń D, Kuligowska-Jakubowska M, Aleksandrowicz-Wrona E, Płoszyński A, et al (2014) Effects of metformin or an oral contraceptive containing cyproterone acetate on serum C-reactive protein, interleukin-6 and soluble vascular cell adhesion molecule-1 concentrations in women with polycystic ovary syndrome. Exp Clin Endocrinol Diabetes.
  21. Cosma M, Swiglo BA, Flynn DN, Kurtz DM, LaBella ML, et al (2008). Insulin sensitizers for the treatment of hirsutism: A systematic review and metaanalyses of randomized controlled trials. Journal of Clinical Endocrinology and Metabolism.
  22. Morin-Papunen L, Vauhkonen I, Koivunen R, Ruokonen A, Martikainen H, et al (2003). Metformin versus ethinyl estradiol-cyproterone acetate in the treatment of nonobese women with polycystic ovary syndrome: A randomized study. J Clin Endocrinol Metab.
  23. Tao T, Wu P, Wang Y, Liu W (2018). Comparison of glycemic control and β-cell function in new onset T2DM patients with PCOS of metformin and saxagliptin monotherapy or combination treatment. BMC Endocr Disord.
  24. Celik O, Acbay O (2012) Effects of metformin plus rosuvastatin on hyperandrogenism in polycystic ovary syndrome patients with hyperlipidemia and impaired glucose tolerance. J Endocrinol Invest.
  25. Seyam E, Hefzy E (2018). Long-term effects of combined simvastatin and metformin treatment on the clinical abnormalities and ovulation dysfunction in single young women with polycystic ovary syndrome. Gynecol Endocrinol.
  26. Jamilian M, Farhat P, Foroozanfard F, Afshar Ebrahimi F, Aghadavod E, et al (2017). Comparison of myo-inositol and metformin on clinical, metabolic and genetic parameters in polycystic ovary syndrome: A randomized controlled clinical trial. Clin Endocrinol (Oxf).
  27. Fruzzetti F, Perini D, Russo M, Bucci F, Gadducci A (2017). Comparison of two insulin sensitizers, metformin and myo-inositol, in women with polycystic ovary syndrome (PCOS). Gynecol Endocrinol.
  28. Artini PG, Di Berardino OM, Papini F, Genazzani AD, Simi G, et al (2013). Endocrine and clinical effects of myo-inositol administration in polycystic ovary syndrome. A randomized study. Gynecol Endocrinol.
  29. V. T, D. R, V. I, S. DC, C. DF, et al (2017). Metformin vs myoinositol: which is better in obese polycystic ovary syndrome patients? A randomized controlled crossover study. Clin Endocrinol (Oxf).

CD44 cleavage product CD44-intracellular domain regulates gene transcription and tumorigenesis

DOI: 10.31038/CST.2019445

Abstract

CD44 is a multifunctional transmembrane glycoprotein that is expressed in many cancers and can regulate invasion and metastasis. CD44 can interact with a multitude of ligands to promote metastasis and invasion. CD44 is also a known cancer stem cell marker. Due to alternative splicing, CD44 can exist in multiple isoforms besides standard CD44 isoform. Recent studies have shown that CD44 can be proteolytically cleaved into CD44-intracellular domain (ICD). Specifically, this cleavage product ICD translocates into the nucleus to activate transcription of a variety of genes that are critical to inflammation, cell survival, glycolysis, and cancer metastasis.

Keywords

Cancer, Metastasis, CD44, CD44-ICD, Transcriptional Factor.

CD44 – Transmembrane Glycoprotein

CD44, a cell surface receptor for osteopontin (OPN) and hyaluronic acid (HA) and other ligands is known to play critical roles in cancer cell migration, invasion, and tumor growth [1-6]. Multiple isoforms of CD44 exists due to the insertion of alternative exons at the extracellular domain site [5]. CD44 is expressed ubiquitously and distributed widely in fetal and adult tissues with varying degrees of expression [7-9].

CD44-Intracellular Domain (ICD)

CD44 can undergo sequential proteolytic processing to create an intracellular domain (ICD) fragment that can translocate into the nucleus to regulate the expression of a few genes [10-18]. This sequential cleavage of CD44 to generate the ICD fragment can be first mediated by metalloproteases (MMPs) at the ectodomain portion to create a fragment known as CD44 extracellular truncation (EXT). Sequentially, cleavage by γ-secretase at the transmembrane domain generates the CD44-ICD fragment. This fragment is capable of translocating into the nucleus to regulate gene transcription [13, 18].

CD44-ICD Transcriptional Factor

CD44-ICD has recently been shown in several cancers as the main factor responsible for tumorigenic potential of the cells. Specifically, in prostate cancer, CD44-ICD was found to be associated with the master regulator of osteoblastogenesis RUNX2 to mediate the transcription of matrix metalloproteinase 9 (MMP-9) gene [24]. Additionally, CD44-ICD interacts with a novel consensus sequence in the promoter region of the MMP-9 gene to regulate its expression. Furthermore, CD44-ICD activates multitudes of genes involved in cell survival, tumor invasion, glycolysis, etc. in breast cancer cells [11]. Cleavage product CD44-ICD has also been shown to support the activation of stemness factors Nanog, Sox2, Oct4, thereby promoting tumorigenesis of breast cancer [19]. In thyroid cancer cells, CD44-ICD has been shown to trigger activation of the CREB transcription factor thus sustaining proliferative signaling [10]. Studies have also shown that CD44-ICD has the capability of regulating the transcription of CD44 itself [14]. In other cell types like chondrocytes, CD44-ICD release has been shown to exert a competitive effect on full-length CD44 function [20].

Conclusion

The multifunctional receptor CD44 is involved in a variety of functions ranging from aggregation to migration and metastasis. CD44 can interact with different ligands to elicit many cellular functions. Emerging studies have analyzed the role of CD44-ICD in mediating and promoting tumorigenesis. CD44-ICD upregulates and activates genes involved in invasion, migration, and tumorigenesis. Taken together, CD44-ICD could be a therapeutic target in cells, including cancer cells that express CD44.

References

  1. Senbanjo LT, Chellaiah MA (2017) CD44: A Multifunctional Cell Surface Adhesion Receptor Is a Regulator of Progression and Metastasis of Cancer Cells. Front Cell Dev Biol 5: 18.
  2. Interaction between CD44 and hyaluronan promotes bone metastasis (2013) Bonekey Rep 2: 402.
  3. Desai B, Ma T, Chellaiah MA (2008) Invadopodia and matrix degradation, a new property of prostate cancer cells during migration and invasion. J Biol Chem 283: 13856–13866.
  4. Desai B, Rogers MJ, Chellaiah MA (2007) Mechanisms of osteopontin and CD44 as metastatic principles in prostate cancer cells. Mol Cancer 6: 18.
  5. Cichy J, Puré E (2003) The liberation of CD44. J Cell Biol 161: 839–843.
  6. Draffin JE, Hill A, Johnston PG, Waugh DJ (2003) CD44 Expression on prostate cancer cells correlates with adhesion to bone marrow endothelial cells. Clinical Cancer Research 9: 6181s-6181s.
  7. Desai B, Ma T, Zhu J, Chellaiah MA (2009) Characterization of the expression of variant and standard CD44 in prostate cancer cells: identification of the possible molecular mechanism of CD44/MMP9 complex formation on the cell surface. J Cell Biochem 108: 272–284.
  8. Gupta A, Cao W, Chellaiah MA (2012) Integrin αvβ3 and CD44 pathways in metastatic prostate cancer cells support osteoclastogenesis via a Runx2/Smad 5/receptor activator of NF-κB ligand signaling axis. Mol Cancer 11: 66.
  9. Gupta A, Cao W, Sadashivaiah K, Chen W, Schneider A, Chellaiah MA (2013) Promising noninvasive cellular phenotype in prostate cancer cells knockdown of matrix metalloproteinase 9. ScientificWorldJournal 2013: 493689.
  10. De Falco V, Tamburrino A, Ventre S, Castellone MD, Malek M, Manié SN, Santoro M (2012) CD44 proteolysis increases CREB phosphorylation and sustains proliferation of thyroid cancer cells. Cancer Res 72: 1449–1458.
  11. Miletti-González KE, Murphy K, Kumaran MN, Ravindranath AK, Wernyj RP, Kaur S, Miles GD, Lim E, Chan R, Chekmareva M et al (2012) Identification of function for CD44 intracytoplasmic domain (CD44-ICD): modulation of matrix metalloproteinase 9 (MMP-9) transcription via novel promoter response element. J Biol Chem 287: 18995–19007.
  12. Takahashi N, Knudson CB, Thankamony S, Ariyoshi W, Mellor L, Im HJ, Knudson W: (2010) Induction of CD44 cleavage in articular chondrocytes. Arthritis Rheum 62: 1338–1348.
  13. Nagano O, Saya H (2004) Mechanism and biological significance of CD44 cleavage. Cancer Sci 95: 930–935.
  14. Okamoto I, Kawano Y, Murakami D, Sasayama T, Araki N, et al. (2001) Proteolytic release of CD44 intracellular domain and its role in the CD44 signaling pathway. J Cell Biol 155: 755–762.
  15. Okamoto I, Kawano Y, Tsuiki H, Sasaki J, Nakao M, et al. (1999) CD44 cleavage induced by a membrane-associated metalloprotease plays a critical role in tumor cell migration. Oncogene 18: 1435–1446.
  16. Murakami D, Okamoto I, Nagano O, Kawano Y, Tomita T, et al. (2003) Presenilin-dependent γ-secretase activity mediates the intramembranous cleavage of CD44. Oncogene  22: 1511.
  17. Okamoto I, Tsuiki H, Kenyon LC, Godwin AK, Emlet DR, et al (2002) Proteolytic cleavage of the CD44 adhesion molecule in multiple human tumors. Am J Pathol 160: 441–447.
  18. Senbanjo LT, AlJohani H, Majumdar S, Chellaiah MA (2019) Characterization of CD44 intracellular domain interaction with RUNX2 in PC3 human prostate cancer cells. Cell Communication and Signaling 17: 80.
  19. Cho Y, Lee HW, Kang HG, Kim HY, Kim SJ, et al. (2015) Cleaved CD44 intracellular domain supports activation of stemness factors and promotes tumorigenesis of breast cancer. Oncotarget 6: 8709–8721.
  20. Mellor L, Knudson CB, Hida D, Askew EB, Knudson W (2013) Intracellular domain fragment of CD44 alters CD44 function in chondrocytes. J Biol Chem 288: 25838–25850.

Vertebroplasty vs. SHAM for Treating Osteoporotic Vertebral Compression Fractures: A Double Blind RCT (VOPE)

DOI: 10.31038/IJOT.2019244

Abstract

Introduction: Osteoporotic Vertebral Compression Fractures (VCF) affects 20% of postmenopausal women and can lead to long-term disability.

The effect of Percutaneous Vertebroplasty (PVP) has been debated, since two double-blind RCTs was performed. Our purpose was to investigate the clinical effects of PVP compared with a SHAM procedure in acute osteoporotic VCFs focusing on VAS during activity.

Methods: 52 patients were included in the study, and randomized to either PVP or SHAM. 6 patients were excluded during the study, due to malignancy or need for further surgery. Patients, investigators collecting data, and the statisticians were blinded.

Results: 46 patients were eligible for statistical analysis, 22 patients in the PVP group and 24 patients in the SHAM group. In both groups the VAS-scores, and HRQL scores improved significantly from baseline values (p<0.05). There was a statistical significant higher VAS-score in the SHAM-group throughout the trial period (p=0.001), with main contribution from VAS at forward bending.

Conclusion: Our study shows statistical significant higher VAS-score in the SHAM group during the trial period, both groups improved significantly in all clinical parameters. However the limitations of the study and the data at hand do not provide sufficient evidence of the benefits of PVP for treating osteoporotic vertebral compression fractures. Focus in the future of PVP and acute VCFs must be on the 3 months convalescence period and the cost benefit analysis of early mobilization.

Introduction

Osteoporosis is a generalized disease of the bones defined by reduced bone mass. According to the WHO, osteoporosis is defined by bone mass 2.5 Standard Deviations (SD) below peak bone mass. Bone Mineral Density (BMD) can be measured by a DEXA-scan. The T-score indicates if BMD is above or below peak bone mass. A T-score < -2.5 is by definition, osteoporosis. Using this definition every third woman above 50 years old has osteoporosis [1,2].

Osteoporosis is seen in women twice as often than in men. The risk of having an osteoporotic fracture increases with age. Osteoporosis occurs due to age-related loss of bone mass and loss of bone mass caused by other life processes, most important of which is the reduced level of estrogen in postmenopausal women [3].

In many women, there is a general reduction in height caused by compression fractures in vertebral bodies. A vertebral fracture can cause back pain, a kyphotic deformity and reduce pulmonary function when they occur in the thoracic spine [4].

Percutaneous Vertebroplasty (PVP) involves the percutaneous injection of bone cement into fractured vertebrae. PVP is indicated for Vertebral Compression Fractures (VCFs) due to osteoporosis, metastatic disease, multiple myeloma or hemangioma. The method was developed in 1980s in France for the treatment of vertebral hemangiomas and osteolytic vertebral tumors [5]. Indications were later expanded to include osteoporotic VCFs [6]. The method is described safe, with very few complications and can be performed in general anaesthesia or local anaesthesia [6,7].

Worldwide 3 non-blinded RCTs has been performed, where the effect of PVP has been compared with conservative treatment [10,11,12] and 3 RCTs where PVP was compared with a sham-procedure, periostal injection of lidocaine [8,9,20]. All of these studies have investigated the effect on patients with osteoporotic VCFs. The non-blinded trial published by Voormolen et al where terminated after 2 weeks as most of the conservative patients crossed over to the PVP group [11].

The other non-blinded trial published by Rousing et al, included patients with acute back pain and VCF. They randomized between PVP and conservative brace treatment [12]. Significant pain relief was noted 4–24 hours postoperatively in PVP group. At 3 and 12 months follow-up there was no significant difference in pain level, physical performance evaluated by sit down testing, between the two treatment arms. The most recent non-blinded RCT published in 2016 involving 107 patients found significant pain relieve in patients with PVP acute osteoporotic VCFs compared with conservative treatment consisting of 2 weeks bed rest, optimal pain medication and prescription of physiotherapy [10].

The two RCTs by Buchbinder et al and Kalmes et al [8 ,9] showed no significant difference in pain relief between PVP and the sham-procedure, and not a substantial relief of pain in general. In the study by Kalmes [9] the patients included had a history of back pain up to 52 weeks, and a total of 131 patients included. Amount of PMMA cement injected was not recorded. In the study by Buchbinder [8] including 78 patients the patients were included both with and without edema present on the MRI scan and a VAS score at inclusion from 30–100.

The primary purpose of this study was to compare the Visual Analog Back Pain scores (VAS) [13] at rest and with during mobilization weekly during the first 12 weeks in a double-blind placebo-controlled RCT of PVP vs. SHAM for acute osteoporotic VCFs. Secondary outcome measures of interest were improvements in the EuroQOL-5D (EQ5D) [14] and the Short Form-36 Physical Composite Summary Scores (SF-36 PCS) [15] compared to baseline one year after the procedure.

Methods

Study Design

A double-blinded placebo-controlled RCT to determine the efficacy of PVP in patients with acute osteoporotic VCFs.

The study was approved by the regional Ethics Committee and was registered on clinicaltrials.gov (NCT#01537770). Trial protocol as approved by the ethics committee is displayed at the above mentioned NCT#. Partially funded by the Danish Rheumatism association.

Inclusion Criteria

Osteoporotic VCF from T5-L5, >70 in VAS at Inclusion, </= 8 weeks of back pain and a Magnetic Resonance Imaging Short Tau Inversion Recovery(MRI-STIR) sequence showing edema using a Philips Achieva 1.5 Tesla scanner, (Andover, MA).

Exclusion Criteria

Patients with a history of malignancy, age below 50 years, known allergy towards PVP components, dementia as determined on the MMSE [16], osteoporotic fractures of the long bones and those unable to consent were excluded.

Level of evidence: 1

Randomization was a block randomization design using 80 sealed envelopes (blocks of 20). Procedures were performed under local anaesthesia using the V-Max Mixing and Delivery System (DePuy Acromed). Subjects were placed prone on a Jackson table and Lidocaine was used to anesthetize the entry points. The 11-gauge needles were then inserted into the fractured vertebral body via the pedicles under fluoroscopic guidance and a biopsy specimen was taken. In all cases, bone cement was mixed to create the odor similar to a PVP-procedure. 2 ml of Lidocaine (10 mg/ml) was injected in the SHAM group. 2–4 ml of bone cement was injected in the PVP group.

VAS at rest and during forward bending was collected at enrollment, 6 hours postoperatively, weekly for the first 3 months and at 1 year.. A Danish version of SF-36 [15], EQ5D [14], data on pain medication use and standing full-length spine radiographs were collected at enrollment and at 3 and 12 months. Blood samples were also drawn and analysed to exclude infections and malignancies.

The primary investigator performed all screening procedures and follow-up examinations, and was blinded to the subject’s assigned treatment arm throughout the study period.

Statistical Analysis

Power analysis

Power calculation was performed to find a difference in VAS of 20(0–100) with SD of 0.20. A difference of 20 was chosen, as this was past the Minimal Clinical Important Difference (MCID) reported in other studies [17,18]. This resulted in a power calculation suggesting a minimum of 23 patients needed in each group. Our aim prior to enrolment was 40 in each group.

The statistical analyses were conducted in SAS version 9,4 (SAS institute, Carry, NC). Repeated measures ANOVA was used to determine differences in VAS between PVP and Sham group. Unpaired student’s t-test was used to compare continuous variables and Fisher’s exact test was used to compare categorical variables between groups.

Least-square Means and standard errors of pain scores from a numerical self-reported VAS on a scale of 0 to 100 were calculated from measures collected in two different positions – standing and bending forward – at pre-op, at 6 hours post-treatment (rest only), at week 1–12, and at one year post-treatment. A paired t-test or Wilcoxon signed rank test was used to test for differences between baseline and each subsequent time period. Multiple comparisons were adjusted using Tukey’s test.

Trends over time, by treatment group and by position are compared using a repeated measures mixed effects model, adjusted for timing past baseline, position (at rest or bending) and type of treatment administered(PVP or SHAM). An independent and blinded statistician performed the statistical analyses.

Results

A total of 342 potential subjects were referred to our outpatient clinic between 2011–2014 and were screened in order to find eligible patients to include in this study. All patients included signed an informed consent form to participate in a clinical trial, and that the data could be published in a blinded format. The patients were informed of the option of dropping out at any time without any reason needed.

The reasons for not enrolling 290 of the screened patients in the study were mainly that the time from symptom onset was exceeding the 8 week period, at the time they were referred to our clinic, and patients unwillingness to participate in a clinical trial. In total 52 patients were included. During the trial period 2 patients were excluded postoperatively due to malignant biopsies. 4 patients were excluded due to the need for further spine surgery. (Figure 1) No complications including cement leakage or infections occurred perioperative or during the postoperative period. 46 subjects were included in the final analyses; 24 in the Sham procedure and 22 in the PVP treatment. There were no differences in patient demographics and Bone Mineral Density t-scores between the two groups.

IJOT 19 - 124_Emil Jesper Hansen_f1

Figure 1.

Table 1. Patient Demographics.

Table 1

SHAM

PVP

p-value

Age (years)

69,33 (53–84)

70,59 (54–90)

0,309

Sex M/F

2/22

4/18

0,322

BMD T-score

-2,2 (0,24)

-2,7 (0,25)

0,875

No. Levels treated

28

27

0,932

New VCFs

5 (21%)

4 (19%)

0,688

Vertebral Levels

Th7-L5

Th6-L5

VAS and SE for each time period and position are shown in Table 2: VAS scores 12 months follow-up.

Table 2. Means and Standard Errors of VAS by treatment and Group and position.

Table 2

SHAM

PVP

Position

Mean(SE)

Means (SE)

Resting

Baseline

53,04 (4,35)

40,55 (4,55)

Hour 6

26,45 (4,82)

32,76 (5,07)

Week 1

21,13 (4,35)

24,52 (4,65)

Week 2

19,08 (4,35)

17,52 (4,65)

Week 3

13,87 (4,45)

13,57 (4,65)

Week 4

10,42 (4,35)

12,62 (4,65)

Week 5

10,17 (4,45)

11,81 (4,65)

Week 6

8,83 (4,35)

9,00 (4,55)

Week 7

8,29 (4,35)

10,52 (4,65)

Week 8

8,29 (4,35)

8,00 (4,65)

Week 9

8,04 (4,35)

6,82 (4,55)

Week 10

7,57 (4,35)

7,40 (4,77)

Week 11

7,21 (4,35)

6,17 (5,03)

Week 12

6,88 (4,35)

8,64 (4,55)

Week 52

16,04 (4,35)

16,06 (5,03)

Forward bending

Baseline

76,08 (4,35)

74,68 (4,55)

Week 1

41,83 (4,45)

26,80 (4,77)

Week 2

34,83 (4,45)

28,52 (4,65)

Week 3

28,83 (4,45)

17,81 (4,65)

Week 4

26,27 (4,55)

17,33 (4,65)

Week 5

27,14 (4,55)

14,33 (4,65)

Week 6

21,09 (4,45)

15,27 (4,55)

Week 7

19,26 (4,45)

13,62 (4,65)

Week 8

19,77 (4,55)

13,24 (4,65)

Week 9

15,87 (4,45)

10,00 (4,55)

Week 10

14,00 (4,65)

10,50 (4,77)

Week 11

16,48 (4,45)

9,50 (5,03)

Week 12

18,70 (4,45)

16,09 (4,55)

Week 52

30,67 (4,65)

28,35 (5,16

VAS; Visual Analog Scale 0 to 100

Table 3. Health-related Questionnaires.

Table 3

SHAM

PVP

p-value

SF36 PCS

Baseline

25,53 (4,64)

25,12 (6,86)

0,406

3 months

33,93 (10,56)

31,44 (10,03)

0,219

12 months

35,15 (11,92)

31,90 (9,19)

0,16

SF36 MCS

Baseline

44,29 (13,10)

42,00 (9,75)

0,255

3 months

51,4 (10,98)

49,7 (12,02)

0,318

12 months

53,60 (10,29)

48,60 (10,75)

0,063

EQ5D

Baseline

0,49

0,44

0,343

3 months

0,71 (0,23)

0,68 (0,23)

0,34

12 months

0,74 (0,22)

0,67 (0,27)

0,232

Penalized b-spline curves are shown in Figure 1 by treatment and position. The at-rest position had the lowest VAS regardless of treatment or time from baseline. Study participants in the PVP group had a faster drop in their bending VAS compared to the SHAM group.

There was a difference in treatment groups with the SHAM group having higher overall VAS (p=0.011). The VAS changes over time with highest levels experienced at baseline through week 3 and increasing moderately during follow-up (p<0.0001). Forward bending resulted in elevated VAS compared to the at-rest position (p<0.0001).

We were unable to detect a statistically significant difference between the VAS of the treatment groups at any measured time period within the same position. Before multiple comparison adjustment, there is some suggestion that the baseline VAS in the at-rest position differ by treatment (p = 0.0476).

While there was a significant difference from baseline through week 6 in the SHAM group and at baseline for the PVP group, only the PVP group difference remained significant once adjusted for multiple comparisons(adj-p=0.0002).

No statistical differences were found in SF-36 and EQ-5D scores between the two groups at 3 and 12 months follow-up in any of the parameters analysed.

At 0–12 weeks and at 12 month follow up there were a similar amount and frequency of opiods in the two groups.

Discussion

The debate whether the evidence for PVP in acute osteoporotic VCFs is sufficient enough to recommend it as a standard procedure is ongoing. We have focused on patients both at rest and during mobilization, and with a specific focus on the convalescence period the first 3 months after treatment; the latter is in contrary to the other studies on this subject. Thus a direct comparison between our results and the previous SHAM studies by Kalmes and Buchbinder, is difficult, due to the different study designs, the time of pain evaluation during the study, and the evaluation of pain at rest/ during mobilization. There are limitations to our study, the most important ones being the sample size. We did not succeed in our primary aim to include 40 patients in each group, and that weakens the study. Comparing with other studies of this patient group an intervention type, similar difficulties with sample-size and inclusion have been reported. We had a inclusion rate of about 16% (52/342), the Buchbinder et al. RCT had a 17% inclusion rate (52/500) and the Kalmes et al. RCT had a 13% rate (72/450).

We found in our study a significant higher VAS in the SHAM group throughout the follow up period (p=0.001) when applying ANOVA statistical model on our data. A study of the minimal clinically important difference in patient with acute pain was 9 mm (6–13; 95% CI) in VAS [18]. Other studies have shown a MCID on 13–30 mm, primarily in patients with chronic pain [17,19]. The maximum difference measured in our study is at week 3–5 in activity with differences of 9–13. The main contribution to the difference in VAS score were during mobilization and favours PVP treatment specifically in the first 1–12 weeks after treatment. By asking the patients of their back pain in the forward bending position, we resembled a patient moving from lying/sitting position to standing position, with axial load on the fractured vertebrae. A double blinded RCT published in 2016 by Clark et al. found PVP being a superior pain relieving agent compared with a sham procedure, which supports the trend found in our trial. However their sham treatment did not involve periostal infiltration and biopsies from the affected vertebral bodies [20], and their outcome measures regarding pain observation differed from our study and the studies by Buchbinder and Kalmes.

When comparing with the RCTs on PVP vs. SHAM by Buchbinder et al. and Kalmes et al. our findings are comparable when reviewing the Health related Quality of life questionnaires with no difference between the two groups. Our results however contradict in the VAS scores. The findings by Kalmes et al. who found no difference at any time point between the SHAM and PVP group within the first month. Similar the findings by Buchbinder et al. we are not significant between the groups within the first 6 months after surgery. There are several reasons for the difference in findings between the studies. In our opinion the main focus on the back pain in activity and the study design (differences described in the introduction section) is responsible for these differences in findings. It is remarkable that this study with fewer participants were able to detect a statistical significant difference.

Conclusion

This study set out to investigate whether PVP procedure has its relevance, in treating osteoporotic VCFs, compared with a SHAM procedure. Our study shows statistically significant difference in back pain primarily in forward bending causing significantly more pain in the SHAM group. In acute VCFs it is as well clinically relevant in the early convalescence period. Also, pain decreases over time, regardless of position or treatment and remains decreased from baseline. As suspected, there is no difference when the patients are at rest, with no axial force applied to the fractured vertebrae. With the limitations of this study and the data provided we cannot conclude if and how PVP has its place in treating osteoporotic VCFs. Out study has shown a trend towards a pain-relieving effect when patients are mobilised and applying axial force on the fractured vertebrae, and further studies with this focus and on the cost benefit of early mobilization are needed.

Funding

The study received funding from The Danish Rheumatism Association.

Trial Registration

The study was registered at clinical trials.org and approved by the National Ethics committee.

IJOT 19 - 124_Emil Jesper Hansen_f2

References

  1. Felsenberg D, Silman AJ, Lunt M et al. (2002) Incidence of vertebral fracture in Europe: results from the European Prospective Osteoporosis Study (EPOS). J Bone Mineral Res 17: 716–24.
  2. Curtis EM, Moon RJ, Harvey NC et al. (2017) The impact of fragility fracture and approaches to osteoporosis risk assessment worldwide. Bone 22: S8756–3282, 30024–8.
  3. Silverman SL, Minshall ME, Shen W et al. (2001) The relationship of health-related quality of life to prevalent and incident vertebral fractures in postmenopausal women with osteoporosis: results from the Multiple Outcomes of Raloxifene Evaluation Study. Arthritis Rheum 44: 2611–2619
  4. Suzuki N, Ogikubo O, Hansson T (2008) The course of the acute vertebral body fragility fracture: its effect on pain, disability and quality of life during 12 months. Eur Spine J 17: 1380–1390
  5. Galibert P, Deramond H, Rosat P et al. (1987) Preliminary note on the treatment of vertebral angioma by percutaneous acrylic vertebroplasty. Neurochirurgie 33: 166–8.
  6. McGraw JK, Lippert JA, Minkus KD et al. (2002) Prospective Evaluation of Pain Relief in 100 Patients Undergoing Percutaneous Vertebroplasty: Results and Follow-up. Journal of Vascular and Interventional Radiology 13: 883–6.
  7. Lee BJ, Lee SR, Yoo TY. Paraplegia as a complication of percutaneous vertebroplasty with polymethylmethacrylate: a case report. Spine 2002;27:E419-E422.
  8. Buchbinder R, Osborne RH, Ebeling PR et al.( 2009) A Randomized Trial of Vertebroplasty for Painful Osteoporotic Vertebral Fractures. N Engl J Med 361: 557–68.
  9. Kallmes DF, Comstock BA, Heagerty PJ et al. (2009) A Randomized Trial of Vertebroplasty for Osteoporotic Spinal Fractures. N Engl J Med 361: 569–79.
  10. Yang EZ, Xu JG, Huang GZ et al. (2016) Percutaneous Vertebroplasty Versus Conservative Treatment in Aged Patients With Acute Osteoporotic Vertebral Compression Fractures: A Prospective Randomized Controlled Clinical Study. Spine 41: 653–60.
  11. Voormolen MH, Mali WP, Lohle PN et al. (2007) Percutaneus vertebroplasty compared with optimal pain medication treatment: short-term clinical outcome of patients with subacute or chronic painful osteoporotic vertebral compression fractures. The VERTOS study. AJNR Am J Neuroradiol 28: 555–60.
  12. Rousing R, Hansen KL, Andersen MO et al. (2010) Twelve-Month Follow-up in Forty-Nine Patients With Acute/Semiacute Osteoporotic Vertebral Fractures Treated Conservatively or With Percutaneous Vertebroplasty: A Clinical Randomized Study. Spine 35: 478–82.
  13. Jensen MP, Karoly P, Braver S (1986) The measurement of clinical pain intensity: a comparison of six methods. Pain 27: 117–26.
  14. Sorensen J, Davidsen M, Gudex C et al. (2009) Danish EQ-5D population norms. Scand J Public Health 37: 67–74.See comment in PubMed Commons below
  15. Bjorner JB, Thunedborg K, Kristensen JS et al. (1998) The Danish SF-36 Health Survey: Translation and Preliminary Validity Studies. Journal of Clinical Epidemiology 51: 991–999.
  16. Folstein MF, Folstein SE, McHugh PR (1975) Mini Mental State. A practical method for grading the cognitive state of patients for the clinician. J Psychiatri Res 12: 189–198.
  17. Kelly AM (1998) Does the clinically significant difference in visual analog scale pain scores vary with gender, age, or cause of pain? Acad Emerg Med 5: 1086–90.
  18. Lee JS, Hobden E, Stiell IG (2003) Clinically important change in the visual analog scale after adequate pain control. Acad Emerg Med 10: 1128–30.
  19. Hägg O, Fritzell P, Nordwall A (2003) Swedish Lumbar Spine Study Group. The clinical importance of changes in outcome scores after treatment for chronic low back pain. Eur Spine J 12: 12–20.
  20. Clark W, Bird P, Gonski P et al (2016) Safety and efficacy of vertebroplasty for acute painful osteoporotic fractures (VAPOUR): a multicentre, randomised, double-blind, placebo-controlled trial. Lancet 388: 1408–1416.

Information and Experiences in Connection with Emergency Dental visits – an Exploratory Pilot Enquiry among Syrian Asylum-seeking Patients, Swedish Patients and Dental Staff

DOI: 10.31038/JDMR.2019242

Abstract

Objective

Sweden has received a large number of asylum-seeking individuals in recent years and many refugees are in need of urgent dental care. Refugees do not usually receive regular information about the Swedish dental-care system and its regulations upon arrival. The study was aimed to examine information and experiences associated with emergency dental care among newly arrived Syrian asylum-seeking patients in comparison with Swedish patients and to monitor how the dental staff perceived these two groups of patients. The hypothesis was that the Syrian patients lacked information about the Swedish dental-care system and that they were more dissatisfied with their emergency treatments.

Material and Methods

Two questionnaires for patients and therapists relating to information and experiences in connection with emergency dental visits were produced. The questionnaires were distributed consecutively and responded to by 96% of all involved patients and care- givers.

Results

Most Syrian patients reported receiving information before treatment and, in more than 60%, from friends and acquaintances. Over 90% of all patients had a good understanding of the information and the therapy discussion during treatment. The Syrian patients received less help with their reasons for treatment, were less satisfied with the treatment and experienced more fear. The therapists had greater difficulties in interpreting the Syrian patients’ fear, their satisfaction with treatment and whether or not their expectations were met.

Conclusion

In order to achieve a mutuality in the communication and understanding between the newly arrived refugee as a patient and the dental staff, it is important to provide accurate information about the Swedish dental care system to the refugee before the first dental care visit.

There is also a need for improved skills among the dental-care providers in communicating and interpreting patients from other countries and different cultures.

Keywords

Dental staff, emergency dental visit, experiences, information, newly arrived Syrian refugees

Introduction

Internationally, as a result of wars, conflicts and oppressions, there are currently large flows of refugees, where more than 65 million people are estimated to be on the run [1,2]. Sweden is one of the largest recipient countries in Europe for refugees from developing countries such as Syria, Afghanistan, Iran, Iraq and Somalia and, in 2015, more than 160,000 people applied for asylum in Sweden [3].

It has been found that refugees often are affected by health problems on arrival in new countries [ 4–6]. This includes oral-health problems such as caries, periodontitis, pathological changes in the mucous membrane and damage caused by violence and torture, as well as bad habits in relation to diet, oral hygiene and smoking [6,7]. The often long and exhausting travels with limited dental care facilities, that many asylum seekers undergo, can contribute to transform simple tooth problems to significantly greater [8]. Newly arrived refugees are therefore often in need of both dental and medical treatment soon after arrival, which is often a reason for them to seek emergency care [9,10].

Asylum seekers who have applied for a residence permit in Sweden are entitled to emergency dental care, but they are not eligible for the Swedish state dental-care support [11]. The emergency dental care is governed by a regulatory framework, which often limits the treatment options for asylum seekers. The Swedish National Board of Health and Welfare’s guidelines for acute or immediate dental care for these patients often involves treatment that addresses the acute problem but does not always include the complete treatment therapy [8,12]. Information about treatment regulations, when given in conjunction with emergency treatment, could be a setback for refugees, when their expectations do not match the treatment that can be offered by Swedish dentistry [13]. Further, different cultures’ views of oral health, what constitutes good treatment and what is socially acceptable, together with previous experiences and different ways of communicating  often creates insecurity, worry, anxiety and frustration for newly arrived refugees and this may ultimately contribute to misunderstandings, disagreements and conflicts [7].

The origin of this study was that the staff at a local public dental care clinic in a medium-sized city in the County of Västra Götaland, Sweden reported a working environment problem associated with the increasing number of acute treatment occasions in which newly arrived asylum-seeking refugees were the patients. The dental clinic is situated near one of Sweden’s largest refugee camps in the neighboring area. The problems experienced by the staff were that there were more disagreements and conflicts in connection with the emergency treatment of newly arrived refugees compared to Swedish patients. They usually occurred during information and therapy discussions but also during the treatment itself. According to the dental staff, the newly arrived refugees had a poor knowledge of the Swedish dental-care system, probably due to the absence of dental- care information in the introductory information from the Migration Board, which in turn created uncertainty and frustration among these patients when it came to emergency dental therapy and treatment.

In order to examine what happens during treatment, a decision was made to study the largest group of adult refugees with a more common background than from just one country. The aim was to obtain a better understanding and easier interpretation of the language and a better comparison of the refegees experiences with the experiences of the Swedish patients and the treatment staff. Syrians constituted the largest group of asylum- seeking refugees both at the public dental clinic and at the nearby refugee camp, where about 50–60% of its residents were Syrians. More than 50,000 Syrian refugees sought asylum in Sweden in 2015 [5]. Before the democracy conflict and war began in Syria in 2011, the country had a relatively well- functioning educational system,    as well as health- and dental-care systems [14,15]. This implies that adult Syrians have a relatively high literacy level and also often have previous experience of both medical and dental care in Syria.

The aim of this study was to examine the frequency of information obtained about Swedish dental care before an emergency dental treatment session among newly arrived Syrian asylum-seeking patients and Swedish patients. Further, to examine the frequency and understanding of information and therapy discussions and to examine experiences of treatments during emergency visits among newly arrived Syrian asylum- seeking patients, Swedish patients and the treating staff. The hypothesis was that the Syrian patients received information to a lesser degree and were more dissatisfied with the treatments compared with Swedish patients.

Material and Methods

Participants

The study participants were two groups of patients who received emergency dental treatment, at a public dental-care clinic and the attending dental staff.

The study group consisted of 85 newly arrived adult asylum-seeking refugees from Syria. Asylum seekers are by definition individuals who are not resident in Sweden but who have applied for a residence permit and have stated the reason for fleeing in their application [16]. Adult Swedish patients formed the comparison group with 88 individuals. Finally, the dental staff group included dentists (n = 10), dental hygienists (n = 10) and dental nurses (n = 16) who worked in teams in different constellations during the patient treatments.

The patients were asked consecutively to participate in the study and the common inclusion criterion for both patient groups was adult patients aged > 25 years, as the dental- care system in the County of Västra Götaland involves free dental care up to the age of 24 years for both Swedish citizens and asylum-seeking refugees. Further inclusion criteria for the Syrian patients were: i) asylum-seeking individuals with a valid LMA card (law on the reception of asylum seekers) [17], ii) resident in Sweden for up to two years and iii) Arabic speaking and literate. The additional inclusion criteria for the Swedish control group were: i) Swedish citizen with a Swedish social security number and ii) Swedish speaking and literate. For the dental staff, the inclusion criteria were attendance during the main part of the emergency dental treatment, including the odontological history uptake for the current patients.

Measures

Two questionnaires, one for the patients and one for the dental staff, were produced and designed for this study. Each questionnaire comprised 14 questions with closed answers, where nine questions were the same for both patients and therapists. The questionnaires explored the areas of background data (gender and age), previous information about Swedish dental care, reason for emergency treatment, information, understanding, treatment and the overall impression of the visit. The patients answered the questionnaires individually, but the dental staff answered the questionnaires at theme level, where the therapists gave an overall assessment in each staff-constellation group for each patient.

For the Syrian patients, translations of the written questionnaire and the information consent were made in Arabic. In the translation process [18], the questionnaire and the information were translated into Arabic by a bilingual dentist and then translated back into Swedish by two other bilingual people to verify its compatibility with the original version. For the Swedish patients and the dental staff, the questionnaires were written and answered in Swedish. Prior to the present investigation, a qualitative pilot study of the questionnaires and study information was conducted, after which small adjustments were made.

Data collection

The data collection took place in March-August 2015. In meeting the inclusion criteria and after informed consent, both patients and therapists responded to the questionnaires after the treatments, the patients in a secluded place in the waiting room and the therapists in the treatment room. The completed questionnaires were then left in a locked box. The questionnaires were coded to be able to connect the patient and therapist answers and to distinguish between different patient and therapist group answers in the analyses.

Data processing

The collected data were analyzed using the Statistical Package for the Social Sciences, SPSS version 23.0 statistical program. Descriptive statistics, the chi-square test with Pearson’s correlation and the t-test were used in the statistical analysis to describe background data such as gender and age and to compare different group responses to the questionnaires.

The significance level for all statistical tests was set at p ≤ 0.05.

A power calculation was not possible to implement before the study start, as the questionnaires were newly constructed and untested and due to absence of prior experiences in the research field.

Ethical Considerations

The study was approved by the Local Human Ethics Committee in Gothenburg (Dnr:  854–14). The authors of the study established an ethical approach according to the World Medical Association, 2017 [19]. The patients and therapists were informed both verbally and in writing about the purpose and organization of the study and that the study was voluntary, which meant that the participants could withdraw their participation at any time, without giving any reason or explanation. Consent to the study was requested and given. All the collected data were treated confidentially and the patients’ identities were not known to anyone other than the treatment staff. The collected data are stored at the R&D Center for primary health care and will be kept there for 10 years.

Results

A total of 88 Syrian patients and 92 Swedish patients were asked for participation in the study. The small dropout of three Syrian and four Swedish patients occurred in connection with the participation request and was mainly due to personal reasons for not wanting to answer the questionnaire. Thus, the study included 85 Syrian and 88 Swedish patients. There were significantly more women in the Syrian patient group (73% vs. 41%, x2 = 22.22, p < 0.001) and the Syrian patients were significantly younger than the Swedish patients (mean age 39.8 yr, SD 14.42 vs. 51.8 yr, SD 14.04, t = –5.27, p < 0.001).

Differences were shown between the two groups of patients in the way they had received information about Swedish dental care before the visit, but also if they had received any information at all (Table 1). Most of the Syrian patients, 95%, reported that they had received information in some way, mainly through verbal information from friends and acquaintances, while 15% of the Swedish patients reported no information at all.

Table 1. The Syrian and Swedish patients’ reported ways of receiving information about Swedish dental care.

Ways of receiving information

Syr pat
n = 77
%

Swe pat
n = 79
%

x2

P-value

Through the media

7

28

21.32

0.000

From an organization

25

34

6.39

0.040

By verbal communication from family or friends

63

23

21.57

0.000

Not received any information

5

15

7.91

0.005

Pearson’s chi-square test (p ≤ 0.05), ns = not significant
Syr pat = Syrian patients, Swe pat = Swedish patients

The main reason for the emergency dental visit (Table 2) among Syrian patients was reported to be “pain and aching”, while the Swedish patients reported “a broken tooth or filling”. The therapists’ understanding of the patients’ reasons for the emergency dental visit showed high consistency with the patients’ reports and there were no significant differences between the patients’ and therapists’ answers at group levels or in the matched pair answers (Wilcoxon signed-rank test).

Table 2. The Swedish and Syrian patients’ reported reasons for their emergency dental visit and the therapists’ reported perceptions of the patients’ reasons for the visit.

JDMR-19-128-Mersiha Velic_Sweden_F1

The questionnaire contained multiple-choice answers. Pearson’s chi-square test (p ≤ 0.05), ns = not significant
Syr pat = Syrian patients, Swe pat = Swedish patients, Ther Syr = therapists for Syrian patients, Ther Swe = therapists for Swedish patients.

When comparing the Syrian and Swedish patients’ experiences during treatment (Table 3), the Syrian patients reported that they received as much information (70%) as therapy discussion (69%) in connection with the visit, while Swedish patients received therapy discussion to a greater extent (84%) but obtained information to a lesser extent (44%). More than 90% of all the patients in both groups reported that they understood the information and therapy discussion during treatment. About one third of the Syrian patients used an interpreter and a close friend accompanied another third. The Syrian patients experienced more fear during treatment (37%) than the Swedish patients (19%). They also reported less help with what they were searching for and a lower level of satisfaction. Over 80% in both patient groups reported that their expectations of the emergency dental treatment were fulfilled.

Table 3. Comparison between Syrian and Swedish patients and the patients’ and treatment staff’s reported experiences during emergency dental visits.

JDMR-19-128-Mersiha Velic_Sweden_F2

Pearson’s chi-square test (p ≤ 0.05), ns = not significant
Syr pat = Syrian patients, Swe pat = Swedish patients, Ther Syr = therapists for Syrian patients, Ther Swe = therapists for Swedish patients

The main differences in the patients’/therapists’ reported experiences (Table 3) were the therapists’ greater uncertainty about Syrian patients when it came to the understanding of information and therapy discussion and whether the patients received help or were satisfied with the treatment. However, the therapists expressed no uncertainty, but they did not perceive the Syrian patients fear to the same extent as they did in the Swedish patients. In the overall perception of the emergency dental treatment, the therapists did not realize the degree of fulfilled expectations among Syrian patients, as 43% of the therapists reported that they were unsure. Only at the last question, if  the  patients’  expectations  were  met, the Wilcoxon Signed-Ranks Test indicated significant differences in the paired patient-therapist-answers. Both Syrian and Swedish patients were more satisfied with the treatment, than their therapists experienced (Syrian patients Z = 2.81, p<0.005, Swedish patients Z = 2.11, p<0.035).

Discussion

Contrary to what the hypothesis predicted, most Syrian patients reported receiving information about the Swedish dental-care system before treatment, but the information was mostly verbally given by friends and acquaintances. The quality of this information was not investigated in this study.

When information is spread verbally from person to person, there is a risk that it will change and become incorrect and outdated. In order to be able to trust the information, it is important that it is transferred correctly and consistently in accordance with laws and regulations and under controlled conditions [20]. By providing newly arrived individuals with correct information, patients are given the opportunity to access the information before treatment. This makes it possible to create a better understanding and more relevant expectations, as well as to reduce the stress before treatment [20,21].

This could in turn result in fewer feelings of disappointment, sadness and frustration in connection with the therapy discussion and treatment situation when the patient may also suffer acute discomfort, often including pain. For therapists, this can lead to less stressful therapy discussions and treatments and create more stable working situations which, in turn, promotes a better relationship and cooperation with patients and reduces the risk of conflict experiences [22,23].

The hypothesis that Syrian patients were less satisfied with the emergency dental treatments compared with Swedish patients was proven. However, unlike what the therapists experienced, the results also showed that patients’ expectations were mostly met. This reflects one of the main findings of the study, i.e. that the dental staff reported more difficulties interpreting the Syrian patients’ experiences.

One possible reason for the staff’s difficulties interpreting the Syrian patients may be language barriers and/or different ways of expressing thoughts and feelings in terms of both verbal and non-verbal communication. Other possible reasons could be cultural differences in terms of dealing with pain and stress [23,24] or in front of officials, where the level of hierarchy is different. In Sweden, the hierarchical structure is not as powerful as in many other countries, especially in Asian countries, where people tend to accept and act without questioning [25,26]. Swedish patients have more knowledge of their rights and are more used to and comfortable about having to discuss treatment with a therapist. The Swedish Co- determination Act says that therapists are responsible for informing the patient and enabling him/her to participate in the treatment and the decision-making. According to the law, care must be patient focused, equal, safe and conducted in consultation with and with respect for the patient’s self-determination and integrity [25,27]. For many newly arrived individuals, these rights and opportunities for self-influence are a new way of thinking and acting to which they need to relate. Within many cultures, there are also hierarchical differences between the sexes that may involve both culture and religion, where men may have problems respecting and being subordinate to women, such as female dentists, or that women only wish to be treated by other women [7,26,27].

Other constraints, which tend to create gaps in perception, could be the limited time frame for the treatment. In many cases, the therapist works under stress and does not have time to dedicate him/herself fully to the patients [ 28–30]. The staff may also experience difficulties giving information about the limitations in the Swedish dental-care system regarding the treatment of adult asylum seekers, which includes therapy restrictions. This perhaps reflects not only a uncertainty about the interpretation of the patients but also discomfort about making the patients disappointed and anxiety about creating a conflict.

Interestingly, the therapists’ difficulties interpreting Syrian patients also appeared when they did not perceive the fear of these patients during treatment to the same extent as they did with the Swedish patients. This could be due to different ways of expressing fear in different cultures [15,29,30]. It could also reflect the fact that the therapists often lack experiences of being on the run and understanding the stress and fears encountered during the flight. This result indicates that there is a need for further investigations.

Non-tangible assets within Swedish dentistry are the many individuals of foreign descent who work there. The skills and expertise among the staff are not always utilized, but they could be an asset if they convey knowledge and information about their own country of origin and its culture and provide help in interpreting patients. All patients, especially new arrivals, are entitled to an interpreter. Access to an interpreter can be crucial in order to fulfill the right to equal treatment, patient safety and quality of care. Patients’ rights to an interpreter in dental care are not directly stated in the Swedish Dental Care Law or the Patient Act [28,31]. On the other hand, the legislation supports the use of interpreters [9,28].

There may be several possible reasons why the majority of all the patients reported a good understanding of information and the therapy discussion and why the therapists reported a good understanding of the patients’ reasons for seeking emergency care. As an aid to the translation between the Arabic and Swedish languages, interpreters, accompanying close friends or bilingual dentists were used. It should be noted that many adult Syrians are able to master the English language.

The limitations of the study relates to the relatively small sample with only Syrian patients in the study group and not all refugee patients at the clinic and the fact that the study took place at only one dental clinic. The two new survey instruments designed for this study had not been tested before in terms of their validity and reliability.  It was therefore not possible to perform a power calculation prior to the start. The authors were aware that an untested questionnaire and a small study sample could result in difficulty obtaining the correct information and to generalize the results. We therefore regard this study as a preliminary exploratory enquiry.

The strength of the study was the small number of missing participants and that, according to our knowledge, no similar study has been conducted previously. From a patient and therapist perspective, the outcome of the study could contribute to a better understanding of the importance of information and different experiences, which points to the need for greater knowledge and training for dental staff in terms of interpretation and communication with individuals from other cultures but also of the impact different cultures have on health care. This could lead to a better understanding, better treatment and increased professionalism, which could in turn affect the efficacy of treatments and rehabilitation.

Conclusion

Syrian refugees as patients are often more satisfied with the emergency dental treatment than the therapists realize and most likely, this conclusion could also apply to refugees from countries other than Syria. Needs have been identified when it comes to the importance of providing correct, consistent information about the Swedish dental-care system to asylum- seeking refugees at an early stage after arriving in Sweden. By extension, needs have also been identified when it comes to the importance of educating dental staff in cultural meetings and communication, as well as increasing their knowledge of different conditions in other countries and cultures.

Acknowledgement

The authors are grateful to all the patients and dental staff who participated in the study. Special thanks go to the clinic manager Sigrid Nilsson, who enthusiastically made it possible to conduct this study at the dental clinic. The study was supported economically and scientifically by R&D Primary Health Care in Västra Götaland.

References

  1. WHO (2017) Refugee and migrant health. World Health Organization Geneva, USA.
  2. UNHCR (2017) Figures at a Glance – Statistical Yearbooks. United Nations High Commissioner for Refugees, the UN Refugee Agency.
  3. https://www.migrationsverket.se/download/18.7c00d8e6143101d166d1aab/1485556214938/Inkomna%20ansökningar%20om%20asyl%202015%20-%20Applications%20for%20asylum%20received%202015.pdf
  4. Kreps GL, Sparks L (2008) Meeting the health literacy needs of immigrant populations. Patient Educ Couns 71:  328–332.
  5. The National Board of Health and Welfare (2015) Psykisk ohälsa hos asylsökande och nyanlända migranter. [Mental illness of asylum seekers and newly arrived migrants]. 2015. In Swedish. Available from https://www.socialstyrelsen.se/globalassets/sharepoint-dokument/artikelkatalog/kunskapsstod/2015-1-19.pdf.
  6. Keboa MT, Hiles N, Macdonald ME (2016) The oral health of refugees and asylum seekers: a scoping review. Globalization and Health 12: 59.
  7. Smith A, MacEntee MI, Beattie BL (2013) The influence of culture on the oral health- related beliefs and behaviours of elderly chinese immigrants: a meta- synthesis of the literature. J Cross Cult Gerontol 28:  27–47.
  8. Van Berlaer G, Bohle Carbonell FB, Manantsoa S (2016) A refugee camp in the centre of Europe: clinical characteristics of asylum seekers arriving in Brussels. BMJ Open 6: e013963.
  9. The National Board of Health and Welfare. Hälso- och sjukvård och tandvård till asylsökande och nyanlända. [Healthcare and dental care for asylum seekers andnew arrivals]. 2016. In Swedish. Available from: https://www.socialstyrelsen.se/globalassets/sharepoint-dokument/artikelkatalog/ovrigt/2016-10-13.pdf.
  10. Ay M, González PA, Delgado RC (2016) The perceived barriers of access to health care among a group of non- camp Syrian refugees in Jordan. Int J Health Serv 0: 1- 24.
  11. The Swedish Migration Agency. Health care for asylum seekers. 2017. Available from: https://www.migrationsverket.se/English/Private-individuals/Protection-and-asylum-in-Sweden/While-you-are-waiting-for-a-decision/Health-care.html
  12. The National Board of Health and Welfare. Vilken vård  ska  ett  landsting  erbjuda asylsökande och papperslösa. [What care  should  a  country  council  offer asylum seekers and paperless]. 2017. In Swedish. Available from: https://www.socialstyrelsen.se/stod-i-arbetet/asylsokande-och-andra-flyktingar/halsovard-och-sjukvard-och-tandvard/erbjuden-vard/
  13. Beiruti N, van Palenstein, Helderman WH (2004) Oral health in Syria. Int Dent J  54:  383–388.
  14. United Nations High Commissioner for Refugees. Situation Syrian Regional Refugee Response. 2017. Available from http://data.unhcr.org/syrianrefugees/ regional.php
  15. World Health Organization. Refugee and migrant health; Definitions. 2017. Available from http://www.who.int/migrants/about/definitions/en/ .
  16. The Swedish Migration Agency. LMA card for asylum seekers. 2017. Available from https://www.migrationsverket.se/English/Private-individuals/Protection-and-asylum-in-Sweden/While-you-are-waiting-for-a-decision/LMA-card.html.
  17. Guillemin F, Bombardier C, Beaton D (1993) Cross-cultural adaptation of health- related quality of life measures: literature review and proposed guidelines. J Clin Epidemiol 46:  1417–1432.
  18. Swedish guvernement. Lag (2003:460) om etikprövning av forskning som avser människor. [Act (2003:460) concerning the Ethical review of research involving humans]. 2003. Available from
  19. https://www.riksdagen.se/sv/dokument-lagar/dokument/svensk- forfattningssamling/lag-2003460-om-etikprovning-av-forskning-som_sfs-2003- 460.
  20. Wångdahl J. Uppfattningar om arbetet med hälsoundersökningar för asylsökande. [Perceptions about the work with health examinations for asylum seekers]. In Swedish. Uppsala University; 2014. Sweden. Available from http://uu.diva-portal.org/smash/get/diva2:744594/FULLTEXT01.pdf.
  21. Bischoff A, Bovier PA, Rrustemi I (2003) Language barriers between nurses and asylum seekers: their impact on symptom reporting and referral. Soc Sci Med 57:  503–512.
  22. Campbell SM, Roland MO, Buetow SA (2000) Defining quality of care. Soc Sci Med 51: 1611–1625.
  23. Sofaer S, Firminger K (2005) Patient perceptions of the quality of health services. Annu Rev Public Health 26:  513–559.
  24. Schouten BC, Meeuwesen L (2006) Cultural differences in medical communication: a review of the literature. Patient Educ Couns 64:  21–34.
  25. Kotthoff H, Spencer-Oatey H (2007) Chapter 3: Cognitive pragmatic perspective on communication and culture. In: Žegarac VA (ed.), Handbook of Intercultural Communication. Berlin Germany: Mouton de Gruyter Pg No:  31–53.
  26. Wångdahl J, Lytsy P, Mårtensson L (2015) Health literacy and refugees’ experiences of the health examination for asylum seekers – a Swedish cross-sectional study. BMC Public Health 15: 1162.
  27. The Swedish National Board of Health and Welfare. Föreskrifter och allmänna  råd om hälsoundersökningar av asylsökande m.fl. (SOSFS 2011:11). [Regulations and general advices on health assessment of asylum seekers and others]. 2011. In Swedish. Available from https://www.socialstyrelsen.se/globalassets/sharepoint-dokument/artikelkatalog/foreskrifter-och-allmanna-rad/2013-9-5.pdf.
  28. Karlberg GL, Ringsberg KC (2006) Experiences of oral health care among immigrants from Iran and Iraq living in Sweden. Int J Qual Stud Health Well-being 1:  120–127.
  29. Iliadi P (2008) Refugee women in Greece: a qualitative study of their attitudes and experience in antenatal care. Health Sci J 2:  173–180.
  30. Langan- Fox J, Cooper CL (2011) Chapter 7: Occupational stress among dentists. In: Moore R (ed.), (Part I), Handbook of stress in the occupations. Cheltenham UK: Edward Elgar publishing. Pg No:  109–134.
  31. The National Board of Health and Welfare. Tolkar för hälso- och sjukvården och tandvården. [Interpreters for healthanddentalcare]. 2016. In Swedish.Available from https://www.socialstyrelsen.se/globalassets/sharepoint-dokument/artikelkatalog/ovrigt/2016-5-7.pdf.

Three-Dimensional Analysis of Digital Models Generated from Intraoral, Extraoral, and CBCT Scanning Devices

DOI: 10.31038/JDMR.2019241

Abstract

Objective: To compare the intra- and inter-arch accuracy of three-dimensional (3D) digital models acquired from various orthodontic scanners, including: an intraoral scanner, an extraoral scanner, and a cone beam computed tomography (CBCT) scan compared with the original, trimmed stone models.

Methods: Fifteen sets of maxillary and mandibular finished plaster models were scanned using: Carestream 3600 intraoral scanner, Ortho-Insight 3D Motion View extraoral scanner, and Carestream 9300 CBCT scanner. Dolphin Imaging software was used to calculate various anatomic measurements on the digital models. Digital calipers were used to calculate the same measurements on the original plaster models for comparative purposes. Intraclass Correlation Coefficients (ICC) and pair-wise analysis of variance (ANOVA) were utilized to compare the 4 methods (original plaster models and 3 scanning methods).

Results: ICC values for all intra-arch measurements between the 4 data groups were all >0.90. ICC values for the two inter-arch measurements (overbite and overjet) were both 0.79. CBCT measurements were significantly smaller than the two scanned models as well as the stone models for many intra-arch parameters. On average, these differences were less than 0.5mm.

Conclusion: Digital models produced from CBCT scans of plaster casts appear to have adequate accuracy for orthodontic treatment planning and recordkeeping. Further studies are needed to determine the clinical efficiency of appliance design, fabrication, and chairside delivery using CBCT scanning technologies.

Keywords

digital models, scanning devices, accuracy and reliability

Introduction

Historically, plaster study models have been considered the gold standard in orthodontic patients recordkeeping [1]. Study models are valuable diagnostic tools as they allow clinicians to evaluate dental crowding and occlusal contacts, perform measurements such as the Bolton discrepancy analysis, and examine hard and soft tissue structures of the dental arches. Digital study models have become increasingly popular in both private practice and academic institutions for orthodontic treatment planning purposes [2]. Reported benefits of digital models compared to traditional stone models include: improved methods of storing digital files, simplified measurements and analysis with orthodontic software, protection from damage, and ease of retrieval and exchange with collaborating professionals [3,4]. For these reasons, many new digital model systems have been developed and are readily available in the orthodontic marketplace today.

There are two primary scanning methods of acquiring digital models for orthodontic purposes: intraoral and extraoral (Figure 1). Historically, intraoral scanners have utilized handheld wands, which reflect laser images from tissue structures and produce three-dimensional (3D) renderings using triangulation, confocal imaging, and/or accordion fringe interferometry sensors [5,6]. More recently, intraoral scanners have seen an improvement in overall scan times, stemming from the advancement of trinocular 3D in-motion video technology. This new approach uses laser and Light Emitting Diode (LED) emissions to obtain a high definition video recording of intraoral structures that produce a more rapid, real-time image of the target [5]. Extraoral scanners, however, utilize 3D laser surface scanning technology with rotating bases to generate a digital model file [7]. Flugge et al. [8] evaluated intraoral and extraoral scanning accuracy and found more accurate results with the extraoral scanner compared to the intraoral scanner. The authors concluded that both scanning systems, however, yielded clinically acceptable models for orthodontic treatment planning purposes [8]. In a systematic review of the accuracy of digital models compared to traditional plaster models in orthodontics, Rossini et al. [1] concluded that digital models generated from intra- and extraoral scanning systems are equally reliable when compared to stone models in terms of accuracy and reproducibility.

JDMR-19-126-Ahmed Ghoneima_USA_F1

Figure 1. A. Sample image of a stone (plaster) model. B. Sample image scanned with the Carestream 3600 intraoral scanner. C. Sample image scanned with the Ortho-Insight 3D Motion View extraoral scanner. D. Sample image scanned with the Carestream 9300 CBCT machine.

The use of Cone-Beam Computed Tomography (CBCT) scans is becoming more commonplace in the orthodontic specialty [9]. CBCT has broad clinical applications, which include the scanning of the craniofacial region for orthodontic imaging of teeth, bone, and airway structures. In recent years, manufacturers have introduced the ability to use CBCT scanning of dental products including alginate impression materials. The CBCT scan can then be used to generate 3D renderings of the teeth and dentoalveolar structures for orthodontic records. Kim et al. [10] evaluated the accuracy of digital models derived from alginate impression materials and found that the resulting digital renderings produce clinically acceptable results for orthodontic diagnostic purposes. More recently, companies have expanded the capability and marketing of CBCT scanners to produce digital replications of bite registration materials and plaster and stone models (Figure 1). The aim of this study was to compare the intra- and inter-arch accuracy of 3D digital models acquired from various orthodontic scanners, including: an intraoral scanner, an extraoral scanner, and a CBCT scan compared with the original trimmed stone models in order to evaluate their reliability and clinical validity. The null hypothesis tested was that no significant differences exists between measurements obtained from stone models and those generated from intraoral scanner, extraoral scanners, and CBCT scans.

Methods

In this retrospective cast analysis study, the final models of completed orthodontic cases were used as the basis for data collection. The study was approved by the Institutional Review Board at Indiana University Purdue University at Indianapolis (IRB #1708600071). Fifteen sets of maxillary and mandibular finished plaster models were obtained from the Indiana University School of Dentistry Orthodontic Clinic archives. Inclusion criteria for the models consisted of: 1) post-treatment, finished orthodontic models, 2) trimmed to ABO standards, 3) absence of any chips or voids in the stone.

Each set of models was scanned using the: Carestream 3600 intraoral scanner (Carestream Dental®, Atlanta, GA); Ortho-Insight 3D Motion View (Motion View Software LLC, Chattanooga, TN) extraoral scanner, and Carestream 9300 CBCT (Carestream Dental®, Atlanta, GA). The CBCT scan utilized a 9cm field of view, 0.4mm voxel size, and 8.9s scan time. Models were scanned resting on their trimmed bases for inter-arch measurement analyses. Each de-identified and coded scanned model was imported into the Dolphin Imaging software (version 11.9 premium; Dolphin Imaging & Management Solutions, Chatworth, CA). Intraoral and extraoral scanned models were uploaded under the .STL file type. CBCT models were uploaded under the .DICOM (Digital Imaging and Communications in Medicine) file type for analysis. The digitizing software features on Dolphin Imaging were used to calculate various anatomic measurements on the digital models (Table 1). Digital calipers (Pittsburgh®, Camarillo, CA) with a reported accuracy of ±0.02mm were used to calculate the same measurements on the original plaster models for comparative purposes.

Table 1. Anatomical measurements with border specifications.

Measurement (mm)

Specifications
Linear distance measured from the:

Maxillary Intermolar Width (MxIMW)

Mesiolingual cusp tip of the right and left first maxillary molars

Mandibular Intermolar Width (MdIMW)

Mesiolingual cusp tip of the right and left first mandibular molars

Maxillary Intercanine Width (MxICW)

Cusp tips of the maxillary left and right canines

Mandibular Intercanine Width (MdICW)

Cusp tips of the mandibular left and right canines

Upper Right Central Incisor Crown Height (UR1H)

Incisal edge to the gingival margin of the maxillary right central incisor measured at the midpoint of the mesio-distal dimension of the crown

Lower Right Central Incisor Crown Height (LR1H)

Incisal edge to the gingival margin of the mandibular right central incisor measured at the midpoint of the mesio-distal dimension of the crown

Upper Right First Premolar Crown Width (UR4W)

Mesial marginal ridge to the distal marginal ridge at the midpoint of the buccal-lingual dimension of the crown

Lower Right First Premolar Crown Width (LR4W)

Mesial marginal ridge to the distal marginal ridge at the midpoint of the buccal-lingual dimension of the crown

Maxillary First Molar to Midline (UR6Mid)

Mesiobuccal cusp tip of the maxillary right first molar to the maxillary dental midline

Mandibular First Molar to Midline (LR6Mid)

Mesiobuccal cusp tip of the mandibular right first molar to the mandibular dental midline

Overjet

Mesiodistal midpoint of the facial aspect of the mandibular right central incisor to the mesiodistal midpoint of the lingual aspect of the maxillary right central incisor in centric occlusion

Overbite

Mesiodistal midpoint of the incisal edge of the maxillary right central incisor to the mesiodistal midpoint of the incisal edge of the mandibular right central incisor in centric occlusion

Prior to initiation of the study, the primary investigator (S.R.) performed a reliability assessment including all measurements outlined in Table 1 using 5 digital models on Dolphin Imaging, as well as 5 corresponding stone models using digital calipers. Measurements were then repeated after 10 days. Intraclass Correlation Coefficients (ICC) were calculated to statistically analyze the intrarater reliability. ICC values greater than or equal to 0.90 were considered acceptable.

For each of the parameters in Table 1, analysis of variance (ANOVA) was used to compare the 4 methods (original plaster models and 3 scanning methods). The ANOVA testing included a fixed effect for method and random effects to allow correlation among measurements from the same model; the random effects allowed the pair-wise correlations among the 4 methods to differ. Pair-wise comparisons between the methods were made using Fisher’s Protected Least Significant Differences to control the overall significance level at 5%. Confidence intervals for the differences between methods were also provided to examine non-significant differences for evaluation of equivalence between methods. ICCs for the measurements from the original plaster models with each of the scanning methods were also calculated.

With a sample size of 15 models, the study had a 90% power for an equivalence test comparing the scanned measurements against the original plaster model for each intra-arch parameter, assuming a 5% significance level for each test, standard deviation of the differences between methods of 0.15mm, and an equivalence range of +/- 0.15mm.

Results

ICC values for the reliability assessment were all >0.90. ICC values for project data showed higher reliability for intra-arch measurements compared to inter-arch measurements. Descriptive statistics outlining means and standard deviations of the measurements for each variable are outlined in Table 2. The four different model types used in the study all had ICC >0.90 for all eight intra-arch measurements (Table 3). Two inter-arch measurements, overbite (OB) and overjet (OJ), both had ICC values of 0.79 (Table 3).

Table 2. Descriptive statistics for each parameter.

VARIABLE

Model Type

Mean

Std Dev

Std Error

Minimum

Maximum

Maxillary Intermolar Width (MxIMW)

CBCT

40.10

3.03

0.78

35.17

45.65

ExtraOral

40.20

3.15

0.81

35.03

46.36

IntraOral

40.44

3.05

0.79

35.50

45.99

Stone

40.83

3.11

0.80

35.60

46.10

Mandibular Intermolar Width (MdIMW)

CBCT

34.68

2.71

0.70

28.97

39.93

ExtraOral

34.29

2.79

0.72

28.16

39.74

IntraOral

34.52

2.62

0.68

28.80

39.50

Stone

35.02

2.65

0.68

29.56

40.11

Maxillary Intercanine Width

(MxICW)

CBCT

35.09

2.12

0.55

31.68

40.39

ExtraOral

35.45

2.21

0.57

32.13

40.64

IntraOral

35.47

2.16

0.56

32.06

40.59

Stone

35.44

2.04

0.53

32.41

40.13

Mandibular Intercanine Width (MdICW)

CBCT

27.28

1.82

0.47

25.83

31.87

ExtraOral

27.51

1.80

0.46

25.84

32.45

IntraOral

27.59

1.90

0.49

25.46

32.36

Stone

27.10

1.71

0.44

25.29

31.40

Maxillary Right Central Incisor Crown Height (UR1H)

CBCT

8.65

0.71

0.18

7.20

10.01

ExtraOral

8.62

0.62

0.16

7.40

9.86

IntraOral

8.71

0.63

0.16

7.34

10.10

Stone

8.80

0.74

0.19

7.23

10.21

Mandibular Right Central Incisor Crown Height (LR1H)

CBCT

6.97

0.94

0.24

5.50

8.11

ExtraOral

7.15

1.16

0.30

5.59

8.51

IntraOral

7.20

1.09

0.28

5.82

8.49

Stone

7.10

1.15

0.30

5.27

8.54

Maxillary First Molar to Midline (UR6Mid)

CBCT

35.67

3.24

0.84

29.92

41.75

ExtraOral

35.97

3.37

0.87

30.06

42.40

IntraOral

35.98

3.34

0.86

30.09

42.45

Stone

35.99

3.28

0.85

30.23

42.36

Mandibular First Molar to Midline (LR6Mid)

CBCT

30.18

2.71

0.70

23.78

36.02

ExtraOral

29.87

2.64

0.68

23.63

35.48

IntraOral

29.93

2.67

0.69

23.73

35.73

Stone

30.30

2.67

0.69

23.91

35.93

Overjet (OJ)

CBCT

2.53

0.45

0.12

1.74

3.46

ExtraOral

2.32

0.49

0.13

1.39

3.07

IntraOral

2.34

0.47

0.12

1.53

3.21

Stone

2.44

0.46

0.12

1.73

3.27

Overbite (OB)

CBCT

1.48

0.56

0.15

0.60

2.42

ExtraOral

1.72

0.45

0.12

1.06

2.53

IntraOral

1.72

0.45

0.12

1.02

2.54

Stone

1.90

0.48

0.12

1.22

2.71

Table 3. Outcomes of Intraclass Correlation (ICC) tests.

VARIABLE

Variance Between

Std Dev Between

Variance Within

Std Dev Within

ICC

Maxillary Intermolar Width (MxIMW)

9.3452

3.05700

0.2343

0.48400

0.97555

Mandibular Intermolar Width (MdIMW)

7.1314

2.67046

0.1845

0.42958

0.97478

Maxillary Intercanine Width (MxICW)

4.4550

2.11068

0.1144

0.33823

0.97496

Mandibular Intercanine Width (MdICW)

3.1057

1.76230

0.1898

0.43567

0.94240

Maxillary Right Central Incisor Crown Height (UR1H)

0.4338

0.65867

0.02690

0.16402

0.94161

Mandibular Right Central Incisor Crown Height (LR1H)

1.1033

1.05040

0.08122

0.28499

0.93143

Maxillary First Molar to Midline (UR6Mid)

10.8611

3.29562

0.1021

0.31957

0.99068

Mandibular First Molar to Midline (LR6Mid)

7.0717

2.65926

0.1062

0.32591

0.98520

Overjet (OJ)

0.1779

0.42179

0.04614

0.21481

0.79405

Overbite (OB)

0.2035

0.45108

0.05475

0.23399

0.78797

CBCT vs. Stone Models

For the pair-wise comparison between the different model imaging methods, mean values were significantly smaller (p<.05) for three transverse, intra-arch measurements (MxIMW, MdIMW, and MxICW) for CBCT models compared with stone models (Table 4). Significant differences (p<.05) existed between CBCT models and stone models for UR1H, UR6Mid, and OB. For these three parameters, CBCT model measurements were consistently smaller than the stone measurements. MxIMW had the largest mean difference between stone and CBCT models (-0.73mm). All other statistically significant differences between CBCT and stone models had mean differential estimates of <0.5mm.

Table 4. ANOVA pair-wise comparison tests using Fisher’s protected least significant differences.

Method 1

Method 2

Differential Estimate

Standard
Error

Probt
(p-value)

95%CI Lower

95%CI Upper

Maxillary Intermolar Width (MxIMW)

CBCT

ExtraOral

-0.1073

0.1356

0.4330

-0.3810

0.1663

CBCT

IntraOral

-0.3493

0.1356

0.0136

-0.6230

-0.07572

CBCT

Stone

-0.7327

0.1356

<.0001

-1.0063

-0.4590

ExtraOral

IntraOral

-0.2420

0.1356

0.0815

-0.5156

0.03162

ExtraOral

Stone

-0.6253

0.1356

<.0001

-0.8990

-0.3517

IntraOral

Stone

-0.3833

0.1356

0.0072

-0.6570

-0.1097

Mandibular Intermolar Width (MdIMW)

CBCT

ExtraOral

0.3833

0.1147

0.0018

0.1519

0.6148

CBCT

IntraOral

0.1553

0.1147

0.1829

-0.07615

0.3868

CBCT

Stone

-0.3407

0.1147

0.0049

-0.5721

-0.1092

ExtraOral

IntraOral

-0.2280

0.1147

0.0534

-0.4595

0.003483

ExtraOral

Stone

-0.7240

0.1147

<.0001

-0.9555

-0.4925

IntraOral

Stone

-0.4960

0.1147

<.0001

-0.7275

-0.2645

Maxillary Intercanine Width (MxICW)

CBCT

ExtraOral

-0.3540

0.1082

0.0021

-0.5723

-0.1357

CBCT

IntraOral

-0.3767

0.1082

0.0012

-0.5950

-0.1583

CBCT

Stone

-0.3480

0.1082

0.0025

-0.5663

-0.1297

ExtraOral

IntraOral

-0.02267

0.1082

0.8351

-0.2410

0.1957

ExtraOral

Stone

0.006000

0.1082

0.9560

-0.2123

0.2243

IntraOral

Stone

0.02867

0.1082

0.7923

-0.1897

0.2470

Mandibular Intercanine Width (MdICW)

CBCT

ExtraOral

-0.2340

0.1414

0.1054

-0.5194

0.05136

CBCT

IntraOral

-0.3087

0.1414

0.0347

-0.5940

-0.02331

CBCT

Stone

0.1800

0.1414

0.2100

-0.1054

0.4654

ExtraOral

IntraOral

-0.07467

0.1414

0.6002

-0.3600

0.2107

ExtraOral

Stone

0.4140

0.1414

0.0055

0.1286

0.6994

IntraOral

Stone

0.4887

0.1414

0.0013

0.2033

0.7740

Maxillary Right Central Incisor Crown Height (UR1H)

CBCT

ExtraOral

0.03733

0.05373

0.4910

-0.07110

0.1458

CBCT

IntraOral

-0.06133

0.05373

0.2601

-0.1698

0.04710

CBCT

Stone

-0.1500

0.05373

0.0079

-0.2584

-0.04157

ExtraOral

IntraOral

-0.09867

0.05373

0.0734

-0.2071

0.009762

ExtraOral

Stone

-0.1873

0.05373

0.0012

-0.2958

-0.07890

IntraOral

Stone

-0.08867

0.05373

0.1063

-0.1971

0.01976

Mandibular Right Central Incisor Crown Height (LR1H)

CBCT

ExtraOral

-0.1747

0.1013

0.0920

-0.3791

0.02978

CBCT

IntraOral

-0.2260

0.1013

0.0311

-0.4304

-0.02155

CBCT

Stone

-0.1247

0.1013

0.2253

-0.3291

0.07978

ExtraOral

IntraOral

-0.05133

0.1013

0.6150

-0.2558

0.1531

ExtraOral

Stone

0.05000

0.1013

0.6242

-0.1544

0.2544

IntraOral

Stone

0.1013

0.1013

0.3229

-0.1031

0.3058

Maxillary First Molar to Midline (UR6Mid)

CBCT

ExtraOral

-0.3000

0.1060

0.0071

-0.5139

-0.08609

CBCT

IntraOral

-0.3047

0.1060

0.0063

-0.5186

-0.09076

CBCT

Stone

-0.3140

0.1060

0.0050

-0.5279

-0.1001

ExtraOral

IntraOral

-0.00467

0.1060

0.9651

-0.2186

0.2092

ExtraOral

Stone

-0.01400

0.1060

0.8956

-0.2279

0.1999

IntraOral

Stone

-0.00933

0.1060

0.9303

-0.2232

0.2046

Mandibular First Molar to Midline (LR6Mid)

CBCT

ExtraOral

0.3040

0.09686

0.0031

0.1085

0.4995

CBCT

IntraOral

0.2500

0.09686

0.0134

0.05452

0.4455

CBCT

Stone

-0.1187

0.09686

0.2274

-0.3141

0.07681

ExtraOral

IntraOral

-0.05400

0.09686

0.5802

-0.2495

0.1415

ExtraOral

Stone

-0.4227

0.09686

<.0001

-0.6181

-0.2272

IntraOral

Stone

-0.3687

0.09686

0.0005

-0.5641

-0.1732

Overjet (OJ)

CBCT

ExtraOral

0.2127

0.07229

0.0053

0.06678

0.3586

CBCT

IntraOral

0.1927

0.07229

0.0109

0.04678

0.3386

CBCT

Stone

0.09667

0.07229

0.1883

-0.04922

0.2426

ExtraOral

IntraOral

-0.02000

0.07229

0.7834

-0.1659

0.1259

ExtraOral

Stone

-0.1160

0.07229

0.1161

-0.2619

0.02988

IntraOral

Stone

-0.09600

0.07229

0.1913

-0.2419

0.04988

Overbite (OB)

CBCT

ExtraOral

-0.2340

0.06055

0.0004

-0.3562

-0.1118

CBCT

IntraOral

-0.2433

0.06055

0.0002

-0.3655

-0.1211

CBCT

Stone

-0.4153

0.06055

<.0001

-0.5375

-0.2931

ExtraOral

IntraOral

-0.00933

0.06055

0.8782

-0.1315

0.1129

ExtraOral

Stone

-0.1813

0.06055

0.0046

-0.3035

-0.05913

IntraOral

Stone

-0.1720

0.06055

0.0069

-0.2942

-0.04980

CBCT vs. Extraoral Models

CBCT models showed statistically significant differences (p<.05) with extraoral models for MdIMW, MxICW, UR6Mid, LR6Mid, OJ, and OB. All measurement parameters between stone and CBCT models had <0.5mm average mean differences. Both vertical, intra-arch parameters (central incisor crown heights) showed no significant differences between the two model sets.

CBCT vs. Intraoral Models

Statistically significant differences (p<.05) were noted between CBCT models and models generated from the intraoral scanner for the following parameters: MxIMW, MxICW, MdICW, LR1H, UR6Mid, LR6Mid, OJ, OB. All measurement parameters between both scanning methods had <0.4mm average mean differences.

Discussion

While the clinical accuracy of CBCT scanning dental impressions has been previously confirmed [11], little research has been performed to evaluate the accuracy of digital replications generated from CBCT scans of stone models. Darroudi et al. [12] performed CBCT scans of plaster models for comparative purposes and observed clinically acceptable accuracy between the two model sets for orthodontic intra-arch measurements. However, the authors found significant inconsistencies between inter-arch measurements due to variability in occluding the arch models with digital wax bites. Wesemann et al. [13] compared CBCT-generated models with digital models and 3D printed models, but only examined intra-arch measurements and utilized one master model upon which all other model samples were based. The authors found the greatest accuracy with the extraoral scanner and the greatest variability with 3D printed models. While these studies provide preliminary insight into the potential use of CBCT scanned models, additional research is needed within the emerging digital model technologies, particularly in inter-arch model accuracy.

For digital models to serve as an adequate source of orthodontic recordkeeping, treatment planning, and/or appliance fabrication, it is essential for dimensional accuracy to remain consistent across the model types. The focus of this study was to evaluate the accuracy of digital models created using CBCT scanning procedures of traditional plaster models. ICC data in this study showed high reliability (ICC>0.90) for all intra-arch parameters measured. These findings agree with multiple published studies, that for individual maxillary or mandibular arches, consistent dimensions appear to exist between digital models and traditional stone models [4,10,12,13]. Different findings were obtained, however, when the models were manually articulated and inter-arch measurements were recorded. For the inter-arch analysis, overjet and overbite showed decreased consistency between the model types, with a lower correlation coefficient (ICC=.79) for both variables. Darroudi et al. [12] digitally articulated CBCT models using scanned occlusal registrations (wax bites) of each patient. The authors found similar results to our study including inaccuracies with regards to inter-arch measurements of CBCT-scanned models, but found high accuracy on independently-measured maxillary or mandibular models [12].

In the current study, many of the intra-arch measurements were statistically smaller for CBCT models compared with stone models. This finding was consistent with previously reported CBCT model data [14,15]. San Jose et al. [14] attributed smaller measurements on CBCT models to the tendency of CBCT imaging to create rounded, more indistinct proximal contact points. Our observation agreed with this notion, adding as well the lack of detailed cuspal anatomy on CBCT models compared with stone or other digital model formats. This lack of fine detail could have resulted in a trend towards improper landmark identification for CBCT models.

No significant differences were noted between intraoral and extraoral scanned models for any parameter. The authors felt that occlusal anatomy was most detailed on these two particular model sets. Additionally, both of these model sets were measured using Dolphin software, i.e. no manual digital caliper usage. This improvement in cuspal anatomy, coupled with the digital measuring technique, could have resulted in improved consistency between the model sets.

While statistically significant differences were reported between many stone model and CBCT model parameters, it is important to evaluate the differential estimates of these comparisons. All parameters other than maxillary intermolar width had differential estimates of <0.5mm. This finding is of clinical significance, as a discrepancy of <0.5mm could provide clinically ample model sets for treatment planning and diagnostic recordkeeping. The largest discrepancy was noted for maxillary intermolar width, which had a differential estimate of -0.73mm. This could be attributed to the aforementioned lack of cuspal anatomy and rounded edges of CBCT models. Maxillary intermolar width was also the largest linear parameter measured in this study, so a slightly increased discrepancy between the models for this variable was not a surprising finding. To further analyze accuracy between digital model sets, additional studies should incorporate superimpositions of CBCT scans over other digitally scanned models with color mapping to localize discrepancies between the various scanning modalities. Furthermore, additional studies should evaluate whether the discrepancies observed between stone and CBCT models are significant enough to impact appliance delivery and overall clinical efficiency.

Conclusion

Digital models fabricated from CBCT scans of plaster casts appear to have adequate accuracy for orthodontic treatment planning and recordkeeping. Further studies are needed to determine the clinical efficiency of appliance design and chairside delivery using CBCT scanning.

References

  1. Rossini G, Parrini S, Castroflorio T, Deregibus A, Debernardi CL (2016) Diagnostic accuracy and measurement sensitivity of digital models for orthodontic purposes: A systematic review. American Journal of Orthodontics and Dentofacial Orthopedics 149: 161–70.
  2. Shastry S, Park JH (2014) Evaluation of the use of digital study models in postgraduate orthodontic programs in the United States and Canada. The Angle Orthodontist 84: 62–67.
  3. Wiranto MG, Engelbrecht WP, Tutein Nolthenius HE, van der Meer WJ, Ren Y. (2013) Validity, reliability, and reproducibility of linear measurements on digital models obtained from intraoral and cone-beam computed tomography scans of alginate impressions. American Journal of Orthodontics and Dentofacial Orthopedics 143: 140–47.
  4. Fleming PS, Marinho V, Johal A. (2011) Orthodontic measurements on digital study models compared with plaster models: a systematic review. Orthodontics Craniofacial Research 14: 1–16.
  5. Kravitz ND, Groth C, Jones PE, Graham JW, Redmond WR (2014) Intraoral digital scanners. Journal of Clinical Orthodontics 48: 337–47.
  6. Garino F, Garino GB, Castroflorio T (2014) The iTero intraoral scanner in Invisalign treatment: a two-year report. Journal of Clinical Orthodontics 48: 98–106.
  7. Thiruvenkatachari B (2009) Measuring 3-dimensional tooth movement with a 3-dimensional surface laser scanner. American Journal of Orthodontics and Dentofacial Orthopedics 135: 480–85.
  8. Flugge T, Schlager S, Nelson K, Nahles S, Metzger M. (2013) Precision of intraoral digital dental impressions with iTero and extraoral digitzation with the iTero and a model scanner. American Journal of Orthodontics and Dentofacial Orthopedics 144: 471–8.
  9. Detterbeck A (2016) MRI vs. CT for orthodontic applications: comparison of two MRI protocols and three CT (multislice, cone-beam, industrial) technologies. Journal of Orofacial Orthopedics 77: 251–261.
  10. Kim J, Heo G, Lagravère MO. (2014) Accuracy of laser-scanned models compared to plaster models and cone-beam computed tomography. The Angle Orthodontist 84: 443–50.
  11. Lee SM, Hou Y, Cho JH, Hwang HS (2016) Dimensional accuracy of digital dental models from cone-beam computed tomography scans of alginate impressions according to time elapsed after the impressions. American Journal of Orthodontics and Dentofacial Orthopedics 149: 287–94.
  12. Darroudi AM (2017) Accuracy of a computed tomography scanning procedure to manufacture digital models. American Journal of Orthodontics and Dentofacial Orthopedics 151: 995–1003.
  13. Wesemann C, Muallah J, James M, Bumann A (2017) Accuracy and efficiency of full-arch digitalization and 3D printing: A comparison between desktop model scanners, an intraoral scanner, a CBCT model scan, and stereolithographic 3D printing. Quintessence International 48: 41–50.
  14. San Jose V (2017) Dental measurements and Bolton index reliability and accuracy obtained from 2D digital, 3D segmented CBCT, and 3d intraoral laser scanner. Journal of Clinical and Experimental Dentistry 9: 1466–73.
  15. Kau CK. (2010) Evaluation of CBCT Digital Models and Traditional Models Using the Little’s Index. The Angle Orthodontist 80: 435–439.

Surgical Rib Fixation: Five-Year Experience from an Australian Trauma Centre

DOI: 10.31038/IJOT.2019251

Abstract

Background

Literature suggests surgical rib fixation in the acute phase of injury leads to positive outcomes. We have implemented this practice since 2014 and detail the outcomes of rib fixation from our institution.

Methods

We implement a multidisciplinary team management for chest injury. Failure to progress despite maximum intervention by the pain specialist is identified early leading to operative intervention. Retrospective 5-year review was performed on patients undergoing surgical rib fixation looking into the effect on pain scores, length of in hospital stay, post-operative complications and follow up.

Results

Thirty-seven cases (81% males) with a mean age of 56 met the inclusion criteria. All patients underwent rib fixation within 96 hours of admission. Of all included patients, 57% (n=21) required intensive care unit admission for ventilatory support. Of this subset of patients, 66% (n=14) were discharged to ward management within 48 hours, the remaining seven patients required ongoing support secondary to co-existing injuries requiring ongoing management in the unit. Postoperatively, pain scores reduced at median of 2 days with a standard deviation of 2.5 days.  The in-hospital stay also reduced by 155 hours (6 days) over the period of 5 years.  There were two early complications in the series, but no mortality. At 12 months post operatively, both clinical and radiological follow up suggested no hardware or residual pulmonary complications.

Conclusion

This single institution study presents the early results of surgical rib fixation with satisfactory outcomes and minimal complications. Ongoing follow-up will provide a more detailed analysis of long-term outcomes

Background

Rib fractures are present in about 21% of blunt chest trauma patients presenting to Australian hospitals [1]. The number of ribs fractured and the complexity of fracture pattern are associated with an increase in morbidity and mortality [2,3]. Traditionally rib fractures are managed with focus on adequate pain control, oxygen supplementation and early chest physiotherapy [4]. The management of complex rib fractures by traditional means can be challenging as these patients might require respiratory support in the intensive care unit with prolonged hospital stays during the recovery phase [5].

Open Surgical Rib Fixation (SRF) is being used to manage complex rib fractures and follows the same principle of orthopaedic reduction and fixation of fractured bones to reduce pain by return of structural stability of the chest wall which also improves ventilatory efforts leading to reduced pulmonary complications and prevent delayed union [6–8]. Interventions can be performed in conjunction with SRF such as placement of analgesic catheters, evacuation of retained haemothorax and exploration of other thoracic pathologies such as lung lacerations and integrity of the diaphragm2. The benefits of SRF for complex rib fractures has been recognised in reducing pain and improving physical function [6,7].

The Gold Coast University Hospital (GCUH) is a verified Level I Trauma Centre by our Royal Australasian College of Surgeons (RACS).  Over the last 5 years, 10,545 patients were managed by the service out of which 2070(20%) presented with blunt chest wall injury.  Or institution promotes multidisciplinary team approach in the management of these patients. Pain specialist team would monitor subjective pain scores for the duration of stay recorded utilising numeric/verbal rating scale [10]. The days required for the patient to have subjective pain improvement by a drop in the pain brackets of severe (10–7), moderate (6–4), mild (1–3) or none (0). Following exhaustion of all modalities of pain relief within the first 96 hours of admission to hospital, patients would be recruited to the surgical pathway.

Surgical Technique

In our institution, a standardized SRF technique had been developed by surgeon experience and with adaption to literature. Patients for consideration of SRF have three-dimensional computed tomography reconstruction of the chest wall for operative planning [9].  Anaesthesia is administered via single lumen tube with the patient in lateral position on bean mattress. A minimal muscle splitting surgical approach is performed using a wound protector (ALEXIS – Applied Medical, CA, USA) with minimal rib dissection and preservation of the periosteum [6], followed by reduction and plating (MatrixRib® Fixation System, West Chester, PA, USA or Rib Loc® Rib Fracture Plating System, Acute Innovations, Hillsboro, OR, USA) of the fractures depending on site of fractures. The pleural cavity is then lavaged with saline and a curved intercostal catheter inserted. Post-operative chest X-ray determines the need for suction on the drainage system. Paravertebral blocks are either left in situ or replaced at the end of the procedure.

The aim of this study is to describe the outcomes of surgical rib fixations looking at in hospital length of stay, pain scores and duration of intensive care stay over a period of five years at our institution.

Methods

Design and Setting

Following local ethics committee approval (LNR/2018/QGC/49835), a retrospective chart review was conducted on all SRF cases performed from July 2014 to December 2018 at Gold Coast University Hospital.

Participants

We included all patients who underwent surgical rib fixations irrespective of their other injury status. Penetrating chest wall Injuries leading to rib fractures and blunt injury induced fractures managed without surgical intervention were not included in this study.

Outcomes

Primary outcome was to evaluate length of stay in hospital and secondary outcome being improvement in pain scores, reduction in ventilatory days and complications.

Data Collection

Data was retrieved via the prospectively collected trauma registry managed by the trauma service at GCUH.

Data Analysis

Statistical analysis was performed using IBM SPSS statistics for windows. Statistical analysis was performed using t-test (two-sample assuming unequal variances), specifically to evaluate the difference in outcomes in pain, length of stay in hospital and ventilatory days. Descriptive analysis was performed on non-comparative values.

Results

Thirty-seven cases (81% males) with a mean age of 56 met the inclusion criteria. Flow Chart 1 displays details of recruitment.

The chest Abbreviated Injury Scale (AIS) scores were ≥ 3 for all cases. The mean Injury Severity Score (ISS) was 21. Figure 1 displays distribution of ISS/New Injury Severity Score (NISS) over the period of 5 years.

IJOT 19 - 126_Bavik Patel_F1

IJOT 19 - 126_Bavik Patel_F2

Figure 1. Distribution of ISS and NISS over a 5- Year period

IJOT 19 - 126_Bavik Patel_F3

Figure 2. Demonstrates the length of in-hospital stay.

All patients underwent surgical rib fixation within 96 hours of admission. The number of operative cases progressed from three annually in 2014/2015 to twenty in 2018. In 2014, at the beginning of the study, pain not controlled following maximum intervention from the pain specialist was the predominant indication for intervention however as the duration of the study progressed surgical interventions were also performed for chest wall instability. Five patients were excluded from the study as for more than 48 hours either pre- or post-procedure secondary to their injuries it would not be possible to document their pain scores.

Of all included patients, 57% (n=21) were admitted pre-as well as post-operative to intensive care unit admission for respiratory support. Of this subset of patients, 66% (n=14) were discharged to ward within 48 hours. The remaining seven patients required ongoing support in the unit for management of their co-existing injuries. The median days after SRF where patients described pain score improvement were 2 with a standard deviation of 2.5 days.

The length of in hospital stay over a period of 5 years reduced from 546 to 391 hours, a difference of 155 hours (6 days). The overall median length of in hospital stay was 292 hours with a Standard deviation of 313 hours. Patients sustaining concurrent severe head injury if excluded, the length of stay reduced from 401 to 261 hours difference of 140 hours (5 days).

As time progressed, we undertook surgical fixation of the more anatomically challenging posterior (10%) and bilateral (8%) rib fractures.

Over the course of 5 years, follow‐up rate at 12 months progressively increased from 75% to 85% with no hardware or pulmonary complications reported on plain chest x-rays.

Complications in this case series consisted of a postoperative bleed in a posterior rib fixation patient requiring operative intervention with second intercostal catheter placement and a superficial wound infection managed non‐operatively with intravenous antibiotics. Non-procedure complications included pneumonia (2), pulmonary embolism (1) and mortality due to traumatic brain injury (1). Thus, overall complication rate was 16.2% with an overall procedure related complication rate of 5.4%.

Discussion

Since the introduction of surgical rib fixation at our institution, there has been a steady increase in the number of cases performed annually. This could not only be attributed to the increasing confidence of the surgeon performing the procedure but also to patient outcomes in terms of reduction in pain scores, reduced ventilatory days and decreased length of in hospital stay.

Pain is the main complaint of rib fracture patients and management of this is a challenge often with complex fracture patterns. Once all supportive pain management options are exhausted, surgical rib fixation is considered.

The average cost of patients acutely admitted to public hospitals in Queensland, Australia is about $8561 for 4 days [11]. The post-operative time to improvement in subjective pain scores was 2 days, which might have a direct link in reduction of the length of in hospital stay by 155 hours (6 days).  This study suggests direct link to subjective pain relief following surgery and reduction in length of hospital stay leading to reduction in costs of hospital stay [14].

The post-operative time to improvement in subjective pain experienced has decreased over the period of this study. This may be due to refinement in surgical technique by reducing the size of surgical incision and minimum muscle dissection as more cases were performed. Another confounding factor for subjective pain score improvement could be the increased experience of the pain specialist and allied health professionals in managing these subsets of patients.

Literature review suggests acute recovery from complex rib fractures can be measured by length of hospital stay [13]. In the identified patients who underwent SRF, the mean HLOS has shown a steady decrease by 155 hours (6 days). When patients with concurrent severe head injury is excluded from the groups, the mean difference still favours the surgical group by 140 hours (5 days) suggesting similarity in local as well as international results [13,14].

It is recommended for novice surgeons to perform the technique on antero-lateral rib fractures [5]. As the experience in surgical technique was gained, confidence in performing the more challenging posterior and bilateral rib fractures also increased.

Some clinical studies are substantially smaller and often lack sufficient statistical power to detect clinically meaningful differences in operative mortality rates. Moreover, there is little evidence from these clinical studies to suggest there are important volume-related differences in the case mix (i.e. those low-volume providers. Although we cannot rule out confounders by unmeasured characteristics of the patients in our study, there is no reason to believe that such confounders would affect our analyses of hospital and surgeon volume [12].

Limitations

There are certain limitations of this study with the most distinct being the retrospective nature of this study which includes small cohort of patients at a single institution. Major chest trauma is usually associated with other injuries and the severity of this may be a confounder to the true in hospital length of stay. A multi institutional prospective study might provide us with suggestions into the outcomes of this surgical procedure.

Conclusion

Preliminary data analysis from our institution suggests, we have increased our incidence for this procedure with reduced in hospital length of stay and minimal impact to complications. We hope to see consistent results as case numbers increase in the following years and for fellow institutions to support these outcomes.

Declaration

Ethical statement: Study was carried out only after approval from Local Ethics Committee (LNR/2018/QGC/49835)

Consent for publication: Retrospective de identified chart analysis only so no consent from patients

Availability of data and material: On request de identified data can be accessed

Competing interests: Bhavik Patel, Gary Hung, Andrie Stroebel and Martin Wullschleger have no competing interest

This study has been presented as a poster at The Annual Summit of Chest Wall Injury Society, Santa Fe, New Mexico, USA- 2019.

Authors’ Contributions

Bhavik Patel- Devise Idea, Draft Manuscript, Analysis of data, Submission and Corresponding Author

Gary Hung- Collect data, Analysis of data, Draft Manuscript

Andrie Stroebel- Initial Phase Cardiothoracic Surgeon for Second Opinion on operative cases

Martin Wullschleger – Initial Phase Surgeon and Correction of Manuscript

References

  1. Cameron P, Dziukas L, Hadj A, Clark P, Hooper S (1996) Rib fractures in major trauma. Aust N Z J Surg 66: 530–534.
  2. Witt CE, Bulger EM (2017) Comprehensive approach to the management of the patient with multiple rib fractures: a review and introduction of a bundled rib fracture management protocol. Trauma Surgery & Acute Care Open 2: 1–7.
  3. Chien CY, Chen YH, Han ST, et al. The number of displaced rib fractures is more predictive for complications in chest trauma patients. Scand J Trauma Resusc Emerg Med 25: 19.
  4. Kane ED, Jeremitsky E, Pieracci FM, Majercik S, Doben AR (2017) Quantifying and exploring the recent national increase in surgical stabilization of rib fractures. J Trauma Acute Care Surg. 83: 1047–52.
  5. de Campos JRM, White T (2018) Chest wall stablization in trauma patients: when, when, and how? J Thorac Dis 10: S951-S962
  6. Pieracci FM, Majercik S, Ali-Osman F, et al. (2017) Consensus statement: Surgical stabilization of rib fractures rib fracture colloquium clinical practice guidelines. Injury 48: 307–21
  7. Fagevik Olsén M, Slobo M, Klarin L, et al. (2016) Physical function and pain after surgical or conservative management of multiple rib fractures – a follow-up study. Scand J Trauma Resusc Emerg Med 24: 128.
  8. Kaplan DJ, Begly J, Tejwani N. Multipe (2017) Rib Nonunion: Open Reduction and Internal Fixation and Iliac Crest Bone Graft Aspirate. J Orthop Trauma 3: S34–5.
  9. Benjamin R. Pulley, Benjamin C. Taylor, Terry Ty Fowler, Neysa Dominguez, Thai Q (2017) Trinh. Utility of three-dimensional computed tomography for the surgical management of rib fractures. J Trauma Acute Care Surg 78: 530–533.
  10. Breivik et al (2008) Assessment of Pain. Br J Anaesth 101: 17–24.
  11. Independent Hospital Pricing Authority. National Hospital Cost Data Collection. Australian Public Hospitals Cost Report 2013–2014.
  12. Birkmeyer JD, Stukel TA, Siewers AE, Goodney PP, Wennberg DE, Lucas FL (2003) Surgeon Volume and Operative Mortality in the United States. N Engl J Med 349: 2117–27
  13. Silvana F. Marasco, Andrew R. Davies, Jamie Cooper et al. (2013) Prospective Randomized Controlled Trial of Operative Rib Fixation in Traumatic Flail Chest. Journal of the American College of Surgeons 216: 924–932.
  14. Sarah Majercik, Emily Wilson, Scott Gardner, Steven Granger, Don H. VanBoerum, et al. (2015) In-hospital outcomes and costs of surgical stabilization versus nonoperative management of severe rib fractures. J Trauma Acute Care Surg 79: 537–539.

3-Dimensional Multiple Object Tracking Training Can Enhance Selective Attention, Psychomotor Speed, and Cognitive Flexibility in Healthy Older Adults

DOI: 10.31038/ASMHS.2019341

Abstract

Objectives: The objective of this pilot study was to determine if a 3-dimensional multiple object tracking training (3D-MOT) intervention could improve performance on measures of attention, psychomotor speed, and cognitive flexibility in healthy older adults.

Methods: Forty-six individuals aged 63–87 years old participated in the study. Twenty-five participants in the intervention group completed the Stroop task before and after intervention that consisted of seven training sessions with the Neurotracker, a 3D-MOT software program. Stroop test scores were examined for changes in selective attention, cognitive flexibility (CF), as well as psychomotor speed pre- and post-intervention. The 21 individuals in the control group completed the Stroop test at the pre-post interval, without completing the Neurotracker intervention.

Results: The Neurotracker training intervention group showed significant improvements in both cognitive flexibility (M = 5.01, SE = 1.44, p = 0.002), and psychomotor speed and selective attention (M = 4.90, SE = 1.44, p = 0.002). Significant changes were also detected in a condition that measured psychomotor speed and cognitive flexibility together (M = 9.39, SE = 1.74, p < 0.001). No significant changes were detected in the control group.

Conclusion: The current results suggest that the Neurotracker may be an effective tool for improving selective attention, cognitive flexibility, and psychomotor speed in healthy older individuals.

Introduction

Changes in cognitive performance with normal aging have been well documented [1,2]. In particular, older adults are known to have reduced information processing speed and declines in executive functions (EF) [3,4]. Although EF captures many cognitive processes (e.g. complex attention, cognitive inhibition, working memory, and cognitive flexibility), changes in complex attention and cognitive flexibility are most frequently reported [3–5]. Specifically, complex attention includes divided attention, or the ability to attend to multiple stimuli simultaneously [6], while cognitive flexibility captures the mental ability to switch attention between multiple concepts. Therefore, such changes in EF may reduce an individuals’ capacity to behaviorally adapt to changing environment, and may help explain some of the difficulties experienced by older adults from tasks such as driving [1,2,7–10 ].

Age-related impairments in EF have been linked to structural alterations in the prefrontal cortex (PFC) in normal aging [4,11–13]. Additional changes, linked more specifically to declines in attention, include cortical thinning in the PFC [14], and decreased functional magnetic resonance imaging activation across the dorsolateral prefrontal and parietal cortices [15–17] and the anterior cingulate cortex [16,18]. Despite these structural and functional changes, the continued plasticity of the aging brain has been well-documented [19–21]. As a result, interventions for older adults have been a focus of emerging age-related research. However, current pharmacological and behavioral interventions to reduce age-related cognitive declines are limited in their efficacy. Therefore, increasing attention has been paid to the use of cognitive interventions as tools to improve cognition in older adults because they are readily available and easy to administer.

Three-dimensional multiple object tracking (3D-MOT) is a video game technology has been previously used to study attentional enhancement [22,23]. Specifically, 3D-MOT is thought to stimulate brain networks essential to executive functions, such as attention, cognitive flexibility and working memory [24]. As a result, 3D-MOT has been investigated as an emerging tool used to enhance perceptual cognitive abilities in both elite athletes [24–26] and the general population [27–30]. The video game requires subjects to follow a discrete number of moving sub-targets from an array of identical targets [31]. One of the major cognitive skills used in 3D-MOT is attention, including sustained, selective, and divided attention, as well as inhibition and reaction time [30]. Flexibility is conditioned by training the participant to allocate the correct attentional resource while tracking multiple objects [32,33]. Generally, individuals are able to track three to five targets efficiently; however, with age and associated cognitive decline, the ability to track multiple objects decreases [28]. Trick, Perl, and Sethi [34] assessed MOT performance in groups of young (M = 19 years old)and older adults (M = 73 years old), finding that young adults were able to efficiently track four items simultaneously, while older adults could effectively track three items. These results may be attributed to a general decline in attentional capacity: specifically, a decreased activation of the dorsal attentional network [35] that accompanies normal aging.

Given the documented cognitive differences in older adults and evidence that the 3D-MOT can improve cognitive performance in other groups, recent research has focused on whether interventions such as 3D-MOT can improve EF performance in older adults. One particularly relevant study by Legault et al. [28] examined differences in performance between ten young (M = 27 years old) and ten older adults (M = 66 years old) following 5 weeks of training on a 3D-MOT task. Older adults were poorer at tracking pre-intervention; however, they improved on the 3D-MOT task at the same rate as the younger group and continued to improve even when the young adults plateaued. These findings were attributed to the automaticity of tracking following multiple 3D-MOT training sessions, which reduced the attentional load necessary for tracking and thus improved performance. The importance of these findings is the notion that, while some degree of cognitive decline is unavoidable, cognitive decline may be delayed, or even improved, with sufficient training. However, there is debate whether the benefits of these training tools demonstrate far-transfer effects to more generalized cognitive domains, or whether the gains are limited to performance on the training tool itself. It remains unknown how such intervention-based changes may relate to standard measures of cognitive function. The objective of this pilot study was to examine the influence of 3D-MOT training on selective attention, psychomotor speed, and cognitive flexibility in healthy older adults. It was hypothesized that following 7 training sessions on the Neurotracker, a 3D-MOT software program, participants would show improvement in selective attention, cognitive flexibility, and psychomotor speed, as measured by scores on the Stroop test.

Methods

Participants

Older adults aged at least 60 years were recruited from various senior activity centers in Victoria, British Columbia. Participants at these sites were recruited following a brief presentation summarizing he research project. Additionally, a small subset of the sample responded to flyers posted at various seniors’ centres and health facilities. Approval for this project was obtained from the University of Victoria’s human research ethics board.

Eligibility criteria for inclusion included being aged 60 years or older, and able to fully complete an eight-week testing/training period. Age criteria were based on previous research demonstrating that age-related declines in cognition begin around aged 60 years and older [4,36,37]. Exclusion criteria included major neurocognitive diseases, such as Alzheimer’s disease or vascular dementia, or pronounced colour blindness, as the current study required participants to differentiate between colours on both the Stroop test and Neurotracker (Figure 1 for enrolment process).

ASMHS-2019-Brian R. Christie_Canada_F7

Figure 1. Flow diagram outlining participant inclusion process

Initially, 30 healthy participants were recruited for the intervention group, and 25 adults between the ages of 63–87 years old (M = 71.44, SD = 6.04) completed the study. Participants included twelve females (48%) and thirteen males (52%). Twenty-one healthy participants were recruited for the control group, which consisted of 5 males (24%) and 16 females (76%), aged 61–84 years (M = 71.76, SD = 7.47)
(Table 1 for participant education levels).

Table 1. Education obtainment frequencies and percentages of participants in the control and 3D-multiple object tracking training groups.

Education level

Control group (n = 21)

3D-MOT training group (n = 25)

Frequency

Percentage (%)

Frequency

Percentage (%)

High school

1

5

1

4

College

4

19

4

16

Bachelors

6

29

13

52

Masters/PhD

10

47

7

28

Apparatus and instruments

Neurotracker

The Neurotracker is a computerized 3D-MOT perceptual-cognitive training system (CogniSens Athletic Inc., Montreal, Canada) that has been used for training cognitive abilities, including selective attention and cognitive flexibility [38]. Only participants in the intervention group completed the Neurotracker. In total, members of the intervention group completed 21 sessions with the Neurotracker. Specifically, each participant completed one appointment per week, and each appointment included three Neurotracker sessions. During each session, eight yellow projected spheres appeared as targets in a 3D volumetric cube in the screen. Four of the eight spheres briefly changed to red, and then reverted to yellow. The four target spheres were to be tracked as they moved in a linear trajectory. Prior to the first session at intake, participants were given verbal instructions on how to complete the Neurotracker task. The sessions were based on a staircase procedure [39], in which an algorithm shifts the speed of the target spheres in response to the participants’ performance. If all targets were correctly identified, the speed of the movement of the spheres increased by 0.05log; with each incorrect response, the speed decreased by 0.05log (see Figure 2 for Neurotracker procedure).

ASMHS-2019-Brian R. Christie_Canada_F1

Figure 2. Procedure for completing Neurotracker sessions: (a) balls highlighted in white indicate the four targets to track; (b) targets will revert back to yellow and move randomly in 3D space amongst the distractors for eight seconds; (c) balls will stop moving after eight seconds and numbers will appear on all stimuli; participant uses a keyboard to select the original four targets; (d) the targets will be highlighted once selected (e) once the participant has made their selection, the correct targets will be shown by an orange highlight; the balls will then resume moving and the participant will continue tracking the original targets for the remainder of the session.

The Stroop test

The Stroop test was delivered using the EncephalApp, a smartphone program developed originally to assess cognitive decline associated with hepatic encephalopathy [40]. The Stroop test has been supported as a valid and reliable measure of selective attention and cognitive flexibility [41,42]. In the pencil and paper version, the Stroop task presents an array of different colour words in two tasks. During the first task, the words are presented in a congruent colour (e.g. RED written in red ink). In the second task, they are presented in an incongruent colour (e.g. RED written in blue ink). During the incongruent task, there is a marked increase in response time due to the additional demands on selective attention and inhibition, and increased cognitive interference, a phenomenon referred to as the Stroop effect [43]. The Encephal App adheres to the same mechanism as the classic version, but presents the words one at a time, rather than all at once. Additionally, the order and spatial arrangements of the target words on the screen, and response options at the bottom of the screen, are randomized upon each administration, which has been identified as a potential protective measure against learning effects [44,45].

There are two main tasks in the EncephalApp: the Off task, requiring participants to identify the colours of number symbols (#), and the On task, requiring participants to identity the ink colours of words written in an incongruent colour. There were two practice trials that were unscored prior to each timed task. Ten words/symbols were presented during each timed task. Scores were measured based on the time taken to complete a full task without making any errors. If errors were made, the task would restart (Figure 3).

ASMHS-2019-Brian R. Christie_Canada_F2

Figure 3. EncephalApp task. (a) and (b) Stroop effect turned on, where participants select the colour of the ink of the presented word, and not the word itself; (c) Stroop effect turned off, where participants select the colour of the ink of the presented symbols. Each session presents ten different symbols/words; sessions will restart when incorrect responses are given; (d) example of data upon completion of Stroop task.

Three scores were recorded. Off-time scores measured psychomotor speed and selective attention; On-Time scores measured psychomotor speed, divided attention, and cognitive flexibility; and On-Time minus Off-Time scores measured cognitive flexibility isolated from psychomotor speed [44] (see appendix B for raw data).

Procedure

The study took place at the University of Victoria Concussion Lab, Victoria, BC. Participants signed up for appointments using the online scheduling software, Web-Appointments. Members of the intervention group came in once a week for eight weeks.

During the first appointment, goals and aims of the study were explained, and participants were asked to read and sign a consent form. Participants completed a brief intake questionnaire that generated participant histories regarding neurological diseases, concussion experiences, and sensory deficits. Demographic measures were also recorded on the questionnaire, and included age, sex, and years of completed education. At intake, a baseline Stroop test, and three sessions with the Neurotracker were completed. The Stroop test was completed pre- and post-training (i.e. at the first appointment, and one week after the seventh session). The Neurotracker was performed at appointments one through seven. Seven appointments with the Neurotracker were chosen due to time constraints of the study and to ensure participant adherence.

At the eighth appointment, participants completed the Stroop test without the Neurotracker. This was required to get a measurement on the Stroop test that was representative of the conditions under which it was done at the intake (i.e. without having done the Neurotracker immediately before, to reduce the effects of mental fatigue from 3D-MOT training).

Members of the control group came in twice, with the appointments separated by seven weeks. At both appointments, participants completed the Stroop test only.

All participants were compensated for any travel costs accrued, including parking and/or bus fare.

Statistical Analyses

The design was a single factor within-group research design. Data was collected and analyzed using the IBM Statistical Package for the Social Sciences 23 (SPSS) and Excel. Means and standard deviations were computed for demographics (sex and age), and the mode was computed for level of education (i.e. high school/college, Bachelor’s degree, or Master’s/PhD). A two-tailed paired t-tests were carried out using SPSS for On-Time minus Off-Time scores (cognitive flexibility) from the first and eighth appointments. As the sample consisted of a large number of active bridge players, Spearman’s rho correlations were computed for bridge players and non-bridge players and Stroop scores, to examine whether there was a correlation between active engagement in mentally stimulating activities and performance on the Stroop test, based on existing research demonstrating increased cognition in older adults who participate in these activities [46, 47]. Statistical correlations were thus calculated to assess whether this was an extenuating variable. Spearman’s rho correlations were also computed for sex and Stroop scores, and education level and Stroop scores. Pearson’s correlations were calculated for age groups (62–69 years old, 70–73 years old, and 74 and older) and Stroop scores, to assess the relationship between advanced ages and the degree of cognitive improvement following the Neurotracker intervention.

A second t-test was performed to test the hypothesis that psychomotor speed was significantly different following the intervention, as measured by the Off-Time conditions. Three paired t-tests were also performed on Stroop scores recorded for the control group. A paired t-test also demonstrated that there was no significant difference on Stroop test performance pre-intervention comparing the experimental group with the control group.

To verify whether Stroop test scores improved after seven sessions of 3D-MOT training, a two-tailed paired sample t-test was performed using SPSS. Scores obtained from the Stroop effect Off-Time condition (i.e. identifying the colour of number signs) represented psychomotor speed and were analyzed pre- and post-intervention. Scores obtained from the Stroop effect On-Time condition (i.e. identifying the ink colour of discordant-coloured stimuli) represented cognitive flexibility and psychomotor speed, and were analyzed pre- and post-intervention. Scores obtained from the On-Time minus Off-Time condition represented cognitive flexibility isolated from psychomotor speed, and were analyzed pre- and post-intervention.

Results

A Shapiro-Wilk test [48] and a visual inspection of their box plots showed that the Stroop scores for the On-Time minus Off-Time condition were normally distributed (p = .181). The skewness value of -.321 (SE = .464) and kurtosis of -.803 (SE = .902) were conducted to assess the assumption of normality pre- and post-training. These values met the criteria outlined by West, Finch, and Curran [49] of skewness and kurtosis values within ± 2 to demonstrated normality.

Pre-Intervention

Prior to 3D-MOT training, the mean Stroop test score for the intervention group participants was 77.23 (SD = 13.33) for Off-Time, and 92.05 (SD = 17.35) for On-Time. The mean score for On-Time minus Off-Time was 14.83 (SD = 9.30).

At baseline, the mean Stroop test scores for the control group was 80.88 (SD = 11.75) for Off-Time, 90.32 (SD = 24.96) for On-Time, and 16.36 (SD = 17.90) for On-Time minus Off-Time. There was no significant difference in Stroop test performance between the experimental and control group pre-intervention.

Post-Intervention

To test the hypothesis that cognitive flexibility was statistically different following the intervention, as measured by the On-Time minus Off-Time conditions, a dependent samples t-test was performed for both the experimental and control group (Table 2).

Table 2. Average Stroop test scores in seconds at baseline and 8 weeks post-intervention. The Neurotracker group post-intervention scores were measured following 21 training sessions using 3D-multiple object tracking over 7 weeks. The control group received no 3D-MOT training.

Control (n = 21)

Neurotracker group (n = 25)

EncephalApp results, baseline (mean ± SD)

Total Off-Time, sec.

80.88 ± 11.75

77.23 ± 13.33

Total On-Time, sec.

90.32 ± 24.96

92.5 ± 17.35

Total On-Time minus Off-Time, sec.

16.36 ± 17.90

14.86 ± 9.30

EncephalApp results, post-intervention (mean ± SD)

Total Off-Time, sec.

79.89 ± 11.19

72.33 ± 12.18*

Total On-Time, sec.

82.59 ± 35.99

82.66 ± 12.75**

Total On-Time minus Off-Time, sec.

25.75 ± 25.73

9.80 ± 6.84+

Notes: * = p = .002; ** = p < .001; + = p = .006

On average, the time taken to complete the Stroop test for the On-Time minus Off-Time condition significantly decreased between the initial appointment and final appointment for the experimental group (M = 5.01, SD = 7.19, SE = 1.44, CI [2.04, 7.97]), t(24) = 3.48, p = .002). Participants who completed 3D-MOT training demonstrated a 33.76% improvement in On-Time minus Off-Time scores, which was significantly greater than the control group (see figure 4).

ASMHS-2019-Brian R. Christie_Canada_F3

Figure 4. Percent difference in 3 Stroop test tasks between initial appointment and 8 weeks later. The experimental group completed 21 sessions of 3D-multiple object tracking training over a 7-week period. The control group received no intervention.

A Cohen’s d value of 3.06 indicated a large effect size [50]. A second t-test was performed to test the hypothesis that psychomotor speed and selective attention were significantly different following the intervention, as measured by the Off-Time conditions. On average, the time taken to complete the Stroop test in the Off-Time condition significantly decreased from the initial appointment (M = 4.90, SD = 7.12, SE = 1.44, CI [1.94, 7.86]), t(24) = 5.41, p = .002. Participants who completed 3D-MOT training demonstrated a 6.24% improvement Off-Time scores, which was significantly greater than the control group (see figure 4).

A third t-test was performed to test the hypothesis that psychomotor speed and cognitive flexibility were statistically different following the intervention, as measured by the On-Time conditions. On average, the time taken to complete the Stroop test decreased significantly following the intervention (M = 9.39, SD = 8.68, SE = 1.74, CI [5.81, 12.98]), t(24) = 5.41, p > .001. Participants who completed 3D-MOT training demonstrated a 10.20% improvement in On-Time, which was significantly greater than the control group (see figure 4).

Three paired t-tests were performed on Stroop scores recorded for the control group. No significant changes were found in the On-Time, Off-Time, or On-Time minus Off-Time scores at week 8.

Post–hoc demographic comparisons

Sex

Scores were further analyzed to assess the influence of sex on Stroop test On-Time minus Off-Time scores. Prior to 3D-MOT training, there were significant sex differences in Stroop scores for the On-Time and Off-Time conditions, while there were no significant differences for the On-Time minus Off-Time condition. Following 3D-MOT training, these sex differences were maintained, with significant sex differences found in the On-Time (p < .001) and Off-Time (p = .004) conditions but not in the On-Time minus Off-Time conditions (see Figure 5 for percent differences in Stroop test scores as a factor of sex).

ASMHS-2019-Brian R. Christie_Canada_F4

Figure 5. Percent differences in Stroop test task completion following 21 sessions of 3D-multiple object tracking completed over a 7-week period as a factor of sex.

Age

Scores were further analyzed to assess the influence of age on Stroop test On-Time minus Off-Time scores. Participants were divided into 3 age groups: 62–69 (n = 9), 70–73 (n = 8), and 74 years and older (n = 8). Participants were categorized into these age groups as these groupings allowed within-group variation to be minimized.Prior to 3D-MOT training, participants in the 74 and older group took the longest to complete the Off-Time (M = 83.85, SD = 14.18), On-Time (M = 102.33, SD = 14.80), and On-Time minus Off-Time conditions (M = 18.47, SD = 10.89) (Table 3).

Table 3. Average changes and percent differences in Stroop test scores as a factor of age at baseline and post-intervention for 3D-multiple object tracking training group and control group.

Baseline (mean ± SD)

Post-intervention (mean ± SD)

Difference (%)

Stroop test tasks

Control

3D-MOT training

Control

3D-MOT training

Control

3D-MOT training

Off-Time

Age

62–69

76.86 ± 9.57

71.66 ± 6.14

73.48 ± 9.90

66 ± 4.96

-4.39

-7.82

70–73

76.41 ± 11.80

76.93 ± 16.55

76.66 ± 7.54

70.08 ± 11.24

0.33

-8.90

74+

86.49 ± 12.04

83.85 ± 14.18

85.03 ± 11.85

81.69 ± 14.03

-1.69

-3.90

On-Time

Age

62–69

75.8 ± 35.30

84.18 ± 11.87

86.4 ± 10.82

78.54 ± 9.78

13.98

-6.70

70–73

90.4 ± 11.46

90.63 ± 21.20

92.55 ± 17.36

80.12 ± 11.99

2.38

-11.60

74+

101.56 ± 15.21

102.33 ± 14.80

99.82 ± 18.36

89.83 ± 14.71

-1.71

-12.22

On-Time minus Off-Time

Age

62–69

19.83 ± 23.40

12.58 ± 7.36

12.92 ± 7.54

11.1 ± 8.35

-34.85

-11.76

70–73

13.99 ± 6.01

13.70 ± 9.66

15.95 ± 12.88

10.05 ± 4.51

14.01

-26.64

74+

14.97 ± 18.87

18.47 ± 10.89

15.44 ± 12.94

8.15 ± 7.42

3.14

-55.87

Following 3D-MOT training, the 74 and older group had the highest scores in the Off-Time (M = 81.69, SD = 14.03) and On-Time (M = 89.83, SD = 14.71) conditions, while participants in the 62–69 year old group had the highest scores in the On-Time minus Off-Time condition (M = 11.1, SD = 8.35) (Figure 6).

ASMHS-2019-Brian R. Christie_Canada_F5

Figure 6. Changes in time take to complete the Stroop test On-Time minus Off-Time condition as a factor of age. Scores were taken once at baseline and again 8 weeks later following 21 sessions of 3D-multiple object tracking over a 7 week period.

Percent differences were calculated for the different age groups to measure improvement in Stroop test completion post-intervention following 21 training sessions on the Neurotracker. The 70–73 year old group had the largest percent decrease in time taken to complete the Stroop test Off-Time conditions (-8.90%), while the 74+ year old group had the largest percent decrease in time taken to complete the On-Time (-12.21%) and On-Time minus Off-Time (-55.90%) conditions (Figure 7).

ASMHS-2019-Brian R. Christie_Canada_F6

Figure 7. Percent differences in Stroop test completion between baseline and following 21 sessions of 3D-multiple object tracking training over 7 weeks, as a factor of age.

Education

Scores were further analyzed to assess the influence of education level on Stroop test On-Time minus Off-Time scores. A Pearson’s correlation measurement showed that there was no significant correlation between education level and Stroop test performance pre- or post-intervention.

Discussion

The purpose of this pilot study was to evaluate the effect of 3D-multiple object tracking (MOT) training on selective attention and cognitive flexibility in the healthy aging population. Baseline Stroop test scores were assessed at the initial appointment, and again at the eighth week following 21 sessions of 3D-MOT training on the Neurotracker. Stroop scores were broken down to consider specific cognitive functions including selective attention, cognitive flexibility, and psychomotor speed. A control group was also assessed by measuring baseline Stroop test scores at the first appointment, and again at the eighth week without participating in the Neurotracker intervention. By measuring the effects of the Neurotracker pre- and post-intervention, it was hypothesized that Stroop test On-Time minus Off-Time scores would change, indicating an alteration in cognitive flexibility [42,44]. The hypothesis was supported; there was significant improvement in On-Time minus Off-Time scores following 3D-MOT training. Furthermore, scores for On-Time, measuring psychomotor speed plus cognitive flexibility, significantly improved, as did scores for the Off-Time condition, measuring psychomotor speed and selective attention. Additionally, there were no significant changes in Stroop scores measured in the control group, supporting the influence of 3D-MOT training on Stroop performance. These results suggest that weekly training sessions with the Neurotracker may improve selective attention and cognitive flexibility in older persons. There was no significant correlation between education levels and Stroop scores, consistent with previous research [44].

The improvement in cognitive performance in this study, as indicated by changes in Stroop test scores, is consistent with previous research demonstrating that customized video games serve as powerful tools to enhance cognitive control [51], processing speed [52], task switching, and working memory [53]. The current study expands on these findings by demonstrating additional benefits of computer training on selective attention, cognitive flexibility, and psychomotor speed. Two mechanisms may underlie the effect of 3D-MOT training to improve cognitive performance: isolation and overload [24,54]. Isolation refers to a limited and consistent number of cognitive abilities employed during 3D-MOT training. Overload refers to an adaptive increase in training difficulty, thereby continually challenging the participant beyond their current ability. Neurophysiological adaptation may explain the benefits of overload for cognitive-perceptual enhancement across the lifespan, and has been well documented [13,51,55].

The improvement in attention specifically, as indicated by significant decreases in On-Time minus Off-Time Stroop scores, may be due to increased activation of the neural structures and circuits employed during multiple object tracking. Increased activation in the dorsal frontoparietal attention network, and the intraparietal sulcus in particular, has been recorded by fMRI during 3D-MOT training. These neural areas are heavily involved during tasks of attending to multiple stimuli. Furthermore, a causal link has been established between increased activation of the intraparietal sulcus and improvement on MOT tasks. It is possible, then, that increased isolation and overload of these neural areas during Neurotracker completion may be responsible for improvements in attention, as measured by changes in On-Time minus Off-Time scores in the 3D-MOT training group.

A change in psychomotor speed and selective attention, as measured by Off-Time scores, was significant. This is consistent with previous research that has reported improvements in psychomotor speed following computerized cognitive interventions [19,56,57]. There is limited research, however, on changes in psychomotor speed following 3D-MOT in particular. Fragala and colleagues [58] found no significant changes in psychomotor speed, as measured by reaction time, following training with the Neurotracker. However, due to the small sample sized used in the current study, further replication is necessary to accurately assess psychomotor speed changes.

Participants in the 74 and older group had overall slower Stroop test scores compared to participants aged 62–73 years old. These results are consistent with previous research reporting decreased cognitive flexibility, attentional networks, and psychomotor speed in the oldest adults [59–61]. However, an interesting finding was the amount of improvement observed in the oldest participants; participants aged 74 and older demonstrated a significantly greater magnitude of improvement across all measurements of the Stroop test compared to younger participants, despite having overall slower scores. These results indicate that, even with a decrease in overall performance on cognitive tasks with age, learning capacity may be well preserved [62].

The age-related differences in Stroop test improvement reported in this study, however, are inconsistent with previous research [63–65], which reported plasticity and learning capacity in the oldest age groups, but at reduced levels compared to younger old adults. It is like that the sample size employed in this study was not large enough to statistically analyze distinct age groups; future research could benefit from measuring cognitive performance and learning capacity in the oldest of old following 3D-MOT training. Moreover, all members over the age of 74 years old self-reported high levels of exercise and involvement in mentally stimulating activities, such as the card game, Bridge. It is well documented that enhanced neuroplasticity is correlated with physical and mental exercise [66–68] and it is possible that, due to this, the oldest participants simply had a higher capacity for improvement, resulting in an increased learning curve. As this was a pilot study, these results should be interpreted with caution and future replication is needed to ensure reliability and validation.

Limitations

The findings may be limited by the use of the Stroop test twice throughout the course of the current study. Carryover effects may have influenced the results [69, 70]. However, Rosenbaum and colleagues [39] argue that the Stroop test is resistance to practice effects, reasoning that the randomized order of colour, spatial location, and words throughout each version of the test reduce practice effects. Furthermore, Bajaj et al. [44] demonstrated that healthy controls completing the EncephalApp showed no changes in scores across administration of the test when separated by a one-month period. This was seen as well in scores of the control group of the current study, who received no intervention. Taken together, these findings support the resistance of the Stroop test to practice effects and increase confidence that the changes in Stroop test performance observed in the current study are related to 3D-MOT training.

Additionally, the sample size employed for both the control and experimental group may limit the generalizations that can be made from these findings to the greater population of older adults. Further research would benefit from employing larger number of participants to increase confidence in the reliability and validity of the findings.

Another limitation of this study was the limited time allocated to Neurotracker training sessions. Twenty-one sessions of 3D-MOT training administered over the course of 7 weeks was selected due to time constraints. However, previous research has demonstrated that a plateau in 3D-MOT scores occurs around week ten in healthy young adults, and may take longer to reach in the older population. It may be that further 3D-MOT training could result in greater improvements on the Stroop test, indicating greater gains in attentional ability.

Notably, the use of only one cognitive task limited the findings.   Though the Stroop test has been supported as an accurate measure of attention and cognitive flexibility, the results should be replicated by further research to ensure reliability. As this was a pilot study, and there is, to our knowledge, limited research on the use of the Neurotracker as an enhancement tool for selective attention and cognitive flexibility in the older population, future research would benefit from assessing transfer effects of daily activities that are affected by age-related declines in these cognitive areas. An additional limitation relates to the use of self-reporting on neurodegenerative disease history. In the early stages of dementia, the individual may lack insight into the cognitive changes that are occurring [71]. Therefore, the use of self-reporting may not have been a true measure of cognitive status. In the future, research would benefit from using a screening test, such as the Mini Mental State Examination, a valid questionnaire to measure cognitive impairment [72, 73].

A final limitation in this study is the lack of an active control. Current research demonstrates that older adults who spend regular and meaningful time on the computer have a lower risk of developing mild cognitive impairment (MCI) and dementia [74]. Though the mechanism behind this is currently unknown, researchers Krell-Roesch and colleagues [47] attribute computer use with an increased demand for specific technical and manual skills which may have a protective effect against cognitive decline. Therefore, it is difficult to decipher whether it is the Neurotracker itself, or the use of a computer-based intervention, that is responsible for the gains in cognition measured in this study. Future research would benefit from employing an active control that consists of a Neurotracker experimental group, and a computer-based active control group.

Future Directions

The benefits of enhancement in selective attention, psychomotor speed, and cognitive flexibility as a result of training sessions with the Neurotracker have important implications for future research. Specifically, future research should examine, neurological and physiological changes can may accompany this cognitive enhancement intervention. Mozolic and colleagues [13] provided quantitative evidence that cognitive training is correlated with increased cerebral blood blow to the PFC in older persons following an attentional enhancement intervention. Similar physiology may also be seen following training sessions with the Neurotracker, would could provide a quantitative explanation for the Stroop test improvement demonstrated in this study. The use of neurological imaging and diagnostic tools, to quantitatively assess any changes occurring following 3D-MOT training, would be beneficial.

Future research could also benefit from measuring the effects of 3D-MOT on daily activities requiring attention. In this study, we have demonstrated near-transfer effects from the Neurotracker to the Stroop test, two measurements that are similar in their demands for selective attention and cognitive flexibility. Future research would benefit from demonstrating transfer effects from the Neurotracker to daily tasks that influence independence and quality of life in older adults, such as driving and balance. Legault and Faubert [27] reported transfer effects from perceptual-cognitive training, demonstrating that 3D-MOT training correlated with increased biological motion perception in the healthy older population, indicating that the benefits of the Neurotracker may not be restricted solely to similar assessment test such as the Stroop test. Future research should examine the effects of 3D-MOT training on tasks that tend to decline due to an age-related loss of attention. For example, the Useful Field of View (UFV) test is a valid measurement of driving ability, and a predictor of crash risks [75]. Future research might examine transfer effects from the Neurotracker to the UFV, assessment whether 3D-MOT influences driving ability and safety. Future research would also benefit from measuring whether the gains in attention, cognitive flexibility, and psychomotor speed are sustained in the long term. The current study has demonstrated gains in these areas one week following the end of the Neurotracker intervention. Future research would benefit from assessing whether these gains are maintained in the long term without active engagement in Neurotracker training, or whether sustained 3D-MOT training is necessary to maintain these cognitive benefits.

Conclusions

The current study demonstrated improved performance in older adults on a measure of cognitive flexibility, selective attention, and psychomotor speed as a result of 3D-MOT intervention.Further research is essential to examine structural neuroplasticity and transfer effects from the Neurotracker to daily tasks. Taken together, the results of this study suggest that the Neurotracker may be an effective tool for cognitive-perceptual enhancement in the population of older adults.

References

  1. Harada CN, Natelson Love MC, Triebel KL (2013) Normal cognitive aging. Clinics in Geriatric Medicine 29: 737–752.
  2. Murman DL1 (2015) The Impact of Age on Cognition. Semin Hear 36: 111–121. [crossref]
  3. Kirova A, Bays RB, Lagalwar S (2015) Working memory and executive function decline across normal aging, mild cognitive impairment, and Alzheimer’s disease. BioMed Research International 2015: 748212.
  4. Salthouse TA (2009) When does age-related cognitive decline begin? Neurobiology of Aging 30: 507–514.
  5. Turner GR, Spreng RN (2012) Executive functions and neurocognitive aging: Dissociable patterns of brain activity. Neurobiology of Aging 33: 826.
  6. Eidels A, Townsend JT, Algom D (2009) Comparing perception of Stroop stimuli in focused versus divided attention paradigms: Evidence for dramatic processing differences. Cognition 114: 129–150.
  7. Karthaus M, Falkenstein M (2016) Functional changes and driving performance in older drivers: Assessment and interventions. Geriatrics 1: 12.
  8. Richardson ED, Marottoli RA (2003) Visual attention and driving behaviors among community-living older persons. The Journals of Gerontology. Series A, Biological Sciences and Medical Sciences 58: 832–836.
  9. Svetina M (2016) The reaction times of drivers aged 20 to 80 during a divided attention driving. Traffic Injury Prevention 17: 810–814.
  10. Coubard OA, Duretz S, Lefebvre V, Lapalus P, Ferrufino L (2011) Practice of contemporary dance improves cognitive flexibility in aging. Frontiers in Aging Neuroscience 3: 1–12.
  11. Aron AR, Monsell S, Sahakian BJ, Robbins TW (2004) A compenential analysis of task-switching deficits associated with lesions of left and right frontal cortex. Brain 127: 1561–1573.
  12. Johnson MK, Mitchell  KJ, Raye CL, Greene EJ (2004) An age-related deficit in prefrontal cortical function associated with refreshing information. Psychological Science 15: 127–132.
  13. Mozolic JL, Hayasaka S, Laurienti PJ (2010) A cognitive training intervention increases resting cerebral blood flow in healthy older adults. Front Hum Neurosci 4: 16.
  14. Zamroziewicz MK, Zwilling CE, Barbey AK (2016) Inferior prefrontal cortex mediates the relationship between phosphatidylcholine and executive functions in healthy, older adults. Frontiers in Aging Neuroscience 8: 226.
  15. Cabeza R, Nyberg L (2000) Imaging cognition II: An empirical review of 275 PET and fMRI studies. J Cogn Neurosci 12: 1–47.
  16. Milham MP, Erickson KI, Banich MT, Kramer AF, Webb A et al. (2002)Attentional control in the aging brain: insights from an fMRI study of the stroop task. Brain Cogn 49: 277–296.
  17. Raz N (2000) Aging of the brain and its impact on cognitive performance: Integration of structural and functional findings. In: Craik, F.I.M. and Salthouse, T.A., Eds., The Handbook of Aging and Cognition, Lawrence Erlbaum Associates, Mahwah Pg No: 1–90.
  18. Solbakk, A., Fuhrmann, A., Furst, A., Hale, L., Oga, T., Chetty, S., Pickard, N, & Knight, R. (2008). Altered prefrontal function with aging: Insights into age-associated performance decline. Brain Res, 1232, 30–47.
  19. Bherer L, Kramer AF, Peterson MS, Colcombe S, Erickson K (2006) Testing the limits of cognitive plasticity in older adults: Application to attentional control. Acta Psychologica 123: 261–278.
  20. Kheirbek, M., & Hen, R. (2013). (Radio)active neurogenesis in the human hippocampus. Cell, 153, 1183–1184.
  21. Valkanova, V., Eguia, Rodriguez R., Ebmeier, K. (2014). Mind over matter – what do we know about neuroplasticity in adults? Int Psychogeriatr 26, 891–909.
  22. Pylyshyn, Z.W., & Storm, R.W. (1988). Tracking multiple independent targets: Evidence for a parallel tracking mechanism. Spatial Vision, 3: 179–197.
  23. Scholl  BJ (2009) What have we learned about attention from multiple-object tracking (and vice-versa)? In Computation and Pylyshyn (pp. 49–77). Cambridge, MA: MIT Press.
  24. Romeas T, Guldner A, Faubert J (2016) 3D-multiple object tracking training task improves passing decision-making accuracy in soccer players. Psychology of Sport and Exercise 22: 1–9.
  25. Faubert J, Sidebottom L (2012) Perceptual-cognitive training of athletes. Journal of Clinical Sport Psychology 6: 85–102.
  26. Faubert J (2013) Professional athletes have extraordinary skills for rapidly learning complex and neutral dynamic visual scenes. Scientific Reports 3: 1154.
  27. Legault I, Faubert J (2012) Perceptual-cognitive training improves biological motion perception: evidence for transferability of training in healthy aging. Neuroreport 23: 469–473.
  28. Legault I, Allard R, Faubert J (2013) Healthy older observers show equivalent perceptual-cognitive training benefits to young adults for multiple object tracking. Frontiers of Psychology 4: 323.
  29. Oshin V (2016) 3D multiple object tracking boosts working memory span: Implications for cognitive training in military populations. Military Psychology 28: 353–360.
  30. Parsons, B., Magill, T., Boucher, A., Zhang, M., Zogbo, K., Bérubé, S., . . . Faubert, J. (2014). Enhancing cognitive function using perceptual-cognitive training. Clinical EEG and Neuroscience, 47, 37–47.
  31. Drew T, McCollough  AW (2009) Attentional enhancement during multiple-object tracking. Psychonomic Bulletin & Review 16: 411–417.
  32. Colzato LS, van Leeuwen PJA, van den Wildenberg WPM, Hommel B (2010) DOOM’d to switch: Superior cognitive flexibility in players of first person shoot games. Frontiers of Psychology 1: 8.
  33. Vul E, Frank M, Alvarez G, Tenenbaum J (2009) Explaining human multiple object tracking as resource constrained approximate inference in a dynamic probabilistic model. Advances in neural information processing systems 22: 1955–1963.
  34. Trick LM, Perl T, Sethi N (2005) Age-related differences in multiple-object tracking. J Gerontol B Psychol Sci Soc Sci 60: 102–105. [crossref]
  35. Tomasi D, Volkow ND (2012) Aging and functional brain networks. Molecular psychiatry 17: 471–558.
  36. Andrade C, Radhakrishnan R (2009) The prevention and treatment of cognitive decline and dementia: An overview of recent research on experimental treatments. Indian Journal of Psychiatry 51: 12–25.
  37. Konar A, Singh P, Thakur MK (2016) Age-associated cognitive decline: Insights into molecular switches and recovery avenues. Aging Disorders 7: 121–129.
  38. Faubert J (2001) Motion parallax, stereoscopy, and the perception of depth: Practical and theoretical issues. In B. Javidi,  F. Okano (Eds.), Three-dimensional video and display: Devices and systems (CR76, pp. 168–191), Proceedings of SPIE.
  39. Hairston WD, Maldjian JA (2009) An adaptive staircase procedure for the E-prime programming environment. Computer Methods and Programs in Biomedicine 93: 104–108.
  40. Allampati S, Duarte-Rojo A, Tacker LR, Patidar KR, White MB, et al. (2016) Diagnosis of minimal hepatic encephalopathy using Stroop EncephalApp: A multicenter US-based norm-based study. American Journal of Gastroenterology 111: 78–86.
  41. Barbarotto R, Laiacona M, Frosio R, Vecchio M, Farinato A, et al. (1998) A normative study on visual reaction times and two Stroop colour-word tests. Ital J Neurol Sci 19: 161–170.
  42. Bench CJ, Frith CD, Grasby PM, Friston KJ, Paulesu E, et al. (1993) Investigations of the functional anatomy of attention using the Stroop test. Neuropsychologia 31: 907–922. [crossref]
  43. Macleod, C. (1991). Half a century of research on the Stroop effect: An integrative review. Psychological Bulletin, 109(2), 163–203.
  44. Bajaj JS, Heuman DM, Sterling RK, Sanyal AJ, Siddiqui M, et al. (2016) Validation of EncephalApp, smartphone-based Stroop test, for the diagnosis of covert hepatic encephalopathy. Clinical Gastroenterolgy Hepatology 13: 1828–1835.
  45. Rosenbaum AM, Arnett PA, Bailey CM, Echemendia RJ (2006) Neuropsychological assessment of sports-related concussion: Measuring clinically significant change. (pp. 137–169). Boston, MA: Springer US.
  46. Ball K, Berch DB, Helmers KF, Jobe JB, Leveck MD, et al. (2002) Advanced Cognitive Training for Independent and Vital Elderly Study Group.  Effects of cognitive training interventions with older adults: A randomized controlled trial. Jama 288: 2271–2281.
  47. Krell-Roesch J, Vemuri P, Pink A, Roberts RO, Stokin GB, et al. (2017). Association between mentally stimulating activities in late life and the outcome of incident mild cognitive impairment, with an analysis of the APOE e4 genotype. JAMA Neurology 74: 332–338.
  48. Royston, P. (1992). Approximating the Shapiro-Wilk W-test for non-normality. Statistics and Computing, 2, 117–119.
  49. West SG, Finch JF, Curran PJ (1995) Structural equation models with nonnormal variables: Problems and remedies. In: R.H. Hoyle (Ed.), Structural equation modeling: Concepts, issues and applications Newbery Park, CA: Sage. Pg No: 56–75.
  50. Cohen  J (1988) Statistical power analysis for the behavioural sciences (2nd edn). Hillsdale, N.J: L. Erlbaum Associates.
  51. Anguera JA, Boccanfuso J, Rintoul JL, Al-Hashimi RO, Faraji F, et al. (2013) Video game training enhances cognitive control in older adults. Nature 501: 97–101.
  52. Ball K, Edwards JD, Ross LA (2007) The impact of speed of processing training on cognitive and everyday functions. J Gerontol B Psychol Sci Soc Sci 62: 19–31.
  53. Basak C, Boot WR, Voss MW, Kramer AF (2008) Can training in a real-time strategy video game attenuate cognitive decline in older adults? Psychology and Aging 23: 765–777.
  54. Parsons B, Magill T, Boucher A, Zhang M, Zogbo K, et al. (2016) Enhancing cognitive function using perceptual-cognitive training. Clinical EEG and Neuroscience 47: 37–47.
  55. Envig A, Fjell AM, Westlye LT, Moberget T, Sundseth O, et al. (2010) Effects of memory training on cortical thickness in the elderly. Neuroimage 52: 1667–1676.
  56. Bherer L, Kramer AF, Peterson MS, Colcombe S, Erickson K, et al. (2008) Transfer effects in task-set cost and dual-task cost after dual-task training in older and younger adults: Further evidence for cognitive plasticity in attentional control in late adulthood. Experimental Aging Research 34: 188–219.
  57. Bisson E, Contant B, Sveistrup H, Lajoie Y (2007) Functional balance and dual-task reaction times in older adults are improved by virtual reality and biofeedback training. CyberPsychology & Behavior 10: 16–23.
  58. Fragala MS, Beyer KS, Jajtner AR, Townsend JR, Pruna GJ, et al. (2014). Resistance exercise may improve spatial awareness and visual reaction in older adults. Journal of Strength and Conditioning Research, 28, 2079–2087.
  59. Gesta-Martino E, Ott BR, Heindel WC (2004) Interactions between phasic alerting and spatial orienting: Effects of normal aging and Alzheimer’s disease. Neuropsychology 18: 258–268.
  60. Gunstad J, Paul RH, Brickman AM, Cohen RA, Arns M, et al. (2006) Patterns of cognitive performance in middle-aged and older adults: A cluster analytic examination. Journal of Geriatric Psychiatry and Neurology 19: 59–64.
  61. Zhou S, Fan J, Lee TMC, Wang C, Wang K (2011) Age-related differences in attentional networks of alerting and executive control in young, middle-aged, and older Chinese adults. Brain and Cognition 75: 205–210.
  62. Clark R, Freedberg M, Hazeltine E, Voss MW (2015) Are there age-related differences in the ability to learn configural responses? PLoS One 10.
  63. Kliegl R, Smith J, Baltes PB (1990) On the locus and process of magnification of age differences during mnemonic training. Developmental Psychology 26: 894–904.
  64. Yang L, Krampe RT, Baltes PB (2006) Basic forms of cognitive plasticity extended into the oldest-old: Retest learning, age, and cognitive functioning. Psychology and Aging 21: 372–378.
  65. Singer T, Lindenberger U, Baltes PB (2003) Plasticity of memory for new learning in very old age: a story of major loss? Psychol Aging 18: 306–317. [crossref]
  66. Clarkson-Smith L, Hartley AA (1990) The game of bridge as an exercise in working memory and reasoning. J Gerontol 45: 233–238. [crossref]
  67. Gajewski PD, Falkenstein M (2016) Physical activity and neurocognitive functioning in aging – a condensed updated review. European Review of Aging and Physical Activity: Official Journal of the European Group for Research into Elderly and Physical Activity 13: 1.
  68. Williams K, Kemper S (2010) Exploring interventions to reduce cognitive decline in aging. J Psychosoc Nurs Ment Health Serv 48: 42–51.
  69. Collie A, Maruff P, Darby DG, McStephen M (2003) The effects of practice on the cognitive test performance of neurologically normal individuals assessed at brief test-retest intervals. Journal of the International Neuropsychological Society 9: 419–428.
  70. Goldberg TE, Harvey PD, Wesnes KA, Snyder PJ, Schneider LS (2015) Practice effects due to serial cognitive assessment: Implications for preclinical alzheimer’s disease randomized controlled trials. Alzheimer’s & Dementia (Amsterdam, Netherlands) 1: 103–111.
  71. Rajan KB, Wilson RS, Weuve J, Barnes LL, Evans DA (2015) Cognitive impairment 18 years before clinical diagnosis of alzheimer disease dementia. Neurology 85: 898.
  72. O’Bryant SE, Humphreys JD, Smith GE, Ivnik RJ, Graff-Radford NR, et al. (2008) Detecting dementia with the mini-mental state examination in highly educated individuals. Archives of Neurology 65: 963–967.
  73. Santacruz  KS, Swagerty D (2001) Early diagnosis of dementia. American Family Physician 63: 703.
  74. Liapis J, Harding KE (2017) Meaningful use of computers has a potential therapeutic and preventative role in dementia care: A systematic review. Australasian Journal on Aging 36: 299–307.
  75. Wood JM, Owsley C (2014) Useful field of view test. Gerontology 60: 315–318. [crossref]

Microemulsions and Nanoparticles as Carriers for Dermal and Transdermal Drug Delivery

DOI: 10.31038/JPPR.2019241

Abstract

The major obstacle of dermal and transdermal therapeutics is the low penetration rate of xenobiotics through the skin due to the diffusional barrier of its upper layer, the stratum corneum. A wide array of techniques has been proposed thus far, however, recent developments in the application of nanosystems for topical drug administration have gained much interest and optimism. In this review, we provide a comprehensive overview of the main types of nanocarriers that have been studied and developed up-to-date. We conclude that the nanosystems may become a useful dosage form for a variety of dermally active principals by modulating drug transfer and serving as nontoxic penetration enhancers.

Keywords

Microemulsion, Nanoparticles, Skin Permeation, Transdermal Drug Delivery, Nanotechnology.

Introduction

An optimal pharmaceutical dosage form aims at delivering an active compound to a target organ at therapeutic concentrations, while avoiding or reducing side effects and simplifying the dosing regimen of the patients. Percutaneous drug delivery is one of the promising pharmaceutical approaches since it can provide a continuous delivery for hours or days creating constant drug levels. The transdermal delivery can be advantageous in particular for drugs with a high renal or hepatic clearance, i.e., those that undergo oral first-pass metabolism and drugs with short half-lives that would otherwise need a frequent dosing regimen. The quick and short-acting BCS class II drugs with a very short half-life like the antidiabetic repaglinide, are ideal candidates for transdermal drug delivery [1]. In addition to the potential improvement in the medication regimen, the transdermal route can cause a considerable impact in medical practice, clinically and economically, by improving the treatment compliance and reducing the need for medical services. In an observational study of a population with Alzheimer’s disease [2], a high proportion of patients have switched from oral to transdermal rivastigmine, which has eventually resulted in increased patient satisfaction and stress relief for caregivers through the use of the patch under daily practice conditions. The ultimate goal, though not easy to fulfill, for all new forms of transdermal formulations is to achieve a quantitative drug permeation through the skin, taking into account that the skin is an excellent barrier and basically difficult to penetrate. This constraint is evidenced by the fact that after more than 30 years since launching the first transdermal drug product, there have been only 30 transdermal products on the US market for just 20 drug molecules [3,4]. Nevertheless, due to the advantages of transdermal drug delivery and the potential benefit for millions of patients every year, tremendous research efforts have been made to challenge the skin penetration problem. Many techniques have been developed to enhancing transdermal drug permeation using physical or chemical methods. The latter include prodrugs, salt formation, ion pairing, chemical enhancers, as well as nano-formulation approaches such as microemulsions, nanoemulsions, solid lipid nanoparticles, polymeric nanoparticles, nanostructured lipid, liposomes and others [5–10]. Microemulsions (MEs), and nanoparticles which includes lipid nanoparticles (SLNs and NLCs) and solid polymeric nanoparticles (PNPs), three nanotechnology-based dosage forms (see Table 1 and Fugure 2), have been drawn much attention during the last decade. Owing to their physicochemical properties, these systems are proposed as vectors to deliver active compounds through the stratum corneum, epidermis, and dermis, in order to obtain dermal, regional, and systemic effects. It should be noted that dermal and transdermal drug delivery systems are both being designed to overcome the main barrier of the skin, the stratum corneum, and the terminological difference between them relates to the extent of the molecular flux through the skin. Unfortunately, due to the selective nature of the stratum corneum, only a small group of drugs loaded in these novel formulations can be delivered at a therapeutically relevant dosage [11]. In this review, we summarize the immense work done so far aiming to challenge the skin barrier by the three types of nano-sized drug delivery systems.

Table 1. MEs, PNPs and SLNs for drug delivery to and through the skin.

JPPR 19 - 122_Amnon Sintov_F3
JPPR 19 - 122_Amnon Sintov_F4

Topical Pharmaceutical Forms and Challenges in Transporting Drugs via the Transdermal Route

Since the US Food and Drug Administration have approved the first scopolamine transdermal patch for motion sickness in 1979, the pharmaceutical industry has centered their efforts on transdermal formulation research for other drugs. Between 1970 to 1980, the first generation of the transdermal system included patches that designed as a drug reservoir with a semi-permeable membrane placed over the skin that controls drug release. Later, in the next decade (1980–1990), patches made of polymeric matrices entrapping the drug within pores and channels were introduced into the market. Today, almost 20 drugs have been successfully incorporated into transdermal drug delivery systems to reach systemic circulation or to treat local disorders. Commercial transdermal systems contain drugs such as clonidine, fentanyl, estradiol, nicotine, rotigotine, estradiol, oxybutynin, testosterone, nitroglycerin, and others [3]. The transdermal dosage forms have become attractive for patients due to their simplicity, immediate application, and prompt termination whenever desired [12–15].

Advantages of Transdermal Drug Delivery

Transdermal drug delivery has a significant advantage of bypassing the hepatic first-pass metabolism, thereby improving drug bioavailability. In addition, the transdermal route can avoid possible gastrointestinal degradation and instability of some orally- administered drugs and/or unwanted mucosal irritation caused by drugs like non-steroidal anti- inflammatory drugs (NSAIDs). The transdermal benefits were exemplified in a research performed with flurbiprofen, one of the most potent members of the phenylalkanoic acid series of NSAIDs [16]. After its oral administration, the most frequently reported side effects of flurbiprofen are abdominal discomfort, diarrhea, constipation, emesis and abdominal distention [17]. Furthermore, it has a short half-life of 3.9 h, which requires frequent dosing that obviously increases these symptoms. These drawbacks make flurbiprofen a perfect candidate for the transdermal route, especially for the prolonged therapy of rheumatoid arthritis and its related disorders. Charoo et al. [18] have shown that the bioavailability of flurbiprofen in albino rats increased up to 5.56 times with transdermal patch formulation compared to its oral administration. The results were confirmed by pharmacodynamic studies in a rat edema inflammation model [18]. Another attractive advantage of the transdermal drug delivery systems is the reduction of toxic side effects by keeping a steady state plasma drug level with less peak-to-trough variations. The necessity of the transdermal route is also exemplified by the scopolamine patch that was designed to prevent motion sickness for an extended duration of time. Its dermal application accompanies with none or minimal adverse effects, which are usually associated with the oral or parenteral bolus therapy of antimuscarinic drugs (mainly dry mouth, drowsiness and some more reactions including hallucinations) [19, 20]. Finally, the improved patient compliance due to non-invasive, easy drug administration, and the natural capability of controlled and sustained drug release make this dosage form attractive. It may also effectively serve the elderly population, especially people suffering from dysphagia and neurological disorders that lead to non- compliance [21]. Similarly, it may serve infants and children who also require compliant medications [22]. As it has already been recognized that drug compliance is quite substantial, the transdermal drug delivery can resolve the compliance problems, reducing the need for injections and oral administration of medications to vulnerable pediatric and geriatric patients [23, 24]. In developing countries, children, unfortunately, die from easily treatable diseases (e.g., malaria) due to poor compliance, e.g., difficulties to properly swallow medications or inconsistent multiple dosing. Poor patient compliance can also result in antibiotic resistance, which is one of the biggest threats to global health.

Limitations of Transdermal Drug Delivery

Despite the considerable advantages some major drawbacks limit the transdermal patch from being a generally-used drug delivery system. A substantial limitation of the transdermal route is a poor permeation of many active molecules through the skin, wherein the stratum corneum plays the primary barrier. A relatively high skin penetration usually takes place with low molecular weight drug molecules (< 500 kDa), light lipophilicity, and high potency (daily dose < 10 mg) [25–27]. Due to these limitations, it is therefore difficult to frequently employ the transdermal route. Thus, it is a great challenge and almost an impossible mission to deliver large hydrophilic molecules (i.e., high molecular weight/poor lipophilicity) such as antibodies, peptides, proteins, and hormones. Besides, possible skin irritation and sensitization caused by the formulation and/or the adhesive band may be detrimental during the treatment. It should be taken into consideration that a drug that accumulates in the skin may be irritant if it stays for a relatively long time inside the skin layers. Therefore, it is essential to investigate the skin pharmacokinetics not only during the patch application but also after the application is over (patch removal). An excellent example of skin toxicity by accumulation is captopril, which its irritation activity could be diminished only by including penetration enhancer, antioxidant, anti-irritant and chelating agent in the transdermal formulation [28]. Inter- and intra-subject variability of skin permeability due to patient skin conditions may also be a problem. Fentanyl, a potent synthetic opioid that has been used in transdermal drug delivery systems, has caused an extensive interindividual variation in dermal penetration with maximal fluxes ranging between 21 to 105 ng/cm2/h in in vitro studies [29].

Finally, it is well known that the most common drug-metabolizing enzymes are expressed in the skin, which is the largest organ of the human body. Among them are cytochromes P450, flavin monooxygenases, glutathione-S-transferases, N-acetyltransferases, and sulfotransferases [30, 31]. Their activity in the skin may cause either drug biotransformation that leads to inactivation [32], or prodrug biotransformation that leads to pharmacological activation [33, 34]. Any pre-systemic metabolism that may occur in the skin should be taken into account when transdermal patch is designed and developed.

The Skin Barrier

Skin is the largest and accessible organ of the body, covering a surface area of approximately 2m2 depending on the individual weight and height. It is also one of the most multifunctional organs, forming a protective barrier against many different factors including ultraviolet radiation, pathogens, and xenobiotics. It allows, however, an exchange of gases and toxins with the external environment. Additionally, it prevents water loss but regulates body temperature in humans through sweat secretion. The thickness of the skin is a few millimeters, possessing two primary structures:

  1. The epidermis, an avascular layer, measures 50 to 100 µm in thickness. This layer can be further divided into four distinct strata according to the corresponding cell differentiation: stratum basale, stratum spinosum, stratum granulosum, and the outer stratum corneum (SC). The latter is the outermost layer, which is 10 to 20 µm thick and is generally accepted as the primary membranal barrier for topically applied xenobiotics. This barrier is constructed as a ‘brick and mortar’ structure, where the bricks represent dead corneocyte cells composed primarily of cross-linked keratin and the intercellular mortar is a mixture of lipids organized in bilayers. The extracellular medium consists principally of neutral lipids such as cholesterol, ceramides and fatty acids, including linoleic acid that is deemed to play a significant role in the barrier function [35]. The SC is commonly recognized as the most predominant barrier for drug delivery, therefore, it has become the target for variously designed nanocarriers. By transporting the SC, the drug could be released from its carrier and retained in the skin, known as topical drug, or could be dragged through the skin into the blood, an action known as transdermal drug. Whatever is the mechanism of drug release, the act of transporatation through the SC barrier by the nanocarrier is of great importance for transdermal researchers.
  2. The dermis, covered by the epidermis, possesses 1–2 mm thickness and contains a highly capillary area just below the dermal-epidermal junction. Drug molecules that reach the dermis are available for systemic drug absorption via the capillary area. The dermis represents another active layer of the skin that holds the hair muscles, blood supply, sebaceous glands, and nerve receptors.

Although the skin consists of various membranal layers and cell types, it is acceptable that the stratum corneum layer is the one that controls the entrance of xenobiotics, and despite its incredible thin thickness it provides an effective barrier for maintaining homeostasis [36]. The passage of a xenobiotic through the skin can follow three diffusive pathways (Figure 1): transcellular (intracellular), paracellular (intercellular), and appendageal (through eccrine sweat glands or hair follicles). The transepidermal pathway (intracellular and intercellular) requires crossing through the stratum corneum, i.e., corneocytes and lipid-dominant extracellular lamellar membrane structures. Polar drugs following the intracellular route can cross through corneocytes, while apolar drug molecules undergo intercellular transport through the continuous lipid matrix. The transappendageal route comprises a passage of molecules through the hair follicles or sweat glands; however, it is considered as a less significant route for most drugs [37].

JPPR 19 - 122_Amnon Sintov_F1

Figure 1. Illustration of a cross-section view of human skin, where the three possible xenobiotic penetration pathways are signaled: a) intracellular, b) intercellular, c) follicular or appendageal. The upper left inset indicates the stratum corneum, viable epidermis, and dermis.

Commonly, to obtain quantitative transdermal drug absorption to the dermis and blood circulation, a temporary disruption of the skin barrier function is required [38]. This process can proceed in three different steps. Initially, the molecule enters into the outer skin stratum, the SC (i.e., skin penetration). In the next step, it passes through one stratum to another, which is defined and known as permeation, and finally reaches the dermis and the vascular system (i.e., absorption). The physicochemical characteristics of the molecules determine the route of drug penetration through the stratum corneum [39]. It has been reported that hydrophilic molecules usually prefer the intracellular (transcellular) route, due to the low affinity of these molecules to lipids existing on the surface and between the corneocytes [40]. However, this pathway is considered to be most difficult due to the complexed lipid bilayers crossing. Moreover, if a drug is very hydrophilic, it would be unable to partition from the topical aqueous delivery system into the SC. In contrast, a highly lipophilic drug is unable to transfer into the epidermis and will retain in the SC. Like the intracellular route, the appendages are also considered as a less significant route, because they occupy a limited surface area (~0.1%) [41]. Altogether, the relative importance of the skin appendages depends on the intrinsic physical properties of the test molecules or delivery systems as well as the time of application [42]. Nevertheless, the appendages represent important reservoir structures and are considered as shunt penetration pathways [43]. In fact, the pilosebaceous units are key anatomic compartments for particle-based drug delivery systems. Nanoparticles in particular can be accumulated in the follicular openings and penetrate along the follicular duct [44, 45]. However, the hair follicle types and dimensions significantly vary among the different body regions, which make the delivery rate and extent via this route inconsistent in nature. It has been noted that while terminal hair follicles of the scalp and the dilated acne pores can conveniently be reached with particles in the submicron size range, penetration in hair follicles of the body vellum is limited to smaller particles sizes [46]. Despite its high tortuosity, the intercellular (paracellular) pathway of xenobiotics along the lamellar lipids between the corneocytes is widely considered as the main route for a few drugs but a significant barrier to permeation for most drugs. Therefore, it is commonly accepted that an optimal drug candidate for transdermal delivery should be lightly lipophilic (log octanol-water partition coefficient or logP = 1–3), possessing a low molecular weight (MW <500 Da), and a low melting point (m.p. <200 °C) [25, 47]. Basically, the intercellular and follicular route, at least in healthy skin, may be the most relevant for penetration of drug-loaded nanoparticles into the skin, but not for penetration of most drug molecules in their free and soluble form. Impenetrable large particles, rather than nanoparticles, deposited in furrows atop the stratum corneum may continuously release their payload, which may become effective only if the active molecules show suitable features for skin penetration such as described above.

Currently New Transdermal Drug Delivery Nano-Systems

There has been always of great importance for the pharmaceutical and cosmetic researchers to develop more “cost-effective/ delivery-efficient” vehicles. In particular, major efforts have been made for development of vehicles possessing an appropriate ability to carry hydrophilic and high molecular weight active molecules through the stratum corneum, molecules that are naturally impenetrable into the skin. These vehicles should be designed to bring about efficient penetration and maximization of drug bioavailability thus providing therapeutic drug concentrations. During the last decades, extensive research has been done to overcome the skin barrier and novel formulations and techniques have been developed to achieve this goal. They can be roughly classified into physical and chemical methods. The physical or the active methods include iontophoresis [48], electroporation [49], sonophoresis [50], fractional ablation [51], and micro-needles [52], and are used as a driving force to obtain drug skin permeation from a topical formulation. The iontophoretic method applies an electrical field to drive ionized drug molecules across the skin membrane, electroporation treats the skin with a high electrical voltage for a short period of time, and sonophoresis uses ultrasonic waves to improve drug diffusion. On another hand, there are chemical strategies that include chemical permeation enhancers that perturb the skin structure [53], prodrugs, and nanoformulations (or nanostructured systems) such as polymeric nanoparticles, solid lipid nanoparticles, and microemulsions (see Figure 2). Nanostructure systems represent an alternative to the traditional formulations due to their ability to facilitate drug delivery to structural features of the skin like hair follicles or interact with skin lipids to mediate transportation. Diverse parameters affect the penetration of nanostructures including size, shape as well as their deformability. The relevance of the size for nanoparticle permeation has not yet been conclusive, and that is because several other physicochemical properties of the nanoparticles may also affect, such as ζ potential and surface modification.

JPPR 19 - 122_Amnon Sintov_F2

Figure 1.Figure 2. Schematic illustration of (from left to right): Solid lipid nanoparticles, Polymeric nanoparticles, and Microemulsion.

Microemulsion

Microemulsions (MEs) have gained an important role since it has widely demonstrated to significantly enhance transdermal permeation of drugs compared to the conventional dosage forms such as simple gels, ointments or creams (macroemulsions) [54]. A microemulsion is a mixture of two immiscible liquids, surfactant, and a cosurfactant, forming an optically isotropic structured liquid. Even though it macroscopically appears as a single-phase system, it is a multiphasic system on a nanoscale, being considered as a dispersion of nanodroplets. MEs are thermodynamically stable (interfacial tension is nearly zero) and are spontaneously formed while not requiring an input of energy. The ME formulation is beneficial for transdermal and dermal delivery of drugs, primarily since the diffusivity and the partitioning into the skin is significantly increased due to its high capacity, namely, a high quantity of drug that can be incorporated in the formulation. Furthermore, the microemulsion ingredients that create its unique composition may reduce the diffusional barrier of the stratum corneum and enhance skin permeation [55–58]. For instance, the hydration effect of the microemulsion on the stratum corneum has been reported to affect skin permeation [7,59]. In addition, ME formulations are capable of solubilizing and delivering both hydrophilic (in W/O MEs) and lipophilic drugs (in O/W MEs). Consequently, many studies have demonstrated an improvement in drug bioavailability and stability by using MEs. Gannu et al. [60] developed a microemulsion-based transdermal therapeutic system for lacidipine, which is a poorly water-soluble (logP=4.5) and poorly bioavailable drug. The results demonstrated a 3.5 times improvement in the bioavailability of lacidipine after transdermal administration of microemulsion gel compared to oral suspension. Other promising results have been reported by Said et al. [61] who studied the delivery of agomelatine by the transdermal route using microemulsions. An approximate value of 40-fold enhancement in drug permeation through rat skin was demonstrated when compared to the same drug in a hydrogel formulation.

Despite their benefits, MEs are not exempt from disadvantages. In order to produce stable nanodroplets with an ultra-low interfacial tension, high concentrations of surfactants (30–60%) are usually required. These excessive concentrations of surfactants may lead to skin irritation and toxicity. Additionally, due to the use of high concentrations of surfactants and co-surfactants, microemulsions can be affected by environmental parameters such as temperature, ionic strength, dilution, and pH. The effectiveness of MEs for transdermal drug delivery depends on several interconnected factors such as the microstructure, type, size, and shape of the nanodroplets. The transport efficacy through the skin layers also depends on how a drug or an active compound is incorporated in the MEs droplets, either dissolved in their core or attached at the interface. It has also been reported that MEs components can play an essential role as penetration enhancers, by disrupting the lipid structure of the stratum corneum or increasing the partition coefficient between the vehicle and the skin [62]. However, the penetration mechanism is additionally dependent on the stratum corneum properties and the physicochemical properties of the active compound [63]. Hathout et al. [64] have designed a study to evaluate how a microemulsion component induces changes in the stratum corneum. It has been shown that there was a proportional relationship between the perturbation degree of the stratum corneum and the concentration of the components that had topically applied on the skin [65]. They have shown that the use of unsaturated fatty acids, such as oleic acid, can decrease the conformational order of the stratum corneum lipids and induce some phase separation. Other studies have confirmed that the stratum corneum uptake of oleic acid, Tween 20 and Transcutol®, which are commonly used as MEs components, is increased after application of MEs compared to application  of the pure chemicals [64]. Another interesting research evaluated the transdermal delivery of indomethacin in eugenol microemulsion by the rabbit ear model [66], showing a greater flux compared with that obtained from a saturated aqueous solution. This penetration enhancement can  be explained by the the activity of eugenol and the synergistic effect obtained with PEG. Also, the microemulsions that contained a high eugenol concentration and Polyethylene Glycol (PEG) were able to increase the loading capacity of indomethacin as evidenced by a significant improvement in the solubility of the drug in these formulations compared to its water solubility (logP of indomethacin=4.46). In another study, ME was prepared with cineole as a chemical enhancer, a combination that promoted a higher skin permeation of zidovudine [67]. Zidovudine, a poorly bioavailable drug with a short half-life of 0.53h, significantly permeated through pig ear skin and snake skin from the cineole containing ME (by three-fold) compared with the control. It is well known that permeation enhancers may act on the skin through diverse mechanisms, such as by disruption of the lipid bilayer of the SC, or by interaction with skin proteins (e.g., denaturation, conformational modification). Specifically, cineole disorganizes the lipid bilayers and decreases SC property as a barrier.

Microemulsions can also act as skin permeation promoters by their nanostructural virtue. In a series of studies performed at Ben-Gurion University in Israel, the advantage of a microemulsion system has been established with no need of penetration enhancers or alcohols [8, 68–70]. The skin bioavailability of lidocaine was improved by a microemulsion system composed of glyceryl oleate and polyoxyl 40 fatty acids (as the surfactants), isopropyl palmitate as the oil, and tetraglycol as the co-surfactant [68]. The in vitro transdermal permeation of lidocaine was significantly increased from the microemulsion compared to lidocaine permeation from a macroemulsion, oil-free micellar system, and a surfactant mixture only (water-free). Similarly, the transdermal administration of diclofenac-containing microemulsion to rats resulted in 8-fold higher plasma levels of the drug than those obtained after application of Voltaren Emulgel® [8]. The diclofenac microemulsion contained the same ingredients as in lidocaine formulation [68], i.e., glyceryl oleate and polyoxyl 40 fatty acid, isopropyl palmitate tetraglycol. Caffeine permeation across fresh skin excised from rat, rabbit, and pig was highly enhanced when formulated in microemulsion composed of Labrasol®, glyceryl oleate, isopropyl palmitate, propylene carbonate and water [69]. The transdermal permeation rate of caffeine was higher via microemulsion than the rates measured after caffeine in Labrasol® solution, caffeine in an oil-free micellar system, and caffeine in a surfactant-oil mixture. These findings indicate once more that the mechanism of drug permeation through the skin is based on the microemulsion’s vesicular nature rather than on chemical enhancement driven by its surfactant excipients. In another study which was carried out by our group to evaluate transdermal curcumin permeation [70], it has also been established that microemulsion vehicle was advantageous over a micellar system and a surfactant-oil mixture, composed of the same proportions of ingredients.

Polymeric Nanoparticles

The use of polymeric materials for entrapping drugs and active substances in a solid envelope is an apparent approach selected to mask the intrinsic physicochemical properties of active compounds that are inapplicable for skin permeation. Polymeric nanoparticles, which are defined as nanosystems with particle sizes of tens and hundreds of nanometers in diameters, have frequently been given more descriptive names, such as nanocapsules or nanospheres, depending on their morphology. The presence of an inner core (aqueous or oily solution) in nanocapsules leads to a vesicular structure while its absence in nanospheres provides a matrix structure of the polymeric matter. The drug can be entrapped in the core (nanocapsules) or the channels and cavities of the matrix (nanospheres) as a dispersion (in a saturated solution), as a solution, or as a complex with the polymer. Due to their inherent complexity, nanoparticles made of polymers have shown to be an excellent carrier for controlled and sustained delivery of drugs [71, 72]. Their surface may also be modified in order to carry out an active or passive drug delivery [73, 74].

The pharmaceutical properties of polymeric nanoparticles (PNPs) (e.g., drug stability, release mechanism) depend essentially on the type of the polymer. For example, instability has been encountered in calcium alginate nanoparticles that led to fast and uncontrolled drug release profiles after oral administration [75]. Similar results have been shown in gliadin nanoparticles [76]. The proteinaceous nature of gliadin makes its nanoparticles highly sensitive to pH changes or ionic strength alterations, so they may dissolve or aggregate depending on the environmental conditions in the alimentary canal [76]. To improve PNPs’ stability, two approaches or strategies have been adopted. One of the strategies takes advantage of the functional groups present on the polymeric chains, which can be covalently cross-linked with a compatible crosslinker. In many cases, crosslinking is an essential step that affects the functionality of nanoparticles, such as biodegradability and/or drug release [77, 78]. The second strategy uses coating of PNP surface area (e.g., with polysaccharides, polyethylene glycols) to avoid agreggation and precipitation [79, 80]. PNPs are among the most studied nanocarriers for drug delivery due to their relatively high entrapment yield and their ability to effectively deliver therapeutic doses while minimizing side effects. Masella et al. [81] have developed an innovative polymeric patch for transdermal delivery of melatonin, which was incorporated into polycaprolactone (PCL) nanoparticles. Melatonin release from this patch was assessed by a Franz diffusion cell system, shown a controlled behavior of melatonin diffusion from the PCL nanoparticles. This drug has been indicated as a good candidate for transdermal drug delivery due to first-pass metabolism resulting in low oral bioavailability and a weak sleep-promoting effect. Another drug loaded in PNPs that has also been studied for transdermal delivery was pirfenidone, the first antifibrotic agent approved by the FDA to treat idiopathic pulmonary fibrosis. Pirfenidone has a short half-life in the (2.4 h), and clinical studies have shown that it undergoes hepatic first-pass metabolism. Moreover, following oral administration, it may cause side effects such as stomach pain, vomiting, diarrhea, burning or pain in esophagus and throat. Transdermal delivery has been attested as an effective pathway to overcome the undesired side effects, and to provide patient compliance. The transdermal drug delivery system was based on chitosan-sodium alginate nanogel, which presented a sustained release pattern during 24 h and a significant enhancement of skin penetration [82].

Lipid Nanoparticles (LN)

Solid lipid nanoparticles (SLNs) were introduced in 1990 as an alternative carrier system for liposomes, O/W microemulsions, and lipophilic polymeric nanoparticles. They are composed of a solid hydrophobic core and a monolayer of surfactant coating and are suspended in the aqueous environment. The solid core contains the active compound dissolved or dispersed in a solid high melting fat matrix. Due to their properties, SLNs have the potential to carry lipophilic or hydrophilic molecules, depending on the method of their preparation. Usually, SLNs are composed of approximately 0.1 – 30% (w/w) solid fat, have an average size of 50–1000 nm in diameter and a spherical morphology. Apart from decreasing SLNs’ particle size, which increases their stability, tensoactives are also being used at concentrations of about 0.5 to 5% to enhance stability. These include phospholipids, steroids, poloxamers, and polysorbates. The type of surfactants, lipid compounds, and their proportions can modulate the particle size and drug loading. SLNs’ lipid components include glyceryl esters, waxes, and fatty acids, which are required to be in a solid, state at ambient and body temperature (36.5–37.5°C). SLNs have several advantages: the manufacturing is cost-effective, easy to scale-up the production, they are biodegradable, relatively stable and nontoxic [83–851]. Other important characteristics include good protection offered for the entrapped drugs and sustained drug release from the lipidic matrix. For the purpose of transdermal application and to avoid a potential systematical toxicity, Guo et al. [86] prepared ivermectin-containing SLNs. The release study displayed a slow and sustained release patterns for the drug-SLNs. Nevertheless, variability was noted in the shape and particle size of the SLNs, as well as drug expulsion from the lipid matrix [87]. However, one of the most relevant limitations is the possible degradation of active components during the production process [88, 89]. Labile molecules such as peptides, proteins or nucleotides, may undergo degradation as a consequence of stress and strain caused by the homogenization process, or by the heat formation during melting. It should be aware, therefore, that an appropriate selection of the production method is indispensable. Gallarate et al. [90] prepared peptide-loaded SLNs through coacervation technique, a solvent-free method, in which leuprolide and insulin had been chosen as model polypeptides. The researchers have demonstrated that the coacervation technique, which included some mild heating steps, did not affect the chemical stability of these peptides.

SLNs appear to be an attractive colloidal carrier system for the delivery of drugs into the skin, mainly because of their soothing effects on the skin. They have a moisturizing effect on the skin through occlusion providing an incremental skin hydration [91]. SLN formulations were loaded with lornoxicam, an NSAID, and were tested for drug permeation through full-thickness rat skin [88]. As already mentioned, topical application of NSAIDs may represent drug administration that avoids some gastrointestinal side effects such as dyspepsia, ulceration, and bleeding, usually appearing after oral lornoxicam. It was shown that lornoxicam SLNs increased skin permeation rate compared with a lornoxicam gel control, implying that the spontaneous occlusivity and skin hydration increase the penetration into the skin [92]. Transdermal drug delivery using SLNs has also been studied for rivastigmine, a drug used for the treatment of mild to moderate Alzheimer’s and Parkinson’s diseases [93]. The results showed improvement of daily activities like cognition, behavior, and global function, thus, transdermal drug delivery have given an optimal advantage to such patients, by providing a controlled drug release that maintains steady plasma levels. That makes the treatment a user-friendly and convenient alternative to the traditional dosage forms. The researchers also reported that SLNs were prepared by the emulsification-diffusion method, and subsequently, the SLNs were incorporated into transdermal films. Then, pharmacokinetics studies were performed on rabbits, showing significant improvement of Cmax and bioavailability of the drug compared to a control patch [93].

SLNs can be modified by incorporation of liquid lipid into the solid structure. This new form of SLNs, named nanostructured lipid carriers (NLCs), encounters the limitations of SLNs such as limited drug loading capacity and lipid crystallization [95]. The introduction of liquid lipids causes a melting point depression in comparison with a pure solid lipid, and impairs the crystal structure of the lipid thus offering more space to drug inclusion. However, Teeranachaideekul et al [96] have shown that lipid NPs display a deeper penetration up to upper dermal layer when the content of liquid lipid is lower, indicating that liquid lipid limits skin penetration. This phenomenon has been explained by reduction in the occlusive effect (hydrophobic film formation) of the lipid nanoparticles with the increase on liquid content, which in turn caused more water evaporation and lesser skin hydration [96].

MEs, PNP and LN as Nanocarriers for Transdermal Drug Delivery of Various Therapeutic Agents

During the last decades, researchers have shown an increasing interest in nanocarriers for transdermal application. Table 1 summarizes the latest studies related to transdermal nanocarriers. The selection of the most appropriate carrier has been primarily dependent on the physicochemical characteristics of the drug that has to be loaded (e.g., pKa, hydrophilicity, lipophilicity), and factors related to the carrier and its manufacturing process, such as the ability to entrap the drug and to keep its stability. The nanocarriers could be prepared from a diversity of materials such as lipids, proteins, polysaccharides, natural or synthetic polymers. The lipophilic/hydrophilic nature of the drug mainly dictates the development of most compatible transdermal dosage forms. It is commonly accepted that drugs with a relatively high logP are more appropriate to be delivered through the skin, while drugs with low logP are more difficult to penetrate and need lipophilic carriers. Therefore, it is essential for a nanocarrier not only to be able to adsorb and entrap a low logP drug but also to penetrate and deliver it through the lipid bilayers of the stratum corneum [97].

Microemulsions have gained much interest due to their thermodynamic stability and ease of preparation. In vitro [113] and in vivo [114] studies have demonstrated their potential in enhancing drug delivery through dermal and transdermal routes of administration. The main advantages of MEs for transdermal delivery of drugs include (a) the high capacity and ability to solubilize quantitative amounts of hydrophilic drugs, and (b) the permeation enhancing effect due to individual components in the microemulsions or due to the vesicular nature of the delivery system. El Maghraby et al. [98] studied hydrocortisone as a model lipophilic drug and investigated the effects of cosurfactants on the transdermal delivery. Ethyl alcohol, isopropanol, and 1,2-propanediol (propylene glycol) were used as cosurfactants in the microemulsion. The results showed a significantly increased transdermal flux of hydrocortisone from MEs containing these cosurfactants compared to a cosurfactant-free formulation. Thus, the incorporation of cosurfactants not only modifies the physical characteristics of the microemulsion but it also increases the permeation efficacy, supporting the conception of the nanovesicle-driven mechanism of skin penetration [8, 68–70]. Carvalho et al. [97] compared a non-aqueous microemulsion (containing propylene glycol) with an aqueous microemulsion (containing water), and evaluated their ability to improve drug delivery into the skin. The researchers studied the delivery of progesterone (MW=314.5 g/mol, logP=3.87), α- tocopherol (MW=430.7 g/mol, logP=7.96), and lycopene (MW=537, logP=9.16). The results of the skin penetration studies have demonstrated that the penetration enhancement promoted by the aqueous formulation was significant for progesterone and tocopherol, but not for lycopene. These data suggest that skin penetration of highly lipophilic drug is limited by aqueous MEs, and its use by this system may be redundant. Other promising results have been shown for repaglinide. This drug is a quick and short-acting BCS class II drug, and due to its poor water solubility (logP=5.4), and its short half- life (~1 h) (rapid first-pass metabolism), it represents a good candidate for microemulsion systems. Ex vivo permeability study across rat skin showed a 12.3-fold increase in flux with a microemulsion formulation compared to repaglinide suspension in water [1].

SLNs, on the other hand, are entirely different nanocarriers. Their main advantages include the protection of labile substances from chemical degradation, controlled drug release due to the solid state of the lipid matrix, and film formation on the skin that produces an occlusion effect. The occlusion effect leads to a reduced water loss and increased skin hydration, and produces a significant reduction in the total Transepidermal Water Loss (TEWL) [109]. The occlusion effect ability of SLNs (composed of glyceryl dibehenate) was studied using porcine skin. Occlusion Factor (F) was calculated according to Teeranachaideekul et al. [96], where F=0 means no occlusive effect while an F=100 means maximum occlusion. In this study, an occlusion factor of 36% for SLNs was shown. Furthermore, TEWL (recorded with a Tewameter®) showed a 34.3% reduction in TEWL. The studies have confirmed that SLNs, by their affinity to the stratum corneum, form an invisible and occlusive film over the skin that reduces transepidermal water loss and improves skin hydration [96, 115–117]. One more characteristic of SLNs is its lipophilic nature that combined with the high surface area allows longer contact duration of the drug with the skin and results in an efficient drug delivery. However, only thermostable drugs should be chosen for the SLN system due to the high temperatures required to be applied during production [89]. SLNs’ components are also relevant for transdermal absorption as their properties are critical for getting optimal transdermal permeation. Some interesting results have been published by Gaur et al. [110], who studied SLNs loaded with curcumin and obtained high drug permeation through human skin after 24h by including ceramide- 2 in the formulation. The amounts and the proportions of components may also influence the SLN properties as shown by Wake et al. [111], who designed SLNs for transdermal rasagiline mesylate to alleviate the symptoms of Parkinson’s disease. This research has shown that increasing the concentration of stearic acid in the SLNs led to a higher entrapment while increasing the concentration of tween 80 led to a smaller particle size. Unlike liquid oils and microemulsions, SLNs are able to release drugs by a controlled manner, while the slow mobility of the drug molecules is dictated by the diffusion out of the solid lipid. SLNs are usually made of physiological lipids such as fatty acids, steroids, monoglycerides, diglycerides and triglycerides [118], therefore they are considered safe and the danger of acute and chronic toxicity is much lower. However, its cytotoxicity will depend on the compounds that form the lipid matrix. Weyenberg et al. [119] tested a series of positively and negatively surface charged SLNs, demonstrating a cytotoxicity caused by the influence of surfactant excipients. Moreover, significant cytotoxicity was measured when SLNs were coated with the cationic surfactant cetylpyridinium chloride, while formulations containing Lipoid S75 reduced cell viability just slightly.

PNPs are different from MEs and SLNs by their rigidity, which might be critical for transdermal drug delivery. Although polymeric nanoparticles have a potential as transdermal drug carriers, the penetration of nanoparticles into the skin may be significantly lower due to this rigidity when comparing with soft nanoparticles (e.g., liposomes) [120]. It is, therefore, advisable to evaluate the specific PNPs’ properties and to consider a surface modification in order to obtain a significant skin penetration. Marimuthu et al. [121] prepared poly (lactide-co-glycolide) (PLGA) nanoparticles containing glucosamine and modified their outer surface, resulting in a more flexible permeability through the skin lipid membranes compared with uncoated glucosamine nanoparticles. Polymeric nanoparticles are generally prepared by one of three techniques – emulsion/solvent evaporation, nanoprecipitation, and salting out – all of them need a volatile organic solvent in which a hydrophobic drug is dissolved. Thus, PNPs are a useful reservoir for hydrophobic drugs designed for delivering them through the stratum corneum and for releasing these drugs by a controlled manner into the viable skin. Luengo et al. [100] used flufenamic acid as a lipophilic drug model and reported accumulation of the drug in deeper layers of excised human skin after more than 12 h. Transdermal hydrophilic drugs have also been studied using PLGA nanoparticles. Procaine hydrochloride-loaded PLGA nanoparticles, having an average diameter of 150–210 nm, were reported to increase skin accumulation, following by elevated muscle concentrations when using isopropyl myristate as a transdermal enhancer [122].

Perspectives for Transdermal Dosage Forms

The advantages of the dermal and transdermal drug route of administration are the best incentive to keep investing efforts and spending time in its research. The benefits of this route are, just to mention a few, the large surface area of the skin that provides a vast accessible area for drugs, the patient-friendly application that helps to improve the treatment adherence, the avoidance of the gastrointestinal tract environment, the decrease of side effects, as well as reducing multiple dosing frequencies. Due to the low number of drug molecules that are capable of passively crossing the skin barrier, development and application of nanocarriers such as MEs, SLNs, and PNPs are needed to expand the scope of drug compounds that would be quantitatively transported through the skin. More innovative formulation work, pre-clinical experiments, and clinical studies need to be done to establish the safety and efficacy of these nanosystems before introducing into the market. The current reports have demonstrated the advantages of nanometric transdermal formulations; however, solvent-free, safe and non-irritant excipients, time-consuming and inexpensive manufacturing process should be taken into consideration during product development. The number of next- generation therapeutics is expected to increase with new types of drug molecules, like proteins, peptides, and antibodies, even though the future challenge of the pharmaceutical scientists would be tougher and more difficult. The toughest obstacle of all might be the need to hold an active macromolecule into a nanoparticle or a nanodroplet while preserving its activity once it releases into the skin or in the systemic circulation. Altogether, the nanosystems have become successful dosage forms for a variety of dermally and transdermally active principals by modulating drug transfer and serving as nontoxic penetration enhancers.

References

  1. Shinde, Ujwala A, Sheela H Modani, Kavita H Singh (2018) Design and Development of Repaglinide Microemulsion Gel for Transdermal Delivery. AAPS PharmSciTech 19: 315–25.
  2. Darreh-Shori, T, V Jelic (2010) Safety and Tolerability of Transdermal and Oral Rivastigmine in Alzheimer’s Disease and Parkinson’s Disease Dementia. Expert Opinion on Drug Safety 9: 167–76.
  3. Pastore, Michael N, Yogeshvar N Kalia, Michael Horstmann, Michael S Roberts (2015) Transdermal Patches: History, Development and Pharmacology. British journal of pharmacology 172: 2179–209.
  4. Huang  Da,  Mi  Sun,  Yazhong  Bu,  Fang   Luo,  Cuiying   Lin, et al (2017) Microcapsule-embedded hydrogel patches for ultrasound responsive and enhanced transdermal delivery of diclofenac sodium.  J Mater Chem B 5: 8653–8675.
  5. Tosato MG, JV Maya Giron, AA Martin, V Krishna Tippavajhala, M Fernandez Lorenzo de Mele et al (2018) Comparative Study of Transdermal Drug Delivery Systems of Resveratrol: High Efficiency of Deformable Liposomes. Mater Sci Eng C Mater Biol Appl 90: 356–64.
  6. Wu, Xiao-mei, Christopher J. Branford-White, Li-min Zhu, Nichoals P. Chatterton, and Deng-guang Yu (2010) Ester Prodrug-Loaded Electrospun Cellulose Acetate Fiber Mats as Transdermal Drug Delivery Systems.” Journal of Materials Science: Materials in Medicine 21: 2403–11.
  7. Williams, Adrian C, and Brian W Barry (2012) Penetration Enhancers. Advanced Drug Delivery Reviews 64: 128–37.
  8. Sintov, Amnon C, Shafir Botner (2006) Transdermal Drug Delivery Using Microemulsion and Aqueous Systems: Influence of Skin Storage Conditions on the in Vitro Permeability of Diclofenac from Aqueous Vehicle Systems.” International journal of pharmaceutics 311: 55–62.
  9. Jain SK, MK Chourasia, R Masuriha, V Soni, A Jain, Nitin K Jain, and Y Gupta. “Solid Lipid Nanoparticles Bearing Flurbiprofen for Transdermal Delivery. Drug delivery 12: 207–15.
  10. Hatanaka, Tomomi, Toshihiko Kamon, Setsuko Morigaki, Kazunori Katayama, et al (2000) Ion Pair Skin Transport of a Zwitterionic Drug, Cephalexin. Journal of Controlled Release 66: 63–71.
  11. Paudel, Kalpana S, Mikolaj Milewski, Courtney L Swadley, Nicole K Brogden et al (2010) Challenges and Opportunities in Dermal/Transdermal Delivery. Therapeutic delivery : 109–31.
  12. Bodkin, J Alexander, and Jay D Amsterdam. “Transdermal Selegiline in Major Depression: A Double- Blind, Placebo-Controlled, Parallel-Group Study in Outpatients. American Journal of Psychiatry 11: 1869–75.
  13. –Winblad, Bengt, Jeffrey Cummings, Niels Andreasen, George Grossberg, et al (2007) A  Six–Month  Double–Blind, Randomized,   Placebo–Controlled   Study   of   a   Transdermal   Patch   in   Alzheimer’s   Disease––Rivastigmine Patch Versus Capsule. International Journal of Geriatric Psychiatry: A journal of the psychiatry of late life allied sciences 22: 456–67.
  14. Chelly, Jacques E, Jeffrey Grass, Timothy W Houseman, Harold Minkowitz, et al (2004) The Safety and Efficacy of a Fentanyl Patient-Controlled Transdermal System for Acute Postoperative Analgesia: A Multicenter, Placebo-Controlled Trial. Anesthesia Analgesia 98: 427–33.
  15.  Xu, Peng-Gang, Xi-Feng Lei, Bao-Di Ren, Shui-Ying Lv, et al (2017) Diclofenac Transdermal Patch Versus the Sustained Release Tablet: A Randomized Clinical Trial in Rheumatoid Arthritic Patients. Tropical Journal of Pharmaceutical Research 16: 477–82.
  16. Bhaskar, Kesavan, Jayaraman Anbu, Velayutham Ravichandiran, Vobalaboina Venkateswarlu, et al (2009) Lipid Nanoparticles for Transdermal Delivery of Flurbiprofen: Formulation, in Vitro, Ex Vivo and in Vivo Studies. Lipids in health disease 8: 6.
  17. Harirforoosh, Sam, Waheed Asghar, Fakhreddin Jamali (2014) Adverse Effects of Nonsteroidal Antiinflammatory Drugs: An Update of Gastrointestinal, Cardiovascular and Renal Complications. Journal of Pharmacy Pharmaceutical Sciences 16: 821–47.
  18. Charoo, Naseem Ahmad, Areeg Anwer Ali Shamsher, Kanchan Kohli, et al (2008) Improvement in Bioavailability of Transdermally Applied Flurbiprofen Using Tulsi (Ocimum Sanctum) and Turpentine Oil. Colloids surfaces B: Biointerfaces 65: 300–07.
  19. Apfel, Christian C, Kun Zhang, Elizabeth George, Serena Shi, et al (2010) Transdermal Scopolamine for the Prevention of Postoperative Nausea and Vomiting: A Systematic Review and Meta-Analysis. Clinical therapeutics 32: 1987–2002.
  20. Pergolizzi Jr, Joseph V, Beverly K Philip, John B Leslie, Robert Taylor Jr et al (2012) Perspectives on Transdermal Scopolamine for the Treatment of Postoperative Nausea and Vomiting. Journal of clinical anesthesia 24: 334–45.
  21. Kaestli, Laure-Zoé, Anne-Florence Wasilewski-Rasca, Pascal Bonnabry, Nicole Vogt-Ferrier (2008) Use of Transdermal Drug Formulations in the Elderly. Drugs aging 25: 269–80.
  22. Delgado-Charro, M Begona, and Richard H Guy (2014) Effective Use of Transdermal Drug Delivery in Children. Advanced Drug Delivery Reviews 73: 63–82.
  23. Boateng, Joshua (2017) Drug Delivery Innovations to Address Global Health Challenges for Pediatric and Geriatric Populations (through Improvements in Patient Compliance). Journal of pharmaceutical sciences 106: 3188–98.
  24. Gnjidic, Danijela, Andy Husband, Adam Todd (2009) Challenges and Innovations of Delivering Medicines to Older Adults. Advanced Drug Delivery Reviews.
  25. Bos, Jan D, Marcus MHM Meinardi (2000) The 500 Dalton Rule for the Skin Penetration of Chemical Compounds and Drugs. Experimental Dermatology: Viewpoint 9: 165–69.
  26. Delgado-Charro, M Begona, Richard H Guy (2003) Iontophoresis: Applications in Drug Delivery and Noninvasive Monitoring.” Transdermal Drug Delivery Systems 2: 199–225.
  27. Prausnitz, Mark R, Samir Mitragotri, Robert Langer (2004) Current Status and Future Potential of Transdermal Drug Delivery. Nature reviews Drug discovery 3: 115.
  28. Huang, Yaw-Bin, Yi-Hung Tsai, Jui-Sheng Chang, Jian Chen Liu, et al (2002) Effect of Antioxidants and Anti-Irritants on the Stability, Skin Irritation and Penetration Capacity of Captopril Gel. International Journal of Pharmaceutics 241: 345–51.
  29. Larsen, Rikke H, Flemming Nielsen, Jens A Sørensen, Jesper B Nielsen (2003) Dermal Penetration of Fentanyl: Inter-and Intraindividual Variations. Pharmacology toxicology 93: 244–48.
  30. Manevski, Nenad, Piet Swart, Kamal Kumar Balavenkatraman, Barbara Bertschi, et al (2015) Phase Ii Metabolism in Human Skin: Skin Explants Show Full Coverage for Glucuronidation, Sulfation, N-Acetylation, Catechol Methylation, and Glutathione Conjugation. Drug Metabolism Disposition 43: 126–39.
  31. Wilkinson, Simon C, Faith M Williams (2007) Cutaneous Metabolism. Dermal absorption toxicity assessment : 89–115.
  32. Jacques C, E Perdu, EL Jamin, JP Cravedi, A Mavon, et al (2014) Effect of Skin Metabolism on Dermal Delivery of Testosterone: Qualitative Assessment Using a New Short-Term Skin Model. Skin pharmacology physiology 27 : 188–88.
  33. Fang, Jia-You, Yann-Lii Leu (2006) Prodrug Strategy for Enhancing Drug Delivery via Skin. Current drug discovery technologies 3: 211–24.
  34. Doh, Hea-Jeong, Won-Jea Cho, Chul-Soon Yong, Han-Gon Choi, et al (2003) Synthesis and Evaluation of Ketorolac Ester Prodrugs for Transdermal Delivery. Journal of pharmaceutical sciences 92: 1008–17.
  35. Walters, Kenneth A, Michael S Roberts (2002) The structure and function of skin. In Dermatological and Transdermal Formulations, 1st ed.: Walters, KA, Eds.; Marcel Dekker, Inc., New York, USA, Pg No: 1–39.
  36. Tobin, Desmond J (2006) Biochemistry of Human Skin—Our Brain on the Outside. Chemical Society Reviews 35: 52–67.
  37. Illel, Brigitte, Hans Schaefer, Jacques Wepierre, Olivier Doucet (1991) Follicles Play an Important Role in Percutaneous Absorption. Journal of pharmaceutical sciences 80: 424–27.
  38. Pohlmann, Adriana R, Silvia S Guterres, Tatiele Katzer, Renata Vidor Contri (2016) Drug Transport across Skin. In Drug Delivery across Physiological Barriers 143–66.
  39. Ghafourian, Taravat, Parinaz Zandasrar, Hamed Hamishekar, Ali Nokhodchi (2004) The Effect of Penetration Enhancers on Drug Delivery through Skin: A Qsar Study. Journal of Controlled Release 99: 113–25.
  40. Chen, Longjian, Guoping Lian, Lujia Han (2010) Modeling Transdermal Permeation. Part I. Predicting Skin Permeability of both Hydrophobic and Hydrophilic Solutes. AIChE journal 56: 1136–46.
  41. Ng, Keng Wooi, Wing Man Lau (2015) Skin Deep: The Basics of Human Skin Structure and Drug Penetration. In Percutaneous Penetration Enhancers Chemical Methods in Penetration Enhancement: Drug Manipulation Strategies and Vehicle Effects, edited by Nina Dragicevic and Howard I. Maibach, 3–11. Berlin, Heidelberg: Springer Berlin Heidelberg 2015.
  42. Hueber, Frédérique, Jacques Wepierre, Hans Schaefer (1992) Role of Transepidermal and Transfollicular Routes in Percutaneous Absorption of Hydrocortisone and Testosterone: In Vivo Study in the Hairless Rat. Skin pharmacology physiology 5: 99–107.
  43. Tampucci S, Burgalassi S, Chetoni P, Lenzi C, Pirone A, et al (2014) Topical formulations containing finasteride. Part II: determination of finasteride penetration into hair follicles using the differential stripping technique. J Pharm Sci 103: 2323–9.
  44. Alvarez-Román, Rocio, Aarti Naik, YN Kalia, Richard H Guy, H Fessi (2004) Skin Penetration and Distribution of Polymeric Nanoparticles. Journal of Controlled Release 99: 53–62.
  45. Raber AS, Mittal A, Schaefer J, Bakowsky U, Reichrath J, et al (2014) Quantification of nanoparticle uptake into hair follicles in pig ear and human forearm. J Control Release 179: 25–32.
  46. Patzelt, Alexa, Heike Richter, Lars Dähne, Peter Walden, et al (2011) Influence of the Vehicle on the Penetration of Particles into Hair Follicles. Pharmaceutics 3: 307–14.
  47. Grice, Jeffrey E, Hamid R Moghimi, Elizabeth Ryan, Qian Zhang,et al (2017) Non-Formulation Parameters That Affect Penetrant-Skin-Vehicle Interactions and Percutaneous Absorption. In Percutaneous Penetration Enhancers Drug Penetration into/through the Skin 45–75.
  48. Wang, Yiping, Rashmi Thakur, Qiuxi Fan, Bozena Michniak (2005) Transdermal Iontophoresis: Combination Strategies to Improve Transdermal Iontophoretic Drug Delivery. European Journal of Pharmaceutics Biopharmaceutics 60: 179–91.
  49. Prausnitz, Mark R, Vanu G Bose, Robert Langer, James C Weaver (1993) Electroporation of Mammalian Skin: A Mechanism to Enhance Transdermal Drug Delivery.” Proceedings of the National Academy of Sciences 90: 10504–08.
  50. Mitragotri, Samir, Daniel Blankschtein, Robert Langer (1996) Transdermal Drug Delivery Using Low- Frequency Sonophoresis. Pharm Res 13: 411–20.
  51. Yu, Jing, Dhaval R Kalaria, and Yogeshvar N Kalia (2011) Erbium: Yag Fractional Laser Ablation for the Percutaneous Delivery of Intact Functional Therapeutic Antibodies. Journal of controlled release 156: 53–59.
  52. Martanto, Wijaya, Shawn P Davis, Nicholas R Holiday, Jenny Wang, et al (2004) Transdermal Delivery of Insulin Using Microneedles in Vivo. Pharm Res 21: 947–52.
  53. Funke, Adrian P, Roman Schiller, Hans W Motzkus, Clemens Günther, (2002) Transdermal Delivery of Highly Lipophilic Drugs: In Vitro Fluxes of Antiestrogens, Permeation Enhancers, and Solvents from Liquid Formulations. Pharm Res 19: 661–68.
  54. Lu, Guang Wei, Ping Gao (2010) Chapter 3 – Emulsions and Microemulsions for Topical and Transdermal Drug Delivery. In Handbook of Non-Invasive Drug Delivery Systems, edited by Vitthal S. Kulkarni, 59–94. Boston: William Andrew Publishing 10003–4.
  55. Baroli, Bianca, M Arturo López-Quintela, M Begoña Delgado-Charro, Anna M Fadda, et al (2000) Microemulsions for Topical Delivery of 8-Methoxsalen. Journal of Controlled Release 69: 209–18.
  56. Chen, Huabing, Xueling Chang, Ting Weng, Xiaozhi Zhao (2004) A Study of Microemulsion Systems for Transdermal Delivery of Triptolide. Journal of Controlled Release 98: 427–36.
  57. Biruss, Babette, Hanspeter Kählig, Claudia Valenta (2007) Evaluation of an Eucalyptus Oil Containing Topical Drug Delivery System for Selected Steroid Hormones. International Journal of Pharmaceutics 328: 142–51.
  58. Lopes, Luciana B, Hillary VanDeWall, Hsin T Li, Vijay Venugopal, Hsin K Li, et al (2010) Topical Delivery of Lycopene Using Microemulsions: Enhanced Skin Penetration and Tissue Antioxidant Activity. Journal of pharmaceutical sciences 99: 1346–57.
  59. Lopes, Luciana (2014) Overcoming the Cutaneous Barrier with Microemulsions. Pharmaceutics 6: 52–77.
  60. Gannu, Ramesh, Chinna Reddy Palem, Vamshi Vishnu Yamsani, Shravan Kumar Yamsani, Madhusudan Rao Yamsani (2010) Enhanced Bioavailability of Lacidipine via Microemulsion Based Transdermal Gels: Formulation Optimization, Ex Vivo and in Vivo Characterization. International Journal of Pharmaceutics 388: 231–41.
  61. Said, Mayada, Ibrahim Elsayed, Ahmed A Aboelwafa, Ahmed H Elshafeey (2017) Transdermal Agomelatine Microemulsion Gel: Pyramidal Screening, Statistical Optimization and in Vivo Bioavailability. Drug delivery 24: 1159–69.
  62. Shukla, Tripti, Neeraj Upmanyu, Mukta Agrawal, Swarnlata Saraf,et al (2018) Biomedical Applications of Microemulsion through Dermal and Transdermal Route. Biomedicine Pharmacotherapy 108: 1477–94.
  63. Ghosh, Bijaya, L Harivardhan Reddy (2001) Effect of Physicochemical Parameters on Skin Permeability of Antihypertensive. Indian Journal of Experimental Biology 39: 710 – 14.
  64. Hathout, Rania M, Samar Mansour, Nahed D Mortada, Ahmed S Geneidi, Richard H Guy (2010) Uptake of Microemulsion Components into the Stratum Corneum and Their Molecular Effects on Skin Barrier Function. Mol Pharm 7: 1266–73.
  65. Naik, Aarti, Louk ARM Pechtold, Russell O Potts, Richard H Guy (1995) Mechanism of Oleic Acid- Induced Skin Penetration Enhancement in Vivo in Humans. Journal of Controlled Release 37: 299–306.
  66. El Khayat, Noha W, Ahmed A Donia, Omer Y Mady, Gamal M El Maghraby (2018) Optimization of Eugenol Microemulsion for Transdermal Delivery of Indomethacin. Journal of Drug Delivery Science Technology 48: 311–18.
  67. Carvalho, André Luis Menezes, José Alexsandro Silva, Ana Amélia Moreira Lira, Ellen Denise Prado Almeida, (2018) Third-Generation Transdermal Delivery Systems Containing Zidovudine: Effect of the Combination of Different Chemical Enhancers and a Microemulsion System. AAPS PharmSciTech 19:  3219–27.
  68. Sintov AC, L Shapiro (2004) New Microemulsion Vehicle Facilitates Percutaneous Penetration in Vitro and Cutaneous Drug Bioavailability in Vivo. Journal of Controlled Release 95: 173–83.
  69. Sintov AC, I Greenberg (2014) Comparative Percutaneous Permeation Study Using Caffeine-Loaded Microemulsion Showing Low Reliability of the Frozen/Thawed Skin Models. International Journal of Pharmaceutics 471: 516–24.
  70. Sintov AC (2015) Transdermal Delivery of Curcumin Via Microemulsion. International Journal of Pharmaceutics 481: 97–103.
  71. Budhian, Avinash, Steven J Siegel, Karen I Winey (2005) Production of Haloperidol-Loaded Plga Nanoparticles for Extended Controlled Drug Release of Haloperidol. Journal of microencapsulation 22: 773–785.
  72. Mu, Liang, SSFeng (2003). A Novel Controlled Release Formulation for the Anti cancer Drug Paclitaxel (Taxol®): Plga Nanoparticles Containing Vitamin E Tpgs. Journal of Controlled Release 86: 33–48.
  73. Lale, Shantanu V, AthulyaAravind, D Sakthi Kumar, VeenaKoul (2014) As1411 Aptamer and Folic Acid Functionalized Ph-Responsive Atrp Fabricated Ppegma–Pcl–Ppegma Polymeric Nanoparticles for Targeted Drug Delivery in Cancer Therapy. Biomacromolecules 15: 1737–1752.
  74. Das, Pradip, NikhilRJana (2015). Dopamine Functionalized Polymeric Nanoparticle for Targeted Drug Delivery. RSC Advances 5: 33586–33594.
  75. Al-Otoum, R, SRA bulateefeh, and MOTaha (2014). Preparation of Novel Ionotropically Crosslinked Beads Based on Alginate-Terephthalic Acid Composites as Potential Controlled Release Matrices. Die Pharmazie-An International Journal of Pharmaceutical Sciences 69: 10–18.
  76. Ezpeleta, Isabel, Juan M Irache, Serge Stainmesse, Christiane Chabenat,et al (1996) Gliadin Nanoparticles for the Controlled Release of All- Trans-Retinoic Acid. International Journal of Pharmaceutics 131: 191–200.
  77. Montero, Nuria, Elena Pérez, Marta Benito, César Teijón, et al (2019) Biocompatibility Studies of Intravenously Administered Ionic-Crosslinked Chitosan-Bsa Nanoparticles as Vehicles for Antitumour Drugs. International Journal of Pharmaceutics 554: 337–351.
  78. Jiang, Xiaoyu, Hongting Pu, Peng Wang (2011) Polymer Nanoparticles Via Intramolecular Crosslinking of Sulfonyl Azide Functionalized Polymers. Polymer 52: 3597–602.
  79. Sheng, Yan, Changsheng Liu, Yuan Yuan, Xinyi Tao, (2009) Long-Circulating Polymeric Nanoparticles Bearing a Combinatorial Coating of Peg and Water-Soluble Chitosan. Biomaterials 30: 2340–48.
  80. Chauvierre, Cédric, Denis Labarre, Patrick Couvreur, and Christine Vauthier (2003) Novel Polysaccharide- Decorated Poly (Isobutyl Cyanoacrylate) Nanoparticles. Pharm Res 20: 1786–93.
  81. Massella, Daniele, Federica Leone, Roberta Peila, Antonello Barresi, and Ada Ferri (2018) Functionalization of Cotton Fabrics with Polycaprolactone Nanoparticles for Transdermal Release of Melatonin. Journal of functional biomaterials 9: 1.
  82. Abnoos, Marzieh, Mojdeh Mohseni, Seyed Ali Javad Mousavi, Khadijeh Ashtari, et al (2018) Chitosan-Alginate Nano-Carrier for Transdermal Delivery of Pirfenidone in Idiopathic Pulmonary Fibrosis. International journal of biological macromolecules.
  83. Garces, A, MH Amaral, JM Sousa Lobo, AC Silva (2018) Formulations Based on Solid Lipid Nanoparticles (Sln) and Nanostructured Lipid Carriers (Nlc) for Cutaneous Use: A Review. European Journal of Pharmaceutical Sciences 112: 159–67.
  84. Müller, Rainer H, Dörte Rühl, Stephan Runge, Kai Schulze-Forster, Wolfgang Mehnert (1997) Cytotoxicity of Solid Lipid Nanoparticles as a Function of the Lipid Matrix and the Surfactant. Pharm Res 14: 458–62.
  85. Shegokar R, KK Singh, RH Müller (2011) Production & Stability of Stavudine Solid Lipid Nanoparticles—from Lab to Industrial Scale. International Journal of Pharmaceutics 416: 461–70.
  86. Guo, Dawei, Dandan Dou, Xinyu Li, Qian Zhang (2018) Ivermection-Loaded Solid Lipid Nanoparticles: Preparation, Characterisation, Stability and Transdermal Behaviour. Artificial cells, nanomedicine, biotechnology 46: 255–62.
  87. Mehnert, Wolfgang, Karsten Mäder (2012) Solid Lipid Nanoparticles: Production, Characterization and Applications. Advanced Drug Delivery Reviews 64: 83–101.
  88. Bhalekar, Mangesh, Prashant Upadhaya, and Ashwini Madgulkar (2017) Formulation and Characterization of Solid Lipid Nanoparticles for an Anti-Retroviral Drug Darunavir. Applied Nanoscience 7: 47–57.
  89. Ramteke, KH, SA Joshi, SN Dhole (2012) Solid Lipid Nanoparticle: A Review. IOSR journal of pharmacy 2 : 34–44.
  90. Gallarate, Marina, Luigi Battaglia, Elena Peira, Michele Trotta (2011) Peptide-Loaded Solid Lipid Nanoparticles Prepared through Coacervation Technique. International Journal of Chemical Engineering.
  91. Hamishehkar, Hamed, Saeideh Same, Khosro Adibkia, Kamyar Zarza, et al (2015) A Comparative Histological Study on the Skin Occlusion Performance of a Cream Made of Solid Lipid Nanoparticles and Vaseline. Research in pharmaceutical sciences 10: 378.
  92. Gönüllü, Ümit, Melike Üner, Gülgün Yener, Ecem Fatma Karaman, Zeynep Aydoğmuş (2015) Formulation and Characterization of Solid Lipid Nanoparticles, Nanostructured Lipid Carriers and Nanoemulsion of Lornoxicam for Transdermal Delivery. Acta Pharmaceutica 65: 1–13.
  93. Ravi, G, Gupta, VN and Balamuralidhara,V (2018) Rivastigmine Tartrate Solid Lipid Nanoparticles Loaded Transdermal Film: An in Vivo Study. Research Journal of Pharmacy Technology 11: 227–227.
  94. Mueller, RH, Radtke M, Wissing (2002) Nanostructured lipid matrices for improved microencapsulation of drugs. International Journal of Pharmacetics 242: 121–128.
  95. Chandrashekar, NS, and RH Shobha Rani (2008) Physicochemical and Pharmacokinetic Parameters in Drug Selection and Loading for Transdermal Drug Delivery. Indian journal of pharmaceutical sciences 70: 94.
  96. Teeranachaideekul V, Boonme, P, Souto, EB, Mueller, RH, Junyaprasert, VB (2008) Influence of oil content on physiochemical properties and skin distribution of Nile red-loaded NLC. Journal of Controlled Release 128: 134–141.
  97. Carvalho, Vanessa F, Debora P de Lemos, Camila S Vieira, Amanda Migotto, Luciana B Lopes (2017) Potential of Non-Aqueous Microemulsions to Improve the Delivery of Lipophilic Drugs to the Skin. AAPS PharmSciTech 18 : 1739–49.
  98. El Maghraby, Gamal M (2008) Transdermal Delivery of Hydrocortisone from Eucalyptus Oil Microemulsion: Effects of Cosurfactants. International Journal of Pharmaceutics 355: 285–92.
  99. Sood, Jatin, Bharti Sapra, Ashok K Tiwary (2017) Microemulsion Transdermal Formulation for Simultaneous Delivery of Valsartan and Nifedipine: Formulation by Design. AAPS PharmSciTech 18: 1901–16.
  100. Soliman, Sara M, NS Abdel Malak, Omaima N El-Gazayerly, AA Abdel Rehim (2010) Formulation of Microemulsion Gel Systems for Transdermal Delivery of Celecoxib: In Vitro Permeation, Anti- Inflammatory Activity and Skin Irritation Tests. Drug Discov Ther 4:  459–71.
  101. Dave, Kaushalkumar, Fahd M Alsharif, Saiful Islam, Chandradhar Dwivedi, et al (2017) Chemoprevention of Breast Cancer by Transdermal Delivery of Α-Santalol through Breast Skin and Mammary Papilla (Nipple). Pharm Res 34: 1897–907.
  102. Jain, Sanyog, Ankit Mittal, Amit K Jain (2011) Enhanced Topical Delivery of Cyclosporin-a Using Plga Nanoparticles as Carrier. Current Nanoscience 7: 524–30.
  103. El-Gogary, Riham I, Noelia Rubio, Julie Tzu-Wen Wang, Wafa’T Al-Jamal, et al (2014) Polyethylene Glycol Conjugated Polymeric Nanocapsules for Targeted Delivery of Quercetin to Folate-Expressing Cancer Cells in Vitro and in Vivo. Acs Nano 8: 1384–401.
  104. Dias, Sávia Francisca Lopes, Silvania Siqueira Nogueira, Flaviane de França Dourado, Maria Adelaide Guimarães, et al (2016) Acetylated Cashew Gum-Based Nanoparticles for Transdermal Delivery of Diclofenac Diethyl Amine. Carbohydrate polymers 143: 254–261,
  105. Luengo J, B Weiss, M Schneider, A Ehlers, F Stracke, et al (2006) Influence of Nanoencapsulation on Human Skin Transport of Flufenamic Acid. Skin pharmacology physiology 19: 190–97.
  106. Al-Kassas, Raida, Jingyuan Wen, Angel En-Miao Cheng, Amy Moon-Jung Kim, et al (2016) Transdermal Delivery of Propranolol Hydrochloride through Chitosan Nanoparticles Dispersed in Mucoadhesive Gel. Carbohydrate polymers 153: 176–86.
  107. Hafner, Anita, Jasmina Lovrić, Ivan Pepić, Jelena Filipović-Grčić (2011) Lecithin/Chitosan Nanoparticles for Transdermal Delivery of Melatonin. Journal of microencapsulation 28: 807–15.
  108. Sutthanut, Khaetthareeya, Xiuling Lu, Michael Jay, Bungorn Sripanidkulchai (2009) Solid Lipid Nanoparticles for Topical Administration of Kaempferia Parviflora Extracts. Journal of biomedical nanotechnology 5: 224–32.
  109. Kurakula, Mallesh, Osama AA Ahmed, Usama A Fahmy, Tarek A Ahmed (2016) Solid Lipid Nanoparticles for Transdermal Delivery of Avanafil: Optimization, Formulation, in-Vitro and Ex-Vivo Studies.” Journal of liposome research 26: 288–96.
  110. Gaur, Praveen Kumar, Shikha Mishra, Anurag Verma, Navneet Verma (2016) Ceramide–Palmitic Acid Complex Based Curcumin Solid Lipid Nanoparticles for Transdermal Delivery: Pharmacokinetic and Pharmacodynamic Study. Journal of Experimental Nanoscience 11: 38–53.
  111. Wake, Prashant S, and MD Kshirsagar (2017) Compatibility Study in-Vitro Drug Release Study of Solid Lipid Nanoparticle Based Transdermal Drug Delivery System for Rasagiline Mesylate. Asian Journal of Research in Pharmaceutical Science 7: 92–96.
  112. Puglia, Carmelo, Alessia Offerta, Giorgia Giusy Tirendi, Maria Stella Tarico, et al (2016) Design of Solid Lipid Nanoparticles for Caffeine Topical Administration. Drug delivery 23: 36–40.
  113. Boltri, L, S Morel, M Trotta, and MR Gasco (1994) In Vitro Transdermal Permeation of Nifedipine from Thickened Microemulsions. Journal de pharmacie de Belgique 49:  315–20.
  114. Changez, Mohammad, Jagdish Chander, Amit Kumar Dinda (2006) Transdermal Permeation of Tetracaine Hydrochloride by Lecithin Microemulsion: In Vivo.” Colloids surfaces B: Biointerfaces 48: 58–66.
  115. Wissing, S, A Lippacher, and R Müller (2001) Investigations on the Occlusive Properties of Solid Lipid Nanoparticles (SLN). Journal of cosmetic science 52: 313–24,
  116. Müller, Rainer H, Magdalene Radtke, Sylvia A Wissing (2002) Solid Lipid Nanoparticles (SLN) and Nanostructured Lipid Carriers (NLC) in Cosmetic and Dermatological Preparations. Advanced Drug Delivery Reviews 54: S131-S55.
  117.  Müller, RH, RD Petersen, A Hommoss, J Pardeike (2007) Nanostructured Lipid Carriers (NLC) in Cosmetic Dermal Products. Advanced Drug Delivery Reviews 59: 522–30.
  118. Shidhaye, SS, Reshma Vaidya, Sagar Sutar, Arati Patwardhan, VJ Kadam (2008) Solid Lipid Nanoparticles and Nanostructured Lipid Carriers-Innovative Generations of Solid Lipid Carriers. Current drug delivery 5: 324–31.
  119. Weyenberg, Wim, Plamen Filev, Dave Van den Plas, Jo Vandervoort et al (2007) Cytotoxicity of Submicron Emulsions and Solid Lipid Nanoparticles for Dermal Application. International Journal of Pharmaceutics 337: 291–98.
  120. Lopez, Renata FV, Jennifer E Seto, Daniel Blankschtein, Robert Langer (2011) Enhancing the Transdermal Delivery of Rigid Nanoparticles Using the Simultaneous Application of Ultrasound and Sodium Lauryl Sulfate. Biomaterials 32: 933–41.
  121. Marimuthu, Mohana, Devasier Bennet, Sanghyo Kim (2013) Self-Assembled Nanoparticles of Plga- Conjugated Glucosamine as a Sustained Transdermal Drug Delivery Vehicle. Polymer journal 45: 202.
  122. Takeuchi, Issei, Keishiro Tomoda, Megumi Koji, Kimiko Makino (2017) Hydrophilic Drug-Loaded PLGA Nanoparticles for Transdermal Delivery. Colloid Polymer Science 295: 977–83.

The Application of a CO2 Laser in Implant Site Development: A Case Report

DOI: 10.31038/JDMR.2019235

Abstract

Introduction: Ridge preservation procedures have been utilized to minimize the alveolar ridge dimensional changes following tooth extraction. This case report describes a novel approach to ridge preservation with an application of a carbon dioxide laser (CO2 laser) to stabilize blood clot formation and stimulate wound healing.

Case presentation: A 76-year-old Caucasian male with history of type 2 diabetes was referred for extraction of #8 and placement of a dental implant to reconstruct the area. Extraction was performed in a minimal traumatic manner and a mineralized freeze-dried bone allograft was placed in the socket. A 10,600 nm wavelength CO2 laser was used in setting of 1.0 watts focused continuous wave energy to stabilize the blood clot over the extraction site. The laser was used until a char layer was formed. This char layer was a non-bleeding stable blood clot, and the end-point of laser application was set as “no blood flow from the clot are within 10 seconds.” No membranes or sutures were used. Eleven weeks after the extraction and ridge preservation, a 4.1x10mm dental implant was placed with >35N/cm of primary stability and Implant stability quotient (ISQ) value of 83. A provisional crown was delivered at the time of implant placement. Three months following implant placement, the final restoration was delivered. The soft and hard tissue healing were uneventful to achieve esthetic and functional outcomes.

Conclusion: Within limits of this case report, the application of CO2 laser for “Laser-Assisted Blood Clot Formation” may enhance the soft and hard tissue healing following extraction for ridge preservations.

Keywords

Carbon Dioxide Laser, Ridge Preservation, Implant, Immediate Provisional

Introduction

Ridge preservation procedures have been utilized to minimize the loss of alveolar ridge dimension following extractions [1,2]. One of the most commonly used methods is application of bone substitutes graft materials into the extraction sockets as a scaffold for space maintenance and new bone formation since bundle bone will be resorbed following extractions [3–5]. Several studies have shown the positive effect on extraction site healing with laser irradiation [6,7]. Fukuoka reported that carbon dioxide laser irradiation in rat extraction sites resulted in less concavity and lower vertical alveolar ridge reduction compared to non-irradiated sites [8]. Moreover, histo-immunostaining revealed that less myofibroblastic activity was noted in irradiated areas. In other words, less wound contraction was noted due to the blood clot stability and possible low-level laser therapy (LLLT) effects [8]. A carbon dioxide laser (CO2 laser: wave length:10,600µm) has been utilized in dentistry primarily for soft tissue and hemostasis procedures [9]. Application of CO2 laser is considered relatively safer because the energy is absorbed on the surface of water and causes less scatter. The CO2 laser is used in a non-contact manner which is beneficial to stimulate the blood clot compared to other types of lasers which need direct contact on the tissues [10]. The aim of this case report is to demonstrate the novel application of CO2 laser for alveolar ridge preservation procedures.

Clinical Presentation

A 76-year-old white male presented to Indiana University School of Dentistry Graduate Periodontics Clinic for consultation for an implant of #8 in November 2017. The patient’s chief complaint was “This crown keeps falling out and needs to be fixed”. The patient’s medical history revealed well-controlled Type 2 diabetes (HbA1c:6.2%), hypertension, and history of myocardial infarction (stent and bypass surgery). His medications included clopiogrel 75mg and aspirin 81mg. The patient also reported that he took levothyroxine for hypothyroidism medication and used a CPAP machine for sleep apnea. #8 was deemed to be non-restorable due to recurrent caries. Treatment options were discussed with patient and #8 extraction and subsequent implant placement was chosen (Figure 1, 2).

JDMR-19-127-Yusuke Hamada_USA_F1

Figure 1. Pre-operative Clinical Appearance.

JDMR-19-127-Yusuke Hamada_USA_F2

Figure 2. Pre-operative Periapical Radiograph.

Case Management

Following the local anesthesia administration, the crown and post were removed. A sulcular incision was made around the root to sever the supracrestal attached tissue. No flap reflection was performed. The remained root was sectioned, elevated and extracted with periotome elevators. After granulation tissue removal, a 2–3 mm fenestration was noted on the facial mid to apical third of the extraction site. Mineralized freeze-dried bone allograft (FDBA) was hydrated with saline and placed in the extraction site to the level of the crestal bone. A 10,600 nm wavelength CO2 laser was used at a setting of 1.0 watts focused continuous wave energy to stabilize the blood clot over the extraction site. A gold tip was attached to the laser hand-piece. Target distance was set approximate 10mm from the edge of the gold tip. The divergence of beam was 6.2 degree and the spot size at the target was Ø0.48mm. Since we utilized 1W focused continuous wave mode of this device, the power density was 555.6W/cm2. A CO2 laser is absorbed by water, and it does not penetrate into the deep layer of the soft and hard tissue. However the careful attention was taken to keep moving the laser tip to reduce the heat generation and avoid the direct application onto the hard tissue structure including teeth and alveolar bone surfaces. The laser tip was moved continuously with circle motion approximately 3–5 turns/sec over the extraction site. Extraction site is approximately 10mm diameter, so beam movement is 9.4–15.7cm/sec of speed. This movement can reduce the concentration of energy on the one spot which increase the temperature. The laser was used until a char layer was formed. This char layer was a non-bleeding stable blood clot, and the end-point of laser application was set as “no blood flow from the clot are within 10 seconds” (Figure 3–5).

JDMR-19-127-Yusuke Hamada_USA_F3

Figure 3. Immediately after the extraction: Buccal bone was present.

JDMR-19-127-Yusuke Hamada_USA_F4

Figure 4. Description of laser tip and object.

JDMR-19-127-Yusuke Hamada_USA_F5

Figure 5. Laser Assisted Blood Clot Formation and Stabilization were achieved.

Results

The wound healing was uneventful and no complications were noted. The patient returned for 1, 3 and 7 week post-operative visits (Figure 6–8). At 11 weeks following the extraction, the site was re-entered for implant placement. Following crestal and slight vertical incision on mesial on #8, a full thickness flap was elevated. Crestal bone revealed solid and flat alveolar bone upon flap reflection in the former extraction site although slight soft tissue concavity was noted. The buccal-palatal dimension ofalveolar bone was sufficient for the planned dental implant. Implant osteotomy was performed per manufacturer recommendation and a 4.1 x 10 mm implant§ was placed with an insertion torque of 35 N/cm. Implant Stability Quotient (ISQ) value showed 83 from both buccal and lingual directions. Due to the high implant stability, an immediate provisional was fabricated chairside and delivered (Figure 9–13). The use of an immediate provisional allowed better soft tissue emergence profile as well as patient comfort and convenience. Three months following implant placement, a definitive restoration was delivered. Final restoration showed good soft tissue esthetics and papillary fill, and the outcome has been stable up to one year (Figure 14,15).

JDMR-19-127-Yusuke Hamada_USA_F6

Figure 6. 1 week post-operative clinical view.

JDMR-19-127-Yusuke Hamada_USA_F7

Figure 7. 3 weeks post-operative clinical view.

JDMR-19-127-Yusuke Hamada_USA_F8

Figure 8. 7 weeks post-operative clinical view.

JDMR-19-127-Yusuke Hamada_USA_F9

Figure 9. 11 weeks post-operative clinical view.

JDMR-19-127-Yusuke Hamada_USA_F10

Figure 10. 11 weeks post-operative periapical radiograph.

JDMR-19-127-Yusuke Hamada_USA_F11

Figure 11. Bone regeneration was noted 11 weeks after the extraction.

JDMR-19-127-Yusuke Hamada_USA_F12

Figure 12. 1 week after the implant placement and provisional crown delivery. (Clinical)

JDMR-19-127-Yusuke Hamada_USA_F13

Figure 13. 1 week after the implant placement and provisional crown delivery. (Periapical radiograph)

JDMR-19-127-Yusuke Hamada_USA_F14

Figure 14. 1 year after the implant placement with the final crown: Acceptable papillae fill and gingival health was obtained

JDMR-19-127-Yusuke Hamada_USA_F15

Figure 15. 1 year after the implant placement with the final crown: No marginal bone loss was noted.

Discussion

Extraction sites usually heal by secondary intention, and slight concavity over the crestal area is very common [11]. Amler described the healing process of human extraction wounds [12]. For the undisturbed healing sites, initial blood clot formation fills the entire socket and followed by immature connective tissue formation and epithelization over the wound. Disruption of the blood clot during healing can result in disturbance of the normal healing pattern and is suspected to be the cause of ofalveolar osteitis. The exposed alveolar bone surface causes not only pain also significant wound healing delayed. According to this description, blood clot stability will directly affect the wound stability which can maximize the regenerative capacity. Cortellini and Tonetti compared application of modified minimal invasive surgery with or without graft materials or growth factors [13]. Then the study showed that there were no statistical differences between groups. The key to achieve the maximum potential of regenerative outcome is to create a stable environment for soft and hard tissue healing. In this case report, we tested the application of CO2 laser to stabilize the blood clot formation over the extraction site. Due to the blood clot stability, relatively faster epithelization over the extraction site was observed during the initial healing process. Meloni et al. utilized a porcine collagen matrix and connective tissue graft to cover the extraction site following placement of a bone graft substitute. Both methods did not show any significant differences for healing outcomes. The concept of those procedures was also to achieve wound stability by placing graft materials. Disadvantages of those soft tissue grafts and those substitutes are required to place sutures to obtain stabilization. In addition to those sutures, harvesting of connective tissue requires a secondary surgical site, and those substitutes are not cost friendly [14]. On the contrary, utilization of CO2 laser does not require any sutures nor additional soft grafts since this technique is simply stimulating blood coagulation and stabilizing the blood clot. The authors would like to propose that this procedure can be named as a “laser assisted blood clot formation”. However, there is currently no evidence to show how soft tissue healing process with CO2 laser can induce the bone maturation and preservation of ridge dimension. Due to the nature of case report, the other limitation of this study was that ridge dimension change was not measured prospectively. Although the existing buccal bone thickness was thin at the time of extraction, this case cannot prove which factor (bone substitute grafting or blood clot stability with CO2 laser) contributed to the outcome of this case report. Further studies are needed to substantiate these results.

Conclusion

Within limits of this case report, the application of CO2 laser for “Laser-Assisted Blood Clot Formation” may enhance the soft and hard tissue healing following extraction for ridge preservations.

Acknowledgement

The authors would like to acknowledge Dr. Eiji Funakosi, Private practitioner, founder of Funakoshi Research Institute of Clinical Periodontology, Fukuoka, Japan for the assistance to develop this laser protocol.

The authors also would like to acknowledge Mr. Tatsuya Kashima and Mr. Wataru Kikuchi (THE YOSHIDA DENTAL MFG. CO., LTD) for the calculation of the total energy of this laser application.

References

  1. Hämmerle CH, Araújo MG, Simion M; Osteology Consensus Group 2011 (2012) Evidence-based knowledge on the biology and treatment of extraction sockets. Clin Oral Implants Res 5: 80–82. [crossref]
  2. Schropp L, Wenzel A, Kostopoulos L, Karring T (2003) Bone healing and soft tissue contour changes following single-tooth extraction: a clinical and radiographic 12-month prospective study. Int J Periodontics Restorative Dent 23: 313–323.
  3. Araujo MG, Lindhe J (2005) Dimensional ridge alterations following tooth extraction. An experimental study in the dog. J Clin Periodontol 32: 212–218.
  4. Frost NA, Banjar AA, Galloway PB, Huynh-Ba G, Mealey BL (2014) The decision-making process for ridge preservation procedures after tooth extraction. Clinical Advances in Periodontics 4: 56–63.
  5. De Risi V, Clementini M, Vittorini G, Mannocci A, De Sanctis M (2015) Alveolar ridge preservation techniques: a systematic review and meta-analysis of histological and histomorphometrical data. Clin Oral Implants Res 26: 50–68.
  6. Brawn PR, Kwong-Hing A (2007) Histologic comparison of light emitting diode phototherapy-treated hydroxyapatite-grafted extraction sockets: a same-mouth case study. Implant Dent 16: 204–211.
  7. Cranska J (2008) Post-extraction laser hemostasis with immediate insertion of a bonded bridge. Dent Today 27: 108–110.
  8. Fukuoka H, Daigo Y, Enoki N, Taniguchi K, Sato H (2011) Influence of carbon dioxide laser irradiation on the healing process of extraction sockets. Acta Odontol Scand 69: 33–40. [crossref]
  9. Cobb CM (2006) Lasers in periodontics: a review of the literature. J Periodontol 77: 545–564. [crossref]
  10. Aoki A, Mizutani K, Schwarz F (2015) Periodontal and peri-implant wound healing following laser therapy. Periodontol 2000 68: 217–269.
  11. Lin Z, Rios HF, Volk SL, Sugai JV, Jin Q, et al. (2011) Gene expression dynamics during bone healing and osseointegration. J Periodontol 82: 1007–1017. [crossref]
  12. Amler MH (1969) The time sequence of tissue regeneration in human extraction wounds. Oral Surg Oral Med Oral Pathol 27: 309–318. [crossref]
  13. Cortellini P, Tonetti MS (2011) Clinical and radiographic outcomes of the modified minimally invasive surgical technique with and without regenerative materials: a randomized-controlled trial in intra-bony defects. J Clin Periodontol 38: 365–373.
  14. Meloni SM, Tallarico M, Lolli FM, Deledda A, Pisano M, et al. (2015) Postextraction socket preservation using epithelial connective tissue graft vs porcine collagen matrix. 1-year results of a randomised controlled trial. Eur J Oral Implantol 8: 39–48.

A view of brief CBT for insomnia in Japan

DOI: 10.31038/ASMHS.2019335


Insomnia is common among older people that one out of five person complain insomnia in Japan [1]. The treatment of sleep-related illness in older patients must be undertaken with an appreciation of the physiologic changes associated with aging [2].

However one out of twenty person is using a sleeping drug in Japan [3]. The Guideline of Ministry of Health, Labor and Welfare (2013) points out to problem that multiple and massive dose drug and long—term administration. It is important issue that improvement of life style in aged person with insomnia. Furthermore epidemiologic survey showed that deficiency of sleeping time increased risk of obesity [4] and concerned with prevalence and crisis rate of hypertension [5, 6]. Insomnia is important factor of lifestyle disease and influence to aging.

Insomnia is the most frequency of sleep-related illness that is caused by chronic psychological stress and anxiety in daily life [7]. Insomnia should be treat independently (International Classification of Sleep Disorders, Third edition) and Cognitive Behavioral Therapy for Insomnia (CBT-I) is recommended as the most high evidence in non-drug treatment in US [8]. CBT-I was reported to meta-analysis of randomized controlled trial that is effectively at the end of point and the follow-up point in Japan [9]. However, it is not only CBT-I but also CBT for mental illness are not diffused in clinical fields in Japan because practitioners and time for the treatment are very few. Accordingly, Japanese nurses are expected to the practical person of CBT and the educational training system have been continued by Ministry of Health, Labor and Welfare. We consider that Japanese nurses should engage to CBT-I and a simple model of CBT-I is required.

Recently, brief CBT-I has been developed in UK [10] and the effectiveness was report [11]. We try to develop of brief CBT-I Japanese-version and try to the pilot study. Standard CBT-I is five or six session and take about fifty minutes, but brief CBT-I is four or three session and take about ten minutes. Our brief CBT-I focus to individual problems, and it is very specific content. If the brief CBT-I by Japanese nurses is effectively, multiple and massive dose drug among older people will improve. At the present moment, the pilot study is producing to very good results. I will engage to randomized controlled trial in the future.

References

  1. Kim K, Uchiyama M, Okawa M (2000) An epidemiological study of insomnia among the Japanese general population. Sleep 23: 41–47.
  2. Norman W, Osama Elkholy, Marc Baltzan, Mark Palayew (2007) Sleep and aging: 2. Management of sleep disorders in older people. CMAJ 176: 1449–1454.
  3. Kaneita Y, Ohida T, Osaki Y, Tanihata T, Minowa M, et al. (2007) Association between mental health status and sleep status among adolescents in Japan: a nationwide cross-sectional survey. J Clin Psychiatry 68: 1426–1435.
  4. Cappuccio FP, Taggart FM Kandala NB (2008) Gender-Specific Associations of Short Sleep Duration With Prevalent and Incident Hypertension The Whitehall II Study. Sleep 30: 619–626.
  5. Gangwisch JE, Heymsfield SB, Boden-Albala B (2006) Short Sleep Duration as a Risk Factor for Hypertension Analyses of the First National Health and Nutrition Examination Survey. Hypertension 47: 833–839.
  6. Gottlieb DJ, Redline S, Nieto FJ (2006) Association of Usual Sleep Duration With Hypertension: The Sleep Heart Health Sleep. Sleep 29: 1009–1014.
  7. http://ghdx.healthdata.org/organizations/ministry-health-labour-and-welfare-japan.
  8. Practice Parameters for the Psychological and Behavioral Treatment of Insomnia: An Update. An American Academy of Sleep Medicine Report 2006.
  9. Okajima I, Komada Y, Inoue YA (2011) meta-analysis on the treatment effectiveness of cognitive behavioral therapy for primary insomnia. Sleep and Biol Rhythms 9: 24–34.
  10. David L (2013) Using CBT in General Practice (2nd Edn) The 10 Minute CBT Handbook, Scion Publishing Ltd. United Kingdom.
  11. Tonya M P, Sarah B E, Maggie B, et al. (2017) A single arm pilot trial of brief cognitive behavioral therapy for insomnia in adolescents with physical and psychiatric comorbidities, Jounal of Clinical Sleep Medicine 13: 401–410.