Abstract
This paper explores the messaging about a doctor visit from the perspective of survey takers (respondents) acting as prospective patients. Respondents evaluated systematically varied vignettes, combinations of messages about a visit to the doctor. The elements were developed using artificial intelligence embedded in the BimiLeap program. Respondents each evaluated 24 unique vignettes comprising systematically varied combinations of the messages. Each vignette presented 2-4 messages, combined according to a main- effects permuted experimental design. Based upon the response to the vignettes about a ‘visit to the doctor’s office,’ regression and cluster analyses revealed three different-sets of prospective and current patients (Patient Mind-Set 1: Focus on connection with the doctor after the visit; Patient Mind-Set 2 – Doctor is attentive to my needs and involves me; Patient Mind-Set 3 – Visit ends with what specifically to do..) The Mind Genomics approach presented in this paper can be used to educate medical professionals about what they believe patients want and what patients actually want regarding the visit to their health care office.
Introduction
A search through the academic literature reveals what many practitioners and patients already know, namely that the patient-facing system today is ‘broken’, or at least can be optimized. One need only read the titles of papers to get a sense of the massive dissatisfaction, both from the viewpoint of the patient books detailing the issues, but perhaps a more productive solution is to find out what patients need and want from the point of view of human interaction. The clinical issues are best left to the experts, but what about the issues of patient experience? [1-4].
In today’s climate of hyper measurement, of everything, the patient experience is measured with an almost religious fervor. Following most visits, one receives the now-expected follow-up survey of the experience (e.g., Press-Ganey, Siegrist, 2013) [5]. No patient visit is left unexamined, as the patient is warned to expect a follow-up satisfaction survey and requested to be sure to uprate the scores for the experience if at all possible. Survey after survey, whether from a survey professional or from the office of the practitioner show remarkably similar structure, namely rating general statements about the experience on some type of point scale, along with questions about recommendations. These general surveys continue to show a decreasing satisfaction with the interaction with the doctor in the office, a trend that people may talk about in casual conversation but has now become a topic in the world of professional medicine [6]. Some of the issues may be individual differences, with doctors and nurses varying in their so-called bedside manner. Those differences are built into the system. People behave the way they behave. They may be taught some ways around their behavioral shortcomings once these shortcomings are identified, but the people may take years to really improve their behaviors. The other issue is the change in the economics, with insurance companies and venture capital using the medical system to optimize financial yield by treating the visit with the patient as a product whose ‘financials’ are to be optimized as if optimizing the production of any item to be sold to customers.
Exploring Granular Thinking about the Visit to the Doctor through Mind Genomics
Over the past forty years an alternative way of thinking about measuring experience has emerged, the origins of which go back to the pioneering work of functional measurement, and the foundations of mathematical psychology embodied in conjoint measurement. The common property here is to present respondents with combinations of alternatives and get their ratings of these alternatives or their choices. The subsequent mathematical analysis relating the choices or ratings to the composition of the test combinations reveals the underlying strength of the individual options or elements. The rationale for this approach comes from the realization that people react to stories, to vignettes of experience, not to single statements. It is more ecologically valid to present ‘small stories’ to be judged, and in turn identifying ‘what’ in the stories drives the reaction of the person judging the stories. It is from this worldview that Mind Genomics evolved, as an attempt to explore the granularity of experience in a way that does not allow the respondent to ‘game’ the system [7,8].
Mind Genomics evolved from this pioneering work, focusing on simple, DIY (do it y 0urself) templates, and automated analyses Underlying the DIY template is a carefully structured path which ensures that the data emerging from the Mind Genomics study will be statistically correct, even to the level of an individual respondent. The Mind Genomics approach has been used for many different types of problems, ranging from medical to legal, ethics, consumer products, social issues and education. The approach is similar for virtually all of the studies, with the exception of the specific elements or messages, and the underlying experimental design. The specific steps for the Mind Genomics studies have been presented in various papers. The approach followed in those papers will be one used here, with slight variations, such as the use of regression modeling without an additive constant, a change which makes the data easier to understand [9-11].
This study focuses on the application of the Mind Genomics approach to the issue of what do patients want in the sessions with their doctors, and in turn what do doctors, nurses, and senior medical students feel they want in their interaction with the patient.
The Mind Genomics World View
When one thinks about the mind of the patient regarding the session with a doctor, or vice versa, the mind of a doctor or other health professional thinking about the session with a patient, the topic at first seems easy, almost self-evident. There is an almost instinctive positive or negative reaction when patients describe their experiences with doctors, a reaction that can range from rapturous to disillusioned. A lot of it is emotion, with the catch-all phrase of bed-side manner summarizing a great deal of the feelings about the experience, even when the meeting occur at an appointment rather than at the bedside of a sick person [12]. The important thing to note is the reality that for most patients the doctor or nurse is the professional with whom they will interact, from whom they may get good news or less fortunately, bad news. Whether the doctor is proficient or not may be relevant and can be determined from reviews and from talking to one’s friends, but the immediate situation is one of emotion. The emotional tension may be mild, such as the visit to the doctor’s office for a routine physical, or the emotional tension may be significant as in the case of the doctor calling the patient to come in talk about some issues which have just surfaced for the patient.
At the end of the visit, the patient is often asked to complete a survey about responses to the visit. Press-Ganey surveys are well known in this regard [13], although patients may be asked to fill out any of many different ‘home-grown’ surveys, devised by the staff of the specific medical practice. T the typical survey might end up having the patient rate the doctor’s behavior at the visit, perhaps doing so with one overall rating or perhaps dimensionalizing the visit into such direct issues as the rating of promptness, explanation of the situation, the amount of time spent with the doctor, and so forth. These numbers are tabulated and produced into a report profiling the visit as a series of scaled responses, like a report card, albeit one with more emotion but perhaps absence of soul anyway.
The foregoing approach allows the researcher to cover many topics, but in superficial terms only. In the effort to capture as many aspects as possible about the visit of patient and health professional, the researcher ends up giving each topic short shrift, usually covering the topic by one general question or perhaps two or three general questions. There is usually none of the richness of language to capture the experience, and the feeling about such experience.
It is at this point that Mind Genomics departs from the conventional methods. Mind Genomics presents vignettes, combinations of messages, to the respondent, and instructs the respondent to rate the feeling about the vignette. The respondent is not asked to be analytical, but simply to rate the feeling on a scale. The respondent ends up rating a set of these vignettes, combinations of messages, with each vignette comprising a minimum of two and a maximum of four elements. The vignettes are simple to read, convey detailed information, and simply require the respondent to scan them and assign a rating. From the evaluation of 24 such vignettes, each rated by a respondent, the researcher can assemble a profile of how each of test phrases (16 of them) drive the respondent’s feelings. The respondent feels that she or he is guessing, but nothing can be further from the truth. Each set of 24 vignettes evaluated by a respondent differs in combination from every other set of 24 vignettes. Underneath the combinations is a carefully designed layout, the experimental design, which puts these combinations together in a structured manner, allowing the respondent to react to a compound description, but with the ability to tease out the contribution of each element of the vignette. Often the survey-taker’s response is that the interview seemed jumbled, the elements seemed randomly combined, and instead of trying to answer honestly (another way for saying ‘giving the correct response’), survey-taker confesses that she or he simply guessed.
The analysis of the results provides a deep snapshot of how the respondent feels about the elements. The system cannot be gamed. The ability to probe a topic deeply rather than superficially means that it is now possible to deeply understand the topic. The data make a great deal of sense as will be shown below. Almost always, faced with 24 seemingly random combinations of messages about a topic, the respondent feels she or he gives up trying to guess and simply assigns a rating which seems ‘correct.’ It is that level of focus, the same level that economic psychologists Daniel Kahneman calls ‘System 1’ [14].
Mind Genomics data are deconstructed into the contribution of the different messages. The story is in the pattern of coefficients from models or equations relating the presence/absence of elements the messages, the response. These coefficients emerge from regression. The pattern of coefficients often points to different groups of people, the differences now coming from who they are but from how they think about the specific topic. These are the mind-sets, the desired information emerging from the study of the granular experience.
Setting Up the Study on the Mind Genomics Platform
To illustrate the approach of Mind Genomics we present a study on what low-income respondents feel they want from a visit with the doctor. Thus, the Mind Genomics projects here are done in the spirit of patient satisfaction studies (e.g., like Press Ganey survey), or the very many after-the-fact customer satisfaction surveys which try to dimensionalized the experience with the professional, the sales representative, or the help desk..
The study was suggested by a constant topic surfaced in the daily online, world-wide meeting among clinicians and allied parties, the Global Population Health Management Forum. A continuing theme of the FORUM is the recognition that people feel shortchanged by the current medical care system, especially in the United States, but increasing in other countries. These feelings about ‘shortchange’ actually came from the doctors themselves and were supported by both medical literature [15], and by popular literature and advertisement.
Figures 1-4 show the steps of the process represented by screen shots. Figure 1, Panel A show the first screen, requiring the respondent to assign the study a name, to select the language of the prompts (e.g., English, Chinese, etc.), and to agree not to request personal information unless specifically agreed to by the survey taker before the start of the study.
Figure 1 Panel B shows introduction to the AI-powered Idea Coach. Often the researcher is unable to formulate questions. This inability to formulate a string of questions is increasingly common because it requires critical and structured thinking. During the years 20222-2023 the emergence of easily available AI in the form of Chat GPT allowed for the Mind Genomics program to incorporate a system to suggest questions, based upon the input of the researcher. These questions are suggestions for discussion, and not meant to be informational. They teach about the topic by presenting different questions that the researcher can ask. The Idea Coach can be accessed dozens of times until the researcher has discovered the four questions that are of greatest promise. Each use of the Idea Coach generates 15 questions. With many uses of Idea Coach for the same ‘squib’ or problem description, Idea Coach will produce a number of different questions, but some questions will repeat.
Figure 1 Panel C shows a set of questions produced by AI through Idea Coach. To reinforce the spirit of experimentation and inquiry and to reduce the fear of asking question, the Idea Coach can be re-interrogated as many times as desired. After a while the same questions will appear. The different suggestions for questions from Idea Coach will be stored for subsequent analysis and returned to the researcher in a comprehensive package called the ‘Idea Book’. The Idea Book is separate from the study, set up as a document to help learning.
Figure 1 Panel D shows the final four questions selected by the researchers with the aid of AI (Idea Coach), but with the language edited by the researcher to make the question easier to understand. Figure 2, Panel A shows the output of one run of Idea Coach to select answers for question A (How do you want to spend your visit with the doctor). Each iteration of the Idea Coach to provide answers to the questions will generate 15 answers. As in the case of generating questions, generating answers will produce both new answers and repeats.
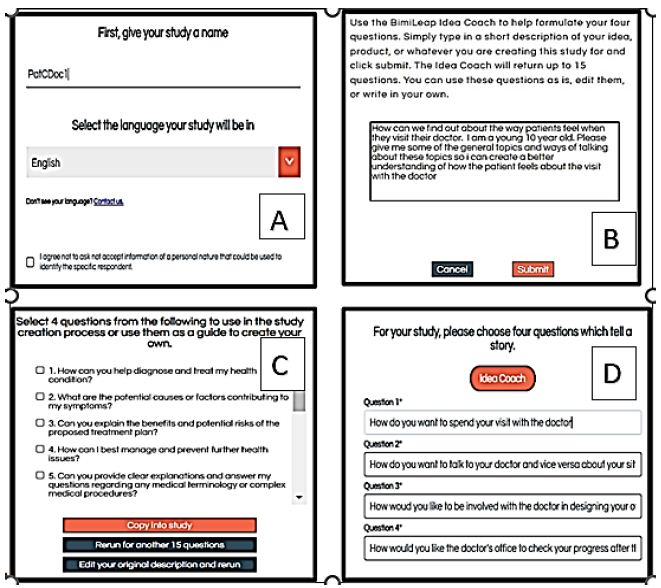
Figure 1: The first part of the set-up for the study, using a templated system and AI (Idea Coach) to suggest questions.
Figure 2, Panel B shows the four answers that were accepted by the researcher. As was the case for the generation of questions, the idea Coach returns with a mix of previously used answers and new answers. Once again the researcher can modify the answer and may return to the question section to modify the language of the question.
Figure 2, Panel C shows the self-profiling question, set up so that the researcher can find out more detailed information about who the survey taker is, what the survey taker thinks, and what the survey taker does. The language in Panel C for eight questions is left to the researcher. The two remaining questions are age and gender.
Figure 2, Panel D shows the rating question that will be used by the respondent, who in the course of the study will evaluate 24 vignettes, created by combining answers together. For right now, it is only important to keep in mind that the scale has a minimum number of points (five), and that the scale has two dimensions, first For Me vs Not For Me, and then Positive Gut Feel vs Negative Gut Feel. In this way the study generates a deeper picture of how the survey taker feels. Figure 3 shows final thoughts and the open-ended questions.
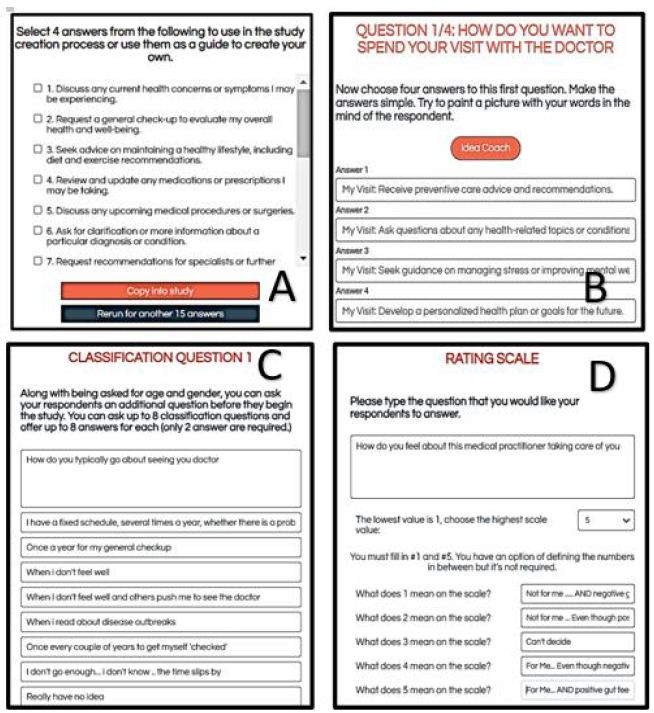
Figure 2: Creating the answers, the self-profiling classification question(s), and the rating scale
Figure 3 (Panel A) shows the box where the respondent. Figure 3B shows the box where the researcher can record the purpose of the study. The researcher is required to write something in this box. The rationale is that the BimiLeap system is used for teaching as well as for exploring real situations. As such, it is a good idea for the person designing the study to record the rationale. The study is also meant to be searchable on a big database, requiring that the researcher select key worlds.
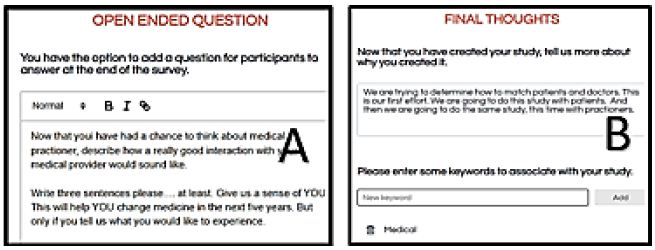
Figure 3: The opened-ended question and the final thoughts about the study as written by the researcher
The respondent experience begins with the greeting to the respondent, and then the self-profiling questionnaire as shown in Figure 4. The questions were created at the set-up time (see Figure 2, Panel C). To make the introduction less daunting, the BimiLeap program presents the questions in one page, but the answers in pull-down form. The respondent provides the necessary information, including the agreement not to provide any information that would identify the respondent. For those cases where it is necessary to know who the respondent actually is, the study must be augmented by permission forms. Otherwise, the default is total privacy.
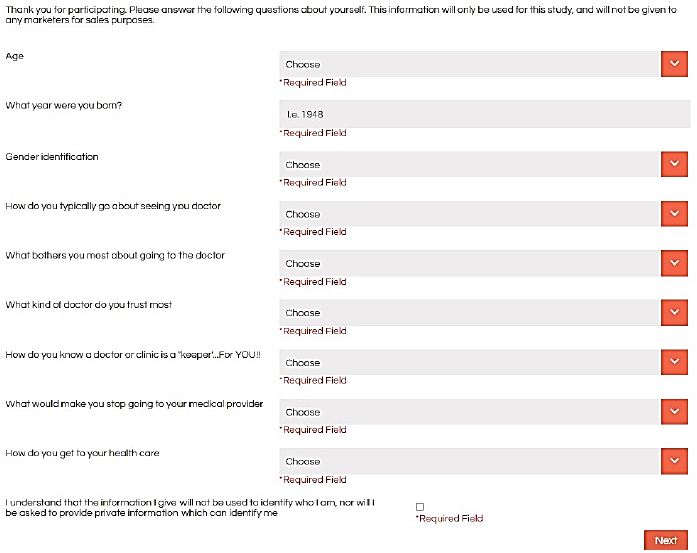
Figure 4: The self-profiling questionnaire page
Figure 5 shows the vignette as it looks on a PC. The vignette presented to the respondent is a stark collection of phrases, put into the different groups as answers to questions. The vignette shows only the answers, not the questions. The layout of the vignette throws information at the respondent in what must seem like a ‘blooming, buzzing confusion’ in the words of Harvard psychologist William James when asked to describe the perceptual world of the newborn baby. Despite the stark appearance, the vignette is effective as a means to throw information at the respondent in a way which allows them to ‘graze’, to pick up information quickly, rate the vignette, and move on to the next. After 24 vignettes the respondent does not feel ‘drained’ by having had to read an enormous amount of prose. The sheer starkness of the layout allows the researcher to move quickly through the vignettes, rather than being caught in the quicksand of too much verbiage.
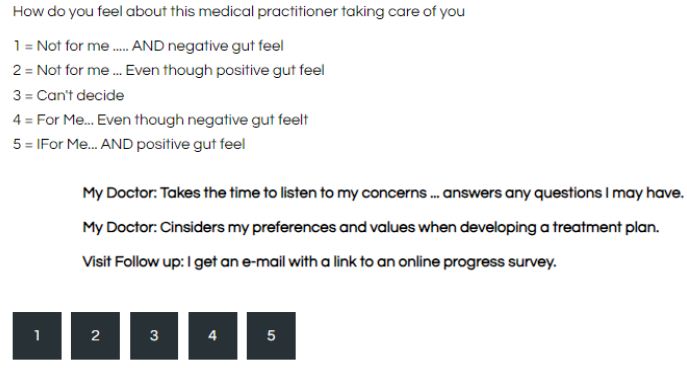
Figure 5: Example of a vignette as it looks on a PC. Each respondent evaluated a unique set of 24 such vignettes.
The actual combinations of elements (vignettes) are prescribed by an underlying experimental design. The experimental design was developed in a fashion which allows each respondent to evaluate a unique set of 24 vignettes. Each vignette has a minimum of two elements, and a maximum of four elements. The elements are answers to the questions. A vignette never contains more than one answer from a question, but many vignettes are absent from one question or absent from two questions, respectively. Finally, the experimental design is created so that each respondent ends up evaluating an isomorphic experimental design, viz., the same mathematical design but with different combinations. This is called an isomorphic permuted design [16].
How Low-income Respondents in New York Design Their Visit to the Doctor
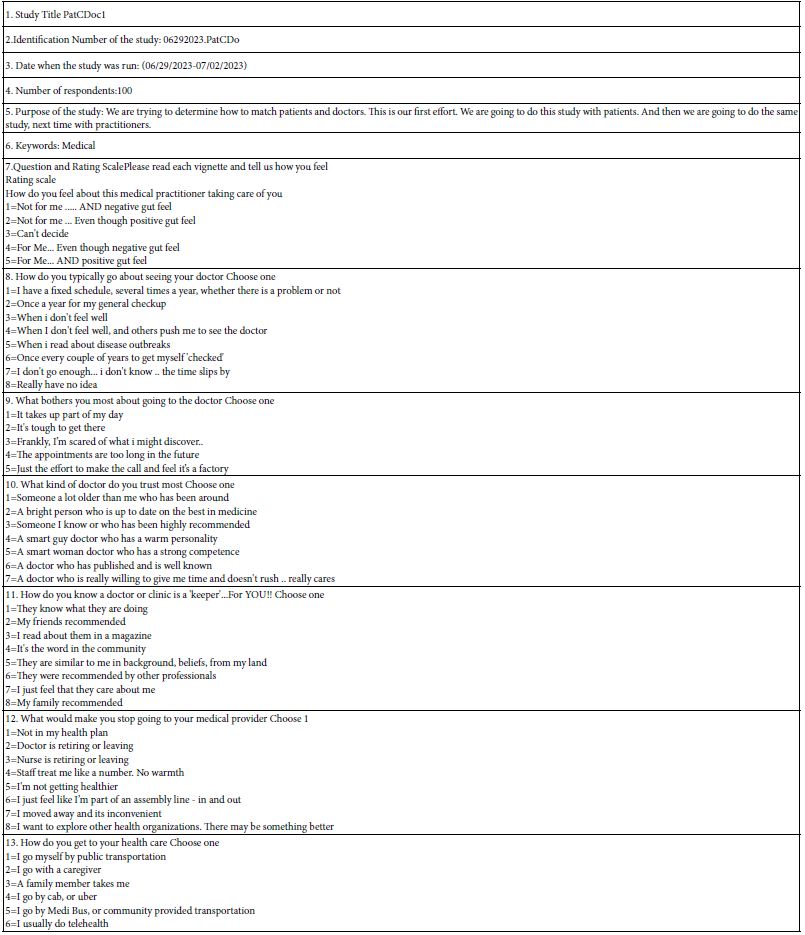
This study focused on the design of a visit to the doctor by the patient. The respondents were chosen to be low-income individuals. The respondents were provided by a Mind Genomics vendor specializing in on-line survey-takers. The vendor, Luc.id Inc., provides totally anonymized respondents who fit the above-mentioned criteria (Table 1).
Table 1: Specifics for study 1 (Low-income respondents design visit to doctor)
Each respondent evaluated a full set of vignettes, as structured by the underlying experimental design. To reinforce the point made above, each respondent evaluated a totally different combination of vignettes. The ratings on the 5-point scale were transformed to a binary scale. Ratings of 5 and 4 (For Me) were transformed to 100, ratings of 3, 2 and 1 were transformed to 0. The conversion of a Likert scale to a simple binary scale makes the results easier to communicate.
After the transformation, the data from each self-defined group was subject to an OLS (ordinary lease-squares) regression. The regression is expressed by the statement: Top2 = k1(A1) + k2(A2)…K16(D4). The coefficients tell us the additive percent of respondents who will rate the vignettes 5 or 4 (viz., ‘Me’) when the vignette contains the specific element.
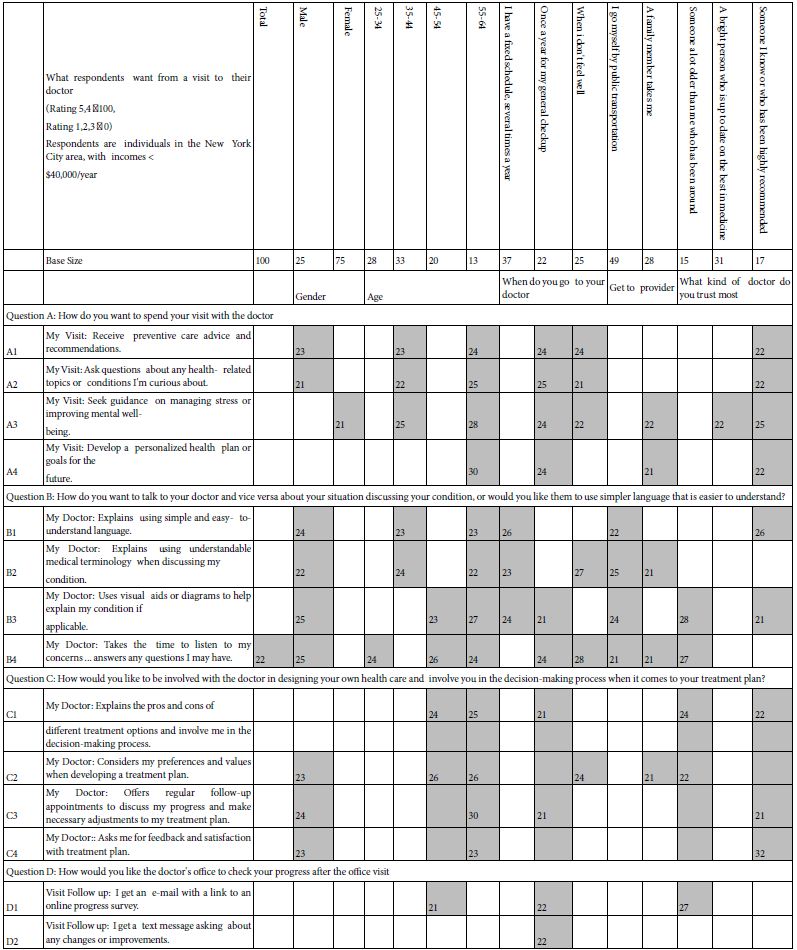
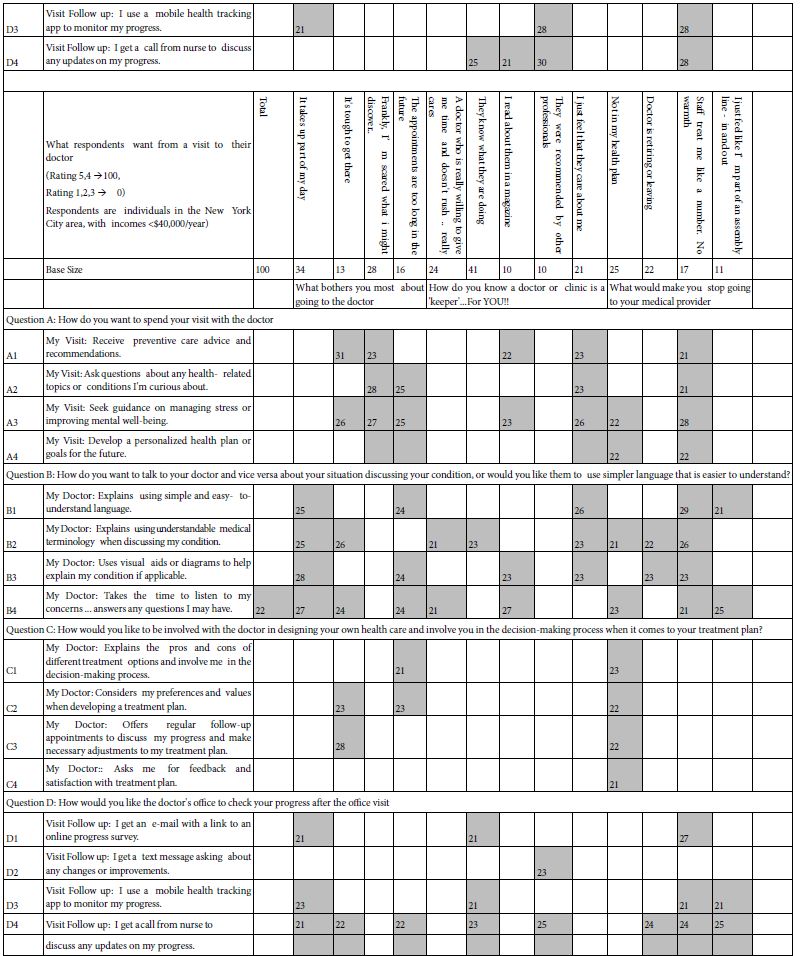
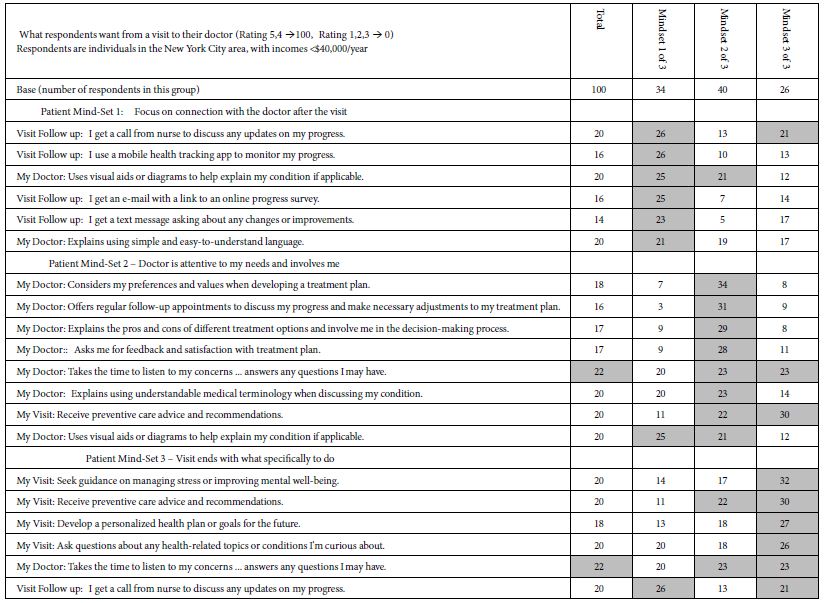
Often researchers and respondents feel that the evaluation of vignettes complicates an otherwise easy task. Table 2 shows the strong performing coefficients across the 16 elements, and all of the subgroups. There are no clear patterns across groups, a situation which typically appears in Mind Genomics studies when the focus is on clearly different groups, but when there is no method for understanding the deep differences in the way of thinking. The clear patterns will emerge from mind-set segmentation, shown in the next section.
Table 2: High scoring elements for the rating of ‘Fits Me’. Coefficients of 21 and above are shaded
Mind-Sets in the Population
Mind Genomics was developed as a response to the psychophysics of the 1950’s and 1960’s, which searched for invariance, for the ‘one’ or ‘correct’ relation between physical stimulus level and subjective response. Psychophysicists typically work with well-defined physical stimuli, such as tones of varying sound pressure levels, weights of varying mass, circles of different areas, or money of various amounts. The standard approach espoused by Harvard psychophysicist, S Smith Stevens was to present unpracticed respondents with stimuli of various magnitudes, instruct the respondents to rate the perceived intensity, and then plot the relation between the number assigned (so-called magnitude estimate) and the physical magnitude [17]. The relation conformed to a power equation pf the form Rating = k(Physical Magnitude)n. The exponent n becomes the slope when the foregoing power equation or power function was linearized by being plotted in log-log coordinates, viz. log Rating = log k + n(Log Physical Magnitude). Note that it was within this tradition the author HRM received his PhD with Professor Stevens, in 1969.
The linearizable power function breaks down when the rating is degree of liking. In that case the relation is a curve perhaps like a parabola. There is an optimal level of liking somewhere in the middle stimulus range [18]. Just as important, the optimum point varies across people. The optimal level of liking may be of low intensity, medium intensity or high intensity. One need only think of the addition of sweetener or whitener to coffee/ some people like sweet dark coffee, others like light but non sweet coffee, and so forth.
With the differences in optimal points, one needs to cluster the respondents to identify meaningful, although operationally defined groups, called taste segments. The same thing can be done for the different messages in a Mind Genomics study to identify mid-sets. The thinking is the same; create a measure for each individual showing the pattern of elements which drive interest, and then cluster the respondents based upon similarities these patterns.
The process to develop these segments, not of taste but of thinking, follows a straightforward path, one which does not make any assumptions but rather combines statistical analysis by k-means clustering [19], followed by regression analysis to create the ‘mind-set’ equations, and then interpretation. The interpretation of the clusters is left to the researcher, with the suggestion that there be as few clusters or ‘mind-sets’ as possible (parsimony), but with the mind-sets interpretable.
Table 3 shows the coefficients for the mind-sets. The data could have been limited to two mind-sets, but the clustering solution for two mind-sets was unclear. When three mind-sets were extracted the results made more sense. Table 3 shows the strongest performing elements for each mind-set. From time to time an element might perform well in two of the three mind-sets, almost never in three of the three mind-sets.
Table 3: Performance of the 16 coefficients among respondents assigned to the Total Panel and then to one of three mutually exclusive and exhaustive mind-sets. Strong performing elements, coefficients of 21 or higher, are shown in shaded cells.
The three mind-sets are not mutually exclusive, but rather reflect the existence of individuals who stress different aspects of the visit with the doctor or other medical professional.
Patient Mind-Set 1: Focus on connection with the doctor after the visit
Patient Mind-Set 2 – Doctor is attentive to my needs and involves me
Patient Mind-Set 3 – Visit ends with what specifically to do.
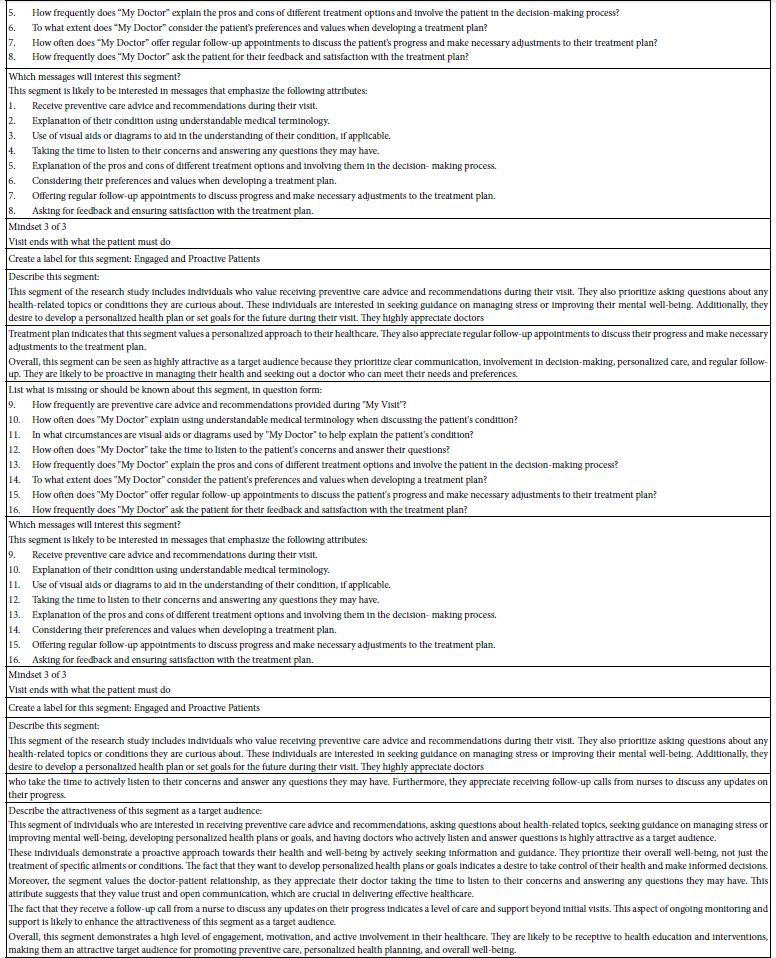
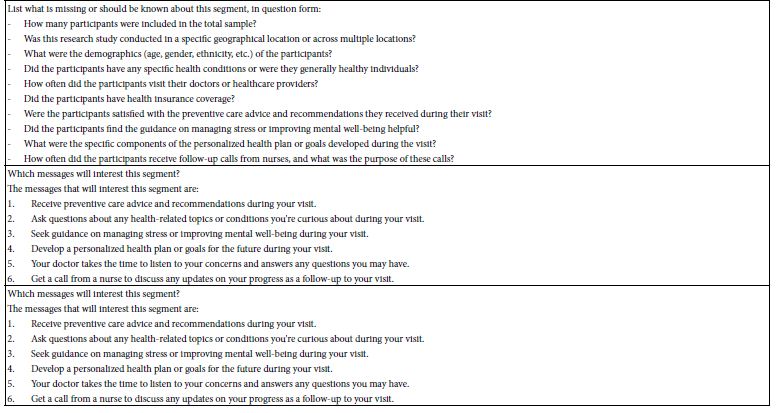
During the past several years the emergence of AI, artificial intelligence, has become of increasing interest to researchers. The Mind Genomics program in BimiLeap now incorporates a set of queries for the strong elements of each key subgroup. Table 4 presents the AI ‘summarization’ of the three mind-sets. The summarization is not meant to replace the human interpretation but rather to highlight some possible patterns that would not have been suspected.
Table 4: AI summarization of the strong performing elements for each mind-set by using Chat GPT to identify commonalities among these elements.
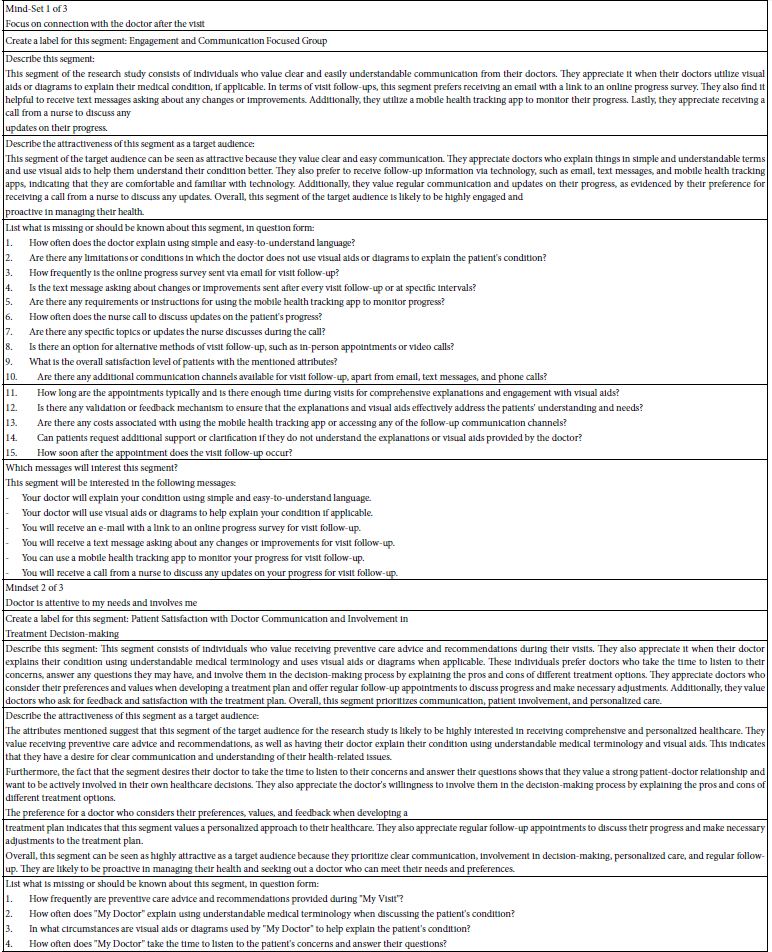
During the past several years the emergence of AI, artificial intelligence, has become of increasing interest to researchers. The Mind Genomics program in BimiLeap now incorporates a set of queries for the strong elements of each key subgroup. Table 4 presents the AI ‘summarization’ of the three mind-sets. The summarization is not meant to replace the human interpretation but rather to highlight some possible patterns that would not have been suspected.
From Knowledge to Application: Creating ‘Service-Based Products’
As part of the AI ‘summarization’ by fixed queries about strong performing elements (Table 4), the notion emerged that perhaps armed with the strong performing ideas the AI might be able suggest new innovative products, services, experiences, or policies. Table 5 shows these AI-driven suggestions. It is important to keep in mind that the raw materials for these suggestions are the elements that were found to be most appealing by the mind-sets of actual people, the respondents or survey-takers participating in the study. Whether the suggestions are good or poor, meaningful or meaningless, is not the issue here. Rather, the ease with which the researcher can work with ordinary people to understand in the particulars of the wellness-illness continuum means that one can now use AI to suggest possible solutions to the problem. With a Mind Genomics study taking less than one hour to set up with the Idea Coach, about one-to-three hours to ‘field’ with a paid panel of survey takers, and about 30 minutes for complete analysis, the potential is here to systematize the array of problems and arrive at prospective solutions that can be tested in the subsequent iterations of the Mind Genomics process, perhaps a day later.
Table 5: AI driven suggestions for new or innovative products, services, experiences or policies, based upon the analysis of the strong performing elements in a Mind Genomics study.
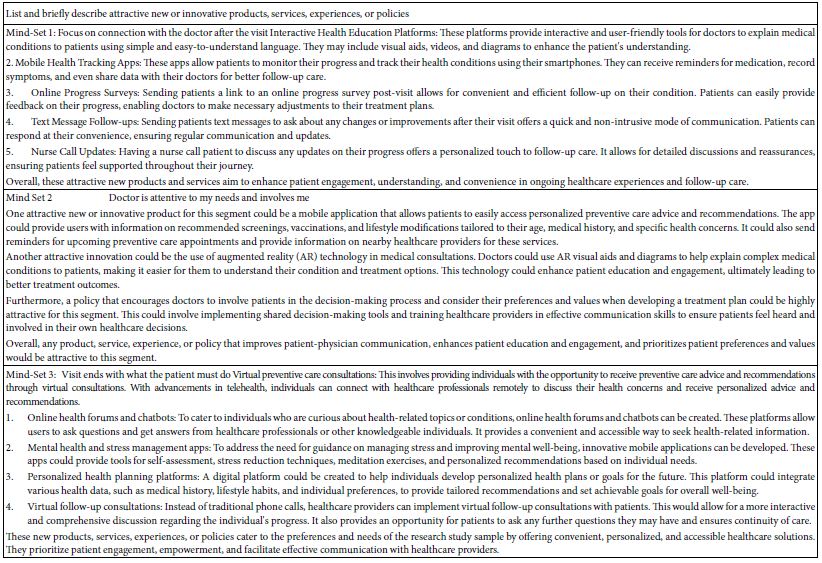
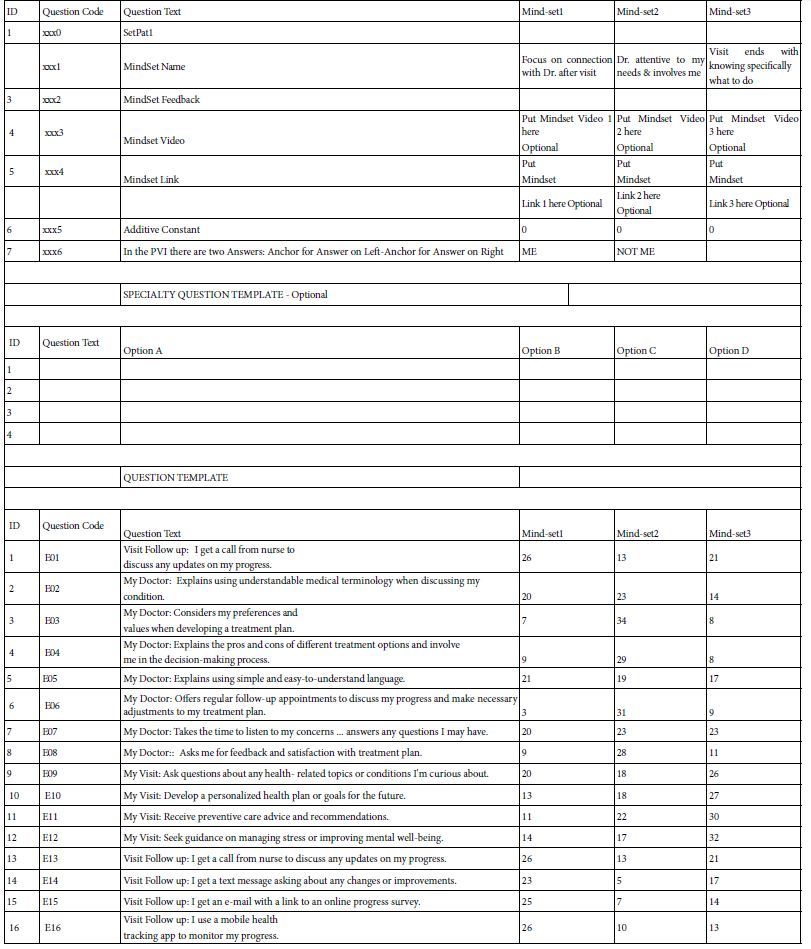
Table 6: The form used to create the PVI (personal viewpoint identifier). The format is a drag-and-drop powered by Microsoft Excel®.
The PVI (Personal Viewpoint Identifier): Understanding New People through a Short Interview
The final topic of this paper is the creation of a tool to assign people to one of the three mind-sets. The notion of mind-set as a way of looking at the world is clear. What has become increasingly obvious is that people differ from each other in the style that they find most comfortable, whether the situation is buying food, interacting with friends, or even dealing with medical professionals during a visit. The differences are not in the substance of what is discussed, but rather the general style, the types of words, the types of feelings that are conveyed during the interaction. In the world of commerce this is known as the nature of the interaction such as the interaction between a sales prospect and a salesperson [20]. The knowledgeable salesperson adjusts the language and behavior to what is deemed most likely to make the sales prospect be interested in listening and perhaps even buying. In the medical world this sensitivity to how a patient likes to interact with the medical professional is also important. Often in part it is referred to as the doctor’s ‘bedside manner.’
The next question to apply this knowledge is to recognize how a person wants to be treated in the meeting with the medical professional, e.g., in the doctor’s office, in the hospital, even on the phone with telehealth. Is there a way to discover the person’s desired ‘style of interaction’ in a rushed, crowded environment, with say a new and inexperienced, young medical professional, perhaps doing a rotation in a foreign country? In other words, can the Mind Genomics results be incorporated into an easy-to-use tool, administered in less than a minute, to tell the medical professional the type of interaction that the person might find to be most comfortable. The questions are simply those asked by any consumer researcher, on the web. The analysis of the answers puts the individual into one of the three groups, with the new benefit that the medical professional has a sense of how to interact with the patient because of some new, codified knowledge [21].
During the past three years a great deal of effort has gone into creating a system which allows a person to develop a typing tool, based upon the summary data from the study, data which parallels the numerical results of Table 3, along with the option to provide feedback and recommendations to the user of the tool, and the ability to show a video, as well as obtain additional information from up to four new questions. Table 5 shows the input structure for the PVI, in three sections; names/feedback/rating questions, additional questions to be answered (chosen by the researcher), and the summary data from the three mind-sets used to create the PVI. In turn, Figure 6 shows the PVI as the respondent see it. The left panel shows database questions about the respondent. The right panel shows the six questions. The output ends up being information to the clinician about the style that the respondent finds best, viz., the style preferred by one of the three mind-sets. Thus, the clinician understands the mental ‘WHO’ in terms of what is relevant at the level of interpersonal behavior, perhaps allowing the clinician to fine tune the interaction to make it smoother [22-26].
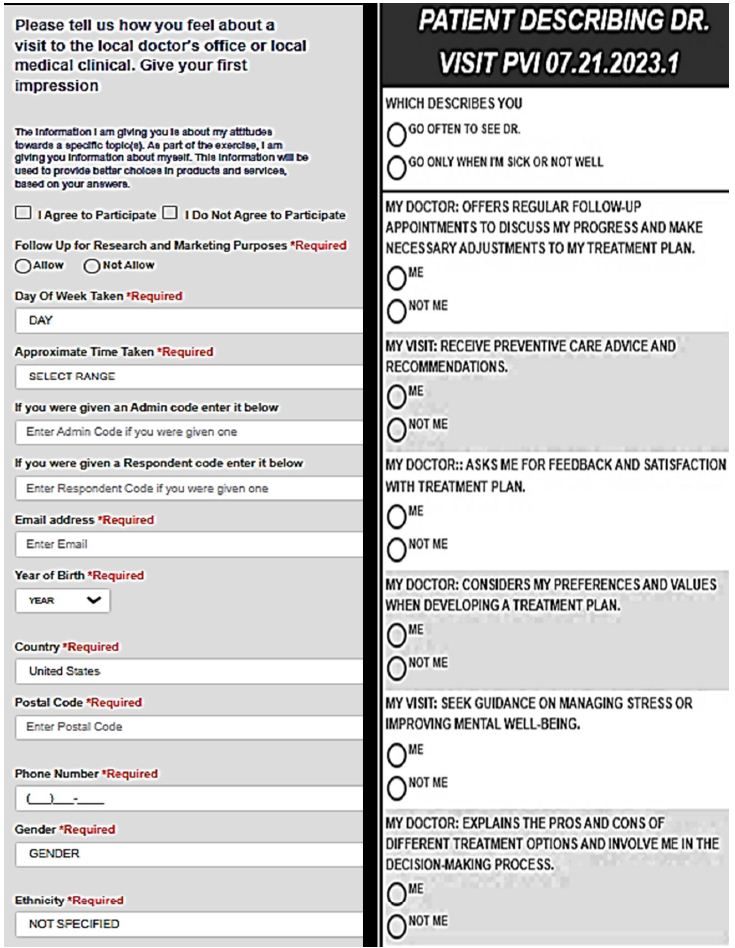
Figure 6: The PVI (personal viewpoint identifier), as shown to the respondent who completed the questionnaire. The results are immediately databased, and returned to the clinician and, when desired, to the patient.
Discussion and Conclusions
As the medical system continues to ‘break down’, at least in the minds of many medical professions as well as the rank-and-file individuals who are the patients, opportunities exist to improve the system, even without improvement in clinical aspects. The improvements presented in this paper are simple to discover with the Mind Genomics technology and with Idea Coach. The decisions about which improvements are most promising emerge from treating the effort as a conventional market research study. The output of the effort ends up being suggestions for behavior from the Idea Coach, and initial suggestions of promise from work with consumer survey-takers, the respondents in the study. These individuals can be stratified by who the people are (viz. geo-demographics), what the people do, what the people believe. The Mind Genomics technology through the BimiLeap platform works with those divisions of people but adds to those divisions the ability to identify new-to-the-world groups of individuals, not based on general behaviors, but rather base on their responses to granular level descriptions of the situation. It is the compilation of such data which promise the ability to know what to do, at least at the level of person-to-person interaction to create a better medical experience, here specifically a better visit to the doctor.
References
- Anderson R, Barbara A, Feldman S (2007) What patients want: a content analysis of key qualities that influence patient satisfaction. Journal of Medical Practice Management 22: 255-261. [crossref]
- Barsky AJ (1981) Hidden reasons some patients visit Annals of Internal Medicine 94: 492-498.
- Berry DC, Gillie T, Banbury S (1995) What do patients want to know: an empirical approach to explanation generation and validation. Expert Systems with Applications 8: 419-428.
- Topol E (2015) The Patient Will See You Now: The Future of Medicine Is In Your Basic Books.
- Siegrist Jr RB (2013) Patient satisfaction: history, myths, and misperceptions. AMA Journal of Ethics 15: 982-987. [crossref]
- Sia B (2016) Physician burnout: a global Lancet 388: 2272-2281. [crossref]
- Anderson NH (1976) How functional measurement can yield validated interval scales of mental quantities. Journal of Applied Psychology 61: 677-692.
- Green PE, Krieger AM, Wind Y (2004) Thirty years of conjoint analysis: Reflections and prospects. Springer US 117-139.
- Moskowitz HR, Gofman A (2007) Selling Blue Elephants: How to Make Great Products That People Want Before They Even Know They Want Them. Pearson Education.
- Davidov S, al Humaidan M, Gere A, Cooper T, Moskowitz H (2021) Sequencing the ‘Dairy Mind’ using Mind Genomics to create an “MRI of Consumer Decisions”. New Advances in the Dairy Industry. Intech Open.
- Losavio J, Gollub E (2022) Application of mindsets to Health education and behavior change. Programs. Health 14: 407-417.
- Epstein RM (2006) communication research matter: what do patients notice, what do patients want, and what do patients need? Patient Education and Counseling 60: 272-278.
- Newgard CD, Fu R, Heilman J, Tanski M, Ma OJ, et al. (2017) Using Press Ganey provider feedback to improve patient satisfaction: a pilot randomized controlled trial. Academic Emergency Medicine 24: 1051-1059.
- Kahneman D, Frederick S (2007) Frames and brains: Elicitation and control of response tendencies. Trends in Cognitive Sciences 11: 45-46. [crossref]
- Masege D (2022) Managed Healthcare: Ethical implications on the doctor-patient relationship (Doctoral dissertation, School of Clinical Medicine, University of the Witwatersrand, Johannesburg)
- Gofman A, Moskowitz H (2010A) Isomorphic permuted experimental designs and their application in conjoint analysis. Journal of Sensory Studies 25: 127-145.
- Stevens SS (1975) Psychophysics: An Introduction to its Perceptual, Neural and Social Prospects, New York, John Wiley.
- Moskowitz HR, Kluter RA, Westerling J, Jacobs HL (1974) Sugar sweetness and pleasantness: Evidence for different psychological laws. Science 184: 583-585.
- Likas A, Vlassis N, Verbeek JJ (2003) The global k-means clustering Pattern Recognition 36: 451-461.
- Moon Y (2002) Personalization and personality: Some effects of customizing message style based on consumer personality. Journal of Consumer Psychology 12: 313-326.
- Gabay G, Moskowitz HR (2019) Are we there yet? Mind-Gynomics and data-driven personalized health plans. In: The Cross-Disciplinary Perspectives of Management: Challenges and Opportunities. 7-28.
- Gofman A, Moskowitz H (2010B) Improving customers’ targeting with short intervention testing. International Journal of Innovation Management 14: 435-448.
- Williams S, Weinman J, Dale J, Newman S (1995) Patient expectations: what do primary care patients want from the GP and how far does meeting expectations affect patient satisfaction? Family Practice 12: 193-201.
- Berry DC, Mikhas IC, Gillie T, Forster M (1997) What do patients want to know about their medicines, and what do doctors want to tell them?: A comparative study. Psychology and Health 12: 467-480.
- Kolasa KM (2005) Strategies to enhance effectiveness of individual based nutrition communications. European Journal of Clinical Nutrition 59:S24-S30. [crossref]
- Kreuter M, Farrell D, Olevitch L, Brennan L (2000) Tailoring Health Messages: Customizing Communication with Computer Technology. Mahwah, NJ: Lawrence Erlbaum Associates.