Abstract
One hundred low-income respondents in New York City each evaluated 24 unique vignettes, combinations of 2-4 elements (messages). The vignettes were created according to a permuted experimental design, with each respondent evaluating full set of vignettes, allowing regression analysis to reveal the motivating power of each element, and k-means clustering to divide the 100 respondents into different groups, mind-sets, based upon the specific group of elements that were most motivating. The three emergent mind-sets were: MS1=Work on self and health; MS2=Set goals and structured reporting; MS3=Get family involved to focus on eating habits. To assign new individuals to a mind-set, the paper shows the construction and use of a PVI (personal viewpoint identifier) typing tool. The paper finishes with the use of artificial intelligence (AI) for three automated post-study applications; identify recurrent-themes in the data, suggest new areas of knowledge to pursue, and suggest new products and services for each mind-set.
Introduction
The world of 2023 is experiencing a rapidly growing epidemic, that of obesity, with innumerable consequences, diabetes the main source of worry, but many other diseases following behind [1,2]. One need not go through the litany of diseases, nor look for causes. There are many causes, a great number having to do with lifestyle alone with genetic proclivity [3,4]. The world of energy saving devices has made physical exercise into something often pursued specifically by regimented exercise, either alone, in a gym or with a personal trainer. To further complicate matters, the foods eaten are often simply not as healthy as they could be, perhaps because our lifestyle allows us to snack more than we should, on food, which is more delicious, but not healthful.
The literature is vast. One can find causes, report incidence of disease, create registries, attempt modifications. Much of the knowledge of what to do comes from the medical and the nutrition professionals. What happens, however, when we move from professionals to young people who explore obesity and the complex it comprehends. What more or what in general can we learn when we empower a young person to do the research, a person who is not yet jaded and hammered into conformity? What types of insights do we obtain? The Mind Genomics approach is a continuation of a stream of work using young minds to explore topics. What is presented here has already been used a number of times by elementary and middle school students, with significant new learning emerging from the process [5].
The approach of this paper is based on Mind Genomics, an emerging science of the ‘everyday’. The goal of Mind Genomics is to find out how people think about different aspects of ordinary life. The Mind Genomics studies works by presenting respondents with combinations of elements (messages about a topic), instructing the respondent to rate the combination, and deconstruct the ratings into the contributions of the different messages. The objective is to let the respondent evaluate almost realistic combinations of messages, a system which cannot be gamed, and which quickly reveals how the respondent thinks about the different aspects of a situation. Mind Genomics has a long history, beginning with conjoint measurement [6], moving to functional measurement [7] and finally to the form presented here [8,9]. Mind Genomics has already been used in many settings, ranging from marketing to social issues to health issues, to the law and beyond [10-14].
Part 1 – Searching for Questions, Answers, and Insights at the Initial Stage of Setting Up the Study
The Mind Genomics process is templated, with the website guiding the researcher through the different steps. The website itself is at www.BimiLeap.com. The first objective is to create the raw materials. This effort occurs only after the researcher creates the framework for the study, gives the study a name, selects the language for the prompts to the researcher, and finally agrees agree not to collect personal information unless knowingly provided by the respondent (viz. the survey-taker).
It is now time to create the raw materials. The raw materials for Mind Genomics are questions which tell a story, and then answers to those questions. The template for today’s Mind Genomics studies comprises four questions created by the researcher, and then four answers to each question. The questions will never be shown to the respondent, but the answers will be shown in combinations called vignettes.
When confronted with the Mind Genomics process, many researchers freeze, becoming nervous at the prospect of asking four questions which tell a story. Once the questions are asked, it becomes reasonably simple to provide answers. Despite the ability to provide answers, the nervousness of the researcher ends up being a major stumbling block hindering the adoption of Mind Genomics. The reality is that people are simply not educated in a way which encourages them to create questions and answers in the form of a narrative that can be used by researchers.
The idea Coach was invented in 2022 to circumvent the problem of the ‘stymied researcher’ the researcher who simply experiences too much fear and cannot move through that fear to produce the requisite questions and answers. Often after a few attempts the researcher become comfortable with the process of one question → multiple answers. The Idea Coach was created to help the novice advance to that stage.
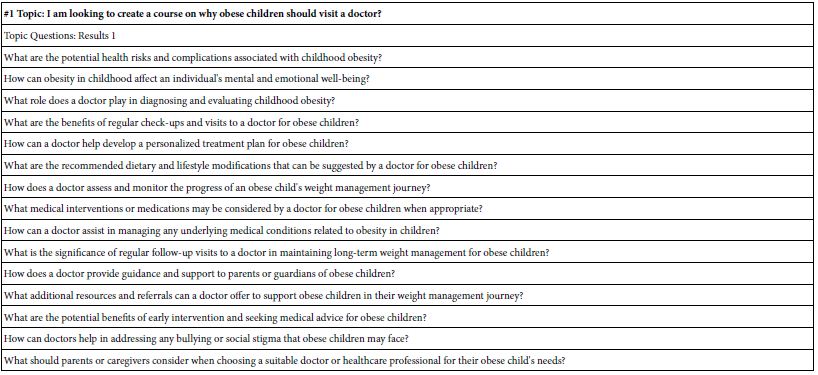
Figure 1 shows the screens from the study template requesting the four questions (A), the Idea Coach selected by the researcher (B), the computer screen showing the first few of the of 15 questions emerging from one request from the Idea Coach program within BimiLeap (C), and finally the four questions dropped into the template. The researcher can edit the questions to make it simpler for the Idea Coach. Table 1 shows the full text of each of the 15 questions generated by AI through Idea Coach.
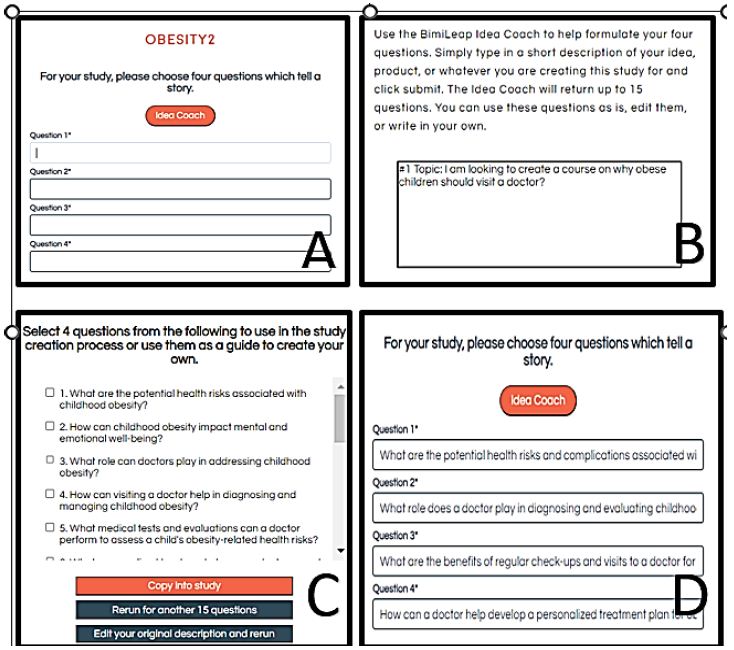
Figure 1: The request for four questions, the Mind Genomics Idea Coach, and the four questions which emerge
Table 1: The 15 questions generated by Idea Coach in its first pass. The 15 questions were generated in response to the paragraph written for Idea Coach in Figure 1, Panel B.
The Mind Genomics process continues with the creation of answers to each question, again by the AI-driven Idea Coach. Each iteration returns with 15 answers to a question, with an estimate of 15-30 seconds for the 15 answers to emerge. The answers are presented to the researcher, who can choose either to incorporate the answers into the template, or to request a re-run.
Note also that after the questions and answers have been presented to the respondent by Idea Coach, the BimiLeap program returns with the ‘Idea Book’, containing one page for each request for 15 questions, and one page for each request for 15 answers. Below the record of the questions and answers, the Idea Coach inserts the analysis by AI of additional understanding that the research can learn from those 15 questions or answers, the analysis done by having AI use a set of queries to summarize the questions or answers. Appendix 1 shows an example of this AI summarization and expansion of the information for the questions. The same work is done on each page, viz., for each request for questions, and for each request for answers.
Appendix 1 shows the set of questions returned by Idea Coach.
Appendix 2 shows the four sets of different answers
Figure 2 shows screenshots of the process, proceeding from the template with no answers to the question (Panel A), the Idea Coach Request (Panel B), the partial output of Idea Coach for that first iteration (Panel C), and the four final answers selected (Panel D). Although the researchers ran only one iteration and obtained the answers, as well as editing them before finalizing the answers, Idea Coach makes it easily to do iteration after iteration, enabling the researcher once again to have an AI-driven tutor become essentially ‘Socrates as a service.’
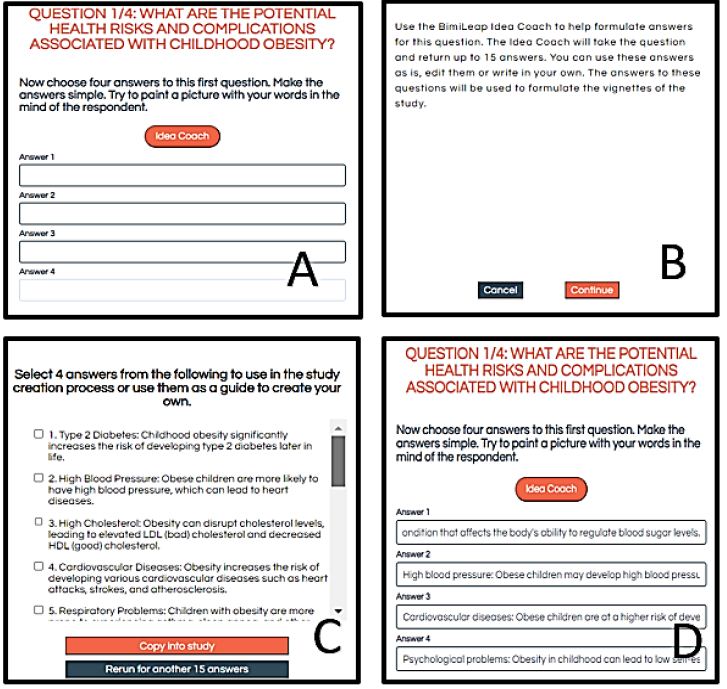
Figure 2: The template showing the request for four answers to the first question (Panel A), the Idea Coach which is either selected to skipped (Panel B), a set of prospective answers to question 1 returned by the Idea Coach (Panel C), and the four selected answers ‘dropped into’ the template.
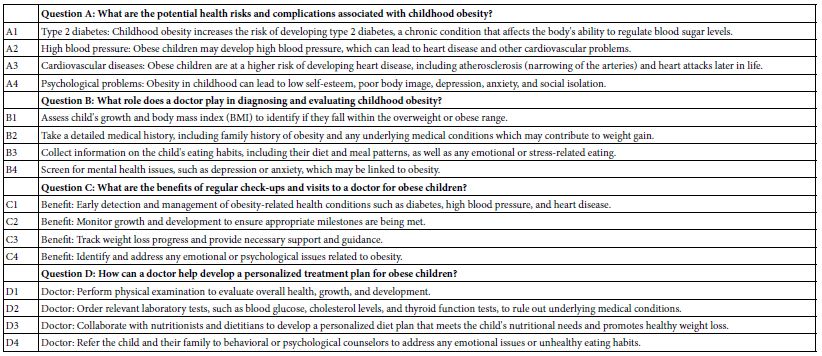
It is important to keep in mind that this first step with Idea Coach becomes a teaching tool, viz., almost a Socratic tool. The researcher need not create the questions or the answers. The AI embedded in the BimiLeap program ends up providing questions and answers, each of which can be edited by the researcher. Table 2 presents the four questions and the four answers. Note that the answers have been edited for clarity by the researchers. The Mind Genomics template enables the researcher to edit or even entirely replace any question or answer that has been written by the researcher or by Idea Coach.
With the introduction of AI into the BimiLeap program in the form of Idea Coach, the AI has been given a new task, summarizing the different questions created in a single pass, or summarizing the 15 answers created in one pass to answer one question. Appendix 1 shows the AI summarization and expansion/interpretation of the 15 suggested questions for the first pass through Idea Coach, where the effort was to create four questions. (Note, the material returns in a separate book called the Idea Book. A researcher can run the effort many times, with each run creating a separate page of analysis and interpretation for the 15 questions generated by that pass.)
Running the Mind Genomics Study
Figure 3 (Panel A) shows one of eight possible self-profiling questions chosen by the researcher. For each question the researcher may provide up to eight different answers but must have at least two. The respondent selects the most appropriate answer to each question. Not shown here are the questions of gender and age.
Figure 3 (Panel B) shows the very brief orientation screen shown to the respondent at the start of the study. The rationale for having a very short introduction, virtually a single sentence, is the desire to have the individual elements or messages generate the differences in the response. Where a specific frame of mind is desired, one with deeper knowledge of the topic, such as the background of a law or medical case, the orientation page can extend to half a page or more.
Figure 3 (Panel C) shows the rating question and the scale points. The scale is set up to be 5, 7 or 9 points. The researcher selects the anchors. The researcher is required to anchor the top and bottom of the scale but has the option to provide anchors for the other scale points.
Figure 3 (Panel D) shows the open-ended question, allowing the respondent to add additional reactions.
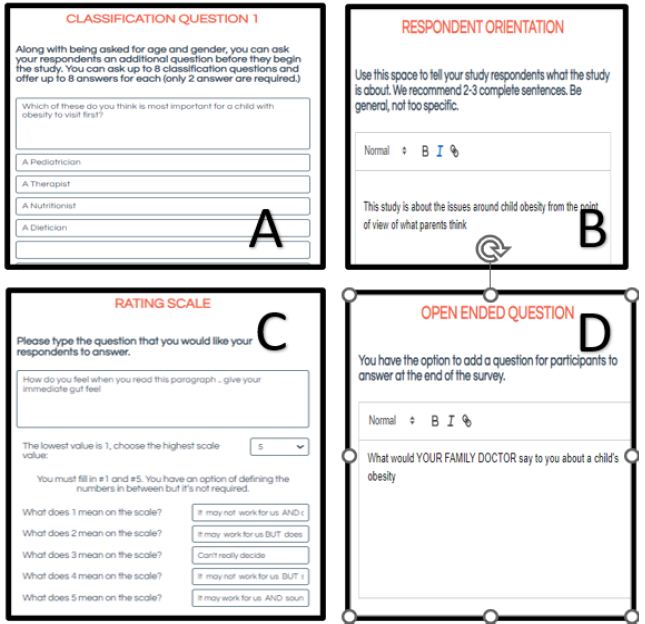
Figure 3: Additional study set-up screens. Panel A: Example of a self-profiling classification question. Panel B: Respondent orientation. Panel C: The rating scale and anchors. Panel D: Open-ended question.
Figure 4 shows two final screens in the set-up. Figure 4, Panel A shows the researcher’s final thoughts and key words. Mind Genomics studies are easy and quick to set-up. It is important to capture the thinking underlying the specific study, especially since a project might involve as many as 5-10 parallel studies, run at the same time, with different aspects covered by the various studies. It is always a good idea to record the momentary thinking underlying the specific study. The key words are also requested, with a minimum of one word required. The key words allow for database searches.
Figure 4, Panel B shows the request for panel sourcing. The researcher can choose from different sources, giving the researcher flexibility. When the researcher opts for the default provider, to provide the respondents, the researcher is led to the API for Luc.id Inc., a panel aggregator, and from there to the selection of respondents according to specific criteria. When the researcher wants to work with other panel providers or even source the respondents from a pool of specific individuals, the researcher chooses another option. The objective is to make respondent selection easier, driving the researcher to options which will greatly increase the likelihood of a successfully completed study, with the desired number of appropriate respondents.
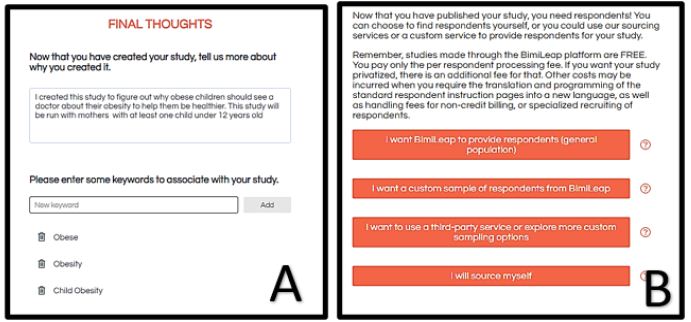
Figure 4: Final thoughts (Panel A), and sourcing the respondents (Panel B)
The Respondent Experience
Once the study has been set up, and the financial aspects agreed upon (viz., platform charge and panelist recruitment fees) the respondents are invited to participate, usually by email. The respondents who agree to participate are led to the website which introduces the study through the short orientation (Figure 3, Panel B), and then proceed to the self-profiling classification (Figure 5). The self-profiling classification is presented as a pull-down menu, uncluttered and easy to complete.
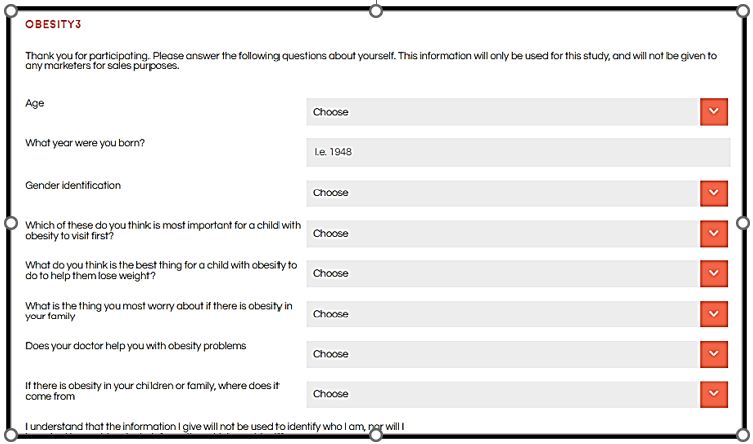
Figure 5: The screen showing the self-profiling classification for the study
The final steps are the presentation of the test vignettes (Figure 6), and the open-ended question (Figure 7). The test vignettes appear to be random combinations of elements, viz., answers to the question. Figure 6 shows a test vignette comprising the rating scale at the top, and the vignette in the middle. The respondent evaluates 24 unique vignettes, some having two elements, some having three elements, some having four elements. To the untutored eye, the 24 vignettes appear as a hodge-podge, a collection of screens comprising seemingly random mixtures of elements. The elements are the answers in Table 2. The questions never appear, and indeed their sole reason for being is that they motivate the different answers. The questions are not relevant for the respondents, whereas the answers are. Most respondents confronted with this seeming randomness end up looking at the combination on the screen and assigning a rating. Exit interviews with respondents, and especially with academics, end up with the same observation, viz., that everything seemed so ‘random’. Many respondents confess that they attempted to assign the ‘appropriate rating’ to the vignette, but had a hard time, and so they felt they just ‘guessed.’ This state of ‘indifference’, of lack of involvement, allows the respondent to answer honestly. The actual structure of the vignettes are anything but random. The basic design, a main effects experimental design, creates 24 combinations, the aforementioned vignettes. Each vignette has a minimum of two elements (answers in the terminology of Table 2), and a maximum of four elements. The experimental design ensures that each vignette has at most one element or answer from each question, but in those with three elements one question does not contribute an element, and in those with two elements two questions do not contribute elements. The underlying experimental design, known informally as a 4×4, ensures that the elements will appear five times in 24 vignettes, and be absent from 19 vignettes. Furthermore, the design ensures that the 16 elements will be statistically independent of each other, allowing for the analysis of the data by regression modeling, either at the group level or at the individual respondent level. Finally, the underlying experimental design is only a template. The design stays constant, but the elements can be permuted so that the elements are still associated with questions, but the combinations change. This strategy is called permuting the experimental design and ensures that the combinations or vignettes cover a lot of the possible combinations. At the level of science, this permutation means that the researcher does not have to limit the focus to pre-specified combinations that are thought to be most promising. Rather, he permuted design enables the researcher to quickly explore a large number of combinations of elements, and, at after-the-fact develop a detailed picture of the different elements. A good analogy is what the MRI ends up doing, taking pictures of the same tissue from different angles, and then combining these pictures after the fact [15]. When the respondent finishes reading the vignette the respondent simply presses the appropriate key on the computer or smartphone, the rating is registered along with the response time. The response time is defined as the number of thousandths of a second between the appearance of the vignette on the screen and the rating assigned by the respondent. After the respondent has assigned the rating the BimiLeap program automatically advances to assemble the next vignette at the local site viz., at the respondent’s computer or smartphone. Over a period of 20+ years the Internet-based surveys or experiments have gotten shorter. When the efforts were first launched in a major way around 1999, it was fairly easy and inexpensive to obtain respondents. The Internet was fairly new, respondents were interested in participating and the attention span seemed to be much longer. It was not unusual to be able to get hundreds of respondents for a study, and for the web-based interaction with the respondent to last 15-20 minutes. Today, however, people are time-starved, and have substantially shorter attention spans. The 4×4 experimental designs used here require about 3-4 minutes on the internet. Even with that short time, it is vital to work with a panel provider, unless one has a captive audience. The panel providers have access to millions of respondents. It becomes cost effective and time saving to work with these providers, an effort which ends up virtually guaranteeing that the study will be completed, often in an hour or sooner.
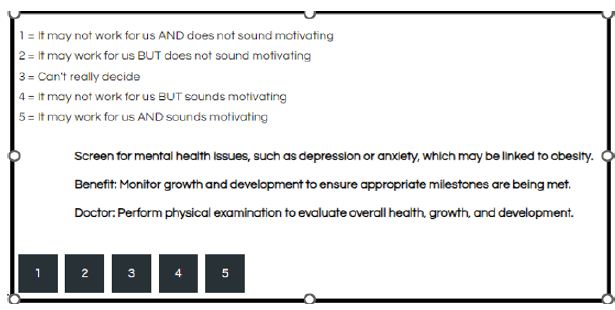
Figure 6: Example of a vignette
Table 2: The four questions and the four answers to each question provided by the Idea Coach, viz., AI embedded in the BimiLeap program.
The Mind Genomics Study about Low-income Parent’s Response to What Do for an Obese Child
This study was run by the senior author (BK) following his interest in nutrition education. The focus of the study was on what are the aspects, concerns, and messages regarding a low-income parent thinking about a child who is obese. The study was created on the BimiLeap platform, and sent for participation to parents in New York City, with self-declared income less than $45,000, and with self-declared parent of at least one child under 12 years old.
The study required about 30 minutes to set up with the assistance of the Idea Coach. The study was run by Luc.id, a panel provider, on July 13, 2021. Table 3 presents the set-up information taken from the set-up screens.
Analyzing the Data by Transforming the Ratings, and Using OLS (Ordinary Least-squares) Regression
The study comprised the responses of 100 individuals, each of whom evaluated 24 unique vignettes. Across all of the 2400 vignettes the vast majority of the vignettes were unique. This uniqueness means that the ordinary analyses of averaging ratings for a common stimulus won’t work, since the stimuli tested by the respondents are vignettes. What is important, however, is the response to the individual elements, the phrases which give the message. There were only 16 elements, each element appearing five times in 24 vignettes, so each element appearing 500 times the full set of 2400 vignettes.
The analysis first transforms the ratings. The rationale for transforming the ratings comes from the reality that most users of data do not know what to do with the actual ratings. For example, what does a 4.5 mean on a five-point scale? The scientists who do the research have a difficult time explaining the meaning of the intermediate scale point. This difficulty is glossed over because the research conclusions end up with ‘statistically speaking, these two ‘items’ are same, different, lower, higher.’ The pervasive use of inferential statistics, of same vs different, higher vs lower, ends up making the rating value a simple way by which to compare two or more groups on these simple ‘same/different/lower/higher’ categories of reporting. The reality of the scientific project is to find effects, find differences, using the rating as key indicator, with the discussion moving away from the focus on the rating value and on to the hypothesis.
The objective of Mind Genomics is to measure the mind or at least to put numbers onto messages so that one can create a metric of thoughts, of attitudes. The use of responses to vignettes is a good way to do that but the analysis has to extract the important information. That information must be a number, comparable across studies, amenable to being databases, to being used as a key performance indicator (KPI). To create these KPI-level numbers requires a few simple steps, which end up creating an easy-to-master system.
Step 1: Transform the Ratings to a Binary Scale
Most managers who use the data focus on simple numbers by which they understand and by which they take action. It is easy to communicate the percent of respondents saying yes vs percent saying no. To achieve this binary scale, the Mind Genomics convention is to pick some point on the scale which divides the Top from the Bottom. For the five-point scale, this cut-point is 4. Ratings of 5 and 4 are transformed into 100, ratings 1,2 and 3 are transformed into 0. To the newly created transformed variable is added a vanishingly small random number (<10-5). The rationale for the random number is that in the case that all of the ratings assigned by a respondent were either 1-3 or 4-5, there would be some randomness, preventing the regression from crashing.
The transformation is really a mapping of the anchored rating scale to a binary scale. For our analysis in this paper the ratings 5 and 4 have in common that the vignette is ‘motivating’ whereas the ratings 1, 2, and 3 have in common that the message is not ‘motivating’. The messages may not be demotivating, but rather simply are not motivating.
Finally, to finish the discussion of mapping, one could also create another binary variable ‘Work For Us’. This variable would take on the value 100 for ratings of 5 and 2, and then take on the value of 0 for ratings of 4, 3, and 1. This paper does not deal with the variable ‘Work For Us’, although everything that has been done for ‘Motivating’ can be done for ‘Work For Us’.
Step 2: Estimate the Parameters of the Equation Relating the Presence/Absence of the 16 Elements to the Dependent Variable
The equation is expressed as: DV (dependent variable)=k1(A1) + k2(A2)…k16(D4)
The equation has no additive constant. This is deliberate in order to make all coefficients comparable, both within an individual, across individuals within a single study, and across studies with different sets of elements.
The underlying experimental design ensures that each group of respondents will generate data that can be subject to OLS regression, ranging from data generated by all respondents together (Total Panel) and down to definable subset (e.g., based upon the answers of the respondent in the self-profiling classification), and down to the level of the individual.
The coefficients for the total panel are shown in screen shot in Figure 7. These are ‘flash results’ appearing on the researcher’s screen. The BimiLeap program updates the data every minute or so, providing a report of the coefficients for each defined group. The numbers are the coefficients of the model, shown for the Total Panel. We interpret the coefficient as the percent of responses achieving the rating 5 or 4 (viz., motivates) when the element is inserted into the vignette. Most of the coefficients are positive. Statistically ‘significant’ coefficients have values around 15-16.
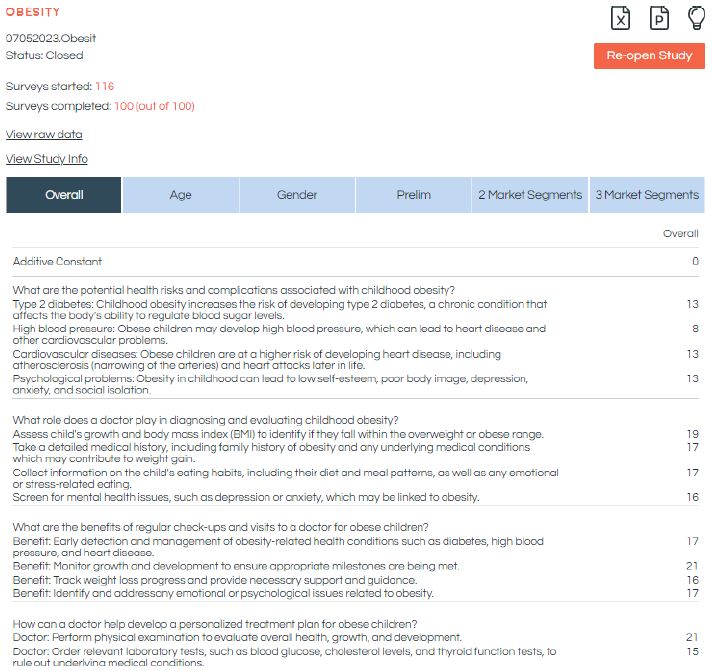
Figure 7: Screen shot of the visual report of the data. The visual report is updated when the researcher refreshes the screen. The screen shows the number of respondents who started the study, the number who completed, the elements and the coefficients estimated for the Total Panel.
Step 3: Create the Models for the Total Panel and for the Self-defined Groups
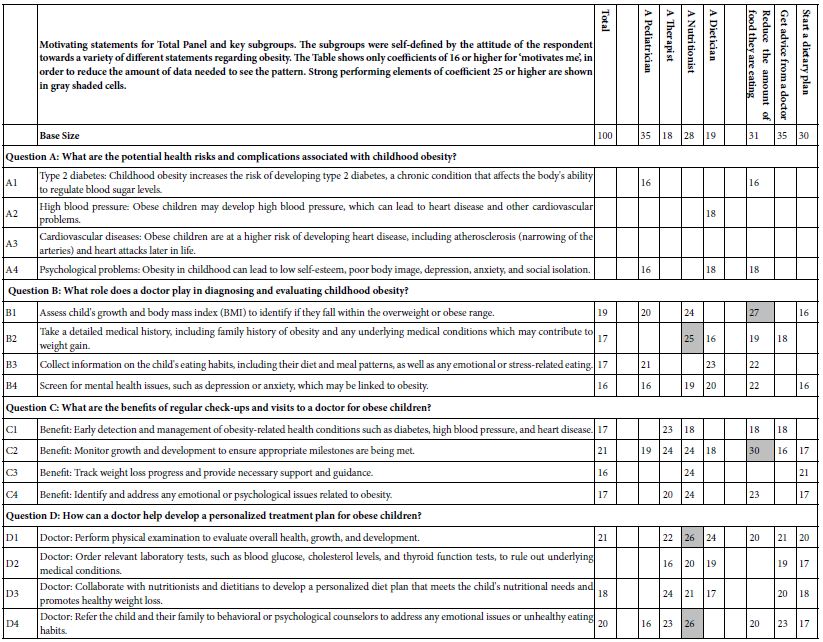
Once the data have been incorporated into the database, the OLS regression rapidly reveals the strong performing as well as the weak performing elements. Table 3 shows coefficients for the 16 elements for key self-defined subgroups. Only those subgroups with 10 or more respondents are shown. Fewer than 10 respondents generate readable data, but the base size makes the coefficients less robust.
Table 3 shows many blank cells. These correspond to coefficients which do not reach the cutoff point of 16 or higher. The coefficient value of 16 approaches statistical significance in terms of a t-test of coefficients. The strong performing elements are operationally defined as having coefficients of 25 or higher. These strong performers are shown as shaded cells.
Table 3: Study summary, provided when the data report is issued at the end of the field work and analysis.
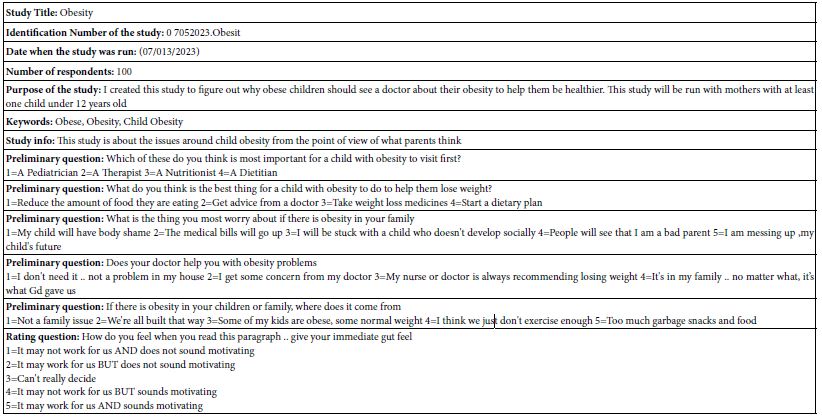
A cursory look at the performance of the elements in Table 3 suggests that there may be patterns among strong performing elements, but these patterns are hard to discern. The same finding occurs in study after the study. Simply looking at the respondents by WHO they are, what they say they THINK, and what they say they DO produces data, but interpretable patterns usually fail to not emerge. The reason for the pattern not emerging is that there are 16 elements, not one or two. With 16 elements, the patterns which emerge should tie together a reasonable number of elements. With one or two elements, the temptation is to create a plausible ‘hypothesis.’ With its abundance of elements, patterns will emerge readily when present, letting the researcher focus on data, not on hypotheses which fit sparse data.
Mind Sets
A key tenet of Mind Genomics is that at the granular level of behavior, the everyday, people differ from each other in the way they make choices, in the way they value the information they receive. Furthermore, these person-to-person variations exist as basic, explainable differences among people. It is the job of the Mind Genomics researcher to uncover these different groups, these mind-sets.
The way to uncover these basic mind-sets at the level of granular and everyday topics is by clustering together people who show similar patterns of coefficients. The patterns of coefficients for our study on obesity show what is important to various people. Mind Genomics enables the researcher to discover these mind-sets using empirical methods.
The actual mechanics for discovering mind-sets are simple. The researcher creates an individual level for each respondent, and then clusters the set of individual coefficients using one or another method for clustering. The method used here is k-means clustering [16]. The metric for ‘distance’ between people is the value (1-Pearson Correlation), with the Pearson Correlation computed across the 16 coefficients for two people. Each respondent ends up being assigned to one of the segments or mind-sets.
Segmentation is a heuristic, aiming to simplify data by putting the items (viz., respondents) into non-overlapping groups. Depending upon the specific algorithm for doing the clustering, the result may end up as few clusters versus many clusters, and as clusters which may be easy-to-interpret or hard-to-interpret. The researcher makes the judgment considering the criteria of interpretability (do the mind-sets or segments make intuitive sense), and parsimony (the fewer the number of segments or min-sets the better, as long as the mind-sets tell a coherent story).
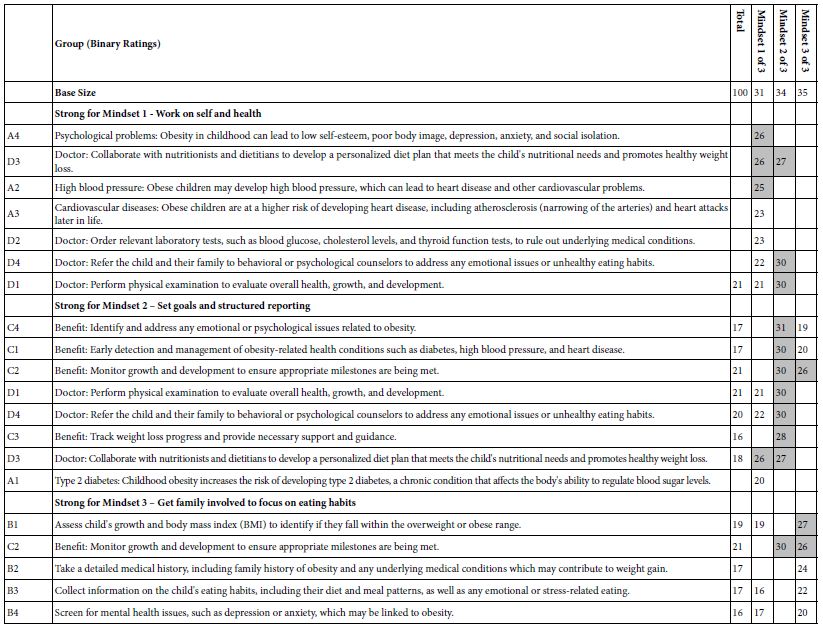
Table 4 shows the three mind-sets emerging from these data. The mind-sets all focus on obesity, medical interventions, and lifestyle interventions. What is important, however, is the fact that even with a fairly constrained topic such as obesity, there are clear and meaningful differences in the way people respond to the messaging. The nuanced differences among the groups emerge clearly, along with key messages for that group. In effect, the clustering provides a springboard for better thinking, better understanding, and hopefully improved communications.
Appendix 3 shows AI interpretation of the strong performing elements from Table 4. The opportunity to use AI to interpret the results becomes more important when the clustering reveals interpretable clusters. Once again the interpretability of these clusters, these mind-sets, come from the commonality of elements which motivate the different groups of respondents. It is the sheer simplicity of similar ideas, important for clustering, which also boosts the ability of AI to create meaningful interpretations, enhancing patterns which are already obvious from the similar ‘meanings’ of the strong elements.
Table 4: Performance of elements across different self-defined groups of respondents. Only elements of +16 or higher are shown.
Appendix 4 shows AI suggestions about new products and services for the three mind-sets. These suggestions also emerge from the AI summarization of each set of answers.
Moving Beyond Knowledge to Actionable Communication – The Personal Viewpoint Identifier (PVI)
The ‘project’ of Mind Genomics does not stop at the experiments and at the identification of relevant interpersonal messaging and actions. Rather, having been nurtured in the business environment from the pioneering efforts of Wharton Business School professors Paul Green and Yoram Wind [17], Mind Genomics carries in its DNA the opportunity for application. The specific application is a bank of knowledge about interpersonal communications in the world of professional and client. The objective is not to prescribe clinical specifics but rather to tailor the style of communication to that which is empirically most appropriate for the patient. The data in this granular level study of the general nature of what to say to parents of children regarding obesity is a good example. What are the types of words to which the three different mind-sets will attend? The topic of childhood obesity seems so well defined that it’s quite likely the health professional might not even realize that more success could be had by knowing how to frame one’s messages It is to the end of assigning a person to a mind-set for purposes of general understanding ‘how to communicate’ that we now turn. During the past several years, the notion of developing a personal viewpoint identifier has come to the fore for a variety of issues [18,19]. The rationale for the of a personal viewpoint identifier, or indeed, for any typing tool is that once the science is established, those who need to know what to communicate are given actionable suggestions. The experienced person might not need that PVI typing tool, but the inexperienced person does, the person with decades of trial and error which makes the person an expert. The objective of the PVI is to present an individual with a simple to complete questionnaire, shown by Figure 8. Panel 8A shows the consent form, and background material about the respondent. Panel 8B shows the six-question typing tool. Panel C shows the assignment of the respondent to one of the three mind-sets, as well as feedback for the three mind-sets. The researcher creates the titles for the mind-sets, and the messages. The underlying algorithm sorts create the assignment method. There are many available statistical methods to create typing tools, such as discriminant function analysis or CHAID. It will be the large set of these easy-to-create databases and typing tools that will allow a new vista to emerge. This opportunity with be deeper, quickly and easily obtained knowledge of specifics in style, in language, to help professionals understand those who seek their advice. In other words, a system to understand the way the patient wants to interact as a person with the medical professional. The approach is not to diagnose the patient, not to suggest anything other than revealing the most likely ‘best style’ of communication.
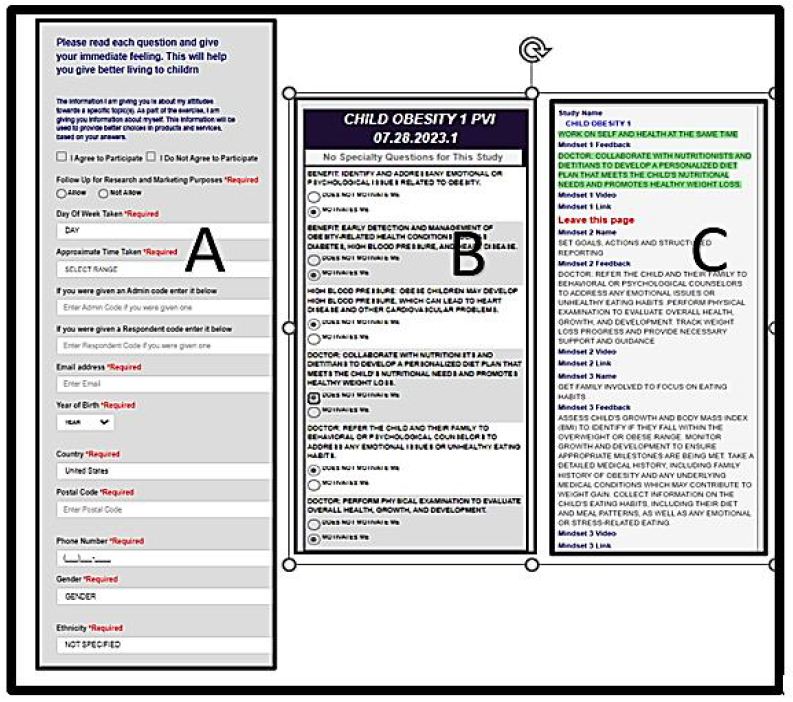
Figure 8: The PVI (personal viewpoint identifier) for the obesity topics covered in this study
Table 5: How the 16 elements perform among the Total Sample vs among three emergent mind-sets
Setting up the PVI is straightforward (see www.pvi360.com). The setup is formatted to accept Excel-type data, meaning that either the entries are entered by hand, or a complete excel matrix can be copied and pasted. Figure 9 shows the formatted sheet, which needs only be completed, with data easy to copy from the results file.
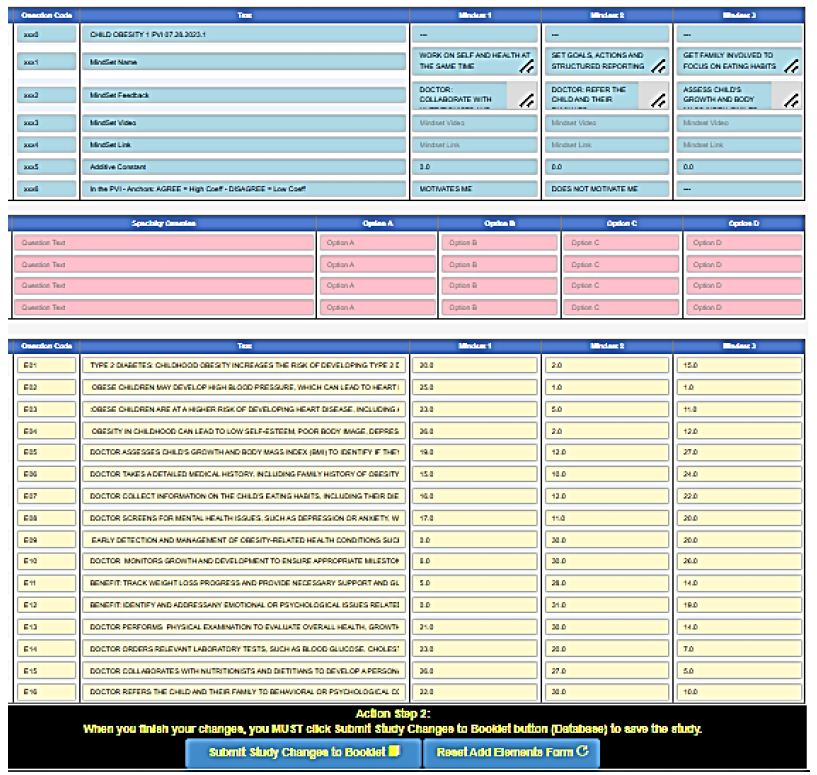
Figure 9: Set-up form for the PVI (personal viewpoint identifier), coded by colors to make the set up easy even for beginners.
Discussion and Conclusions
The foregoing study represents just one effort to generate deep knowledge about messaging to individuals regarding a health and wellness condition. The contribution of this paper is to present an approach which can generate large amounts of data about how people think, the data coming from different topics, or the same topic with different messages, or even the same topic with the same message across the world. The potential now exists for the industrial-level acceleration of curated primary information about how one should communicate with people, either within a topic area such as obesity, across different areas such as better living, and across different populations [20]. The challenge for today is straightforward. The challenge is to create this depth of knowledge on a daily basis, for all topics where people need to speak with those who are tasked with helping them on the arc of wellness and health to the point where they need intervention. Can these studies of effective language be automated around the world so that the precious, diminishing time of health professionals can be spent communicating in the best, most effective, kindest way possible, for every individual who shows up requesting health. It is that vision, of truly industrial-scale knowledge of the ‘how to effectively communicate’ which might well return a modicum of interpersonal intimacy, trust and communication effectiveness to a system thought by many to be slowly breaking down.
Acknowledgments
The author acknowledges the help provided by Yehoshua Deitel of Sifra Digital Inc., in Israel, both in the development of the Mind Genomics system and the Idea Book. The authors also acknowledge Professor Attila Gere of Hungarian University of Agriculture and Life Sciences and Mr. Robert Sherman of Robertsoft for their efforts in creating the PVI.
References
- Han JC, Lawlor DA, Kimm, SY (2010) Childhood obesity. The Lancet. [crossref]
- Lakshman R, Elks CE, Ong, KK (2012) Childhood obesity. Circulation. [crossref]
- McPherson AC, Hamilton J, Kingsnorth S, Knibbe, et al. (2017) Communicating with children and families about obesity and weight‐related topics: a scoping review of best practices. Obesity Reviews. [crossref]
- Mellor JM, Dolan CB, Rapoport RB (2011) Child body mass index, obesity, and proximity to fast food restaurants. International Journal of Pediatric Obesity. [crossref]
- Mendoza CL, Mendoza CI, Braun M, Deitel Y, Rappaport S (2023) Empowering Young Researchers: Searching for What to Say to Young People to Avoid Becoming Obese. Endocrinology, Diabetes and Metabolism Journal 7: 1-11.
- Luce RD and Tukey, JW (1964) Simultaneous conjoint measurement: A new type of fundamental measurement. Journal of Mathematical Psychology 1: 1-27.
- Anderson NH (1976) How functional measurement can yield validated interval scales of mental quantities. Journal of Applied Psychology 61: 677-692.
- Moskowitz HR (2012) ‘Mind genomics’: The experimental, inductive science of the ordinary, and its application to aspects of food and feeding. Physiology Behavior. [crossref]
- Moskowitz HR, Gofman, A, Beckley, et al. (2006) Founding a new science: Mind Genomics. Journal of Sensory Studies 21: 266-307.
- Gabay G, Moskowitz HR (2019) “Are We There Yet?” Mind-Genomics and data-driven personalized health plans. In: Cross-Disciplinary Perspectives of Management: Challenges and Opportunities, 7-28.
- Milutinovic V, Salom J (2016) Mind Genomics: A Guide to Data-Driven Marketing Strategy. Springer.
- Moskowitz HR, Wren J, Papajorgji P (2020) Mind Genomics and the Law. LAP LAMBERT Academic Publishing.
- Moskowitz HR, Gofman A (2007) Selling Blue Elephants: How to Make Great Products That People Want Before They Even Know They Want Them. Pearson Education.
- Porretta S, Gere A, Radványi D, Moskowitz H (2019) Mind Genomics (conjoint analysis): The new concept research in the analysis of consumer behaviour and choice. Trends in Food Science, Technology 84: 29-33.
- Gofman A, Moskowitz H (2010) Isomorphic permuted experimental designs and their application in conjoint analysis. Journal of Sensory Studies 25: 127-145.
- Likas A, Vlassis N and Verbeek JJ (2003) The global k-means clustering algorithm. Pattern Recognition 36: 451-461.
- Wind J, Rao VR, Green PE (1991) Behavioral methods. Handbook of Consumer Behavior, 507-532.
- Davidov S, al Humaidan, M, Gere A, Cooper, et al. (2021) Sequencing the ‘Dairy Mind ’using Mind Genomics to Create an “MRI of consumer decisions”. In: New Advances in the Dairy Industry. IntechOpen. DOI: 10.5772/intechopen.101422
- Zemel R, Choudhuri SG, Gere A, Upreti, H, Deite Y, et al. (2019) Mind, consumers, and dairy: Applying artificial intelligence, Mind Genomics, and predictive viewpoint typing. In Current Issues and Challenges in the Dairy Industrty. IntechOpen.
- Randle M, Okely, AD, Dolnicar S (2017) Communicating with parents of obese children: Which channels are most effective? Health Expectations.