Abstract
The method of water determination in glasses and melt inclusions with Raman spectroscopy is shown. Furthermore, it is demonstrated that by the linearity of the calibration curve in a concentration range from 50 ppm to nearly 50%, the practicability of the method can be significantly simplified.
Keywords
Raman spectroscopy, H2O and D2O determination, Reference samples, Calibration
Introduction
Water is the most essential magmatic and pegmatitic volatile. Exact knowledge about the amount of water during magmatic and pegmatitic crystallization processes is critical in understanding the behavior of volatiles in silicate melts. Therefore a simple method for determining total water is necessary. The technique must be simple, fast, and cover a large concentration range. Because most information about the water in magmatic-pegmatitic systems comes from melt inclusions, the method must also have a high spatial resolution and sensitivity.
The author used micro-Raman spectroscopy from the beginning (1998) for this challenge. The author published the first data produced between 1998 and 1999, together with Webster and Heinrich [1]. The most significant problem was the acquisition of reference glasses with testified and independently determined water concentrations. The demand for a simple Raman spectroscopic method was in the air [2]. However, they are standing in this time only at the beginning.
Reference Samples
The prerequisite for developing such a method is the availability of good standards. In the first step, the author used synthetic glasses (of albite, granitic, or pegmatitic composition) with water concentrations determined with the Karl-Fischer method. These glasses come from different authors quoted in Thomas [3]. Water concentrations higher than 12% in silicate glasses are unstable over time. Therefore the author used for higher concentrations water-rich melt inclusions in pegmatite quartz. To obtain the necessary homogenous glass, the melt inclusions must be homogenized under pressure and subsequently fast-cooled using rapid quenching methods (see Thomas et al. [4,5] and the Electronic supplementary material – ESM). Generally, homogeneous, water-rich melt inclusions (>25%) are metastable and disintegrate after the first measurement into a water-bearing stable glass and a water-rich volatile sub-phase. Then the bulk-water concentration results from the water in the partial volumes. We used pure glasses as references with very low water concentrations below the ppm level. Thomas [6] determined the water content of these glasses with the self-calibrating proton-proton (pp) scattering method [7].
Methodology
For the measurements, we used primarily a Dilor XY Laser Raman Triple 800 mm spectrometer equipped with Olympus optical microscope and long-distance 80x and 100x objectives. The spectra were collected with a Peltier-cooled CCD detector [8]. We used the 514 and 488 nm lines of a Coherent Ar+ Laser Model Innova 70-3 and a power of 150 mW for the sample excitation. We obtained effectively interference-free Raman spectra of tiny melt inclusions embedded in the transparent quartz matrix with the confocal technique. The integral intensity in the 3100-3750 cm-1 frequency range was used for all measurements. Starting in 2006, we used a LabRam HR800 UV-VIS spectrometer for all further measurements. This exchange gave no problems because we could, using well-studied reference samples, transform the calibration data for the new device. Furthermore, starting in 2006 [6,9], we used the so-called “Comparator Technique,” justified by the fact that the calibration curve is strongly linear and goes practically through the zero point. However, note here that the exact zero point is for the integral intensity not defined. With this work in 2006, we could also determine the water content in homogenized melt inclusions deep in the quartz matrix by extrapolation to a deep of zero because the integral intensity increases linearly with the decrease of the surface layer (for example, by polishing). Another way is the use of different deep inclusions with the same composition. If on both sides, the polished sample is not too thick (~200 µm) and the inclusion is not precisely between both surfaces, then can, from two measurements, the water content adequate be determined or estimated. In 2006 we also showed that integral intensity between 2250 and 2900 cm-1 for D2OT forms a linear relationship with the concentration and can be used to determine D2O beside the water. We have made such determination (H2O and D2O) for water-rich melt inclusions in the Shaw meteorite [10]. Regarding the rare appearance of fluorescence in the frequency range around 3500 cm-1, we have used the weaker band at about 1630 cm-1 (see McMillan) [11] to quantify water.
Results
The primary aim was to complete a general calibration curve for an extensive concentration range. Also, the simplicity of the method was always a request. That was only possible because the research on melt inclusion was an essential target over a long time. Forty-eight different glasses or melt inclusions were used for the calibration curve plot. Each point represents at least 10 determinations [8]. For simplification, the ± 1s standard deviation is not shown (however. can be seen in Thomas) [8] (Figure 1).
The proof of a general calibration curve was the prerequisite for applying the Raman spectroscopy in the simplified form of the “Comparator Technique.” That means only one certified reference sample is necessary to determine water in glasses and melt inclusions.
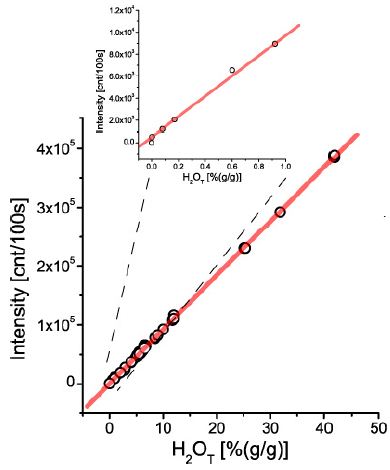
Figure 1: Generalized calibration curve for water in silicate glasses and melt inclusions in the concentrations range from about 50 ppm to nearly 50% – that is five orders of magnitude. The upper smaller diagram shows the concentration range from 50 ppm (determined with pp-scattering – see Reichard et al. (2004) and Thomas et al. (2008) to 1%.
Conclusions
The outlined Raman method for determining H2O and D2O can also be used in analogy for other components. Thomas (2002) [3] has shown that for boric acid [H3BO3] in fluid and melt inclusions and later also for sulfate [12], carbonate/hydrogen carbonate (see, e.g., Thomas et al. 2020) [13].
Acknowledgment
I thank many colleagues and coauthors who accompanied me for over 50 years in my research, mostly on melt inclusions. Furthermore, I think here first to Jim D. Webster (1955-2019), who was very interested in my work on melt inclusions in granites and pegmatites of the Variscan Erzgebirge. I am, above all, grateful to H. Behrens and F. Holtz (University of Hannover, Germany), Robert (Bob) Bodnar (Virginia Tech, Blacksburg), H.R. Westrich (Sandia National Laboratories, Albuquerque, New Mexico), and M. Leschik (University Clausthal, Germany) for providing glass standards with defined H2O and D2O concentrations. Bob Bodnar encouraged me at the ECROFI XV in 1999 to publish the first results on water determination very fast.
References
- Thomas R, Webster JD, Heinrich W (1999) Melt inclusions in pegmatite quartz: Complete miscibility between silicate melts and hydrous fluids. ECROFI Abstracts, Terra Nostra 99/6, 305-307.
- Chabiron A, Pfeiffert C, Pironon J, Cuney M (1999) Determination of water content in melt inclusions by Raman spectroscopy. ECROFI Abstracts, Terra Nostra 99/6, 68-69.
- Thomas R (2002) Determination of the H3BO3 concentration in fluid and melt inclusions in granite pegmatites by laser Raman microprobe spectroscopy. American Mineralogist 87: 56-68.
- Thomas R, Davidson P, Rhede D, Leh M (2009) The miarolitic pegmatites from the Königshain: a contribution to understanding the genesis of pegmatites. Comtrib. Mineral Petrol 157: 505-523.
- Thomas R, Davidson P (2016) Origin of miarolitic pegmatites in the Königshain granite/Lusatia. Lithos 260: 225-241.
- Thomas SM, Thomas R, Davidson P, Reichart P, Koch-Müller M, et al. (2008) Application of Raman spectroscopy to quantify trace water concentrations in glasses and garnets. American Mineralogist 93: 1550-1557.
- Reichart P, Datzmann G, Hauptner A, Hertenberger R, Wild C, et al. (2004) Three-dimensional hydrogen microscopy in diamond. Science 306: 1537-1540.
- Thomas R (2000) Determination of water contents of granite melt inclusions by confocal laser Raman microprobe spectroscopy. American Mineralogist 85: 868-872.
- Thomas R, Kamenetsky VS, Davidson P (2006) Laser Raman spectroscopic measurements of water in unexposed glass inclusions. American Mineralogist 91: 467-470.
- Thomas R, Davidson P (2019) Shaw meteorite: water-poor and water-rich melt inclusions in olivine and enstatite. Mineralogy and Petrology 113: 1-5.
- McMillan PF (1994) Water solubility and speciation models. In: Mineralogical Society of America. Reviews in Mineralogy 30: 131-156.
- Thomas R, Davidson P (2017) Hingganite-(Y) from a small aplite vein in granodiorite from Oppach, Lusatia Mts., E-Germany. Miner Petrol 111: 821-826.
- Thomas R, Davidson P, Rericha A (2020) Emerald from the Habachtal: new observations. Mineralogy and Petrology 114: 161-173.