Abstract
The study is part of a program set up to encourage young researchers (age < 18) to learn to think critically. The process shows the young researcher how to systematize aspects of daily life, create a database of specifics, and then explore the perception of these aspects by real people, using templated experimental designs and real ‘experiments’ on the web through a purpose-built application (www.BimiLeap.com). In this study respondents evaluated unique sets of 24 combinations (vignettes), each vignette presenting 2-4 statements which might have come from a ‘charge’ given to medical students and new doctors. Deconstruction of the response to these combinations at the level of individual respondents using regression analysis revealed which statements were perceived to be ‘important,’ which were perceived to be ‘memorable, which were both, etc. Cluster analysis of the individual coefficients from respondents revealed three mind-sets emerging, based upon the pattern of messages perceived to be important: MS1 – Dealing with the stress of the practice of medicine, MS2 – Dealing with difficult patients, MS3 – Aware of what is important to the patient.
Introduction
Empowering through Templated Experimental Design
This paper deals with the way a young researcher (Cledwin Mendoza) conceives of the way a medical school might inspire its students or give a ‘charge’ to a new doctor [1-4]. The topic of inspirational addresses given by senior professionals to newly-minted-professionals is of interest to middle school and high school students. It is their introduction to the world, a world about which they are curious, and excited to enter. The literature has publications on exhortations to the doctor, but virtually nothing from the vantage point of young people to whom the world of professionalism is both experienced but at the same time shrouded in mystery, the world of adulthood.
In this series of papers entitled ‘Empowering young researchers,’ we aim to look at the world of the everyday through the lens of the young researcher, in this case a junior high school student who is aware of the world, interested in the world, but whose sole experience is personal interactions with doctors, what he reads, and what he might see in the media. The research in this paper was designed and carried out using a new science, Mind Genomics. The objective of the research was to explore how ordinary people think medical students would react to inspirational and descriptive phrases regarding their teachings and ethical issues. The study is reported in the spirit of Mind Genomics, specifically a study of an everyday experience (the lecture or charge to a medical student), with the objective of learning what might be the inspiring messages and what might be the messages heard but soon forgotten.
Today’s computer technology allows people to do complex clerical tasks, often quite simply, by following a template. The template ensures that the person does the correct actions for each task, checks that the material is ready, and moves forward. As a consequence, the template ensures that the process will not run into a problem, at least in terms of the structure of the activity. Furthermore, what could be a complex, involved task might well become easy as the person filling out the template becomes conversant with the different steps. What could have been a boring, repetitive task may remain boring, but can be executed flawlessly over time. And, most of all, the learning to complete the template in general is fairly quick, although the material fitting into the template may itself be difficult.
Imagination about the Everyday
The history of science will show the increasing sophistication of the questions asked. From Aristotle who could only observe the world around and make conjectures, we move along to the world of experiments, where the notion was to understand how one variable ‘covaried’ with another variable, but more important, how one variable drove the other variable, viz., causation. As one readily recognizes today, the best experiments occur when the researcher is trying to understand how ‘nature’ works, searching doggedly in many cases for the rules of nature. At the same time there is the world of social science, the study of people, their social structures, motives, behaviors and so forth. Philosophers since Plato and Aristotle, and presumably many before them, were interested in why people behave the way they do. One never, however, feels that one can create a massive database about the many different aspects of people, at least in the social sciences.
Test Stimuli: Collaboration between the Researcher and AI (Idea Coach)
Mind Genomics works by creating a ‘bank’ of ideas (elements), presenting combinations of these elements to a respondent, having the respondent read and rate each combination on a fixed Likert scale, and then deconstructing the ratings to discover the contribution of each element. The process is mechanical once the elements are created. It is the creation of the elements which often stymies the researcher, leading to the abandonment of the project, or leading to an untenable delay in the project until ‘everything is just right’, everyone agrees with the choice of elements, etc. In the end, the task of creating the elements simply frightens many researchers, regardless of their experience or seniority.
The Mind Genomics template requires that the researcher select four questions which ‘tell a story’. For each question, the researcher is required to provide four answers. In the end, the raw material comprises the underlying story, knitting tighter the four specific questions, and the sixteen answers. Experience over three decades, since the early 1990’s, suggests that it is at this point in the process when many promising projects are simply abandoned by hopeful but frustrated researchers. The reasons for abandoning the project are not relevant, other than to say that there seems be a lowered tolerance for frustration in today’s researcher, and a belief that one should ‘know’ the answer, and select the ‘correct’ elements. Not being sure of ‘correct elements’ suffices to stop forward progress. Many researchers apparently suffer from “open-ended question anxiety.”
To remedy the problem, the Mind Genomics templated recently has been upgraded to incorporate Idea Coach, a user-friend tool based in OpenAI [5]. In the templated process, the researcher begins by providing the four questions. The researcher who would like ‘guidance’ chooses the Idea Coach button on the template form. The researcher then writes in a few sentences about the topic. Using that information, Idea Coach returns with up to 30 questions, from which the researcher can choose up to four. In the case where the questions do not all meet the researcher’s expectation, the researcher choose some, and repeats the Idea Coach effort, either with the same input (leading to a set of 30 questions, many of which are new), or with different input. The researcher ends up selecting four questions, some from AI, perhaps some from oneself, and can edit/polish before proceeding.
Table 1 shows the four questions. The Idea Coach was given the following background to the project:
Table 1: The four questions and the four answers (elements) for each question
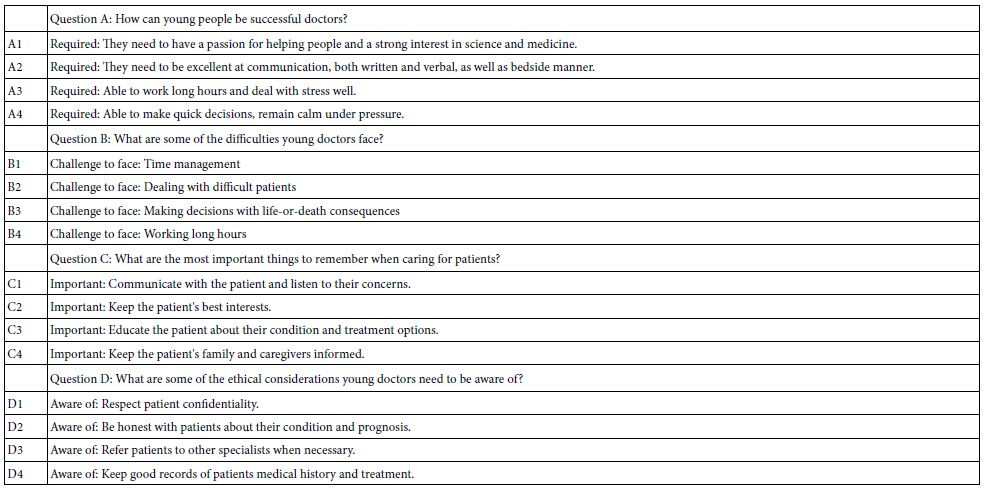
We created this study to see what important precautions young doctors need to face in the medical world. Also to help young doctors so they don’t make a serious mistake.
It is important to keep in mind that the formulation of the question comes from the mind of a young person, a middle-school student. The question is simple, direct, and not formulated in the typical manner that has become the pattern of today’s science. The question is one ‘about the world,’ in the naïve yet profound way that could only be asked by a young person. As the data will show, this type of questioning can lead to profound, powerful, and actionable results, as well as be a part of an easy-to-construct corpus of knowledge about the mind of people facing everyday life.
The quality of the questions shown in Table 1 come from the nature of the Open AI. The researcher’s task is made much easier. The task now morphs from trying to think about good questions to reading questions and selecting those which make sense for one’s project.
After the AI and researcher have collaborated to create/select the four questions, the BimiLeap templated system moves to acquiring four answers to each question. Once again the Idea Coach helps in this task, but requires the deeper involvement of the researcher. For the case of questions, Idea Coach required questions needing very little editing. Not so with the answers. Idea Coach returns with statements. These statements comprise the answers but the statements must be edited. For example, consider element A1. Idea Coach returned with the second part of the element, specifically ‘They need to have a passion for helping people and a strong interest in science and medicine.’ The BimiLeap program for Mind Genomics would be better when the sentence is given an ‘orientation’, such as the word ‘Required’. The authors changed the elements, inserting the orientation word(s), so that the elements were more meaningful. A good analogy to this is the placement of items in a menu under the proper headings (appetizer, main course, etc.,) rather than just having the food on the menu.
The second thing to note about the elements is that they are long, and well-crafted. Virtually all users of the BimiLeap program have commented on the fact that the questions, but more importantly the answers, move beyond what they might have generated had they been instructed to think about the elements, and do research to find elements. This up-front work, possibly taking hours and days, and often leading to frustration in the wake of progress seemingly out of one’s grasp, now takes approximately 20 to 30 minutes, with potentially far better results.
The final thing to note is that hitherto a long, arduous, and often frustrating effort to create questions literally from one’s mind is now replaced by a far more pleasant, intriguing learning experience. The researcher no longer has to feel alone in the effort to come up with questions and answers, but rather now engages in a focused experience of discovering and choosing. In some respects the creation of the elements evolves into its own learning experience, enjoyed by the researcher, with a motivating power to drive exploration of just-learned ideas. What was a difficult moment in the design of a Mind Genomics experiment now becomes perhaps the first learning experience. The Idea Coach, and AI, moves away from a simple aide to become a teacher who reveals new dimensions of a topic to a researcher deeply focused on the topic. Ideas that were not even in the ken of the researcher can now be explored in moments, as part of the research effort.
The History of Mind Genomics
Mind Genomics traces its history to three disciplines, psychophysics, statistics, and consumer research, respectively. Psychophysics is the oldest branch of experimental psychology, seeking to understand how to measure the internal perception of physical stimuli, such as the sweetness of sugar in a beverage. The origination of Mind Genomics can be traced to author Moskowitz’s studies as a graduate student in the Laboratory of Psychophysics in William James Hall, Harvard University, directed by the late Harvard professor, S.S. Stevens. During the latter part of Moskowitz’s tenure at Harvard, with a Ph.D. awarded for studies of taste mixture, it became obvious that the approach could be used to mix ideas, and obtain a measure of the mind in terms of responses to these ideas. The effort would have to wait until Moskowitz was safely ensconced as a scientist at the US Army Natick Laboratories, in Natick MA, where he could begin small scale studies of mixtures of ideas. The taste work would lead to the appreciation of human response mixtures as the relevant topic to explore, whether mixtures of ingredients, or mixtures of ideas [6,7].
Statistics, the second discipline, provides Mind Genomics with analytic tools. The history of science is often presented in terms of the researcher isolating all forms of extraneous noise, viz. unwanted variability, in order to study a phenomenon. We need only visit laboratories to see the apparatus used for these studies to get a sense of how proud the researcher is of the ability to study a phenomenon in ‘splendid isolation;, without the interfering noise. On the other hand, there are many effects where many variables interact with each other, and in the end produce a response. The traditional methods of isolating the variable and then studying the behavior of that variable simply cannot work. Rather, it is a matter of creating specific combinations, allowing the variables to interact, but at the same time allowing the researcher to measure the behavior of each variable, even though the variables are in a mixture. It is this discipline, statistics, specifically the area of experimental design, which constitutes the second foundation of Mind Genomics [8].
The third foundation of Mind Genomics is the world of consumer research, where the focus in on the complex, real-world stimulus, rather than on the artificially created world of the experimental psychologist. The consumer researcher focuses on what consumers are exposed to, how they react to situations which occur in everyday life. Consumer researchers are not attempting to understand the deep fundamentals of thinking and behaving, but rather interested in behavior in natural settings, dealing with responses to real test stimuli, or at least test stimuli which could be real.
The Test Stimuli
The foregoing history of Mind Genomics serves as an introduction to the nature of the test stimuli. The stimuli comprise combinations of elements, rather than single elements. The rationale is that only with combinations of elements can the test stimuli make sense, have ‘ecological validity.’ When we isolate the test elements, the 16 phrases shown in Table 1, instructing the respondent to rate each element, one at a time, we end up presenting the respondent with stimuli that are almost meaningless. Of course we are interested in the performance of each element, but it is very hard for the respondent to rate each element. It may be that the respondent and rate each element with the same mental rules, but more likely the respondent will end up shifting the mental criterion for the rating. That shift may be hard to imagine for these data, but easy to understand when we turn to elements which comprise brand name, price, nature of the product features, and location where the product is bought. When the rating sale is ‘interest in buying’, the respondent has a hard time using the same criterion. The data may look correct, but the reality is that during the course of evaluating the different types of elements the respondent may have shifted the criterion many time to be appropriate for the element.
To solve the foregoing problem, viz., of presenting ideas as simulating something real, Mind Genomics uses the power of experimental design to create combinations of elements. The experimental design for the 4×4 structure (four questions, four answers for each) comes up with 24 combinations. Within those 24 combinations, each of the 16 elements appears exactly five times, and is absent 19 times. A single vignette can have two, three, or four elements, but no more than one element from any question. The structure is set up so that the data from a single respondent can be analyzed by OLS (ordinary least squares regression), which as shown below, will reveal the individual level combination of every element to the response. Finally, the Mind Genomics design is set up so that each respondent sees different combinations. No respondents see the same combinations until the number of respondents exceeds 250. This property of different sets of 24 combinations created by the same mathematical scheme is called a permuted design structure.
The Orientation and Rating Scale
Mind Genomics studies are typically conducted with populations of respondents who are unfamiliar with the topic. They know that they will be reading and evaluating different combinations of messages, but have no idea that the combinations, also known as vignettes, will be created by experimental design. The respondent generally follows the instructions, doing what they are told. Thus, the simplest way to do the Mind Genomics experiment is to tell the respondent a little about the topic, viz., a sparse background, and then instruct the respondent to read the vignette and assign a rating using a defined rating scale.
Table 2 shows the instructions and the rating scale. The instructions are very simple. A principle of Mind Genomics is that it is more productive to provide a sparse orientation and let the individual elements in the vignette provide the necessary information about the topic. We follow this practice in our studies. Simplicity makes the task easy for a younger researcher because there needs to be very little deep knowledge behind the question.
Table 2: The orientation paragraph and the associated rating scale
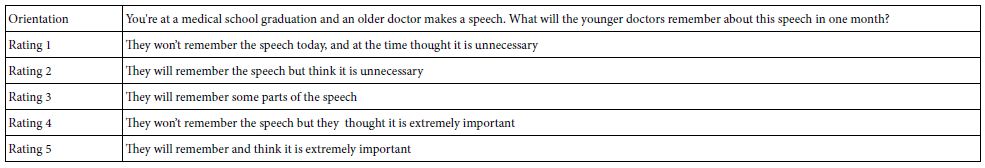
The rating scale in Table 2 merits more discussion. The rating scale actually encompasses two scales, one for important, and the other for remembering. Each point on the five point scale corresponds to one possible combination of thinking something is important and remembering the speech. Another thing to observe is that ‘remembering’ is first, and ‘important’ is second. In this way the scale is ‘broken up’ forcing the respondent to read the scale, rather than just remember a place on the scale, or at least that is the intention.
In order to prepare the data for analysis, it was first necessary to transform the scale. Users of data find it very hard to look at either the mean on the scale (which is meaningless for our broken up scale), or the distribution of ratings on the five-point scale. A simpler way to do things is to transform the scale values to binary (0 or 100). For simplicity, we abbreviate the word “Rating,” with “R” and the rating number. For example, “Rating 1” is abbreviated “R1,” etc. This study features two sets of transformations, one dealing with importance, and the other dealing with memorability.
1a. Important and Remembered (R5 only transformed to 100, rest of ratings transformed to 0)
1b. Not Important (viz., Not Necessary) and Not Remembered (R1 only transformed to 100, rest of ratings transformed to 0)
2a. Important (R5, R4 only transformed to 100, rest of ratings transformed to 0)
2b. Remembered (R5, R2 only transformed to 100, rest of ratings transformed to 0)
2c. Not Important (viz., Not Necessary) (R1, R2 only transformed to 100, rest of ratings transformed to 0)
2d. Not Remembered (R1, R4 only transformed to 100, rest of ratings transformed to 0)
With this transformation it becomes easier to discover patterns. The combination of rating scale points into those denoting ‘important’ vs. ‘not important’ allow us to isolate specific elements driving the perception of importance. Similarly, the combination of rating scale points into those denoting ‘remembered’ vs. ‘not remembered’ allow us the same power to isolate specific elements that the respondents feel will be ‘remembered’ by the medical students or young doctors. Keep in mind, however, that this experiment is done among the population of young people, ages 19-40. The same experiment could be done easily among medical students to discover whether they feel the same way.
Analysis 1
Do Different, Identifiable Groups of Respondent Score the Vignettes the Same Way?
In the foregoing introduction to Mind Genomics we made the point that each respondent in the study evaluated a unique set of 24 vignettes. This means that when we look at the distribution of ratings, we must keep in mind that we are not looking at the different groups of people evaluating the same stimuli, but rather evaluating different stimuli of the same type.
At this point it is worth pointing out that stopping here, just looking at the pattern of responses without any deeper analysis, would not be wrong. Indeed, the researcher who stops here, and supports her or his conclusions of similar patterns with conventional statistics, e.g., tests of statistical difference, would be lauded for defending the conclusion of ‘similar patterns’ using well-accepted statistics. Yet, as we will see below, when we move to the development of ‘mind-sets’, the researcher will be afforded the far deeper opportunity to understand the topic, one provided by the up-front efforts to create the test vignettes using experimental design.
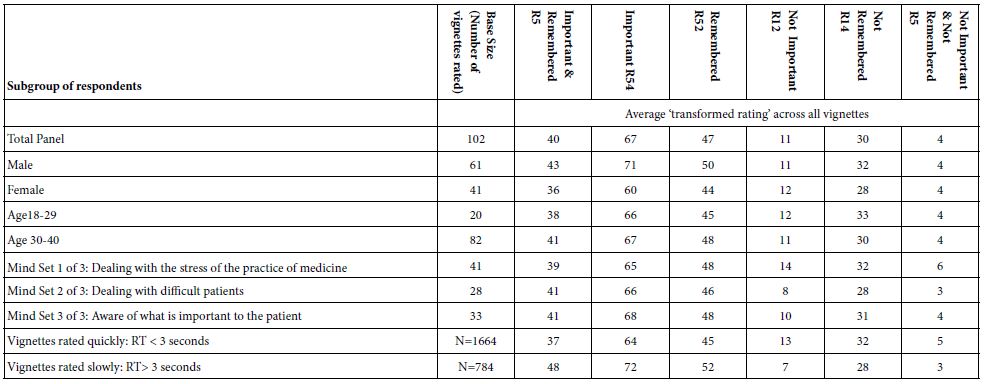
Table 3 shows the average ratings for the six newly created dependent variables, for the key subgroups. Table 3 suggests similar patterns of response. Were we to stop here, we would not know anything beyond the observation that the patterns of transformed ratings seems to be similar across the different groups. As the subsequent analyses will reveal, our observation might seem correct on the surface, but is wrong. We would not, however, realize that there are deeper patterns, some of which are radically different from each other.
The groups shown in Table 3 are:
- Total
- Gender (male, female)
- Age (18-29 years old, 30-40 years old)
- Vignettes rated rapidly (response time < = 3 seconds) vs. rated slowly (response time > 3 seconds)
- Mind-Set emerging from clustering (Mind Set 1 of 3 Dealing with the stress of the practice of medicine; M2 of 3 Dealing with difficult patients; MS 3 of 3 Aware of what is important to the patient).
Table 3: Averages of six newly created transformed variables, by total panel and by key subgroups. The averages are computed based upon the original rating assigned to each of the vignettes seen by a member of the subgroup. The numbers can be treated like percentages.
Building Models (Equations) Relating the Elements to the Newly Created Transformed Variables
We now move to the heart of Mind Genomics, creating equations which show how each of the 16 elements contributes to the newly created variables. Our analysis will focus on five of the six variables, as we see at the top of Table 4. We will look at the transformed variables corresponding to the highest level of performance (important and remembered), the transformed variables corresponding to ‘important’, the transformed variable corresponding to ‘remembered’, and then the complementary transformed variables of ‘not important’ and ‘not remembered’. The next set of tables will present the parameters of these five transformed variable for each identifiable subgroup previously presented in Table 3. The results will reveal a deeper, far more organized world, one emerging clearly due to the underlying experimental design.
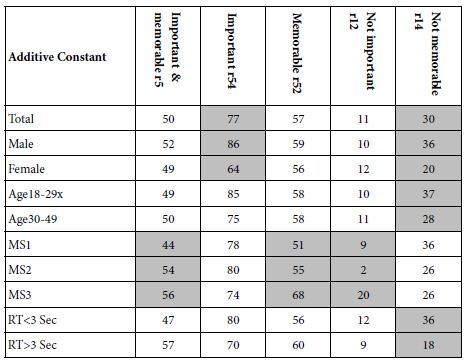
Table 4: Values of the additive constant for five dependent variables (columns) and different groupings of respondents and vignettes, respectively
The first step to build the equation is to create the database. The database can be thought of as a rectangular file, one row for each vignette. Recall that each respondent evaluated 24 vignettes, so this database comprises 24 rows for each respondent.
The columns of this database contain the relevant information:
Column 1 – The unique identification number for the respondent. It is sufficient to label the respondents with a sequential set of numbers, starting with 1, and continuing. The study comprises the data from 102 respondents.
Column 2 – Gender
Column 3 – Age
Up to now the data for a specific respondent has been repeated 24 times. We now turn to the data for a specific vignette.
Columns 4-19 correspond to the 16 elements, with each element having its own column. For example, column 4 is reserved for element A1, column 5 or element A2, and so forth. For a single row, each cell (4-19) will be given the value ‘0’ when the element is absent from that particular vignette, or given the value ‘1’ when the element is present in that particular vignette. Since the experimental design prescribe that each vignette will have 2-4 elements, and not more than one element from a question, the database will reflect the design by having the number ‘1’ in two, three, or four columns, and the number ‘0’ in the remaining columns. The rationale for this specific coding, so-called ‘dummy variable coding’ [9], is that the coding enables the regression program to estimate the contribution of each element when the element goes from ‘state =0’ to ‘state = 1’, viz., present.
Column 20 shows the order of presentation of the vignette for a respondent, with the value going from 1 (first vignette) to 24 (last vignette).
Column 21 shows the response time, defined as the number of seconds elapsing between the presentation of the vignette to the respondent and the response. The response time is measured to the nearest tenth of a second. The response time is an important measure in the world of consumer researcher, insofar as it may indicate the presence of different cognitive processes [10,11].
Column 22 shows the rating assigned to the specific vignette by the specific respondent.
Up to now, columns 1-22 were generated by the BimiLeap program, along with data acquired during the course of the experiment. The data can be used for analysis ‘as is’, but consumer researchers prefer to transform the data so that they can investigate different types of answers. There are five specific transformations of interest, focusing on five different aspects of the decision. Each one creates a new dependent variable that will be analyzed in depth.
- R5: ‘important’ and ‘memorable’. Ratings of ‘5’ are converted to 100. Ratings 1-4 are converted to 0.
- R54: ‘important’. Ratings ‘5’ and ‘4’ are converted to 100. Ratings 1-3 are converted to 0.
- R52: ‘memorable’. Ratings ‘5’ and ‘2’ are converted to 100. Ratings 1,3, and 4 are converted to 0.
- R12: ‘not important’. Ratings ‘1’ and ‘2’ are converted to 100. Ratings 3,4 and 5 are converted to 0.
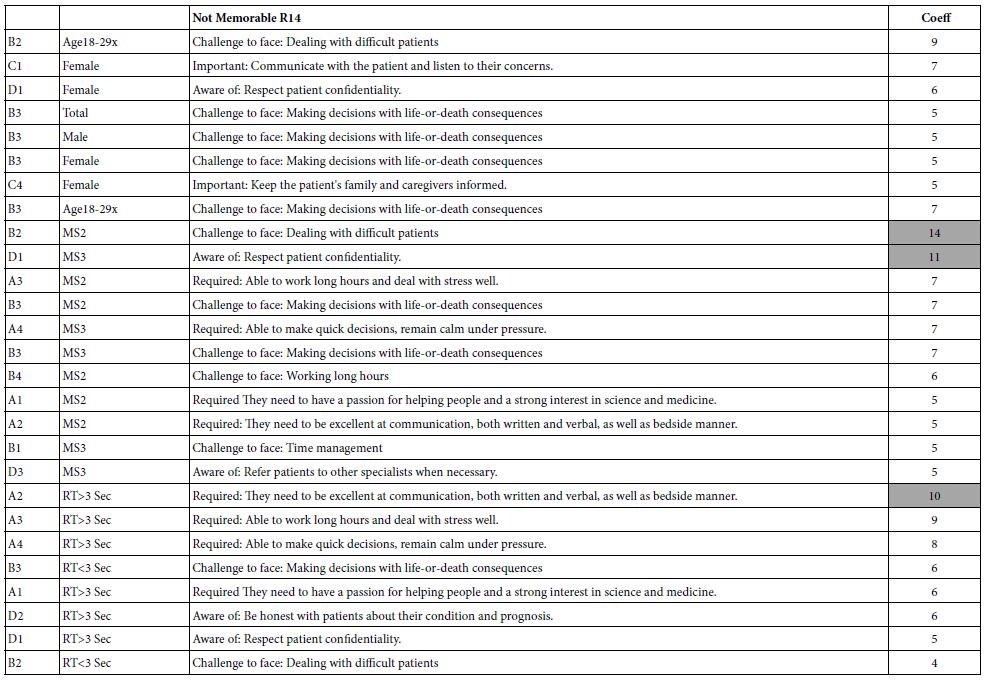
- R14: ‘not memorable.’ Ratings ‘1’ and ‘4’ are converted to 100. Ratings 2,3 and 5 are converted to 0
- To prepare for the analysis by OLS (ordinary least-squares) regression the BimiLeap program adds a vanishingly small random number (<10-5) to each transformed value. The random number does not affect the coefficients of the regression equation, but ensures that the dependent variable will possess some minimal variation across the vignettes for each individual respondent. This variability is necessary for the statistical calculations.
- The equation or model is expressed by the simple formula: DV (dependent variable) = k0 + k1(A1) + k2(A2) … k16(D4)
- After the parameters of the OLS model for importance (R54) are calculated for each respondent and stored in a second database, that second database to be subsequently used by a clustering program. The clustering program [12], uses the 16 coefficients (k1-k16) as inputs to identify groups of respondents showing similar patterns of 16 coefficients The clustering program assigns each respondent to one of two clusters, based upon similar patterns, and then assigns each respondent to one of three clusters, again based upon similar patterns. The output is the assignment of each respondent to one of two ‘mind-sets’ or one of ‘three mind-sets.’ The assignment is done using strict mathematical criteria. However, the names assigned to the mind-sets or clusters are based upon the elements which are the strongest performers. This criterion is known as ‘interpretability.’
- Each respondent belongs to several different groups. The first group is Total Panel, viz., everyone. The second grouping divides into the respondent being a male or a female. The third grouping divides into the respondent into younger (ages 19-29) or older (ages 30-40). The fourth grouping divides the respondents by the mind-set to which they belong.
- Up to now, the vignettes were assigned to groups based upon the characteristic of the respondent, viz., a gender. We can also look at the vignettes, rather than at respondents to create groups. The fifth groups divides the vignettes by those that were evaluated quickly (operationally defined as response time, <= 3 seconds) versus those that were evaluated slowly (operationally defined as response time > 3 seconds). We can also look at the data focusing our attention on the speed of the response to the particular vignette.
- Baruch JM (2017) Doctors as makers. Academic Medicine 92: 40-44. [crossref]
- Kassirer JP (2000) Patients, physicians, and the internet: Coming generations of doctors are ready to embrace new technology, but few incentives now exist to encourage their older peers to do likewise. Health Affairs 19: 115-123.
- Murtagh GM, Furber L, Thomas AL (2013) Patient-initiated questions: How can doctors encourage them and improve the consultation process? A qualitative study. BMJ Open 3: p.e003112.
- Swennen MH, van der Heijden GJ, Boeije HR, van Rheenen N, Verheul FJ et al (2013) Doctors’ perceptions and use of evidence-based medicine: a systematic review and thematic synthesis of qualitative studies. Academic Medicine 88: 1384-1396. [crossref]
- OpenAI (2023)
- Moskowitz HR, Gofman A, Beckley J, Ashman H (2006) Founding a new science: Mind Genomics. Journal of Sensory Studies 21: 266-307.
- Porretta, S, Gere A, Radványi D, Moskowitz H (2019) Mind Genomics (Conjoint Analysis): The new concept research in the analysis of consumer behaviour and choice. Trends in Food Science & Technology 84: 29-33.
- Gofman A, Moskowitz H (2010) Isomorphic permuted experimental designs and their application in conjoint analysis. Journal of sensory studies 25: 127-145.
- Suits DB (1957) Use of dummy variables in regression equations. Journal of the American Statistical Association 52: 548-551.
- Lenzner T, Kaczmirek L, Lenzner A (2010) Cognitive burden of survey questions and response times: A psycholinguistic experiment. Applied cognitive psychology 24: 1003-1020.
- Revilla M, Ochoa C (2015) What are the links in a web survey among response time, quality, and auto- evaluation of the efforts done? Social Science Computer Review 33: 97-114.
- Likas A, Vlassis N, Verbeek JJ (2003) The global k-means clustering algorithm. Pattern Recognition 36: 451-461.
Clustering generates groups of two and three mind-sets, with the name of each mind-set chosen based on the strongest performing elements in the mind-set, viz., the elements with the highest positive coefficients. Taking the three mind-set-solution as an example, Mind Set 1 of 3 is Dealing with the stress of the practice of medicine, Mind Set 2 of 3 is Dealing with difficult patients, and Mind Set 3 of 3 is Aware of what is important to the patient.
Steps 1-7 above create a database that is readily analyzed by standard regression methods. The approach here is OLS (ordinary least squares) regression. We begin with the additive constant, k0, shown above as part of Step 6. To review, the equation in Step 6 has 16 coefficients (k1-k16) and the additive constant. The additive constant is a ‘baseline’, defined as the expected transformed value were the vignettes to comprise no elements at all. The underlying experimental design ensures that all vignettes will comprise at lest two elements and at most four elements. The additive constant has no physical meaning other than as an adjustment factors. We can use the additive constant as a ‘baseline’, giving us a sense of the likely percent of responses to be obtained for a given dependent variable (e.g., R54), in the absence of elements.
6. Table 4 shows the additive constant for each of the groups (rows), and for each of the five dependent variables (columns). For each group and for each dependent variable the additive constants have been shaded for those groups showing an 11 point or higher magnitude of difference between any two members of the group. The large magnitudes of differences in a group are most striking for the three mind-sets, viz., those groups create on the basis of different patterns of coefficients.
We now turn to the important elements for the five transformed dependent variables, showing only those elements which generate a coefficient of +5 or higher. The standard error for Mind Genomics coefficients varies from 4-6 for most studies with a base size of 100. Furthermore, when elements with coefficients of 4-5 or higher are separately investigated, they often turn out to be relevant to the topic. Consequently, and in the interest of Mind Genomics studies as being early-stage explorations, the cut-off level is set to about 4-5. In this project the cut-off level was set at 5, to follow the conventional practice. In addition, the very strong performing elements are shown in shaded cells, specifically those elements with coefficients of +10 or higher. Finally, each table presents three sets of elements, each set sorted in descending order of coefficient value. The first portion of the table presents the results for relevant elements (coefficient = 5+) for the total panel, gender and age. The second portion of the table presents the results for relevant elements for the three mind-sets. Finally, the third portion of the table presents the results for relevant elements for vignette-based groups (response time, order of testing).
Mind Genomics generates a great deal of data, much of which can be analyzed in depth for the simple reason that the elements themselves are ‘cognitively meaningful.’ That meaningfulness leads to the ability to discern general patterns, but then to evaluate the nuances of each element.
7. If we were to summarize the results from the data in Tables 5-9 we would emerge with the conclusion that the strong results emerge from the mind-set, rather than from the self-profiled demographics of the respondents (viz., age and gender), and rather than from the non-cognitive nature of the stimulus (viz., speed of responses, order of testing (first half vs. second half)).
Table 5: Strong performing elements (high coefficients) for ‘important and memorable, R5’
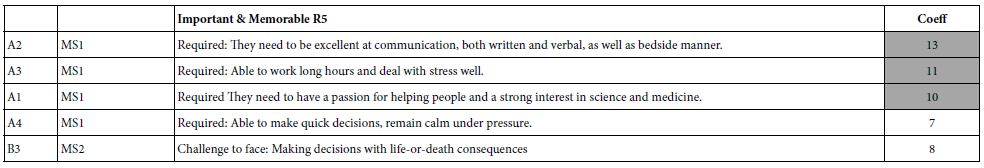
Table 6: Strong performing elements (high coefficients) for ‘important (R54)
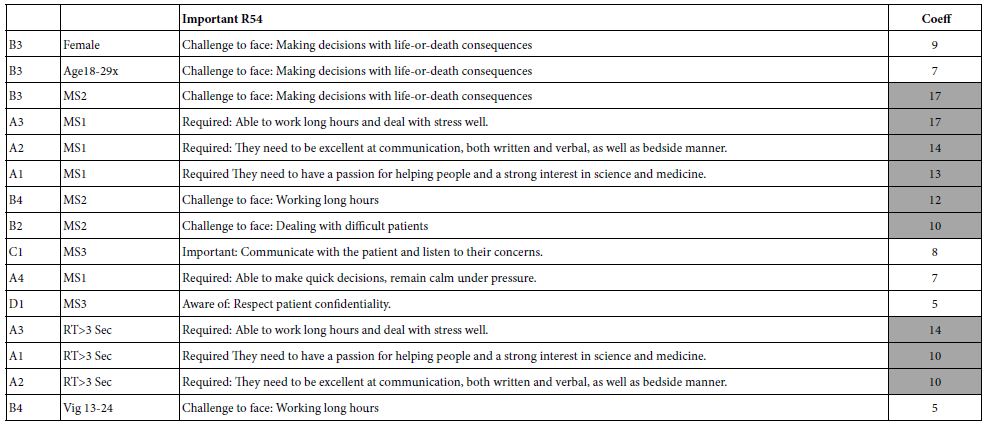
Table 7: Strong performing elements (high coefficients) for ‘memorable’ (R52)
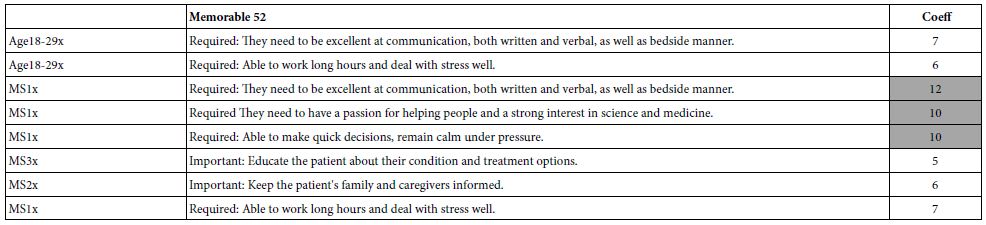
Table 8: Strong performing elements (high coefficients) for ‘not important’ (R12)
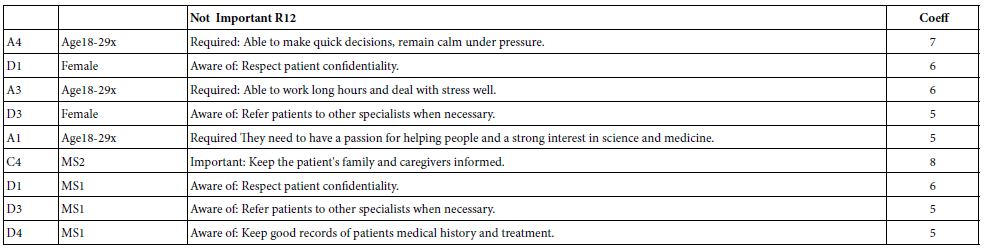
Table 9: Strong performing elements (high coefficients) for ‘not memorable’ (R14)
Discussion and Conclusions
Traditionally, the combination of young students and ‘science’ has been to repeat experiments that have been previously performed, experiments whose answers are known. The student’s task is to replicate the experiment in the proper manner, obtain the results, and present the process to the teacher. Success in such a case emerges from the combination of executing the study properly and getting the ‘right answer’. The approach has worked for decades, as generations of students went through the process, some emerging with the feeling that ‘science’ is for them, whereas others emerging with the feeling that this process is not at all for them. A century and more of scientific progress, and the emergence of the modern world with all its technology and ‘know-how’ testifies to the success of the traditional process to learn science.
The world has changed. One can scarcely spend a day reading newspapers or now more frequently looking at the material flooding forth from the web, to get a sense that the traditional methods of teaching and exciting students no longer work very well. Perhaps it is the ‘tyranny of the small screen’, a phrase author Moskowitz coined to describe the everyday scene of people, young and old, glued to their smartphones. Perhaps the phones are smart, but the people seem to be less smart, or less educated, if one is to believe the ongoing reports in both the academic press and in the popular press, respectively.
In this emerging world, how then can students be excited? The approach presented in this paper constitutes one way of exciting students through becoming researchers. Happily, there is very systematized thinking about the problems of the everyday, the world where ordinary people live, the world in which they experience the aspects of the quotidian, the daily, the routine. What then could happen if this daily world, so accessible to people, so very ordinary, could be magically transformed into a topic for true scientific investigation, research which not only teaches the student how to think, but actually creates a unique, valuable, indeed absolutely vital corpus of knowledge about the world. After all, the study just reported here, done in just a few hours, from beginning to end, produces unique to the world, valuable information. Most of all, this valuable information comes from the minds of young students, the senior researcher aged 13 (Cledwin), and the junior researcher aged 8 (Ciara), respectively. Their efforts, their curiosity, exploring the topic, produces unique to the world information, the beginning of a large corpus of knowledge on communications to students in the world of medicine.
There is much to do, more than a billion students around the world, many of them that could be considered the ‘raw material’ of our civilization. Right now the issue continues to be concern about their learning, that they are not learning properly, that their motivation is lagging, that their attention is increasingly on the small screen. Perhaps it is because they are not involved in learning, that learning has become the ceaseless repetition of facts to be ingested, converted to bits of memory, and regurgitated at the proper time, somewhat like the cow chewing its cud. Expressed that way, learning is for the very motivated, and perhaps those who cannot escape this onerous task. But, and this is the important point, what would happen if the students could participate in world-wide projects which create separate topic-specific databases about the everyday, using templated experimental design, and using artificial intelligence. The escape would be into education, not away from education into mindless gaming. One could only imagine a world where thousands of students could collaborate and even compete as they jointly build large scale databases about the minds of people in society regarding the different aspects of daily living. An example might be a large scale database about different aspects of teaching and learning mathematics, across 192 countries, across the entire range from say 3rd grade to end of college, focusing on the many dozens different aspects of teaching and learning mathematics. This effort alone, with 192 countries x 10 aspects of learning mathematics creates a unique, valuable database. One could only imagine the pride of participation and learning for students world-wide who volunteer to participate in this effort. And, to finish, the opportunities are unlimited. Truly in this case ‘the appetite comes with the eating.’
References