Author Archives: author

Differences in the Pandemic? Qualitative Study of Gender as a Social Determinant

DOI: 10.31038/AWHC.2023631

Abstract

Life history factors have a significant role in disease development and coping, but have been given little consideration in the response to the COVID-19 pandemic. Based on a thorough analysis of oral history interviews from the initial phase of the pandemic, an investigation of the effects of COVID-19 on individual areas of life is carried out and subjective coping patterns are considered The mental stresses experienced due to the pandemic situation relate primarily to the social environment, the job and society.

In particular, the aspect of reconciling professional and private obligations makes it clear that the challenges perceived here affected women with small children and single parents in particular. The results illustrate the importance of gender and life situation for the individual experience of the pandemic.

Keywords

Oral history, COVID-19, Pandemic, Compatibility, Gender gap, Diversity

Background

The year 2020 was supposed to be groundbreaking for gender equality.  Instead, the spread of the COVID 19 pandemic threatens  to undo even the limited gains of recent decades. The pandemic deepened already existing inequalities and exposed vulnerabilities in the social, political and economic systems, which in turn amplified the impact of the pandemic [54].

Life history factors have a considerable share in the development and management of disease, but were given little consideration in the measures taken in the pandemic – both nationally and internationally [25,31,41,45]. This contradicts WHO health goals and is also gradually entering public awareness, but so far without effect [33]. At the same time, studies make it clear that the effects significantly influence inequalities: for example, socially disadvantaged people have a higher risk of infection with COVID-19 and a more severe course of the disease [6,13], the possibility of mobile working is unequally given [1], and low-income workers experience above-average income losses [24]. Relevant social determinants of the individual risk of infection are cramped living conditions, poor housing quality, low income,  low education and a disadvantaged socio-economic situation [23]. Occupations with a potentially increased risk of exposure are those that are characterised by interpersonal contact and cannot be easily practised from home, such as retail, health or rescue workers [23].

Women more often experience additional care work and reconciliation conflicts [19,27,40], they are more affected by infection worries [21,39] due to different living environments and are exposed to different influences and health resources, which are expressed in different ways of dealing with complaints [58]. Wandschneider [57] points out that a large proportion of health care workers are female [13], that women take on the majority of care work [32,59] and that they suffer more frequently from domestic violence [55].

Taking into account the social determinants of health [10,11,53,60] can already lead to better planning in preparedness plans and contribute to successful pandemic management on several levels [26]. The current COVID 19 pandemic has once again highlighted the drifting apart of opportunity structures.

At the same time, the gender category influences numerous areas of social life and, according to Gamper et al. [15], plays a significant role as a category of social order and social positioning [5,43]. In  the area of health, numerous studies have shown a strong difference between the sexes (morbidity, mortality, development and course of diseases, health behaviour) [28,42]. Furthermore, social and cultural factors have an impact on health care and are expressed in partly significant gender differences [15,28].

Qualitative observations of the connections between the pandemic situation, gender and inequality deal with different focal points. The Federal Conference of Women’s and Gender Equality Representatives pointed out early on that there has been increased structural discrimination against women scientists and other experts since the beginning of the COVID pandemic [9]. Several studies point to a stronger disadvantage of female students [3] and scientists [12,16,46,56] in the pandemic situation. Haag and Gamper point     to a new urgency in the situation for women in science, which has intensified with the onset of the COVID 19 pandemic [16].

With the aim of recording the perception and interpretation patterns of the pandemic situation on an individual biographical level, the perspective was expanded to include further social aspects. Based on life history interviews, this article explores the question of which life-world effects women in western industrialised countries perceived in the context of the COVID 19 pandemic and the containment measures they experienced and formulated in oral history interviews.

Research Approach: Secondary Analysis of Oral History Projects

Data Collection

This paper captures this phenomenon on an individual- biographical level. To this end, it looks at the individual perception and coping with the measures from the perspective of women. Methodologically, access is gained through a systematic secondary analysis of several oral history projects on experiences during the COVID 19 pandemic in 2020-22, which made their documented records available to the public and for further use. In addition, aspects of the interaction of collective memory are considered as well as organisational structures and subjective coping patterns that helped shape the handling of the measures ordered and thus the crisis community.

A systematically collected sample of oral history interviews with women from western industrialised countries on their experiences   in the early phase of the COVID pandemic, which were collected in various projects and made available for use, serves as the source basis. The interviews recorded between March 2020 and October 2021 were subjected to secondary analysis [48,49]. For this purpose, the transcripts of the included interviews on the work situation, perceived risk of infection and expressed or recognisable psychosocial stress were searched [36]. The interviews conducted in other projects were not specifically concerned with these aspects, so they were not always the focus of the interviews, but many interviewees did address these aspects.

This paper is based on a secondary analysis of qualitative data from four different qualitative surveys on experiences with the pandemic situation. The understanding of secondary analysis refers to the analysis of empirical material along a research question that deviates from the epistemological interest of the primary projects included [29,35,44,47]. As explained below, the secondary analysis was carried out methodologically as a qualitative content analysis.

The research design presented here is not fully suitable for the study of individual experiences with the pandemic and restrictive measures. For better comparability, more comparable data sets and questions would have to be available, which was not feasible within the framework of this analysis. Nevertheless, the research presented here can provide initial indications of subjective perceptions and interrelationships. At the same time, it can only be understood as an empirically based, hypothesis-generating preliminary investigation; a hypothesis-testing investigation is therefore still pending.

The interviews included are from published and widely available oral history projects on COVID-19 from Columbia University in New York, Sacred Heart University in Fairfield, Texas A&M University San Antonio and the Historic New Orleans Collection. Even though the recordings are available to the public, the interviews have been effectively anonymised to protect the personality of the people speaking out.

Explanation of the projects included:

  • New Students in Prof. Ana Paulina Lee’s Contemporary Civilization II course at Columbia University in New York conducted oral history interviews in April and May 2020, shortly after the pandemic hit New York City and Columbia University courses switched from in-person to online. As such, the interviews provide a snapshot of understanding of COVID-19 and its social impact in the early days of the pandemic. From this project, 10 interviews were included in the analysis [29].
  • Fairfield: The oral histories archived there are the result of student research in courses taught by Dr Charlotte Gradie (HI203 Medicine, Disease and History) and Dr Gerald Reid (SO201 Poverty and Inequality in the US) at Sacred Heart University in Fairfield, Connecticut. From the documented records, all accessible interviews with women, 28 in total, were included in the study [30].
  • Texas: The COVID-19 Oral History Project began in September 2021 at Texas A&M University, San Antonio and is currently ongoing. From the recordings accessible in the Student Works Collection “History 1302”, 21 videos on female perspectives were included in the analysis [31].
  • New Orleans: The oral history project “From the Front Narratives of the COVID-19 Pandemic in New Orleans” began in May 2020 and has collected audio interviews with nurses, doctors, paramedics, epidemiologists, public officials, undertakers, spiritual leaders, business people and artists through the end of 2021. The interviews, which have been catalogued and archived, form one of the most comprehensive resources on the social history of the pandemic in New Orleans. From this series, selected interviewees are featured in a series of short videos in an exhibition and on social media. From this project, 6 recordings were included in the analysis [32].

Data Collection

The included interviews provide an exciting foil for comparison with the perspectives in the literature and the other recorded memories. The series of interviews collected between spring 2020 and autumn 2021 address individual perspectives on the pandemic situation. The following diagrams show the composition of the surveyed sample (n=65):

The article uses Daniel Oesch’s class-analytical model to capture and interconnect the multiple effects of the COVID 19 pandemic [37]. This combines a horizontal axis of inequality research (level of education) with a vertical differentiation according to dominant work logics (administrative, interpersonal, technical, independent) (Figures 1-4).

Under 20

21-30

31-40

41-50

51-60

61-70

71-80

over 81

4

26

6

9

14

3

1

2

Figure 1: Distribution by age

Q II/20

Q III/20

Q IV/20

Q I/21

Q II/21

10

0

34

19

2

Figure 2: Distribution by survey period

No children: 44 Children: 21 (of which single: 3)
No migration background: 53 Migration background: 12

Figure 3: Distribution by family background

Apprenticeship

Training profession

Semi-Profession

Academic Profession

Unknown

8

16

18

21

2


Figure 4:
Distribution according to education level

According to Fessler et al. [20] in the administrative logic the work process is determined by bureaucratic rules, in the interpersonal work logic direct human interaction plays a central role, in the technical logic the work processes are concentrated on technical artefacts and machines and in the independent work logic the processes are subject to the control mechanisms of autonomy. According to Holst et al. [21,22]. women are clearly overrepresented in the four interpersonal employment classes and in the two lower classes of the administrative work logic, while men dominate above all the technical employment classes and the upper administrative as well as independent employment classes. The gender ratio observed by Holst et al. is also reflected in part in the interview sample. Accordingly, the statements refer primarily to the perspective of representatives of interpersonal work logics with a higher level of education, but other perspectives are also represented (Figure 5).

Administrative

Interpersonal

Technical

Independent

Unknown

Upper Management: 3 Sociocultural Expert: 7 Technical Expert: 0 Independent Professional: 3
Lower Management: 8 Sociocultural Semi-Profession: 9 Technical Semi-Profession: 1 Entrepreneur: 1
Skilled Office Worker: 0 Skilled Service Worker: 7 Skilled Worker: 1 Small Business with employees: 0 Training: 10
Routine Office Worker: 2 Routine Service Worker: 6 Routine Worker: 0 Small Business without employees: 5 Unknown: 2
Total: 13 Total: 29 Total: 2 Total: 9 Total: 12


Figure 5:
Distribution according to work logic and employment class (according to Oesch):

Data Analysis

The topic-centred interviews serve as a starting point to reconstruct women’s perspectives on their situation in the pandemic and, more importantly, the perceived impact of the interventions [7]. Topics addressed in the interviews include: Personal background (social and local origin, education and occupation), Recollection of becoming aware of the pandemic situation, Perception of the risk of infection as well as the impact on everyday life, occupation and social environment, Abandoned activities, Comparable drastic experiences, Classification of government coping measures as well as their impact, Personal lessons and consequences from the situation. The recorded interviews give the interviewees, to varying degrees, the opportunity to set their own priorities and formulate their interpretations of the situation. Depending on the interview, interviewees also address the perceived social inequality that is felt to be intensified in the pandemic situation.

The data was analysed using the MaxQDA analysis software. A coding method based on qualitative content analysis according to Mayring served as the evaluation method [34]. Qualitative content analysis according to Mayring involves the ordering, categorisation and structuring of manifest and latent contents and the development of systematic and intersubjectively verifiable results.

The coding was done in two steps; first, all categories were created theory-based (according to Holst et al.) [21]. In order to obtain a balanced code system, the interviews, which were initially coded inductively, were recoded deductively in a second step. The strength of this deductive-inductive approach lies in “not only being able to analyse objects, contexts and processes, but … to imagine them in a re-experiencing way” [34].

Findings

This paper examines women’s perceptions of the impact of COVID-19 on their lives in Western industrialised countries in the context of the COVID-19 pandemic and the associated restrictive measures. The perceived impact of COVID-19 on women’s everyday lives is examined below using three topics as examples. These also play an essential role in the public discourse on coping with the pandemic [21]. The following sections are first devoted to the reconciliation of gainful employment and care work; then perceived risks of infection are considered; after that, the aspect of psychosocial stress is examined. For each topic area, typical subjective patterns of experience are reconstructed from the perspective of women.

Reconciling Gainful Employment and Care Work

The following section looks at how the respondents perceive the changed working conditions with regard to the reconciliation of gainful employment and care work in the pandemic situation. In order to get closer to an answer, changes in professional activity and the associated coping patterns and reconciliation conflicts are considered. The majority of the interviewees work in the interpersonal field, i.e. professions that, according to Oesch [37], are mainly occupied by women.

One of the most significant changes in connection with the pandemic situation was to reconcile gainful employment and care work under the new circumstances [27]. While there is no question that this was the sole responsibility of the interviewees, the main responsibility for balancing lay with the interviewees who were confronted with the changed living and working conditions.

Changes in Gainful Employment

Perceivable changes took place especially in the conditions of gainful employment. The interviewees perceived many developments that affected their everyday work. The changes described include, above all, the rules of conduct and hygiene that the interviewees not only had to observe in their work, but also demand from their clients.

  • “We’re wearing double face mask, we have gloves, we wash our hands constantly, we make sure that we take care of our customers and make sure that they’re are practicing social ” (TX_I67)
  • “Several interviews referred to the closures and layoffs that accompanied the changed economic situation as very drastic. This changed not only earning but also training opportunities, especially in the interpersonal sphere:
  • “I gave up my graduation, … things that I have been looking forward to, me and my family.” (NY_I39)
  • Also, especially in the interpersonal field of work, learning content could not always be adequately conveyed in education and training.
  • “I was worried that I wasn’t having in person (at the practice)…. I was worried I wasn’t going to be caught up with everything that I need to know by the time I graduate and that I wasn’t going to be up to the par of the therapist before me.” (CO_I20)

Another measure perceived as very relevant is the transfer or placement of professional activities into the virtual realm. This did not only affect women entering the profession:

  • “So this is actually my first full year teaching I taught for three  months.  And  then  we went  into  lockdown,  and I haven’t had  a normal experience, if you may have teaching.”(TX_I49)
  • “Many of the interviewees reported the transition to mobile workplaces and the changes in their working conditions that came with Many of the changes affected all family members in home-based work, members of all genders regardless of whether they were raising children at home or not:
  • “So we had to rethink everything that we’ve ” (CO_I13, with Care Commitment)
  • “Because the whole country somehow shutdown, everyone was working ” (NY_I41, with Care commitment). One problem that many affected people perceived was the difficult differentiation of professional and private areas and times:
  • “Work and life, work and personal life, you know, in the same house, you know, your living room is your working room, and your bedroom is next to your working room. So it’s very confusing how to separate your life–personal life and ” (NY_I38)
  • “At first I was having a hard time separating my work from my personal life but eventually I learned how to live with ” (TX_I50). This spatial overlap and accompanying availability was perceived as a compression and increase in workload:
  • “I feel like I’m working a lot more especially when we were full-time working from home. Because I didn’t have to drive to I didn’t have to, you know, do anything to leave my house. I was working, you know, sometimes 7:45 in the morning until like, 6:17 at night So I feel like I’ve been working longer hours and putting different effort in.” (CO_I27)
  • “Seems like we’re working at all hours of the day in different increments instead of going to work for 8 hours a ” (TX_ I63, with care commitment)

Changes in Care Work

The interviews suggest that people in precarious jobs, people in the low-wage sector or who depend on part-time work are particularly affected by the more difficult conditions in care work. At the same time, the majority of care work is done by women and women are more likely to be in precarious or low-paid jobs. This means that women in particular have greater difficulties in reconciling their professional activities or training with the pandemic measures [38]. The interviews also reveal that already existing multiple burdens are now even more difficult to cope with. Numerous interview sequences make it clear that in particular the lack of supervision of children, the expectation to take on educational tasks and the constant workload have led to reconciliation conflicts.

  • “So the work stuff was tricky because obviously exacerbated by the fact that then like, my kids were home. So that was really it was a dark time” (CO_I6, with care commitment). It is clear that single parents in particular found few ways to compensate for the extra workload and lack of resources.
  • “In the beginning it was a very rough transition, as a single mom having two young boys and having to learn how to work from home and homeschool them it was a rough ” (TX_I58, with care commitment). Some interviews also make it clear that administrative institutions, employers and decision-makers are not always able to empathise with the situation of employees or those who qualify themselves and perceive their needs and possibilities.
  • “I noticed, I think a lot of my colleagues assume that our students are sort of 20 years old, like sitting alone in a room with a private office, doing their work like totally uninterrupted. But what I actually saw was that I’ll pay some of my students are also parents, so it’s the same time as my kids were home from school. Their kids are home from school and even … students who … were responsible for their ” (CO_I6, with care commitment). The interviews also make clear that traditional, stereotypical role models have been reinforced or hardened in the changed working and living conditions. For example, some interviewees report perceived expectations and inequalities within their relationship that have manifested themselves with the pandemic situation:
  • “I was expected to cook a whole heck of a lot I really didn’t  like that.   But like, you know,  I think that it was   just, I felt drained at the end of the day.” (CO_I13, with care commitment)
  • “I have been kicked out of my So he is taking over my office and there are times where and he’s loud. He runs all these meetings and stuff and it and I’m upstairs over it and I’m trying to run my class. ” (CO_I16, with care commitment). At the same time, some interview sequences make it clear that the role models were also internalised by the female side and thus handed down. For example, it was reported as a matter of course that the man gets the quieter room and the woman felt responsible for supervising the children while she was at work.
  • “You know, one another world people with the kind of, it was basically my (partner) working upstairs in the office cuz he could shut the door and then me working downstairs because I didn’t want to leave the kids like unsupervised and me taking a meeting with the kids like three feet away from ” (CO_I6, with care commitment)
  • “Even just figuring out like where do you know, especially for my two daughters While I was also having to have classes, while my husband was needing to access introduce them calls for work.” (CO_I25, with care commitment). Some female interviewees were critical of the internalised unequal distribution of work of others involved:
  • “I’m … remember standing on the surgery unit talking to  the nurse and she was like, completely exhaust braided. She says: ‘I’m going to leave here and I have to go home and, you know, do homework with my kids’ and I’m like: ‘where’s your husband?’ I mean she was completely ” (CO_I24, with care commitment)

Compatibility Conflicts

In addition to the described changes in gainful employment and care work, the accompanying conflicts of reconciliation, the perceived burden and also attempts at compensation are addressed.

In one conversation, it becomes clear that the multiply burdened women burdened themselves with self-reproaches of neglecting their children.

  • “Because I became a bad parent because I was always trying to work while I was with my kids which is not good for them … and I just thinking about it all the time.” (CO_I6, with care commitment)

Coping Patterns

Several interviews refer to coping patterns to compensate for the stressful situation. Among the approaches mentioned were better structuring or reorganisation as well as support from other family members. In the case of a solution found, a thoroughly positive attitude towards the changes is evident.

  • “I feel like it has made me a little bit better at making a schedule, planning things.” (TX_I58, with care commitment)
  • “I’m … very lucky to have our aunt living with me and doing a lot of the housework and the cleaning, and just running errands and being a ” (NY_I45)
  • “But the reality of it is is that happening to (my husband) was the greatest thing that could have Because … him being able to be home and do what he did and … with a level of comfort that I may not have had had we both been working” (CO_I24, with care commitment)

Possibility of Infection during the Pandemic

Another aspect that is relevant in the context of women’s perspectives on the influences of COVID-19 and the accompanying measures is the risk of infection. How did the interviewees perceive their own risks of infection and those of their environment? For this purpose, both the objective and subjective risks of infection were considered. It can be seen that interviewees with children speak more extensively about perceived risks.

A comparison of the fields of work to which the respondents (n=65) are assigned shows that the majority work in the interpersonal field (administrative: 13, interpersonal: 29, technical: 2, independent: 9, unknown: 12). Activities in this field of work often involve direct contact with people, which means that the objective risk of infection is also higher than in other occupational classes. The question here  is to what extent an assumed objectively higher risk of infection is also reflected in the perception of the respondents (subjective risk of infection).

Subjective Risk of Infection

The perceived risk of infection becomes clear through several aspects: classification of the general situation, desire for more knowledge, existing fears, perceived risks of specific groups (young childhood, age, occupation, social class, big city), corresponding protective measures.

Several interviews show that the pandemic situation and the possibility of self-disease were classified differently in phases and individually. Public and social media as well as conversations with other people played a major role in the classification of the situation.

  • “I saw more people getting infected, more patients (coming) to the hospitals, and that’s when I said: this is serious.” (NY_I47).
  • “I didn’t think it would impact our life here. …  So  we  didn’t expect it will hit us that ” (NY_I38). Individual conversations point to a desire for more knowledge in order to be able to classify the situation:
  • “At that time there wasn’t a lot of research or knowledge about the pandemic. So you had to take the most cautions most forgotten that you ” (CO_I7)
  • “So I started reading every book I could about an And then I read a book on (the major outbrerakt of Spanish Flu) in (the city) .” (NO_I34)

Along with this, different fears were expressed, especially at the beginning of the pandemic when infection routes, courses and effects were perceived as difficult to assess:

  • “You know in the beginning it was really scary. I’d personally felt like the world was ending. I didn’t know what was going to happen like, … Really like scared me … So I would say the hardest part was the beginning and I guess like the lack of information and the uncertainty and the ” (CO_I4)
  • “People were very afraid. … I was really afraid I remember, this funeral home from Brooklyn, was on the news and they have so many dead bodies that they would just piling up in a truck outside” (CO_I11)
  • “So with COVID-19 at first I didn’t want to go to the store, I was afraid…. For maybe a few months I was just using curbside so I would just order through (a delivery service). I’ve never sanitized my hands so ” (TX_I63, with care commitment)
  • “So my life started to change. I was living a different life. I lived with the fear of going out on the streets. I was afraid of everything that would happen. I thought that every step I took would infect me. I thought everything was already infected … Then everything changed inside me      Before, I lived a free life,     I went out on the street without worrying…. When I go out, I have to remember to take care of myself. I have to go out with a mask, I have to take disinfectant, I have to think about who I approach because for me everyone is infected” (NY_I47).

There are no statements about fears due to inadequate protective measures in the private or work sphere. It can be assumed that comparable positions can be found in a gender-independent consideration. The concerns are based, among other things, on a non-knowledge or a non-controllability and a resulting feeling of powerlessness.

  • “We all want on this (situation) is that was at least one thing I could control You have no control in this whole thing.” (CO_I24, with care commitment)

Objective Risk of Infection

It also becomes clear in the interviews that objectively known risks of infection were known and perceived in the interviewees’ environment. The extent to which this affected the living and working conditions of the interviewees is shown in the following sequences.

One risk that was formulated in the interviews is the perceived risk of infection of newborns and children:

  • “My sister has a baby and she’s been taking it very easy to because she’s doesn’t know how, you know, this would affect the virus would affect the baby of his ” (CO_I20)
  • “I am concerned that (my son) going to you know he does socialized with this local kids that go to school … I chose to go remote ” (CO_I29, with care commitment)

The perceived objective risk of infection of older people in the environment did come up more frequently:

  • “With my family is all here in (X-City) so my parents are 75 … That age, you can easily contracted this disease. So …at the beginning … I stayed away for quite some time.” (CO_I14, with care commitment)
  • “Especially like my elderly family members. I’ve been really concerned about them… just because they’re their immune systems are as strong as they once So it’s a lot of stress on me.” (CO_I8)
  • “Whenever I go visit my grandmother, like, I never hug her anymore and it’s just, like, it’s really sad.” (CO_I8)

The perception of risk of infection in the context of vulnerable groups is probably related to involvement in care work. It can be assumed that comparable concerns were expressed by all people involved in this field. If there is a higher proportion of women here, this is probably related to the higher involvement of women in care work overall.

In addition to the likelihood of infection of people in the environment, the perception of one’s own risk as an older person was also addressed:

  • “At the beginning I thought it was something unimportant, but then I saw the situation was somewhat I saw how people were already getting infected very quickly – and that worried me. Firstly, because I am 60 years old … At my age, my immune system is already weakened, which means it’s a danger for me.“ (NY_I47).

Besides age, social and economic class were perceived as objective risk factors, but this was rather rarely addressed:

  • “Because of their low salary, (some) cannot afford to buy healthy and nutritious So they eat poorly. If they eat poorly, they will be more easily affected by the virus. They will die faster because their immune system is weakened.” (NY_I47).

Very often, respondents raised the perceived risk of infection in relation to their job:

  • “But in my situation with my current job as a sales associate at (a big super market), I am not able to work from home. So, I always have to go in, in-person for my shift and interact with other customers and um people who may potentially carry the ” (“ (TX_I65)

Urban space and cramped situations as a possible risk factor for contracting COVID-19 and how this affects one’s situation was also mentioned several times:

  • “I feel like (the big city) is the worst place that you could be right now, knowing how many people are dying there every ” (NY_I40)
  • “The populations is insane it’s definitely it was definitely very different cuz here I anytime I just need to put my mask I have to be extremely careful.” (CO_I23)

In particular, interviewees from the interpersonal work sector, for whom working from home was not possible and close human contact was part of the job description, reflected on the risk of infection they perceived and described the impact on their work and life situation.

  • “Because being in the medical field, I’m very aware of germs, and I’m an avid handwasher” (NY_I40)
  • “I was worried that I would bring something home and get them sick. I bring my hand sanitizer everywhere. I wash my hands all the time.” (CO_I9)
  • “So coming home we had the standard procedure where he would have me in the back porch and I would take off my He would Lysol my shoes and then he would take my clothes deposit them in a separate bucket and then wash them in hot water to make sure that nothing was coming in the house wasn’t contaminated. And then, I would go right into the shower.” (CO_I24, with Care commitment)
  • “My mom … was working directly with COVID patients because her floor that she work at the hospital was the COVID 4 and that was during the peak of the So, you know, she would come home and we couldn’t, you know, we couldn’t interact with her … She was literally wiping herself down with (a desinfection) that’s just what it took for her to have that piece of mind that she’s not bringing anything home.” (CO_I7)

Summary Table of People Involved

Interview Project Age Care Obligation Single Parent Migration Working Class Working Logic Level of Education
2 Connecticut Up to 20 no no yes Routine Service Worker interpersonal Apprenticeship
3 Connecticut 31-40 yes no no Sociocultural expert interpersonal Academic Profession
4 Connecticut 21-30 no no no Lower management administrative Semi-Profession
5 Connecticut 21-30 no no no Lower management administrative Semi-Profession
6 Connecticut 31-40 yes no no Sociocultural expert interpersonal Academic Profession
7 Connecticut 21-30 no no yes Independent Professional independent Academic Profession
8 Connecticut 21-30 no no no Sociocultural Semi-Profession interpersonal Semi-Profession
9 Connecticut 31-40 no no no Lower management administrative Semi-Profession
10 Connecticut 21-30 no no no Lower management administrative Semi-Profession
11 Connecticut 51-60 no no no Sociocultural expert interpersonal Academic Profession
12 Connecticut 21-30 no no no Lower management administrative Semi-Profession
13 Connecticut 51-60 yes no no Lower management administrative Semi-Profession
14 Connecticut 51-60 yes no no Sociocultural Semi-Profession interpersonal Semi-Profession
15 Connecticut 21-30 no no no Skilled Service Worker interpersonal Training Profession
16 Connecticut 41-50 yes no no Sociocultural expert interpersonal Academic Profession
17 Connecticut 21-30 no no no Skilled Service Worker interpersonal Training Profession
18 Connecticut Up to 20 no no no Training interpersonal Academic Profession
19 Connecticut 21-30 no no no Training interpersonal Academic Profession
20 Connecticut 21-30 no no no Skilled Service Worker interpersonal Training Profession
21 Connecticut 21-30 no no no Skilled Service Worker interpersonal Training Profession
22 Connecticut 21-30 no no no Sociocultural expert interpersonal Academic Profession
23 Connecticut 21-30 no no no Routine Service Worker interpersonal Apprenticeship
24 Connecticut 51-60 yes no no Skilled Service Worker interpersonal Training Profession
25 Connecticut 51-60 yes no no Sociocultural expert interpersonal Academic Profession
26 Connecticut 21-30 no no no Sociocultural expert administrative Academic Profession
27 Connecticut 51-60 no no no Sociocultural expert interpersonal Academic Profession
28 Connecticut 51-60 no no no Entrepreneur independent Academic Profession
29 Connecticut 31-40 yes yes no Lower management administrative Semi-Profession
32 New Orleans 51-60 yes yes no Upper management administrative Academic Profession
33 New Orleans 41-50 yes no no Independent Professional independent Academic Profession
34 New Orleans 41-50 no no no Upper management administrative Academic Profession
35 New Orleans 51-60 no no yes Independent Professional independent Academic Profession
36 New Orleans 41-50 yes no no Upper management administrative Academic Profession
37 New Orleans 41-50 no no no Skilled Service Worker interpersonal Training Profession
38 New York 51-60 no no yes Small Business without employees independent Training Profession
39 New York 21-30 no no no Training unknown Training Profession
40 New York 51-60 no yes no Technicale Semi-Profession technical Semi-Profession
41 New York 51-60 yes no no Unknown unknown Unknown
42 New York 61-70 no no no Routine Service Worker interpersonal Apprenticeship
43 New York 51-60 no no no Small Business without employees independent Training Profession
44 New York 21-30 no no no Training administrative Academic Profession
45 New York Over 81 no no no Unknown unknown Unknown
46 New York 71-80 no no yes Sociocultural Semi-Profession interpersonal Semi-Profession
47 New York 61-70 no no yes Routine Service Worker interpersonal Apprenticeship
48 Texas 31-40 yes no no Sociocultural Semi-Profession interpersonal Semi-Profession
49 Texas 21-30 yes no no Sociocultural Semi-Profession interpersonal Semi-Profession
50 Texas 21-30 no no yes Small Business without employees independent Training Profession
51 Texas 21-30 no no no Small Business without employees independent Training Profession
52 Texas Up to 20 no no no Training unknown Academic Profession
53 Texas 21-30 no no no Routine Office Worker interpersonal Apprenticeship
54 Texas 21-30 yes no no Lower management administrative Semi-Profession
55 Texas 21-30 no no no Training unknown Academic Profession
56 Texas 41-50 yes no no Sociocultural Semi-Profession interpersonal Semi-Profession
57 Texas 51-60 no no yes Sociocultural Semi-Profession interpersonal Semi-Profession
58 Texas 31-40 yes no no Facharbeit technical Training Profession
59 Texas 41-50 yes no yes Sociocultural Semi-Profession interpersonal Semi-Profession
60 Texas Up to 20 no no no Training unknown Training Profession
61 Texas 31-40 yes no yes Sociocultural Semi-Profession interpersonal Semi-Profession
62 Texas 51-60 yes no yes Sociocultural Semi-Profession interpersonal Semi-Profession
63 Texas 41-50 yes no no Skilled Service Worker interpersonal Training Profession
64 Texas 21-30 no no no Training unknown Academic Profession
65 Texas 21-30 no no no Routine Service Worker interpersonal Apprenticeship
66 Texas 21-30 no no no Routine Service Worker interpersonal Apprenticeship
67 Texas Up to 20 no no no Routine Office Worker interpersonal Apprenticeship

Psychosocial Stress and Borderline Experiences

Among the most far-reaching influences in the context of the pandemic situation and the restrictive measures are the psychosocial stresses that the interviewees perceived and expressed directly or implied indirectly. These had an impact on the living and working environment of the interviewees. The statements on this concentrated mainly on three areas: Stresses or borderline experiences in the social environment, at work and in society.

Stresses and Strains in the Social Environment

The central burdens and borderline experiences mentioned are those in the social environment; here above all: the restriction of social contacts, the restriction of freedom of movement, isolation (own, others), lack of social support, fear of self-infection, infecting others as well as experiences of illness and death.

Most of the statements on restrictions of family and general social contacts concern the environment of extended family and friends. It is observed that normalities, bonds and dynamics shift greatly as a result:

  • “I’m with my mom and dad. I’m an only child. So, it’s just You miss interacting with other people.” (NY_I44)
  • “I would spend more time actually with my immediate family um but less time with my extended family … and that would kind of affect um our ” (TX_I65)
  • “So it was hard because my family … hasn’t even met (my newborn son) and that’s like insane, you know … but it’s just really affected like how he’s growing ” (CO_I20)
  • “Haven’t had much of a social life in the last, you know, since pandemic started.” (CO-I4)

Some interviewees perceive the restrictions on freedom of movement and leisure life as burdensome:

  • “We had to stay quarantined. It was really tough cause there wasn’t much to do but, I had to cope with it cause I’m an outdoor person. It was ” (TX_I67)
  • “We’re never going to be able to go anywhere ever again because of all this you know I mean like I want to go to Italy again. I’ve been saying that you know forever and I’m sitting here going to get to Italy before that or ” (CO_I24, with care commitment)
  • “So I’m afraid to go outside, so much so that I don’t want to go outside at all I have to disinfect all the products I buy, I have to disinfect myself. I have to be careful not to bring the virus into my house   In other words, it is a drastic change. For me, my life has stopped. It has stopped  In other words, my life is no longer my life.” (NY_I47).

Non-voluntary isolation measures when ill are perceived as a very strong burden. Respondents describe feelings of being locked up and a fear of loneliness:

  • “It was just a toll mentally just not being able to really do anything … and like kind of felt like you were in a box. … I think a lot of people felt that ” (CO_I21)
  • “That’s really scary. And there was nobody like, not a soul, which really like made it even more But it was like I was really, really alone. And it did have a fax on like my mental state and my moods every day and it was just like, upsetting because I will talk to people and I would be happy and I’m going to have to hang up and then I was back being alone and it was just really upsetting and it wasn’t didn’t feel the same as going back into the quarantine.” (CO_I18)

The isolation imposed on sick and dying people is perceived     as equally overwhelming, regardless of whether the respondents were directly affected by it or not. This situation also put a strain on caregivers, as shown below:

  • “I do have a friend who’s father passed away, …Well he had detected, or was, he found out that he had this Coronavirus. And they took her home, they wheeled her out, she waved goodbye, and that was the last she saw of him and two days later he died. And I think, I think with this virus, the sad part of it all is, is, you know, they end life alone. So I think it’s kind of like a lonely disease and ” (NY_I42). One thing that the interviewees express as a very intense burden is the experience of illness and death in their immediate and extended environment:
  • “It’s been such hard year, hard for First of all, my family got infected, all my kids got infected, my husband got infected, I got infected … it was such a bad time. And it is crazy because I always tried to protect my family by not taking them nowhere, just stay home and we still got infected, this is crazy … I always try be safe and take care that way we don’t get the virus but we still got it.” (TX_I59, with care commitment)
  • “When I tested positive, my first thought was I’m going to be alone for 2 weeks, which I was really scared.” (CO_I18)
  • “Well, it affected me I nearly lost my life to coronavirus” (TX_I61, with Care Commitment).
  • “It was difficult. It was sad. It was heart wrenching. We lost family members. All of a sudden, I lost a very good friend and coach. … So that hurts my ” (TX_I62, with care commitment)

Stress at Work

Another area to which the perceived stress related is the occupation. Aspects cited included excessive workload, the possible far-reaching consequences of professional actions, job insecurity, and borderline experiences in professional activities. Several interviews address the perceived time pressure and increased workload due to the urgency of the situation:

  • “But it was just like all the sudden we had one day to, you know, figure it all out.” (CO_I11)
  • “Covid made us have to work very, very I mean, there were weeks where we were working here. Um, we were running around frantically for, for weeks at a time. You know, this was like a every day was just, um, like a frantic day. And we were getting used to working like that when your adrenaline just at such a high level and it just never let up. I feel like we never even could take a breath to just kind of regroup and say, oh my goodness, it just, it never stopped.” (NO_I32, with care commitment). Another perceived burden was the possible far-reaching consequences of professional actions in combination with the urgency required, existing ignorance or existing overload.
  • “And there was so much that we did not know about this virus and we were making decisions on the fly with presumptions about what this virus might This is scary.” (NO_I33, with Care Commitment)
  • “The hardest decisions came around the increasing number of deaths … and recognizing that, um, there was a point when there would be, um, multiple cardiac arrest and we did not have enough employees to respond to the other calls. We also had to look at our medical, um, responses and decide how likely is survival after a certain period of … We did have to modify our protocols and that was hard.” (NO_I33, with care commitment)

For several interviewees who worked in precarious or semi- skilled jobs, another aspect that was perceived as very stressful was the perceived pressure of impending dismissal and unemployment:

  • “Last year I was working as a waitress, I couldn’t even work at that moment because all the restaurants and bars were closed, and it was bad, really ” (TX_I59, with Care Commitment).
  • “I believe it was May that entire office actually, with us, for offices, with investing company and all four offices laid off their stuff. So that was I think probably the most impactful way that the coronavirus has affected me and my So that was really hard to take.” (CO_I7)
  • Existential borderline experiences resulting from the professional activity, such as accompanying dying people and their relatives, appear to be particularly drastic:
  • “And these people would call … the hospital and know, their family members are dying and the only time that you would be able to come in as if they were making a decision to take somebody off life support, they let you come in and say goodbye to the ” (CO_I24, with Care Commitment)
  • “I got the iPad out, and I (asked my colleagues, to) work for me, so that I could (speak) with the family  And I said to  (the patient): ‘You know, you hear your family.’ I just tried to allay their fears and let them know that I was doing everything I could to make sure that she was peaceful so they could have peace.” (CO_I24, with care commitment)

Burdens on Society

In addition to the perceived stresses in the social and professional environment, psychosocial stresses were also formulated in relation to society. The aspects addressed include: unforeseen changes, the experience of social boundaries as well as the experience of social division.

Several interviewees mentioned that the suddenly changed circumstances and the experience of uncertainty were stressful for them.

  • “I’m… everyday I’m kinda panicked too because I don’t know how long I have to work at home.” (NY_I38)
  • “So everyone was kind of uprooted for sure. And fast like everyone had to kind of figure out what to do right ” (CO_I9). Likewise, the changing public discourse and the experienced social division were among the challenges mentioned:
  • “If I was to compare this to anything, it would be like another civil war, because Americans are fighting with each other over human rights, and they’re on either side of the ” (TX_I51)
  • “Another stressful factor mentioned was the experience of the limits of the social system:
  • “This pandemic also show our country does have weakness, too. The system–it’s not as effective as we thought. We’re not as strong as we ” (NY_I38)
  • “So like, we are in a new normal.” (CO_I20)
  • “I would tell future generations about this pandemic to not trust everything you may have read on social media and to listen reliability to credible sources … I think when history writes about COVID, it is going to write about as us as a society and as a global entity how we failed a little bit in our responses and how ill prepared we were.” (TX_I56, with care commitment)

Discussion and Reflection

The COVID 19 pandemic had a  far-reaching  social  impact,  not only in its early phase. This paper explored the impact of the pandemic situation and coping measures on individual lives, looking at the perspectives of women in the United States. In order to capture female perspectives, the effects of COVID-19 and coping measures on women’s everyday lives were examined using three aspects as examples: the reconciliation of gainful employment and care work, perceptions of the risk of infection, and psychosocial stress and borderline experiences.

Based on a secondary analysis of topic-related interviews from four oral history projects, the perceived lifeworld effects of the COVID 19 pandemic were recorded and analysed. For a networked view of the multiple effects of the COVID 19 pandemic, this paper draws   on Oesch’s class analytic model [37]. It shows that an overwhelming proportion of interviewees work in the interpersonal sector, i.e. professions that, according to Oesch [37], are mainly occupied by women.

According to Holst et al. [21,22], women are significantly overrepresented in the four interpersonal labour force classes and in the two lower administrative labour force classes; men, on the other hand, dominated mainly the technical labour force classes and the upper administrative as well as independent labour force classes. These factors were given little consideration in the pandemic mitigation measures [23,25,31,41,45]. The associated effects become clear in the individual experience of the respondents.

For example, the lockdown of almost all social sectors that were not considered relevant to the system – such as crèches, kindergartens, schools, cultural offerings – and the simultaneous working from home made it difficult to reconcile gainful employment and care work. Many respondents, especially single parents or mothers of small children experienced the situation as precarious

According to Bukof, the difficulties that arise in the pandemic situation manifest themselves in a multiple burden on women of     all social status groups with children due to simultaneous home schooling, hardly sufficient emergency care, rarely partnership-based solutions and the privatisation of the care problem [9].

Suphan’s research also points to these problems. The following were cited as burdensome: Childcare closures and homeschooling, the need for childcare while working, a constant sense of insecurity, a perceived disadvantage at work due to parental responsibilities. Suphan states a decreased possibility for women to combine gainful employment and care work [52].

These aspects are also reflected in the interviews analysed. With regard to the question of reconciling life-supporting and caring tasks, the interviewees describe above all perceived changes in behaviour and hygiene rules, dismissals or training  discontinuations  due  to the pandemic, effects on employees in the low-wage sector and in part-time jobs, the transfer or placement of professional activities in the virtual sphere, the dissolution of work boundaries, experienced externally expected and internalised role models, non-reconciliation of family and work and the associated reactions.

Several interviewees describe how the impact of COVID-19 directly affects their precarious employment status. Several interviewees also report on dismissals and leaves of absence, the resulting consequences and the pressure that arises from the threat of dismissal alone. In the interpretation, however, it must be taken into account that all people, regardless of gender, suffer from precarious employment and living conditions when they are affected by them.

On the question of reconciling care and gainful employment, Holst et al. point out that the gender and age of the children (and thus of the parents) are relevant. Thus, women, regardless of their socio- economic position, have a significantly higher risk of experiencing conflicts between gainful employment and care work. Holst et al. describe social inequalities in the management of reconciliation conflicts: For example, the lower interpersonal and technical classes could hardly work from home and were more dependent on people from the social network to organise the care of their children in times of closed childcare facilities [21,22].

Current research notes that mobile working can increase inequality [30]. Arndt et al. describe a general increased burden due to, among other things, the simultaneity of private and professional life, heterogeneous individual starting points and technical infrastructures [4].

Bukof describes an associated potential for disadvantage and discrimination in several areas. For example, women often have poorer equipment and access, and students and employees in lower wage groups are also at a disadvantage [9]. Access to information and the dissolution of boundaries between private space and work are also described.

Suphan notes changes in working hours, the place of work and work processes [52]. For example, the journey to the workplace would be saved, but mobile working would significantly increase  the difference between contractually fixed and actual working time. Thus, home office increases the spatial and temporal dissolution of boundaries through constant presence. Communication is strongly objectified with a simultaneous lack of personal contact.

Similar results can also be seen in the oral history interviews. In the qualitative interviews analysed here, it becomes apparent that mobile working has ambivalent effects from the perspective of the interviewees. Although this offered protection against infection and significantly reduced commuting, several affected persons describe experienced problems (dissociation, permanent accessibility) depending on their housing and living situation and their technical resources. Respondents in lower income brackets seemed to be more affected by the resulting social inequalities, and they also saw less scope to implement alternative family role models. In particular, working mothers of younger children, single parents and women in cramped living conditions found it difficult to achieve an improved work-life balance through mobile working. It was pointed out several times that working from home and childcare, and parallel homeschooling, are difficult to reconcile. In some cases, support from the social network was able to compensate for major challenges, but the experienced situation often brought parents of young children to the brink of overload. In this context, it should be further investigated to what extent effects related to mobile working had an additional influence on the pandemic experience.

Another aspect that was considered was the perceived risks of infection. In general, it can be said that individual perceptions differ less according to the level of education and more according to social environment and work logics. The perceived risk of infection could be examined through several aspects: Understanding of the seriousness of the situation, level of information, existing fears, classification of infection risks in young childhood, age, depending on occupation, social class, living environment and enabled protective measures.

The  qualitative  interviews  indicate  that  a  broad  awareness  of pandemic-related health risks was raised by people from the interpersonal work environment. There were hardly any statements about the lack of protective measures at the workplace. In addition  to people from the interpersonal work sector, interviewees living in urban areas in particular commented on their perceived increased risk of infection due to the sometimes cramped situations in public spaces in large cities.

In addition to the aspect of the risk of infection, the psychosocial burden associated with the pandemic and the restrictive measures was considered. In the area of health, Bukof notes an increase in physical and psychological stress, the emergence of fundamental fears as well as the very different recognition of risk patient status [9]. In the area of organisational processes, Bukof points to a perceived low level of problem awareness at management level, non-transparent decisions and processes, and a lack of anchoring and implementation of equal opportunities measures [9]. The oral history interviews focused on the following areas in particular: social environment, profession and society.

The stressful aspects in the social environment mentioned in the interviews seem to be less gender-specific. The frequently mentioned burdens include the restriction of social contacts, the restriction of freedom of movement, isolation (own, others), lack of social support, fear of self-infection, infecting others as well as experiences of illness and death. The experience of domestic violence was not directly discussed in the interviews; this may be due to the fact that the problem is generally not dealt with openly and at the same time was not directly asked about. In order to obtain reliable data on this, the interviews studied so far would have to be supplemented in the analysis with written sources from violence protection outpatient clinics.

According to Holst, the pandemic-related health risks found  their focus in the interpersonal work logic, the economic burdens of the pandemic measures mainly affected the self-employed and technical classes and the pandemic-related mobile work mainly affected the administrative area [21]. The interviews reflect Holst’s horizontally differentiated distribution of work-related burdens and risks. The psychosocial burdens formulated here, which related to the job, dealt with excessive workload, far-reaching consequences of professional actions, job insecurity as well as borderline experiences in professional activities. Since the interviewees work to a large extent in the interpersonal field, there were several women in caring, therapeutic and medical professions among the interviewees who were very stressed by the pandemic situation.

Psychosocial stress in relation to society included, in particular, stress due to unforeseen changes, the experience of social boundaries and the experience of social division.

The captured memories of individual experiences in the COVID 19 pandemic show how the pandemic and the implemented containment measures were perceived. Most of the interviews were conducted between the second quarter of 2020 and the first quarter of 2021, i.e. in a phase in which restrictive measures were very topical and recently implemented, depending on the region, and further developments were not foreseeable. The interviews thus depict perceptions that arose from this situation. On the one hand, this means that the memories  of the events and processes are still very present. On the other hand, it also means that some measures and the problems associated with them might have been understood differently over time, that  an inner distance from some situations would be more likely and that relativization or even glorification could also occur. This must be taken into account when interpreting the statements.

Because the selection of interviews for the secondary analysis   is not based on random sampling, it cannot be guaranteed to be representative of all women in the United States. Nevertheless, the author is convinced that the present dataset can show clear trends.

The oral history projects included here differ not only in terms of the researchers, target groups and scientific interests, but also in their questions. In addition, different project designs were implemented. For these reasons, the interviews are not directly comparable, but they can provide an overarching perspective and illuminate specific focuses. This was used in such a way that the various interviews can complement each other. When classifying the interview sequences, it must therefore be taken into account that the statements were made in the context of different projects and the interviewees answered questions on the topic considered here less directly. At the same time, the sample offers a rich fundus that allows insights into the personal perspectives of women on experiencing the pandemic and the changes it has brought about.

The present analysis is only a cautious approximation. It became clear that those surveyed perceived the early phase of the pandemic as a collective experience: the uncertainty about the future and their own dismay from a possible infection made their personal socio-economic situation clear to those affected.

Conclusion

The analysis of the perceived life-world effects has shown that the changes caused by the pandemic have had a far-reaching influence. They affected personal contact with one another, the conditions of gainful employment and care work and, in the case of compatibility conflicts, became a factor that increased inequalities. Based on a secondary analysis of oral history interviews, the perceived impact of the COVID-19 pandemic on everyday life was recorded and the assumed relevance of gender and pandemic experience was discussed. A better understanding of the situation can serve as a basis for needs- based support and necessary political measures in the further course of the pandemic under consideration and future epidemic events. Even if it can only be verified in a long-term study, it can be assumed that the pandemic situation has made it more difficult for women to reconcile gainful employment and care work and career paths [12].

The differentiation of the pandemic effects according  to Oesch’s class scheme offers an extended approach to understanding pandemic inequalities. The results also show the analytical benefit  of the qualitative approach of oral history to determine individual perspectives on pandemic experiences. The qualitative interviews allow a direct insight into the individual perceptions and classifications. The utterances contain different levels of reflection – some sequences refer to personal experiences, others anticipate other experiences and others reflect on a meta-level. Access via the oral history shows the extent to which COVID-19 and the coping measures associated with the pandemic affected practically all areas of life of the interviewees included in the study. In particular, the aspects of the compatibility of paid work and care work, perceived risks of infection and experienced psychosocial stress made it clear that people who  perform  care work were particularly affected by the pandemic situation and the associated restrictive measures. It seems that the pandemic and the restrictive measures that have accompanied it have increased social inequalities. In order to be able to name the multiple, intertwined dimensions of inequality more clearly in this context and to be able to make meaningful recommendations for future pandemic plans, it is important that future research looks for alternative approaches to analyze the problems perceived by the interviewees. The long-term consequences can also only be mapped out at a later point in time, but it is already clear how far-reaching the pandemic experience is affecting gender inequality.

Sources

  • Fairfield: Interview 2-29, “Covid-19 Oral History”, 2020, Sacred Heart University, https://digitalcommons. sacredheart.edu/Covid19-oralhistories/
  • New Orleans: Interview 32-37, “From the Front Narratives of the COVID-19 Pandemic in New Orleans”, 2020/21. https://www.hnoc.org/research/front-line- narratives-COVID-19-pandemic-new-orleans
  • New York: Interview 38-47, “Columbia University student COVID-19 oral history collection, 2020”, 2020, Columbia Center for Oral History, New https://oralhistoryportal. library.columbia.edu/document.php?id=ldpd_14966338

Texas; Interview 48-68, “Covid-19 Oral History Project”, 2020, Texas A&M University, San Antonio. https://digitalcommons.tamusa. edu/hist1302_spring2021/

References

  1. Adams-Prassl A, Boneva T, Golin M, Rauh C (2020) Inequality in the Impact of the Coronavirus Shock: Evidence from Real Time Journal of Public Economics 189: 104245.
  2. Amano-Patiño N, Faraglia E, Giannitsarou C, Hasna Z (2020) Who is doing new research in the time of COVID-19? Not the female economists. https://econpapers. repec.org/bookchap/cprebchap/p332-19.htm
  3. Aristovnik A, Keržič D, Ravšelj D, Tomaževǐ D, Umek D (2021) Impacts of the COVID-19 Pandemic on Life of Higher Education Students: A Global Perspective. Sustainability 12: 8438. [crossref]
  4. Arndt C, Ladwig T, Knutzen S (2020) Zwischen Neugier und Verunsicherung. Interne Hochschulbefragung von Studierenden und Lehrenden im virtuellen Sommersemester
  5. Babitsch B (2008) Die Kategorie Geschlecht: Theoretische und empirische Implikationen für den Zusammenhang zwischen sozialer Ungleichheit und Gesundheit. In Richter M, Hurrelmann K (eds.) Gesundheitliche Ungleichheit. Grundlagen, Probleme, Perspektiven. Wiesbaden: VS 2008: 283-299.
  6. Bergman J, Ballin M, Nordström A, Nordström P (2021) Risk factors for COVID-19 diagnosis, hospitalization, and subsequent all-cause mortality in Sweden: a nationwide European Journal of Epidemiology 36: 287-298. [crossref]
  7. Bohnsack R (2014) Rekonstruktive Sozialforschung: Einführung in qualitative Methoden.
  8. Boniol M, McIsaac M, Xu L, Wuliji T, Diallo K, Campbell J (2019) Gender equity in the health workforce: analysis of 104 countries. Working paper 1. Geneva: World Health
  9. BuKoF (ed.) (2020) Geschlechterpolitik in Zeiten von Corona – Ergebnisse einer Umfrage unter den Frauen- und Gleichstellungsakteur*innen der außeruniversitären Forschungsorganisationen und Hochschulen. https://bukof.de/wp-content/ uploads/20-07-01-Ergebnisse-Umfrage-AG-Geschlechterpolitik-in-Zeiten-von- pdf
  10. CSDH − Commission on Social Determinants of Health (ed.) (2008) Closing the gap in a generation: Health equity through action on the social determinants of Final Report of the Commission on Social Determinants of Health. Geneva.
  11. Dahlgren G, Whitehead M (1991) Policies and strategies to promote social equity in health. Stockholm: Institute for Future
  12. Degele M (2020) Homeoffice und Heimarbeit. Gender in der Corona-Krise. Soziopolis. Gesellschaft
  13. Dragano N, Rupprecht C, Dortmann O, Scheider M, Wahrendorf M (2021) Higher risk of COVID-19 hospitalization for unemployed: an analysis of 1,298,416 health insured individuals in Bundesgesundheitsblatt – Gesundheitsforschung – Gesundheitsschutz 64: 314-321.
  14. Elmer T, Mepham K, Stadtfeld C (2020) Students under lockdown: Comparisons of students’ social networks and mental health before and during the COVID-19 crisis in PLoS ONE 15: 1-22. [crossref]
  15. Gamper M, Seidel J, Kupfer A, Keim-Klärner S, Klärner A (2020) Geschlecht und gesundheitliche Ungleichheiten – Soziale Netzwerke im Kontext von Gesundheit und Gesundheitsverhalten. In: Klärner A et al. (eds.) Soziale Netzwerke und gesundheitliche Ungleichheiten. Wiesbaden 2020: 273-307.
  16. Haag H, Gamper M (2022) “Wenn’s nirgendwo so richtig stimmt“– Einblicke in qualitative Forschung zu Hochschulkarrieren und Elternschaft unter Corona- Bedingungen. Femina Politica 2: 132-136.
  17. Haag H, Kubiak D (2022) Hochschule in krisenhaften Zeiten. Eine qualitativ- explorative Studie zum Erleben der COVID-19-Pandemie unter Hochschullehrenden und Studierenden. Gewerkschaft Erziehung und Wissenschaft.
  18. Hartmann T, Dahm J, Krell C (2020) rausgeblickt: Teresa Bücker. Pandemie und Geschlechter. Ein Gespräch über eine feministische Bonn 2020.
  19. Hipp L, Büning M (2020) Parenthood as a driver of increased gender inequality during COVID-19? Exploratory evidence from European Societies 23: 658- 673.
  20. Fessler A, Holst H, Niehoff S (2021) Corona und die Arbeitswelt der Zukunft: von der gesellschaftlichen (Un-)Sichtbarkeit des Leidens an der Pandemie. In: Filipič U, Schönauer A (eds.) Ein Yes hr Corona: Ausblick Zukunft der Wien 2021: 8-20.
Neuroprotective Effects of a Serotonin Receptor Peptide Following Sham vs. Mild Traumatic Brain Injury in the Zucker Rat

DOI: 10.31038/EDMJ.2023731

Abstract

Aims: Accelerated cognitive decline frequently complicates traumatic brain injury. Obesity and type 2 diabetes mellitus drive peripheral inflammation which may accelerate traumatic brain injury-associated neurodegeneration. The Zucker rat harbors G-protein coupled receptor agonist IgG autoantibodies and in vitro neurotoxicity caused by these autoantibodies was prevented by a novel synthetic fragment of the serotonin 2A receptor. The aim of the present study was to test whether genetic obesity manifested in Zucker diabetic fatty rat is associated with greater spatial memory impairment before and after mild traumatic brain injury compared to Zucker lean rats. Furthermore, we investigated whether these neurodegenerative complications can be lessened by administration of a novel putative neuroprotective peptide comprised of a fragment of the second extracellular loop of the serotonin 2A receptor.

Methods: Age-matched lean and fatty diabetic Zucker rats were tested in the Morris water maze (spatial memory) prior to receiving a sham-injury or lateral fluid percussion (LFP) mild traumatic brain injury. Behavioral testing was repeated at 1-week, 1-month, and 3-month intervals following injury. A synthetic peptide consisting of a portion of the 5-hydroxytryptamine (serotonin) 2A receptor (2 mg/kg) (vehicle, or an inactive scrambled version of the peptide (2 mg/kg)) was administered via intraperitoneal route every other day for 7 days after sham or LFP injury to lean rats or 7 days before and after sham or LFP injury to fatty rats.

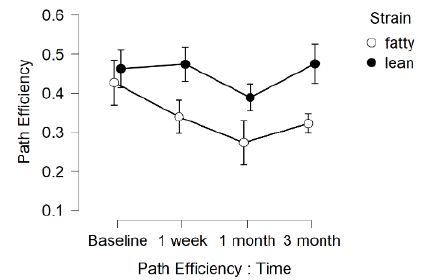
Results: Mild traumatic brain injury impaired recall of spatial memory in fatty and lean rats. Zucker fatty rats subjected to sham-injury or mild TBI experienced a significantly greater longitudinal decline in recall of spatial memory compared to lean Zucker rats. A synthetic peptide fragment of the 5-hydroxytryptamine 2A receptor significantly enhanced acquisition of spatial learning and it appeared to strengthen recall of spatial learning (one-week) after sham injury in Zucker rats.

Conclusions: These data suggest that the Zucker diabetic fatty rat is a suitable animal model to investigate the role of metabolic factor(s) in accelerated cognitive decline. A novel synthetic peptide comprised of a fragment of the second extracellular loop of the human serotonin 2A receptor appeared to have neuroprotective effects on both acquisition and recall of spatial memory in subsets of Zucker rats, with relatively greater benefit in sham-injured, lean Zucker rats.

Introduction

Cognitive dysfunction increases substantially following Traumatic Brain Injury [1] (TBI) contributing to substantial morbidity and mortality in affected persons. Peripheral and central inflammation drive neurodegeneration via activation of innate and adaptive immune mechanisms which may target (in part) neurovascular antigens released during traumatic brain injury. Owing to a global epidemic of obesity and type 2 diabetes mellitus [2], lifetime TBI-sufferers having metabolic derangements associated with peripheral inflammation may be at increased risk for experiencing certain neurodegenerative complications [3].

The Zucker diabetic fatty rat (ZDF) is a model of morbid obesity, type 2 diabetes mellitus and hypertension [4] which exhibits high level of innate immunity, i.e. pro-inflammatory cytokines [5]. Previously, we reported spontaneously-occurring neurotoxic agonist autoantibodies targeting the 5-hydroxytryptamine (serotonin) 2A receptor in plasma from both ZDF rat and Zucker lean rat (ZLR) sub-strains with the ZDF rats having persistently high level at 5 months of age [6]. The serotonin 2A receptor is a known treatment target in major depressive disorder and Parkinson’s disease, two neurodegenerative complications following TBI. Here we tested for changing in the acquisition and/or recall of spatial learning in substrains of Zucker fatty and lean rats following mild TBI (induced by lateral fluid percussion) or sham injury.

In addition, a putative neuroprotective peptide comprised of a 5-hydroxytryptamine (5HT) 2A receptor second extracellular loop region fragment was effective in preventing in vitro neurotoxicity caused by autoantibodies targeting the serotonin 2A receptor from both ZDF rat plasma [6] and human neurovascular disorders plasma [7]. Therefore the efficacy of this peptide in modulating TBI- (or sham-injury associated spatial memory impairments in fatty and lean Zucker rats was tested. The mechanism of the action of the 5HT2AR peptide fragment was explored using alanine substitution of key functional amino acid residues.

Materials and Methods

Peptides

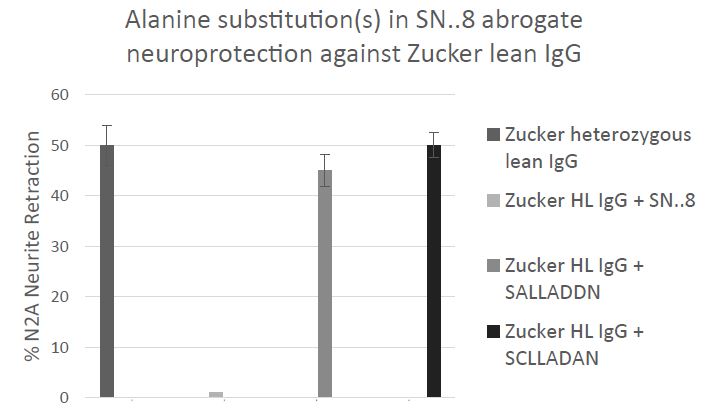
A linear synthetic peptide, SCLLADDN (SN..8 or “P4”) having a sequence identical to that of a fragment of the second extracellular loop region of the human 5-hydroxytryptamine 2A receptor was synthesized at Lifetein, Inc (Hillsborough, NJ) and had ≥95% purity. Substitutions of SCLLADDN containing a single alanine amino acid replacement, e.g. SALLADDN, SCLLADAN were synthesized at Lifetein, Inc (Hillsborough, NJ) and had purity of ≥95%. A “scrambled” peptide containing the same amino acids as SCLLADDN had a sequence of LASNDCLD (LD.8) and a purity of 96.37%, MW 849.91. The lyophilized peptides were stored (in the presence of dessicant) at −40 degrees C prior to use. On the day of an experiment, an aliquot of lyophilized peptide was reconstituted in sterile saline at the indicated concentration. Reconstituted peptide(s) were prepared fresh before each experiment.

Animals

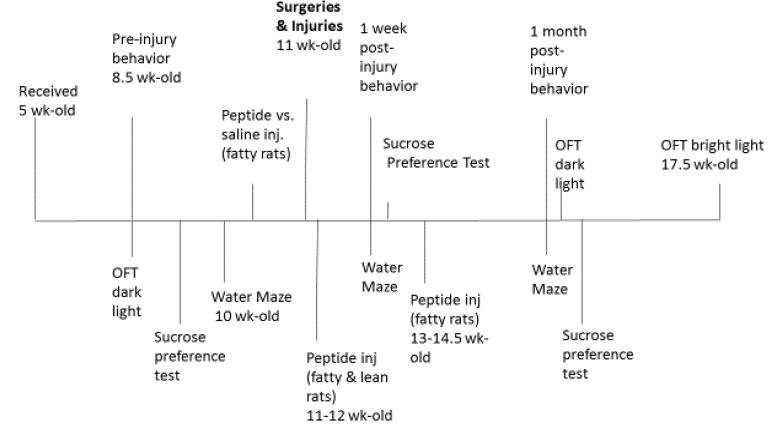
All procedures were conducted according to the National Institutes of Health (NIH) Guide for the Care and Use of Laboratory Animals and approved by the Institutional Animal Care and Use Committee of the Veterans Affairs Medical Center (East Orange, New Jersey). Male ZDF (fa/fa) and lean (+/?) Zucker rats were obtained from Charles River Laboratories (Kingston, NY) at approximately 6-7 weeks of age. All rats were single housed upon arrival, with modest enrichment (a PVC tube). Rats were provided ad libitum access to food and water and maintained in a 12 h light/dark cycle with lights on at 0630. All procedures occurred during the light phase of the circadian cycle and a timeline of procedures is shown in Figure 1. Results of the open field test (OFT) for anxiety-like behavior and sucrose preference test results (a measure of anhedonic behavior) are not reported here.

fig 1

Figure 1: Timeline of treatments, exposures and behavioral assessments in Zucker rats

Injections

Peptide (SN..8 or LD.8) was dissolved in sterile saline (2 mg/kg) and SN.8 peptide vs. vehicle (sterile saline) or LD..8 peptide intraperitoneal (IP) injections were administered every other day according to the schedule shown in Figure 1. Peptide (SN.8) (vs. saline or LD..8) injections commenced 1-week prior to surgery/injury in ZDF rats to prevent (excess) acute post-injury mortality in ZDF rats thought to be related (in part) to pre-injury moderate hypertension. The peptide SN..8 was previously reported to substantially lower blood pressure in the ZDF rat [8].

Surgeries/Injury

All animals underwent a surgical procedure to attach a luer-lock connector to a craniectomy, positioned either on the left or right parietal bone plate. Rats were anesthetized with 1-4% isoflurane (5 L/min O2 for 60 s) and transferred to a stereotactic instrument with 1-4% isoflurane mixed with 1-1.5 L/min O2 delivered via a nosecone to maintain anesthesia throughout the surgery. A craniectomy (2 mm in diameter, centered at 3 mm posterior to bregma and 3.5 mm lateral to midline) was made in the skull and super glue was used to secure a luer-lock connector around the edge of the craniectomy. A plastic cylinder (cut from a 10 mL syringe) was placed on the skull surrounding the luer-lock connector; this was placed to provide stability and protect the area around the craniectomy. Dental cement was used to fill the space in between the connector and the plastic cylinder. A small amount of sterile saline was deposited into the connector along with a small piece of Kimwipe to keep the dura clean of debris.

One day following implantation of the surgical hub, fluid percussion injury is achieved with a device using a computer-controlled voice-coil to deliver defined pressure waves to the dura through a water piston [9]. Water is first placed in the surgical cap to prevent any air displacing the pressure waves. Rats were anesthetized with isoflurane in an induction chamber followed by fluid percussion injury or sham. The injury procedure occurs one day after surgery to prevent the dura from drying out and thereby reducing the injury of the brain tissue. Mild to moderate severity TBI will occur at pressure amplitudes of 20-30 psi (±3 psi) and rates of rise between 10-20 ms. To reduce the effects of anesthesia as much as possible, rats are connected to the device by the syringe hub and allowed to recover from anesthesia until they respond lightly to a foot pinch before injury occurs. Therefore, the rats were lightly anesthetized at the time of injury. Sham rats are treated the same way as injured rats including isoflurane anesthesia and connection of the device to the rat, but the pressure wave was not delivered. The animal is monitored for startle in response to the pressure wave and then placed on its back in a recovery cage and evaluated for apnea. Latency for the righting reflex to return is recorded and used as an index of traumatic unconsciousness.

Behavioral Tests

Morris Water Maze

The Morris water maze is a test of short-term recall of a spatial learning task. Zucker lean and fatty rats subjected to sham vs. traumatic brain injury were tested for the ability to locate a submerged platform in a swimming pool. Sample phase corresponds to acquisition of learning; the choice phase measures recall of newly-acquired spatial learning task. Distance is a measure of how far the rats swam before locating the submerged swim platform. Longer distance (choice phase) is indicative of impairment of recall of short-term spatial learning acquired in the sample phase. Path efficiency (efficiency) is the ratio of the shortest path to the platform vs. the actual swim path taken by the animal. Maximum path efficiency has a value of 1.0 and is a measure of recall of swim platform location.

Delayed Match to Position in Morris Water Maze

Before injury, the animals underwent extensive training in the Morris water maze apparatus. The delayed match to position (DMTP) test is a short-term recall of a spatial memory task. Rats were tested for the ability to locate a submerged platform in a swimming pool. The swimming pool was made opaque by non-toxic paint (Crayola washable paint, 16 oz, white 54-2016-053). Submerged in the pool was a platform on which the rat could escape from swimming, with the surface of the escape platform approximately 1 cm below the surface of the water. During the first acclimation session, the rat was initially placed on the platform and allowed to remain on the platform for 10 – 20 seconds. In subsequent training trials, the rat was placed further from the escape platform so that the rats learned that there was a place to escape from swimming, learned to climb onto the escape platform, and acclimated to swimming in the pool. During this training phase, the escape platform was in the same location and rats were started twice from 3 distinct locations (6 trials/session). Rats were trained for 4 days with one session per day. Each trial lasted a maximum of 60 seconds and if the rat had not located the platform during that time the rat was led to the platform using a wooden stick. The rat was then allowed to climb onto the platform where they remained for 10-20 seconds. After this, the rat was dried and moved to a holding cage with a heater if necessary.

One day after the 4th training session, a single probe trial was given in which the platform was removed from the pool and the rat was allowed to swim from one of the start locations for 60 seconds, after which the rat was removed from the pool, dried, and placed back in the home cage. For both training and probe sessions, the swim path of the rat was recorded and analyzed for multiple measures to assess spatial learning using AnyMaze (AnyMaze version 6.21 (64-bit) (Stoelting Co., 620 Wheat Lange, Wood Dale, IL 60191 USA).

Testing of spatial working memory commenced approximately 2-3 days after the probe trial using a DMTP procedure that consisted of 6 trials per rat with each trial having two phases, a sample phase and a choice phase. At the beginning of each trial, an animal entered sample phase by being placed in the water at a novel start position and has 60 seconds maximum swim time to find the platform. After either successfully finding the platform or being led to it after the 60 seconds swim time, the rat was left on the platform for 15 seconds, and then returned to its home cage for 30 seconds. That same animal then began choice phase, was placed back in the water at the same location as in sample phase and had 60 seconds maximum swim time to locate the platform. Each trial has a novel combination of start and platform positions. All rats were tested at the same start-platform positions. The pool was divided by AnyMaze into three equal-area zones, covering 120° of circumference each. At the beginning of the sample phase, each rat was placed in the water facing the perimeter of the tank in a selected zone. The escape platform was in a different zone than that of the start position and remained in that zone for both phases. The rat was allowed a maximum of 60 seconds to find the platform. After either successfully finding the platform or being led to it after 60 seconds, the rat was left on the platform for 10-20 seconds, and then returned to its home cage for approximately 30 seconds. The same animal then began the choice phase, where it was placed back in the water at the same start location as in sample phase and allowed 60 seconds to locate the platform. On each subsequent trial, the starting location and the platform location were changed across trials, not within trials, within the session. Approximately 1 hour separated each trial.

The swim path was recorded for later analysis. One to two days of working memory testing was required. Swim Distance was used as a measure of how far the rats swam before locating the submerged swim platform.

Statistics

Student’s t-test for single comparisons, two-way ANOVA for differences between two or more factors (strain, injury, drug) and their interaction, and repeated measures ANOVA for differences over time (pre-injury, 1-week, 1-month and 3-months post injury). The post hoc Bonferroni test was employed in all ANOVA. All statistical analyses were conducted using the SPSS software. A P-value <0.05 was considered significant and values are expressed as means ± SEM.

Results

Morris Water Maze – A Test of Spatial Memory

In fatty and lean Zucker rats exposed to TBI, distance (needed to locate swim platform) in the choice phase (CP) significantly exceeded that of sham-injured Zucker rats (Figure 2A and 2B) (F(1,12)=8.314, p=0.014) indicative of TBI-associated spatial memory impairment. In a repeated measures ANOVA, there was a trend of a significant time x injury interaction, F(3,36)=2.401, p=0.084, which did not reach statistical significance. Path efficiency was significantly lower in fatty vs. lean Zucker rats at all timepoints post-baseline (Figure 3) including TBI and sham-injured fatty rats. These data suggest factors associated with obesity, hypertension and type 2 diabetes likely contribute to accelerated decline in cognitive function (spatial memory recall) in fatty vs. age-matched lean Zucker rats.

fig 2

Figure 2: Delayed match to position in the Morris water maze: distance (meters) as a function of time before and after injury in Zucker lean and fatty rats. Results are mean ± SEM. Distance was determined by Any Maze software as described in Methods. Fatty: sham (N=6), tbi (N=6) Lean: Sham (N=9), tbi (N=8).

fig 3

Figure 3: Delayed match to position in the Morris water maze: path efficiency as a function of time before and after injury in Zucker lean and fatty rats. Results are mean ± SEM. Path efficiency was determined by Any Maze software as described in Methods. Fatty (N=12); Lean (N=17) rats.

Effect of Short-term Peptide Administration on Spatial Memory

Peptide (SCLLADDN=SN..8) was administered to fatty rats (every other day) for seven days before and after injury and in lean rats for seven days after injury. The fatty rats received three additional doses of SN..8 or saline (before injury) because of prior work showing that SN..8 significantly lowered blood pressure in ZDF rats and appeared cardioprotective [8]. Zucker diabetic fatty (vs. lean) rats experienced a disproportionate excess mortality associated with TBI which was reduced by pre-treatment with SN..8 (Grinberg M, Burton J, Pang K, Zimering MB, unpublished observations). Path efficiency difference is defined as [choice phase efficiency – sample phase efficiency] and is a measure of the strength of spatial memory recall. One-week post-injury, SN..8 peptide-treated, sham-injured fatty and lean Zucker rats displayed significantly larger gain in path efficiency difference compared to saline-treated, sham-injured fatty and lean rats (F(1,10)=5.777, p=0.037) (Figure 4). There was a significant (drug x injury) interaction F(2,20)=4.442, P=0.025. Post-hoc Bonferroni test showed significantly higher (one-week) path efficiency difference in Sham, SN..8-treated vs. Sham, Saline-treated Zucker rats (Pbonf=0.039) (Figure 4). Our sample size (N=29) was only powered to detect two-way, but not three-way interactions. There was no significant (strain x drug) interaction F(2,23)=0.584, P=0.566. There was no significant (strain x injury) interaction F(1,25)=0.328, P=0.572.

fig 4

Figure 4: Delayed match to position in the Morris water maze: Path efficiency difference at 1-week post injury in Zucker fatty and lean rats. Path efficiency difference was calculated as described in Methods and is a measure of the strength of recall of spatial learning. Results are mean ± SEM. Sham (N=9); TBI (N=11). Sham, saline (N=5), Sham, P4 (N=4), TBI, saline (N=4), TBI, P4 (N=7). P4= SN..8 peptide.

Cohorts 1 and 2 combined sample size (N=29 rats) lacked sufficient power to detect statistically significant differences in behavior in peptide- vs. saline-treated rats analyzed at repeated intervals following injury. Next we tested three additional cohorts of Zucker fatty (N=22) and lean rats (N=12), total N=34 rats in the Morris water maze using an identical (2 mg/kg) concentration of scrambled peptide (LD..8) as control for SN..8 peptide treatment. Duration to locate the swim platform in the choice phase (CP) was an outcome measure of (recall of spatial learning), in a repeated measures ANOVA (preinjury, 1-week, and 1-month post-injury) which demonstrated a main effect of time, F(2, 56)=6.214, P=0.004 (Figure 5). There was a main effect of strain F(1,28)=7.797, P=0.009 with leans requiring less time than fatty Zucker rats to locate the platform. There was a main effect of injury F(1,28)=11.300, P=0.002 with sham-injured rats requiring less time than TBI rats to locate the platform (Figure 5). There was a significant time x injury interaction F(2,56)=9.584, P < 0.001, post-hoc: sham, 1 week x tbi, 1 week, P bonf <0.001 & sham, 1 month x tbi, 1 month, P bonf=.013.

fig 5

Figure 5: Delayed match to position in the Morris water maze: duration in the choice phase CP (recall of spatial learning) as a function of time before and after injury in Zucker lean (N=12) and fatty rats (N=22). Results are mean ± SEM. Duration (seconds) was determined by Any Maze software as described in Methods.

Duration (to locate swim platform) in the Sample Phase (SP) was a measure of (spatial learning acquisition). A repeat measures ANOVA of duration in the sample phase demonstrated main effects of strain (F(1,28)=12.613, P=0.001 with leans having reduced duration compared to Zucker fatty rats; and injury F(1, 28)=9.335, P=0.005 with sham-injured rats having reduced duration compared to TBI (Figure 6A). There was a significant injury x drug interaction F(1,28)=7.788, p=0.009 with sham, SN..8-treated animals having shorter duration (to locate platform) than sham, scrambled-LD..8-treated rats (P bonf=0.001), (Figure 6B). There was no significant difference in post-hoc tests of TBI, SN..8 vs. TBI, LD..8-treated rats (Figure 6B). There was a significant (strain x drug) interaction F(1,28)=4.589; P=0.041 (Figure 6C). In post-hoc testing, fatty P4 had significantly higher SP duration than lean P4; P bonf=0.002; and fatty, scrambled had significantly higher SP duration than lean P4; Pbonf=0.021 (Figure 6C). There was no significant (strain x injury) interaction F(1,25)=0.328; P=0.572. Sample size limitations prevented testing for a strain x drug x injury interaction.

fig 6

Figure 6: Delayed match to position in the Morris water maze: duration in the sample phase SP (acquisition of spatial learning) as a function of time, A) and injury or B) peptide (P4= SN..8, scrambled = LD..8) treatment group or C) strain before and after injury in Zucker lean (N=12) and fatty rats (N=22). Results are mean ± SEM. Duration was determined by Any Maze software as described in Methods.

In vitro Neuroprotection by SN.8 in Mouse Neuroblastoma N2A cells

The SN..8 peptide dose-dependently inhibited Zucker lean heterozygote rat Ig-induced neurite retraction in vitro exhibiting an IC50 of ~ 9 mg/L (Figure 7).

fig 7

Figure 7: Dose-dependent inhibition of N2A neurite retraction from 100 nanomolar concentration of Zucker heterozygous lean by SN..8. Neurite retraction assay were performed as described in Methods. Results are mean ± SEM.

Mechanism of Action of SCLLADDN (SN….8) Peptide

The precise mechanism of SN..8 peptide’s in vitro and in vivo neuroprotective action is unknown. We had proposed that the epitope-specific SN..8 peptide may act as a ‘decoy’ which directly binds 5-HT2AR agonist IgG preventing receptor activation. Although we can’t exclude this possibility, we now provide evidence for an additional possible mechanism. Using linear synthetic peptides containing an alanine substitution for a highly conserved cysteine at EL2.50 (Ballesteros-Weinstein residue numbering system [10]) SALLADDN or for an aspartic acid residue at position EL2.55 (SCLLADAN) we compared the in vitro neuroprotective effects (Gq11/IP-mediated neurite retraction) of mutant vs. ‘wild-type’ SCLLADDN peptide. A 50-100 nanomolar concentration of Zucker heterozygous lean rat IgG caused 50% acute N2A neurite retraction which was completely prevented by co-incubation with twenty mg/mL concentration of wild-type SN..8 (Figure 8). Pre-incubation of IgG with twenty mg/mL concentration of either ‘C to A’ or ‘D to A’ mutant peptides had no inhibitory effect on Zucker rat IgG-induced neurite retraction. Although (20 ug/mL) wild-type peptide alone had no effect on N2A neurite retraction, we found unexpectedly that incubation of N2A cells with a twenty mg/mL concentration of either ‘C to A’ or ‘D to A’ mutant peptides alone caused transient, reversible (after 5 minutes), Gq11/IP-mediated N2A neurite retraction (not shown in Figure 8).

fig 8

Figure 8: Effect of targeted ‘C to A’ or ‘D to A’ amino acid substitutions in ‘wild-type’ SCLLADDN peptide on the resulting mutant peptides’ (SALLADDN) or (SCLLADAN) ability to prevent acute N2A neurite retraction in the presence of 50-100 nanomolar concentration of Zucker heterozygous lean rat IgG. Results are mean ± SEM of three experiments. Similar results were obtained in experiments using the IgG fraction of plasma from four different middle-aged human TBI patients. Neurite retraction assay in mouse N2A neuroblastoma cells was carried out as described in Methods.

The wild-type SCLLADDN (SN..8) is identical to a subregion of the second extracellular loop (ECL) of the human serotonin 2A receptor reported by Wacker et al [11] to function as a ‘lid’ modulating the ingress and egress of ligands into and out of the 5HT2(B, or A) receptor’s orthosteric binding pocket (OBP). For example, closure of the lid prevented egress of the hallucinogenic ligand lysergic acid diethylamine (LSD) from the OBP causing an unusually long off-reaction time of LSD at the 5HT2B and 5HT2A receptors [11]. Mobility of the lid peptide is dependent on its specific amino acid residues which in turn determines the kinetics of the open and closed receptor conformations [11]. The lid function is conserved among many different aminergic GPCRs [12] and a highly conserved cysteine residue EL2.50 involved in intrachain disulfide bonding normally prevents constitutive aminergic GPCR activation [12]. The observation that C to A (SCLLADDN to SALLADDN) or D to A (SCLLADDN to SCLLADAN) single amino acid residue substitution(s) each led to transient constitutive receptor Gq11/IP activation (in the presence of serotonin in the culture medium) is of interest since it suggests a possible direct effect of exogenously administered short lid peptides on stabilizing an active vs. inactive conformation of the receptor. We speculate that cysteine-containing ‘wild-type’ SN..8 (SCLLADDN) may spontaneously form aggregates important in antigen-antibody binding or which interfere with hydrogen bonding between GPCR transmembrane helices [13] required for receptor activation. The Asp at position EL 2.54, shown in bold SCLLADDN in the wild-type peptide, is also highly conserved among family A GPCRs [13] and it mediates hydrogen bonding between helix 2 and helix 7 underlying receptor activation [13]. Replacement of the adjacent Asp (EL2.55) with Ala to form SCLLADAN may have led to a more highly mobile lid peptide which mediated transient receptor activation by increasing the probability of hydrogen bonding between helices 2 and 7. To our knowledge, these are the first data suggesting that small peptide mimics of an aminergic GPCR receptor ‘lid’ region in which key amino acid residues (Cys EL2.50 or Asp 2.55) have been replaced by alanine not only mediate transient receptor activation, but also abrogate neuroprotection associated with ‘wild type’ SN…8 lid peptide.

Discussion

Obese type 2 diabetes mellitus and hypertension are associated with accelerated age-related cognitive decline in older adults [14], and in a recent study of lifelong TBI-sufferers, (obesity and hypertension) were significant predictors of an increased hazard rate for the occurrence of major depressive disorder, Parkinson’s disease or dementia [3]. The Zucker fatty rat is a widely-used genetic model of morbid obesity [4]. Morbid obesity promotes peripheral inflammation associated with increased risk for neuropsychiatric and neurodegenerative disorders in humans [15], yet there have been relatively few prior neurobehavioral studies in the Zucker fatty rat strain which might shed light on underlying mechanisms.

Here we report that the Zucker diabetic hypertensive fatty rat experienced significantly greater spontaneous decline in spatial memory compared to age-matched lean Zucker rats.

It is not clear to what extent diabetes or hypertension (in Zucker fatty rats) may have affected the rate of decline in recall of spatial memory. In human studies, older adult type 2 diabetes populations experienced increased rate(s) of decline in executive function and processing speed; and hypertension, hypertriglyceridemia, and diabetes duration, (but not glucose level per se) was each a significant predictor of accelerated cognitive decline [14]. Severe hypertriglyceridemia which paralleled the development of morbid obesity in Zucker fatty rat may have contributed in part to observed sub-strain behavioral differences. In a prior report, male albino rats on a high-fat (vs. normal diet) developed obesity, and elevated lipid profile and had worse performance (on spatial memory task) in the Morris water maze [16] suggesting a role for metabolic factors in the Zucker fatty rat spatial memory impairment.

It is unclear how the SN..8 serotonin 2A receptor peptide fragment mediated its apparent in vivo neuroprotective effects, but one possibility may involve hippocampal neurogenesis. Neurogenesis occurs in the dentate gyrus (DG) region of the hippocampus in adult mammals, and it affects acquisition and recall of spatial learning [17]. Hippocampal neural progenitor cells (NPC) develop in a unique vascular niche [18] exposed to the general circulation. Circulating serotonin 2A receptor modulatory Ig (from morbidly-obese, and adult diabetic patients and in Zucker rats) not only had anti-endothelial effects [19] which could adversely impact neurogenesis, but also adversely affected the maturation, survival and electrical excitability of rat dentate gyrus NPC in vitro [20]. Serotonergic receptors expressed in the hippocampus have a well-established role in the regulation of mood and emotional disorders [21]. In addition, systemic administration of 5-HT2A receptor agonists (psilocin, or TCB-2) in rodents significantly impaired spatial memory recall in the Morris water maze (MWM) [22]. Taken together, it is possible that SN..8 peptide administration could act at the level of the dentate gyrus region of the hippocampus in modulating neurogenesis important in both acquisition and recall of spatial memory.

Another major hormone system which influences dentate gyrus neurogenesis are glucocorticoid (GR) and Mineralocorticoid Receptors (MR). Both receptors are highly expressed in hippocampal brain regions [23] and participate in the complex regulation of the effects of stress on the hypothalamic/pituitary/adrenal axis. It is possible that stress associated with mild TBI (LFP) causes greater GR activation in the hippocampus leading to stronger suppression of neurogenesis compared to sham-injury. An SN.8 peptide which targets the serotonin 2AR may have little effect on GR-induced suppression of neurogenesis. A future study of serotonergic and glucocorticoid receptor expression in Zucker rat brain following sham vs. TBI is needed to clarify the underlying mechanisms. A possible role for DG neurogenesis in mediating the putative neuroprotective effects of a serotonin 2A receptor peptide on acquisition and recall of spatial learning also requires more direct study.

Our data that a 5HT2AR-specific lid peptide SCLLADDN (SN..8) significantly enhanced acquisition of spatial memory and strength of spatial memory recall (1-week post-injury in sham-injured rats) is consistent with the possibility that the receptor peptide may prevent 5HT2A receptor activation by endogenous 5-HT2AR ligand agonists including possibly circulating 5HT2AR agonist IgG.

Taken together, these data suggest that a novel serotonin 2A receptor peptide may have neuroprotective effects in sham-injured Zucker rats under conditions in which hippocampal neurogenesis is not already strongly suppressed by other hormonal factors principally, increased hippocampal GR and possibly MR activity in obese, hypertensive Zucker rats [24,25].

In summary, systemic administration of a small peptide mimic of the 5HT2A receptor lid peptide appeared to confer neuroprotective effects on acquisition and strengthening of recall of spatial learning tasks in sham-injured Zucker rats. Larger studies are needed to confirm these preliminary results and further test for any possible strain differences. Injections of both SN..8 and LD..8 peptides were well-tolerated and not associated with chronic pain, or local tissue injury. TBI was associated with greater impairments in spatial memory recall, and the neuroprotective peptide appeared less likely to significantly modulate the behavioral impairment(s) in brain-injured Zucker rats, especially fatty rats susceptible to the additional adverse cognitive effects of abnormal metabolic factors.

Acknowledgements

This work was supported in part by a grant CBIR 22 PIL022 from the New Jersey Commission on Brain Injury Research (Trenton, NJ) to MBZ, and by grants from the Technology Transfer Program/BLRD, Office of Research and Development, Department of Veterans Affairs (Washington, DC) to MBZ. The opinions expressed herein are solely those of the authors and do not reflect the official position of the US Government.

References

  1. Walker KR, Tesco G (2013) Molecular mechanisms of cognitive dysfunction following traumatic brain injury. Front Aging Neurosci 5: 29. [crossref]
  2. Jaacks LM, Vandevijvere S, Pan A, McGowan CJ, Wallace C, et al. (2019) The obesity transition: stages of the global epidemic. The lancet. Diabetes & endocrinology 7: 231-240. [crossref]
  3. Zimering MB, Patel D, Bahn G (2019) Type 2 Diabetes Predicts Increased Risk of Neurodegenerative Complications in Veterans Suffering Traumatic Brain Injury. J Endocrinol Diabetes 6: 137. [crossref]
  4. Kurtz TW, Morris RC, Pershadsingh HA (1989) The Zucker fatty rat as a genetic model of obesity and hypertension. Hypertension 3: 896-901. [crossref]
  5. Shibata T, Takeuchi S, Yokota S, Kakimoto K, Yonemori F, et al. (2000) Effects of peroxisome proliferator-activated receptor-alpha and -gamma agonist, JTT-501, on diabetic complications in Zucker diabetic fatty rats. Br J Pharmacol 130: 495-504. [crossref]
  6. Zimering MB, Grinberg M, Burton J, Pang K (2020) Circulating Agonist Autoantibody to 5-Hydroxytryptamine 2A Receptor in Lean and Diabetic Fatty Zucker Rat Strains. Endocrinol Diabetes Metab J 4: 413. [crossref]
  7. Zimering MB (2019) Autoantibodies in Type-2 Diabetes having Neurovascular Complications Bind to the Second Extracellular Loop of the 5-Hydroxytryptamine 2A Receptor. Endocrinol Diabetes Metab J 3: 118. [crossref]
  8. Zimering MB (2021) A serotonin 2A receptor decoy peptide potently lowers blood pressure in male Zucker diabetic fatty rats. Endo Diab Metab J 5: 1-13. [crossref]
  9. Wahab RA, Neuberger EJ, Lyeth BG, Santhakumar V, Pfister BJ (2015) Fluid percussion injury device for the precise control of injury parameters. J Neurosci Methods 248: 16-26. [crossref]
  10. Ballesteros JA, Weinstein H (1995) Integrated methods for the construction of three-dimensional models and computational probing of structure-function relations in G protein-coupled receptors. Methods Neurosci 25: 366-428.
  11. Wacker D, Wang S, McCorvy JD, Betz RM, Venkatakrishnan AJ, et al. (2017) Crystal Structure of an LSD-Bound Human Serotonin Receptor. Cell 168: 377-389.e12. [crossref]
  12. Michino M, Beuming T, Donthamsetti P, Newman AH, Javitch JA, et al. (2015) What can crystal structures of aminergic receptors tell us about designing subtype-selective ligands?. Pharmacol Rev 67: 198-213. [crossref]
  13. Sanchez-Reyes OB, Cooke ALG, Tranter DB, Rashid D, Eilers M, et al. (2017) G Protein-Coupled Receptors Contain Two Conserved Packing Clusters. Biophys J 112: 2315-2326. [crossref]
  14. Zimering MB, Knight J, Ge L, Bahn G (2016) VADT Investigators. Predictors of Cognitive Decline in Older Adult Type 2 Diabetes from the Veterans Affairs Diabetes Trial. Front Endocrinol (Lausanne) 7: 123. [crossref]
  15. Castanon N, Lasselin J, Capuron L (2014) Neuropsychiatric comorbidity in obesity: role of inflammatory processes. Front Endocrinol (Lausanne) 5: 74. [crossref]
  16. Wahid RM, Samy W, El-Sayed SF (2021) Cognitive impairment in obese rat model: role of glial cells. Int J Obes (Lond) 45: 2191-2196.
  17. Dupret D, Revest JM, Koehl M, Ichas F, De Giorgi F, et al. (2008) Spatial relational memory requires hippocampal adult neurogenesis. PLoS One 3: e1959. [crossref]
  18. Palmer TD, Willhoite AR, Gage FH (2000) Vascular niche for adult hippocampal neurogenesis. J Comp Neurol 425: 479-494. [crossref]
  19. Zimering MB, Alder J, Pan Z, Donnelly RJ (2011) Anti-endothelial and anti-neuronal effects from auto-antibodies in subsets of adult diabetes having a cluster of microvascular complications. Diabetes Res Clin Pract 93: 95-105. [crossref]
  20. Zimering MB, Behnke JA, Thakker-Varia S, Alder J (2015) Autoantibodies in Human Diabetic Depression Inhibit Adult Neural Progenitor Cells In vitro and Induce Depressive-Like Behavior in Rodents. J Endocrinol Diabetes 2. [crossref]
  21. Bohn LM, Schmid CL (2010) Serotonin receptor signaling and regulation via β -arrestins. Crit Rev Biochem Mol Biol 45: 555-566. [crossref]
  22. Zhang G, Stackman RW Jr (2015) The role of serotonin 5-HT2A receptors in memory and cognition. Front Pharmacol 6: 225. [crossref]
  23. Van Eekelen JA, Jiang W, De Kloet ER, Bohn MC (1988) Distribution of the mineralocorticoid and the glucocorticoid receptor mRNAs in the rat hippocampus. J Neurosci Res 21: 88-94. [crossref]
  24. Wong EY, Herbert J (2005) Roles of mineralocorticoid and glucocorticoid receptors in the regulation of progenitor proliferation in the adult hippocampus. Eur J Neurosci 22: 785-792. [crossref]
  25. Fredersdorf S, Endemann DH, Luchner A, Heitzmann D, Ulucan C, et al. (2009) Increased aldosterone levels in a model of type 2 diabetes mellitus. Exp Clin Endocrinol Diabetes 117: 15-20. [crossref]
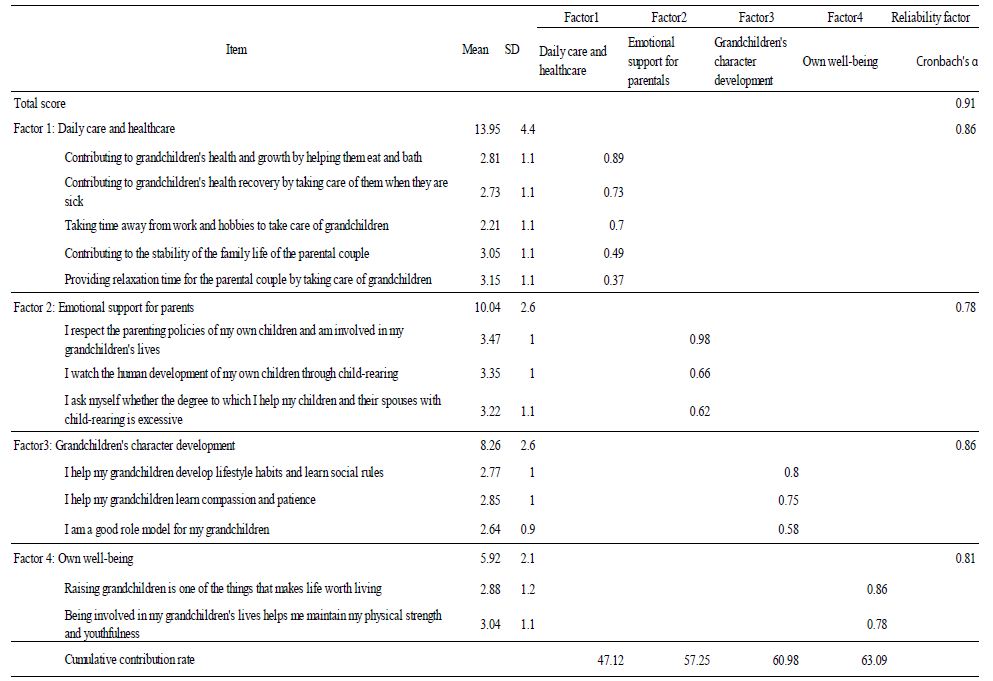
Reversal of Early Increased Anxiety-Like Behavior in the Zucker Fatty versus Lean Rat: Possible Role of Acquired Hormonal Factors

DOI: 10.31038/EDMJ.2023724

Introduction

Anxiety and depression increase substantially after traumatic brain injury (TBI) in humans. They are among the most common early neuropsychiatric complications of TBI [1] contributing to substantial morbidity and mortality. Owing to the current global epidemic of obesity [2], a possible role for obesity in the development of anxiety disorders has received increased attention [3]. In a recent study of TBI in humans, obesity was a significant predictor of an increased risk for the later occurrence of a composite neurodegeneration endpoint comprised of major depression and suicide, Parkinson’s disease or dementia [4]. Yet few prior studies in have explored the relationship between obesity, TBI and anxiety disorders. Here we used the Zucker fatty rat strain, a genetic model of obesity harboring homozygous mutations in the leptin receptor gene (fa/fa) [5] and Zucker lean (Fa/fa/?) rats to test a commonly-held notion that obesity is a risk factor for anxiety-like disorders. We also tested whether mild traumatic injury (induced by lateral fluid percussion-LFP) (vs. sham injury) modifies anxiety-like behavior in obese vs. lean Zucker rats.

Obesity in rats age (8-12 weeks old) was recently reported to be associated with heightened anxiety-like behavior compared to age-matched obese-resistant genetic strains [6]. Since anxiety-like behavior was not correlated with body weight (in the study) the authors concluded that acquired (vs. genetic factors) may play a less important role in the etiology of anxiety [6]. In the current study, we tested rats for anxiety-like behavior at different times in the developmental cycle to further evaluate a possible role for chronic acquired factors (related to obesity and diabetes) in anxiety-like behavior. Current drug therapy for anxiety disorders modulates serotoninergic signaling at central synapses in the cerebral cortex, hippocampus and other brain regions. We also conducted an exploratory test of whether systemic administration of a novel, putative neuroprotective synthetic peptide fragment of the human serotonin 2A receptor (SN..8) may modulate anxiety-like behavior in Zucker fatty (vs. lean) rats exposed to mild TBI (vs. sham injury).

Materials and Methods

Peptides

A linear synthetic peptide, SCLLADDN (SN..8) having a sequence identical to that of a fragment of the second extracellular loop region of the human 5-hydroxytryptamine 2A receptor was synthesized at Lifetein, Inc (Hillsborough, NJ) and had > 95% purity. A scrambled peptide containing the same amino acids as SCLLADDN had a sequence of LASNDCLD (LD.8) and a purity of 96.37%, MW 849.91. The lyophilized peptides were stored (in the presence of dessicant) at −40 degrees C prior to use. On the day of an experiment, an aliquot of lyophilized peptide was reconstituted in sterile saline at the indicated concentration. Reconstituted peptide(s) were prepared fresh before each experiment.

Animals

All procedures were conducted according to the National Institutes of Health (NIH) Guide for the Care and Use of Laboratory Animals and approved by the Institutional Animal Care and Use Committee of the Veterans Affairs Medical Center (East Orange, New Jersey). Male ZDF (fa/fa) and lean (+/?) Zucker rats were obtained from Charles River Laboratories (Kingston, NY) at approximately 6-7 weeks of age. All rats were single housed upon arrival, with modest enrichment (a PVC tube). Rats were provided ad libitum access to food and water and maintained in a 12 h light/dark cycle with lights on at 0630. All procedures occurred during the light phase of the circadian cycle.

Injections

Peptide (SN..8 or LD.8) was dissolved in sterile saline (2 mg/kg) and SN.8 peptide vs. vehicle (sterile saline) or LD..8 peptide intraperitoneal (IP) injections were ad-ministered every other day. Peptide (SN.8) (vs. saline or LD..8) injections commenced 1-week prior to surgery/injury in ZDF rats to minimize the risk of excess acute post-injury mortality in ZDF rats thought to be related (in part) to pre-injury moderate hypertension. The peptide SN..8 was previously reported to substantially lower blood pressure in the ZDF rat [7].

Surgeries/Injury

All animals underwent a surgical procedure to attach a luer-lock connector to a craniectomy, positioned either on the left or right parietal bone plate. Rats were anesthetized with 1-4% isoflurane (5 L/min O2 for 60s) and transferred to a stereotactic instrument with 1-4% isoflurane mixed with 1-1.5 L/min O2 delivered via a nosecone to maintain anesthesia throughout the surgery. A craniectomy (2mm in diameter, centered at 3mm posterior to bregma and 3.5mm lateral to midline) was made in the skull and super glue was used to secure a luer-lock connector around the edge of the craniectomy. A plastic cylinder (cut from a 10mL syringe) was placed on the skull surrounding the luer-lock connector; this was placed to provide stability and protect the area around the craniectomy. Dental cement was used to fill the space in between the connector and the plastic cylinder. A small amount of sterile saline was deposited into the connector along with a small piece of Kimwipe to keep the dura clean of debris.

One day following implantation of the surgical hub, fluid percussion injury is achieved with a device using a computer-controlled voice-coil to deliver defined pressure waves to the dura through a water piston [8]. Water is first placed in the surgical cap to prevent any air displacing the pressure waves. Rats were anesthetized with isoflurane in an induction chamber followed by fluid percussion injury or sham. The injury procedure occurs one day after surgery to prevent the dura from drying out and thereby reducing the injury of the brain tissue. Mild to moderate severity TBI will occur at pressure amplitudes of 20-30 psi (±3 psi) and rates of rise between 10-20 milliseconds. To reduce the effects of anesthesia as much as possible, rats are connected to the device by the syringe hub and allowed to recover from anesthesia until they respond lightly to a foot pinch before injury occurs. Therefore, the rats were lightly anesthetized at the time of injury. Sham rats are treated the same way as injured rats including isoflurane anesthesia and connection of the device to the rat, but the pressure wave was not delivered. The animal is monitored for startle in response to the pressure wave and then placed on its back in a recovery cage and evaluated for apnea. Latency for the righting reflex to return is recorded and used as an index of traumatic unconsciousness.

Behavioral Tests

Open Field Test. Rats were placed in the center of a round, gray, open field apparatus (diameter of 74 cm, height of 51 cm). A light (120 W) was located 135 cm directly above the center of the apparatus which had a measured light intensity, LT300-NIST Light Meter (Extech Instruments, Knoxville, TN) of 400-500 lux. The open field apparatus was placed in a novel environment. The path of the rat in the open field was recorded, digitized, analyzed, and stored on a computer using AnyMaze version 6.21 (64-bit) (Stoelting Co., 620 Wheat Lange, Wood Dale, IL 60191 USA). For analysis, the open field was separated into two zones, the center, and the periphery. The center zone was measured to have the area of the total field (diameter of approximately 52.32 cm). Performance in the open field was scored during a 3-minute time window before returning the animal to its home cage. The apparatus was wiped with 70% ethanol solution between testing of each rat. Increased mobility in the center zone, defined as distance, speed, and time in motion, was used as an indicator of reduced anxiety, whereas staying in the peripheral zone, was used as an indicator of increased anxiety [9].

Statistical Analysis

Statistical analysis was performed using the Student’s t-test for single comparisons and one-way ANOVA for differences between more than two groups followed by post hoc Bonferroni tests. All statistical analyses were conducted using the SPSS software. A p-value <0.05 was considered significant and values are expressed as means ± SEM.

Results

Open Field Test – Bright Light

Twenty-two rats were initially tested 1.5 months post-injury (i.e. at 18=19 weeks of age). An ANOVA demonstrated a main effect of strain, P=0.037 (Figure 1). Sham-injured Zucker fatty rats spent more time in center (mean 82 ± 10 sec) compared to sham-injured Zucker lean rats (mean 55 ± 7 sec) (Figure 1A and 1B). The preliminary study of anxiety-like behavior was only powered to test for main effects. Still it suggested that Zucker fatty rats display reduced anxiety-like behavior when tested later in the developmental cycle.

fig 1

Figure 1: Center time (sec) in bright light in A) lean or B) fatty Zucker rats after sham- vs. mild TBI. A) Lean: Sham (N=7), TBI (N=6). B) Fatty: Sham (N=5), TBI (N=4).

Open Field Test – Under Dark Conditions (Mobility Test)

General mobility was assessed in the open field test performed under dark conditions. There were no significant differences in time in the center by strain (fatty vs. lean) or injury (sham vs. TBI) (Figure 2). These results suggest that the differences observed under bright light conditions were likely attributable to anxiety-like behavior.

fig 2

Figure 2: Open field test under dark conditions, 1 month post-injury in Zucker lean and fatty rats. Results are mean ± SEM. Lean: Sham (N=7), TBI (N=6). Fatty: Sham (N=5), TBI (N=4).

Next, in a different cohort of Zucker fatty (N=22) and lean (N=12) rats, the open field test (under bright light) was performed before injury (11-12 weeks of age), 1-week after injury (15-16 weeks of age) and 1-month after injury (18-19 weeks of age). In a repeated measures ANOVA of center time at (preinjury, 1week and 1 month post-injury), there was a significant main effect of strain (F(1,26)=5.639, p=0.025) and a significant interaction effect of (time x strain) F(2,52)=8.248, p<0.001 (Figure 3). The post-hoc tests showed significant differences between fatty, preinjury vs. fatty, 1week post-injury (Pbonf=0.002) and between fatty, 1week post-injury vs. lean, 1week post-injury (Pbonf=0.023) (Figure 3). The fatty rats spent significantly more time in the center zone after injury compared to preinjury, and spent significantly more time in the center zone after injury than leans rats (Figure 3). There was no significant (strain x injury) interaction.

fig 3

Figure 3: Center time: significant (strain x time) interaction. Each point is mean ± SEM

Mean difference (fatty vs. lean Zucker rats) in center time (Figure 4) underwent a ‘reversal’ after 11-12 weeks and before 15-16 weeks of age. At the earlier timepoint fatty rats had higher anxiety and later underwent a shift to reduced anxiety-like behavior (vs. lean rats). Zucker fatty rats acquired body weight significantly more rapidly than lean rats between 7-12.5 weeks of age (Figure 5), however injury (sham or TBI) which occurred at 13 weeks of age (Figure 6, arrowhead) contributed to a temporary ‘fall off’ in the normal trajectory of weight gain in Zucker fatty rats (Figure 5). Severe hyperglycemia in Zucker fatty rats (16 weeks and older) may have also contributed to a slowing in the relative trajectory of weight gain in fatty vs. lean (normoglycemic) Zucker rats (Figure 5).

fig 4

Figure 4: Developmental ‘onset’ of reduced anxiety-like behavior in fatty vs. lean Zucker rats. Data are mean ± SEM.

fig 5

Figure 5: Change in body weight in Zucker lean and fatty rats across development and injury (arrowhead). Arrows signify pre-injury, 1-week post and 1-month post-injury timepoints. Each point is mean ± SEM.

Overall mean speed, and exploratory behavior (distance traveled) were unexpectedly significantly higher in fatty vs. lean Zucker rats (Figure 6A and 6B) and immobility time was significantly reduced in fatty vs. lean Zucker rats (Figure 6C), assessed 1-week after injury. Mean distance traveled (Figure 7A) was significantly higher in Zucker fatty (vs. lean rats), before and 1-week post injury. Total immobility time was significantly reduced, before injury, 1 week, and 1 month post-injury, in Zucker fatty vs. lean rats (Figure 7B). Taken together, center time in the open-field test under bright light conditions (a measure of anxiety-like behavior) was unexpectedly decreased in Zucker fatty (vs. lean) rats at 15-16 weeks of age and older and could not be accounted for by strain differences in general mobility, or exploratory behavior.

fig 6

Figure 6: One week after injury: A) Mean speed and B) distance traveled were both significantly higher in fatty vs. lean Zucker rats; C) total time immobile was significantly higher in lean vs. fatty Zucker rats.

fig 7

Figure 7: A) Zucker fatty (vs. lean) rats traveled significantly greater distance before and 1-week after injury B) Zucker lean (vs. fatty) rats had significantly greater immobility at all three timepoints before and after injury. * P < 0.05.

A novel small peptide medication (SN..8) comprised of a fragment of the second extracellular loop of the human 5HT2AR prevented 5HT2AR activation on mouse neuroblastoma cells in vitro. Unlike direct antagonist 5HT2AR medications which promote significant weight gain, chronic administration (for 13 weeks or longer) of SN..8 (vs. an inactive scrambled version of the peptide – LD..8) did not cause significant weight gain in Zucker rats [7]. We next tested whether systemic (intraperitoneal) administration of SN..8 (vs. LD.8) may affect anxiety-like behavior in (sham-injury vs. TBI) Zucker rats.

There were no significant differences in center time between fatty vs. lean Zucker rats subjected to (sham- vs. TBI injury) or (SN..8 vs. scrambled peptide) treatment, i.e. 2 mg/kg, IP every other day when assessed either 1 -week after injury (Figure 8) or 1-month after injury (Figure 9). In repeated measures ANOVA of center time, there was no significant (drug x injury) or (drug x strain) interaction (data not shown). Still, the sample sizes were small and had reduced power to detect possible statistically significant difference(s) in drug (SN.. 8 vs. LD.8) or injury (sham vs. TBI) effects on anxiety-like behavior.

fig 8

Figure 8: SN..8 (vs. scrambled peptide) treatment did not significantly modify time in center in lean or fatty rats evaluated a A) 1 week after sham injury or B) 1 week after mild TBI. Data are mean ± SEM.

fig 9

Figure 9: SN..8 (vs. scrambled peptide) treatment did not significantly modify time in center in lean or fatty rats evaluated a A) 1 month after sham injury or B) 1 month after mild TBI. Data are mean ± SEM.

Discussion

Obesity has reached epidemic proportions in the United States and other parts of the world [2]. Anxiety and depressive disorders rank very high among conditions contributing to morbidity and mortality. Understanding biological links between obesity and anxiety or depressive disorders is of considerable public health importance. Among lifelong TBI-sufferers, obesity caused in part by a sedentary lifestyle and medications useful in treatment-refractory depression is both common and appeared to increase the risk for later occurrence of a composite neurodegenerative disease outcome including severe depression [4]. In a prior study that compared rats fed a standard diet vs. high-fat Western diet (leading to obesity), obesity was reported to increased anxiety-like behavior in the high-fat diet fed rats [10]. One proposed mechanism linking obesity to anxiety is increased inflammation [3]. In a different study that compared obese-prone vs. obese-resistant rat strains at 8-12 weeks of age, the Zucker fatty rat had lower exploratory activity, lower general mobility and decreased center time in the open field test (i.e. increased anxiety-like behavior) compared to several different obese-resistant rat strains, but not including Zucker lean rats [6]. In the present study, we compared obese and lean Zucker rats having similar overall genetic background, but differing at the leptin receptor locus (i.e. fa/fa vs. Fa/?). At 8-12 weeks of age, anxiety-like behavior was significant increased in fatty vs. lean Zucker rats perhaps consistent with prior reports of a role for inflammation and obesity [6,10]. However, when the open field test was conducted at later developmental age(s) in the present study, anxiety-like behavior was significantly reduced in fatty vs. Zucker rats. This may be indicative of development change in one or more receptors in the Zucker fatty rat brain important in mediating anxiety-like behavior.

The serotonin 2A receptor and the serotonin 1A receptor play opposing roles in the regulation of anxiety and depression [11]. Increased activity in the 5HT2AR in certain brain regions is associated with increased anxiety and depression [12] and several existing FDA-approved 5HT2AR antagonist medications are effective in treatment-resistant depression. On the other hand, sustained activity in the 5HT1A receptor underlies (in part) the anxiolytic and anti-depressant effect of SSRI medications [13].

Both 5-HT2AR and mineralocorticoid receptor (MR) are expressed in cortical brain regions and have a role in anxiety-like behavior. For example, cortical expression of 5HT2A, -B, -C receptors was identical in ‘high anxiety’ Lewis vs. ‘low anxiety’ SHR rat strains [14], however, cortical Gq11/IP accumulation (via 5HT2A, B or C receptors) was substantially higher in the ‘high anxiety’ Lewis rat [15]. Rozeboom et al. [16] reported that transgenic mice harboring chronic increased forebrain mineralocorticoid receptor (MR) expression displayed reduced anxiety-like behavior (vs. wild-type mice). Forebrain MR overexpression led to increased CA1 hippocampal expression of the 5HT1A receptor (important in mediating anxiolysis) and reduced hippocampal expression of the glucocorticoid receptor (important in mediating the stress response). Zucker fatty (vs. lean) rat were reported to have two-fold higher level of plasma aldosterone [17] (at 25 weeks of age) owing in part to obesity-associated hypertension, and to activation of the renin-angiotensin-aldosterone as a result of severe insulin resistance, hyperglycemia and insulin deficiency [18]. Taken together, morbid obesity- and diabetes-associated hormonal changes may cause increased brain MR activity (in the Zucker fatty rat) resulting in increased hippocampal expression of the 5HT1A receptor and decreased glucocorticoid expression – both mediating anxiolysis. Future study can directly test for changes in the hippocampal expression level of the 5HT1A and glucocorticoid receptor in Zucker fatty vs. lean rat brain, and its developmental onset and possible modulation by sham-injury vs. TBI.

A limitation of the present study is that subgroups of rats treated with SN..8 (vs. LD..8) and subjected to sham-injury vs. TBI may have been too small in their number(s) to detect significant differences in anxiety-like behavior. Zucker diabetic fatty rats (ZDF) spontaneously harbor 5-HT2AR agonist autoantibodies causing Gq11/IP3 accumulation [19] and the ZDF Ig mediated neurotoxicity in vitro was nearly completely prevented by incubation (of neuroblastoma cells) with SN..8 [19]. If the circulating 5-HT2AR agonist Ig were able to access (anxiogenic) cortical 5HT2A receptors, e.g. following mild TBI and disruption of the blood brain barrier, SN..8 might prevent Ig-induced 5HT2AR activation. A larger study is needed to test whether preventing cortical 5HT2AR activation by Ig, with SN..8 (vs. LD..8) may have an anxiolytic effect in lean vs. fatty Zucker rats.

Acknowledgements

This work was supported in part by a grant CBIR 22 PIL022 from the New Jersey Commission on Brain Injury Research (Trenton, NJ) to MBZ, and by grants from the Technology Transfer Program/BLRD, Office of Research and Development, Department of Veterans Affairs (Washington, DC) to MBZ. The opinions expressed herein are solely those of the authors and do not reflect the official position of the US Government.

References

  1. Howlett JR, Nelson LD, Stein MB (2022) Mental health consequences of traumatic brain injury. Biol Psychiatry 91: 413-422. [crossref]
  2. Jaacks LM, Vandevijvere S, Pan A, McGowan CJ, Wallace C, et al. (2019) The obesity transition: stages of the global epidemic. The lancet. Diabetes & endocrinology 7: 231-240. [crossref]
  3. Castanon, Nathalie, Julie Lasselin, Lucile Capuron (2014) Neuropsychiatric comorbidity in obesity: role of inflammatory processes. Frontiers in endocrinology 5: 74. [crossref]
  4. Zimering MB, Patel D, Bahn G (2019) Type 2 Diabetes Predicts Increased Risk of Neurodegenerative Complications in Veterans Suffering Traumatic Brain Injury. J Endocrinol Diabetes 6: 137. [crossref]
  5. Kurtz TW, Morris RC, Pershadsingh HA (1989) The Zucker fatty rat as a genetic model of obesity and hypertension. Hypertension 3: 896-901. [crossref]
  6. Vogel H, Kraemer M, Rabasa C, Askevik K, Adan RAH, et al. (2017) Genetic predisposition to obesity affects behavioural traits including food reward and anxiety-like behaviour in rats. Behav Brain Res 328: 95-104. [crossref]
  7. Zimering MB (2021) A serotonin 2A receptor decoy peptide potently lowers blood pressure in male Zucker diabetic fatty rats. Endo Diab Metab J 5: 1-13. [crossref]
  8. Wahab RA, Neuberger EJ, Lyeth BG, Santhakumar V, Pfister BJ (2015) Fluid percussion injury device for the precise control of injury parameters. J Neurosci Methods 248: 16-26. [crossref]
  9. Walsh RN, Cummins RA (1976) The open-field test: A critical review. Psychological Bulletin 83: 482-504. [crossref]
  10. André C, Dinel AL, Ferreira G, Layé S, Castanon N (2014) Diet-induced obesity progressively alters cognition, anxiety-like behavior and lipopolysaccharide-induced depressive-like behavior: focus on brain indoleamine 2,3-dioxygenase activation. Brain Behav Immun 41: 10-21. [crossref]
  11. Kandel Eric R, James H Schwartz, Thomas M Jessell, Steven Siegelbaum, A James Hudspeth, et al. (2000) Principles of neural science 4.
  12. Celada P, Puig M, Amargós-Bosch M, Adell A, Artigas F (2004) The therapeutic role of 5-HT1A and 5-HT2A receptors in depression. J Psychiatry Neurosci 29: 252-265. [crossref]
  13. Gordon JA, Hen R (2004) The serotonergic system and anxiety. Neuromolecular Med 5: 27-40. [crossref]
  14. Berton O, Aguerre S, Sarrieau A, Mormede P, Chaouloff F (1998) Differential effects of social stress on central serotonergic activity and emotional reactivity in Lewis and spontaneously hypertensive rats. Neuroscience 82: 147-159. [crossref]
  15. Gauffre JC, Aguerre S, Mormède P, Chaouloff F (1997) Cortical [3H] ketanserin binding and 5-HT2A receptor-mediated inositol phosphate production in the spontaneously hypertensive rat and Lewis rat strains. Neurosci Lett 236: 112-116. [crossref]
  16. Rozeboom AM, Akil H, Seasholtz AF (2007) Mineralocorticoid receptor overexpression in forebrain decreases anxiety-like behavior and alters the stress response in mice. Proc Natl Acad Sci USA 104: 4688-4893. [crossref]
  17. Fredersdorf S, Endemann DH, Luchner A, Heitzmann D, Ulucan C, et al. (2009) Increased aldosterone levels in a model of type 2 diabetes mellitus. Exp Clin Endocrinol Diabetes 117: 15-20. [crossref]
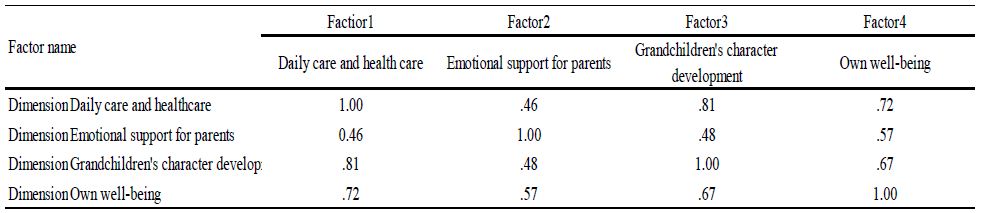
  18. Miller Judith A (1999) “Impact of hyperglycemia on the renin angiotensin system in early human type 1 diabetes mellitus.” Journal of the American Society of Nephrology 10: 1778-1785. [crossref]
  19. Zimering MB, Grinberg M, Burton J, Pang K (2020) Circulating Agonist Autoantibody to 5-Hydroxytryptamine 2A Receptor in Lean and Diabetic Fatty Zucker Rat Strains. Endocrinol Diabetes Metab J 4: 413. [crossref]

The Quality of Ideas When AI (Artificial Intelligence) is Used as a Coaching Device

DOI: 10.31038/ASMHS.2023721

Abstract

Four studies explored the subjective responses to text generated by AI versus text generated by a single individual. Each study focused on a topic (local pizza shop; local cleaner; local dentist; local school board). Each study comprised four sets of four elements each, viz., 16 elements, the elements being answers to simple questions pertaining to the topic. Each study comprised 30-31 respondents. The evaluation showed no decided advantage for AI generated information over human generated information when the rating was assigned on a simple 5-point Likert scale. The test process provides a way of inserting human evaluation into the text generated by people or by AI, and in turn opens up the potential of a standardized way to evaluate AI text using people.

Introduction

Today’s focus on hot new technologies must, by sheer popularity, include AI, artificial intelligence. AI is high on the Gartner hype cycle (Dedehayir & Steinert, 2016), perhaps due to it romanticized connotations as much to its performance. This paper is simply a study of how well AI can help a person think, or solve a problem, when AI is used as a ‘coaching device.’ At the same time this paper in being written in a time of ferment. Two decades ago Hill et. al., (2005), reported that “people communicated with the chatbot for longer durations (but with shorter messages) than they did with another human. Additionally, human–chatbot communication lacked much of the richness of vocabulary found in conversations among people and exhibited greater profanity. These results suggest that while human language skills transfer easily to human–chatbot communication, there are notable differences in the content and quality of such conversation”. The big story of 2022 is that AI has developed so quickly and powerfully that it is being used (or really misused) by students to write their college essays (Fyfe, 2022.).

The origins of this study come from three decades of work on systematic exploration of people’s responses to ideas, when these ideas are presented in combinations, in vignettes, with these vignettes created by experimental design. The origin of the work is the emerging science of Mind Genomics (Moskowitz et. al., 2012). Mind Genomics focuses on how people make decisions in the world of ordinary experience. The underlying approach of Mind Genomics is to choose a topic, then ask a set of four questions which present the topic in a story sequence, choose four answers to each question, creating 16 elements (element=answer). Finally, the Mind Genomics program (www.bimileap.com) creates combinations of these elements according to an underlying set of recipes, a so-called experimental design (Gofman & Moskowitz, 2010), presents these combinations to the respondent, obtains ratings, and uses regression analysis to deconstruct the responses into the contributions of the different elements.

The foregoing approach has been templated and is now easy to use. One recurring observation over the decades of use is that people simply freeze when they are instructed to create a set of four questions. That is, people may know how to answer questions, but again and again it is becoming clear that people don’t know how to frame questions. In other words, it may be that people simply don’t know how to think in a critical way, at least when critical thinking is defined in part as the ability to ask a set of coherent questions.

Introducing AI into Mind Genomics

Beginning around 2010, Mind Genomics was put on a path of developing a true DIY (do it yourself) system, with automatic set-up, automated recruiting using a panel company as a partner, and automated reporting. The effort finally materialized in 2017, with the set-up screens. The objective of the DIY was to have the researcher identify a topic for the study, then provide four questions, and finally four answers for each question.

Years of experience gave the authors the preparation to provide questions and answers with a fair degree of ease. It seemed to the authors that almost anyone should be able to think of four questions about a topic, but the authors were slowly disabused of that notion when users had to be ‘coached’, brought along, and only after the coaching and talking were the users comfortable. The unhappy reality was that the reluctance, or perhaps the real inability, to come up with questions was hindering the adoption of the Mind Genomics platform. Users simply abandoned the Mind Genomics effort, often after choosing a topic, and being confronted with what had seemed to be a perfect simple task of choosing questions.

During the many years of developing Mind Genomics, author HRM was asked many times whether the questions and answers could be put in somehow ‘automatically.’ The history of those questions would make an interesting article in itself, but the main thing to emerge was that people simply did not know how to think about topics in a critical way. Answering questions was very easy for people. In contrast, framing questions about a topic was off-putting. It seemed at first that people were being lazy, but the reality began to emerge that people were simply recognizing the need for a coach, for something to help them, preferably not a person.

The opportunity to create a ‘coaching’ system emerged during the middle of the past year, in 2022. At that time the Mind Genomics approach had become virtually a DIY system, as long as the respondent knew how to create the right questions, create the answers, create the orientation page, and the rating scale. The orientation page and rating scales were easy to learn and master. Creating questions and answers remained elusive, depending as much on the person’s confidence and topic-specific knowledge as it did on the person’s attitude towards these open ended explorations.

It would be the available of AI as an interface which provided the opportunity for enhancing Mind Genomics, perhaps removing the barrier of having to think of questions for a given topic. The underlying idea was to provide a ‘coaching mechanism’, effectively a device in which researchers could elaborate on a topic, with AI returning with up to 30 questions. The elaboration could be done several times, either with the same text or with different variations, until he researcher came up with questions which seemed relevant. Some or all of these questions could be selected, and ‘dropped’ into the question boxes. The researcher was free to edit the questions, and to provide questions that she or he wished to add, as long as the number of questions came to four. The second part of the coach allowed the researcher to select the coach, receive up to 15 answers to the question, and again repeat the process, selecting the best answers. The researcher could edit the answers, as well as incorporate her or his own answers.

It was the introduction of AI in this way, viz., as a coach, which reduced some of the hesitancy, making Mind Genomics more of a cut and paste operation in which the thinking was encouraged, but not made into a stumbling block. The researcher could be a child, even one eight years old or so. The fear factor of thinking was replaced by the excitement of the new information to appear, new questions to check, new answers to discover and select. The task became fun, at least to children. And, for adults, the delight may not have been so obvious, but the hesitation appeared to have been reduced, in some occasions dramatically.

AI Generated Ideas Versus Self-generated Ideas – Do They Differ in Quality?

The genesis of this paper emerged from ongoing conversations about the use of AI in studies. The question continue to emerge regarding the ‘quality’ of the ideas emerging from AI. The consumer researcher business continues to feature advertisements about AI in consumer research, although the underlying methods, viz. ‘under the hood’ are never revealed, nor are metrics. Yet despite the opacity of AI, the pattern is clear. It may only be a matter of time before AI catches up with the human being, and actually surpasses people (Grace et al. 2018). They write in stark terms that “AI will outperform humans in many activities in the next ten years, such as translating languages (by 2024), writing high-school essays (by 2026), driving a truck (by 2027), working in retail (by 2031), writing a bestselling book (by 2049), and working as a surgeon (by 2053). Researchers believe there is a 50% chance of AI outperforming humans in all tasks in 45 years and of automating all human jobs in 120 years “

A consequence of the popularity of AI, at least in the discussions among market researchers has led to the question of how one might measure the quality of ideas emerging from AI. Would the ideas be really better, producing insights that were the equal of good ideas produced by people, and hopefully better ideas? Or, when subject to standard researchers, such as Mind Genomics, would AI produced ideas perform worse than or equal to, but definitely not better than ideas of smart people. It was this last idea, head to head comparison to the performance of ideas generated by AI versus by people which gave rise to this paper.

Mind Genomics and the Head to Head Comparison of Ideas

Mind Genomics allows the researcher to measure the quality of the ideas, without anyone except the researcher knowing the source. The research project emerged as simple to do. In a few words, the idea was to choose a simple topic, and run the study exactly the same two times. The first time the researcher would create the study with no help at all. The second time the research would select the elements, the raw material, from Idea Coach. The same number of respondents would participate in the parallel studies, and the result compared in terms of performance.

There is no direct, absolute, non-subjective way to measure the quality of ideas. Thus, the ideas which emerge from one’s unaided efforts cannot be ‘objectively’ compared to the ideas which emerge from AI. AI may produce many more ideas, but on the basis of what can we assign values to these ideas? There is the old adage, a bit judgmental, and somewhat contemptuous, namely ‘GIGO, garbage in, garbage out.’ Given the prevalence of GIGO thinking, is possible to create a system to measure the value of ideas.

Mind Genomics may provide a solution to the above-mentioned problem. Keep in mind that there are two parts of the Mind Genomics exercise. The first part comes from the selection of the elements, whether from the person or from the combination of AI as the provider of the elements and the person as the selector of the elements. The second part comes from the evaluation of the elements, albeit combinations of elements, not single elements alone. The evaluation is one by real people who do not know how the elements were generated, rating each combination on a simple Likert scale, viz. an anchored scale. With this separation of idea generation from idea evaluation, it may be possible to measure the human subjective response to the ideas, and by so doing compare the performance of ideas generated by people to ideas generated by AI.

The Mind Genomics Process

Mind Genomics is an emerging science, focusing on the way people make decisions (REF). Mind Genomics grew out of a combination of three different disciplines; statistics, psychophysics, and consumer research, respectively. The underlying process has been documented a number of times (REF). In summary, the process follows these steps:

Step 1 – Define the topic, generate four questions, and for each question generate four answers. The term ‘element’ will be used instead of the term ‘answer.’ In effect, there are 16 elements in a Mind Genomics study. These questions and answers may be generated by the researcher, or may be generated using artificial intelligence. In this study, four of eight studies used questions and questions generated by the researcher, and the other four studies, with matching topics, used questions and answers generated by OpenAI’s language model “text-davinci-003” (https://beta.openai.com/docs/models/gpt-3).

The eight studies summarized in Table 1 were run with 30-31 respondents, all in the state of Connecticut, USA, with respondents aged 18-49 for the pizza studies, and 25-54 for the dry cleaner, dentist and school board candidate studies, respectively.

Table 1: Positive coefficients for the eight studies, showing the results for the Total panel, and for the three mind-sets extracted for each study. Strong performing elements for each study are shown in shaded cells.

tab 1(1)

tab 1(2)

tab 1(3)

tab 1(4)

tab 1(5)

Each respondent was a member of an online panel, aggregated by Luc.id Inc. The respondents were invite to participate by an email sent only to panel members. The panels comprised more than several hundred thousand individuals for each panel company whose members were aggregated by Luc.id, making recruiting easy. Those respondents who agreed to participate read an introductory statement, completed a short self-profiling questionnaire, and evaluated a unique set of 24 vignettes, created according to an underlying experimental design (Gofman & Moskowitz, 2010). The respondents rated the vignette on an anchored 5-pooint scale, shown below.

The screen below describes a local pizzeria. Please indicate how likely you would be to patronize this pizzeria on a scale of 1-5. Although some screens may look alike, each one is different. Don’t dwell on them, just choose a number based on your gut reaction. 1=Not at all likely … 5=Extremely likely.

For each dentist described on this screen, please rate how likely you would be to choose this dentist. 1=Not at all likely … 5=Extremely likely.

You will be shown a series of screens. Each one describes a local dry cleaner. For each dry cleaner described on a screen, please rate how likely you would be to patronize this dry cleaner.

1=Not at all likely … 5=Extremely likely.

Based on the policy positions of the school board candidate below, how likely would you be to vote for this person? 1=Unlikely … 5=Extremely likely.

The analysis converted ratings 5 and 4 to 100, ratings 1-3 to 0, added a vanishingly small random number to each transformed number, used OLS (ordinary least-squares regression), and then clustered the respondents into two and then three mind-sets using k-means clustering. The OLS regression related the presence/absence of the 16 elements to the transformed rating scale, doing so at the level of each respondent. Each respondent ended up with an additive constant and 16 coefficients. The additive constant shows the basic level of interest in the topic (e.g., voting for a person for the school board) in the absence of elements, value that ends up becoming a baseline value since all vignettes comprised 2-4 elements (viz. answers) as dictated by the underlying experimental design.

The respondents were then divided first into two non-overlapping but exhaustive groups, and then into three non-overlapping but exhaustive groups based upon K-Means Clustering. The 16 coefficients were used as the basis for clustering, with the additive constant ignored for by the clustering algorithm.

Table 1 below divides into eight sections, one section for each of four topics, done twice. The two ways are done by the researcher alone, SELF using the AI Coach, the second way, AI, done by the researcher using the AI-powered Idea Coach. Table 1 shows the results for Total Panel and for three mind-sets, for each pair of studies One can get a sense of the richness of the ideas generated by the researcher (SELF) and generated by the researcher aided by AI in the form of Idea Coach.

A cursory look at Table 1 suggests similar performances by elements chosen by a person, first without AI (SELF), and later, at a separate time, with the help of AI (AI). There are no glaring patterns which emerge to tell us that AI-augmented efforts are dramatically stronger or weaker, when selected for the same topic, and evaluated by individuals are presented with a test protocol which prevents guessing what the underlying patterns might be. Only in one of the four studies do we see clear superiority, with elements for school board chosen by a person element performing far better than elements chosen by a person selecting from offerings of AI. This means AI does not offer up any better ideas than the ideas emerging from the individual himself.

Creating a Metric for Comparison – IDT (Index of Divergent Thinking)

A different metric is called for, to compare the performance of the study. This metric has been used for Mind Genomics studies. Table 2 presents the computation for the IDT, index of divergent thinking. In simple terms, the IDT looks at the weighted sum of positive coefficients generated by the combination of the three major groups: total panel, both mind-sets in the two-mindset solution, all three mind-sets in the three mind-set solution. Each of these three components contributes an equal proportion to the final IDT. The approach makes sense because it is very difficult to generate a high coefficient for the total panel because the different people in the total panel cancel each other out. Thus, the total panel gets a weight of 33%. When it comes to two mind-sets, they also share a weight of 33%, so the two mind-sets compete for the 33%. Finally, when I come to three mind-sets, they also share a weight of 33%, so the three mind-sets compare for their 33%. Table 2 shows the computation.

Table 2: Computation of the IDT, the ‘Index of Divergent Thought’. The IDT provides a metric for the strength of the ideas using subjective judgments of the vignettes.

tab 2

When the IDT is computed for the eight studies, the results give a sense of the subjective ‘strength’ of the elements, when ‘strength’ is operationally defined as strong performance on the rating attribute (viz., a preponderance of assigned ratings of 5 and 4 to the vignettes by a defined subgroup of respondents). Table 3 presents a comparison among the eight studies, the sum of positive coefficients for each of the key groups (total, two mind-sets, three mind-sets, respectively), then the IDT for the study.

Table 3: Key statistics from the eight studies

tab 3

The important number in Table 3 is the IDT for virtually the same number of respondents across four pairs of matched studies, one study with four questions and four sets of four elements chosen completely by the researcher without any help from AI, and then afterwards the same selection, this time using only the questions and answers provided by the selected OpenAI language model and based only on a simple statement about the topic.

At this stage, we can say that the results are inconclusive. AI generates a much higher IDT value for school board (113 vs. 94, AI vs. Self), similar value for dentist (86 vs. 83), lower for dry cleaner (54 vs. 69) and much lower for pizza shop (48 vs. 74).

These initial results suggest that AI may perform better than Self generates messages for topics which are not ordinary, not daily (viz., dentist, and school board), but will probably perform more poorly for the more common topics (viz., dry cleaner, pizza shop). The respondents were matched in each study in terms of market and age, and the study was not identified as to origin of the elements. It may be that the differences could emerge from discrepancies in the base sizes of the two groups of emergent mind-sets (MS1 of 2 and MS2 of 2 vs. MS1 of 3, MS2 of 3, and MS3 of 3). If we just look at the Total Panel, using the Total of the positive coefficients, we find that only dentist data shows a stronger performance of AI generated elements versus self-generated elements.

Are AI Generated Elements More or Less ‘Engaging’ than Self-generated Elements?

Up to now the data strongly suggest that the current AI generated elements do not perform quite as well as the self-generated elements, although they do not perform poorly, at least when the judgment is cognitive. What happens, however when the metric comparing the two is non-cognitive, and often used by consumer researcher as well as experimenters in psychology and other disciplines’ course, we refer here to response time, a time-honored method in psychology and more recently in consumer research (Bassili & Fletcher, 1991).

The Mind Genomics program, BimiLeap, measures the time between the presentation of the test stimulus, the vignette, and the response to the stimulus, viz., the rating assigned by the respondent. The respondent need not do anything but read and respond. The time between the presentation of the vignette and the respondent, response time, become the dependent variable in a simple regression equation:

RT=k1A1 + k2A2… k16D4

The response time model does not have an additive constant, simply because the additive constant does not have any real meaning. The dependent variable, response time, is used in place of the 5-poont scale, either at the level of the group, or for other studies, at the level of the individual respondent.

Table 4 shows the response time estimate for each element for all eight studies. The table shows the longer response times in shade. This paper does not evaluate the response time, but two opposite arguments can be made about the response time. The first argument is that the longer response times ‘engage’ the respondent to pay attention. The second argument is that the longer response times due to the fact that the message may take longer to read because the message is confusing, poorly written, or simply has mor words.

Table 4: Estimated response time for each element, estimated by Mind-Genomics

tab 4(1)

tab 4(2)

tab 4(3)

Discussions and Conclusions

The rapid emergence of ‘cognitively rich’ AI cannot be ignored. Newspaper articles discussing trends of AI point to the ability of widely available AI tools to create prose in a way which mimics that prose written by people who are capable writers, producing what could be called felicitous prose. Indeed, the topic of the growing potential of students to write college essays using AI is forcing a reevaluation of what it means for a student to learn to write, or indeed to get a liberal arts education. When the language generated by AI is sufficiently close to the language ‘ordinary people’ use, a new paradigm in called for in education.

The contribution of this paper is to introduce the human judge into the evaluation of snippets of information, viz., the elements produced either by people or by artificial intelligence. The Mind Genomics study does not focus on the coherence of the composition, viz., the ‘fitting together’ of the elements into a coordinated paragraph. Rather, the Mind Genomics effort in this paper is to understand the degree to which respondents feel about the individual texts, and to determine whether the elements generated by AI produces the same evaluation score of feeling as does the text of the same topic produced by a person.

If one were to summarize the findings of this paper, one would have to conclude that in terms of human judgment, the elements generated by AI may approach the quality of the elements generated by one’s mind alone, but only in one study out of four (school board) do we see AI performing better, presumably because people do not know about school boards in the way they know about pizza shops, dry cleaners, and dentists. Furthermore, the response time for elements are higher for elements created by the person, rather than by AI. This might be because the text elements created by the highly regarded AI used for the study (Zuccarelli 2020) were sensible, but bland and simply not as engaging yet as those written by a person.

References

  1. Bassili JN, Fletcher JF (1991) Response-time measurement in survey research a method for CATI and a new look at nonattitudes. Public Opinion Quarterly 55: 331-346. [crossref]
  2. Dedehayir O, Steinert M (2016) The hype cycle model: A review and future directions. Technological Forecasting and Social Change 108: 28-41. [crossref]
  3. Fyfe P (2022) How to cheat on your final paper: Assigning AI for student writing. AI & SOCIETY, pp.1-11. [crossref]
  4. Gofman A, Moskowitz H (2010) Isomorphic permuted experimental designs and their application in conjoint analysis. Journal of Sensory Studies 25: 127-145. [crossref]
  5. Grace K, Salvatier J, Dafoe A, Zhang B, Evans O (2018) When will AI exceed human performance? Evidence from AI experts. Journal of Artificial Intelligence Research 62: 729-754. [crossref]
  6. Hill J, Ford WR, Farreras IG (2015) Real conversations with artificial intelligence: A comparison between human–human online conversations and human–chatbot conversations. Computers in Human Behavior 49: 245-250. [crossref]
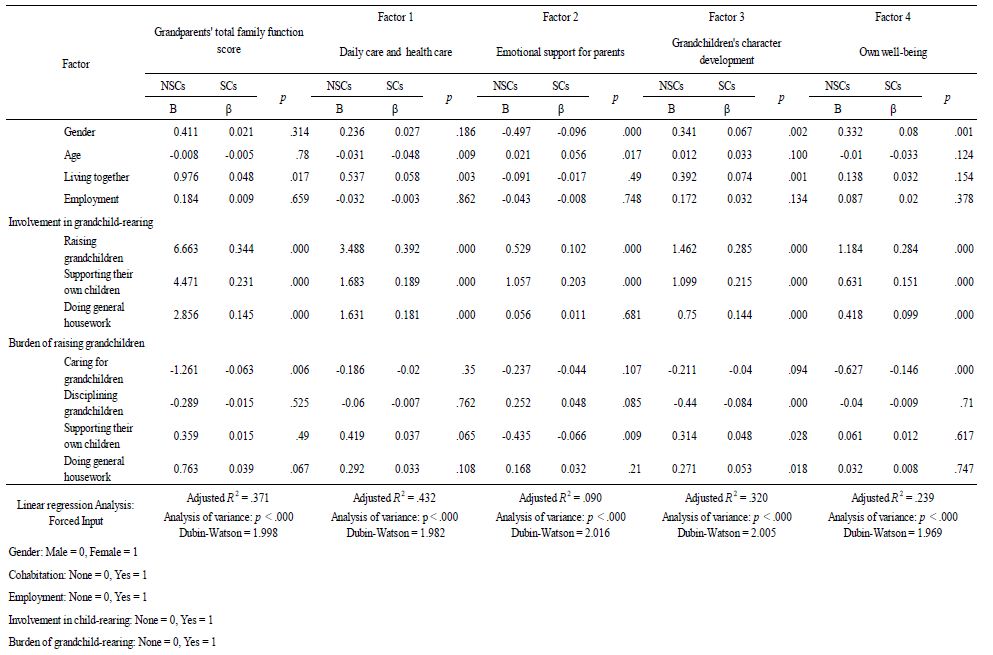
  7. Moskowitz HR (2012) ‘Mind genomics’: The experimental, inductive science of the ordinary, and its application to aspects of food and feeding. Physiology & Behavior 107: 606-613. [crossref]
  8. Zuccarelli, Eugenio (2020) GPT-3, OpenAI’s Revolution: Looking into the most powerful language model ever created, Towards Data Science, GPT-3, OpenAI’s Revolution. Looking into the implications of the… | by Eugenio Zuccarelli | Towards Data Science, accessed 20 December 2022. [crossref]

A Pilot Study: Can Using QR Codes Increase Student Participation in Large Classroom Settings?

DOI: 10.31038/IJNM.2023432

Abstract

In large classes, students report feeling a lack of personalization and ownership for learning course material. Students can feel disengaged from the learning process, thus a greater risk of failing to seek clarification of misunderstood concepts. Given that 35-50% of persons have an introverted temperament, it is important to provide an equitable learning environment to support all students’ learning. The purpose of this pilot project was to determine if the use of a QR code to ask questions would improve student engagement both during class and after class time for a first and third semester prelicensure nursing students. Post QR code survey using a 1-10 Like rt scale showed a mean satisfaction score of 8.63 for 1st semester and 7.79 for 3rd semester students. 90.7% of first semester and 76.9% of third semester students felt having access to the QR code enabled them to ask more questions.

Keywords

QR code, Large class size, Student participation, Prelicensure nursing program, Engagement

Introduction

Nursing school faculty face many challenges supporting student participation in the classroom. One challenge is identifying appropriate technologies which will enhance student participation without burdening faculty and being perceived as useless by students. This can be particularly difficult in large classes. Students in large classes have reported feeling a lack of personalization and ownership for learning course material, disengagement from the learning process, and greater risk of failing to seek clarification of misunderstood concepts [1,2]. It has been noted the use of electronic devices can be distracting and discouraged [3]. However, the use of technology can promote critical thinking and knowledge retention [4]. Quick response (QR) codes were developed over 20 years ago and are widely used in business [5]. QR code readers are readily available on portable devices and have been incorporated in patient and medical education programs. Today, QR code readers are readily available on portable devices such cell phones and tablets. QR codes have been incorporated in patient and medical education programs, but there have been few applications of QR codes in prelicensure nursing programs [5-7]. The purpose of this paper is to describe the outcome of a pilot study at an accelerated baccalaureate nursing program (ABSN) in the Southeastern United States that applied QR code technology to improve student participation in a large classroom.

Background

Created in 1994, a QR code is a bar code which when scanned, links to a predetermined digital destination. Originally designed to improve inventory efficacy, QR codes are now part of everyday life. The use of QR codes has been studied, however, only relative to enhancing student experiences in low fidelity simulations4. By using QR codes, students were able to access video and audio assessment findings. Students felt the use of a QR code enabled them to pull together assessment findings and apply to nursing care. Focusing on specific breath sounds was one innovative example where QR codes have been useful in nursing education. By using a QR code, students were able to hear and document findings in an appropriate manner [8,9]. Finally, QR codes have been used to promote Just-in-time (JIT) learning for nursing skills and understanding sexually transmitted infections (STIs) [3]. After an extensive literature search, no research was found highlighting the use of a QR to ask questions either in class or outside of class.

Ensuring all students have a voice in the classroom is essential, particularly in large class sizes. This can be especially difficult for a student who is introverted. Introversion has been defined as persons who prefer quieter, less stimulating environments. The percentage of people who fall somewhere on an introverted temperament continuum is estimated to be 35% to 50%10. This can have a significant impact on student learning and stress. Calling on an introvert student to answer questions can add to the already high stress level. By recognizing the introversion-extroversion continuum, educators can create an equitable learning environment which support all students’ learning [10].

Method

This project received expedited Institutional Review Board approval. A comprehensive literature review searching for QR code usage in nursing education found no articles discussing the use of QR codes for large classroom participants. Based on this search, a pilot project was developed to implement QR codes in first and third semester courses for undergraduate students. To determine if there was a difference between beginning students and more advanced students. The authors developed a Redcap survey to develop baseline data. Redcap pre/post surveys were kept separate though both had the same questions. The four question pre-QR code survey asked students about experience in using a QR code, comfort in raising one’s hand in class to ask a question and if uncomfortable raising one’s hand, how were questions answered. To determine if there was a generational difference, an age range question was added. At semester’s end, a post-survey asked if students used the QR code to ask a question in class, used it outside of class, whether there was comfort in using the QR code, what was the satisfaction in using the QR code and did it lead to asking more questions. To implement the project, a QR code linked to a Redcap survey was developed. When the QR code was scanned, the student was taken to a Redcap survey, allowing the student to choose which faculty they wanted to respond to their question and then type a question. The question was immediately sent via email to the requested faculty so the faculty could respond in “real-time” during a class lecture. Students had the option to provide one’s name so faculty could respond personally or remain anonymous. The QR code was also imbedded in each power point/Panopto recording so students could ask a question outside of the classroom. The QR code was printed and laminated so each student could have it available during class time.

Results

All students from both cohorts completed the pre-survey and greater than ninety-eight percent had experience using QR codes with no statistical difference between the groups. What was surprising was the percentage of students who stated they were uncomfortable raising their hand in class which was approximately 28% from both groups. Comments for first semester students were: “Sometimes I am shy.” and “I feel comfortable in an online format asking questions but not in person classes.” Comments from third semester students included: “Yes, social anxiety prohibits me from asking questions routinely in class, especially when we’re all together again in one room!” and I will ask a question out loud, if need be, but I’d rather not.” An interesting finding was how students got questions answered. First semester students had a significantly higher dependence on course faculty either meeting after class or emails compared with third semester students who relied more on classmates for assistance. Over the course of the semester, first semester students used the QR code forty-one times while third semester students used the QR code eighteen times. While the project was designed to enable students to ask questions during class, greater than ninety-five percent of questions received were after class. For both cohorts, nearly all students chose to be anonymous. Responses to anonymous QR code questions were posted in the course announcement section of the learning management system (LMS) under the assumption if one student had a question, so would other students. Post QR code survey results showed a mean satisfaction score of 8.63 for first semester students on a 0 -10 scale with 10 being the highest and 7.79 for third semester students. Students were asked if they felt they could ask more questions due to the use of a QR code. For both semester groups, the results were very positive at 90.7% and 76.9% for first and third semester students respectively.

Discussion

This project demonstrated the feasibility of using QR codes to improve student participation in large classroom settings. The greatest benefit appeared to be with first semester students. This finding was not unexpected as first semester students may lack confidence or have anxiety about asking questions in a large classroom9. However, using the QR code enabled all students to ask questions throughout the semester. This approach provided immediate feedback to faculty on areas where students struggled. Several lessons were learned during the pilot study. One was remembering to place the QR code on student desks. This was adjusted for the next semester by creating a QR code which attached to the student’s badge. Since the QR code survey was anonymous, faculty could not provide a personal response. This was corrected by adding a statement to the QR code Redcap survey asking the student to provide a name if they wanted a personal email. Since the QR question went instantly to the faculty email, there was some difficulty in how frequently faculty checked emails during class. In one instance, there were several similar questions, but class time did not allow for an in-depth explanation. However, a detailed recorded explanation was posted after class.

Conclusion

Providing students with QR codes to anonymously ask questions both during and after class has the potential to promote student learning and participation by fostering an inclusive and responsive in a large classroom setting. In addition, it may decrease first semester anxiety as students adjust to a new learning environment as well as help instructors pinpoint where students are struggling with new concepts.

Conflict of Interest

The authors declare no conflict of interest

References

  1. Kinyon K, D’Alton S, Poston K, Anderson B (2021) Changing student outcomes without sacrificing student satisfaction. Journal of Nursing Education 60: 1-3. [crossref]
  2. Robb MK (2012) Managing a large class environment: Simple teaching strategies for new nurse educators. Teaching and Learning in Nursing 7: 47-50.
  3. Sommerall WE, Roche CC (2020) The ABC’s of STIs: Promoting student learning using QR codes. Journal of Nursing Education 59. [crossref]
  4. Marcus J, Adeboyo M, Cranwell-Bruce L, Faulkhner MS (2021) Evaluating nursing students’ perceptions of using quick response codes to enhance learning during nursing health assessment. Nursing Education Perspectives 42: E133-134. [crossref]
  5. Billing DM, Kowalski K, Bradley K (2020) Just-in-time learning and QR codes: A must-have tool for nursing professional development specialists. J Contin Educ in Nurs 51: 302-303. [crossref]
  6. Bellot J, Shaffer k, Wang M (2015) Use of quick response coding to create interactive patient and provider resources. Journal of Nurs Education. 54: 224-227. [crossref]
  7. Jacoby S (2012) QR-codes-Quick response. Radiologic Technology 83: 301-302.
  8. Marcus J, Adeboyo M, Cranwell-Bruce L, Faulkhner MS (2021) Evaluating nursing students’ perceptions of using quick response codes to enhance learning during nursing. Nursing Education Perspectives 42: E133-E134.
  9. Willbanks C (2021) Take out your phones! Using QR codes in a health assessment course to overcome social-distancing obstacles. Tennessee Nurse 19.
  10. Colley SL (2018) Equitable education for introverts: providing learning opportunities that prepare nursing students to be leaders. Nursing Educator 45: 244-226.

Comparison Analysis of Metabolites by Exercise in Thoroughbred and Korean Native Jeju Pony

DOI: 10.31038/EDMJ.2023723

Abstract

Objective: Among experimental animal models, horses are the most adaptable to exercise and this ability has been extensively studied. Research on equine exercise physiology is mostly focused on genetics, and few integrated studies have focused on equine metabolomics. This study were conducted to analyze metabolites in plasma, urine, and sweat samples collected from Jeju pony and thoroughbred horses before and after exercise. In this study, we analyze the various equine samples using NMR (nuclear magnetic resonance) spectroscopy.

Methods: 1H NMR spectroscopy analysis were conducted with equine plasma, urine, and sweat samples collected from Jeju pony and thoroughbred horses before and after exercise. Relative metabolite levels between three types of were compared under exercise stimuli and by breeds.

Results: A total 26, 39, and 36 metabolites were identified in each of plasma, sweat, and urine samples, respectively, of both thoroughbred and Jeju pony. A total 3, 12, 15 metabolites were exclusively detected in plasma, sweat, and urine samples, respectively, and 15 metabolites were detected in all samples at the same time. In addition, total 8 and 5 metabolites were detected after exercise in plasma and urine samples. Additionally, we obtained 16, 6, and 30 metabolites in plasma, urine, and sweat by breeds.

Keywords

Horse, Thoroughbred, Korean native horse, Jeju pony, Metabolites, Nuclear magnetic resonance spectroscopy

Introduction

Horses are the most adaptable experimental animal models to exercise and, as such, are the most suitable for studying its effects. Moreover, studies focused on exercise physiology in horses can provide valuable basic information for understanding underlying mechanisms associated with exercise in humans. For this reason, further research on exercise physiology is necessary [1]. However, although studies focused on improving the athletic performance of horses have not had much success, economic trait -related genes have recently received greater attention [2-4]. In addition, equine tissue derived cells are being used in studies on the functional validation of these genes [5,6].

In recent years, multivariate analyses, so called multi-omics (genomics, epigenomics, transcriptomics, metabolomics, and proteomics) have been used to explain the biological mechanisms in numerous animals. Metabolites are the final biological products of cellular processes in cells, tissues, organs, or organisms [7]. Quantification of metabolomes can explain several biological phenomena along with other omics studies.

Exercise has a powerful effect on the body metabolism [8]. Repetitive and unilateral contraction of muscles associated with frequent exercise training is a suitably strong stimulus of physiologic function. During exercise, blood-borne glucose, creatine phosphate, glycogen, free fatty acids, and lactate which is known as external molecular substrates were used to produce ATP in muscle. The importance of these external molecular substrates in exercise metabolism is mostly affected by exercise rate and duration, but can also be affected by the type of exercise itself, as well as diet and environmental factors [9]. In addition, other energy mechanisms may be needed depending on the degree and duration of exercise [10].

In a previous study, we investigated a metabolic mechanism activated by physical activity using 1H nuclear magnetic resonance (NMR) spectroscopy in thoroughbred horses [11]. Specifically, we profiled exercise specific metabolome in muscles and plasma. However, the metabolic mechanism during exercise has not yet been analyzed in urine and sweat, which are much easier to collect than plasma and muscle.

In this study, the metabolite profiling of the sweat, plasma, and urine in various equine breeds under exercise stimulus was analyzed by 1H NMR spectroscopy. Based on the results, commonly or specifically released metabolites were identified from various equine biopsied specimen. Subsequently, metabolic pathways associated with obtained metabolites were investigated. The present study could contribute to a better understanding of metabolic fluctuations caused by exercise in thoroughbred and Jeju pony.

Materials and Methods

Animals

In this study, samples were gathered from five Thoroughbred and five Jeju pony. The study design was approved by the Pusan National University-Institutional Animal Care and Use Committee (Approval Number: PNU-2015-0864).

Horse Sampling

Jeju pony and Thoroughbred horse samples of sweat, plasma, and urine were collected in a stable setting and following exercise (30 min). A 15 mL syringe was used to obtain blood samples, which were then transferred to heparin tubes and centrifuged at 5,000 rpm for 15 min to extract the plasma. Sweat samples were obtained only after exercise. In case of urine, obtained sample was centrifuged to remove solids. Supernatant of centrifuged urine samples was added to a 1.5 ml tube which, is containing D2O (deuterium oxide) solution, DSS( dextran sulphate sodium), and 10 mM imidazole. In addition, 0.42% sodium azide was added. Obtained plasma samples and sweat samples were stored at -20°C, and urine samples were stored at -70°C until conducting NMR spectroscopy.

Nuclear Magnetic Resonance Spectroscopy

Plasma, urine, and sweat samples were 1H NMR spectroscopy analyzed. Briefly, plasma, urine, and sweat samples were used with D2O containing the reference material TSP (trimethylsilylpropionate) before NMR measurement. We conducted high-resolution magic angle spinning NMR for plasma samples, with a spinning rate of 2,050 Hz. Water peak and macromolecular peak signals were removed using the Carr-Purcell-Meiboom-Gill pulse sequence for analysis of plasma, sweat, and urine samples. Used to eliminate signals from water peaks and macromolecular peaks. Measured spectrum data were optimized by Chenomx NMR Suite 7.1 (Chenomx Inc., Edmonton, AB, Canada), and statistical analysis were conducted by SIMCAp+12.0 (Umetrics, Umea, Sweden) software. In this study, we measured the absolute concentrations of the metabolites in various equine samples. Relative concentrations were determine, and amount of metabolites present in the samples were calculated by multivariate statistical analysis method.

Statistical Analysis

A T-test and One-way ANOVA analysis of variance was conducted to determine significance levels. Data were shown as mean ± standard deviation of mean. One-way ANOVA  analysis of variance followed by Duncan multiple test was used to compare before and after exercise training results and used for each sample of thoroughbreds and Jeju pony.

Results

Comparison of Metabolic Patterns in Thoroughbred and Jeju Pony Before and After Exercise

In our previous study, we conducted 1H NMR spectroscopy analysis with various equine tissue samples (plasma, muscle, and urine) following exercise [11]. In this study, we obtained plasma, urine, sweat samples from both thoroughbred and Jeju pony following exercise, as well as before exercise, and conducted 1H NMR spectroscopy analysis (Figure 1A). We obtained a very large quantity of metabolomics data. A total of 26, 39, and 36 metabolites were identified in plasma (Figure 1B), sweat (Figure 1C), and urine samples (Figure 1D), respectively. To assess which metabolites were significantly released after exercise, we compared samples obtained before and after exercise in thoroughbred and Jeju pony. Glutamate, glutamine, glutathione, lactate, and pyruvate were detected in the Jeju pony plasma samples and betaine, citrate, glucose, glutamate, glutamine, glutathione, histidine, isoleucine, leucine, phenylalanine, proline, and valine were significantly released in plasma of thoroughbred horses (Supplementary Table 1). In urine samples, trimethylamine were identified in Jeju pony and 2-oxovalerate, 3-aminoisobutyrate, alanine, citrulline, glucose, glutamine, glutarate, methylsuccinate, N-isovaleroylglycine, N-phenylacetylglycine, proline, pyruvate, taurine, threonine, tryptophan, and urea were significantly released in thoroughbred horses (Supplementary Table 2). Notably, sweat samples were difficult to collect before exercise; as such, only those collected after exercise were used (Supplementary Table 3). In addition, we analyzed metabolites that were specifically released in each tissue (Table 1). A total of 3, 12, and 15 metabolites were identified in plasma, sweat, and urine, respectively.

FIG 1

Figure 1: Venn diagram showing shared and unique metabolites (A), and heatmap analysis of the differentially expressed metabolites (B-D) in the plasma, sweat, and urine. Red and green shadings represent higher and lower relative expression levels, respectively.

Table 1: Tissue specific metabolites in both of Thoroughbred and jeju pony

Clustering

Total

Metabolites

Plasma Only 3 Glutathione, Malonate, Ornithine
Sweat Only 12 2-Hydroxybutyrate, Acetoin, Choline, Formate, Fumarate, Glycerate, Homoserine, Mannose, N-Methylhydantoin, Phenylacetate, Pyroglutamate, Urocanate
Urine Only 15 2-Oxovalerate, 3-Aminoisobutyrate, 3-Hydroxyisovalerate, Acetoacetate, Citrulline, Dimethylamine, Glutarate, Hippurate, Methylsuccinate, N-Isovaleroylglycine, N-Phenylacetylglycine, Succinate, Trimethylamine, Trimethylamine N-oxide, Tryptophan
Plasma and Sweat 22 Acetate, Alanine, Betaine, Citrate, Creatine, Glucose, Glutamate, Glycerol, Glycine, Histidine, Isoleucine, Lactate, Leucine, Lysine, Proline, Pyruvate, Serine, Threonine, Tyrosine, Valine, myo-Inositol
Sweat and Urine 20 Acetate, Alanine, Arginine, Benzoate, Creatine, Creatinine, Glucose, Glycine, Isoleucine, Lactate, Leucine, Phenylalanine, Proline, Pyruvate, Taurine, Threonine, Tyrosine, Urea, Valine, myo-Inositol
Plasma and Urine 16 Acetate, Alanine, Creatine, Glucose, Glutamine, Glycine, Isoleucine, Lactate, Leucine, Phenylalanine, Proline, Pyruvate, Threonine, Tyrosine, Valine, myo-Inositol
Plasma, Sweat, and Urine 15 Acetate, Alanine, Creatine, Glucose, Glycine, Isoleucine, Lactate, Leucine, Phenylalanine, Proline, Pyruvate, Threonine, Tyrosine, Valine, Myo-Inositol

Metabolite Set Enrichment Analyses Based on Exercise Status

Enrichment analyses of the overlapped metabolites among plasma, urine, and sweat were conducted by MetaboAnalyst 5.0 [12], and total 41 pathways were identified (Table 2). Among various pathways, the glucose-alanine cycle, glycine and serine metabolism, and alanine metabolism were the most significantly expressed after exercise.

Table 2: Enriched metabolite pathway among plasma, urine and sweat

Total

Expected

Hits

Raw p

Holm p

FDR

Glucose-Alanine Cycle

13

0.19 3 0.000667 0.0654 0.05
Glycine and Serine Metabolism

59

0.864 5 0.00103 0.1 0.05
Alanine Metabolism

17

0.249 3 0.00153 0.147 0.05
Gluconeogenesis

35

0.513 3 0.0126 1 0.308
Pyruvate Metabolism

48

0.703 3 0.0296 1 0.426
Glutamate Metabolism

49

0.718 3 0.0312 1 0.426
Glutathione Metabolism

21

0.308 2 0.0358 1 0.426
Arginine and Proline Metabolism

53

0.776 3 0.0383 1 0.426
Transfer of Acetyl Groups into Mitochondria

22

0.322 2 0.0391 1 0.426
Warburg Effect

58

0.85 3 0.0483 1 0.429
Glycolysis

25

0.366 2 0.0495 1 0.429
Valine, Leucine and Isoleucine Degradation

60

0.879 3 0.0526 1 0.429
Phenylalanine and Tyrosine Metabolism

28

0.41 2 0.0608 1 0.453
Urea Cycle

29

0.425 2 0.0647 1 0.453
Ammonia Recycling

32

0.469 2 0.0771 1 0.499
Amino Sugar Metabolism

33

0.483 2 0.0814 1 0.499
Galactose Metabolism

38

0.557 2 0.104 1 0.599
Lactose Degradation

9

0.132 1 0.125 1 0.68
Pyruvaldehyde Degradation

10

0.146 1 0.138 1 0.711
Thyroid hormone synthesis

13

0.19 1 0.176 1 0.86
Phosphatidylinositol Phosphate Metabolism

17

0.249 1 0.223 1 1
Ethanol Degradation

19

0.278 1 0.246 1 1
Catecholamine Biosynthesis

20

0.293 1 0.258 1 1
Lactose Synthesis

20

0.293 1 0.258 1 1
Threonine and 2-Oxobutanoate Degradation

20

0.293 1 0.258 1 1
Carnitine Synthesis

22

0.322 1 0.28 1 1
Cysteine Metabolism

26

0.381 1 0.322 1 1
Inositol Phosphate Metabolism

26

0.381 1 0.322 1 1
Selenoamino Acid Metabolism

28

0.41 1 0.342 1 1
Citric Acid Cycle

32

0.469 1 0.381 1 1
Inositol Metabolism

33

0.483 1 0.39 1 1
Aspartate Metabolism

35

0.513 1 0.409 1 1
Fatty Acid Biosynthesis

35

0.513 1 0.409 1 1
Porphyrin Metabolism

40

0.586 1 0.452 1 1
Sphingolipid Metabolism

40

0.586 1 0.452 1 1
Propanoate Metabolism

42

0.615 1 0.469 1 1
Methionine Metabolism

43

0.63 1 0.477 1 1
Tryptophan Metabolism

60

0.879 1 0.598 1 1
Bile Acid Biosynthesis

65

0.952 1 0.629 1 1
Tyrosine Metabolism

72

1.05 1 0.668 1 1
Purine Metabolism

74

1.08 1 0.678 1 1

Differentially Released Metabolites that Responded to Exercise in Plasma and Urine

A total of 15 metabolites, including acetate, alanine, and creatine, were observed in all sample types (plasma, urine, and sweat) (Table 1). For these metabolites, release pattern analysis after exercise was conducted in plasma and urine (Table 3). Lactate and pyruvate were significantly identified in the plasma of Jeju pony (Figure 2A) and six metabolites (glucose, isoleucine, leucine, phenylalanine, proline, and valine) were significantly identified in the thoroughbreds plasma samples (Figure 2B). In thoroughbred horses, most metabolites doubled after exercise, with glucose showing the biggest increase. Interestingly, metabolites that significantly increased after exercise in Jeju pony were showed a decreasing trend in thoroughbred horses after exercise. In addition, metabolic analysis was conducted in urine samples after exercise (Figure 3). In contrast with the plasma results, significant changes in the release of metabolites in urine were only found in the samples from thoroughbred horses. Alanine, glucose, proline, pyruvate, and threonine were significantly identified after exercise.

Table 3: Expression pattern of plasma metabolites overlapped among plasma, urine and sweat

Metabolites Jeju Horse Thoroughbreds


Before (Mean ±SE) mM After (Mean ±SE) mM p value Before (Mean ±SE) mM


After (Mean ±SE) mM


p value


Acetate 13.30 ±1.77 16.44 ±1.49 0.259 17.10±3.49 15.20±1.38 0.633
Alanine 15.26 ±1.35 17.09 ±1.82 0.49 16.39±2.46 10.78±3.18 0.248
Creatine 3.53 ±0.32 3.52 ±0.22 0.979 2.75 ± 0.41 1.79 ± 0.43 0.186
Glucose 118.24 ± 9.10 98.81 ± 5.52 0.141 104.00 ± 15.69 51.79 ± 9.07 0.0352**
Glycine 26.46 ± 2.95 23.95 ± 2.58 0.583 31.44 ± 7.79 14.75 ± 2.62 0.107
Isoleucine 2.30 ± 0.19 2.00 ± 0.24 0.4 2.46 ± 0.40 1.18 ± 0.30 0.0512*
Lactate 20.31 ± 2.14 32.04 ± 1.57 0.00418*** 18.22 ± 3.18 15.94 ± 4.46 0.719
Leucine 7.33 ± 0.22 6.62 ± 0.46 0.243 7.53 ± 1.09 3.79 ± 0.78 0.0372**
Phenylalanine 2.02 ± 0.10 2.06 ± 0.20 0.895 2.30 ± 0.30 1.23 ± 0.27 0.0436**
Proline 8.38 ± 0.73 8.76 ± 0.47 0.704 11.48 ± 1.95 5.41 ± 1.42 0.0549*
Pyruvate 0.87 ± 0.12 1.40 ± 0.15 0.0388** 0.94 ± 0.16 0.64 ± 0.11 0.21
Threonine 11.06 ± 1.94 10.60 ± 1.84 0.88 16.51 ± 2.96 9.29 ± 3.14 0.172
Tyrosine 2.75 ± 0.27 2.51 ± 0.34 0.635 3.54 ± 0.46 2.25 ± 0.57 0.133
Valine 8.68 ± 0.75 8.27 ± 1.05 0.781 11.32 ± 2.17 5.45 ± 0.79 0.0527*
Myo-Inositol 2.73 ± 0.29 2.45 ± 0.15 0.475 3.38 ± 0.53 2.35 ± 0.94 0.418

FIG 2

Figure 2: Significant difference of metabolites in plasma by exercise in Jeju pony (A) and Thoroughbreds (B). *p<0. 1, **p<0.05, ***p<0.01, ****p<0.001. All values expressed in mM as mean ± SD.

FIG 3

Figure 3: Significant difference of metabolites in urine by exercise in Thoroughbreds. *p<0. 1, **p<0.05, ***p<0.01, ****p<0.001. All values expressed in mM as mean ± SD.

Comparison of Metabolites between Equine Breeds (Thoroughbred and Jeju Pony)

In addition, we compared the metabolites between thoroughbred and Jeju pony under exercise stimuli (Tables 4-7). A greater difference was found between the metabolites released by the two breeds after exercise than before exercise in all sample types. Citrate and histidine were significantly released before exercise (Figure 4A), and 16 metabolites, including betaine and citrate, were significantly released after exercise in plasma in both breeds (Figure 4B). Among them, citrate values tripled in samples collected after exercise in both breeds and betaine and pyruvate showed largest difference between species (Figure 4B). In urine samples, six metabolites, including creatine and creatinine, showed significant differences between breeds (Figure 5). The release of taurine and myo-inositol was significantly different by more than 3.5-fold between breeds before exercise (Figure 5A) and five metabolites (creatine, creatinine, trimethylamine N-oxide, urea, and myo-inositol) were significantly different after exercise (Figure 5B). Creatine, urea, and myo-inositol more than doubled their values in urine samples after exercise (Figure 5). Although sweat samples were difficult to collect before exercise, we still analyzed sweat metabolite patterns after exercise. Among 39 metabolites, 30, including 2-hydroxybutyrate, showed significant differences between species (Table 6). Interestingly, most detected metabolites had a higher value in Jeju pony than in thoroughbred horses.

Table 4: Expression pattern of urine metabolites overlapped among plasma, urine and sweat

Metabolites

Jeju Horse


Thoroughbreds


Before (Mean ± SE) mM


After (Mean ± SE) mM


p value


Before (Mean ± SE) mM


After (Mean ± SE) mM


p value


Acetate 0.56 ± 0.14 0.41 ± 0.10 0.366 0.38 ± 0.12 0.43 ± 0.09 0.778
Alanine 0.04 ± 0.01 0.06 ± 0.02 0.573 0.03 ± 0.01 0.05 ± 0.01 0.0707*
Creatine 0.43 ± 0.32 0.09 ± 0.02 0.331 0.11 ± 0.04 0.17 ± 0.03 0.285
Glucose 0.43 ± 0.08 0.61 ± 0.10 0.285 0.27 ± 0.05 0.64 ± 0.09 0.00719***
Glycine 6.45 ± 4.42 0.39 ± 0.10 0.207 0.15 ± 0.04 0.23 ± 0.08 0.388
Isoleucine 0.06 ± 0.01 0.08 ± 0.01 0.165 0.05 ± 0.01 0.11 ± 0.03 0.107
Lactate 0.12 ± 0.04 0.13 ± 0.02 0.92 0.07 ± 0.02 0.13 ± 0.03 0.108
Leucine 0.08 ± 0.01 0.12 ± 0.02 0.308 0.10 ± 0.03 0.16 ± 0.03 0.16
Phenylalanine 0.48 ± 0.10 0.43 ± 0.08 0.793 0.31 ± 0.10 0.54 ± 0.11 0.158
Proline 0.49 ± 0.08 0.68 ± 0.17 0.2 0.32 ± 0.08 0.60 ± 0.10 0.076*
Pyruvate 0.11 ± 0.02 0.14 ± 0.05 0.71 0.08 ± 0.02 0.15 ± 0.02 0.0676*
Threonine 0.34 ± 0.10 0.19 ± 0.04 0.244 0.16 ± 0.04 0.29 ± 0.05 0.0783*
Tyrosine 0.48 ± 0.13 0.50 ± 0.11 0.924 0.36 ± 0.10 0.63 ± 0.11 0.114
Valine 0.06 ± 0.01 0.08 ± 0.01 0.349 0.07 ± 0.02 0.12 ± 0.03 0.177
Myo-Inositol 1.00 ± 0.19 1.15 ± 0.16 0.288 0.27 ± 0.06 0.41 ± 0.06 0.166

Table 5: Metabolite comparison between Thoroughbreds and jeju pony in plasma

Metabolites

Before (Mean ± SE) mM After (Mean ± SE) mM


TH


JH


p value


TH


JH


p value


Acetate 17.10 ± 3.49 13.30 ± 1.77 0.409 15.02 ± 1.38 16.44 ± 1.49 0.55
Alanine 16.39 ± 2.46 15.26 ± 1.35 0.729 10.78 ± 3.18 17.09 ± 1.82 0.162
Betaine 3.73 ± 1.06 3.59 ± 0.17 0.908 1.41 ± 0.34 3.17 ± 0.16 0.003***
Citrate 2.99 ± 0.36 4.09 ± 0.33 0.081** 1.48 ± 0.33 4.51 ± 0.37 0.0006****
Creatine 2.75 ± 0.41 3.53 ± 0.32 0.213 1.79 ± 0.43 3.52 ± 0.22 0.012**
Glucose 104.00 ± 15.69 118.24 ± 9.10 0.502 51.79 ± 9.70 98.81 ± 5.52 0.005***
Glutamate 9.08 ± 1.46 11.01 ± 0.67 0.315 4.07 ± 0.67 7.18 ± 0.71 0.022**
Glutamine 10.07 ± 1.89 9.98 ± 0.98 0.971 3.88 ± 0.50 7.61 ± 0.49 0.001***
Glutathione 24.70 ± 4.59 21.68 ± 1.19 0.584 12.90 ± 3.15 17.66 ± 1.52 0.259
Glycerol 3.28 ± 0.50 4.39 ± 0.27 0.118 2.64 ± 0.94 3.79 ± 0.15 0.311
Glycine 31.44 ± 7.79 26.46 ± 2.95 0.607 14.75 ± 2.62 23.95 ± 2.58 0.06*
Histidine 13.92 ± 2.01 8.56 ± 0.92 0.0621** 6.57 ± 1.55 8.70 ± 0.97 0.329
Isoleucine 2.46 ± 0.40 2.30 ± 0.19 0.759 1.18 ± 0.30 2.00 ± 0.24 0.089*
Lactate 18.22 ± 3.18 20.31 ± 2.14 0.639 15.94 ± 4.46 32.04 ± 1.57 0.016**
Leucine 7.53 ± 1.09 7.33 ± 0.22 0.877 3.79 ± 0.78 6.62 ± 0.46 0.024**
Lysine 59.40 ± 17.18 19.49 ± 9.91 0.11 39.78 ± 16.49 16.19 ± 8.54 0.289
Malonate 3.22 ± 0.42 3.98 ± 0.45 0.302 1.82 ± 0.58 3.19 ± 0.28 0.094*
Ornithine 6.46 ± 2.44 10.88 ± 3.31 0.364 3.35 ± 0.82 9.22 ± 3.22 0.152
Phenylalanine 2.30 ± 0.30 2.02 ± 0.10 0.455 1.23 ± 0.27 2.06 ± 0.20 0.056*
Proline 11.48 ± 1.95 8.38 ± 0.73 0.219 5.41 ± 1.42 8.76 ± 0.47 0.081*
Pyruvate 0.94 ± 0.16 0.87 ± 0.12 0.775 0.64 ± 0.11 1.40 ± 0.15 0.00625***
Serine 18.34 ± 3.74 15.52 ± 0.96 0.532 10.33 ± 3.30 14.46 ± 1.86 0.357
Threonine 16.51 ± 2.96 11.06 ± 1.94 0.205 9.29 ± 3.14 10.60 ± 1.84 0.756
Tyrosine 3.54 ± 0.46 2.75 ± 0.27 0.222 2.25 ± 0.51 2.51 ± 0.34 0.718
Valine 11.32 ± 2.17 8.68 ± 0.75 0.335 5.45 ± 0.79 8.27 ± 1.05 0.0917*
myo-Inositol 3.38 ± 0.53 2.73 ± 0.29 0.362 2.35 ± 0.94 2.45 ± 0.15 0.927

Table 6: Metabolite comparison between Thoroughbreds and jeju pony in Urine

Metabolites

Before (Mean ± SE) mM


After (Mean ± SE) mM


TH


JH


p value


TH


JH


p value


2-Oxovalerate 0.09 ± 0.02 0.12 ± 0.03 0.378 0.22 ± 0.05 0.14 ± 0.03 0.338
3-Aminoisobutyrate 0.28 ± 0.07 0.29 ± 0.07 0.882 0.48 ± 0.08 0.41 ± 0.12 0.851
3-Hydroxyisovalerate 0.06 ± 0.01 0.04 ± 0.00 0.34 0.10 ± 0.02 0.08 ± 0.04 0.971
Acetate 0.38 ± 0.12 0.56 ± 0.14 0.362 0.43 ± 0.09 0.41 ± 0.1 0.946
Acetoacetate 0.17 ± 0.05 0.18 ± 0.04 0.949 0.47 ± 0.20 0.21 ± 0.04 0.231
Alanine 0.03 ± 0.01 0.04 ± 0.01 0.103 0.05 ± 0.01 0.06 ± 0.02 0.628
Arginine 0.29 ± 0.10 0.43 ± 0.12 0.397 0.32 ± 0.08 0.60 ± 0.2 0.246
Benzoate 0.07 ± 0.02 5.73 ± 3.49 0.143 0.05 ± 0.01 0.06 ± 0.01 0.937
Citrulline 0.30 ± 0.07 0.41 ± 0.07 0.298 0.58 ± 0.10 0.61 ± 0.15 0.735
Creatine 0.11 ± 0.04 0.43 ± 0.32 0.342 0.17 ± 0.03 0.09 ± 0.02 0.0719*
Creatinine 11.73 ± 3.30 11.90 ± 2.37 0.968 17.00 ± 2.32 8.84 ± 2.61 0.0733*
Dimethylamine 0.13 ± 0.03 0.18 ± 0.03 0.272 0.16 ± 0.03 0.20 ± 0.03 0.34
Glucose 0.27 ± 0.05 0.43 ± 0.08 0.146 0.64 ± 0.09 0.61 ± 0.1  0.928
Glutamine 0.37 ± 0.09 0.54 ± 0.08 0.217 0.70 ± 0.13 0.53 ± 0.1 0.502
Glutarate 0.08 ± 0.02 0.12 ± 0.02 0.299 0.19 ± 0.05 0.13 ± 0.03 0.585
Glycine 0.15 ± 0.04 6.45 ± 4.42 0.191 0.23 ± 0.08 0.39 ± 0.1 0.205
Hippurate 26.02 ± 8.77 19.32 ± 3.47 0.498 53.58 ± 15.38 35.04 ± 7.85 0.381
Isoleucine 0.05 ± 0.01 0.06 ± 0.01 0.814 0.11 ± 0.03 0.08 ± 0.01 0.313
Lactate 0.07 ± 0.02 0.12 ± 0.04 0.266 0.13 ± 0.03 0.13 ± 0.02 0.976
Leucine 0.10 ± 0.03 0.08 ± 0.01 0.553 0.16 ± 0.03 0.12 ± 0.02 0.405
Methylsuccinate 0.14 ± 0.04 0.15 ± 0.02 0.814 0.30 ± 0.07 0.21 ± 0.05 0.474
N-Isovaleroylglycine 0.10 ± 0.02 0.13 ± 0.03 0.502 0.16 ± 0.01 0.14 ± 0.03 0.831
N-Phenylacetylglycine 5.94 ± 1.38 7.40 ± 1.50 0.494 10.96 ± 1.83 8.63 ± 1.34 0.524
Phenylalanine 0.31 ± 0.10 0.48 ± 0.10 0.264 0.54 ± 0.11 0.43 ± 0.08 0.687
Proline 0.32 ± 0.08 0.49 ± 0.08 0.198 0.60 ± 0.10 0.68 ± 0.17 0.466
Pyruvate 0.08 ± 0.02 0.11 ± 0.02 0.44 0.15 ± 0.02 0.14 ± 0.05 0.998
Succinate 0.03 ± 0.01 0.04 ± 0.01 0.197 0.05 ± 0.01 0.03 ± 0.01 0.419
Taurine 0.23 ± 0.06 0.86 ± 0.23 0.0312** 0.78 ± 0.17 1.16 ± 0.41 0.738
Threonine 0.16 ± 0.04 0.34 ± 0.10 0.127 0.29 ± 0.05 0.19 ± 0.04 0.3
Trimethylamine 0.03 ± 0.01 0.04 ± 0.01 0.138 0.04 ± 0.00 0.02 ± 0 0.198
Trimethylamine N-oxide 0.15 ± 0.05 0.20 ± 0.06 0.553 0.11 ± 0.02 0.22 ± 0.03 0.025**
Tryptophan 0.26 ± 0.07 0.29 ± 0.03 0.69 0.50 ± 0.09 0.47 ± 0.08 0.973
Tyrosine 0.36 ± 0.10 0.48 ± 0.13 0.512 0.63 ± 0.11 0.50 ± 0.11 0.636
Urea 84.58 ± 16.17 79.19 ± 9.54 0.782 173.25 ± 11.44 103.46 ± 9.89 0.00177***
Valine 0.07 ± 0.02 0.06 ± 0.01 0.842 0.12 ± 0.03 0.08 ± 0.01 0.322
Myo-Inositol 0.27 ± 0.06 1.00 ± 0.19 0.0062*** 0.41 ± 0.06 1.15 ± 0.16 0.00639***

Table 7: Metabolite comparison between Thoroughbreds and jeju pony in Sweat

Metabolites

Before (Mean ± SE) mM


TH


JH


p value


2-Hydroxybutyrate 0.05 ± 0.01 0.28 ± 0.08 0.0505*
Acetate 1.06 ± 0.42 2.15 ± 0.29 0.331
Acetoin 0.00 ± 0.00 0.05 ± 0.00 1.07e-05****
Alanine 0.14 ± 0.05 1.40 ± 0.37 0.0281**
Arginine 0.06 ± 0.02 1.06 ± 0.48 0.108
Benzoate 0.03 ± 0.01 0.26 ± 0.10 0.095*
Betaine 0.01 ± 0.00 0.06 ± 0.02 0.0602*
Choline 0.00 ± 0.00 0.01 ± 0.00 0.00326***
Citrate 0.49 ± 0.06 8.16 ± 3.08 0.0693*
Creatine 0.03 ± 0.01 0.18 ± 0.01 0.000221****
Creatinine 0.07 ± 0.03 0.12 ± 0.04 0.532
Formate 0.18 ± 0.04 0.49 ± 0.02 0.00646***
Fumarate 0.01 ± 0.00 0.05 ± 0.01 0.0561*
Glucose 0.17 ± 0.06 1.55 ± 0.36 0.0223**
Glutamate 0.08 ± 0.01 0.45 ± 0.08 0.00996***
Glycerate 0.07 ± 0.02 0.31 ± 0.02 0.00222***
Glycerol 0.10 ± 0.02 1.18 ± 0.20 0.00578***
Glycine 0.14 ± 0.05 1.70 ± 0.47 0.0299**
Histidine 0.02 ± 0.00 0.63 ± 0.41 0.215
Homoserine 0.06 ± 0.01 0.33 ± 0.12 0.114
Isoleucine 0.03 ± 0.01 0.20 ± 0.06 0.0457**
Lactate 0.43 ± 0.14 5.90 ± 1.92 0.0519*
Leucine 0.04 ± 0.01 0.23 ± 0.06 0.0324**
Lysine 0.02 ± 0.01 0.19 ± 0.06 0.057*
Mannose 0.10 ± 0.03 0.16 ± 0.01 0.0367**
N-Methylhydantoin 0.00 ± 0.00 0.03 ± 0.01 0.0339**
Phenylacetate 0.02 ± 0.00 0.07 ± 0.03 0.129
Phenylalanine 0.02 ± 0.00 0.21 ± 0.06 0.0362**
Proline 0.06 ± 0.01 0.19 ± 0.04 0.0648*
Pyroglutamate 0.15 ± 0.05 1.61 ± 0.58 0.0639*
Pyruvate 0.10 ± 0.03 0.84 ± 0.01 1.44e-05****
Serine 0.18 ± 0.06 2.77 ± 1.41 0.138
Taurine 0.02 ± 0.00 0.08 ± 0.01 0.000513****
Threonine 0.04 ± 0.01 0.53 ± 0.27 0.15
Tyrosine 0.02 ± 0.00 0.13 ± 0.04 0.0503*
Urea 10.05 ± 1.98 7.93 ± 3.51 0.894
Urocanate 0.04 ± 0.01 0.24 ± 0.06 0.0283**
Valine 0.04 ± 0.01 0.26 ± 0.08 0.0506*
Myo-Inositol 0.06 ± 0.01 0.25 ± 0.04 0.0134**

FIG 4

Figure 4: Significant difference of metabolites in plasma between breeds (Jeju pony and Thoroughbreds) before (A) and After exercise (B). *p<0. 1, **p<0.05, ***p<0.01, ****p<0.001. All values expressed in mM as mean ± SD.

FIG 5

Figure 5: Significant difference of metabolites in urine between breeds (Jeju pony and Thoroughbreds) before (A) and after exercise (B). *p<0. 1, **p<0.05, ***p<0.01, ****p<0.001. All values expressed in mM as mean ± SD.

Discussion

Almost 60 million horses currently exist on the planet. In addition to providing important services such as transport, meat, leather, and ploughing force and in the majority of developing countries, horses are mainly used for sports and leisure activities in most developed countries [13]. Therefore, as one of their most important economic traits, most research conducted in horses focuses on improving their athletic abilities [14,15]. However, although their physical and physiological adaptations receive much attention [16], targeted genes and metabolites or underlying mechanisms associated with exercise are still understudied.

The advances in metabolic analysis technology that have been carried out allow the assessment of the physiological state of individuals [17] and prediction of their condition [18]. Therefore, metabolomics demonstrates various biological responses to environmental influences, genetic, transcriptomic, and proteomic, [19-21]. Because of these advantages, metabolic analysis is widely used to explore metabolic patterns [22] or to discover new biomarkers through physical changes associated with diseases or environmental changes [21,23].

Although previous studies have investigated the metabolic changes caused by exercise, most only analyzed skeletal muscle [24] and were further limited by their small sample size and little expansive metabolite platform [25]. Previous metabolic studies on exercise mainly focus on the effect of exercise in various tissues [26,27], and studies on the discovery of biomarkers, which are affected by the athletic ability of individuals, are relatively poorly performed. Jang et al., 2017, the basis of this study, conducted a metabolic analysis in skeletal muscle, plasma, and urine samples after exercise [11]. In this study, we performed a metabolic analysis in plasma, urine, and sweat samples of thoroughbred and Jeju pony by exercise. In addition, we demonstrated the influence of exercise and breed in metabolite levels. We obtained a large amount of metabolite data that were released after exercise. Among 15 metabolites that were commonly detected in plasma, urine, and sweat, the levels of lactate, pyruvate, glucose, isoleucine, leucine, phenylalanine, proline, and valine showed significantly changes after exercise in plasma samples (Figure 2), and the levels of alanine, glucose, proline, pyruvate, and threonine had significantly changed after exercise in urine samples (Figure 3). These results are in line with those of previous studies [11]. The metabolites observed in samples collected after exercise were all associated with the tricarboxylic acid (TCA) cycle, with some being intermediate products. Alanine, aspartate, and glutamate metabolism and aminoacyl-tRNA and arginine biosynthesis related metabolic pathways are activated by acute exercise [28]. These results suggest that several metabolic pathways that utilize skeletal muscle substrate are regulated after exercise, and previous studies reported that this occurs in various tissues [29,30].

During exercise, muscle glycogen, its main source of energy, is altered to glucose and subsequently to pyruvate via glycolysis [31]. The pyruvate converted by glycolysis can enter TCA and glucose-alanine cycles or be converted to lactate [32]. During aerobic exercise, muscle glycogen can be used to produce ATP through glycolysis; however, when anaerobic exercise like a sprint is conducted, the muscles cannot use oxygen for glycolysis [33]. Therefore, muscle glycogen (glucose) is altered to lactate through anaerobic glycolysis [33]. Then, the lactate is released to the bloodstream and transferred to the kidneys and liver [34]. In the liver, lactate is altered to pyruvate through gluconeogenesis [35]. In addition, when amino acids are used for energy in extrahepatic tissues, pyruvate derived from the glycolysis is used as an amino group receptor to form alanine, a non-essential amino acid [36]. The produced alanine is transferred to the liver through the bloodstream and converted to either pyruvate for gluconeogenesis via the glycose–alanine cycle or to glutamate, which then goes through the urea cycle. Collectively, the detected metabolites in equine plasma and urine including glucose, alanine, and lactate were altered to pyruvate and used for energy production. Therefore, the metabolites discovered in this study can be used as a reasonable indicator to measure athletic ability and exercise fatigue.

In conclusion, we compared metabolite presence between thoroughbreds and Jeju pony after exercise and analyzed enriched metabolic pathways of commonly detected metabolites in all samples (plasma, urine, and sweat). Our results could help improve our understanding of exercise fatigue and find regulation markers for fatigue reduction. Further research is necessary to combine these results with other omics data and reveal the function of metabolic markers.

Declarations

Ethics Approval and Consent to Participate

All animal procedures used in the study were conducted in compliance with international standards and were approved by the Institutional Animal Care and Use Committee of Pusan National University (Approval Number: PNU-2015-0864).

Competing Interests

The authors declare that they have no competing interests.

Acknowledgments

This work was supported by a 2-Year Research Grant from the Pusan National University.

Author’s Contribution

The research was conceptualized by Park JW, Cho BW and further edition was done by all the authors.  Data was curated by Park JW, Kim KH, and analyzed by Park JW, Lee SI, Sang SS. All authors have participated on data interpretation. The draft of the manuscript was written by Park JW and Kim KH, and the final form was edited by Lee SI, Sang SS, and Cho BW. All authors have contributed by interpretation, analysis, critical discussion.

References

  1. Kim H, Lee T, Park W, Lee JW, Kim J, et al. (2013) Peeling back the evolutionary layers of molecular mechanisms responsive to exercise-stress in the skeletal muscle of the racing horse. DNA Res 20: 287-298. [crossref]
  2. PARK Jeong-Woong, Choi JY, Hong SA, Kim NY, Do KT, et al. (2017) Exercise induced upregulation of glutamate-cysteine ligase catalytic subunit and glutamate-cysteine ligase modifier subunit gene expression in Thoroughbred horses. Asian-Australasian Journal of animal sciences 30: 728-735. [crossref]
  3. CHO Hyun-Woo, Shin S, Park JW, Choi JY, Kim NY, et al. (2015) Molecular characterization and expression analysis of the peroxisome proliferator activated receptor delta (PPARδ) gene before and after exercise in horse. Asian-Australasian Journal of Animal Sciences 28: 697. [crossref]
  4. KHUMMUANG Saichit, Lee HG, Joo SS, Park JW, Choi JY, et al. (2020) Comparison for immunophysiological responses of Jeju and Thoroughbred horses after exercise. Asian-Australasian Journal of Animal Sciences 33: 424-435. [crossref]
  5. PARK Jeong-Woong, Kim KH, Choi JK, Park TS, Song KD, et al. (2021) Regulation of toll-like receptors expression in muscle cells by exercise-induced stress. Animal Bioscience 34: 1590. [crossref]
  6. LEE Hyo Gun, Choi JY, Park JW, Park TS, Song KD, et al. (2019) Effects of exercise on myokine gene expression in horse skeletal muscles. Asian-Australasian Journal of Animal Sciences 32: 350-356. [crossref]
  7. Jordan Kate W, Nordenstam J, Lauwers GY, Rothenberger DA, Alavi K, et al. (2009) “Metabolomic characterization of human rectal adenocarcinoma with intact tissue magnetic resonance spectroscopy.” Diseases of the colon and rectum 52: 520. [crossref]
  8. Hargreaves Mark (2000) “Skeletal muscle metabolism during exercise in humans.” Clinical and Experimental Pharmacology and Physiology 27: 225-228. [crossref]
  9. Moghetti Paolo, Bacchi E, Brangani C, Donà S, Negri C (2016) “Metabolic effects of exercise.” Sports Endocrinology 47: 44-57. [crossref]
  10. Jang Hyun-Jun, Kim DM, Kim KB, Park JW, Choi JY, et al. (2017) “Analysis of metabolomic patterns in thoroughbreds before and after exercise.” Asian-Australasian journal of animal sciences 30: 1633-1642. [crossref]
  11. PANG Zhiqiang, Zhou G, Ewald J, Chang L, Hacariz O, et al. (2022) Using MetaboAnalyst 5.0 for LC–HRMS spectra processing, multi-omics integration and covariate adjustment of global metabolomics data. Nature Protocols 17: 1735-1761. [crossref]
  12. ORLANDO Ludovic (2020) The evolutionary and historical foundation of the modern horse: Lessons from ancient genomics. Annual Review of Genetics 54: 563-581. [crossref]
  13. Wilkin Tessa, Anna Baoutina, Natasha Hamilton (2017) “Equine performance genes and the future of doping in horseracing.” Drug testing and analysis 9: 1456-1471. [crossref]
  14. Arfuso Francesca, Assenza A, Fazio F, Rizzo M, Giannetto C, et al. (2019) “Dynamic change of serum levels of some branched-chain amino acids and tryptophan in athletic horses after different physical exercises.” Journal of equine veterinary science 77: 12-16. [crossref]
  15. Arfuso Francesca, Giudice E, Panzera M, Rizzo M, Fazio F, et al. (2022) “Interleukin-1Ra (Il-1Ra) and serum cortisol level relationship in horse as dynamic adaptive response during physical exercise.” Veterinary Immunology and Immunopathology 243: 110368. [crossref]
  16. SABATINE Marc S, Liu E, Morrow DA, Heller E, McCarroll R, et al. (2005) Metabolomic identification of novel biomarkers of myocardial ischemia. Circulation 112: 3868-3875. [crossref]
  17. SHAH Svati H, Bain JR, Muehlbauer MJ, Stevens RD, Crosslin DR, et al. (2010) Association of a peripheral blood metabolic profile with coronary artery disease and risk of subsequent cardiovascular events. Circulation: Cardiovascular Genetics 3: 207-214. [crossref]
  18. GERMAN J Bruce, HAMMOCK Bruce D, WATKINS Steven M (2005) Metabolomics: building on a century of biochemistry to guide human health. Metabolomics 1: 3-9. [crossref]
  19. OREŠIČ Matej, VIDAL-PUIG Antonio, HÄNNINEN Virve (2006) Metabolomic approaches to phenotype characterization and applications to complex diseases. Expert review of molecular diagnostics 6: 575-585. [crossref]
  20. MOORE Rowan E, Kirwan J, Doherty MK, Whitfield PD (2007) Biomarker discovery in animal health and disease: the application of post-genomic technologies. Biomarker insights 2: 185-196. [crossref]
  21. KELL Douglas B (2004) Metabolomics and systems biology: making sense of the soup. Current opinion in microbiology 7: 296-307. [crossref]
  22. WHITFIELD, Phillip David, et al. (2005) Metabolomics as a diagnostic tool for hepatology: validation in a naturally occurring canine model. Metabolomics 1: 215-225.
  23. HUFFMAN Kim M, Koves TR, Hubal MJ, Abouassi H, Beri N, et al. (2014) Metabolite signatures of exercise training in human skeletal muscle relate to mitochondrial remodelling and cardiometabolic fitness. Diabetologia 57: 2282-2295. [crossref]
  24. HUFFMAN Kim M, Slentz CA, Bateman LA, Thompson D, Muehlbauer MJ, et al. (2011) Exercise-induced changes in metabolic intermediates, hormones, and inflammatory markers associated with improvements in insulin sensitivity. Diabetes Care 34: 174-176. [crossref]
  25. BRENNAN Andrea M, Benson M, Morningstar J, Herzig M, Robbins J, et al. (2018) Plasma metabolite profiles in response to chronic exercise. Medicine and science in sports and exercise 50: 1480-1486. [crossref]
  26. BRENNAN Andrea M, Tchernof A, Gerszten RE, Cowan TE, Ross R (2018) Depot-specific adipose tissue metabolite profiles and corresponding changes following aerobic exercise. Frontiers in Endocrinology 9: 759. [crossref]
  27. TABONE Mariangela, et al. (2021) The effect of acute moderate-intensity exercise on the serum and fecal metabolomes and the gut microbiota of cross-country endurance athletes. Scientific reports 11: 1-12.
  28. MANAF Faizal A, Lawler NG, Peiffer JJ, Maker GL, Boyce MC, et al. (2018) Characterizing the plasma metabolome during and following a maximal exercise cycling test. Journal of Applied Physiology 125: 1193-1203. [crossref]
  29. HEINONEN Ilkka, Kalliokoski KK, Hannukainen JC, Duncker DJ, Nuutila P, et al. (2014) Organ-specific physiological responses to acute physical exercise and long-term training in humans. Physiology 29: 421-436. [crossref]
  30. SPRIET Lawrence L (2002) Regulation of skeletal muscle fat oxidation during exercise in humans. Medicine and science in sports and exercise9: 1477-1484. [crossref]
  31. ISHIKURA, Keisuke; RA, Song-Gyu, OHMORI, Hajime (2013) Exercise-induced changes in amino acid levels in skeletal muscle and plasma. The Journal of Physical Fitness and Sports Medicine3: 301-310.
  32. HIGGINS, Chris. Lactate and lactic acidosis. 2007. [crossref]
  33. YANG Woo-Hwi, Park H, Grau M, Heine O (2020) Decreased blood glucose and lactate: is a useful indicator of recovery ability in athletes? International Journal of Environmental Research and Public Health15: 5470. [crossref]
  34. CHIANG J (2014) Liver physiology: Metabolism and detoxification.
  35. EXTON JH, Mallette LE, Jefferson LS, Wong EH, Friedmann N, et al. (1970) The hormonal control of hepatic gluconeogenesis. In: Proceedings of the 1969 Laurentian Hormone Conference. Academic Press 411-461. [crossref]
  36. JOSE Caroline, Melser S, Benard G, Rossignol R (2013) Mitoplasticity: adaptation biology of the mitochondrion to the cellular redox state in physiology and carcinogenesis. Antioxidants & Redox Signaling7: 808-849. [crossref]

Errors during the Night Shift: An Age Management Policy is Needed for Nurses Over 55

DOI: 10.31038/IJNM.2023431


In the study “Relation between sleep deprivation and nursing errors during the night shift,” conducted on a sample of 3358 nurses, 94.7% of the respondents stated that they perform regular activities during the night shift. 16.8% of the respondents made errors in the last two night shifts, with 59.5% of the cases involving a single error. Sleep deprivation (3-5 hours of sleep within the 24 hours preceding the interview) appears to contribute to a higher frequency of errors. This tendency is particularly pronounced among nurses working in critical care units (23.9%). The number of nights worked also influences the likelihood of making errors, with an error frequency of 20.5%. The propensity to make errors is relatively high among the younger age group (17.2%), decreases in the middle age group (15.8%), and then increases again in the older age group (17.6%). We have concluded that night-time care is exhausting and demanding and can have negative effects on the quality of care provided. Therefore, healthcare organizations should support nurses in the organization of night-time care by investing in strategies for safe and quality night-time care that minimizes the negative impact on nurses’ quality of life and psycho-physical well-being. This includes increasing the number of nursing staff during the night shift. Furthermore, the authors conclude that precise age management strategies supported at the management level are needed to minimize the negative effects of the current situation and to enhance the skills that increase in quantity and quality with work experience, utilizing them as valuable resources within the system.

A significant portion of the global and Italian nursing workforce is represented by those over 55. According to the “Health Profile 2019” for Italy published by the OECD and the European Commission in 2020, available on the FNOPI website, the majority of nurses are concentrated in the age group between 36 and 55 years: 268,914. There are also 15,552 nurses between 20 and 25 years old and 13,259 nurses over 65. The “younger” nurses (up to 58 years old with over 30 years of professional experience) number over 30,000. Nurses over 60 (with over 30 years of professional experience) amount to just over 13,000, and nurses up to 28 years old, at risk of underemployment/unemployment, are 39,000. Finally, nurses over 60 without more than 30 years of professional experience amount to approximately 25,000. Nurses over 55 are an important segment of the nursing profession who, along with advancing age and years of service, face a range of psychophysical issues that make it difficult to ensure efficient work performance. Despite this, healthcare companies do not pay attention to this age group of nurses. What would nurses want for their careers in the years leading up to retirement?

A survey conducted at the Modena Local Health Authority investigated the organizational health status of workers over 50, their perceptions, motivations, health issues, and proposed measures to raise awareness of the phenomenon of aging in the profession and suggest improvement actions to be tested within the company. Nurses who participated in the survey listed some self-strategies to mitigate the impact of aging and strategies to suggest to the organizational system.

Self-strategies:

  • Invest in personal professional development and participate in individual training courses.
  • Maintain a part-time employment contract.
  • Have more hours of rest.
  • Achieve a balanced use of absences from work for psycho-physical recovery by reviewing the threshold for illness and the use of contractually defined leaves.
  • Request authorization for extended ordinary leave of at least 4-5 consecutive days for rest and better vacation planning.
  • Strategies to suggest to the organizational system:
  • Value the experience gained by older nurses by combining the energy and vitality of younger nurses with the knowledge and experience of older ones. The value of older nurses should be measured by recognizing their wealth of skills and field experience, different culture, and being the key to the company’s historical memory, as older nurses are loyal to their work due to cultural and generational factors.
  • Identify older nurses who can facilitate the integration of newly hired nurses.
  • Mentoring, the process of knowledge transfer through the support of newly hired or nursing students, can play a significant role in work organization.
  • Motivate older nurses by bridging their technological training gaps. Older nurses today face greater difficulty in adapting to new technologies.
  • Employ older nurses in less stressful services with lower workloads, services that require experience and good relational skills more than physical endurance.
  • Exempt employees over 55, upon request, from night shifts and on-call shifts, and ensure a regular schedule to allow for psycho-physical recovery.

Grandparents’ Family Functions in Grandchildrearing in Japan, and Its Effect Factors

DOI: 10.31038/IJNM.2023424

Abstract

Midwives have the role of helping grandparents enhance their family functions as they welcome new family members. However, their specific functions and effect factors remain unclear. Therefore, we conducted a survey with the aim of clarifying the family function of grandparents in raising grandchildren. We conducted an online survey of 2,000 Japanese grandparents and analyzed the data using factor analysis and multiple regression.

Four functions of the grandparents were revealed: daily care and healthcare, emotional support for parents, grandchildren’s character development, and own well-being. Raising grandchildren exerts a great influence on family dynamics. Grandparents who did not feel burdened reported that grandchild-rearing was one of their lives’ passions and helped them maintain their strength and youth. To enhance their family functions grandparents, it is necessary to assess the four functions of grandparents, support them in maintaining an appropriate distance from their grandchildren and parents, and set up a forum for discussion between grandparents and parents.

Keywords

Childcare, Family function, Grandchildren, Grandparents

Contribution to the Field

  • The family function of grandparents in raising Japanese grandchildren was clarified. Therefore, in the future, the viewpoints of the four family functions mentioned above will be used as an assessment tool, which may lead to the implementation of midwives’ care that enhances the family functions of grandparents.
  • To improve the quality of life of grandparents, the need to maintain a moderate distance from grandchildren was revealed. New grandparents of both sexes can be educated in advance about the role of grandparents.

Introduction

Against the backdrop of declining family functions, problems such as depression, suicide among pregnant women [1], and infant abuse continue to persist [2]. The birth of a new child represents a developmental crisis because the family roles of both parents and grandparents change considerably. The main purpose of family support is to enable families welcoming new children to smoothly fulfill their roles and functions and enhance family functions. In Japan, for grandparents, the birth of a grandchild is the achievement of family succession, and the involvement of grandparents in childcare improves the grandparents’ own quality of life [3,4]. For mothers, the influence of grandparents has the merits of physical recovery after childbirth, elimination of anxiety about childcare, and passing on childcare skills [5]. In recent years, the employment rate of Japanese mothers has increased [6]. Mothers need access to formal childcare schemes [7] and informal family support to balance childcare and work. The Japanese tend to choose informal support from grandparents when they need childcare support [8,9]. Furthermore, 53% of Japanese couples receive childcare support from their mothers until their children are three years old. If wives are employed, this number rises to 58% [6]. In addition, the role of grandparents as caretakers of grandchildren is associated with an increase in the number of births [10]. All of this indicates a growing expectation that grandparents will take on a role in providing childcare for their grandchildren. However, involvement in grandchild-rearing adds a physical and emotional burden on grandparents [11,12]. Differences in childcare policies between mothers and grandparents have created issues such as burden and stress on mothers [5,13]. In the future, as the average life expectancy increases further [14] it is conceivable that as grandparents get older, the physical burden will increase, making it more difficult for them to be involved in the regular rearing of their grandchildren [15]. Midwives have a role to play in helping families, including grandparents, adapt to the birth of a new child [16]. Therefore, it is necessary to assess the family functions of grandparents and provide appropriate support. In recent years, grandparents who welcome new grandchildren have been educated about childcare and the roles of grandparents so that they can understand the role and take charge of raising their grandchildren [17]. However, these supports are not sufficient to meet the needs of grandparents because they are care plans based on an assessment of the family functions of grandparents raising grandchildren and remain ambiguous. Previous studies have cited the role of grandparents as providing basic care to their grandchildren, ensuring their safety and health [18] and identifying themselves as role models and educators [18-20]. In addition, the extent and impact of grandparents’ involvement in parenting have been clarified, but the exact family functions of grandparents remain unknown. Grandparents often refer to the ambiguity of their role within the family and the concomitant challenge of adjusting the parents’ roles, which can lead to the drawing of boundaries and severing of family ties [21]. Therefore, it is necessary to clarify the role function of grandparents responsible for raising grandchildren to support the family so that they can perform individual functions in the family without crossing boundaries. Accordingly, this study aimed to determine grandparents’ family functions in grandchild-rearing in Japan and factors that influence them.

Methods and Materials

Operational Definitions and Conceptual Framework

Grandparents

Men and women with grandchildren between 0 and 5 years of age, with the infants’ parents being over the age of 40.

Grandparents’ Family Functions

Grandparents’ family function was defined as the state in which grandparents maintain and improve their own well-being in harmony with their work, hobbies, and community activities while building relationships with their own children and their children’s families [22].

Research Design

This cross-sectional observational study used a questionnaire survey.

Participants

The sample comprised 2,000 individuals (50% women), 40–89 years of age, with preschool-aged grandchildren with whom they interacted at least once a year.

Survey Period and Methodology

In July 2021, we commissioned a Japanese internet research firm to conduct an online survey, ensuring participants’ anonymity. The sample was selected from a list of people registered with this firm. The internet research company’s monitors are registered in accordance with the rules and have 1.12 million monitors. Participants were selected from among them.

Survey Contents

Participants’ Attributes and the Burden of Raising a Grandchild

The participant attributes surveyed included gender, age, cohabitation, and employment. The respondents who indicated being “very” (scored as 4) or “somewhat” involved (scored as 3) in their grandchildren’s development, supporting the parents, and general housework, were defined as “involved.” Those who indicated being “not very involved” (scored as 2) and having “almost no involvement” (scored as 1) were defined as “not involved.” Regarding the burden of child-rearing (e.g., caring for their grandchildren, disciplining them, supporting their parents, and doing general housework), those who indicated feeling “very” (scored as 4) and “somewhat” (scored as 3) burdened, were assigned to the “burden” group, whereas those who indicated feeling “not very burdened” (scored as 2) and “almost no burden” (scored as 1) were assigned to the “no burden” group.

Grandparents’ Family Functions

In order to clarify the family function of grandparents, 15 items that assessed grandparents’ family functions were extracted from previous studies [11,23-25]. Experts examined the constructs of the extracted items. Items were scored on a five-point Likert scale, ranging from 1 (“not at all applicable”) to 5 (“very applicable”).

Analysis Method

Basic statistics were calculated for each variable, and an exploratory factor analysis was conducted for the grandparents’ family function items. After confirming multicollinearity using the correlation coefficient variance inflation factor (VIF), a linear regression analysis (i.e., forced entry method) was conducted with the grandparents’ family functions as the dependent variables and basic attributes as the independent variables. Multiple regression analysis was conducted between the grandparents’ family functions subscale and basic attributes. Gender was coded as 0=male and 1=female. Employment and cohabitation status were both coded as 0=no and 1=yes. The dummy variables for involvement in grandchild-rearing and the degree of grandchild burden were set as 0=none and 1=yes. The significance level was set at 5%. Statistical analyses were performed using IBM’s SPSS Statistics software, Ver. 27.

Ethical Considerations

A statement clearly stating the ethical considerations (e.g., guarantee of voluntary research cooperation and anonymity, confidential handling of data after completion of the research, existence of conflicts of interest, and monitoring) was displayed on the screen before the beginning of the survey. The study was approved by the Ethical Review Committee for Nursing Research of Dokkyo Medical University (approval number: Nursing 03008). Because this was an online survey, the study participants provided informed consent by checking a box to indicate that they agree with the ethical statements that appeared on the screen.

Results

Overview of the Participants

A summary of the participants’ characteristics is presented in Table 1. The participants’ age averaged 63.4 years (6.9 SD); 67 of them (3.4%) were in their 40s, 451 (22.6%) were in their 50s, 1,092 (54.6%) were in their 60s, and 390 (19.5%) were in their 70s or older. Further, 715 participants (35.8%) lived with their grandchildren, whereas 1,285 (64.3%) did not. Additionally, 1,088 (54.4%) were involved in grandchild care, 1,085 (54.3%) were involved in supporting their own children, and 1,102 (55.1%) were not involved in general housework. Of the respondents, 1,248 (62.3%) did not feel burdened by grandchild care, 1,211 (60.6%) did not feel burdened by disciplining grandchildren, 1,624 (81.2%) did not feel burdened by supporting their own children, and 1,102 (55.1%) did not feel burdened by general housework.

Table 1: Outline of eligible persons (N=2,000)

TAB 1

Notes: 1Involvement in child-rearing: Yes (very involved, somewhat involved); No (not very involved, almost no involvement).
2Burden of child-rearing: Yes (very burdened, somewhat burdened); No (not very burdened, no burden).

Grandparents’ Family Functions and Effect Factors

The 15 items of grandparents’ family functions were confirmed by calculating basic statistics; no ceiling or floor effects were found. These items were subsequently subjected to exploratory factor analysis, based on the maximum likelihood method. Judging from the possibility of interpretation, a factor analysis of Promax rotation was performed with four factors. As a result, two items, “I am troubled by the gap between my own child-rearing experience and that of my own children” and “I try to ease the strained relationship between my grandchildren and their parents,” were deleted because their factor loadings were lower than 0.4, and factor analysis was conducted again using maximum likelihood method and Promax rotation. Table 2 presents the factor loadings.

Table 2: Grandparents’ family function: exploratory factor analysis (N=2,000)

TAB 2

Notes: Maximum likelihood method: Promax method with Kaiser normalization.
Kaiser-Meyer-Olkin .93; Bartlett spherical test of: p<0.001.

The following four dimensions of grandparents’ family function were identified: Function 1 was named daily care and health care because of its high loadings in “contributing to grandchildren’s health and growth by helping them eat and bathe,” “contributing to grandchildren’s health recovery by taking care of them when they are sick,” “taking time away from work and hobbies to take care of them,” “contributing to the stability of family life for the parental couple,” and “providing relaxation time for the parental couple by taking care of the grandchildren”. Function 2 was named emotional support for parents due to the high loadings of “I respect the parenting policies of my own children and am involved in my grandchildren’s lives,” “I watch the human development of my own children through child-rearing,” and “I ask myself whether the degree to which I help my children and their spouses with child-rearing is excessive”. Function 3 was named grandchildren’s character development owing to its high loadings for “I help my grandchildren develop lifestyle habits and learn social rules”. “I help my grandchildren learn compassion and patience,” and “I am a good role model for my grandchildren”. Function 4 was named own well-being because of its high loadings for the items “raising grandchildren is one of the things that makes life worth living,” and “being involved in my grandchildren’s lives helps me maintain my own physical strength and youthfulness”. Cronbach’s α coefficients for dimensions 1–4 were 0.91, 0.86, 0.78, 0.81, and 0.86, respectively. The inter-factor correlations are depicted in Table 3.

Table 3: Grandparents’ family function: correlation between factors

TAB 3

Note: Maximum likelihood method: Promax method with Kaiser normalization.

Linear regression analysis of grandparents’ family functions and participants’ characteristics is presented in Table 4. Multiple regression analysis was performed, with grandparents’ family functions as dependent variables and basic attributes as independent variables. All variables were included because there were no variables with r>0.8. The VIFs were all lower than 10.0; therefore, there were no problems with multicollinearity.

Table 4: Comparison of grandparents’ family function and grandparents’ attributes

TAB 4

Notes: SCs: Standardized Coefficients; NSCs: Non-Standardized Coefficients.

Function 1 was significantly affected by grandchildren’s involvement in childcare: (β=0.392, p<0.000), support for the parents (β=0.189, p<0.000), general housework (β=0.181, p<0.000), co-residence (β=0.058, p<0.003), and age (β=-0.048, p<0.009) had a significant effect.

Function 2 was significantly affected by support for their own children: (β=0.203, p<0.000), involvement in raising the grandchildren (β=0.102, p<0.000), age (β=0.056, p<0.017), and the burden of support for their own children (β=-0.066, p<0.009), and gender (β=-0.096, p<0.000).

Function 3 included involvement in childcare (β=0.285, p<0.000), support for the parents (β=0.215, p<0.000), general housework (β=0.144, p<0.000), cohabitation (β=0.074, p<0.001), gender (β=0.067, p<0.002), the burden of general housework (β=0.053, p<0.018), and the burden of support for parents (β=0.048, p<0.028). The burden of general housework (β=0.053, p<0.018), burden of support for parents (β=0.048, p<0.028), and burden of disciplining grandchildren (β=-0.084, p<0.000) had significant effects.

Function 4 was significantly affected by involvement in childcare: (β=0.284, p<0.000), support for parents (β=0.151, p<0.000), general housework (β=0.099, p<0.000), gender (β=0.080, p<0.001), and the burden of childcare (β=-0.146, p<0.000).

Discussion

Characteristics of the Target Population

Over 50% of participants were involved in grandchild-rearing, which is in line with the finding that 53% of Japanese couples receive childcare support from their grandmothers by the time their children are three years old [6] half of grandparents in China [26], and 42-44% of grandparents in Europe and other countries take care of their grandchildren [27]. In the United States, 25% of children under five years of age are in the care. Thus, it can be said that the subjects of this study are a general population.

Furthermore, 64.3% of participants did not live with their grandchildren. In a survey of Japanese people’s perceptions regarding cohabitation, 22% of respondents stated that living apart from their grandparents was preferred, but that living in the same neighborhood as their parents was ideal [28]. This suggests that Japanese people prefer to maintain a moderate distance from their parents. The reason for this may be that, for the parental generation, grandparents provide childcare support when needed, which is beneficial to both the parental and grandparental generations’ psychological health.

Grandparents’ Family Functions

The four family functions of grandparents were extracted: daily care and health care, emotional support for parents, grandchildren’s character development, and own well-being. Shiraishi and Inoue (2017) categorized grandparents’ participation in grandchild care as support for grandchildren’s daily life, support for parents’ daily life, emotional support for parents, and support for grandchildren’s emotional and social needs [29]. The three functions revealed in this study: daily care and health care, emotional support for parents, and grandchildren’s character development were consistent with Shiraishi and Inoue (2017) [29]. According to a survey by the Cabinet Office (2014), 50-60% of the parents’ generation expected grandparents to talk and play with their children and pass on their experiences and wisdom to their children, whereas 40% of the parents’ generation expected grandparents to discipline them in daily life [28]. It has also been demonstrated that grandparents perceive themselves as role models and educators [18-20]. Grandparents play an essential role in the character development of grandchildren even in today’s era of nuclear families [30-36]. In this study, the family functions of grandparents were shown by daily care and healthcare and character formation of grandchildren. It was found that grandparents are involved in the child-rearing policy of the parent couple as emotional support for parents and think about whether the scope of helping the parent couple raise the child is excessive. According to Sumikawa (2016), grandparents state that it is the role of parents to raise their grandchildren and that they are involved in “not intervening too much in the childcare of their grandchildren as grandparents” [31]. Many grandparents tend to play a supportive but non-interfering role, set clear boundaries with the parents to avoid family conflict, respect parental wishes, and ensure family harmony and consistency in parenting [32-35]. The current study shows that emotional support for parents respects the child-rearing policy of parents and couples and protects their personal growth. To enhance the family function of grandparents, it is necessary to discuss in detail the division of roles between parents and grandparents, and midwives need to set up a discussion place for parents and grandparents. The role function of grandparents’ characteristics in this study was “own well-being. Grandparents expressed that raising their grandchildren was one of their purpose in life, whereas that the function of maintaining their own health was to maintain their own health. Grandparents experience a “rejuvenating effect” by being involved in childcare [37]. It was also revealed to result in better physical health [3]. Therefore, assessing the family functions related to the health balance of grandparents themselves will lead to support according to the needs of grandparents.

Factors Affecting the Family Functioning of Grandparents

The four family functions of grandparents were affected by the degree of involvement of grandchildren. Grandparents involved in raising grandchildren scored higher on four factors. Grandparents who did not feel burdened by taking care of their grandchildren recognized that raising their grandchildren helped them maintain their physical strength and youth. For grandparents, raising grandchildren has a positive impact on their health.

Regarding gender differences, grandfathers scored higher on the function of grandchildren’s character development and own well-being, whereas grandmothers scored higher on emotional support for parents. Further, grandmothers were more likely to raise their grandchildren for longer periods [38,39]. Grandparents’ employment status had no significant effect on their family functions. However, compared to those who were unemployed, grandparents working full-time perceived child-rearing as one of their reasons for living, whereas unemployed grandparents perceived that it reduced the time they could spend on work and hobbies. Grandparents who were unemployed held the belief that they respected the child-rearing policies of the parents [40] suggesting that further investigation is needed to determine whether grandparents’ employment influences their functions in the family. Grandparents’ age affected the dimensions of daily care and healthcare and emotional support for parents. Grandparents in their 40s and 50s were more involved in grandchild-rearing, recognizing that grandchild-rearing was one of their reasons for living and that grandchild-rearing was contributing to the family’s quality of life, even though it reduced their time available for work and hobbies [40]. It is assumed that grandparents, especially those who are younger, take on the role of caretakers while also having jobs and hobbies; we speculate that the balance between these two roles may affect grandparents’ family functions. It goes without saying that the closer the physical distance to the grandchildren, the more the family function of the grandparents. This study revealed that grandparents living with their grandchildren scored higher in daily care and healthcare and grandchildren’s character development than grandparents who did not live with them. Those who lived with their grandchildren had more intense parenting responsibilities and burdens, and the pressure to do a good job of raising their grandchildren often caused psychological stress, burnout, frustration, and feelings of being overwhelmed and helpless [19,41,42]. In contrast, grandparents who were only moderately involved in grandchild rearing, enjoyed the traditional laid-back grandparenting role without a sense of obligation to provide childcare [43]. The attitude of grandparents toward raising their grandchildren is that they consider it the responsibility of the parents to raise their grandchildren, but also to be involved when requested, and it is clear that they are responsible for raising their grandchildren in response to the parents’ requests [33,35,40]. Also, even if grandparents do not live with their children and grandchildren, they will watch over and adjust to them to maintain balance and live [44]. Therefore, in order to improve the quality of life of grandparents in their later years, it is necessary to provide support such as education and environment improvement so that grandparents can perform family functions, including maintaining an appropriate distance in preparation for welcoming new grandchildren.

Limitations of the Study and Future Research

This study clarified the family functions of grandparents with infant grandchildren. However, the family functions of grandfathers and grandmothers may be different in other scenarios. In some cases, grandparents responsible for grandchild rearing were at a higher risk of developing health problems and serious medical conditions, such as cardiovascular disease, arthritis, and generalized pain [45,46]. These topics should be explored in future research, as grandparents’ health status may affect their family functions. We also included grandparents with grandchildren aged 1 to 5 years and did not analyze their ages in detail. Grandparents have reported fatigue and lack of rest when caring for younger grandchildren [12,46]. In addition, differences in the choice of grandparents to assume the role of grandparents themselves or as obligations may affect the family function of grandparents [47]. Therefore, it is necessary to clarify the possibility that the burden of the role of grandparents is influenced by the recognition of whether or not they are responsible for raising their grandchildren as a duty.

Conclusions

The survey revealed grandparents’ family functions: daily care and healthcare, emotional support for parents, grandchildren’s character development, and own well-being. Grandparents who did not feel burdened reported that grandchild-rearing was one of their life passions and helped them maintain their own strength and youth. Grandparents’ involvement in raising their grandchildren affected their functions in the family. To enhance their family functions grandparents, it is necessary to assess the four functions of grandparents, support them in maintaining an appropriate distance from their grandchildren and children, and set up a forum for discussion between grandparents and parents.

Acknowledgments

We would like to thank Editage (http://www.editage.com) for English language editing.

Funding

This study was supported by Grant-in-Aid for Scientific Research Fundamental Research (C) under Grant 20K10896.

Competing Interests

The authors declare that they have no competing interests.

References

  1. Mori (2018) Current status of death during pregnancy and postpartum as seen from vital statistics (death, birth, stillbirth), perinatal medical care. Research on linkage database (Health, Labour and Welfare Sciences Research Grants, ICT Infrastructure Construction Research Project for Clinical Research).
  2. Ministry of Health, Labour and Welfare. Number of child abuse consultation cases at child guidance centers in FY29. 2018.
  3. Di Gessa G, Glaser K, Tinker A (2016) The health impact of intensive and nonintensive grandchild care in Europe: New evidence from SHARE. J Gerontol B Psychol Sci Soc Sci 71: 867-879. [crossref]
  4. Tahata J, Katane Y, Suzuki Y. Quality of life of grandmothers through childcare support [in Japanese]. J Womens Health 2012: 25-32.
  5. Kobayashi Y (2010) Fruits of returning home before and after childbirth Maternal Support and Mother-Child Relationship and Maternal Development. J Jpn Acd Midwif 24: 228-239.
  6. National Institute of Population and Social Security Research. 2015 Basic survey on social security and population problems [In Japanese]. 2017.
  7. Cabinet Office. The Reiwa 4th white paper on measures for a declining birthrate society [White paper] [In Japanese]. 2020.
  8. Yoda S, Shintani Y (2018) Mothers’ employment and childcare support from grandparents—An examination of intraindividual variation and interindividual differences [in Japanese]. of Population Problems. 74: 61-73.
  9. Di Gessa G, Glaser K, Price D, Ribe E, et al. (2016) What drives national differences in intensive grandparental childcare in Europe?. J Gerontol B Psychol Sci Soc Sci 71: 141-153. [crossref]
  10. Thomese F, Liefbroer A (2013) Child care and child births: The role of grandparents in the Netherlands. J Marriage Fam 75: 403-421.
  11. Kubo K, Oikawa Y, Katane Y (2011) Factor structure of grandmotherhood. Japanese Journal of Maternal Health 51: 601-608.
  12. Low SSH, Goh ECL (2015) Granny as nanny: Positive outcomes for grandparents providing childcare for dual-income families. Fact or myth? J Intergenerational Relatsh 13: 302-319.
  13. Sumikawa S (2009) Consideration of the introduction of grandparent classes for child-rearing support [In Japanese]. Japanese Journal of Maternal Health 50: 300-309.
  14. Ministry of Health, Labour and Welfare. Overview of the 2022 simplified life tables. 2022.
  15. Meyer MH, Kandic A (2017) Grandparenting in the United States. Innov Aging 1.
  16. ICM (2017) Definition of midwife, international definition of the midwife.
  17. Isoyama A, Shibuya E, Sakama, I (2016) Examination of the effectiveness of preparatory education programs for acquiring roles for grandparents who welcome new grandchildren Ibaraki Journal of Maternal Health. 35: 5-11.
  18. Lewis JP, Boyd K, Allen J, Rasmus S, et al. (2018) We raise our grandchildren as our own: Alaska native grandparents raising grandchildren in Southwest Alaska. J Cross-Cult Gerontol 33: 265-286. [crossref]
  19. Henderson TL, Dinh M, Morgan K, Lewis J (2017) Alaska native grandparents rearing grandchildren. J Fam Issues 38: 547-572.
  20. Zeng Z, Xie Y (2014) Effects of grandparents on children’s schooling: Evidence from rural China. Demography 51: 599-617. [crossref]
  21. Shorey S, Ng ED (2022) Socioecological model of parenting experiences: A systematic review. The Gerontologist 62: e193-e205. [crossref]
  22. Honohashi N (2008) Assessment method for family functions: Guide to FFFS Japan I. EDITEX. 10-11.
  23. Hangse T, Misawa S (2003) Creation of a family characteristic scale in Japan. Annals of Clinical Thanatology 8: 30-49.
  24. Soyama K, Yoshida K, Yoneda M (2015) Relationship between grandmothers’ child-rearing experiences and their awareness of raising grandchildren [In Japanese]. Journal of Japan Society of Nursing Research 38: 139-149.
  25. Tabuchi M, Nakahara J (2007) Motivation to support child-rearing and awareness of issues in the grandparents’ generation. Behavioral sciences of life, aging, sickness and death. 12: 12-22.
  26. Pei-Chun K, Hank K (2013) Grandparents caring for grandchildren in China and Korea: Findings from CHARLSs and KLoSA. J Gerontol B Psychol Sci Soc Sci 69: 646-651.
  27. Glaser K, Price D, Ribe Montserrat E, Di Gessa G, et al. (2013) Grandparenting in Europe: Family policy and grandparenting in providing childcare. Grandparents Plus.
  28. Cabinet Office. Fiscal 2013 report on the awareness survey on child-rearing in families and communities [In Japanese]. Cabinet office. 2014.
  29. Shiraishi E, Inoue R (2017) Literature review on the content and awareness of grandparents’ participation in raising grandchildren. Bulletin of the Faculty of Health Sciences, Tokai University 22: 67-74.
  30. Fukue S, Fukuoka K, Arai S (2020) Influence of past grandparent functions on psychological development and elderly image of university students. Kawasaki Medical Welfare Journal 30: 95-107.
  31. Sumikawa S (2016) Conflict between grandparents and parents focusing on roles concerning the first grandchild. Japanese Journal of Maternal Health 56: 531-538.
  32. Monserud MA (2010) Continuity and change in grandchildren’s closeness to grandparents: Consequences of changing intergenerational ties. Marriage Fam Rev 46: 366-388.
  33. StGeorge JM, Fletcher RJ (2014) Men’s experiences with grandfathers: A welcome surprise. Int J Aging Hum Dev 78: 351-378. [crossref]
  34. Villar F, Celdrán M, Triadó C (2012) Grandmothers offering regular auxiliary care for their grandchildren: An expression of generativity in later life? J Women Aging 24: 292–312. [crossref]
  35. Von Humboldt S, Monteiro A, Leal I (2018) How do older adults experience intergenerational relationships? Different cultures and ambivalent feelings. Educ Gerontol 44: 501-513.
  36. Xie H, Loy S, Caldwell LL, Robledo M (2018) A qualitative study of Latino grandparents’ involvement in and support for grandchildren’s leisure-time physical activity. Health Educ Behav 45: 781-789.
  37. Bordone V (2017) The youthful effect of childcare beyond grandparenthood. IIASA Working Paper No. WP-17-013.
  38. Martin-Baena D, Mayoral O (2019) Gender differences on the psychological well-being of early Spanish grandparents caring for grandchildren. J Psychiatry Behav Health Forecast 2.
  39. Zhao D, Zhou Z, Shen C, Ibrahim S, et al. (2021) Gender differences in depressive symptoms of rural Chinese grandparents caring for grandchildren. BMC Public Health 21.
  40. Isoyama A, Kinugawa A (2021) A study of factors concerning the involvement of grandparents with preschool grandchildren in raising their grandchildren. Proceedings of the Annual Meeting of the Japanese Society of Japan Nursing Sciences. 41.
  41. Fauziningtyas R, Indarwati R, Alfriani D, Haryanto J, et al. (2019) The experiences of grandparents raising grandchildren in Indonesia. Work Older People 23: 17-26.
  42. Kwon YS, Yoo EK (2016) The “twilight childcare” experiences of grandmothers. Information (Japan), 19: 5601-5606.
  43. Blundon A (2013) The role of grandparents. In A. Singh & M. Devine (Eds.), Rural transformation and Newfoundland and Labrador diaspora. Sense Publishers.
  44. Suzawa H (2012) Families acquiring the role of grandparents: Through the complementary coordination of grandchildren’s generations and parents’ generations. Annual reports of Graduate School of Humanities and Sciences. 27: 115-124.
  45. Byers LG, Bragg JE, Muñoz RT (2012) American Indian grand-families: Trauma and services. J Ethn Cult Divers 26: 204-216.
  46. Chang YT, Hayter M (2011) Surrogate mothers: Aboriginal grandmothers raising grandchildren in Taiwan. J Fam Nurs 17: 202-223. [crossref]
  47. Ando K (2020) Recent trends in the study of grandparent-grandchild relationships. Fam Relat Studies 39: 57-68.

Polynucleotides/Sodium Hyaluronate Ovules for Postmenopausal Vulvovaginal Atrophy and Other Vaginal Environment Disorders

DOI: 10.31038/AWHC.2023624

Abstract

Introduction: Vulvovaginal atrophy, as the most troublesome symptom complex within the more comprehensive clinical picture of Genitourinary Syndrome of Menopause, severely impacts the postmenopausal women’s quality of life, their self-respect as still attractive women, and possibly the women’s couple relationship. The same may happen at a younger age, with vaginal dryness as an occasional side effect of estro-progestin oral contraceptives, hormone-releasing vaginal rings, and other disorders leading to a deranged vaginal environment. Based on a sound rationale, a new medical device based on natural-origin polynucleotides and sodium hyaluronate formulated as vaginal ovuli may help over the long term with those frequent hassles of middle-aged and younger women.

Methods: Design: a survey investigation based on a questionnaire compiled by three investigators familiar with the new vaginal ovuli medical device in their everyday office practice. The investigators completed the survey based on outcomes in 45 ambulatory adult women (≥18 years old). All women had freely consulted the investigators to seek relief from vulvovaginal atrophy symptoms and vaginal dryness as a contraceptive side effect. The minimal inclusion and exclusion criteria helped simulate a real-world office situation. The survey followed a treatment cycle with a Class-III CE-marked medical device (Ovuli PNHA, Mastelli S.r.l., Sanremo, Italy—vaginal ovules with 0.25% polynucleotides, 0.25% non-cross-linked sodium hyaluronate, and 3% polycarbophil as functional ingredients). After the end of the self-administration cycle (one ovule intravaginally per day for two to four weeks), the survey’s goal was to assess the impressions of investigators and their patients about the safety and efficacy (symptom relief, restoration of a healthy vaginal environment) of the medical device in all conditions of vulvovaginal atrophy/vaginal dryness and dystrophic lesions/vaginal environment disorders. The device establishes a protective, moisturizing, and pH-controlled lubricating film onto the cervix and vaginal mucosa and promotes its physiological regenerative and reparative mechanisms. Assessment tools at baseline and after the end of the treatment cycle: Vaginal Health Index score (validated investigator-assessed five-item scale, with scores ranging from 5 to 25 and <15 as dryness and atrophy score threshold); subjective VVA symptom severity (vaginal dryness, vulvovaginal irritation/itching, vulvovaginal soreness, dyspareunia) assessed by the patients with the support of a series of five-point VAS scales (0=absent, 1=mild, 2=moderate, 3=severe, 4 = very severe).

Results: The surveyed investigators stated that the mean total VHI score significantly improved over the follow-up period, from 2.5 ± 0.94 to 3.6 ± 0.85 (p <0.001 vs. baseline). The mucosal thickness and integrity, showing severe or very severe atrophy in 13 surveyed women at baseline, presented no more than some mild atrophy in 91.1% of women, with 35.6% of surveyed women reverting to complete restitutio ad integrum. Vaginal dryness also markedly decreased from baseline, with 79% of cohort women improving to mild atrophy or symptom clearance and 21% reverting to restitutio ad integrum. Regarding the subjective symptom relief, the surveyed women reported a highly significant reduction of the mean total VAS score — cumulatively accounting for vaginal itching, vaginal burning, vaginal pain, pain/discomfort during intercourse, and vaginal dryness — from 3.5 ± 0.70 to 2.1 ± 0.73 (p <0.001 vs. baseline). The occasional mild local pain and irritation were of no clinical significance and rapidly transitory.

Conclusions: The novel formulation of polynucleotides and sodium hyaluronate as vaginal ovules efficiently counteract the symptom complex due to vulvovaginal atrophy in postmenopausal women, including younger women with contraindications for estrogen therapy and vaginal dryness as a contraceptive side effect. The study confirms that PNs, in synergy with hyaluronic acid, retain their innovative potential as non-pharmacological activators of physiological regenerative and reparative processes in vulvovaginal tissues. The study also confirms the novel device’s safety and the women’s compliance with treatment.

Keywords

Dyspareunia, Hyaluronic acid, PNHA ovules, Polynucleotides, Vaginal dryness, Vulvovaginal atrophy

Introduction

The role of 17ß-estradiol in so many cellular pathways regulating vulvovaginal cell growth, barrier functions, and cell proliferation and trophism explains why menopausal hypoestrogenism may have a grievous impact on middle-aged women [1]. Unfortunately, women in advanced countries may expect, on average, to live more than three decades in postmenopausal condition, and about 27% to 84% of them will experience the most troublesome vulvovaginal atrophy (VVA) symptoms [2]. Severe vulvar irritation and burning, compromised vaginal lubrication with discomfort or frank dyspareunia during sexual activity, vaginal discharge, dysuria, and recurrent urinary tract infections may thus be unwelcome companions for many years. The consequences for daily living activities are dire for 75% of symptomatic women, according to the outcomes of the “Vaginal Health: Insights, Views & Attitudes” (“VIVA”) online survey of 3,520 postmenopausal women in six countries [3-6].

Combined with hyaluronic acid (HA), highly purified DNA polynucleotides (PNs), purified from male salmon trout gonads, already showed to improve genital atrophy, VVA symptoms, and the disrupted sexual life and couple relationship of menopausal women [7-11]. PNs showed a powerful restructuring effect on local connective tissues after infiltration in the dermis and tonaca propria of vulvovaginal tissues [9,10]. PNs act non-pharmacologically by progressively releasing small nitrogen precursors (nitrogen bases, nucleosides, nucleotides) in vulvovaginal tissues and showing persistent moisturizing effects.7 Now, a new handy medical device formulation of natural-origin PNs and strongly hydrating HA as vaginal ovuli (formulation henceforth labeled PNHA) promises to extend their combined benefits to other troubling vaginal environment disorders. Examples are the younger women’s vaginal dryness and dyspareunia occasionally observed as adverse effects of estro-progestin oral contraceptives, birth control vaginal rings releasing hormones, and especially progesterone-only contraceptive methods [12-14].

The paper reports on the outcomes of a retrospective survey centered on a questionnaire prospectively administered by the investigators, all gynecologists, to some of their patients who spontaneously sought help and office treatment for problems of menopausal vulvovaginal atrophy (VVA). Some younger women sought relief for their vaginal dryness as a side effect of estro-progestin oral contraceptives or birth control hormone-releasing vaginal rings.

All investigators already used the investigated PNHA device as described in the approved product information leaflet (IFU)-one PNHA ovule daily [15]. The survey study, performed after two to four weeks of everyday use of the intravaginal medical device, was the first within a long-term monitoring program of the device’s persistent efficacy and profile of known side effects and contraindications. Identifying unknown side effects or emergent risks was another purpose of the study and the ongoing long-term monitoring program. Resorting to real-world data, independently from the rigid inclusion and exclusion criteria of randomized clinical studies with their highly selected patient samples, is the clue that supports the clinical value of the investigation in daily practice.

Methods

Study Design

Conceived as a single-arm ambulatory cohort investigation of adults of both genders who had spontaneously sought specialist help for postmenopausal vaginal environment problems and vaginal dryness as a side effect of estro-progestin oral contraceptives and birth control hormone-releasing vaginal rings. Before the survey, following the investigators’ prescription, all individuals had self-administered, at home in a real-world setting, the monitored Class-III CE-marked medical device (Ovuli PNHA, Mastelli S.r.l., Sanremo, Italy: vaginal ovules with 0.25% polynucleotides, 0.25% non-cross-linked sodium hyaluronate, and 3% polycarbophil as functional ingredients). Dose and self-administration period: one ovule intravaginally per day for two to four weeks as stated in the approved product information leaflet (IFU) [15].

After the last ovule domiciliary self-administration, the survey, completed by the investigators, was purely observational with no active intervention. All subjects agreed to submit to the survey after being informed about its goals. Beyond monitoring the efficacy and safety outcomes, the reasons for vaginal treatment were also registered. Questionnaires allow information collection without time constraints for the investigator to answer questions thoroughly, faithfully, and more quickly than face-to-face interviews.

The office-based survey study respected the Helsinki Declaration and Good Clinical Practice principles. All study materials, which included informed consent forms and questionnaires, were preliminarily peer-reviewed for ethical problems.

Observational Efficacy Assessments

Primary Efficacy Endpoint

Relieving objective signs and restoring the healthy vaginal state is paramount in managing vulvovaginal atrophy and disorders of the vaginal environment. The improvement of vaginal signs and symptoms from baseline, evaluated by the investigators with the help of the validated Vaginal Health Index, was the observational primary efficacy endpoint (assessment: total VHI score change from baseline after the last PNHA-based vaginal ovule). First described in 1995, the VHI is a five-point investigator-assessed scoring scale extensively used in clinical trials, which considers the lack of mucosal moisture, vaginal elasticity and volume of vaginal secretions, intravaginal pH, and the evidence of vaginal petechiae and bleeding (Table 1 [16,17]. The ranges of VHI subscale scores are 1 = none, 2 = poor, 3 = fair, 4 = good, and 5 = excellent, with the total VHI score between 5 and 25. Total VHI scores below 15 signal vaginal atrophy [15]. The unimodal symmetric distributions of outcomes on five-point Likert-like assessment tools like the VHI subscales minimize the statistical liability of skewed J- and U-shaped distributions; outcomes assessed on five-point scales also have lower means, floor, and ceiling effects. At the same time, the regression analysis shows that these scales explain a significant fraction of the variation in floor and ceiling effects while minimizing the contribution of unknown factors [16].

Table 1: Vaginal Health Index (Bachmann et al.); * Lower scores: progressively more severe atrophy [16]

Score

Overall elasticity *

Secretions type and consistency

pH

Mucosal epithelium

Moisture

1 None None 6.1 Petechiae noted before contact None; mucosa inflamed
2 Poor Scant, thin yellow 5.6−6.0 Bleeds with light contact None; mucosa not inflamed
3 Fair Superficial, thin white 5.1−5.5 Bleeds with scraping Minimal
4 Good Moderate, thin white 4.7−5.0 Not friable, thin mucosa Moderate
5 Excellent Normal (white flocculent) ≤4.6 Not friable, normal mucosa Normal

Secondary Efficacy Endpoint

Subjective assessment by patients of symptom severity (vaginal dryness, vulvovaginal irritation/itching, vulvovaginal soreness, dyspareunia) with the support of a series of impromptu five-score Visual Analog Scales (henceforth VAS, 0=absent, 1=mild, 2=moderate, 3=severe, 4 = very severe) [18].

Safety

Based on spontaneous reporting over the whole study period. The questionnaire included closed and open questions to identify known side effects, describe their clinical presentation, severity, and duration, and detect any previously unknown adverse event.

Statistics

The sample size estimation took advantage of the G*Power statistical program version 3.14 [19]. The estimate, after a literature review of the efficacy of comparable products, was based on a fictional cumulative VAS symptom score and a conservative assumption of the mean cumulative VAS symptom score at the end of the treatment course (60% improvement). Under these assumptions, the statistical power (two-tailed) to detect a significant difference in a treatment cohort of at least 42 women would have minimized the risk of false-negative type II errors (ß-risk = 0.92).

Descriptive statistics: tabulated as means ± standard errors of the mean (SEM). Inferential statistics: mean total VHI score and subscores as primary efficacy parameter and self-assessed symptom severity VAS scores as secondary efficacy parameter: non-parametric Wilcoxon test [18]. All statistical analyses, two-tailed with a 5% significance level, were performed with the StatPlus analysis program Version v7 [20].

Results

The three participating clinical investigators, all experienced gynecologists already prescribing the PNHA vaginal ovules, enrolled 45 ambulatory menopausal and non-menopausal women with VVA symptoms. All women completed the study fully compliant with the protocol and domiciliary vaginal ovule self-administration with only a few transitory and mild local adverse effects and without dropouts. Table 1 illustrates the women’s demographics, menopausal or non-menopausal conditions, and previous use of estrogens. The subgroup of menopausal women had been in menopause for a range of 2 to 30 years and had experienced VVA symptoms for periods ranging from 1 month to 20 years (Figure 1). Often together with oral or topical estrogens, 16 cohort women (35.6%) had used other topical and parenteral formulations and techniques to counter their VVA symptoms—other injectable polynucleotide and hyaluronic acid gels, hyaluronate topical formulations, vaginal moisturizers, lubricants, and electroporation and radiofrequency biostimulation procedures.

Table 1: Women’s demographics, menopausal condition, and oral and topical estrogen use. SEM: Standard Error of the Mean.

Age Mean ± SEM (years) 55.4 ± 10.29
Median (years) 56
Range (years) 25-74
Menopause Yes (%) 29 (64.4)
Years in menopause ± SEM 9.2± 6.64
Years with VVA symptoms ± SEM 6.6 ± 5.46
No (%) 16 (35.6)
Oral estrogens Yes (%) 7 (15.6)
No (%) 38 (84.4)
Topical estrogens Yes (%) 5 (11.1)
No (%) 46 (88.9)

FIG 1

Figure 1: Years with VVA atrophy symptoms in the 45-strong women’s cohort

At baseline, the VVA symptoms appeared to severely affect the women’s sexual life, with 31 menopausal and non-menopausal women (68.9%) reporting reduced sexual activity with decreased sexual interest and desire in 27 (60.0%).

The VVA signs and symptoms which most commonly induced the investigators to prescribe the PNHA intravaginal ovules were, in decreasing frequency, vaginal dryness (80% of cohort women), vaginal burning (40% of women), vaginal itching (37.8% of women), vaginal pain (31.1% of women), often during intercourse (24.4% of women), and vaginal bleeding during intercourse (15.6% of women). Symptoms co-existed very commonly. Previous genital surgery and dysuria were other significant reasons for prescribing the PNHA ovules (6.7% and 2.2% of women, respectively).

Efficacy

At baseline, the mean VHI score was 12.68, beyond the VVA threshold, while the mean total VHI score (mean of all VHI subscale scores) was 2.5 ± 0.94, once again describing a severe VVA picture. Figure 2 shows the highly significant improvement in the mean total VHI score at the study end compared with baseline, although always with some persisting atrophy signs and symptoms. Figure 3 analytically illustrates the improvements vs. baseline for each VHI subscore after treatment with the PNHA ovules.

FIG 2

Figure 2: Mean total Vaginal Health Index scores (± standard errors of the mean); **p<0.001 vs. baseline

FIG 3

Figure 3: Mean VHI subscores (± standard errors of the mean); **p<0.001 vs. baseline

Looking more in detail into the mucosal thickness and integrity (Figure 4), the ultimate basis for bleeding and other symptoms, thirteen women showed severe or very severe atrophy of the vaginal epithelium at baseline (scores: 1 or 2); after the topical PNHA treatment, 91.1% of women showed no more than a condition of mild atrophy (scores: 4 or 5), with 35.6% of them reverting to complete restitutio ad integrum (score: 5).

FIG 4

Figure 4: Percent of cohort women with compromised vaginal mucosal thickness and integrity of variable clinical severity (scores 1 to 5) at baseline and end-of-treatment assessment visits.

Regarding the clinical severity of vaginal dryness, the most bothersome and frequently reported symptom of atrophy, it also markedly decreased from baseline in all cohort women (Figure 5), with 79% of them improving to a condition of mild atrophy or symptom clearance (scores: 4 or 5), and 21% of them reverting to complete restitutio ad integrum (score: 5).

FIG 5

Figure 5: Percent of cohort women who reported vaginal dryness of variable clinical severity (scores 1 to 5) at baseline and end-of-treatment assessment visits.

Safety

The investigators and treated women invariably deemed the procedure manageable and handy without unexpected technical difficulties, troubles, and discomfort. The repeated insertion of the PNHA ovules was well tolerated, with a few transitory and mild local adverse effects—local burning in 15 cohort women (mild 31.8%, moderate 2.3%), vulvovaginal itching in 16 women (mild 31.8%, moderate 4.5%), and local discomfort in 19 women (mild 36.4%, moderate 6.8%). According to investigators, two women reported some mild vaginal blood losses, which disappeared in 6 to 10 days and were unrelated to the PNHA topical treatment. There were no unexpected technical difficulties. The few transitory and mild local adverse effects (local burning, vulvovaginal itching, and local discomfort) were of no clinical significance. They resolved spontaneously in a few hours without further therapy. There were no unexpected side events or complications (Figures 6 and 7).

FIG 6

Figure 6: Mean total symptom VAS scores (± standard errors of the mean); **p<0.001 vs. baseline

FIG 7

Figure 7: Mean VAS scores (± standard errors of the mean) for some representative symptoms; **p<0.001 vs. baseline.

Discussion

Real-world investigations aim to provide reliable insights into conditions analogous to everyday clinical practice [21]. Within a long-term monitoring program, the PNHA vaginal ovule formulation confirmed its efficacy and lack of unknown and troublesome side effects with once-daily dosing in menopausal VVA and other non-menopausal and post-surgical disorders with vaginal dryness and other symptoms, as stated in the Information for Use leaflet.

In this first step of the ongoing real-world, long-term monitoring program of the once-daily PNHA vaginal ovule medical device, the formulation proved to be effective with no intolerably bothersome side effects in vulvovaginal atrophy and other menopausal and non-menopausal or post-surgery disorders.

The phenotypic expression of postmenopausal vulvar involution — depletion of labia majora adiposity, blundering of interlabial sulci, loss of pigmentation and hair, reduced density of sweat and sebaceous production, preputial retraction with clitoral exposure and chronic irritation, and overall dysfunction of the vaginal ecosystem — and related symptoms are a burden on the woman’s self-confidence and self-image. Microscopically, the fragmentation and fusion of elastin fibers, collagen hyalinization, and extracellular matrix depletion are the markers of the VVA picture [2,22]. Moreover, vaginal dryness is a frequent side effect of estro-progestin oral contraceptives and hormone-releasing vaginal rings in up to 12.7% to 30.4% of women after three menstrual cycles, especially with preparations with the lowest synthetic estrogen content [23].

The hydrophilic polynucleotide polymers of the PNHA formulation reorganize in vulvovaginal tissues into a three-dimensional gel that binds water with a moisturizing and volume-increasing effect that synergizes with the potent HA hydrating effect [7-11]. Over the longer term, the polynucleotide component of the PNHA device passively replenishes the fibroblast pool of nitrogen bases, nucleosides, and nucleotide precursors and supports the dermal fibroblast viability, thus facilitating the production of new collagen fibers—the rationale for exploring the PNHA option to antagonize the menopausal and non-menopausal VVA and vaginal dryness [7-10].

The survey study had two main problems: compensating for the lack of a control group and the ß-risk of failing to detect a significant difference in semiquantitative scores, compared with baseline, at the end of the self-administration at home. However, the impressive efficacy outcomes reported by surveyed investigators and women are unlikely to be incidental findings and likely compensate for the first bias. Moreover, the cohort size of the enrolled women, more numerous than what was estimated to reduce to almost zero the ß-risk under the conservative assumption of a 60% efficacy, compensated for the second bias.

All surveyed clinical signs and symptoms showed highly significant improvements over the follow-up period, demonstrating that the newly introduced PNHA ovules are an effective option in all forms of vaginal atrophy, independently of cause. The clinically meaningful relief of VVA objective signs was not associated with more than some occasional undefined discomfort and mild burning of no clinical significance.

In conclusion, improving VVA-related objective signs means that the novel PNHA vaginal ovule medical device is an effective, safe, and well-tolerated non-hormonal therapeutic option in postmenopausal women with VVA and all women unwilling or unable to consider estrogen therapy. In general, the new PNHA device appears effective, independently of age, in all situations of vaginal dryness and a deranged vaginal environment for whatever cause.

References

  1. Cotreau MM, Chennathukuzhi VM, Harris HA, et al. (2007) A study of 17beta-estradiol-regulated genes in the vagina of postmenopausal women with vaginal atrophy. Maturitas 58: 366-376. [crossref]
  2. Nappi RE, Martini E, Cucinella L, et al. (2019) Addressing vulvovaginal atrophy (VVA)/Genitourinary Syndrome of Menopause (GSM) for healthy aging in women. Front Endocrinol (Lausanne) 10: 561. [crossref]
  3. NAMS Position Statement. The 2020 genitourinary syndrome of menopause position statement of The North American Menopause Society. Menopause 27: 976-992.
  4. Nappi RE, Davis SR (2012) The use of hormone therapy for the maintenance of urogynecological and sexual health post WHI. Climacteric 15: 267-274. [crossref]
  5. Davis SR, Lambrinoudaki I, Lumsden M, et al. (2015) Menopause Nat Rev Dis Primers 1: 15004.
  6. Shifren JL, Zincavage R, Cho EL, Magnavita A, Portman DJ, et al. (2018) Women’s experience of vulvovaginal symptoms associated with menopause. Menopause 26: 341-349. [crossref]
  7. Colangelo MT, Govoni P, Belletti S, Squadrito F, Guizzardi S, et al. (2021) Polynucleotide biogel enhances tissue repair, matrix deposition, and organization. J Biol Regul Homeost Agents 35: 355-362. [crossref]
  8. Bartoletti E, Cavallini M, Maioli L, et al. (2020) Introduction to Polynucleotides Highly Purified Technology. Aesthetic Medicine 6: 43-47.
  9. Palmieri IP, Raichi M (2019) Biorevitalization of postmenopausal labia majora, the polynucleotide/hyaluronic acid option. Obstet Gynecol Rep 3.
  10. Palmieri IP, Raichi M (2022) Vulvar rejuvenation with polynucleotides HPT® and benefits on postmenopausal sexual life disruption. Obstet Gynecol Rep 6. [crossref]
  11. Angelucci M, Frascani F, Franceschelli A, Lusi A, Garo ML (2022) Climacteric 25: 490-496.
  12. Sabatini R, Cagiano R (2006) Comparison profiles of cycle control, side effects and sexual satisfaction of three hormonal contraceptives. Contraception 74: 220-223. [crossref]
  13. Mares P, Hoffet M, Rousseau O, Ripart-Neveu S (2001) Vaginal dryness. Rev Prat 51: 155-158.
  14. Shah MB, Hoffstetter S (2010) Contraception and sexuality. Minerva Ginecol 62: 331-347. [crossref]
  15. Newest Gyn ovuli PNHA product information leaflet (IFU).
  16. Bachmann G (1995) Urogenital ageing: an old problem newly recognized. Maturitas S1-S5. [crossref]
  17. Cagnacci A, Xholli A, Sclauzero M, Venier M, Palma F, et al. (2019) Vaginal atrophy across the menopausal age: results from the ANGEL study. Climacteric 22: 85-89. [crossref]
  18. Ettinger B, Hait H, Reape KZ, Shu H (2008) Measuring symptom relief in studies of vaginal and vulvar atrophy: the most bothersome symptom approach. Menopause 15: 885-889. [crossref]
  19. Faul F, Erdfelder E, Buchner A, Lang AG (2009) Statistical power analyses using G*Power 3.1: Tests for correlation and regression analyses. Behav Res Methods 41: 1149-1160. [crossref]
  20. Statistical software downloaded from https://www.analystsoft.com/en/products/statplus/#statfeatures.
  21. Miksad RA, Abernethy AP (2018) Harnessing the power of real-world evidence (RWE): a checklist to ensure regulatory-grade data quality. Clinical Pharmacology & Therapeutics 103: 202-205. [crossref]
  22. Pérez-López FR, Phillips N, Vieira-Baptista P, Cohen-Sacher B, Fialho SCAV, et al. (2021) Management of postmenopausal vulvovaginal atrophy: recommendations of the International Society for the Study of Vulvovaginal Disease. Gynecol Endocrinol 37: 746-752. [crossref]
  23. Roumen FJM (2008) Review of the combined contraceptive vaginal ring, NuvaRing. Ther Clin Risk Manag 4: 441-451. [crossref]

Destructive Complicated Polyonychomycosis and Nail Incarnations: Peculiarities of Interventions, Author’s Views on Complex Treatment of Patients with Comorbid Background Pathology, Diabetes Mellitus

DOI: 10.31038/JCRM.2023621

Introduction

Surgical onychopathology includes a group of nosological forms of purulent-necrotic and mycotic-associated lesions of the nail phalanx, nail and peri-nail tissues, epidermophytia of the feet occupies one of the prominent places among pathological skin lesions; poses a risk of spreading to patients with diabetes due to high contagiousness, frequency of various complications; leads to a violation of the quality of life. Onychomycotic lesions are macroscopically classified into superficial mycosis, proximal and distal-lateral onychomycosis, onychocheilosis, subungual hyperkeratosis, and onychogryphosis. Pathological changes in the nail plate of the foot in patients with diabetes are often combined: hypertrophy and onychogryphotic deformation of the nail (in the form of an eagle’s or vulture’s beak) with its secondary growth, which is combined with the presence of dermatophytes (trichophytes, onychomatrichoma), pathological layering on the nail bed (brown color with destruction, disintegration) and the formation of multiple purulent bacterial-mycotic foci with abscessation. Complex treatment of patients with severe fungal lesions, complicated destructive onychomycosis with multiple nail lesions, onychogryphosis with incarnation, in particular in patients with diabetes, determines the removal of nail plates and the use of antifungal therapy, correction of background vascular pathology and is an urgent problem of outpatient surgery and dermatology. Some aspects of epidemiology, etiology, pathogenesis of onycheal and subungual pathology, macroscopic types of lesions, risk factors and cases of nail incarnations – ingrown nail (IN), localization, frequency of occurrence and causes of purulent onychia, paronychia, other complications and recurrences. In our previous publications, the effectiveness of various methods of surgical interventions, isolated and in combination with other methods of complex treatment, features of the postoperative period in isolated and combined lesions, in particular complicated destructive polyonychomycosis (UDP), were analyzed. It has been established that conservative and orthopedic treatment of IN and other mycotic surgical lesions of nails are not very effective, while the main methods are Dupuytren’s nail removal, Emmert-Schmiden operation, etc. in 2-20% of cases (depending on the absence or presence of onychocryptosis and associated fungal lesions) cause relapses. Complicated mycotic lesions and HF in patients with diabetes are a special problem.

The goal of the work is to improve the implementation of interventions, comprehensive treatment of patients with complicated polyonychomycosis with comorbid background pathology, diabetes and to implement an original method of elimination of UDP – hyperkeratosis and onychogryphosis with nail incarnation – secondary nail growth, in particular in patients with diabetes to optimize early and long-term results.

Materials and Methods

In the 4th City Clinical Hospital of Lviv and MC “Salyutas”, the prospective material for a 10-year period was 496 cases of destructive onychomycosis complicated by secondary nail incarnation, of which 320 were men and 176 were women. The age of the operated patients is from 35 to 72 years. The main group consisted of 325 patients – 172 men and 153 women aged 43-68 years. The control group included 171 cases of onychodestruction that were treated according to “classical” schemes. All subsamples were statistically similar and comparable in terms of age and gender composition. Imperfect surgical techniques account for more than half of the causes of relapses, including cases of IN with subungual hyperkeratosis or onychogryphosis, χ2=20.13, p=0.01. The highest frequency of repeated INs among the technical reasons for recurrence was observed in unjustified refusal of partial matrixectomy – 19.8% and with traumatic mobilization/removal of nails (traumatic onychectomy). The hallux of the left foot was most often affected – in 48.85%, the right – in 33.26%, the presence of IN of both hallux was found in 17.89% of patients. In 18.8% of the sample, onychocryptosis occurred against the background of obliterating diseases of the arteries of the lower extremities: atherosclerosis in 13.76% and diabetes in 15.05%. All surgical interventions in outpatient conditions were performed under adequate anesthesia. The Mann-Whitney U-test, χ2-test (V-square), χ2-test with Yates’ correction for continuity, Fisher’s exact test (Fisher exact p). We determined the χ2 degree of influence of the studied phenomenon (etiological factor, morphogenetic mechanism) on the development of nail plate incarnation and other complications. “Classical methods” of descriptive statistics were also used, with a confidence interval of 95%, calculations were performed on licensed software. The study meets the requirements of bioethics.

Results and Discussion

We have researched clinical variants and peculiarities of the course of the pathological process, confirmed the optimal methods of surgical intervention, their phasing and the terms of complex treatment of complicated, combined mycotic processes and recurrences of reincarnations of nail plates and lesions of the nail structures. Adjuvant systemic three-day antimycotic pulse therapy with daily intake of 400 mg of itraconazole was applied for three days prior to interventional/operative treatment. The peak frequency of mycotic lesions with HF occurred in the subsamples of people aged 40-50 years and in people aged 50-60 years. Pathological incarnations of mycotically altered nail plates were characteristic of trichophytosis in elderly patients. It has been claimed that the free lateral edges of the nail with UDP due to the lifting of its central part by hyperkeratosis are “undermined”, compressing perieponycheal tissues and eponychia. We used the following methods of surgical treatment. “Classic” removal of VN (Dupuytren’s operation) was performed in 64 people (12.90%), en bloc eponychectomy (excision of pathologically changed eponycheal tissues) + nail removal through onycholised structures (low-traumatic) + dermatophytoma resection + partial matrixectomy + eponycheoplasty – in 57 others cases (11.49%), nail removal through onycholised structures (low-traumatic) – in 51 (10.28%), “classic” nail removal + excision of pathologically changed eponycheal tissues – in 43 (8.66%), en bloc eponyhectomy ( excision of pathologically changed eponycheal tissues) + nail removal through onycholated structures (low-traumatic) + resection of dermatophytoma + partial matrixectomy – in 40 (8.04%) block-like eponychectomy + nail removal through onycholised structures (less traumatic) + partial matrixectomy – in other 8 (1.61%) patients. Thus, removal of ingrown nails was used in all cases, of which 64 people (12.90%) had Dupuytren’s nail removal without anti-relapse supplements, extended ablation with excision of dermatophytoma – in other 57 cases (11.49%). In the vast majority of patients (87.1% of the sample), surgical treatment of UDP with VN with anti-recurrence components was applied – two- or three-component, supplemented by excision of pathologically changed eponycheal tissues or (and) mechanical abrasion or (and) coagulation partial matrixectomy. Patients with diabetes accounted for 17% of the sample and were adequately represented in the main and control groups and in the clinical subsamples.

In patients with type 2 diabetes, probable strong positive correlations were recorded between all indicators of carbohydrate metabolism: glucose with insulin (r=0.52; p<0.01), with the NOMA index (r=0.69; p<0.01), with glycosylated hemoglobin (r=0.76; p<0.001); insulin with NOMA index (r=0.74; p<0.01) and glycosylated hemoglobin (r=0.65; p<0.01); NOMA index with glycosylated hemoglobin (r=0.69; p<0.01). We proposed and implemented a method of removing affected nail plates in patients with UDP, in particular, in the presence of trichophytic nail hyperkeratosis, polyonychogryphosis. This method is applied and has proven itself positively in diabetic patients with purulent / incarnate lesions associated primarily with Tr. Rubrum infection.

After applying a tourniquet to the base of the finger, preparing the operating field and anesthesia, stepping back from the proximal edge of the onychogryphous nail by 2-3 mm, we perform a linear dissection of the soft tissues medially retronycheally to the nail plate, which is extended to the medialeponycheal ridge, cutting out pathologically changed medial eponycheal tissues in a block-like manner. We continue the medial dissection distally and linearly down 5 mm on the finger bundle. The remains of the medial eponycheal tissues are separated from the medial edge of the onychogryphous nail with a pedicure spatula for an ingrown onychogryphous nail, a blade of a sterile pedicure tool PE-60/1 (an inclined manicure file with a blade). We visualize the medial edge of the onychogryphous nail and conduct a visual macroscopic assessment of it for the presence of deformations, delaminations, indentations, foci of hyperkeratosis. Similarly, retreating from the edge of the onychogryphous nail by 2-3 mm, we perform a lateral retronycheal linear dissection of the soft tissues to the nail plate, which we extend tolateral eponycheal ridge, cutting out pathologically changed lateral eponycheal tissues en bloc. We continue the lateral dissection distally and linearly down 5 mm on the finger bundle. The remains of the lateral eponycheal tissues are separated from the lateral edge of the onychogryphous nail with a pedicure spatula for an ingrown onychogryphous nail, the blade of a sterile PE-60/1 pedicure tool (an inclined manicure file with a blade). We visualize the incarnated lateral edge of the onychogryphous nail and conduct a visual macroscopic assessment of it for the presence of deformations, delaminations, serrations, foci of hyperkeratosis. Under the distal corner of the onychogryphous nail, in the area of the smaller incarnation, through the onycholized structures between the nail plate and the nail bed in the proximal-lateral direction, we insert the ax-shaped tip of the sterile nail blade PE-10/2 (with a rounded pusher with an ax-shaped raspator), the sterile pedicure tool PE-60/1, with which we gradually mobilize the nail plate with pendulum-like movements to the germinal zone and the proximal edge of the onychogryphous nail, gradually removing hyperkeratoid masses by scraping with a sterile PE-10/2 manicure spatula and a small Volkmann spoon, mobilizing and lifting the nail plate. We insert the blade of a sterile PE-30/4 manicure tool (a rounded pusher with a bent blade) into the formed channel, which completes the mobilization with pendulum-like movements. We introduce the straight blade of a PE-30 sterile manicure tool (a rounded pusher with a straight blade) with which in the proximal-contralateral direction we finally separate the mycotically changed thickened incarnate nail plate en block with the main mass of hyperkeratotic masses, grab it with a sterile Kocher clamp and remove it. With the ax-shaped tip of the sterile manicure blade PE-10/2 (rounded pusher with ax-shaped rasp) and the bent blade of the sterile manicure tool PE-30/4 (rounded pusher with bent blade), we gradually isolate from the eponycheal canals and the nail bed and mobilize in the distal direction the remnants of hyperkeratoids masses and dermatophytomas, which are also captured en block with a sterile Kocher clamp and removed. We clean the nail bed and eponycheal canals from the remnants of exfoliated epidermal structures. We clean the sinuses and eponycheal canals with a Volkmann spoon and a sterile pusher. We perform a revision of the medial and lateral edges of the wound for the tactile detection of the remaining fragments of the jagged edges of the onychogryphous nail. After devulsion of the remnants of eponycheal tissues in the area of incarnation of the onychogryphous nail with the bent blade of a sterile manicure tool PE-30/4, the remaining incarnate fragments of the nail plate are captured under visual and tactile control and removed with a Mosquito-type clamp. we perform bilateral partial marginal matrixectomy with longitudinal mechanical excision and diathermocoagulation of the germ zone and matrix of the onychogryphous nail in the areas of incarnations. Coagulated detritus is cleaned by scraping with the tip of a PE-60 sterile pedicure paddle. The sinuses, eponycheal canals and nail beds are cleaned with a Volkmann spoon and a sterile pusher. We clean the wound three times with a 3% solution of hydrogen peroxide and an aqueous solution of povidone iodine. After repeated devulsion of the remains of the eponycheal tissues with the blade of the PE-60/1 sterile pedicure tool, the eponycheal channels are filled with tampons made of iodoform gauze, keeping the remains of the eponycheal tissues removed. The central part of the wound is filled with povidone-iodine liniment, tightly tamped with gauze swabs under visual control. We remove the tourniquet from the base of the finger. Apply an aseptic bandage. We clean the wound three times with a 3% solution of hydrogen peroxide and an aqueous solution of povidone iodine. After repeated devulsion of the remains of the eponycheal tissues with the blade of the PE-60/1 sterile pedicure tool, the eponycheal channels are filled with tampons made of iodoform gauze, keeping the remains of the eponycheal tissues removed. The central part of the wound is filled with povidone-iodine liniment, tightly tamped with gauze swabs under visual control. We remove the tourniquet from the base of the finger. Apply an aseptic bandage. We clean the wound three times with a 3% solution of hydrogen peroxide and an aqueous solution of povidone iodine. After repeated devulsion of the remains of the eponycheal tissues with the blade of the PE-60/1 sterile pedicure tool, the eponycheal channels are filled with tampons made of iodoform gauze, keeping the remains of the eponycheal tissues removed. The central part of the wound is filled with povidone-iodine liniment, tightly tamped with gauze swabs under visual control. We remove the tourniquet from the base of the finger. Apply an aseptic bandage. tightly tampon with gauze tampons under visual control. We remove the tourniquet from the base of the finger. Apply an aseptic bandage. tightly tampon with gauze tampons under visual control. We remove the tourniquet from the base of the finger. Apply an aseptic bandage.

In the presence of polyonychomycosis with damage to more than 4 nail plates and damage to other structures of the foot (hand), surgical rehabilitation is divided into several stages. No more than four nail plates were removed simultaneously. In the case of other mycotic-associated pathology, no more than two simultaneous interventions were performed at the same time and no more than three nail plates were removed. The sequence of surgical interventions was selected according to their urgency. Nail plates affected by subungual hyperkeratosis were mobilized from the nail bed through hyperkeratoid masses and onycholated structures by a blunt approach to the retronycheal (posterior nail) ridge with fixation by the distal edge of the secondary VN, onychectomy was performed. A bare nail bed with remnants of hyperkeratoid layers and dermatophytomas in the distal part and hyperkeratoses near the eponycheal structures was visualized, which were removed by scraping, additional sanitation with a Volkmann spoon. Antimycotic pulse therapy was continued for the next 4 days of the postoperative period with daily intake of 400 mg of itraconazole. The remaining mycotically changed areas of the nails are cleaned daily with ciclopirox-containing antimycotic varnishes in order to prevent re- or mixed infection, as well as to prevent further fragmentation of the nails. In addition, three 7-day courses of pulse therapy with daily intake of 400 mg of itraconazole with a 10-day break between them were applied. In patients with existing obliterating lesions of the arteries of the lower extremities and in patients with diabetes, planned stages of surgical rehabilitation were performed only after complete epithelization under the guise of a course of vasodilator therapy. Dressings were performed every other day with treatment of surgical wounds with povidone iodine solution (until complete epithelization of wounds) and application of terbinafine liniment (until complete regrowth of nails) with sanitation of other remaining (unremoved) nails by applying antimycotic varnish every other day for 3 months. The last anti-recurrence course of UDP pulse therapy with itraconazole was carried out after the complete surgical rehabilitation of VN and polyonychomycosis. In patients with UDP and VN of the main group, in particular, in 57 patients with diabetes, in which the nail plates were removed due to onycholised structures, the healing time (crushing) of surgical wounds was 11-20 days (the average duration of healing – 16 days), in the control group – 15-25 days (the average duration of healing – 21 days); that is, in patients with UDP who underwent onychectomy due to onycholised structures, the healing time of onychectomy wounds was shorter. Good effectiveness of complex treatment was established in 284 patients of the main group (87.38%) and in 141 cases of the control group (82.46%). In general, a positive effect from the use of combined therapy with itraconazole and staged surgical removal of mycotically affected nails was confirmed in 425 patients (85.69%). who underwent onychectomy through onycholated structures, the healing time of onychectomy wounds was shorter. Good effectiveness of complex treatment was established in 284 patients of the main group (87.38%) and in 141 cases of the control group (82.46%). In general, a positive effect from the use of combined therapy with itraconazole and staged surgical removal of mycotically affected nails was confirmed in 425 patients (85.69%). who underwent onychectomy through onycholated structures, the healing time of onychectomy wounds was shorter. Good effectiveness of complex treatment was established in 284 patients of the main group (87.38%) and in 141 cases of the control group (82.46%). In general, a positive effect from the use of combined therapy with itraconazole and staged surgical removal of mycotically affected nails was confirmed in 425 patients (85.69%). In patients on the background of adjuvant systemic antimycotic treatment with daily pulse therapy of 400 mg of itraconazole, operative treatment of UDP with VN through onycholated structures with the use of podological pedicure instruments, supplemented by excision of pathologically changed eponycheal tissues, mechanical and coagulation partial matrixectomy, was applied to patients, this method can be recommended for the elimination of affected nails in patients with diabetes and obliterating lesions of the vessels of the lower extremities, as well as in patients with other vascular and/or neurotrophic pathology, elderly patients. The applied treatment scheme made it possible to achieve clinical and mycological recovery in 83.33% of the subsample. The achieved good result of the treatment was primarily determined by the peculiarity of the surgical approach, χ2=48.25, p<0.01.

The presence of foci of onycholysis and disintegration of areas of hyperkeratosis, which leads to detachment of part of the nail plate (χ2=15.23, p=0.0211), especially in elderly patients with background endocrine pathology – diabetes, justifies the feasibility of performing a minimally traumatic onychectomy. Patients with onychomycosis associated with secondary incarnation of the nail have a total hypertrophic fungal lesion with the formation of subungual hyperkeratosis or onychogryphosis (χ2=20.41, p=0.01) and subonycheal dermatophytoma, which complicates the mobilization and surgical removal of affected nails. Good effectiveness of the proposed treatment was established in 284 patients of the main group (87.38%) and in 141 cases of the control group (82.46%). In general, a positive effect from the removal of mycotically affected nails was confirmed in 425 patients (85.69%).

The Obtained Research Data Prove That

The author’s developed methods of surgical interventions, based on low-traumatic mobilization and resection/removal of affected nails through onycholated structures, determine a decrease in intraoperative damage to the nail bed (χ2=20.13, p=0.01), reduce the risk of mycotic contamination of other adjacent structures (χ2=27.41, p=0.01); are characterized by a decrease in the intensity of pain (χ2=48.32, p=0.01), a statistically significant increase in the speed of wound healing, the Popova index (χ2=32.14, p=0.01), an improvement in the results of complex treatment and the quality of life of patients. In the postoperative period, we apply dressings with antiseptics, antifungal (antimycotic) ointments and varnishes until the nail(s) grow back completely, according to indications – adequate systemic antifungal therapy. Partial marginal matrixectomy ensures the absence of growth of the nail plate in the area of resection, narrowing the nail and preventing its re-incarnation. Adequate classification criteria of purulent-necrotic complications of onychomycosis are proposed with the selection of the main types of lesions, in each of which clinical variants are differentiated according to the severity of morphological changes, which are of practical importance for the sequence of removal of affected nails. It is claimed that the use of minimally invasive nail removal helps to accelerate the elimination of the fungus and the healing of wounds, improve the results of complex treatment and the quality of life of patients. Adequate classification criteria of purulent-necrotic complications of onychomycosis are proposed with the selection of the main types of lesions, in each of which clinical variants are differentiated according to the severity of morphological changes, which are of practical importance for the sequence of removal of affected nails. It is claimed that the use of minimally invasive nail removal helps to accelerate the elimination of the fungus and the healing of wounds, improve the results of complex treatment and the quality of life of patients. Adequate classification criteria of purulent-necrotic complications of onychomycosis are proposed with the selection of the main types of lesions, in each of which clinical variants are differentiated according to the severity of morphological changes, which are of practical importance for the sequence of removal of affected nails. It is claimed that the use of minimally invasive nail removal helps to accelerate the elimination of the fungus and the healing of wounds, improve the results of complex treatment and the quality of life of patients [1-14].

Conclusions

For patients with destructive complicated polyonychomycosis, in particular, in the presence of secondary growths against the background of comorbid pathology, in particular, background diabetes, we have developed original methods of surgical interventions based on minimally traumatic mobilization and resection/removal of affected nails through onycholated structures, which determine the reduction of intraoperative damage to the nail bed, (χ2=20.13, p=0.01), reduce the risk of mycotic contamination of other adjacent structures (χ2=27.41, p=0.01); are characterized by a decrease in the intensity of pain (χ2=48.32, p=0.01), a statistically significant increase in the speed of wound healing, the Popova index (χ2=32.14, p=0.01), an improvement in the results of complex treatment and the quality of life of patients. In patients with incarnate onychomycosis, there is the formation of subungual hyperkeratosis or onychogryphosis and dermatophytoma, which complicates the mobilization and surgical removal of affected nails. In our clinic, in the complex treatment of complicated and combined fungal onychodestructions, we use minimally traumatic removal of nail plates in their destructive onychomycotic lesions. We remove the affected nail through onycholised structures using podological pedicure instruments, if there is an ingrowth, we supplement it with other local interventions – excision of pathologically changed eponycheal tissues, mechanical and coagulation partial marginal matrixectomy. In the postoperative period, we apply bandages with antiseptics, antifungal (antimycotic) ointments and varnishes until the nail(s) grow back completely.

References

  1. Cabete J, Galhardas C, Apetato M, Lestre S (2015) Onychomycosis in patients with chronic leg ulcer and toenail abnormalities. An Bras Dermatol 90: 136-139. [crossref]
  2. Chiu HH, et al. (2016) Onychomadesis following hand-foot-and-mouth disease. Cutis 97: 20-21. [crossref]
  3. Erdogan FG, Guven M, Erdogan BD, Gurler A (2014) Previous nail surgery is a risk factor for recurrence of ingrown nails. Dermatol Surg 10: 1152-1154. [crossref]
  4. Jung DJ, Kim JH, Lee HY, Kim DC, Lee SI, et al. (2015) Anatomical characteristics and surgical treatments of pincer nail deformity. Arch Plast Surg 42: 207-213. [crossref]
  5. Kallis P, Tosti A (2016) Onychomycosis and Onychomatricoma. Skin Appendage Disord 1: 209-212. [crossref]
  6. Kim JY (2012) Matrixplasty for the treatment of severe incurved toenail with growth plate deformity. J Am Podiatr Med Assoc 102: 198-204. [crossref]
  7. Leeyaphan C, Bunyaratavej S, Prasertworanun N, Muanprasart C, Matthapan L, et al. (2016) Dermatophytoma: An under-recognized condition. Indian J Dermatol Venereol Leprol 82: 188-189. [crossref]
  8. Nadashkevitch O, et al. (2017) Complicated onychomycosis and ingrown nail: complex treatment (case series). Proc Shevchenko Sci Soc Medical sciences 2: 64-68.
  9. Tucker JR (2015) Nail Deformities and Injuries. Prim Care 42: 677-691.
  10. Vergun, et al. (2017) Chronic mycotic-assotiated surgical nail pathology complicated with ingrown nail (nail incarnation): the analyses of clinical cases and complex treatment. International Journal of Medicine and Medical Research 3: 33-40.
  11. Vergun AR, et al. (2020) Surgical Incarnated Nail Pathology, Author Views of Some Controversion in Complex Treatment. Acta Scientific Medical Sciences 4: 31-37.
  12. Vlahovic TC (2016) Onychomycosis: Evaluation, Treatment Options, Managing Recurrence, and Patient Outcomes. Clin Podiatr Med Surg 33: 305-318. [crossref]
  13. Zeng M, Fu SP, (2012) Meliorated surgical procedure of Winograd for recurrent onychocryptosis. Zhonghua Yi Xue Za Zhi 92: 1767-1769. [crossref]
  14. Zhu X, Shi H, Zhang L, Gu Y (2012) Lateral fold and partial nail bed excision for the treatment of recurrent ingrown toenails. J Clin Exp Med 5: 257-261. [crossref]