Abstract
Objective: Among experimental animal models, horses are the most adaptable to exercise and this ability has been extensively studied. Research on equine exercise physiology is mostly focused on genetics, and few integrated studies have focused on equine metabolomics. This study were conducted to analyze metabolites in plasma, urine, and sweat samples collected from Jeju pony and thoroughbred horses before and after exercise. In this study, we analyze the various equine samples using NMR (nuclear magnetic resonance) spectroscopy.
Methods: 1H NMR spectroscopy analysis were conducted with equine plasma, urine, and sweat samples collected from Jeju pony and thoroughbred horses before and after exercise. Relative metabolite levels between three types of were compared under exercise stimuli and by breeds.
Results: A total 26, 39, and 36 metabolites were identified in each of plasma, sweat, and urine samples, respectively, of both thoroughbred and Jeju pony. A total 3, 12, 15 metabolites were exclusively detected in plasma, sweat, and urine samples, respectively, and 15 metabolites were detected in all samples at the same time. In addition, total 8 and 5 metabolites were detected after exercise in plasma and urine samples. Additionally, we obtained 16, 6, and 30 metabolites in plasma, urine, and sweat by breeds.
Keywords
Horse, Thoroughbred, Korean native horse, Jeju pony, Metabolites, Nuclear magnetic resonance spectroscopy
Introduction
Horses are the most adaptable experimental animal models to exercise and, as such, are the most suitable for studying its effects. Moreover, studies focused on exercise physiology in horses can provide valuable basic information for understanding underlying mechanisms associated with exercise in humans. For this reason, further research on exercise physiology is necessary [1]. However, although studies focused on improving the athletic performance of horses have not had much success, economic trait -related genes have recently received greater attention [2-4]. In addition, equine tissue derived cells are being used in studies on the functional validation of these genes [5,6].
In recent years, multivariate analyses, so called multi-omics (genomics, epigenomics, transcriptomics, metabolomics, and proteomics) have been used to explain the biological mechanisms in numerous animals. Metabolites are the final biological products of cellular processes in cells, tissues, organs, or organisms [7]. Quantification of metabolomes can explain several biological phenomena along with other omics studies.
Exercise has a powerful effect on the body metabolism [8]. Repetitive and unilateral contraction of muscles associated with frequent exercise training is a suitably strong stimulus of physiologic function. During exercise, blood-borne glucose, creatine phosphate, glycogen, free fatty acids, and lactate which is known as external molecular substrates were used to produce ATP in muscle. The importance of these external molecular substrates in exercise metabolism is mostly affected by exercise rate and duration, but can also be affected by the type of exercise itself, as well as diet and environmental factors [9]. In addition, other energy mechanisms may be needed depending on the degree and duration of exercise [10].
In a previous study, we investigated a metabolic mechanism activated by physical activity using 1H nuclear magnetic resonance (NMR) spectroscopy in thoroughbred horses [11]. Specifically, we profiled exercise specific metabolome in muscles and plasma. However, the metabolic mechanism during exercise has not yet been analyzed in urine and sweat, which are much easier to collect than plasma and muscle.
In this study, the metabolite profiling of the sweat, plasma, and urine in various equine breeds under exercise stimulus was analyzed by 1H NMR spectroscopy. Based on the results, commonly or specifically released metabolites were identified from various equine biopsied specimen. Subsequently, metabolic pathways associated with obtained metabolites were investigated. The present study could contribute to a better understanding of metabolic fluctuations caused by exercise in thoroughbred and Jeju pony.
Materials and Methods
Animals
In this study, samples were gathered from five Thoroughbred and five Jeju pony. The study design was approved by the Pusan National University-Institutional Animal Care and Use Committee (Approval Number: PNU-2015-0864).
Horse Sampling
Jeju pony and Thoroughbred horse samples of sweat, plasma, and urine were collected in a stable setting and following exercise (30 min). A 15 mL syringe was used to obtain blood samples, which were then transferred to heparin tubes and centrifuged at 5,000 rpm for 15 min to extract the plasma. Sweat samples were obtained only after exercise. In case of urine, obtained sample was centrifuged to remove solids. Supernatant of centrifuged urine samples was added to a 1.5 ml tube which, is containing D2O (deuterium oxide) solution, DSS( dextran sulphate sodium), and 10 mM imidazole. In addition, 0.42% sodium azide was added. Obtained plasma samples and sweat samples were stored at -20°C, and urine samples were stored at -70°C until conducting NMR spectroscopy.
Nuclear Magnetic Resonance Spectroscopy
Plasma, urine, and sweat samples were 1H NMR spectroscopy analyzed. Briefly, plasma, urine, and sweat samples were used with D2O containing the reference material TSP (trimethylsilylpropionate) before NMR measurement. We conducted high-resolution magic angle spinning NMR for plasma samples, with a spinning rate of 2,050 Hz. Water peak and macromolecular peak signals were removed using the Carr-Purcell-Meiboom-Gill pulse sequence for analysis of plasma, sweat, and urine samples. Used to eliminate signals from water peaks and macromolecular peaks. Measured spectrum data were optimized by Chenomx NMR Suite 7.1 (Chenomx Inc., Edmonton, AB, Canada), and statistical analysis were conducted by SIMCAp+12.0 (Umetrics, Umea, Sweden) software. In this study, we measured the absolute concentrations of the metabolites in various equine samples. Relative concentrations were determine, and amount of metabolites present in the samples were calculated by multivariate statistical analysis method.
Statistical Analysis
A T-test and One-way ANOVA analysis of variance was conducted to determine significance levels. Data were shown as mean ± standard deviation of mean. One-way ANOVA analysis of variance followed by Duncan multiple test was used to compare before and after exercise training results and used for each sample of thoroughbreds and Jeju pony.
Results
Comparison of Metabolic Patterns in Thoroughbred and Jeju Pony Before and After Exercise
In our previous study, we conducted 1H NMR spectroscopy analysis with various equine tissue samples (plasma, muscle, and urine) following exercise [11]. In this study, we obtained plasma, urine, sweat samples from both thoroughbred and Jeju pony following exercise, as well as before exercise, and conducted 1H NMR spectroscopy analysis (Figure 1A). We obtained a very large quantity of metabolomics data. A total of 26, 39, and 36 metabolites were identified in plasma (Figure 1B), sweat (Figure 1C), and urine samples (Figure 1D), respectively. To assess which metabolites were significantly released after exercise, we compared samples obtained before and after exercise in thoroughbred and Jeju pony. Glutamate, glutamine, glutathione, lactate, and pyruvate were detected in the Jeju pony plasma samples and betaine, citrate, glucose, glutamate, glutamine, glutathione, histidine, isoleucine, leucine, phenylalanine, proline, and valine were significantly released in plasma of thoroughbred horses (Supplementary Table 1). In urine samples, trimethylamine were identified in Jeju pony and 2-oxovalerate, 3-aminoisobutyrate, alanine, citrulline, glucose, glutamine, glutarate, methylsuccinate, N-isovaleroylglycine, N-phenylacetylglycine, proline, pyruvate, taurine, threonine, tryptophan, and urea were significantly released in thoroughbred horses (Supplementary Table 2). Notably, sweat samples were difficult to collect before exercise; as such, only those collected after exercise were used (Supplementary Table 3). In addition, we analyzed metabolites that were specifically released in each tissue (Table 1). A total of 3, 12, and 15 metabolites were identified in plasma, sweat, and urine, respectively.
Figure 1: Venn diagram showing shared and unique metabolites (A), and heatmap analysis of the differentially expressed metabolites (B-D) in the plasma, sweat, and urine. Red and green shadings represent higher and lower relative expression levels, respectively.
Table 1: Tissue specific metabolites in both of Thoroughbred and jeju pony
|
Clustering |
Total |
Metabolites |
| Plasma Only | 3 | Glutathione, Malonate, Ornithine |
| Sweat Only | 12 | 2-Hydroxybutyrate, Acetoin, Choline, Formate, Fumarate, Glycerate, Homoserine, Mannose, N-Methylhydantoin, Phenylacetate, Pyroglutamate, Urocanate |
| Urine Only | 15 | 2-Oxovalerate, 3-Aminoisobutyrate, 3-Hydroxyisovalerate, Acetoacetate, Citrulline, Dimethylamine, Glutarate, Hippurate, Methylsuccinate, N-Isovaleroylglycine, N-Phenylacetylglycine, Succinate, Trimethylamine, Trimethylamine N-oxide, Tryptophan |
| Plasma and Sweat | 22 | Acetate, Alanine, Betaine, Citrate, Creatine, Glucose, Glutamate, Glycerol, Glycine, Histidine, Isoleucine, Lactate, Leucine, Lysine, Proline, Pyruvate, Serine, Threonine, Tyrosine, Valine, myo-Inositol |
| Sweat and Urine | 20 | Acetate, Alanine, Arginine, Benzoate, Creatine, Creatinine, Glucose, Glycine, Isoleucine, Lactate, Leucine, Phenylalanine, Proline, Pyruvate, Taurine, Threonine, Tyrosine, Urea, Valine, myo-Inositol |
| Plasma and Urine | 16 | Acetate, Alanine, Creatine, Glucose, Glutamine, Glycine, Isoleucine, Lactate, Leucine, Phenylalanine, Proline, Pyruvate, Threonine, Tyrosine, Valine, myo-Inositol |
| Plasma, Sweat, and Urine | 15 | Acetate, Alanine, Creatine, Glucose, Glycine, Isoleucine, Lactate, Leucine, Phenylalanine, Proline, Pyruvate, Threonine, Tyrosine, Valine, Myo-Inositol |
Metabolite Set Enrichment Analyses Based on Exercise Status
Enrichment analyses of the overlapped metabolites among plasma, urine, and sweat were conducted by MetaboAnalyst 5.0 [12], and total 41 pathways were identified (Table 2). Among various pathways, the glucose-alanine cycle, glycine and serine metabolism, and alanine metabolism were the most significantly expressed after exercise.
Table 2: Enriched metabolite pathway among plasma, urine and sweat
|
Total |
Expected |
Hits |
Raw p |
Holm p |
FDR |
|
| Glucose-Alanine Cycle |
13 |
0.19 | 3 | 0.000667 | 0.0654 | 0.05 |
| Glycine and Serine Metabolism |
59 |
0.864 | 5 | 0.00103 | 0.1 | 0.05 |
| Alanine Metabolism |
17 |
0.249 | 3 | 0.00153 | 0.147 | 0.05 |
| Gluconeogenesis |
35 |
0.513 | 3 | 0.0126 | 1 | 0.308 |
| Pyruvate Metabolism |
48 |
0.703 | 3 | 0.0296 | 1 | 0.426 |
| Glutamate Metabolism |
49 |
0.718 | 3 | 0.0312 | 1 | 0.426 |
| Glutathione Metabolism |
21 |
0.308 | 2 | 0.0358 | 1 | 0.426 |
| Arginine and Proline Metabolism |
53 |
0.776 | 3 | 0.0383 | 1 | 0.426 |
| Transfer of Acetyl Groups into Mitochondria |
22 |
0.322 | 2 | 0.0391 | 1 | 0.426 |
| Warburg Effect |
58 |
0.85 | 3 | 0.0483 | 1 | 0.429 |
| Glycolysis |
25 |
0.366 | 2 | 0.0495 | 1 | 0.429 |
| Valine, Leucine and Isoleucine Degradation |
60 |
0.879 | 3 | 0.0526 | 1 | 0.429 |
| Phenylalanine and Tyrosine Metabolism |
28 |
0.41 | 2 | 0.0608 | 1 | 0.453 |
| Urea Cycle |
29 |
0.425 | 2 | 0.0647 | 1 | 0.453 |
| Ammonia Recycling |
32 |
0.469 | 2 | 0.0771 | 1 | 0.499 |
| Amino Sugar Metabolism |
33 |
0.483 | 2 | 0.0814 | 1 | 0.499 |
| Galactose Metabolism |
38 |
0.557 | 2 | 0.104 | 1 | 0.599 |
| Lactose Degradation |
9 |
0.132 | 1 | 0.125 | 1 | 0.68 |
| Pyruvaldehyde Degradation |
10 |
0.146 | 1 | 0.138 | 1 | 0.711 |
| Thyroid hormone synthesis |
13 |
0.19 | 1 | 0.176 | 1 | 0.86 |
| Phosphatidylinositol Phosphate Metabolism |
17 |
0.249 | 1 | 0.223 | 1 | 1 |
| Ethanol Degradation |
19 |
0.278 | 1 | 0.246 | 1 | 1 |
| Catecholamine Biosynthesis |
20 |
0.293 | 1 | 0.258 | 1 | 1 |
| Lactose Synthesis |
20 |
0.293 | 1 | 0.258 | 1 | 1 |
| Threonine and 2-Oxobutanoate Degradation |
20 |
0.293 | 1 | 0.258 | 1 | 1 |
| Carnitine Synthesis |
22 |
0.322 | 1 | 0.28 | 1 | 1 |
| Cysteine Metabolism |
26 |
0.381 | 1 | 0.322 | 1 | 1 |
| Inositol Phosphate Metabolism |
26 |
0.381 | 1 | 0.322 | 1 | 1 |
| Selenoamino Acid Metabolism |
28 |
0.41 | 1 | 0.342 | 1 | 1 |
| Citric Acid Cycle |
32 |
0.469 | 1 | 0.381 | 1 | 1 |
| Inositol Metabolism |
33 |
0.483 | 1 | 0.39 | 1 | 1 |
| Aspartate Metabolism |
35 |
0.513 | 1 | 0.409 | 1 | 1 |
| Fatty Acid Biosynthesis |
35 |
0.513 | 1 | 0.409 | 1 | 1 |
| Porphyrin Metabolism |
40 |
0.586 | 1 | 0.452 | 1 | 1 |
| Sphingolipid Metabolism |
40 |
0.586 | 1 | 0.452 | 1 | 1 |
| Propanoate Metabolism |
42 |
0.615 | 1 | 0.469 | 1 | 1 |
| Methionine Metabolism |
43 |
0.63 | 1 | 0.477 | 1 | 1 |
| Tryptophan Metabolism |
60 |
0.879 | 1 | 0.598 | 1 | 1 |
| Bile Acid Biosynthesis |
65 |
0.952 | 1 | 0.629 | 1 | 1 |
| Tyrosine Metabolism |
72 |
1.05 | 1 | 0.668 | 1 | 1 |
| Purine Metabolism |
74 |
1.08 | 1 | 0.678 | 1 | 1 |
Differentially Released Metabolites that Responded to Exercise in Plasma and Urine
A total of 15 metabolites, including acetate, alanine, and creatine, were observed in all sample types (plasma, urine, and sweat) (Table 1). For these metabolites, release pattern analysis after exercise was conducted in plasma and urine (Table 3). Lactate and pyruvate were significantly identified in the plasma of Jeju pony (Figure 2A) and six metabolites (glucose, isoleucine, leucine, phenylalanine, proline, and valine) were significantly identified in the thoroughbreds plasma samples (Figure 2B). In thoroughbred horses, most metabolites doubled after exercise, with glucose showing the biggest increase. Interestingly, metabolites that significantly increased after exercise in Jeju pony were showed a decreasing trend in thoroughbred horses after exercise. In addition, metabolic analysis was conducted in urine samples after exercise (Figure 3). In contrast with the plasma results, significant changes in the release of metabolites in urine were only found in the samples from thoroughbred horses. Alanine, glucose, proline, pyruvate, and threonine were significantly identified after exercise.
Table 3: Expression pattern of plasma metabolites overlapped among plasma, urine and sweat
| Metabolites | Jeju Horse | Thoroughbreds
|
|||||
| Before (Mean ±SE) mM | After (Mean ±SE) mM | p value | Before (Mean ±SE) mM
|
After (Mean ±SE) mM
|
p value
|
||
| Acetate | 13.30 ±1.77 | 16.44 ±1.49 | 0.259 | 17.10±3.49 | 15.20±1.38 | 0.633 | |
| Alanine | 15.26 ±1.35 | 17.09 ±1.82 | 0.49 | 16.39±2.46 | 10.78±3.18 | 0.248 | |
| Creatine | 3.53 ±0.32 | 3.52 ±0.22 | 0.979 | 2.75 ± 0.41 | 1.79 ± 0.43 | 0.186 | |
| Glucose | 118.24 ± 9.10 | 98.81 ± 5.52 | 0.141 | 104.00 ± 15.69 | 51.79 ± 9.07 | 0.0352** | |
| Glycine | 26.46 ± 2.95 | 23.95 ± 2.58 | 0.583 | 31.44 ± 7.79 | 14.75 ± 2.62 | 0.107 | |
| Isoleucine | 2.30 ± 0.19 | 2.00 ± 0.24 | 0.4 | 2.46 ± 0.40 | 1.18 ± 0.30 | 0.0512* | |
| Lactate | 20.31 ± 2.14 | 32.04 ± 1.57 | 0.00418*** | 18.22 ± 3.18 | 15.94 ± 4.46 | 0.719 | |
| Leucine | 7.33 ± 0.22 | 6.62 ± 0.46 | 0.243 | 7.53 ± 1.09 | 3.79 ± 0.78 | 0.0372** | |
| Phenylalanine | 2.02 ± 0.10 | 2.06 ± 0.20 | 0.895 | 2.30 ± 0.30 | 1.23 ± 0.27 | 0.0436** | |
| Proline | 8.38 ± 0.73 | 8.76 ± 0.47 | 0.704 | 11.48 ± 1.95 | 5.41 ± 1.42 | 0.0549* | |
| Pyruvate | 0.87 ± 0.12 | 1.40 ± 0.15 | 0.0388** | 0.94 ± 0.16 | 0.64 ± 0.11 | 0.21 | |
| Threonine | 11.06 ± 1.94 | 10.60 ± 1.84 | 0.88 | 16.51 ± 2.96 | 9.29 ± 3.14 | 0.172 | |
| Tyrosine | 2.75 ± 0.27 | 2.51 ± 0.34 | 0.635 | 3.54 ± 0.46 | 2.25 ± 0.57 | 0.133 | |
| Valine | 8.68 ± 0.75 | 8.27 ± 1.05 | 0.781 | 11.32 ± 2.17 | 5.45 ± 0.79 | 0.0527* | |
| Myo-Inositol | 2.73 ± 0.29 | 2.45 ± 0.15 | 0.475 | 3.38 ± 0.53 | 2.35 ± 0.94 | 0.418 | |
Figure 2: Significant difference of metabolites in plasma by exercise in Jeju pony (A) and Thoroughbreds (B). *p<0. 1, **p<0.05, ***p<0.01, ****p<0.001. All values expressed in mM as mean ± SD.
Figure 3: Significant difference of metabolites in urine by exercise in Thoroughbreds. *p<0. 1, **p<0.05, ***p<0.01, ****p<0.001. All values expressed in mM as mean ± SD.
Comparison of Metabolites between Equine Breeds (Thoroughbred and Jeju Pony)
In addition, we compared the metabolites between thoroughbred and Jeju pony under exercise stimuli (Tables 4-7). A greater difference was found between the metabolites released by the two breeds after exercise than before exercise in all sample types. Citrate and histidine were significantly released before exercise (Figure 4A), and 16 metabolites, including betaine and citrate, were significantly released after exercise in plasma in both breeds (Figure 4B). Among them, citrate values tripled in samples collected after exercise in both breeds and betaine and pyruvate showed largest difference between species (Figure 4B). In urine samples, six metabolites, including creatine and creatinine, showed significant differences between breeds (Figure 5). The release of taurine and myo-inositol was significantly different by more than 3.5-fold between breeds before exercise (Figure 5A) and five metabolites (creatine, creatinine, trimethylamine N-oxide, urea, and myo-inositol) were significantly different after exercise (Figure 5B). Creatine, urea, and myo-inositol more than doubled their values in urine samples after exercise (Figure 5). Although sweat samples were difficult to collect before exercise, we still analyzed sweat metabolite patterns after exercise. Among 39 metabolites, 30, including 2-hydroxybutyrate, showed significant differences between species (Table 6). Interestingly, most detected metabolites had a higher value in Jeju pony than in thoroughbred horses.
Table 4: Expression pattern of urine metabolites overlapped among plasma, urine and sweat
|
Metabolites
|
Jeju Horse
|
Thoroughbreds
|
|||||
| Before (Mean ± SE) mM
|
After (Mean ± SE) mM
|
p value
|
Before (Mean ± SE) mM
|
After (Mean ± SE) mM
|
p value
|
||
| Acetate | 0.56 ± 0.14 | 0.41 ± 0.10 | 0.366 | 0.38 ± 0.12 | 0.43 ± 0.09 | 0.778 | |
| Alanine | 0.04 ± 0.01 | 0.06 ± 0.02 | 0.573 | 0.03 ± 0.01 | 0.05 ± 0.01 | 0.0707* | |
| Creatine | 0.43 ± 0.32 | 0.09 ± 0.02 | 0.331 | 0.11 ± 0.04 | 0.17 ± 0.03 | 0.285 | |
| Glucose | 0.43 ± 0.08 | 0.61 ± 0.10 | 0.285 | 0.27 ± 0.05 | 0.64 ± 0.09 | 0.00719*** | |
| Glycine | 6.45 ± 4.42 | 0.39 ± 0.10 | 0.207 | 0.15 ± 0.04 | 0.23 ± 0.08 | 0.388 | |
| Isoleucine | 0.06 ± 0.01 | 0.08 ± 0.01 | 0.165 | 0.05 ± 0.01 | 0.11 ± 0.03 | 0.107 | |
| Lactate | 0.12 ± 0.04 | 0.13 ± 0.02 | 0.92 | 0.07 ± 0.02 | 0.13 ± 0.03 | 0.108 | |
| Leucine | 0.08 ± 0.01 | 0.12 ± 0.02 | 0.308 | 0.10 ± 0.03 | 0.16 ± 0.03 | 0.16 | |
| Phenylalanine | 0.48 ± 0.10 | 0.43 ± 0.08 | 0.793 | 0.31 ± 0.10 | 0.54 ± 0.11 | 0.158 | |
| Proline | 0.49 ± 0.08 | 0.68 ± 0.17 | 0.2 | 0.32 ± 0.08 | 0.60 ± 0.10 | 0.076* | |
| Pyruvate | 0.11 ± 0.02 | 0.14 ± 0.05 | 0.71 | 0.08 ± 0.02 | 0.15 ± 0.02 | 0.0676* | |
| Threonine | 0.34 ± 0.10 | 0.19 ± 0.04 | 0.244 | 0.16 ± 0.04 | 0.29 ± 0.05 | 0.0783* | |
| Tyrosine | 0.48 ± 0.13 | 0.50 ± 0.11 | 0.924 | 0.36 ± 0.10 | 0.63 ± 0.11 | 0.114 | |
| Valine | 0.06 ± 0.01 | 0.08 ± 0.01 | 0.349 | 0.07 ± 0.02 | 0.12 ± 0.03 | 0.177 | |
| Myo-Inositol | 1.00 ± 0.19 | 1.15 ± 0.16 | 0.288 | 0.27 ± 0.06 | 0.41 ± 0.06 | 0.166 | |
Table 5: Metabolite comparison between Thoroughbreds and jeju pony in plasma
|
Metabolites
|
Before (Mean ± SE) mM | After (Mean ± SE) mM
|
|||||||
| TH
|
JH
|
p value
|
TH
|
JH
|
p value
|
||||
| Acetate | 17.10 ± 3.49 | 13.30 ± 1.77 | 0.409 | 15.02 ± 1.38 | 16.44 ± 1.49 | 0.55 | |||
| Alanine | 16.39 ± 2.46 | 15.26 ± 1.35 | 0.729 | 10.78 ± 3.18 | 17.09 ± 1.82 | 0.162 | |||
| Betaine | 3.73 ± 1.06 | 3.59 ± 0.17 | 0.908 | 1.41 ± 0.34 | 3.17 ± 0.16 | 0.003*** | |||
| Citrate | 2.99 ± 0.36 | 4.09 ± 0.33 | 0.081** | 1.48 ± 0.33 | 4.51 ± 0.37 | 0.0006**** | |||
| Creatine | 2.75 ± 0.41 | 3.53 ± 0.32 | 0.213 | 1.79 ± 0.43 | 3.52 ± 0.22 | 0.012** | |||
| Glucose | 104.00 ± 15.69 | 118.24 ± 9.10 | 0.502 | 51.79 ± 9.70 | 98.81 ± 5.52 | 0.005*** | |||
| Glutamate | 9.08 ± 1.46 | 11.01 ± 0.67 | 0.315 | 4.07 ± 0.67 | 7.18 ± 0.71 | 0.022** | |||
| Glutamine | 10.07 ± 1.89 | 9.98 ± 0.98 | 0.971 | 3.88 ± 0.50 | 7.61 ± 0.49 | 0.001*** | |||
| Glutathione | 24.70 ± 4.59 | 21.68 ± 1.19 | 0.584 | 12.90 ± 3.15 | 17.66 ± 1.52 | 0.259 | |||
| Glycerol | 3.28 ± 0.50 | 4.39 ± 0.27 | 0.118 | 2.64 ± 0.94 | 3.79 ± 0.15 | 0.311 | |||
| Glycine | 31.44 ± 7.79 | 26.46 ± 2.95 | 0.607 | 14.75 ± 2.62 | 23.95 ± 2.58 | 0.06* | |||
| Histidine | 13.92 ± 2.01 | 8.56 ± 0.92 | 0.0621** | 6.57 ± 1.55 | 8.70 ± 0.97 | 0.329 | |||
| Isoleucine | 2.46 ± 0.40 | 2.30 ± 0.19 | 0.759 | 1.18 ± 0.30 | 2.00 ± 0.24 | 0.089* | |||
| Lactate | 18.22 ± 3.18 | 20.31 ± 2.14 | 0.639 | 15.94 ± 4.46 | 32.04 ± 1.57 | 0.016** | |||
| Leucine | 7.53 ± 1.09 | 7.33 ± 0.22 | 0.877 | 3.79 ± 0.78 | 6.62 ± 0.46 | 0.024** | |||
| Lysine | 59.40 ± 17.18 | 19.49 ± 9.91 | 0.11 | 39.78 ± 16.49 | 16.19 ± 8.54 | 0.289 | |||
| Malonate | 3.22 ± 0.42 | 3.98 ± 0.45 | 0.302 | 1.82 ± 0.58 | 3.19 ± 0.28 | 0.094* | |||
| Ornithine | 6.46 ± 2.44 | 10.88 ± 3.31 | 0.364 | 3.35 ± 0.82 | 9.22 ± 3.22 | 0.152 | |||
| Phenylalanine | 2.30 ± 0.30 | 2.02 ± 0.10 | 0.455 | 1.23 ± 0.27 | 2.06 ± 0.20 | 0.056* | |||
| Proline | 11.48 ± 1.95 | 8.38 ± 0.73 | 0.219 | 5.41 ± 1.42 | 8.76 ± 0.47 | 0.081* | |||
| Pyruvate | 0.94 ± 0.16 | 0.87 ± 0.12 | 0.775 | 0.64 ± 0.11 | 1.40 ± 0.15 | 0.00625*** | |||
| Serine | 18.34 ± 3.74 | 15.52 ± 0.96 | 0.532 | 10.33 ± 3.30 | 14.46 ± 1.86 | 0.357 | |||
| Threonine | 16.51 ± 2.96 | 11.06 ± 1.94 | 0.205 | 9.29 ± 3.14 | 10.60 ± 1.84 | 0.756 | |||
| Tyrosine | 3.54 ± 0.46 | 2.75 ± 0.27 | 0.222 | 2.25 ± 0.51 | 2.51 ± 0.34 | 0.718 | |||
| Valine | 11.32 ± 2.17 | 8.68 ± 0.75 | 0.335 | 5.45 ± 0.79 | 8.27 ± 1.05 | 0.0917* | |||
| myo-Inositol | 3.38 ± 0.53 | 2.73 ± 0.29 | 0.362 | 2.35 ± 0.94 | 2.45 ± 0.15 | 0.927 | |||
Table 6: Metabolite comparison between Thoroughbreds and jeju pony in Urine
|
Metabolites
|
Before (Mean ± SE) mM
|
After (Mean ± SE) mM
|
|||||
| TH
|
JH
|
p value
|
TH
|
JH
|
p value
|
||
| 2-Oxovalerate | 0.09 ± 0.02 | 0.12 ± 0.03 | 0.378 | 0.22 ± 0.05 | 0.14 ± 0.03 | 0.338 | |
| 3-Aminoisobutyrate | 0.28 ± 0.07 | 0.29 ± 0.07 | 0.882 | 0.48 ± 0.08 | 0.41 ± 0.12 | 0.851 | |
| 3-Hydroxyisovalerate | 0.06 ± 0.01 | 0.04 ± 0.00 | 0.34 | 0.10 ± 0.02 | 0.08 ± 0.04 | 0.971 | |
| Acetate | 0.38 ± 0.12 | 0.56 ± 0.14 | 0.362 | 0.43 ± 0.09 | 0.41 ± 0.1 | 0.946 | |
| Acetoacetate | 0.17 ± 0.05 | 0.18 ± 0.04 | 0.949 | 0.47 ± 0.20 | 0.21 ± 0.04 | 0.231 | |
| Alanine | 0.03 ± 0.01 | 0.04 ± 0.01 | 0.103 | 0.05 ± 0.01 | 0.06 ± 0.02 | 0.628 | |
| Arginine | 0.29 ± 0.10 | 0.43 ± 0.12 | 0.397 | 0.32 ± 0.08 | 0.60 ± 0.2 | 0.246 | |
| Benzoate | 0.07 ± 0.02 | 5.73 ± 3.49 | 0.143 | 0.05 ± 0.01 | 0.06 ± 0.01 | 0.937 | |
| Citrulline | 0.30 ± 0.07 | 0.41 ± 0.07 | 0.298 | 0.58 ± 0.10 | 0.61 ± 0.15 | 0.735 | |
| Creatine | 0.11 ± 0.04 | 0.43 ± 0.32 | 0.342 | 0.17 ± 0.03 | 0.09 ± 0.02 | 0.0719* | |
| Creatinine | 11.73 ± 3.30 | 11.90 ± 2.37 | 0.968 | 17.00 ± 2.32 | 8.84 ± 2.61 | 0.0733* | |
| Dimethylamine | 0.13 ± 0.03 | 0.18 ± 0.03 | 0.272 | 0.16 ± 0.03 | 0.20 ± 0.03 | 0.34 | |
| Glucose | 0.27 ± 0.05 | 0.43 ± 0.08 | 0.146 | 0.64 ± 0.09 | 0.61 ± 0.1 | 0.928 | |
| Glutamine | 0.37 ± 0.09 | 0.54 ± 0.08 | 0.217 | 0.70 ± 0.13 | 0.53 ± 0.1 | 0.502 | |
| Glutarate | 0.08 ± 0.02 | 0.12 ± 0.02 | 0.299 | 0.19 ± 0.05 | 0.13 ± 0.03 | 0.585 | |
| Glycine | 0.15 ± 0.04 | 6.45 ± 4.42 | 0.191 | 0.23 ± 0.08 | 0.39 ± 0.1 | 0.205 | |
| Hippurate | 26.02 ± 8.77 | 19.32 ± 3.47 | 0.498 | 53.58 ± 15.38 | 35.04 ± 7.85 | 0.381 | |
| Isoleucine | 0.05 ± 0.01 | 0.06 ± 0.01 | 0.814 | 0.11 ± 0.03 | 0.08 ± 0.01 | 0.313 | |
| Lactate | 0.07 ± 0.02 | 0.12 ± 0.04 | 0.266 | 0.13 ± 0.03 | 0.13 ± 0.02 | 0.976 | |
| Leucine | 0.10 ± 0.03 | 0.08 ± 0.01 | 0.553 | 0.16 ± 0.03 | 0.12 ± 0.02 | 0.405 | |
| Methylsuccinate | 0.14 ± 0.04 | 0.15 ± 0.02 | 0.814 | 0.30 ± 0.07 | 0.21 ± 0.05 | 0.474 | |
| N-Isovaleroylglycine | 0.10 ± 0.02 | 0.13 ± 0.03 | 0.502 | 0.16 ± 0.01 | 0.14 ± 0.03 | 0.831 | |
| N-Phenylacetylglycine | 5.94 ± 1.38 | 7.40 ± 1.50 | 0.494 | 10.96 ± 1.83 | 8.63 ± 1.34 | 0.524 | |
| Phenylalanine | 0.31 ± 0.10 | 0.48 ± 0.10 | 0.264 | 0.54 ± 0.11 | 0.43 ± 0.08 | 0.687 | |
| Proline | 0.32 ± 0.08 | 0.49 ± 0.08 | 0.198 | 0.60 ± 0.10 | 0.68 ± 0.17 | 0.466 | |
| Pyruvate | 0.08 ± 0.02 | 0.11 ± 0.02 | 0.44 | 0.15 ± 0.02 | 0.14 ± 0.05 | 0.998 | |
| Succinate | 0.03 ± 0.01 | 0.04 ± 0.01 | 0.197 | 0.05 ± 0.01 | 0.03 ± 0.01 | 0.419 | |
| Taurine | 0.23 ± 0.06 | 0.86 ± 0.23 | 0.0312** | 0.78 ± 0.17 | 1.16 ± 0.41 | 0.738 | |
| Threonine | 0.16 ± 0.04 | 0.34 ± 0.10 | 0.127 | 0.29 ± 0.05 | 0.19 ± 0.04 | 0.3 | |
| Trimethylamine | 0.03 ± 0.01 | 0.04 ± 0.01 | 0.138 | 0.04 ± 0.00 | 0.02 ± 0 | 0.198 | |
| Trimethylamine N-oxide | 0.15 ± 0.05 | 0.20 ± 0.06 | 0.553 | 0.11 ± 0.02 | 0.22 ± 0.03 | 0.025** | |
| Tryptophan | 0.26 ± 0.07 | 0.29 ± 0.03 | 0.69 | 0.50 ± 0.09 | 0.47 ± 0.08 | 0.973 | |
| Tyrosine | 0.36 ± 0.10 | 0.48 ± 0.13 | 0.512 | 0.63 ± 0.11 | 0.50 ± 0.11 | 0.636 | |
| Urea | 84.58 ± 16.17 | 79.19 ± 9.54 | 0.782 | 173.25 ± 11.44 | 103.46 ± 9.89 | 0.00177*** | |
| Valine | 0.07 ± 0.02 | 0.06 ± 0.01 | 0.842 | 0.12 ± 0.03 | 0.08 ± 0.01 | 0.322 | |
| Myo-Inositol | 0.27 ± 0.06 | 1.00 ± 0.19 | 0.0062*** | 0.41 ± 0.06 | 1.15 ± 0.16 | 0.00639*** | |
Table 7: Metabolite comparison between Thoroughbreds and jeju pony in Sweat
|
Metabolites
|
Before (Mean ± SE) mM
|
||
| TH
|
JH
|
p value
|
|
| 2-Hydroxybutyrate | 0.05 ± 0.01 | 0.28 ± 0.08 | 0.0505* |
| Acetate | 1.06 ± 0.42 | 2.15 ± 0.29 | 0.331 |
| Acetoin | 0.00 ± 0.00 | 0.05 ± 0.00 | 1.07e-05**** |
| Alanine | 0.14 ± 0.05 | 1.40 ± 0.37 | 0.0281** |
| Arginine | 0.06 ± 0.02 | 1.06 ± 0.48 | 0.108 |
| Benzoate | 0.03 ± 0.01 | 0.26 ± 0.10 | 0.095* |
| Betaine | 0.01 ± 0.00 | 0.06 ± 0.02 | 0.0602* |
| Choline | 0.00 ± 0.00 | 0.01 ± 0.00 | 0.00326*** |
| Citrate | 0.49 ± 0.06 | 8.16 ± 3.08 | 0.0693* |
| Creatine | 0.03 ± 0.01 | 0.18 ± 0.01 | 0.000221**** |
| Creatinine | 0.07 ± 0.03 | 0.12 ± 0.04 | 0.532 |
| Formate | 0.18 ± 0.04 | 0.49 ± 0.02 | 0.00646*** |
| Fumarate | 0.01 ± 0.00 | 0.05 ± 0.01 | 0.0561* |
| Glucose | 0.17 ± 0.06 | 1.55 ± 0.36 | 0.0223** |
| Glutamate | 0.08 ± 0.01 | 0.45 ± 0.08 | 0.00996*** |
| Glycerate | 0.07 ± 0.02 | 0.31 ± 0.02 | 0.00222*** |
| Glycerol | 0.10 ± 0.02 | 1.18 ± 0.20 | 0.00578*** |
| Glycine | 0.14 ± 0.05 | 1.70 ± 0.47 | 0.0299** |
| Histidine | 0.02 ± 0.00 | 0.63 ± 0.41 | 0.215 |
| Homoserine | 0.06 ± 0.01 | 0.33 ± 0.12 | 0.114 |
| Isoleucine | 0.03 ± 0.01 | 0.20 ± 0.06 | 0.0457** |
| Lactate | 0.43 ± 0.14 | 5.90 ± 1.92 | 0.0519* |
| Leucine | 0.04 ± 0.01 | 0.23 ± 0.06 | 0.0324** |
| Lysine | 0.02 ± 0.01 | 0.19 ± 0.06 | 0.057* |
| Mannose | 0.10 ± 0.03 | 0.16 ± 0.01 | 0.0367** |
| N-Methylhydantoin | 0.00 ± 0.00 | 0.03 ± 0.01 | 0.0339** |
| Phenylacetate | 0.02 ± 0.00 | 0.07 ± 0.03 | 0.129 |
| Phenylalanine | 0.02 ± 0.00 | 0.21 ± 0.06 | 0.0362** |
| Proline | 0.06 ± 0.01 | 0.19 ± 0.04 | 0.0648* |
| Pyroglutamate | 0.15 ± 0.05 | 1.61 ± 0.58 | 0.0639* |
| Pyruvate | 0.10 ± 0.03 | 0.84 ± 0.01 | 1.44e-05**** |
| Serine | 0.18 ± 0.06 | 2.77 ± 1.41 | 0.138 |
| Taurine | 0.02 ± 0.00 | 0.08 ± 0.01 | 0.000513**** |
| Threonine | 0.04 ± 0.01 | 0.53 ± 0.27 | 0.15 |
| Tyrosine | 0.02 ± 0.00 | 0.13 ± 0.04 | 0.0503* |
| Urea | 10.05 ± 1.98 | 7.93 ± 3.51 | 0.894 |
| Urocanate | 0.04 ± 0.01 | 0.24 ± 0.06 | 0.0283** |
| Valine | 0.04 ± 0.01 | 0.26 ± 0.08 | 0.0506* |
| Myo-Inositol | 0.06 ± 0.01 | 0.25 ± 0.04 | 0.0134** |
Figure 4: Significant difference of metabolites in plasma between breeds (Jeju pony and Thoroughbreds) before (A) and After exercise (B). *p<0. 1, **p<0.05, ***p<0.01, ****p<0.001. All values expressed in mM as mean ± SD.
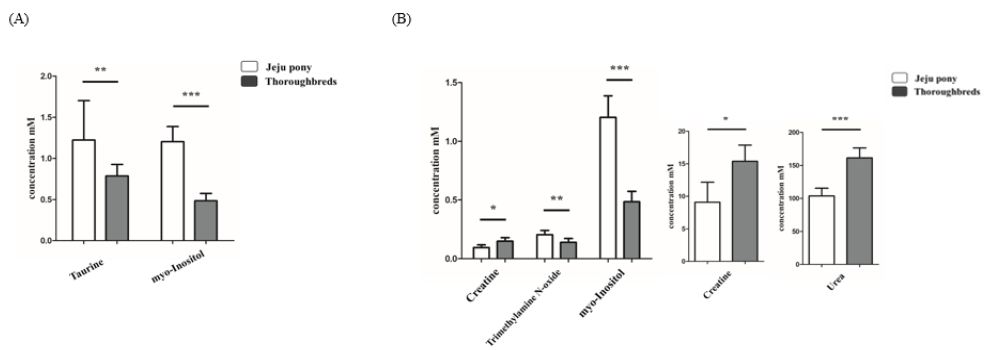
Figure 5: Significant difference of metabolites in urine between breeds (Jeju pony and Thoroughbreds) before (A) and after exercise (B). *p<0. 1, **p<0.05, ***p<0.01, ****p<0.001. All values expressed in mM as mean ± SD.
Discussion
Almost 60 million horses currently exist on the planet. In addition to providing important services such as transport, meat, leather, and ploughing force and in the majority of developing countries, horses are mainly used for sports and leisure activities in most developed countries [13]. Therefore, as one of their most important economic traits, most research conducted in horses focuses on improving their athletic abilities [14,15]. However, although their physical and physiological adaptations receive much attention [16], targeted genes and metabolites or underlying mechanisms associated with exercise are still understudied.
The advances in metabolic analysis technology that have been carried out allow the assessment of the physiological state of individuals [17] and prediction of their condition [18]. Therefore, metabolomics demonstrates various biological responses to environmental influences, genetic, transcriptomic, and proteomic, [19-21]. Because of these advantages, metabolic analysis is widely used to explore metabolic patterns [22] or to discover new biomarkers through physical changes associated with diseases or environmental changes [21,23].
Although previous studies have investigated the metabolic changes caused by exercise, most only analyzed skeletal muscle [24] and were further limited by their small sample size and little expansive metabolite platform [25]. Previous metabolic studies on exercise mainly focus on the effect of exercise in various tissues [26,27], and studies on the discovery of biomarkers, which are affected by the athletic ability of individuals, are relatively poorly performed. Jang et al., 2017, the basis of this study, conducted a metabolic analysis in skeletal muscle, plasma, and urine samples after exercise [11]. In this study, we performed a metabolic analysis in plasma, urine, and sweat samples of thoroughbred and Jeju pony by exercise. In addition, we demonstrated the influence of exercise and breed in metabolite levels. We obtained a large amount of metabolite data that were released after exercise. Among 15 metabolites that were commonly detected in plasma, urine, and sweat, the levels of lactate, pyruvate, glucose, isoleucine, leucine, phenylalanine, proline, and valine showed significantly changes after exercise in plasma samples (Figure 2), and the levels of alanine, glucose, proline, pyruvate, and threonine had significantly changed after exercise in urine samples (Figure 3). These results are in line with those of previous studies [11]. The metabolites observed in samples collected after exercise were all associated with the tricarboxylic acid (TCA) cycle, with some being intermediate products. Alanine, aspartate, and glutamate metabolism and aminoacyl-tRNA and arginine biosynthesis related metabolic pathways are activated by acute exercise [28]. These results suggest that several metabolic pathways that utilize skeletal muscle substrate are regulated after exercise, and previous studies reported that this occurs in various tissues [29,30].
During exercise, muscle glycogen, its main source of energy, is altered to glucose and subsequently to pyruvate via glycolysis [31]. The pyruvate converted by glycolysis can enter TCA and glucose-alanine cycles or be converted to lactate [32]. During aerobic exercise, muscle glycogen can be used to produce ATP through glycolysis; however, when anaerobic exercise like a sprint is conducted, the muscles cannot use oxygen for glycolysis [33]. Therefore, muscle glycogen (glucose) is altered to lactate through anaerobic glycolysis [33]. Then, the lactate is released to the bloodstream and transferred to the kidneys and liver [34]. In the liver, lactate is altered to pyruvate through gluconeogenesis [35]. In addition, when amino acids are used for energy in extrahepatic tissues, pyruvate derived from the glycolysis is used as an amino group receptor to form alanine, a non-essential amino acid [36]. The produced alanine is transferred to the liver through the bloodstream and converted to either pyruvate for gluconeogenesis via the glycose–alanine cycle or to glutamate, which then goes through the urea cycle. Collectively, the detected metabolites in equine plasma and urine including glucose, alanine, and lactate were altered to pyruvate and used for energy production. Therefore, the metabolites discovered in this study can be used as a reasonable indicator to measure athletic ability and exercise fatigue.
In conclusion, we compared metabolite presence between thoroughbreds and Jeju pony after exercise and analyzed enriched metabolic pathways of commonly detected metabolites in all samples (plasma, urine, and sweat). Our results could help improve our understanding of exercise fatigue and find regulation markers for fatigue reduction. Further research is necessary to combine these results with other omics data and reveal the function of metabolic markers.
Declarations
Ethics Approval and Consent to Participate
All animal procedures used in the study were conducted in compliance with international standards and were approved by the Institutional Animal Care and Use Committee of Pusan National University (Approval Number: PNU-2015-0864).
Competing Interests
The authors declare that they have no competing interests.
Acknowledgments
This work was supported by a 2-Year Research Grant from the Pusan National University.
Author’s Contribution
The research was conceptualized by Park JW, Cho BW and further edition was done by all the authors. Data was curated by Park JW, Kim KH, and analyzed by Park JW, Lee SI, Sang SS. All authors have participated on data interpretation. The draft of the manuscript was written by Park JW and Kim KH, and the final form was edited by Lee SI, Sang SS, and Cho BW. All authors have contributed by interpretation, analysis, critical discussion.
References
- Kim H, Lee T, Park W, Lee JW, Kim J, et al. (2013) Peeling back the evolutionary layers of molecular mechanisms responsive to exercise-stress in the skeletal muscle of the racing horse. DNA Res 20: 287-298. [crossref]
- PARK Jeong-Woong, Choi JY, Hong SA, Kim NY, Do KT, et al. (2017) Exercise induced upregulation of glutamate-cysteine ligase catalytic subunit and glutamate-cysteine ligase modifier subunit gene expression in Thoroughbred horses. Asian-Australasian Journal of animal sciences 30: 728-735. [crossref]
- CHO Hyun-Woo, Shin S, Park JW, Choi JY, Kim NY, et al. (2015) Molecular characterization and expression analysis of the peroxisome proliferator activated receptor delta (PPARδ) gene before and after exercise in horse. Asian-Australasian Journal of Animal Sciences 28: 697. [crossref]
- KHUMMUANG Saichit, Lee HG, Joo SS, Park JW, Choi JY, et al. (2020) Comparison for immunophysiological responses of Jeju and Thoroughbred horses after exercise. Asian-Australasian Journal of Animal Sciences 33: 424-435. [crossref]
- PARK Jeong-Woong, Kim KH, Choi JK, Park TS, Song KD, et al. (2021) Regulation of toll-like receptors expression in muscle cells by exercise-induced stress. Animal Bioscience 34: 1590. [crossref]
- LEE Hyo Gun, Choi JY, Park JW, Park TS, Song KD, et al. (2019) Effects of exercise on myokine gene expression in horse skeletal muscles. Asian-Australasian Journal of Animal Sciences 32: 350-356. [crossref]
- Jordan Kate W, Nordenstam J, Lauwers GY, Rothenberger DA, Alavi K, et al. (2009) “Metabolomic characterization of human rectal adenocarcinoma with intact tissue magnetic resonance spectroscopy.” Diseases of the colon and rectum 52: 520. [crossref]
- Hargreaves Mark (2000) “Skeletal muscle metabolism during exercise in humans.” Clinical and Experimental Pharmacology and Physiology 27: 225-228. [crossref]
- Moghetti Paolo, Bacchi E, Brangani C, Donà S, Negri C (2016) “Metabolic effects of exercise.” Sports Endocrinology 47: 44-57. [crossref]
- Jang Hyun-Jun, Kim DM, Kim KB, Park JW, Choi JY, et al. (2017) “Analysis of metabolomic patterns in thoroughbreds before and after exercise.” Asian-Australasian journal of animal sciences 30: 1633-1642. [crossref]
- PANG Zhiqiang, Zhou G, Ewald J, Chang L, Hacariz O, et al. (2022) Using MetaboAnalyst 5.0 for LC–HRMS spectra processing, multi-omics integration and covariate adjustment of global metabolomics data. Nature Protocols 17: 1735-1761. [crossref]
- ORLANDO Ludovic (2020) The evolutionary and historical foundation of the modern horse: Lessons from ancient genomics. Annual Review of Genetics 54: 563-581. [crossref]
- Wilkin Tessa, Anna Baoutina, Natasha Hamilton (2017) “Equine performance genes and the future of doping in horseracing.” Drug testing and analysis 9: 1456-1471. [crossref]
- Arfuso Francesca, Assenza A, Fazio F, Rizzo M, Giannetto C, et al. (2019) “Dynamic change of serum levels of some branched-chain amino acids and tryptophan in athletic horses after different physical exercises.” Journal of equine veterinary science 77: 12-16. [crossref]
- Arfuso Francesca, Giudice E, Panzera M, Rizzo M, Fazio F, et al. (2022) “Interleukin-1Ra (Il-1Ra) and serum cortisol level relationship in horse as dynamic adaptive response during physical exercise.” Veterinary Immunology and Immunopathology 243: 110368. [crossref]
- SABATINE Marc S, Liu E, Morrow DA, Heller E, McCarroll R, et al. (2005) Metabolomic identification of novel biomarkers of myocardial ischemia. Circulation 112: 3868-3875. [crossref]
- SHAH Svati H, Bain JR, Muehlbauer MJ, Stevens RD, Crosslin DR, et al. (2010) Association of a peripheral blood metabolic profile with coronary artery disease and risk of subsequent cardiovascular events. Circulation: Cardiovascular Genetics 3: 207-214. [crossref]
- GERMAN J Bruce, HAMMOCK Bruce D, WATKINS Steven M (2005) Metabolomics: building on a century of biochemistry to guide human health. Metabolomics 1: 3-9. [crossref]
- OREŠIČ Matej, VIDAL-PUIG Antonio, HÄNNINEN Virve (2006) Metabolomic approaches to phenotype characterization and applications to complex diseases. Expert review of molecular diagnostics 6: 575-585. [crossref]
- MOORE Rowan E, Kirwan J, Doherty MK, Whitfield PD (2007) Biomarker discovery in animal health and disease: the application of post-genomic technologies. Biomarker insights 2: 185-196. [crossref]
- KELL Douglas B (2004) Metabolomics and systems biology: making sense of the soup. Current opinion in microbiology 7: 296-307. [crossref]
- WHITFIELD, Phillip David, et al. (2005) Metabolomics as a diagnostic tool for hepatology: validation in a naturally occurring canine model. Metabolomics 1: 215-225.
- HUFFMAN Kim M, Koves TR, Hubal MJ, Abouassi H, Beri N, et al. (2014) Metabolite signatures of exercise training in human skeletal muscle relate to mitochondrial remodelling and cardiometabolic fitness. Diabetologia 57: 2282-2295. [crossref]
- HUFFMAN Kim M, Slentz CA, Bateman LA, Thompson D, Muehlbauer MJ, et al. (2011) Exercise-induced changes in metabolic intermediates, hormones, and inflammatory markers associated with improvements in insulin sensitivity. Diabetes Care 34: 174-176. [crossref]
- BRENNAN Andrea M, Benson M, Morningstar J, Herzig M, Robbins J, et al. (2018) Plasma metabolite profiles in response to chronic exercise. Medicine and science in sports and exercise 50: 1480-1486. [crossref]
- BRENNAN Andrea M, Tchernof A, Gerszten RE, Cowan TE, Ross R (2018) Depot-specific adipose tissue metabolite profiles and corresponding changes following aerobic exercise. Frontiers in Endocrinology 9: 759. [crossref]
- TABONE Mariangela, et al. (2021) The effect of acute moderate-intensity exercise on the serum and fecal metabolomes and the gut microbiota of cross-country endurance athletes. Scientific reports 11: 1-12.
- MANAF Faizal A, Lawler NG, Peiffer JJ, Maker GL, Boyce MC, et al. (2018) Characterizing the plasma metabolome during and following a maximal exercise cycling test. Journal of Applied Physiology 125: 1193-1203. [crossref]
- HEINONEN Ilkka, Kalliokoski KK, Hannukainen JC, Duncker DJ, Nuutila P, et al. (2014) Organ-specific physiological responses to acute physical exercise and long-term training in humans. Physiology 29: 421-436. [crossref]
- SPRIET Lawrence L (2002) Regulation of skeletal muscle fat oxidation during exercise in humans. Medicine and science in sports and exercise9: 1477-1484. [crossref]
- ISHIKURA, Keisuke; RA, Song-Gyu, OHMORI, Hajime (2013) Exercise-induced changes in amino acid levels in skeletal muscle and plasma. The Journal of Physical Fitness and Sports Medicine3: 301-310.
- HIGGINS, Chris. Lactate and lactic acidosis. 2007. [crossref]
- YANG Woo-Hwi, Park H, Grau M, Heine O (2020) Decreased blood glucose and lactate: is a useful indicator of recovery ability in athletes? International Journal of Environmental Research and Public Health15: 5470. [crossref]
- CHIANG J (2014) Liver physiology: Metabolism and detoxification.
- EXTON JH, Mallette LE, Jefferson LS, Wong EH, Friedmann N, et al. (1970) The hormonal control of hepatic gluconeogenesis. In: Proceedings of the 1969 Laurentian Hormone Conference. Academic Press 411-461. [crossref]
- JOSE Caroline, Melser S, Benard G, Rossignol R (2013) Mitoplasticity: adaptation biology of the mitochondrion to the cellular redox state in physiology and carcinogenesis. Antioxidants & Redox Signaling7: 808-849. [crossref]