Abstract
Diamond and graphite in a vertical pegmatite veinlet in a gneiss drill core from the Annaberg region/Erzgebirge, Germany, demonstrate a more crustal position and underline the greater meaning of the input of supercritical fluids from mantle deeps. Proof for that statement is a high concentration of nano-diamond-bearing graphite as a micrometer to sub-micrometer large crystals in quartz and orthoclase.
Keywords
Pegmatite, Nanodiamond, Graphite, Raman spectroscopy, Supercritical fluids
Introduction
End of the eighties, we studied drill cores, most granites from the Annaberg district, for melt inclusion to reconstruct the temperature and pressure of granites with cassiterite-bearing vein/veinlet structures. Most samples are from the borehole An 10/85 near the Grundteichschenke north of Schlettau (Buchholz region). Some results are used and cited in Hösel et al. (1992) [1]. The primary data are in the Thomas (1988) [2]. Most samples are granite drill cores. The solidus, liquidus, homogenization temperatures, and water content of melt inclusions were determined on these granite samples in 1988. However, sample T6 from the drill core An 10/85 (at 71.0 m depth) is a gneiss core with a 2 cm thick pegmatite veinlet parallel to the drill core axis (perpendicular). The pegmatite veinlet was by the field geologist as a dolomite-fluorite vein wrongly interpreted. A microscopic study showed that dolomite and fluorite are not present. Only quartz, feldspars, muscovite, zircon, and apatite are observable. The sample was not studied then because of the complete absence of fluid and melt inclusions.
Methods
We used for all microscopic and Raman spectrometric studies a petrographic polarization microscope with a rotating stage coupled with the RamMics R532 Raman spectrometer working in the spectral range of 0-4000 cm-1 using a 50 mW single mode 532nm laser. Details are in Thomas et al. 2022a and 2022b [3,4]. We used the Olympus long-distance LMPLN100x for the Raman spectroscopic routine measurements as a 100x objective. To avoid contamination on the sample surface, we studied only mineral grains deep under the surface. Therefore, we generally used the total laser power of 50 mW on the sample and a long counting time of 100 to 200 seconds and sometimes up to 10 minutes.
Sample
Figure 1 shows the used sample T6 from the drill core An 10/85 (at 71.0 m). Besides the typical pegmatite minerals quartz, feldspars, mica, zircon, zircon-reidite, xenotime-(Y), monazite-(Ce), and apatite, the pegmatite is characterized by an unexpectedly large amount of graphite and nanodiamond grains in quartz (Figure 2) and also in orthoclase. Fluid inclusions (≤ 2 µm) are very rare. The 500 µm thick sample is polished on both sides with an Al2O3-H2O suspension and carefully cleaned. Graphite and diamond are the objects of this short study. To avoid possible contamination by diamonds from the drilling and preparation, we used only graphite and diamonds deeper than 30 µm (see Thomas et al. 2023).
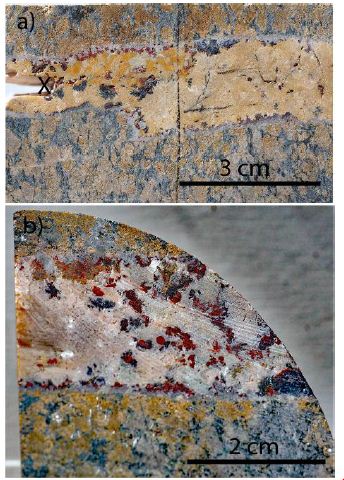
Figure 1: View of the drill core sample. a) Side view of the gneiss core with yellow-brown pegmatite veinlet. X shows the sample position. b) Top view of the sample. The red and black crystals are hematite and pyrrhotine, respectively.
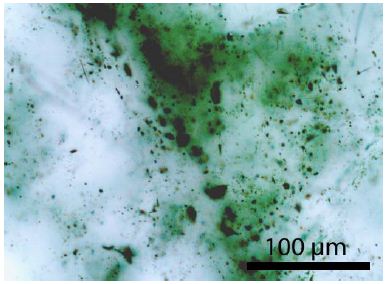
Figure 2: Distribution of the graphite grains in pegmatite quartz about 30 µm deep from the sample surface.
Results
During the microscopic study of the quartz and orthoclase from the pegmatite, black crystals and aggregates (≥ 5 µm) are noticeable. The mean is 1.8 x 10⁸ black grains per cm3 in quartz. The distinction between graphite and nanodiamond is only possible with the Raman spectroscopy. There are sporadic also graphite-diamond grains present in feldspar. Figure 2 shows the distribution of graphite-like crystals and clusters in quartz.
The distribution is not homogeneous. Partial hydrothermal re-mobilised quartz (lighter) is pure in graphite. However, the 1580 cm-1 Raman graphite band is also present at long counting times in transparent quartz regions. That means the sample has a very high density of tiny to nano-graphite particles-invisible at the highest magnification (100x ocular). Table 1 gives the Raman data for “invisible” diamonds and graphite in transparent quartz regions, and Figure 3 shows the corresponding Raman spectrum.
Table 1: Raman band of diamond and graphite in clear pegmatite quartz of the sample
|
Mineral phase |
Raman band (cm-1) |
FWHM (cm-1) |
| Quartz |
1233.2 |
17.4 |
| Diamond |
1333.1 |
19.1 |
| Graphite D1 |
1353.6 |
33.2 |
| Graphite G |
1580.7 |
28.0 |
| Graphite D2 |
1615.7 |
37.1 |
FWHM: Full Width at Half Maximum
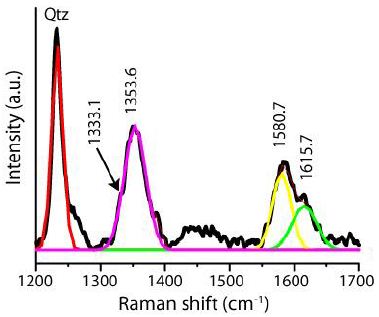
Figure 3: Raman spectrum of clear pegmatite quartz without microscopically visible graphite. Qtz-weak quartz band at 1233.2 cm-1. Recording conditions: 50 mW on sample, exposition time of 10 minutes, 100x objective (see Table 1).
Under the more macroscopical black dots (often spherical or elliptical), there are primarily mixtures of diamond and graphite-Figure 4 shows such crystals. The large xenotime-(Y) crystal in Figure 4a is conspicuous. The Raman spectra match 97% of the xenotime-(Y) RRUFF database ID: R050178 [5]. Besides xenotime-(Y), there are also monazite-(Ce) crystals present [RRUFF database ID: R040106, match 95%], mostly in larger graphite aggregates. Both REE minerals are primarily present in larger graphite-nanodiamond crystal clusters, demonstrating that these minerals are also related to the fast-rising supercritical fluids. Table 2 shows the obtained Raman data (Gaussian fit) of the studied graphite and nanodiamond in Figures 4 and 5.
Table 2: Raman data for the graphite-diamond aggregate shown in Figure 4a
|
Mineral phase |
Raman band (cm-1) |
FWHM (cm-1) |
| Diamond tip1) |
1267.8 |
71.6 |
| Diamond |
1322.6 |
46.9 |
| Diamond (bulk) |
1333.1 |
100.0 |
| Graphite D1 |
1352.7 |
56.8 |
| Graphite G |
1571.8 |
81.9 |
| Graphite D2 |
1615.7 |
39.3 |
FWHM: Full Width at Half Maximum. 1)According to Zaitsev (2001), this range is typical for isolated crystallites of diamonds – here, nanodiamonds.
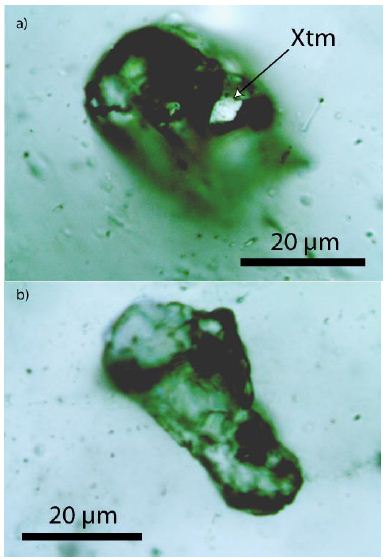
Figure 4: Graphite-nano-diamond aggregates in pegmatite quartz from the drill core T6 from the drilling An 10/85. a) The crystal with Xtm marked place in the graphite-nano-diamond aggregate is a xenotime-(Y) crystal. The crystal shown in b) is composed only of graphite and diamond.
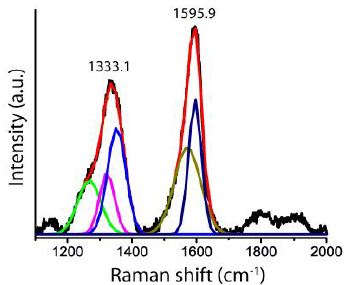
Figure 5: Raman spectrum of a graphite-diamond aggregate (Figure 4a) in pegmatite quartz (sample T6). Shown are only the principal data. More information is in Table 2.
Table 3 summarizes the Raman data of nanodiamond and graphite in the pegmatite sample T6.
For quartz, the Raman band ranges from 1327.3 to 1351.1 cm-1. According to Zaitsev (2001) [6], this range is typical for isolated crystallites of diamonds-here, nanodiamonds with grain size in the range of several nanometers. Besides the spheric to elliptic graphite aggregates, there are also whisker-like graphite needles (see Figure 6); however, there are never moissanite whiskers.
Table 3: Raman data for nanodiamond (n=20) and graphite (n=10) in quartz and orthoclase in the pegmatite from samples T6, 20, and 10 different crystals, respectively.
|
|
Diamond | Graphite | ||
| Mineral | Raman band (cm-1) | FWHM (cm-1) | Raman band (cm-1) |
FWHM (cm-1) |
| Quartz |
1339.4 ± 12.1 |
41.8 ± 12.0 | 1580.3 ± 4.5
1615.4 ± 3.8 |
39.2 ± 11.9 29.2 ± 4.3 |
| Orthoclase |
1337.5 ± 6.8 |
49.9 ± 16.3 |
1571.8 ± 8.0 |
27.8 ± 4.0 |
| Or-matrix* |
1352.4 |
31.5 | 1581.7 | 27.9 |
*Free of visible graphite (50mW on sample, 10 minutes recording time)
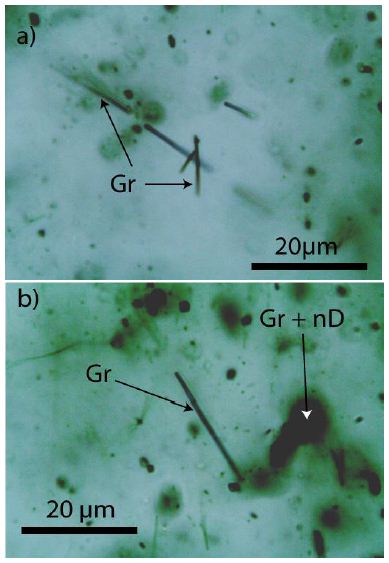
Figure 6: Graphite needles or whiskers beside graphite-bearing nanodiamond cluster. Gr: Graphite, nD: Nanodiamond. Note the needles are real needles and not sections of flat graphite crystals.
Discussion
In the last couple of years, the author, with his colleagues, found in different Variscan granites, pegmatites, and related mineralizations from more crustal position minerals like diamond, graphite, moissanite, reidite, coesite, stishovite, and others, representing mantle origin. By the dominance of spherical forms and their extraneous position in the host minerals, fast transport via supercritical fluids is almost imperative. Proofs are in Thomas et al. (2023a) [7] and Thomas (2023a and 2023b) [8,9]. The small vertical pegmatite vein in gneiss (sample T6) with graphite and nanodiamond further hints that supercritical fluids play a more significant role than assumed. The search for moissanite (isometric crystals or whiskers) in the quartz of the given sample was unsuccessful. Therefore, we can conclude that the formation of moissanite whiskers and isometric crystals in the beryl-dominant veins of the Sauberg mine near Ehrenfriedersdorf beryllium and water are essential catalysts for the formation of moissanite [10]. The diamond (nanodiamond) and graphite spectra look like the shock-synthesized diamond by Chen et al. (2004), representing strongly nonequilibrium processes during the change of the supercritical state into a critical/undercritical one. Most diamonds/nanodiamonds show a covering by graphite. All spectra differ from static pressure diamonds [11]. The relatively extended stay at high temperatures makes the primary diamond unstable and transforms it into nanodiamond or onion-like carbon (OLC) – see Zou et al. 2010 [12]. The fine-disperse distribution of nanographite and nanodiamond in the quartz and orthoclase matrix is conspicuous. Maybe these prevent the intense formation of fluid inclusions in quartz and orthoclase during the cooling.
Acknowledgment
Günter Hösel (Freiberg) is thanked for providing the drilling sample material from the Annaberg
References
- Hösel G, Kühne R, Zernke B (1992) Zur Zonalität der Zinnmineralisation im Raum Annaberg/Erzgebirge. Geoprofil 4: 49-57.
- Thomas R (1988) Ergebnisse der thermobarometrischen Untersuchungen an Granitproben aus dem Gebiet Annaberg. Unpublished Report, Freiberg.
- Thomas R, Davidson P, Rericha A, Recknagel U (2022a) Discovery of stishovite in the prismatine-bearing granulite from Waldheim, Germany: A possible role of supercritical fluids of ultrahigh-pressure origin. Geosciences 12: 1-13.
- Thomas R, Davidson P, Rericha A, Voznyak DK (2022b) Water-rich melt inclusions as “frozen” samples of the supercritical state in granites and pegmatites reveal extreme element enrichment resulting under nonequilibrium conditions. Min J (Ukraine) 4 4: 3-15.
- Lafuente B, Downs RT, Yang H, Stone N (2016) The power of database. The RRUFF project. In: Armbruster T, Danisi RM (Eds.), Highlights in Mineralogical Crystallography. De Gruyter, Berlin, München, Boston, USA, Pg: 1-30.
- Zaitsev AM (2001) Optical Properties of Diamond. A data Handbook. Springer-Verlag Berlin Heidelberg GmbH 502.
- Thomas R (2023a) Ultrahigh-pressure and-temperature mineral inclusions in more crustal mineralizations: The role of supercritical fluids. Geol Earth Mar Sci 5: 1-2.
- Thomas R, Davidson P, Rericha A, Recknagel U (2023a) Ultrahigh-pressure mineral inclusions in a crustal granite: Evidence for a novel transcrustal transport mechanism. Geosiences 13: 1-13.
- Thomas R, Recknagel U, Rericha A (2023b) A moissanite-diamond-graphite paragenesis in a small beryl-quartz vein related to the Variscan tin-mineralization of the Ehrenfriedersdorf deposit, Germany. Aspects Min Miner Sci 11: 1310-1319.
- Thomas R (2023b) The Königshainer granite: Diamond inclusion in zircon. Geol Earth Mar Sci 5: 1-4.
- Chen P, Huang F, Yun S (2004) Structural analysis of dynamically synthesized diamonds. Materials Research Bull 39: 1589-1597.
- Zou Q, Wang MZ, Li YG, Lv B, Zhao YC (2010) HRTEM and Raman characterization of the onion-like carbon synthesised by annealing detonation nanodiamond at lower temperature and vacuum. J Experim Nanosci 5: 473-487.