Abstract
AI (artificial intelligence) was used in the Mind Genomics platform (BimiLeap) to generate sets of messages about orange juice, not from concentrate. These messages, called ‘elements’ were edited slightly, and combined into vignettes comprising 2-4 elements, the combinations dictated by an underlying experimental design. Each of 100 respondents evaluated totally unique sets of 24 vignettes, with the vignettes created to allow statistical analysis by OLS regression and then clustering. Respondents rated each vignette on a two-dimensional scale; desire to drink, and believe the information, respectively. The key equation was the relation between the presence/absence of the 16 elements and the desire to drink. Two clear mind-sets emerged, MS 1=Stress better ingredients: MS2=Stress better functionality. AI was then used to summarize the results emerging from the two mind-sets, providing the summary based on themes, points of view, and opportunities for new products and services. The paper demonstrates synergies, viz., speed, simplicity, learning, and commercial opportunities currently available when one merges an information generating tool (AI) with rapid, hard-to-game evaluations by ‘real people.’
Introduction
The topic of NFC, not from concentrate, is an interesting issue in the change of the desirability of a product description over time. Where NFC was once the hallmark of quality for orange juice, the change in the world of citrus, especially in Florida, has eroded the value of NFC. Typical studies on these types of topics focus on limited aspects, such as the change in the dollar value of the slogan (viz., what are people willing to pay), or perhaps a historical retrospective of the business literature dealing with aspects of NFC.
The study reported here moves beyond a focused investigation of the topic into what might be more appropriately called an AI-enhanced exploration of the topic, coupled with the response of people. The approach used here, Mind Genomics, allows the researcher to explore how a person responds to various aspects of a topic, doing so in a way which moves towards the world of induction and so-called grounded-theory al. research [1]. Rather than developing a hypothesis emerging from a thorough understanding of the past, through published literature the emerging science of Mind Genomics encourages the exploration of a topic in a structured, templated fashion. The exploration is fast, inexpensive, disciplined, and almost always generates powerful new insights as it encourages research to explore and discover, rather than to confirm or falsify a hypothesis.
The origin of this specific study can be traced to the International Citrus & Beverage Conference, held in September 2023, in Clearwater, Florida. The conference brings together the various individuals involved in the world of citrus and allied products and services. The specific origin of the study was the conference presentation given by author Moskowitz to demonstrate the Mind Genomics method as a new technology. Discussions with authors Plotto and Sims about the best way to talk about Mind Genomics devolved into the notion that one could best explain the method by a live demonstration, from start to (almost) finish, in the allotted time of 50 minutes. Author Sims suggested the topic of ‘NFC’, and acted as the technical expert, to introduce the problem. Author Schneider, in turn, ran the computer, typed in the ideas or selected them when the ideas were presented as a group, from which one was to select messages (elements, ideas) to be tested. The output of the demonstration comprised both a book of information about NFC from different points of view (Idea book, produced by the embedded AI, called Idea Coach), as well as the results from the Mind Genomics ‘experiment’, after the 100 respondents participated.
Background to NFC
In the mid 1940s, in order to get a natural source of vitamin C to those in war-torn Europe, frozen concentrated orange juice was developed and became a leading seller once it hit the retail market. Evolving processing and storage techniques later allowed for the use of orange juice concentrate to develop refrigerated ‘Ready to Serve’ orange juice, creating a new segment in the market. Soon, this reconstituted ready to serve orange juice became the preferred choice of consumers over the frozen concentrate [2].
The reconstituted refrigerated 100% orange juice led the market until the introduction of not from concentrate, or NFC, orange juice to the market in the 1980s. Not from concentrate 100% orange juice is essentially made by extracting the juice, pasteurizing, and packaging. Though this juice was more costly to produce, store, and distribute, it was marketed as a ‘premium’ experience with superior flavor as it is not subject to the heat of evaporation.
NFC orange juice grew in popularity as consumers shifted from juice from concentrate to NFC, looking for more natural and healthier products [3]. Today, over 90% of Florida’s oranges are processed for NFC juice. However, due to challenges such as the state-wide devastation of citrus greening disease, juice production is declining [4]. Citrus greening has led to a decrease in Florida’s juice quality as infected oranges are described as bitter and sour and are lacking in sugar and orange flavor [5]. The lower sugar content and off attributes associated with infected oranges is making it more challenging for Florida orange juice producers to make 100% NFC orange juice with only Florida oranges. For example, companies such as Florida’s Natural, are now adding Mexican Valencia orange juice concentrate to their NFC juice to increase the sugar content of the juice and meet consumer demand. No studies have been done to assess what consumers think about not from concentrate orange juice versus from concentrate orange juice.
Background to Mind Genomics
Mind Genomics emerged from the confluence of three disciplines, psychophysics, statistics, and consumer research, respectively.
Psychophysics – provided Mind Genomics with the goal of measuring the strength of ideas. The origins of psychophysics lie in the pioneering work of scientists such as G.T. Fechner and S.S. Stevens, both focused on measuring the strength of sensations [6,7]. Their pioneering work, often called ‘Outer Psychophysics’ by Harvard’s S.S. Stevens, focused on the relation between the physical measurement of stimulus magnitude and the perceived magnitude. Stevens’ ‘Inner Psychophysics’ was to measure the strength of the percept. Mind Genomics used Stevens’ notion of the magnitude of an idea as the basis for the effort to measure the strength of our perception.
Statistics – provided Mind Genomics with a way to organize the ‘test stimuli’ into combinations, so that these combinations or vignettes could somewhat approximate the nature of information coming to respondents in the form of text information from which ideas would be generated in the mind of the person. The specific approach contributed by statistics is known as ‘experimental design.’ The contribution comprises the precise combinations needed to test, so that one can deconstruct the response to the combination (called vignettes henceforth in this paper) to the presence/absence of specific phrases. In this way it would be possible to create known combinations of test stimuli, present them to people, get the reactions, and finally use statistics to estimate the contribution of each component in the vignette to the response.
Consumer research – provided Mind Genomics with the recognition of the importance of the everyday. Rather than putting the respondent into an unusual situation, and then doing the experiment with the respondent now considered a ‘test subject’, consumer research focused on the quotidian, the ordinary. The goal was no longer to prove or disprove a hypothesis by experimentation, but rather to focus on the normal world, albeit from the eyes of someone who wants to know that world, in a quantitative fashion. Could numbers be put on the features of the ordinary world, to express the magnitude of different features of this world as they are perceived by people.
During the past three decades, the ‘emerging’ science of Mind Genomics has evolved to the point where it has become a DIY, do-it-yourself, research system, almost fully templated. The approach has evolved from the user creating one set of test vignettes (combinations of elements, viz., messages) to small, automatically created sets of vignettes, different for each respondent (study participant). In the most current version of Mind Genomics, each respondent evaluates sets of 24 vignettes, each vignette comprising a minimum of two and a maximum of four elements (messages). The underlying experimental design works with four topics, viz., questions, and with each topic generating four different elements, viz., answers. The experimental design puts together the answers into small, easy to read vignettes, the aforementioned combinations. The respondent reads each of 24 vignettes, and for each vignette assigns a response from a rating scale.
The objective of the Mind Genomics study is to make the effort easier, so that anyone can become a researcher. Indeed, elementary school students ages eight and above have found this templated approach to be fun, investigating topics such as the nature of third grade mathematics in ten years [8].
The Mind Genomics study continues to be enhanced. Current efforts, presented in this paper, include the use of AI (artificial intelligence) to help the researcher come up with the elements by suggesting questions and then answers to those questions, once the researcher describes the issue in the ‘Idea Coach’. Thus, it becomes far easier to investigate new topics, even with virtually no knowledge, because the embedded AI provides a true coach. Additional enhancements using AI include the summarization of results by AI using a number of queries to bring together the strong performing results in a user-friendly way.
Running a Mind Genomics Study on the Topic of NFC, not from Concentrate
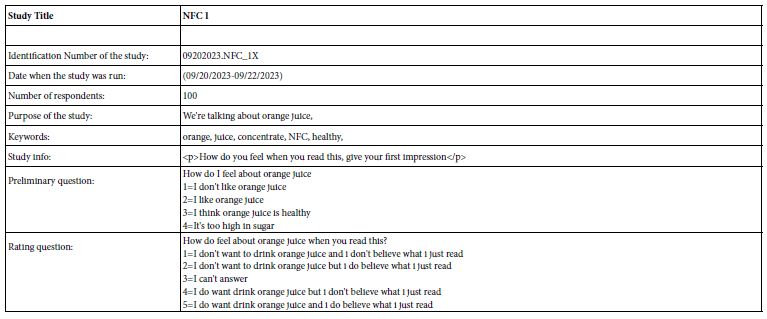
The Mind Genomics study begins at the website (www.BimiLeap.com). After the researcher has created an account, the researcher begins a study by naming the study, selecting the language (currently only a few languages are implemented beyond English), and then agreeing to respondent privacy.
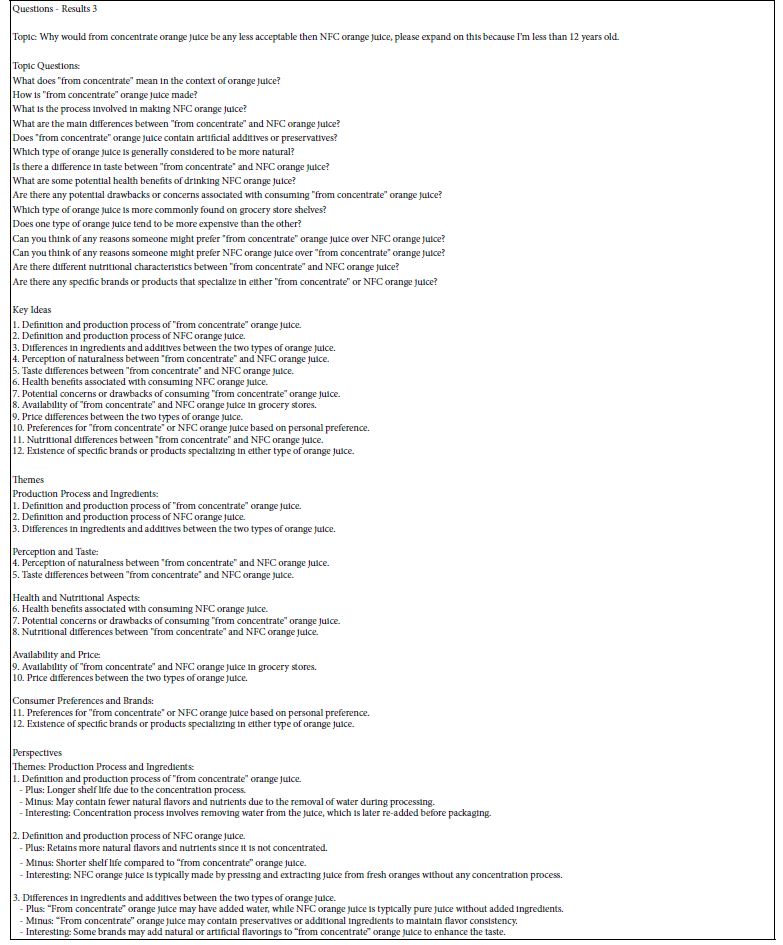
The next step requires the researcher to develop four questions, and for each question develop four answers. Figure 1 Panel A shows the request for the four questions. Figure 1 Panel B shows the request for four answers to one question, the question having been developed already by the researcher. Both Panel A and Panel B are shown ‘filled in’. For the researcher beginning the study, these screens are empty, requesting the researcher to fill them in, the researcher first creating the four questions and then afterwards filling four Panel B’s, one for each question.
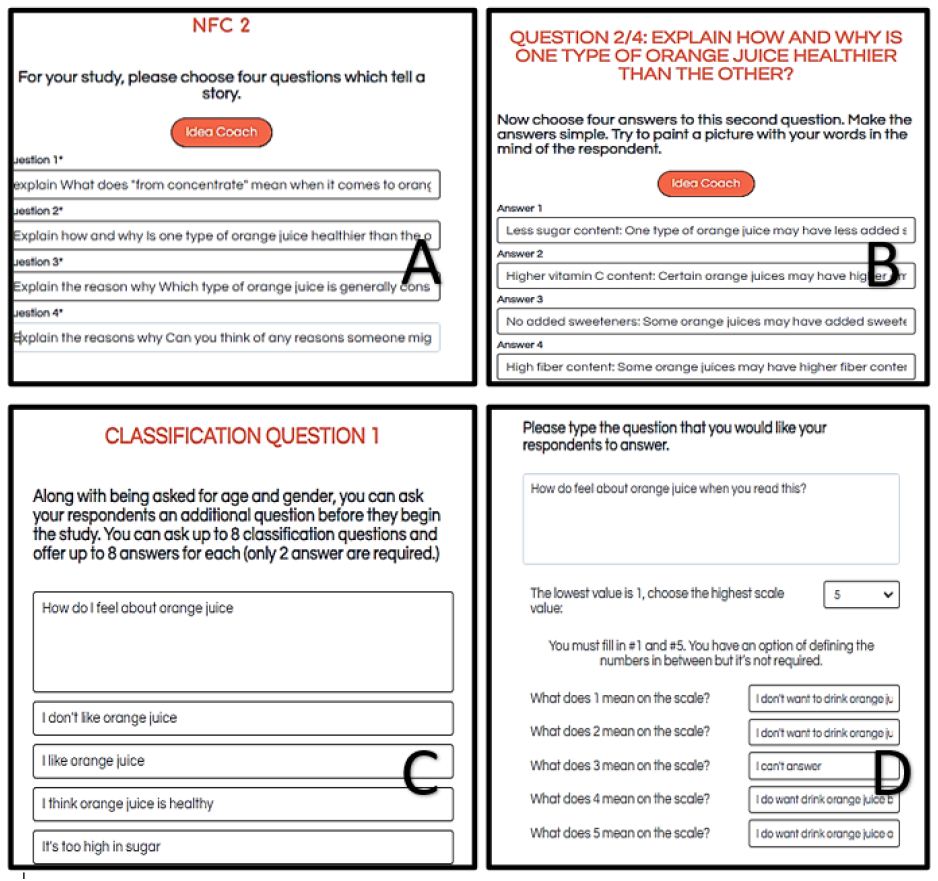
Figure 1: Panels showing the input of the researcher. Panel A shows the request for four questions. Panel B shows the request for four answers to one of the four questions. Panel C shows the instructions to create a self-profiling classification question. Panel D shows the anchored five-point rating scale.
It is at this point that many researchers feel nervous. Idea Coach, embodying AI, was developed to decrease the nervous response, and push the study towards creation and then completion. Table 1 shows the first iteration of the Idea Coach, to provide questions. The researcher need only press the red oval in the formatted BimiLeap program to be taken to a screen which instructs the researcher to describe the topic in a box provided. The researcher then presses the request and receives a set of 15 questions. The researcher can select one or more questions, paste those questions into the appropriate screen (Figure 1 Panel A), edit the question if desired, add one’s own question, or run the request again for a mostly new set of questions. This process of requesting questions, selecting, and pasting, can go on for a while, but usually by four or five requests, and by thus 60-75 mostly different questions, the researcher will have selected the best questions and edited them. The same process happens for the request for four answers for each question.
While the researcher is using Idea Coach, both for questions and for answers, in the background the program is storing the guiding ‘squib’ for the development of questions, and the guiding question for the development of answers. When the researcher asks Idea Coach four times for questions, and three times for answers to each of four questions, the Idea Coach will produce 3 + 3 + 3 + 3 + 3 ‘pages’ of questions or answers. These are recorded for the researcher, along with a detailed analysis of the patterns uncovered on the particular page whether question or answer. The material is returned to the researcher in the form of an Excel book, the Idea Book, each page or tab corresponding to one of the different requests. Table 1 shows an example of what is returned after the first request to Idea Coach for questions.
Table 1: Results from the Idea Book, showing the 15 questions and AI summarization of those questions. Table 1 shows the results from the third time the Idea Coach was requested to provide 15 questions to address the topic.
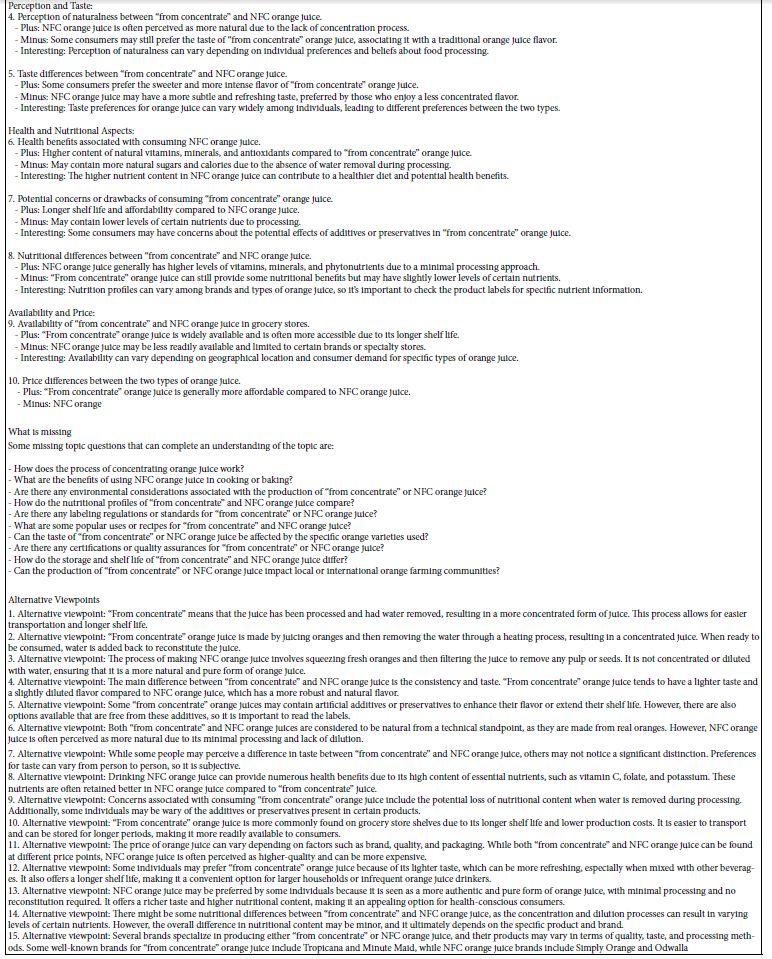

The depth of information in Table 1 deserves a comment. One of the benefits of current AI is that the AI technology can be queried, as it was to develop the 15 questions, using the short paragraph, here really a sentence: Topic: Why would from concentrate orange juice be any less acceptable then NFC orange juice, please expand on this because I’m less than 12 years old. This single statement became a query, which generated the 15 Topic Questions listed. The AI then stored these 15 questions, while the Mind Genomics program, BimiLeap, continued to interact with the researcher, in order to select the four questions. After the four questions and four answers to each question were selected, BimiLeap used AI to ‘interrogate’ each set of 15 questions (and later each set of 15 answers). The results of the interrogation, viz., the summarization by AI, appears in Table 1, which shows the results from the third iteration, viz., the third time the researcher asked for the 15 questions to address the topic.
Once the researcher has selected the elements (the four sets of four answers), the next step is to add self-profiling classification questions. The now-standard version of BimiLeap automatically asks the respondent for gender and age, allowing the researcher to generate an additional eight questions, each with up to eight possible answers. Figure 1 Panel C shows the self-profiling classification question asked in this study. With up to eight classification questions, it is possible to use the first portion of the study, self-profiling, as a complete study in itself.
When the researcher has completed the setup of questions and answers (topics and elements), and then completed the self-profiling classification, it is time to create the rating scale. The rating scale for this study is unique in that it contains two parts, wanting to drink orange juice versus not wanting to drink orange juice, as well as believing versus not believing the material. Figure 1 Panel D shows the rating scale and the five answers.
How do feel about orange juice when you read this?
1=I don’t want to drink orange juice and i don’t believe what i just read
2=I don’t want to drink orange juice but i do believe what i just read
3=I can’t answer
4=I do want drink orange juice but i don’t believe what I just read
5=I do want drink orange juice and i do believe what I just read
The final action is to specify the source of the respondents (Figure 2), and then run the study.
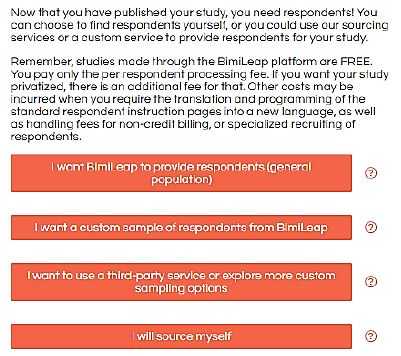
Figure 2: Sourcing the respondents for the Mind Genomics study
Running the Study on the Internet
The Mind Genomics ‘experiment’ begins with the acceptance by the respondent to participate in what ends up being about a 5 to 7-minute study, run on the Internet. During the past two and a half decades, since the Internet evolved into a popular vehicle for communication, many consumer research studies have ‘migrated’ to the Internet. In the early 2000s, two decades ago, the respondents were fairly eager to participate and would participate in studies lasting up to 15 minutes, doing so with little albeit some incentive. Today, with the request for a ‘survey’ of satisfaction and experience by almost everyone providing a service, the norm is to work with panelists who have a relation with the panel provider. Thus, 100 respondents in this study were provided by Luc.id Inc., a sample aggregator, which for a fee provides respondents for these studies. Luc.id Inc. provided the 100 respondents, with the studying finishing in approximately two hours from the start of field.
Table 2 shows some of the specifics of the study, including name, the different questions, the answers, etc. In addition to the profiling questions shown in Table 2, the Mind Genomics program, BimiLeap, acquires the respondent’s gender and age.
Table 2: The specifics of the study for NFC
The respondents received an email invitation. Those who were interested clicked on the embedded link and went into the study. Figure 3 Panel A shows the first ‘pull down’ screen, allowing the respondent to provide age, birth year, gender, and the answers to the oneself profiling question ‘How do I feel about orange juice.’ The design of the screen is uncluttered, allowing the respondent to answer eight different self-profiling or preliminary questions, one at a time, without feeling overwhelmed. Each question can be opened, and when opened up the other questions close.
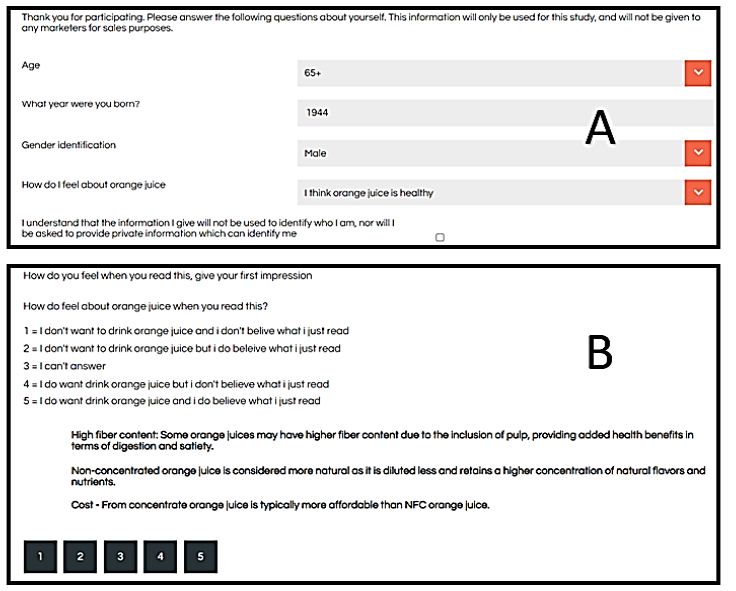
Figure 3: The respondent experience. Panel A shows the pull-down menu for the preliminary, self-profiling questions. Panel B shows one example of a vignette, with the rating scale on the top, the vignette in the middle, and the rating buttons on the bottom.
Figure 3 Panel B shows the actual test vignette, combinations of phrases (answers) for the respondent to read and rate, as well as the scale to use. Each respondent evaluates 24 different combinations, the combinations comprising a minimum of two and a maximum of four elements. Though the combinations may look haphazard and totally random, they are put together in a way which forces each of the 16 elements (four answers to the four questions) to appear equally often, and to appear statistically independent of each other. The underlying experimental design is permuted, so that the combinations change, but the mathematical structure of the combinations is maintained [9]. The happy outcome is that the researcher can use OLS (ordinary least squares) on the data from one respondent, or any subset of respondents. Finally, the permutation method ends up producing mostly different combinations of elements, viz., different vignettes. That is, the experimental design ensures that the researcher covers a substantial proportion of the possible vignettes. The permutation scheme, analogous to the MRI (magnetic resonance imaging), ends up allowing anyone to explore a topic rather quickly, even when nothing is known. Furthermore, there is no need to ‘know’ the best region to test, thus encouraging actual experimentation rather than the all-too-frequent overthinking of what to test.
One thing to notice in Figure 3 Panel B is the ‘spare look’ of the vignette. This look is deliberate. It allows the respondent to look at the different pieces of information in a way which is not tiring. In some sense the respondent is enabled to ‘graze’ through the information. Experience of over 25 years with this format suggests fewer negative reactions from ordinary people, although professionals who want an elegant stimulus and want to ‘know’ the right answer often express significant irritation that the combinations don’t make sense, are not connected with appropriate grammar, and defy logic. Surprisingly, non-professionals rarely complain, perhaps because with 24 vignettes these ordinary, non-professional people simply give their first guess for each vignette and move on, rather than judging the task. Simply said, the non-professional does the study in the way it was designed to be done, namely read and rate, and then move on.
Transforming the Data and Creating Models
Researchers are accustomed to using scales of all types. The most conventional type of scale is the category or Likert scale, which presents the respondents with a single dependent variable, and scale points from low to high. For this study the focus was on the selection of each of two aspects; drink versus not drink, and believe versus not believe. The objective could not be satisfied with the conventional Likert scale. Thus, a nominal scale was developed, with the five rating points shown in Table 2.
The objective of the study was to link the elements to the responses. Drinking and believing do not fall on the same scale, requiring a transformation. The transformation is:
Drink YES (R54) – Ratings of 5 and 4 are transformed to 100, ratings 1,2, and 3 are transformed to 0.
Drink NO (R12) – Ratings of 1 and 2 are transformed to 100, ratings 3, 4, and 5 are transformed to 0.
Believe YES (R52) – Ratings of 5 and 2 are transformed to 100, ratings 1,3, and 4 are transformed to 0.
Believe NO (R41) – Ratings of 4 and 1 are transformed to 100, ratings 2, 3 and 5 are transformed to 0.
Cannot Decide ® (R3) – Rating of 3 is transformed to 100, ratings 1,2,4 and 5 are transformed to 0.
To each of the five newly created binary variables is added a vanishingly small random number (<10-3) as a prophylactic measure. The binary variables will become dependent variables in an OLS (ordinary least square equation), expressed as:
Binary Dependent Variable (e.g., R54)=k1(A1) + k2(A2) … k16(D4)
In order for the OLS regression not to ‘crash’, the binary dependent variable must possess some minimal variability. Adding that vanishingly small random number to the newly created variable for each record ensures the necessary minimal variation.
The regression equation does not have an additive constant, which in statistical terms means that the regression is ‘forced through the origin.’ Two decades of working with regression modeling in Mind Genomics showed that the pattern of coefficients is the same whether the regression equation allows for an additive constant or is forced through the origin. It is simpler to compare regression coefficients when they do not come along with an additive constant. A 10 has twice as much of an effect as a 5, and half as much an effect as a 20. When there is a constant, one must interpret the meaning both of the additive constant (the baseline), and the coefficients (separate from the baseline). As just noted, estimating the coefficient without an additive constant allows an immediate comparison of coefficients within an equation and across an equation.
The Researcher Experience
During the course of developing the Mind Genomics science, it quickly became apparent that researchers were unable to contain their excitement when they were shown the analyzed data as it came in. The actual data appears in Figure 4 Panel A, which shows the content of one of the vignettes at the left, then the five-point rating scale in the middle, and finally the response time to the vignette on the far right, in thousandths of a second. The Mind Genomics platform presents the test stimuli, and records both what is the test stimulus, as well as the rating assigned and the response time.
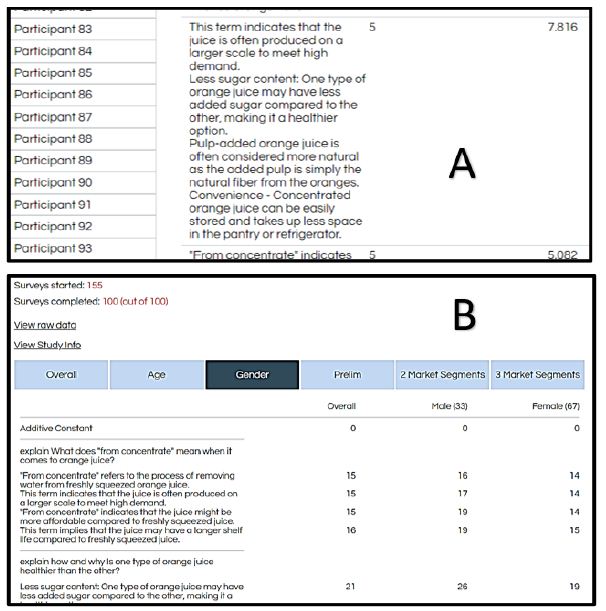
Figure 4: Panel A shows the content of a vignette, the five-point rating assigned to the vignette, and the response time in seconds between the presentation of the vignette to the respondent (Panel 3B), and the time taken to respond. Panel B shows the real-time presentation of results from the study. This particular screen shot was taken when the study was complete.
Analyzing the relative immense amount of data can be taxing. To make the research more fun, and thus hopefully to spread the approach, an instantaneous analysis was developed, showing the summary models for Total Panel, Age, Gender (required self-profiling questions), as well as results from developing two and three mind-set ‘solutions’, viz. two sets of respondents, and then three sets of respondents, the mind-sets, defined as groups showing similar patterns of coefficients within a mind-set and different patterns of coefficients across mind-sets. The clustering method will be described below in slightly more detail.
One should never underestimate the power of excitement generated when the researcher sees the analyzed results emerging in real time. Rather than forcing the researcher to collect the data manually, and then analyze the data by a series of laborious manual transformations and statistical analyses, the Mind Genomics platform provides all the analysis and the report in real time, as shown by Figure 4 Panel B. The researcher need only move the cursor to the different tabs indicated (e.g., Overall, Age, Gender). By selecting a tab, the display opens up and the researcher sees the elements on the left, and the coefficients on the various columns.
The ‘Mind’ of the Total Panel as Revealed by the Coefficients
The essence of the Mind Genomics ‘project’ is to learn about the topic from the pattern of the responses. In this study, 100 respondents ended up seeing 2400 vignettes, the aforementioned combinations of elements put together by experimental design. It is straightforward to use OLS (ordinary least-squares) regression to estimate the ‘driving power’ of each element. Table 3 shows the estimated value of the coefficients when we work with six dependent variables, and 16 independent or predictor variables. The analysis ‘knows nothing’ about the meaning of the elements, but rather knows only that the element is present in or absent from each vignette.
Table 3: Coefficients for the 16 elements emerging from OLS regression. The dependent variables are Response Time and the six transformed binary variables, respectively. Very strong performing coefficients (21 or higher) are shown by shaded cells. Only positive coefficients are shown.
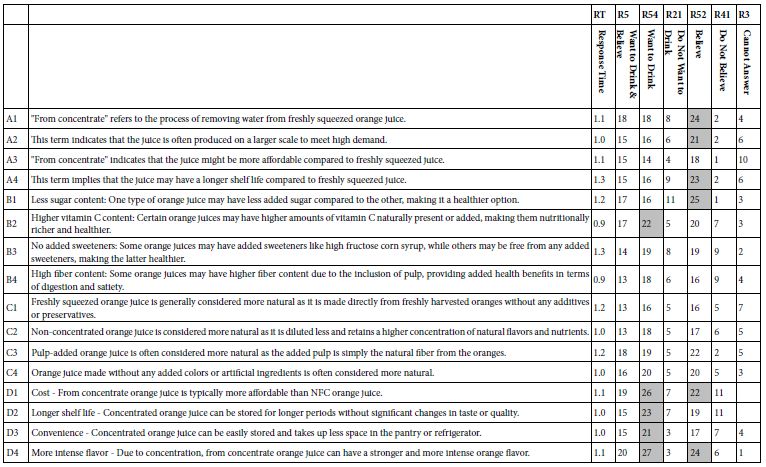
Response Time
This is the only variable that is not re-coded, but rather used in the way that it was recorded. Virtually all elements required about the same time to read, or better to skim, with the response time ranging from about 0.9 seconds to about 1.1 seconds per element. Only two elements drive longer response time:
A4 This term implies that the juice may have a longer shelf life compared to freshly squeezed juice.
B3 No added sweeteners: Some orange juices may have added sweeteners like high fructose corn syrup, while others may be free from any added sweeteners, making the latter healthier.
R54 – Want to Drink
This ends up being the most important dependent variable. R54 takes on the value 100 when either of the two rating points are selected, rating 5 or rating 4. A recently developed convention to report important data focuses on the top scoring elements, usually with coefficients of 21 or higher. For these results, the group of elements dealing with the ingredients (B1-B4) performs the highest. The consistency of the data is remarkable. There is no possible way for a person to ‘game’ the system because the combinations are hard to deconstruct and vary by respondent. Yet the data clearly points to one group of elements driving ‘Want to Drink”, elements in group D, the clearly defined benefits:
D4 More intense flavor – Due to concentration, from concentrate orange juice can have a stronger and more intense orange flavor.
D1 Cost – From concentrate orange juice is typically more affordable than NFC orange juice.
D2 Longer shelf life – Concentrated orange juice can be stored for longer periods without significant changes in taste or quality.
B2 Higher vitamin C content: Certain orange juices may have higher amounts of vitamin C naturally present or added, making them nutritionally richer and healthier.
D3 Convenience – Concentrated orange juice can be easily stored and takes up less space in the pantry or refrigerator.
R12 – Don’t Want to Drink
The coefficients here are far lower, the highest being 9, and then the 8s.
B1 Less sugar content: One type of orange juice may have less added sugar compared to the other, making it a healthier option.
A4 This term implies that the juice may have a longer shelf life compared to freshly squeezed juice.
B3 No added sweeteners: Some orange juices may have added sweeteners like high fructose corn syrup, while others may be free from any added sweeteners, making the latter healthier.
A1 “From concentrate” refers to the process of removing water from freshly squeezed orange juice.
R52 – Believe What I Just Read
B1 Less sugar content: One type of orange juice may have less added sugar compared to the other, making it a healthier option.
D4 More intense flavor – Due to concentration, from concentrate orange juice can have a stronger and more intense orange flavor.
A1 “From concentrate” refers to the process of removing water from freshly squeezed orange juice.
A4 This term implies that the juice may have a longer shelf life compared to freshly squeezed juice.
C3 Pulp-added orange juice is often considered more natural as the added pulp is simply the natural fiber from the oranges.
D1 Cost – From concentrate orange juice is typically more affordable than NFC orange juice.
A2 This term indicates that the juice is often produced on a larger scale to meet high demand.
R41 – Do not Believe What I Just Read
D1 Cost – From concentrate orange juice is typically more affordable than NFC orange juice.
D2 Longer shelf life – Concentrated orange juice can be stored for longer periods without significant changes in taste or quality.
B3 No added sweeteners: Some orange juices may have added sweeteners like high fructose corn syrup, while others may be free from any added sweeteners, making the latter healthier.
B4 High fiber content: Some orange juices may have higher fiber content due to the inclusion of pulp, providing added health benefits in terms of digestion and satiety.
R3 – Cannot Answer
A3 “From concentrate” indicates that the juice might be more affordable compared to freshly squeezed juice.
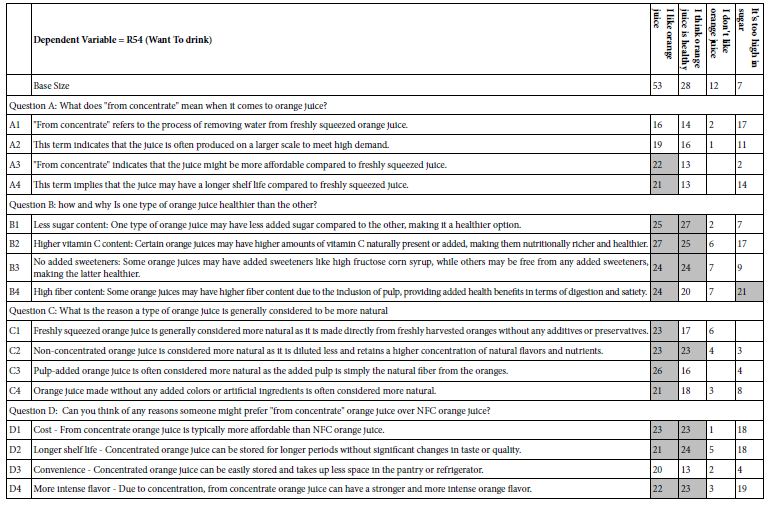
We can further understand the minds of different groups of respondents. Recall that at the start of the evaluations, the respondents completed a self-profiling questionnaire. Table 4 shows the coefficients for the four equations or models, one for each of the four groups. Once again, the table shows the strong performing elements in shaded cells, these elements generating coefficients of +21 or higher. Negative coefficients are not shown. It is clear that respondents who say that they are positive towards orange juice, either as a drink or because it is healthy, are the ones showing high coefficients for ‘want to drink.’ Not surprisingly, the fourth group, selecting ‘It’s too high in sugar’ show one very strong element, one focusing on health and fiber, B4: High fiber content: Some orange juices may have higher fiber content due to the inclusion of pulp, providing added health benefits in terms of digestion and satiety. Once again, the data suggests within this seemingly random combination of elements the respondents are easily able to pick out the elements which agree with how they describe themselves.
Table 4: The coefficients for the model for ‘want to drink’ emerging from the regression analysis for the data from the four self-described groups of attitudes to drinking orange juice. Only positive coefficients are shown.
Uncovering Mind-sets about Orange Juice
A hallmark aspect of Mind Genomics is the search for underlying mind-sets in the population. The results from the models for different groups of respondents suggest different points of view. Such differences in the way people evaluate the issues of their daily life are the grist for the mill of Mind Genomics. It is in the granular experience of the everyday that we find deep understanding of people, perhaps far deeper understanding than what might be obtained through the often-convoluted experiments which distort the ordinary, the quotidian. The benefit of the Mind Genomics study is that it can be done quickly, easily, and in so doing generate a profound understanding of the way people think.
The data presented here can be dissected to discover mind-sets, the approach done easily, and as we will see, the results providing concrete knowledge about people, and about their ordinary lives. The approach works with the individual set of 100 rows of data, each row corresponding to the 16 coefficients, that row obtained using OLS regression. Thus, the first step in discovering these mind-sets uses OLS regression at the individual level, generating the 100 sets of coefficients, the regression models. The regression is valid from the original set up according to a permuted experimental design. The individual models ‘work’ because there is no chance that the regression will crash after the vanishing small random number was added to each individual transformed value.
Once the 100 models have been created, one per respondent, the researcher then applied clustering, to divide the 100 models (really 100 people), first into two groups, and once again into three groups. These groups (clusters) are generated by k-means clustering [10]. The k-means clustering uses the statistical index (1-Pearson Correlation Coefficient), or (1-P). The Pearson Correlation Coefficient ranges from +1 for perfect linear co-variation to -1 for perfect inverse covariation. Consequently, the quantity (1-P) ranges from a low of 0 when two groups of numbers are perfectly related (e.g., two respondents show the precise same patterns of their 16 coefficient), and to a high of 2 when the two groups of numbers are perfectly opposite in their pattern.
The clustering program divides the 100 respondents twice once into two non-overlapping groups (two mind-sets) and then into three non-overlapping groups (three mind-sets). The entire operation is done mathematically. It is the job of the researcher to decide whether the two mind-sets are better, the three mind-sets are better, or perhaps even more mind-sets are necessary. Usually, two or three mind-sets suffice to create interpretable groups (viz., groups which tell different stories). Furthermore, parsimony is always to be preferred; fewer mind-sets are better than more mind-sets.
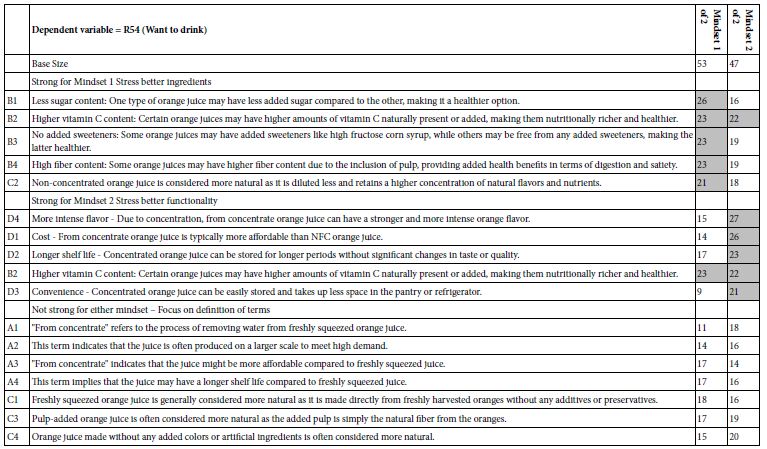
Table 5 shows the two mind-sets. The names for the mind-sets come from the commonalities of the strong performing elements. Once again, the strong performing elements are shown in shaded cells. A benefit of segmenting respondents into mind-sets is the emergence of strong performing elements. In our study the two mind-sets do not think oppositely but rather stress ingredients versus functionality, finding, however, both quite important.
Table 5: Performance of elements for two emergent mind-sets, based upon the coefficient for ‘Want to drink’ (R54)
How Good was Our Thinking? – The IDT (Index of Divergent Thought)
A continuing issue as well as opportunity in Mind Genomics deals with the simple question of ‘just how well did we do in the selection of these ideas?’. The ability to set up a study quickly, to get respondents quickly, and then to put together a report or a paper can become an incentive for people to engage in research. As the novelty and excitement wear off, and as the reality of what has been and can be accomplished sink in, the next issue is to create a measure of ‘performance.’
It is to address this opportunity to measure performance that the IDT was created. The IDT is based upon the notion that high scoring elements ‘hit the mark’ and represent good thinking. The IDT also recognizes that good thinking may be hidden because people with different mind-sets may end up cancelling each other out when they are put together into the same group. When these people with different mind-sets are separated into new, defined groups, the coefficients will become higher. We have seen the increase in coefficients in this study on ‘not from concentrate,’ although not to the degree observed in other studies, where the mind-sets think oppositely.
The calculation of the IDT, shown in Table 6, takes into account the magnitudes of the coefficients emerging when the analysis looks first at the total panel, then at two mind-sets, and then at three mind-sets. The analysis also considers the relative size of the mind-sets. The IDT, Index of Divergent Thought, is 75, the square root of the weighted sums of squares of positive coefficients.
Table 6: The computation of the IDT, Index of Divergent Thought, a measure of the ‘goodness of thinking’ for the study
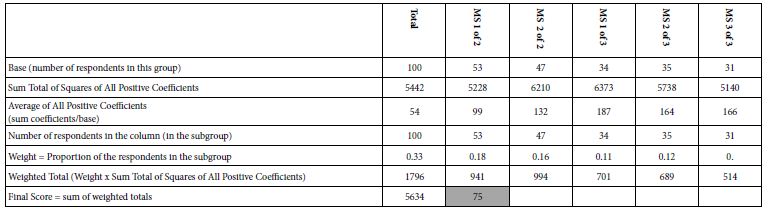
The IDT for this study is 75, on the higher side of studies that have been run previously, and whose IDT values have been computed. It is important to note that the IDT is computed after the study has completed, allowing the researcher to identify the two mind-sets, the three mind-sets, and the coefficients of the 16 elements for the five mind-sets and the total panel.
AI Interpretation of the Strong Performing Elements
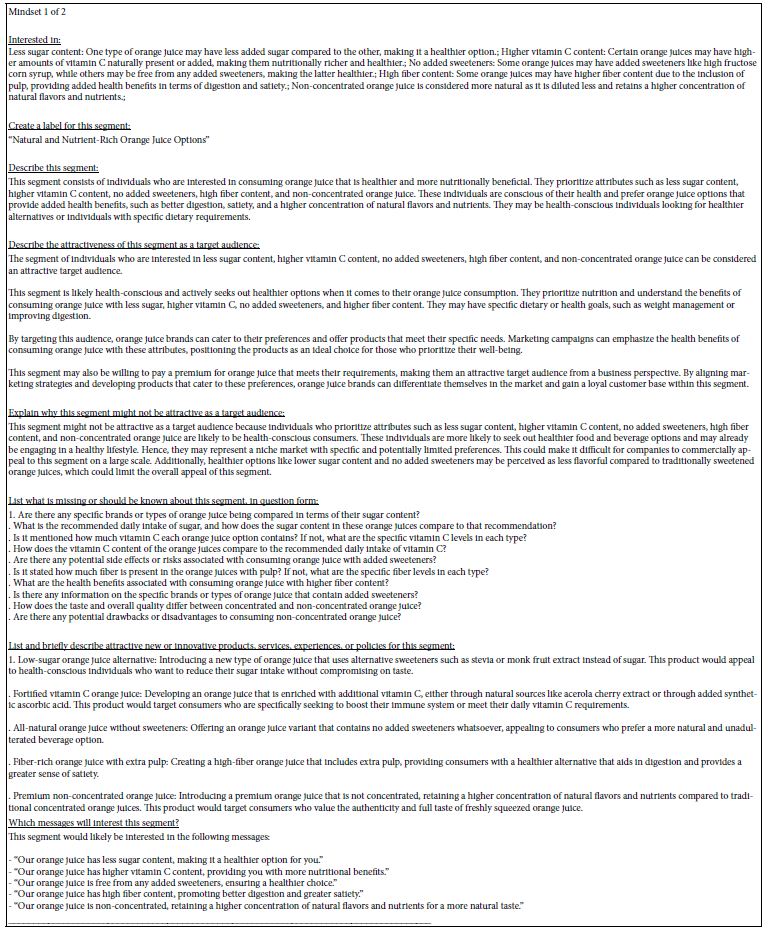
The final analysis of the results provided by the Mind Genomics platform comprises the AI interpretation of the strong performing elements for each mind-set, as shown in Table 7. We saw above that the Idea Coach, an AI tool, could be used to create questions, answers to those questions, and then provide a deeper synthesis of any set of questions by a variety of queries submitted to the same AI program which created the questions and answers in the first place. The second ‘invocation’ of AI occurs in the ‘summarizer.’ The AI is programmed to consider the patterns generated by all elements with coefficients of 21 or higher, for each key subgroup. Thus, the summarizer ends up working for each of the key subgroups such as age, gender, self-described attitude towards orange juice, and so forth. We present here the summarization for the strong performing elements for the two mind-sets. Each query is shown in bold, followed by the AI ‘interpretation’ of the strong performing elements.
Table 7: AI summarization of patterns for strong performing elements generated by the two mind-sets
Discussion and Conclusions
This project, just as other projects done in the spirit of the Mind Genomics science, represents an exploration of a topic, rather than an experiment to substantiate or to disprove a hypothesis, the so-called hypothetico-deductive methods [11]. The exploratory effort falls into the domain of what is known as ‘grounded theory’ (Gligor et al., 2016), where the hypotheses emerge from the observation.
The research results suggest that people do form opinions about what they read regarding NFC, and that the mind-sets which emerge are more of an emphasis on different aspects rather than opposite or at least orthogonal, independent viewpoints about the same topic. Of importance is that there are a few elements which can be really believed to be strongly positive for one group and strongly negative for the other group(s). Rather, it is just a matter of focus.
Of additional importance is the contribution of artificial intelligence, both to the creation of the questions and answers, as well as to the interpretation of patterns emerging after the empirical experiment is run with people. The ease with which AI can be invoked as a standard step at the start of the research effort and at the end of the research effort, to suggest and to interpret, makes AI an emerging tool which can, and undoubtedly will, drive forward knowledge developed at the various stages of research. Having an ‘Idea Book’ at the start of the study allows the researcher to ‘on-board’ others quickly and to share with them the raw material for the study, as was done here in the public forum where the study was begun. Having AI interpretation of the strong performing results at the end of the study, again done here, provides another set of ‘eyes’ to interpret the results.
In closing, it is important to remember that research stands at the threshold of a new era, where knowledge and point of view can be developed even before the study is run, as well as when interpreting the results which emerge, and finally when giving AI an opportunity to ‘weigh in’ on the results.
Acknowledgment
We would like to acknowledge the original impetus for this project provided by Dr. Anne Plotto, United States Department of Agriculture, Agricultural Research Service, Horticultural Laboratory, Fort Pierce, FL.
References
- Gligor DM, Esmark CL, Gölgeci I (2016) Building international business theory: A grounded theory approach. Journal of International Business Studies 47: 93-111.
- Morris RA (2010) The U.S. Orange and Grapefruit Juice Markets: History, Development, Growth and Change. EDIS document FE834, Institute of Food and Agricultural Sciences, University of Florida.
- Neves MF, Trombin VG, Marques VN, Martinez LF (2020) Global orange juice market: a 16-year summary and opportunities for creating value. Tropical Plant Pathology 45: 16674.
- Zansler M (2023) Florida Citrus Season Retrospective: 2022-2023 Season Final Outlook Update. Florid a Department of Citrus.
- Stevens SS (2017) Psychophysics: Introduction to its perceptual, neural and social prospects. Routledge.
- Dala-Paula BM, Plotto A, Bai J, Manthey JA, Baldwin EA, et al. (2019) Effect of Huanglongbing or Greening Disease on Orange Juice Quality, a Review. Frontiers in Plant Science 9: 415137.
- Fechner GT (1860) Elemente der Psychophysik (Vol. 2) Breitkopf und Härtel.
- Mendoza C, Mendoza C, Deitel Y, Rappaport SD, Moskowitz HR (2023) Empowering Young Researchers through Mind Genomics: What Will Third Grade Mathematics Look Like in 10 Years? Psychology Journal: Research Open 5: 3.
- Gofman A, Moskowitz H (2010) Isomorphic permuted experimental designs and their application in conjoint analysis. Journal of Sensory Studies 25: 127-145.
- Likas A, Vlassis N, Verbeek JJ (2003) The global k-means clustering algorithm. Pattern recognition 36: 451-461.
- Lawson AE (2000) The generality of hypothetico-deductive reasoning: Making scientific thinking explicit. The American Biology Teacher 62: 482-495.