Author Archives: author

Effects of Selected Primers and Vanishes on Open Dentine Tubules: An SEM Study

DOI: 10.31038/JDMR.2023612

Abstract

Dentine sensitivity (DS) is a common painful condition affecting teeth. The exact mechanism of transmission of an environmental stimulus across dentine is not fully understood; currently the most accepted theory is the hydrodynamic theory as proposed initially by Brannstrom. Treatment has been concentrated on either reducing the dentine fluid flow by occlusion of tubule openings, or altering the pulpal sensory nerve activity preventing transmission of pain to the central nervous system.

Aims and Methods: The aims of the present in vitro study were to examine the dentine tubule occluding and penetrating properties of selected in-office desensitizing agents (varnishes and primers) using scanning electron microscopy and a dentine disc model.

Results: Of the products examined, the fluoride varnishes, Bifluoride 12 and Duraphat, and Cervitec (a chlorhexidine containing varnish) were effective in both occluding and penetrating the dentine tubules. The results from All Bond 2, One Step and Scotchbond primers were superior to those of HEMA group primers, Gluma 3, Gluma CPS and Solobond Plus.

Conclusions: These findings suggest a mechanism for the action of these potential desensitising agents and suggest that the tubule penetrating properties may play a role in the longevity of their retention on the tooth. Investigation of surface coverage and tubule penetrating characteristics are both necessary in order to fully evaluate in vitro the desensitising potential of agents claimed to reduce Dentine Sensitivity.

Introduction

Dentine sensitivity (DS) can be defined as a pain arising from exposed dentine typically in response to chemical, thermal, tactile, or osmotic stimuli, which cannot be explained as arising from any other form of dental defect or pathology [1]. Currently, the most accepted theory of stimulus transmission across dentine is the hydrodynamic theory [2] proposed initially by Brannstrom [3]. According to this theory, minute fluid shifts across dentine in either direction in response to thermal, tactile, chemical or osmotic stimuli can stimulate mechanoreceptors in or near the pulp, which in turn excite the pulp sensory nerves to cause pain.

Pashley [4] reported that there are two approaches in the treatment of DS, 1) partial or complete occlusion of the dentine tubules and 2) alteration of pulpal sensory nerve activity (SNA) at or near the pulpo-dentinal surface. If the hydrodynamic theory of intradental nerve stimulation is accepted then the treatment of DS through tubule occlusion is a feasible and reasonable approach.

Clinically, DS has been treated by numerous agents, in-office and over the counter (OTC), which have claimed to effectively reduce pain arising from exposed dentine. Laboratory evaluation of these desensitizing agents using the dentine disc model has been reported in several studies [5,6], although, Mordan et al. [7] have modified this model to establish a more precise methodology control to evaluate potential desensitizing agents.

The aims of the present study were to investigate the degree of dentine surface coverage and the extent of tubule occlusion and penetration of selected in-office varnishes and primers. A dentine disc model and qualitative scanning electron microscopy (SEM) were used.

Methods and Materials

Surgically extracted, carious free, unerupted third molars were fixed in 3% glutaraldehyde in 0.1M sodium cacodylate buffer (CAB) solution (pH 7,4) at 4°C for up to one week. 1mm thick dentine discs were obtained from the region below the crown and above the pulp using a Testbourne diamond saw and stored in 0.1 M CAB at 4°C until required.

Before use, the dentine discs were ultrasonicated for 30 seconds in distilled water to dislodge cutting debris. The smear layer was then removed using either 6% citric acid for two minutes or the appropriate etchant provided by the manufacturer and applied according to their instructions. The discs were rinsed in distilled water and marked on either side for orientation (Figure 1) before being broken into halves using dental pliers to provide control and test sections [7].

FIG 1

Figure 1: Marking of dentine discs used in the study

The selected desensitising agents and their ingredients, according to the manufacturer’s information, are shown in Tables 1a and 1b. During the study all the products were coded and at least two discs were used for each agent. The selected desensitising agents were applied onto the test halves according to manufacturer’s instructions. The test and control halves were then allowed to dry in a desiccator for at least 24 hours.

Table 1a: Formulation and manufacturer information of test agents: Varnishes

Test agent

Manufacturer

Active ingredients

Bifluoride 12 Voco GMBH, 27457, Cuxhaven, Germany Fluoride varnish made of synthetic resin. Sodium and calcium fluoride
Cervitec Vivadent Ets. Shaan

Liechtenstein, Germany

1 g contains: 0.010 g chlorhexidine, 0.010 g thymol Polyvinyl Butyral (varnish) Ethanol, ethyl acetate
Duraphat Previously Rhone-Poulenc Rover GMBH, Nattermannallee 150829, Koln, Germany (Current Manufacturer Colgate Palmolive Company, USA) An alcoholic suspension of natural resins containing 5% NaF

Table 1b: Formulation and manufacturer information of test agents: Primers

Test agent

 Manufacturer

 Active ingredients

Hema-Seal G Germipherne Corporation

Ontario, Canada

HEMA, Glutaraldehyde, Sodium fluoride, Water
Gluma 3 Bayer Dental

Leverkusen, Germany

Aqueous solution of gluteral (Glutaraldehyde), HEMA
Gluma CPS Bayer Dental

Leverkusen, Germany

36,1% HEMA, 5,1% Glutaraldehyde, 58,8% Water
Solobond Plus

Universal Bonding Agent

Voco,

Cuxhaven, Germany

Methacrylate Acetone
All Bond 2

Universal Adhesive System

Dual cured

Bisco Inc.

Itasca, IL, 60143

Illinois, USA

N-phenylglycine-glycine methacrylate and bisphenyl dimethacrylate.
Scotchbond

Multi-purposed

Dental Adhesive System

3M Dental Products

Saint Paul, MN 55144

1000, USA

HEMA and BIS-GMA
One Step

Universal Dental Adhesive System

Bisco Inc.

Itasca, IL 60143

Illinois, USA

BPDM monomer dissolved in an acetone solution

A separate series of discs was prepared following the protocol described above, but both control and test halves were carefully fractured into quarters providing longitudinal surfaces for examination of the tubule lumen contents.

After drying in the desiccator, the discs were attached to SEM stubs and sputter coated using a Polaron E5000 sputter coater (Polaron U.K.) with a layer of gold/palladium. The specimens were viewed in a FEI/Philips XL30 FEG SEM (FEI, Eindhoven, Netherlands) at a working distance of 10 mm.

Micrographs were taken from selected fields in the central portion of each half disc on either side of the fractured edge and the test surfaces were only compared with the corresponding controls. Comparison of the test products’ ability to block and penetrate the dentinal tubules was also subjectively assessed using the micrographs.

Results

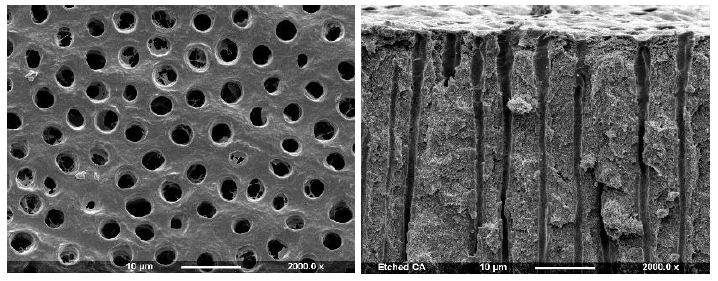
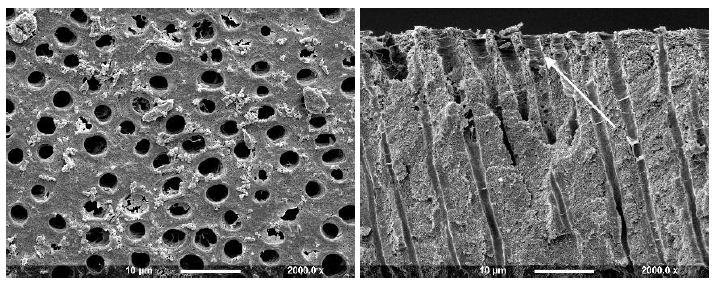
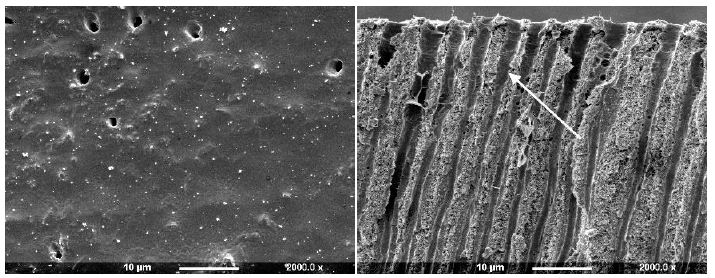
An example of a control disc with both surface and fractured profiles can be observed in Figure 2a showing open dentinal tubules in both views (surface and fractured).

FIG 2A

Figure 2a: Control Surface and Fracture

Varnishes

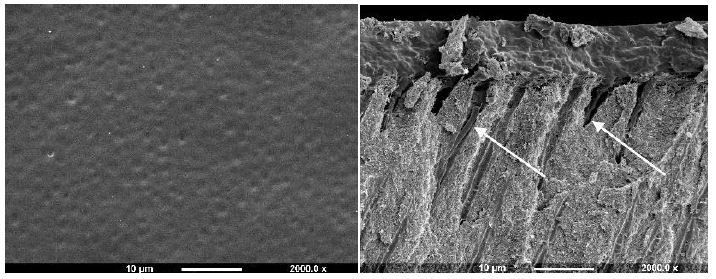
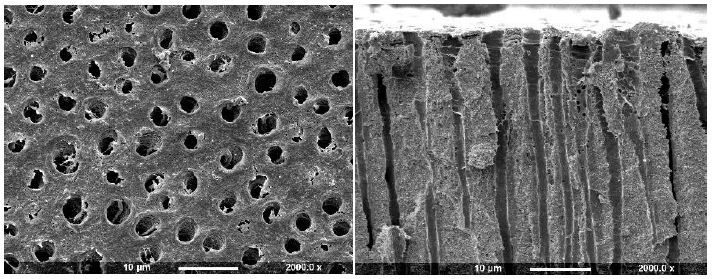
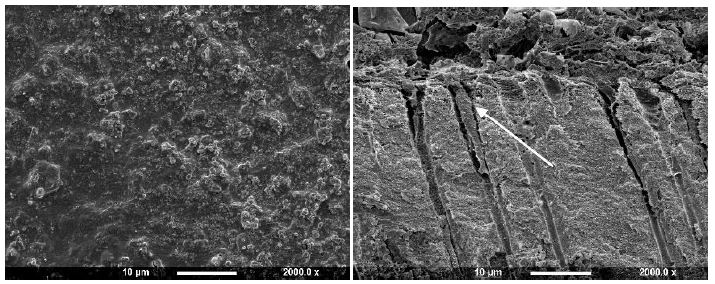
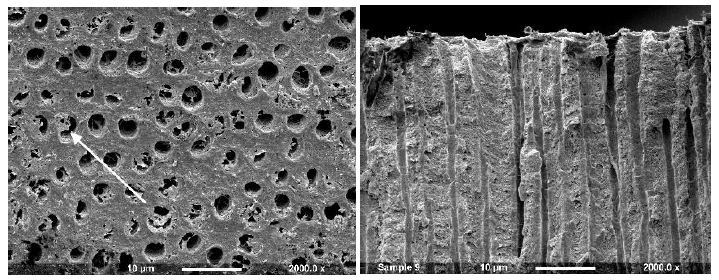
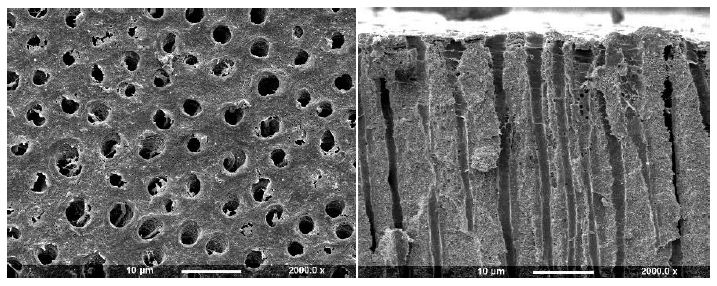
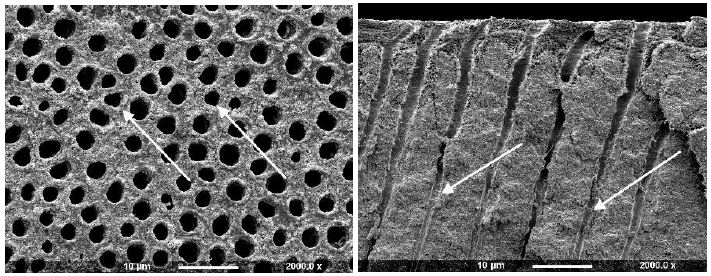
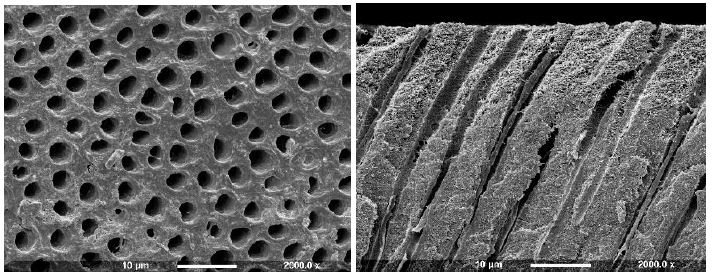
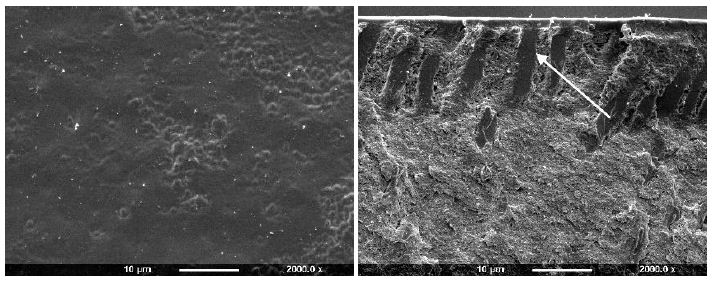
After application to the dentine disc, Cervitec (containing chlorhexidine) was observed to form a uniform layer that covered the whole dentine surface (Figure 2b). No tubule orifices, however were apparent. Fracturing the disc revealed the presence of a thick, textured layer, which covered the tubule orifices. There was some penetration of the product into the tubule lumen (arrows). Duraphat (containing fluoride) provided an uneven crystalline layer that covered the dentine surface and left tubule orifices visible (Figure 2c). Upon fracturing the dentine disc, a thin, amorphous surface layer was evident, although the varnish was usually present within the tubules, where penetration occurred it appeared to coat the lumen occupying the whole tubule diameter. When Bifluoride 12 (containing fluoride) was applied to the dentine disc, the surface was observed to be covered with small, irregular crystal-like structures and the tubule orifices were covered (Figure 2d). After fracturing the disc a thick, rough layer was observed which occluded the tubule orifices and occluded the tubules with plugs that occupied most of the tubule lumen (arrow).

FIG 2B

Figure 2b: Cervitec varnish Surface and Fracture views

FIG 2C

Figure 2c: Duraphat Varnish (Surface and Fractured views)

FIG 2D

Figure 2d: BiFluoride 12 Varnish (Surface and Fractured views)

Primers

The Gluma group of primers (Gluma 3 and Gluma CPS) as well as Hema-Seal G and Solobond Plus primer, whose principal active ingredients are glutaraldehyde and 2- hydroxyethylmethacrylate (HEMA), appeared to produce similar deposits on the dentine surface, partially occluding the tubule openings (Figures 3a-3f).

FIG 3A

Figure 3a: Hema-seal G Primer (Surface and Fractured views)

FIG 3B

Figure 3b: Gluma 3 Primer (Surface and Fractured views)

FIG 3C

Figure 3c: Gluma CPS Primer (Surface and Fractured views)

FIG 3D

Figure 3d: Solobond Plus (Surface and Fractured views)

FIG 3E

Figure 3e: All Bond 2 (Surface and Fractured views)

FIG 3F

Figure 3f: Scotchbond (Surface and Fractured views)

Application of a Hema-Seal G primer resulted in limited deposition on the dentine disc with small deposits partially occluding the tubule orifices (Figure 3a). After comparison with the control half of the disc, it was observed that there was some apparent further etching. When the dentine disc was fractured the tubule orifices appeared unsealed with no sign of material deposit although some tubules appeared widened (arrow). The Gluma 3 primer produced partial occlusion of some of the tubule orifices with irregularly shaped deposits, usually observed on the surface and at the edges of the tubule openings (Figure 3b arrow). When fractured, tubule lumens free of deposits were observed. After treatment with Gluma CPS there were sparse irregular deposits on the dentine surface, some of which appeared to partially occlude the tubule orifices, whereas others were observed on the tubule periphery (Figure 3c). Fracture of the disc revealed little or no tubule occlusion or penetration.

Solobond Plus Universal Adhesive System was applied on a dentine disc etched with Vococid. The dentine surface appeared rough, and the tubule orifices were patent (Figure 3d). Some particles were noticed on the dentine around, but not occluding, the tubules (arrow). When fractured the tubules, small deposits 20-30µm were observed deeper into the tubules, although the tubules were open and widened towards the dentine surface fractured compared to the control disk (example 2a).

After application of All Bond 2 to the dentine it was apparent that the surface was covered with an almost uniform layer sealing the tubule orifices (Figure 3e). Fracture of the dentine disc revealed the presence of a thin layer covering the tubule orifices which appeared to coat the inner walls of the dentine tubule to a varying depth (arrow). Treatment with Scotchbond following etching with maleic acid 10% for 15 seconds demonstrated that some of the ttubule orifices were evident, but greatly reduced in diameter (Figure 3f). The fractured view revealed a degree of product penetration within the tubule lumen which appeared coated (Figure 3f fractured view). One Step produced an even layer which covered the whole dentine surface and no tubule orifices were obvious (Figure 3g). Fracturing the dentine disc showed a thin layer covering the tubule orifices and a considerable degree of agent penetration within the tubule lumen (arrow).

FIG 3G

Figure 3g: One Step (Surface and Fractured views)

Subjective assessment of the test products’ ability to both occlude and penetrate the dentinal tubules was recorded as shown in Table 2. These results would suggest that the fluoride varnishes (Bifluoride 12 and Duraphat, and Cervitec) were effective in both occluding and penetrating the dentine tubules. It was also evident that All Bond 2, One Step and Scotchbond primers were superior to those of the HEMA group primers (Hema-Seal G, Gluma 3, Gluma CPS) and Solobond Plus

Table 2: Summary of the test products’ tubule occluding and penetrating ability

Test agents

Degree of tubule occlusion

Degree of dentine surface coverage

Degree of tubule lumen penetration

Bifluoride 12

+++

+++

+++

Cervitec

+++

+++

+++

Duraphat

+++

+++

++

Hema-Seal G

+

+

0

Gluma 3 Primer

+

+

0

Gluma CPS

+

++

0

Solobond Plus

+

+

0

All Bond 2

+++

+++

+++

Scotchbond

++

++

+++

One Step

+++

+++

+++

Key:
+++ Most tubules occluded/maximum surface coverage/good penetration
++ Some tubule occlusion/some surface coverage/some penetration
+ Few tubules occluded/little surface coverage/little penetration
0 No occlusion/coverage/penetration.

Discussion

Currently, the most accepted mechanism of stimulus transmission across dentine is the hydrodynamic theory, which proposes that rapid shifts of fluid movement in either direction within the dentine tubules may stimulate mechano-receptors in or near the pulp to excite the pulpal nerve and cause pain. This theory leads to the concept of dentine tubule occlusion as a method of dentine desensitization [2,3].

The use of the dentine disc model has been proved to be a reliable method for the initial in vitro screening of tubule occluding properties of potential desensitizing agents [5,7,8]. The dentine disc would appear to be the method of choice since it is easy to use, reproducible, provides a flat surface for elemental analysis and may be correlated with fluid flow research [7]. Due to the differences in the size, orientation, density and diameter of the dentine tubules throughout the tooth [9], the discs were obtained from the same region of the tooth, below the crown and above the root canal. One half of each dentine disc provided the control and the other half the test portion, and only those tubules from the central region of the disc, on either side of the fractured edge, were examined and all the observations on the test side were compared with the control half of the same disc. All the tested agents were applied according to the manufacturer’s instruction in an attempt to mimic the clinical situation.

Cervitec is a chlorhexidine containing varnish, marketed in Europe, which possesses very good dentine covering and tubule occluding properties. Chlorhexidine may act as an antiseptic in the dentine tubule lumen and reduce the number of microbes penetrating the open tubules of sensitive dentine, reducing possible pulp inflammation.

Duraphat has been studied in vivo [10-18] and proved to be effective in alleviating DS short-term. The main ingredient of Duraphat is sodium fluoride (NaF), which can precipitate onto the dentine surface [19] and may contribute its tubule occluding potential, along with its fluid texture which allows penetration into the tubule lumen. Fluoride is also reported to have potential for reducing sensitivity, perhaps acting on the SNA, and the effect of the combined sensory and physical actions may account for the widespread clinical success of Duraphat.

Bifluoride12 appears to seal the dentine surface with a crystal-like deposit in an amorphous matrix that penetrates the tubule lumen. It contains sodium and calcium fluoride, which probably account for the presence of deposits. Although the plugs penetrating the tubules do not completely occupy the tubule lumen, they appear to reduce the tubule radius and this, in association with the desensitising potential of the fluoride, may contribute to a reduction in DS in the clinical environment.

The Gluma group primers (Gluma 3, Gluma CPS), Hema-Seal G and Solobond Plus primer contain mainly glutaraldehyde and HEMA. They appeared to produce similar deposits on the dentine disc surface, partially occluding the tubule orifices. Fracturing did not reveal any degree of deposit penetration. Dondi Dall’ Orologio et al. [20] reported significant reduction of DS following application of Gluma 3 attributed to a possible reaction of glutaraldehyde with the dentinal fluid proteins, precipitation and thus a partial or complete obturation of dentine tubules. The mode of action of HEMA is still unknown. Probably, the partial occlusion of tubule openings shown in the present study may explain the reduction in DS. Hema-Seal G also contains sodium fluoride. Thus any reduction in DS may be attributed either to the partial occlusion of dentine tubule orifices or to the action of sodium fluoride which forms crystals of calcium fluoride reducing the radius of dentine tubules [19]. However, a degree of ‘over etching’ was observed following application of Hema-Seal G, indicating that, when applied to the dentine surface in vivo and in conjunction with acidic dietary intake, it might result in an increase in dentine permeability.

All-Bond 2 primers formed a layer that appeared to fully cover the dentine surface and also penetrated the tubule lumen to some depth. This is in accordance with Tay et al. [21] who also showed penetration of the tubule lumen. Furthermore, Ianzano et al. [22] and Gillam et al. [23] reported that All-Bond 2 primers were effective in vivo in reducing DS, although different evaluation techniques were employed by these investigators. All-Bond 2, therefore, may be useful in the in-office treatment of DS although its effectiveness may be relatively short-lived. One Step was a relatively new product (at the time of evaluation) and so far there are no studies evaluating its desensitizing or occluding properties although it is the same as All Bond 2. As with All-Bond 2, One Step may be of some clinical value given that it’s occluding and penetrating properties are satisfactory and it is also easily applied. Scotchbond has been reported to be effective in reducing DS [24] although it is possible that the primer was subsequently covered with a light-cured resin. In the present study only, the primer was applied onto the dentine disc surface and the results showed a degree of surface coverage although some tubules with reduced diameters were also evident. This may be due to the application procedure or the etching period. It is possible that longer application period or thicker layer would completely obscure the tubule openings. However, the fracture of the disc revealed penetration of the product within the tubules rendering this agent a potential desensitiser.

This study was based on a well-established dentine disc model which has been modified to provide greater control in the preparation and analysis of surface deposits. In this respect, the method may be considered an improvement over previously reported studies. Difficulties may still arise, however, in the interpretation of the results particularly with regard to fracturing the disc halves, which is relatively technique sensitive, and the exact plane of fracture is somewhat unpredictable. Nevertheless, if the control and the test disc sections are carefully compared, the penetrating potential of the tested agents can be satisfactory evaluated as indicated in this present study. The dentine disc model although useful for the initial in vitro assessment of different agents may not reflect the in vivo situation and the results of this in vitro study should be extrapolated to the in vivo situation with caution. Factors such as pulpal pressure, the oral environment (saliva, gingival fluid) and patient’s habits (vigorous toothbrushing, acidic dietary intake) may also influence the retention of these products on the dentine surface. The presence of dentinal fluid within the tubules and its rate of movement in vivo may influence the formation of deposits on the dentine surface despite efforts to keep the exposed dentine [15]. Vongsavan and Matthews [25] reported that the penetration of different molecules into the dentine tubules may be greater in vivo than in vitro.

All the agents introduced in the present study, appear to be clinically applicable since they are easily applied, and some appear to possess both occluding and penetrating ability. Varnishes and primers, (together with sealants which were not reported on in this study), because of the relative ease of application, may provide a useful treatment option for the practicing dentist in the alleviation of DS. Attention should be paid to the mode of their application, which may be technique sensitive, e.g. All Bond 2 and Scotchbond where a vigorous air blast may remove a great amount of the agent leaving uncovered dentine tubules. Tubule penetration properties are important because even when the agent is removed from the dentine surface, plugs of the material may remain within the tubule lumen, which may either maintain the desensitizing effect of the agent or provide the patient with temporary relief until natural tubule occlusion occurs. Both short and long term clinical studies are required to determine whether the in vitro potential of these agents can be extrapolated in the clinical environment.

The majority of in vitro studies have evaluated the desensitizing properties of agents using descriptive methods of dentine surface assessment. Although some authors claimed that their methods of assessing the amount of tubule occlusion were quantitative in nature [6,26] in many cases they were semi-quantitative with no measuring involved. Quantitative studies using digital image analysis and SEM would provide a more accurate result [27] however, most of the products in this study resulted in total surface coverage, negating the need for measurement. Studies including fractures of dentine discs are of benefit in the investigation of the desensitizing potential as there may be blockage within the tubule which is not evident from the surface. Elemental analysis was not within the scope of this study, but further examination of some of the surface products would be interesting.

Conclusions

The results of this study suggest that, of the agents tested, the varnishes, All-Bond 2 primer, Scotchbond primer, and One Step appear to have both occluding and penetrating properties. However, agents which have been observed to be effective in vivo but with no significant tubule occluding or penetrating properties as demonstrated in the present study may employ other mechanism/s which cannot be simulated in this in vitro model. Moreover, the results obtained following the application of all the agents tested in the present study may be affected by the application technique(s) employed to apply them on the dentine surface, although every effort was made to follow the manufacturer’s instructions for clinical application.

References

  1. Addy M, Mostafa P, Absi EG, Adams D (1985) Cervical dentine hypersensitivity. Etiology and management with particular reference to dentifrices. In: Rowe, N. H. (ed): Proceedings of symposium on hypersensitive dentine Origin and Management, University of Michigan, (ed) E. & S, Livingston Limited, Edinburgh & London, pp: 147-167. [crossref]
  2. Gillam DG (1995) Mechanisms of stimulus transmission across dentin–a review. J West Soc Periodontol Periodontal Abstr 43(2): 53-65. [crossref]
  3. Brannstrom M (1962) The elicitation of pain in human dentine and pulp by chemical stimuli. Arch Oral Biol 7: 59-62. [crossref]
  4. Pashley DH (1985) Strategies for clinical evaluation of drugs and/or devices for the alleviation of hypersensitive dentin. In: Rowe NH, editor. Proceedings of Symposium on Hypersensitive Dentin. Origin and Management. Ann Arbor: Univ Michigan. p.65-88 [crossref]
  5. Greenhill JD, Pashley DH (1981) The effects of desensitizing agents on the hydraulic conductance of human dentin in vitro. J Dent Res 60: 686-98 [crossref]
  6. Absi EG, Addy M, Adams D (1995) Dentine hypersensitivity: uptake of toothpastes onto dentine and effects of brushing, washing and dietary acid–SEM in vitro study. J Oral Rehabil 22(3): 175-82. [crossref]
  7. Mordan NJ, Barber PM, Gillam DG (1997) The dentine disc. A review of its applicability as a model for the in vitro testing of dentine hypersensitivity J Oral Rehabil 24(2): 148-156. [crossref]
  8. Ling TY, Gillam DG, Barber PM, Mordan NJ, Critchell J (1997) An investigation of potential desensitizing agents in the dentine disc model: a scanning electron microscopy study. J Oral Rehabil 24(3): 191-203. [crossref]
  9. Pashley DH, Leibach JG, Horner JA (1987) The effects of burnishing NaF/kaolin/glycerin paste on dentin permeability. J Periodontol 58(1): 19-23. [crossref]
  10. Kerns DG, Scheidt MJ, Pashley DH, Horner JA, Strong SL, Van Dyke TE (1991) Dentinal tubule occlusion and root hypersensitivity. J Periodontol 62(7): 421-8. [crossref]
  11. Kim S (1986) Hypersensitive teeth: desensitization of pulpal sensory nerves. J Endod 12(10): 482-5. [crossref]
  12. Sena FJ (1990) Dentinal permeability in assessing therapeutic agents. Dent Clin North Am 34(3): 475-90. [crossref]
  13. Knight NN, Lie T, Clark SM, Adams DF (1993) Hypersensitive dentin: testing of procedures for mechanical and chemical obliteration of dentinal tubuli. J Periodontol 64(5): 366-73. [crossref]
  14. Jain P, Vargas MA, Denehy GE, Boyer DB (1997) Dentin desensitizing agents: SEM and X-ray microanalysis assessment. Am J Dent 10(1): 21-6. [crossref]
  15. Dragolich WE, Pashley DH, Brennan WA, O’Neal RB, Horner JA, Van Dyke TE (1993) An in vitro study of dentinal tubule occlusion by ferric oxalate. J Periodontol 64(11): 1045-51. [crossref]
  16. Gwinnett AJ (1988) Aluminium oxalate for dentin bonding. A SEM study. Amer J Dent 1, 5-8. [crossref]
  17. Ellingsen JE, Rölla G (1987) Treatment of dentin with stannous fluoride – SEM and electron microprobe study. Scand J Dent Res 15, 281-286. [crossref]
  18. Hansen EK (1992) Dentin hypersensitivity treated with a fluoride-containing varnish or a light-cured glass-ionomer liner. Scand J Dent Res 100(6): 305-9. [crossref]
  19. Addy M, Mostafa P (1989) Dentine hypersensitivity. II. Effects produced by the uptake in vitro of toothpastes onto dentine. J Oral Rehabil 16(1): 35-48. [crossref]
  20. Dondi dall’Orologio G, Malferrari S (1993) Desensitizing effects of Gluma and Gluma 2000 on hypersensitive dentin. Am J Dent 6(6): 283-6. [crossref]
  21. Tay FR, Gwinnett AJ, Pang KM, Wei SH (1994) Structural evidence of a sealed tissue interface with a total-etch wet-bonding technique in vivo. J Dent Res 73(3): 629-36. [crossref]
  22. Ianzano JA, Gwinnett AJ, Westbay G (1993) Polymeric sealing of dentinal tubules to control sensitivity: preliminary observations. Periodontal Clin Investig 15, 13-16. [crossref]
  23. Gillam DG, Coventry JF, Manning RH, Newman HN, Bulman JS (1997) Comparison of two desensitizing agents for the treatment of cervical dentine sensitivity. Endod Dent Traumatol 13: 36-39. [crossref]
  24. Copeland JS (1985) Simplified remedy for root sensitivity. Northwest Dent 64(6): 13-4. [Crossref]
  25. Vongsavan N, Matthews B (1991) The permeability of cat dentine in vivo and in vitro. Arch Oral Biol 36(9): 641-646. [crossref]
  26. McAndrew R, Kourkouta S (1995) Effects of toothbrushing prior and/or subsequent to dietary acid application on smear layer formation and the patency of dentinal tubules: an SEM study. J Periodontol 66(6): 443-8. [crossref]
  27. Ahmed TR, Mordan NJ, Gilthorpe MS, Gillam DG (2005) In vitro quantification of changes in human dentine tubule parameters using SEM and digital analysis. J Oral Rehabil 32(8): 589-97. [crossref]

Faking Orgasm: Interviews with College Women about How, When, and Why They Pretend to Experience Orgasm

DOI: 10.31038/AWHC.2023623

Abstract

This study investigated the context in which young women fake orgasm, as well as their reasons. A key component of this study was to examine the way that sexual scripts and societal pressures influence young women who fake orgasm. In-depth interviews were conducted with 12 college women between the ages of 19-22 who had faked orgasms during sexual intercourse. Interview transcripts were analyzed for common themes. These college women faked orgasm for a variety of reasons and in the context of a diversity of relationships. Limitations, suggestions for future research, and recommendations for sexuality education are discussed.

Introduction

Faking orgasm, also known as feigning or pretending to orgasm, has been seen in popular media for decades. When Harry met Sally, was the first movie to highlight a woman faking orgasm. In the iconic restaurant scene, Sally claims that “at one time or another most women have faked it” [1]. Television shows, including Seinfeld [2], Parks and Recreation [3], and I Am Cait [4] have all dealt with the topic, and popular magazines, such as Cosmopolitan, have feature articles on faking orgasm including “7 Sad But True Reasons Women Fake Orgasm” [5] and “Funny Ways People Faked” [6]. These examples from popular media acknowledge that faking orgasm is something some women do, and at the same time raise important questions for researchers about how common it truly is and the reasons why women fake orgasm. It has been suggested it is one of the “least well-studied human sexual behaviors” [7].

Prevalence of Faking Orgasm

Several researchers have looked at the prevalence of women faking orgasm (e.g., Caron, 2021; Darling & Davidson, 1986; Ellison, 2000; Fahs, 2014; Hite, 1976; Muehlenhard & Shippee, 2010; Wiederman, 1997) [8-14]. Four of the earlier studies to address the prevalence of women faking orgasm provided important groundwork for more recent studies. One of these earlier studies was the research by Shere Hite published in her 1976 book, The Hite report: A nationwide study of female sexuality, which was based on the responses of 3,019 women, ages 14 to 78 [12]. The Hite Report revealed that most women experienced orgasm during clitoral stimulation rather than through vaginal penetration (a somewhat revolutionary finding for that time) and that these women felt that men’s attitudes about sex needed to expand to include the stimulation women needed. Important to the current study was her finding that more than half (57%) of women reported faking orgasm [12]. A decade later, a second study was published by Darling and Davidson specifically focused on faking orgasm (referred to as “pretending orgasm”). Their sample included 868 nurses from around the United States and revealed that, of the 745 women who had engaged in penile-vaginal intercourse, more than half (58%) had pretended to orgasm [9]. Another decade later, a third study focusing on faking orgasm involved a sample of 161 college women ages 18-27 from a Midwestern state university [14]. His findings were consistent with the two previous studies in that more than half (56%) of the women reported faking an orgasm during sexual intercourse [14]. In 2000, a fourth study discussing women faking orgasm was published by Ellison in her book, Women’s sexualities: Generations of women share intimate secrets of sexual self-acceptance. Similar to Hite, Ellison reported the results of her national survey, as well as in-depth interviews with women [10]. Of the 2,311 women between the ages of 23 and 95 who answered the questions about faking orgasm, 70% indicated they had faked an orgasm at least once with their partner [10].

More recent studies in the last two decades confirm what these earlier studies have shown: many women have faked orgasm. Muehlenhard and Shippee’s 2010 study of Kansas University college women from the ages of 18-29 found that two-thirds (67%) had faked during intercourse. Their study also looked beyond sexual intercourse and found that some college women pretended to orgasm during oral sex, manual stimulation, and phone sex [13]. Fahs’ (2014) research involving in-depth interviews with 20 women ages 18-59 found that 75% of women had faked orgasm at least once in their life [11]. Nearly half (45%) of these women reported that they faked orgasm regularly during their sexual encounters [11]. And in 2021, Caron published her book, The sex lives of college students: Three decades of attitudes and behaviors based on her annual survey of college students at the University of Maine. Her findings for the 6,654 students ages 18-22 covered a wide range of sexuality topics. In terms of faking orgasm, 70% of sexually active college women in the study said they have faked an orgasm. This is the only study to look at faking orgasm over time. When looking across the 30 years, Caron found that for college women, faking behavior has increased dramatically over time – from less than half to over three-quarters of college women today saying they have faked an orgasm [8].

Reasons Why Women Fake Orgasm

Along with research on the prevalence of women faking orgasms, there are several of studies that have examined the reasons why women fake orgasm. (i.e., Bryan, 2001; Braun et al., 2014; Fahs, 2014; Kaighobadi et al., 2010; Lafrance et al, 2017; Mialon, 2012; Muehlenhard & Shippee, 2010; Roberts et al., 1995) [11,13,15-20]. In addition, Cooper et al. (2014) developed a scale to assess women’s motives for faking orgasm, The Faking Orgasm Scale for Women [7]. These reasons have ranged from concern for their male partner’s feelings and wanting sex to end, to saving the relationship and pressure to perform in order for her to appear “normal.”

The most common reason researchers have found for why a woman might fake orgasm has been out of concern for the feelings of her male sexual partner; women reported they faked orgasm in order to preserve their partner’s feelings, or in some cases, to give him an “ego boost.” This was labeled by Cooper et al. (2014) as “altruistic deceit” and based on gendered beliefs, such as if a woman does not orgasm it will negatively impact the man’s ego. In Roberts et al.’s 1995 study, some of the 75 women interviewed explained how their partner felt he had failed in some way if she did not orgasm, so faking was a way to ensure he did not feel like a failure [20]. Ellison (2000) also found that women viewed faking orgasm as important in taking care of their partner’s feelings. One of the women interviewed stated, “he had to think he was a good lover, satisfying me. Basically, faking was me taking care of the man” [10]. In Bryan’s 2001 study, the women that she surveyed described wanting to boost their partners’ egos and not hurt his feelings. Her orgasm indicated whether or not he was sexually proficient and skilled; it emphasized that sex is a skilled activity, and a woman’s orgasm was the man’s responsibility [15]. Muehlenhard and Shippee (2010) found that 78% of women had pretended orgasm in order to avoid hurting their partner’s feelings, while 47% of women faked orgasm to make their partner feel good about themselves [13]. Mialon (2012) also found that women who care about their partner’s sexual pleasure are more likely to fake; they want to make him happy [19]. And along with protecting his feelings, a woman may want to reinforce her partner’s sexual skills. Fahs found that these were common themes in both her 2011 and 2014 research [11,21]. In Braun et al.’s 2014 research, a common reason women faked orgasm was to save the feelings of their most intimate partner [16]. Most recently, a study of 462 women ages 19 to 73 in the UK found that those who held more gendered beliefs, such as women’s orgasm is necessary for men’s gratification, were more likely to fake orgasm [22].

A second common reason some women fake orgasm is because she wants sex to end (Cooper et al. (2014) labeled this “sexual adjournment” [7]. As a woman in Ellison’s study (2000) described, “I enjoy sex even without orgasm. I fake because my partner tries too hard to get me to orgasm and that turns me off” [10]. In Bryan’s 2001 study, many women faked orgasm in order to stop intercourse [15]. Their reasons for why they wanted to end intercourse included feeling tired, bored, nervous, or in pain [15]. Muehlenhard and Shippee (2010) found that 61% of women in their sample indicated that wanting sex to end was their reason for faking orgasm. The women who wanted sex to end claimed that it was because “they were bored, not in the mood, or tired and wanting sleep” (Muehlenhard & Shippee, 2010). These researchers also found that some women faked orgasm so that their partner would orgasm, and this would lead to the end of sex [13]. In both Fahs’ 2014 study and Lafrance et al.’s 2017 study, women said they purposely faked orgasms in order to end sexual encounters [11,18].

A third common reason found in studies of why women fake an orgasm included her feeling that this keeps her partner happy and the relationship intact. Some women described feeling as though they could lose their boyfriend if they don’t fake [20]. In Ellison’s 2000 study, she describes this as a common theme. One interviewee explained the reason she fakes orgasm is because she needs to please her partner so that ‘then he won’t leave me and I’ll have a boyfriend” [10]. In Bryan’s 2001 study, the researcher found that there were a broad variety of partner-related reasons, and these included, “to maintain the relationship” [15]. In Kaighobadi et al.’s 2010 study about women faking orgasm in order to retain their mate, they found that women who were more insecure in their relationships and who perceived a higher risk of partner infidelity were more likely to fake orgasm [17].

Finally, some researchers have found that the reason a woman has faked orgasm was to convince their partner that she is normal; otherwise the feeling is that there may be something wrong with her. Bryan (2001) found that some women were motivated to fake orgasm because they felt embarrassed, ashamed, or abnormal because they were not going to have an orgasm when they thought they should [15]. Bryan’s research found that women “feared appearing inexperienced or naieve;” therefore, they felt pressure to experience an orgasm [15]. Along with feelings of abnormality come feelings of guilt or shame. In Fahs’ 2014 research, some women felt her inability to orgasm implied that there was something wrong with her, as one woman explained, “I don’t want him to know that I’m one of those women who can’t get aroused from a penis inside of her” [11].

Sexual Scripts

As these studies reveal, faking orgasm is not only common, but increasing, and women of all ages indicate a variety of reasons for faking, including concern for a partner’s feelings, wanting sex to end, to save the relationship, and pressure to appear “normal.” However, the idea that today’s young women fake orgasms seems nonsensical when viewed through a modern lens.

In a society that has seen a rise in feminism, discussions of women’s empowerment and sexual pleasure, women’s marches, empowering television shows and movies, and a myriad of information available online about sexual functioning and women’s pleasure, one would think that the number of women faking orgasm would be small or have decreased over the past few decades, not increased [23]. On the other hand, sex seems to be everywhere, but is seldom talked about honestly and openly. For example, pornography is accessible, but too often unrealistic, and sex education rarely includes discussions about female pleasure [21,24]. It is no wonder that, according to Casey et al. (2013), traditional sexual scripts for women are still in existence. These scripts include women not desiring sex, having a weak “sex drive,” resisting advances, being more highly valued if she is less sexually experienced, as well as the notion that women should prefer relational sex, want commitment and monogamy, and should seek emotional intimacy and trust with sex [25].

These traditional sexual scripts also provide ideas surrounding women’s experience with orgasm. According to Lavie-Ajayi and Joffe (2009) [26] in their article Social Representations of Female Orgasm, these scripts center on three ideas: 1) women’s orgasm as the central indicator of sexual pleasure and the goal of sex, 2) vaginal orgasms are thought of as better than clitoral orgasms, and 3) while it is common for women not to experience orgasm through intercourse, if she doesn’t, it is a sign of her deficiency. These orgasm scripts suggest reasons why women might fake during a sexual encounter. Essentially, the message for women has been that “we have been taught that orgasms are obligatory” [27]. Women, as well as men, have been socialized to believe that orgasm is the goal of sex, and without an orgasm, sex is pointless. This puts an incredible amount of pressure on both parties involved, and it may be easier to fake an orgasm than to deviate from these social norms [26].

The Purpose of this Study

While a number of studies have been done over the past several decades on the frequency of and reasons for faking orgasm, many involve women across a range of ages. Few studies have examined younger women. This qualitative study investigated the context in which today’s young women fake orgasm and examined their reasons for faking orgasm. A key component of this study was to explore the ways that traditional sexual scripts and societal pressures may continue to influence college women who fake orgasm. Specifically, this study involved in-depth interviews with younger college women who have faked orgasm during sexual intercourse. The following research questions were explored:

  1. How often and in what context do college women fake orgasm?
  2. What are college women’s reasons for faking orgasm?
  3. How do college women feel about faking and what is their sense of how their partner(s) and friends feel(s) about women faking orgasm?
  4. What do the college women’s accounts of faking orgasm reveal about their sexual scripts?

Methodology

The Sample

The criteria for inclusion in the study were college women ages 18-22 who had faked an orgasm during sexual intercourse. All 12 women described faking orgasm in the context of a sexual relationship with a man. Participants were recruited through announcements made in classes and e-mail announcements sent to several university discussion boards. The final sample included 12 women (Table 1) attending a public university in the northeastern United States. The age of the participants ranged from 19 to 22 years old, with the average being 21 years old. All 12 of the participants identified as White and cisgender. Ten of the participants identified as heterosexual, one identified as bisexual, and one identified as queer. The number of sexual partners each participant had ranged from 1 to 35 (M=11.6; SD=11). The number of sexual partners each participant faked with ranged from 1-20 (M=6.4; SD=6.8). Most women reported faking orgasm with most of their sexual partners. The percentage of partners they faked orgasm with ranged from 14% to 100% (M=65.4%; SD=26.3).

Table 1: Demographics of Participants (N=12)

Participant Pseudonyms

Age

Race

Sexual Orientation

Number of Sexual Partners*

Number of partners they faked with

Percent of Partners Faked With

Abigail

22

White

Straight

1

1

100%

Bella

21

White

Straight

6

4

66%

Charlotte

21

White

Straight

7

7

100%

Delilah

21

White

Straight

1

1

100%

Emma

22

White

Straight

27

20

74%

Faith

21

White

Straight

3

2

66%

Grace

21

White

Straight

5

3

60%

Hannah

22

White

Bisexual

9

2

22%

Irene

19

White

Straight

3

2

66%

Jasmine

22

White

Straight

22

3

14%

Kaylee

19

White

Queer

20

12

60%

Lily

22

White

Straight

35

20

57%

*All reported that their sexual partners were male

Interview Procedure

The interview was comprised of a series of questions focusing on the experience of faking orgasm. The Human Subjects Committee of the university approved the interview protocol. Interviews began with basic demographic questions (e.g., age, race, number of sex partners). The subjects were then asked a series of questions that centered on how often and the context for faking, what their reasons were for faking, how they and their sexual partner(s) and friends felt about women faking orgasm, and their sexual scripts.

College women who met the criteria (age 18-22 who had faked an orgasm during sexual intercourse) and expressed interest in participating in the study were provided with a copy of the consent form before an interview was scheduled. Consent was implied when they agreed to arrange an interview after reviewing the consent form. Consent was also verbally provided by the participants at the start of the interview. Interviews were conducted face-to-face in a private space on the university campus. Participants were assured that any and all responses would be kept confidential. No names or identifying information was included in the data report; a pseudonym was assigned to each participant, and any names of partners or friends mentioned in the interview were changed. Each interview lasted approximately ninety minutes. Interviews were tape recorded and extensive notes were taken. At the end of the interview, participants were given the opportunity to review the notes with their responses for omissions or clarifications. The taped interviews were later transcribed and afterwards the content from the taped interview was deleted.

Interview Analysis

Interview transcripts were analyzed using established methods of qualitative inquiry, including coding and categorizing processes that make use of both deductive and inductive approaches [28]. Thematic analysis was utilized to analyze and code the interviews. The first and second author read the first three interview transcripts independently, and initial coding of the transcripts involved marking comments that fit under the four research questions of focus for the study: frequency/context, reasons, feelings, and scripts. For example, a response that encompassed a woman’s reason for faking orgasm would have the initial code word “reason” added next to it. Next, coding categories or themes were created under these areas of focus through a process of open coding [28]. For something to be considered a theme, at least half of the women (six women) needed to discuss this in their responses. For instance, under the responses for “reasons,” if six or more women mentioned that the reason she faked an orgasm was because she worried about her partner’s ego and/or did not want to hurt his feelings, this was categorized under that theme. These were compared and coding categories were further developed.

The rest of the interviews were coded by the first author and reviewed by the second author as any changes or additions were made. No new coding categories emerged after approximately 10 interviews were completed, leading to assurances of content saturation. A total of 16 themes emerged from the coding. These are discussed below and presented in Table 2. In terms of frequency and context for faking orgasm, four themes were identified. For reasons for faking orgasm, five themes were determined, and for feelings about faking orgasm a total of four themes were identified. Finally, the fourth research question sought to understand what young women’s accounts of faking orgasm reveal about their sexual scripts. Three sexual scripts were identified and will be discussed.

Table 2: Themes identified for college women’s frequency and context of faking orgasm, reasons for faking orgasm, feelings about faking orgasm, and sexual scripts related to faking.

Frequency and Context of Faking Orgasm

·         How often: It depends

·         How she faked: I was a great actress and lied

·         When she faked: It was typically with intercourse

·         Who she faked with: When I didn’t know him well

Reasons for Faking Orgasm

·         I did not want to hurt his feelings

·         I was uncomfortable being with him

·         I felt I was taking too long

·         He did not know what he was doing

·         It’s expected

Feelings about Faking: Hers, Her Partner(s), and Her Friends

·         I feel it is pretty normal

·         I feel guilty, but it was necessary

·         My sexual partner would feel deceived

·         My girlfriends feel it is perfectly okay

Sexual Scripts

•         Media messages of what “normal sex” looks like

•         Her orgasm is a reflection of his competence

•         Her orgasm signals that sex is complete

Findings

Themes are reported below for each of the areas of focus for this research: frequency and context of faking orgasm, reasons for faking orgasm, feelings about faking orgasm, and sexual scripts. Direct quotations from the interview transcriptions are included to highlight the findings (Table 2).

Frequency and Context of Faking Orgasm

The first research question asked, “How often and in what context do college women fake orgasm?” The 12 college women were asked a series of questions to understand their experience of faking orgasm. Four unique themes were identified from the in-depth interviews, including how often she faked, how she faked, when she faked, and who she faked orgasm with. These are described below and are listed in Table 2.

How often: It depends. The first theme related to the frequency and context of faking orgasm was related to how often the women faked an orgasm. When asked how often they had faked an orgasm, the most common response was “it depends,” with responses ranging from “only a few times” to “hundreds of times.” For many women, it depended on a range of factors from how inexperienced she was or how inexperienced her partner was, to how well she knew him or how much pressure she felt. While some women said they had faked an orgasm only a few times in one relationship, others indicated they had faked “hundreds of times” in most relationships. Examples of how college women described how often they faked an orgasm are included below:

I did it more at the beginning of our relationship, and then less later into the relationship because I think that we both started learning more what we liked in the bedroom. I would say almost the majority of the time at the beginning of the relationship and then almost not at all as the relationship progressed forward. (Grace)

I would say that every one-night stand that I have had, I pretty much faked with. Like when I have a one-night stand, I would say it’s a guarantee pretty much that I am going to fake. It’s usually different than when I’m with someone that I’m emotionally close to. (Lily)

How she faked: I was a great actress and lied. The second theme related to frequency and context of faking orgasm focused on how she actually faked her orgasm. The majority of women described how faking orgasm involved good acting and included descriptions of the kinds of actions (i.e., body movements and sounds) they would engage in. They also said that when asked by their partner after sex if they had had an orgasm, they deliberately lied to him. Many not only described being good at faking, but also discussed getting better overtime with more sexual experiences. Some sample quotes describing how she faked include:

I verbalize, like moaning and getting grabbier. Definitely working myself up kind of thing and then heavy breathing afterwards. That was always a definite and I was like “Oh my God” ((panting)) kind of thing. I would say that I usually didn’t say anything though, just used my muscles and I would scratch their back too. (Kaylee)

I didn’t use just my body. He was like, ‘Did you get it?’ and I just said “Yes” even though I didn’t, so most of the time it’ll be like physical and moaning except for the two times that I straight up lied out of my mouth. (Charlotte) When she faked: It was typically with intercourse. A third theme related to frequency and context of faking focused on sexual intercourse. All 12 college women described faking orgasm during penile-vaginal intercourse. Two women added that they had also faked an orgasm during oral sex. Some women described that they began faking orgasms during sexual intercourse before they had ever had a real orgasm, but once they experienced an orgasm and knew what it felt like, they got better at faking. Some examples of women explaining when they faked include:

I fake during intercourse because I don’t even have a reason. Oral depends, I don’t know, I fake during both of them, but most commonly during intercourse because like I said, I don’t orgasm just by intercourse alone, so, uh, it is to make him feel better. (Delilah)

I emphasized more or got more convincing when I was faking when we were having sex. I think that because I knew what the orgasm was supposed to feel like because of a previous relationship, I was better at faking when I was doing stuff with other guys. (Irene)

Who she faked with: When I didn’t know him well. The fourth and final theme related to frequency and context of faking centered on how well they knew their sexual partner. All 12 college women talked about how they faked orgasm with someone they did not know well, either in the context of a one-night stand or in the very beginning of the dating relationship. It was described by many as “easier to get away with” if they faked an orgasm with someone whom they did not know and would never see again. Most described faking at the start of a relationship that eventually evolved into something long-term. As their partner got to know their sexual needs, there was no need to fake anymore. Some examples describing who women faked with include:

We were dating for less than a year, I only did it like a couple of times in the beginning ‘cause I kind of almost felt bad ‘cause it’s like obviously you’re putting a lot of effort in, you really are trying. It was just sometimes it was not going to happen and also that was one of my early relationships so I wasn’t as comfortable talking openly about it so I didn’t feel okay asking him to try something different. (Jasmine)

I only dated him for like three months, it was a stupid relationship. We didn’t have sex very many times, so this is kind of awkward, but I faked every single time with him. We only had sex like three times. This is so sad. I never even had an orgasm with him. (Bella)

Reasons for Faking Orgasm

The second research question asked, “What are college women’s reasons for faking orgasm?” A series of interview questions explored their most important reasons and what their rationale was for faking orgasm. Five themes were identified for the reasons women said they fake orgasm, including not wanting to hurt his ego, experiencing uncomfortable emotional and physical feelings with him, worrying she was taking too long, feeling like the guy wasn’t doing anything that was stimulating her, or she felt it was expected that she reach orgasm as part of sex. Each woman had many reasons for faking (not just one) and their reasons varied based on the context of the sexual experience. These five themes are described below and listed in Table 2.

I did not want to hurt his feelings. The first theme related to reasons for faking included concern for his feelings. Most of the college women described faking orgasm because they were worried about his ego and whether or not he would feel like he was a good sexual performer. Examples of things women said included:

I guess mainly I was just trying to make my partners feel better about themselves and that’s why I would never say, “Hey I’ve been faking the entire time we’ve been sleeping together” because that would take away all that validation too. Plus, I feel like it’s kind of a waste of time to be faking quite a bit and then tell the partner that you were faking. Their feelings are really going to get hurt that way. (Hannah)

I think that men get their feelings hurt easily and they’re very sensitive when it comes to sex and they always want to protect their ego and I think that there’s at least in some way pressure on women to fake orgasms so that they protect the feeling of their male partner. (Abigail)

I was uncomfortable being with him. The second theme related to reasons for faking orgasm was because they were really uncomfortable being with their sexual partner and therefore knew the sexual encounter was not going to lead to orgasm. They described being emotionally uncomfortable in terms of not being able to relax with him, not feeling a connection to him, or feeling very self-conscious. Many women also mentioned feeling physically uncomfortable (i.e., pain) and faking orgasm in order for the sex to end. For example:

I think “discomfort” would be the one-word summary of why I faked. I think with the more casual relationships, I never was emotionally close to them so I was emotionally uncomfortable with the situation. I felt like, “I don’t like that you’re seeing my boobs right now and I hardly know you.” With my first boyfriend it was probably more like, “This is my first partner ever, I don’t know what I’m doing.” I’m self-conscious, that’s why I’m uncomfortable and also when you don’t really know what you’re doing. I think physically that’s uncomfortable too. (Charlotte)

I felt like I was taking too long. The third theme related to the reason why women faked orgasm was because it was taking them too long to reach a real orgasm. They were worried that their partner would think something was wrong with them or they felt pressured by their partner continually asking, “Have you come yet?” Some examples of quotes from women describing how they felt they were taking too long included:

It’s more like I felt that I should reach an orgasm sooner, more than because he wasn’t going to give me one cause he’s doing the same things he usually does [when I have an orgasm] but sometimes it’s just not as fast. I feel like sometimes it takes me a lot longer to have an orgasm, but I don’t know why. I feel bad when it takes me a long time ‘cause then I think he feels bad too. (Delilah)

I feel like the guy is going to think that something is wrong with me if I don’t have an orgasm. I don’t want him to think that he just had sex with a weirdo after he finishes. He would ask me if I had orgasms, and I hated that. He did it all the time during sex, it made pleasure really difficult to focus on. (Bella)

He didn’t know what he was doing. The fourth theme related to reasons women gave for why they fake an orgasm was because the man they were with did not seem to know what he was doing in terms of stimulating her. Women described how they were sure they would not be reaching a real orgasm with him and therefore felt their only option was to fake an orgasm. Examples of this included:

I think with the other guys [one night stands] it was different. They didn’t really know what they were doing. If I was going to be in a long-term relationship, it would be different, but I had no confidence in the men that I slept with. I would always be like “Eh, they’re never going to get it,” so I would fake because I’m pretty sure that I just wouldn’t have ever have an orgasm in those encounters. (Emma)

I think that the majority of the time I fake because they are not doing anything and I’m not getting very stimulated throughout the whole thing, so I just don’t feel like it’s going to happen no matter how long it goes. No matter how long we like had sex, I wasn’t going to have an orgasm. (Lily)

It’s expected. The fifth theme related to reasons why women faked orgasms included an expectation and pressure to have an orgasm with intercourse. All of the college women said they believed it was what needed to happen in order for sexual intercourse to be complete. Not only should he orgasm, but she needs to orgasm as well. Women described this expectation and pressure in the following examples:

Guys just think we should have an orgasm, so that’s how it happens. I think there’s a huge amount of pressure on many women to have an orgasm, so they end up faking. I wouldn’t say anyone is happy to fake orgasms because normally the situation that you find yourself in is not ideal. (Abigail)

I feel like guys expect you to orgasm, but among girls I feel like it’s an understanding that having an orgasm during sex is not quite so common. I kind of think that’s where faking comes from because girls all understand how difficult it can be to have an orgasm, but guys just don’t seem to get it. I think that they kind of like originate the pressure, but sometimes I feel like I internalize that and then like I feel like I need to have an orgasm. (Emma).

Feelings about Faking: Hers, Her Partner(s), and Her Friends

The third research question asked, “How do college women feel about faking and what is their sense of how their partner(s) and friends feel about women faking orgasm?” The 12 college women were asked a series of questions to explore their feelings about faking, as well as the feelings of those around them. Four unique themes were identified from the in-depth interviews. Many women stated that both she and her friends feel that faking orgasm was typical or normal behavior. Most admitted feeling guilty, but recognized it was necessary, and they described how they never discussed faking with their sexual partner because they knew his response would not be good. These are described below and are listed in Table 2.

I feel it is pretty normal. The first theme related to the women’s personal feelings about having faked orgasm and centered on how normal this behavior was within a sexual encounter. Women seemed to shrug their shoulders and be unphased about having faked and orgasm. Many were okay with faking orgasm and saw it as a useful tool in many sexual encounters. Examples of women’s description of their feelings include:

I don’t think I’m doing anything bad. Just kind of like neutral. I think it’s pretty normal though, and I don’t think that many women feel bad about faking, especially because they are faking to not hurt their partner’s feelings. (Delilah)

It’s so normal, almost like, it shouldn’t be so normal, it shouldn’t be something that I have to do, I just don’t even think about it. I feel like it’s become like I’m used to it. It is what it is. No one really puts any thought into it. I don’t care that I have done it personally, but it’s probably something that I should change at some point. (Emma)

I feel guilty, but it was necessary. The second theme focused on how women feel about having faked orgasm and involved guilt. However, these women also qualified these guilty feelings by saying that faking was necessary in many situations they found themselves in order for the sexual encounter to be considered a success. Some quotes from college women about these feelings include:

I feel bad that I didn’t address it, I mean lying is really what I feel guilty about, but I didn’t want to make either of them feel bad. Going back, I would definitely talk more about it ‘cause that’s super important but going back I was just too shy at the time to discuss it. (Irene)

It is disappointing to fake cause I didn’t feel like my needs were important enough to tell the guy about. It is always hard for me to say, “That wasn’t good for me.” I am also okay that I didn’t make them feel bad, but also I was lying so then you kind of feel guilty anyway. (Faith)

My sexual partner would feel deceived. The third theme to emerge related to feelings about faking orgasm involved her thoughts on how her sexual partner would feel if he knew. All of the college women indicated they were not willing to tell their sexual partner they had faked because they were sure he would respond in a negative way. All of them were sure he would feel lied to or deceived. This reaction was confirmed by a few women who shared that they had later told a sexual partner about faking, and his response was to feel lied to and deceived. Sample responses included:

I haven’t ever talked about that with any of my sex partners. That would be so awkward and embarrassing for both of us because he would feel like he couldn’t get me off. (Bella)

I don’t want it to come out that I have faked in the past, so it’s not something that I ever bring up with my partner. I don’t want to hurt my partner’s feelings, so I would not want to talk about it. I don’t think that guys like to think that anyone has ever faked with them because that would hurt their confidence, so they probably don’t want to bring it up either. (Kaylee)

My girlfriends feel it is perfectly okay. The fourth theme related to feelings about faking orgasm centered on her friends’ reactions to finding out they fake. The overwhelming response from her girlfriends was that it is perfectly normal behavior and not surprising. Women talked only about their female friends’ response; none of the women discussed how male friends would feel about her faking orgasm with a partner. Some example of friends’ feelings about faking orgasm include:

I talked to my friends before I met you for this interview. I texted everyone. And one of my roommates responded back, “Have I faked an orgasm? Do you mean am I a woman?!” We all just laughed because it’s so regular. I feel like with my friends it’s the norm, and that’s what a lot of women unfortunately do. (Abigail)

So the only people I’ve ever talked about this with are my current roommates. We talked about it and all of us kind of joked like, “Oh girl, have I faked? Hell yes I faked, who hasn’t faked?” But it never went really beyond that. They didn’t have any specific reaction when I told them that I personally had faked. I think that most women just assume that all other women are faking, too. (Charlotte).

Sexual Scripts

An examination of the transcripts revealed three overarching sexual scripts these college women internalized to explain their faking orgasm behavior. These sexual scripts include: 1) media messages of what “normal sex” looks like, 2) her orgasm is a reflection of his competence, and 3) her orgasm signals that sex is complete. These sexual scripts are discussed below. Sample quotes are included to highlight these scripts.

Media messages of what “normal sex” looks like. The first sexual script centered on the media. Many of the women didn’t know exactly where their ideas, reasons for, or feelings about faking orgasm originated from, but they were able to cite the media as playing a very important role. Women discussed movies, television shows, and pornography. Women found these various types of media to be influential in their sex lives and to offer them an understanding of what “normal sex” should look like. Some sample quotes describing women’s experiences with media are below:

I think in my experience the way that men and women act has a lot to do with porn and when they watch it. Like the women through the whole entire thing are having orgasms, multiple orgasms. I think that porn plays such a big role in the expectations today. If you have a partner that looks at porn and always thinks it’s going to be the reality of sex, then that’s going to cause a lot of problems in the relationship. (Delilah)

I haven’t really thought about where I learned about faking orgasm before. I don’t want to say TV shows because that’s cliché, but you know how sometimes on TV you might see stuff like that, I don’t know, but I feel like the women on the TV fake it. It’s not like I’ve ever really given it thought, though I guess, I think I would say TV was a pretty big influence. (Grace)

I think that porn is a big reason why women fake, the way that sex is shown makes men think that sex in real life is going to be different than it actually is. Even in movies and stuff, sex is like this amazing thing that everyone wants to have, like in American Pie, but in real life it’s not ever really that interesting. I think sex can be really boring, especially if the guy has no idea what do to with your body. (Faith)

Her orgasm is a reflection of his competence. The second sexual script centered around her orgasm as a reflection of him. Nearly every single woman interviewed had faked orgasm because they understood that her ability to reach orgasm assured him he was competent. This sexual script suggests these women have learned that sex is about him; it’s about assuring him of his abilities, his sexual prowess, and his manhood. All women described the pressure from their partner to orgasm in order to assure him of his competency. Some examples of this can be found below:

With my boyfriend I would fake because I didn’t want to make him feel bad. And I think the other two guys, I mean, maybe it was just kind of, I guess the best reason would be like societal expectations. I don’t know, I always kind of feel like it’s something that should happen during sex. Even if they didn’t make me orgasm, they did make me feel good in at least some way, and faking was kind of my way of like showing even if they really didn’t make me orgasm, they were doing something good. (Grace)

Um, honestly I fake for him, so as not to hurt their ego because men are babies. They couldn’t handle rejection, so I would basically just fake with them because I didn’t want to hurt their feelings or anything. Men need to feel strong, needed, and important. So, I think that giving a girl an orgasm is very important to their self-esteem; if they are unable to give a girl that orgasm it hurts their self-esteem and makes them feel like they aren’t as sexually powerful as they should be. (Bella)

I think that men kind of originate the pressure to have an orgasm. Sometimes I feel like I internalize that and then like I feel I need to have one. Guys always want you to have an orgasm. I think it makes them feel better and more accomplished and then they get the added bonus that their partner is having a good time too. (Emma).

Her orgasm signals that sex is complete. The third sexual script is that women felt like sex was not complete until she experienced an orgasm. Not only did women feel this way, many also proclaimed that their male partners felt similarly. This pressure to perform in order to make the sex act complete was a recurring sentiment. Some sample quotes are below about women feeling as though their orgasm signals to the male partner that he can now orgasm and then sex is complete:

I wanted it to be over, so faking the orgasm was how I decided that I wanted to end the sexual encounter. I learned that if I wanted to end sex, then I could fake orgasm because that was a signal to him that he should be finishing up soon. (Charlotte)

At the time I felt like an orgasm was supposed to happen and then that was sort of like the mark of the end of the experience so I should basically have one to finish things up. (Irene).

Discussion

This study sought to add to our understanding of how and why women fake orgasm. There have been previous studies on women who fake orgasm, however, several are decades old and/or include a very broad age range of participants. For a behavior that appears to be extremely common in sexually active women, and one that has been increasing among college women over the past 30 years [8], there is a need for more research to understand this phenomenon. This study focused exclusively on a younger cohort of educated, college women who had faked orgasm. It involved in-depth interviews in order to understand the context, reasons, feelings, as well as to determine the sexual scripts that are influencing faking orgasm among today’s young women.

Comparison of Findings to Previous Research

Frequency and context of faking orgasm. In terms of the frequency and context of faking orgasm, there was a great variation in how often these college women reported they had faked orgasms. Some women reported that they faked every single time they had sex, while others had only faked a few times in their life. Other researchers also found that there was a wide range in frequency of faking among their study participants. For example, Bryan’s (2001) [15] found that 20% of women faked orgasm during 20% of their encounters, Fahs (2014) [11] found that 45% of women report that they faked orgasm “regularly” during their sexual encounters, and Ellison (2000) [10] found that while most had faked less than 50 times; 10% of the women claimed to have faked orgasm between “150 and 10,000 times or wrote in another answer such as ‘countless’ or ‘a bazillion’” [10].

Most of the college women in this study discussed pretending to orgasm by using their bodies and lying if their partner asked them about having an orgasm. Many women described “putting on a show” for their male partner so that they would not suspect anything. This was a finding described in other studies of women faking orgasm (e.g., Bryan, 2001) [15]. In addition, they all discussed how faking orgasm typically occurred with sexual intercourse. Few women identified faking during oral sex. Earlier studies (e.g., Darling & Davidson, 1986; Wiederman, 1997) [9,14] also specifically explored women who faked orgasm and found this to be typical.

Two findings related to frequency and context were unique to this research. First, the college women in this study reported that they got better at faking over time. Many noted that the longer they faked, the more convincing they felt they became. And related to this, once they experienced a real orgasm, they felt their ability to convincingly fake future orgasms improved considerably. The other unique finding that has not been discussed in previous research related to the context was that these college women described faking orgasm at the beginning of a relationship. All of the women faked when they were “less close” with their partners and had “less emotional attachment.” For some women (those who had only one-night stands), this pattern continued, but for those who had long-term boyfriends, they stopped faking as the relationship progressed.

Reasons for faking orgasm. In terms of the reasons why women fake, almost every woman interviewed agreed that they faked orgasm in order to save their partner’s feelings. The women were more concerned with their partner’s ego than with their own pleasure during the sexual experience. This finding was similar amongst nearly all of the previous research on reasons why women fake [7, 10, 13, 15, 16, 19, 20, 21]. For many women, it was reported that it was easier to fake and “protect his feelings” than to tell him the truth and deal with an uncomfortable conversation. Other reasons women cited for faking were similar to previous studies noted earlier including being uncomfortable, worrying she was taking too long, and feeling the pressure to orgasm.

Unique findings in this study related to reasons women fake orgasm included college women talking about experiencing physical pain, lack of concern for maintaining the relationship, and because he did not know what he was doing. In this study, many of the women cited feeling physically uncomfortable (not just emotionally uncomfortable) and cited this as a reason for faking orgasm in order to have the sexual encounter stop. Few of the previous study [15] discussed that women fake orgasm because of physical discomfort.

In addition, many of the previous studies found that a common reason why women fake was to keep the relationship intact [10, 12, 17, 20]. In the current study, not one of the college women talked about this as a reason for faking an orgasm, which raises questions about today’s college women and their focus on long-term commitments.

Another unique theme noted by college women in this study to explain their reason for faking was because their partner did not know what he was doing. The women who discussed this felt as though they would never experience an orgasm with their partner and therefore faked orgasm. These women were faking orgasm in order to end the encounter, and this is where there are similarities to the other studies [10,11,13,15,18]. These previous studies found that women would fake orgasm to end the sexual encounter, however it was for a variety of other reasons such as being tired, bored, or uncomfortable, not that the male partner didn’t know what he was doing. This reason for faking could be explained in large part because of the young age of the female respondents, who in turn may have young, sexually inexperienced partners who do not know what is involved in pleasing their partner.

Feelings about faking. Several studies have investigated how women feel about faking orgasm and women have suggested their male partner would be hurt to know [10, 11, 18], but asking about how their friends feel about their faking behavior has not been a focus of past studies. In this study, the college women were divided in their own feelings about having faked orgasm. On the one hand, many of the women felt as though their behavior was normal and nothing they were concerned about; on the other hand, many women felt guilty about faking orgasm, but they also justified their actions as necessary. These women knew that faking may not have been the right thing to do, but they could justify why it was done. In addition, most of the college women mentioned that they didn’t tell their partner about faking orgasm because they did not want him to have a negative response.

A unique finding in the study was the reaction of her friends. The college women interviewed for this study all described their female friends as having a supportive view of faking orgasm. Many of their college girlfriends shared that they do the same thing, and that they also believe faking orgasm is a very normal behavior.

Sexual scripts. The finding that many college women discussed the role of the media in defining what “normal sex” is and what female orgasm is supposed to look like was unique. Few of the previous studies [11] examined women’s sexual scripts or the variety of societal pressures that are placed on women. All the women in this study described the important role of the media in shaping their understanding of sex and orgasm. The college women participating in this study mentioned either learning about orgasms or faking orgasms through some sort of media such as pornography, movies, or television. These women mentioned having a fantasy version or unrealistic idea of what “normal sex” is “supposed” to look like due to the media influence in their younger years.

The second script that arose from the interviews with college women is the notion that her orgasm serves as a reflection of her partner. Previous studies have also described this need for women to assure her partner of his competency. [26, 27] discuss how it becomes obligatory for women to have an orgasm. A large goal of her orgasm is not about her pleasure; rather it is about making sure her male partner is happy and confident about his own sexual abilities. This belief system further ingrains the sexual double standard that the male orgasm is for pleasure while the female orgasm is for performance. Other studies [11, 15] found that many women faked because they felt that they needed to show their partner that he is doing a good job and give him the impression that they are enjoying sex as much as he is.

Finally, the third script to emerge from the interviews was the notion that female orgasm signals that sex is complete. Many of the women discussed faking orgasm in order to end the sexual experience. This is similar to other studies such as [26] in which they noted that the woman’s orgasm is the “goal of sex.” Similar to the current study, the female orgasm is seen as what needs to happen for the sex to be complete.

Limitations

As with all qualitative studies, the findings of this study cannot be generalized. There were several limitations to this study beginning with a small sample size and being limited by participants who were willing to be interviewed for the study. In-depth interviews were completed with college women who volunteered and therefore may be more open and comfortable with talking about faking orgasm. The interviews relied on the participants’ ability to recall as well as their perceptions of events, which could not be verified. This study was also limited to students who attended one public university in the northeastern U.S. and all shared the same race. A more diverse group of participants may impact the findings. Factors such as women’s race, socioeconomic status, culture, or religious orientation could all play into women’s propensity towards faking orgasm, along with their willingness to discuss such matters.

Future Research

The prevalence of faking orgasm and the reasons why women fake have been the focus of many studies, however, as noted earlier, it is one of the “least well-studied human sexual behaviors” [7]. In relation to the current study, it would be beneficial for future studies to conduct more in-depth investigations focusing on specific aspects of the current study. Future studies could focus solely on the context of faking, reasons for faking, or feelings a woman or her friends might have about faking orgasm. It would also be beneficial to look at the deeper meaning of faking orgasm in terms of the sexual scripts.

It is important to note that all of the participants in this study ranged in age from 19 to 22 years old. This sample was chosen because of the interest in examining young women’s experiences. Recognizing that faking orgasm is increasing among this age group, it is important to understand why. It is useful to examine this age group to understand how society, media, self-image, and male partners all affect their faking behavior. Other studies could compare how younger women differ from older women in their attitudes, beliefs, and influences. Future research could also compare women based on other factors such as ethnicity, race, religion, socioeconomic factors, and sexual orientation. The participants for this study were all women who shared their experiences of faking orgasm with male partners. Further research could examine how women in same sex relationships experience faking orgasm.

Suggestions and Recommendations

The frequency with which women fake orgasm, and the pressure women feel from their partners to reach orgasm provides several suggestions and recommendations for sexuality education. First and foremost, there is greater need for education of basic anatomy, as well as opportunities for discussion of what students see as the purpose of sex. It appears that for many of the women interviewed in this study, sex involves feelings of pressure, and involves an act or performance in order to prove (mostly to the male partner) that the sexual encounter was a success and that she is normal and okay. Better sexuality education is needed for both men and women in order to have a more realistic understanding of sexual function and the role of pleasure.

Second, there is a need for media literacy and a discussion of the role of pornography specifically in shaping ideas about sex. Many of the women felt their faking behavior was influenced by what has been portrayed in pornography, as well as in television shows and in movies. An opportunity to discuss the reality of sexual encounters versus the image portrayed in the media would be useful.

Third, there is a need for greater permission for couples to talk about their sexual response, their desires, motives, what feels good, and what they need. The college women interviewed for this study made it clear that sex is not something you can or should talk about with even your most intimate partner. Better role models for communicating and greater emphasis in sexuality education classes on how to approach topics of sexual pleasure are needed to give both women and men permission to talk with their partner.

Conclusion

This research looked at an understudied aspect of women’s sexuality – faking orgasm – from a qualitative perspective. It focused on young women who fake in order to understand the reasons, context, and influences for such behavior. Among these women’s circles of friends, faking orgasm is considered commonplace and normal. Faking orgasm is not new; however, it appears that more women are faking than in prior generations. For college women, faking behavior has increased dramatically over the past 30 years – from less than half to over three-quarters of college women today saying they have faked an orgasm [8]. This increase in faking seems counter-intuitive as the emergence of the third wave of feminism has worked to empower women, and women are becoming much more aware of their own pleasure and their own bodily autonomy. There are a wide variety of reasons women give for faking, and by delving into these reasons, the sexual scripts that women are raised to believe can be better understood. By deciphering these scripts that lead to faking orgasm, researchers can further understand societal pressure, self-pressure, and partner pressure, and work to change that.

This study was unique in that it used a qualitative methodology to investigate the experiences of college women who had faked orgasm in the context of heterosexual relationships. Women faking orgasm appears to be normalized amongst their peer group. Interviews with these 12 college women revealed many themes and suggested that women have similar experiences when it comes to faking orgasm and their sexual scripts. By understanding the scripts that young women who fake orgasm hold onto, along with the context and reasons for faking orgasm, we can further deconstruct the societal implications tied to what “normal sex” is “supposed” to look like and help them have a more honest and pleasurable sexual experience.

References

  1. Reiner R (1989) When Harry met Sally. MGM Home Entertainment.
  2. David L, Seinfeld J (1993) Seinfeld/The Mango [Episode 65]. In Seinfeld. NBC.
  3. Daniels G, Poehler A, Schur M, Wittles H (2011) Parks and Recreation/Ron and Tammy: Part II [Episode 34]. In Parks and Recreation. NBC.
  4. TMZ (2016) Caitlyn Jenner: Watch me fake an orgasm. I am Cait. TMZ: Los Angeles, California.
  5. Breslaw A (2017, October 11). 7 Sad but true reasons women fake orgasms. Cosmopolitan.
  6. Azodi M (2010, October 26). The crazy way I faked it. Cosmopolitan.
  7. Cooper EB, Fenigstein A, Fauber RL (2014) The Faking Orgasm Scale for Women: Psychometric properties. Archives of Sexual Behavior 43: 423-435. [crossref]
  8. Caron SL (2021) The sex lives of college students: Three decades of attitudes and behaviors. Orono, ME: Maine College Press.
  9. Darling CA, Davidson JK (1986) Enhancing relationships: Understanding the feminine mystique of pretending orgasm. Journal of Sex & Marital Therapy 12: 182-196. [crossref]
  10. Ellison C (2000) Women’s sexualities: Generations of women share intimate secrets of sexual self-acceptance. Publisher’s Group West.
  11. Fahs B (2014) Coming to power: Women’s fake orgasms and best orgasm experiences illuminate the failures of (hetero) sex and the pleasures of connection. Culture, Health & Sexuality 16: 974-988. [crossref]
  12. Hite S (1976) The Hite report: A nationwide study of female sexuality. New York: Seven Stories.
  13. Muehlenhard C, Shippee S (2010) Men’s and women’s reports of pretending orgasm. The Journal of Sex Research 47: 552-567. [crossref]
  14. Wiederman MW (1997) Pretending orgasm during sexual intercourse: Correlates in a sample of young adult women. Journal of Sex & Marital Therapy 23: 131-139. [crossref]
  15. Bryan TS (2001) Pretending to experience orgasm as a communicative act: How, when, and why some sexually experienced college women pretend to experience orgasm during various sexual behaviors (Unpublished doctoral thesis). University of Kansas.
  16. Braun V, Clarke VE, Rogers C (2014) “It feels so good it almost hurts”: Young adults’ experiences of orgasm and sexual pleasure. Journal of Sex Research 51: 503-515. [crossref]
  17. Kaighobadi F, Shackelford TK, Weekes-Shackelford VA (2011) Do women pretend orgasm to retain a mate? Archives of Sexual Behavior 41: 1121-1125. [crossref]
  18. Lafrance MN, Stelzl M, Thomas EJ (2016) Faking to finish: Women’s accounts of feigning sexual pleasure to end unwanted sex. Sexualities 20: 281-301.
  19. Mialon HM (2012) The economics of faking ecstasy. SSRN Electronic Journal 50: 277-285. [crossref]
  20. Roberts C, Kippax S, Waldby C, Crawford J (1995) Faking it: The story of “ohh!” Women’s Studies International Forum 18: 523-532.
  21. Fahs B (2011) Performing sex: The making and unmaking of women’s erotic lives. Albany, NY: SUNY Press.
  22. Harris EA, Hornsey MJ, Larsen HF, Barlow FK (2019) Beliefs about gender predict faking orgasm in heterosexual women. Archives of Sexual Behavior 48: 2419-2433. [crossref]
  23. Potts A (2000) Coming, coming, gone: A feminist deconstruction of heterosexual orgasm. Sexualities 3: 55-76.
  24. Future of Sex Education Initiative (2012) National sexuality education standards: Core content and skills K-12. Special issue of the Journal of School Health 1-42.
  25. Casey E, Masters NT, Morrison DM, Wells EA (2013) Sexual scripts among young heterosexually active men and women: Continuity and change. Journal of Sex Research 50: 409-420. [crossref]
  26. Lavie-Ajayi M, Joffe H (2009) Social representations of female orgasm. Journal of Health Psychology 14: 98-107. [crossref]
  27. Weiss S (2017) 4 super real reasons women fake orgasms.
  28. Maxwell JA (2005) Qualitative research design: An interactive approach (2nd Edition). Thousand Oaks, CA: Sage Publications.
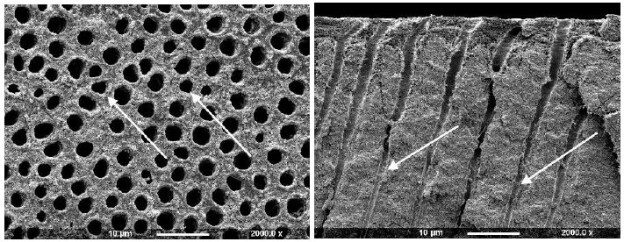
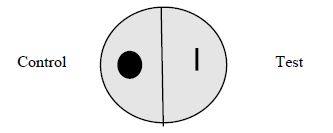
Reflections on Women’s Medical Autonomy in the 21st Century

DOI: 10.31038/AWHC.2023622

Editorial

One of the fiercest and most pragmatic of women’s battle was their right of medical autonomy vis-a- vis full information and right of acceptance/ refusal of any treatment offered. One of the most celebrated of these medico-legal battles and one which proved a page-turner was the case of Montgomery (Appellant) v Lanarkshire Health Board (Respondent) [2015] UKSC 11. It is time to take a reality check on the situation arising in this case, for it is becoming amply clear that in daily obstetric practice, women’s rights are far from being respected for one reason or another.

Montgomery (Appellant) v Lanarkshire Health Board (Respondent) [2015] UKSC 11 revolved about a pregnant mother’s request for an elective caesarean section was completely rejected by the obstetrician. The mother, a PhD graduate, repeatedly and persistently informed her obstetrician about her fears of a vaginal delivery. Her request for a CS was not unreasonable, for she, a primigravida, would be delivering a baby presenting by the breech. In addition,

(i)She was of a short stature.
(ii)She was a diabetic.
(ii)She was carrying a clinically large baby (4.25kg).

Subsequently, at birth the baby experienced severe shoulder dystocia and developed cerebral palsy of the spastic quadriplegic dyskinetic form consistent with underlying Hypoxic-Ischaemic Encephalopathy. At the Appeals Court, the defendant obstetrician was deemed negligent and the Appellant was awarded the sum of £5.25 million in damages. The ruling is widely held to have displaced the previous “Bolam test” in matters of consent.

There is no doubt that the hefty sum awarded in Montgomery was impressive as was indeed the now doubly underlined warning that that the doctor does not know all and the patient must be informed of all that has to happen to him/her and has the right to accept or reject any medical treatment proposed. This principle of disclosure in itself had been long a-brewing, but Montgomery pushed it to the fore not only in the Anglo-Saxon world but also across the ocean. Not that, anyone needed to be advised to explain managements to patients and listen to their side of the coin.

There was and is a danger with Montgomery that the medical practitioner just listens to what the patient wants and simply concedes. This is not a rare occurrence especially with caesarean sections in private practice. That is not the spirit of the Montgomery judgement which, above all, requires that the physician explains the suggested treatment and any alternatives to it, the pros and the cons, what potential complications may be entailed etc. This is Montgomery and it seeks to elicit the charity, the compassion and the ‘loving father image’ rather than the now rejected paternal aspect of “I know best”. A loving father explains to a child and helps in the right choice. In the great majority of cases, medical practitioners across all disciplines are cut of the “loving father” cloth, but, by no means, does this apply universally so.

I have recently been greatly disturbed by a patient of mine, whose daughter in Germany had had a breech presentation and was repeatedly and forcefully refused a caesarean section. The obstetrician could not be a person well versed with recent obstetric developments nor with modern medical ethics in general. Having confirmed all the details, I was both much amazed and greatly pained at such dictatorial remnant behaviour in 2023. Perhaps this is even commoner than I thought. And in this case, we speak of a woman who was tertiary educated – a PhD, in fact. Imagine what an uneducated woman, a non-English speaker or a refugee goes would to through, at this obstetrician’s hands and his ilk.

The battle for woman’s rights is by no means over. I firmly believe that before such rights can be fought for, their existence must surface, be noted and registered. Taking obstetric care as one example, the mode of delivery, especially and particularly in complicated cases, must be actively discussed with the parents, with an end scope of truly answering their questions. If the mother’s choice is for a particular mode of delivery, the only solid element to bring out and defend against would be maternal and child safety. In a breech delivery, for example, the greatest potential danger in a vaginal delivery, would be fetal intra-partum obstruction with subsequent intra-partum hypoxia and its resultant damage such as cerebral palsy. The inherent surgical and anaesthetic risks in a modern-day caesarean section especially with regional anaesthesia would be far less than the previous situation as discussed.

In Medicine, where one must practice secundum artis, depending on challenge and circumstance, no one can write a book of magical solutions. However, as modern medicine broadens its scientific horizons and new legal and ethical reins regulate behaviour, it is now clear that just as important as the tenets of science that we must be informed about, are the obligations of behaviour, imposed by the continuously evolving principles of law and medical ethics.

Repeated Traumatic Brain Injury is Associated with Neurotoxic Plasma Autoantibodies Directed against the Serotonin 2A and Alpha 1 Adrenergic Receptors

DOI: 10.31038/EDMJ.2023722

Abstract

Objectives: Traumatic brain injury (TBI) was associated with increased plasma agonist autoantibodies targeting the serotonin 2A receptor. Repeated TBI exposure is associated with high risk for neurodegenerative and neuropsychiatric complications. Here we tested a hypothesis that repeated TBI is associated with plasma agonist autoantibodies targeting more than one kind of catecholamine G-protein coupled receptor.
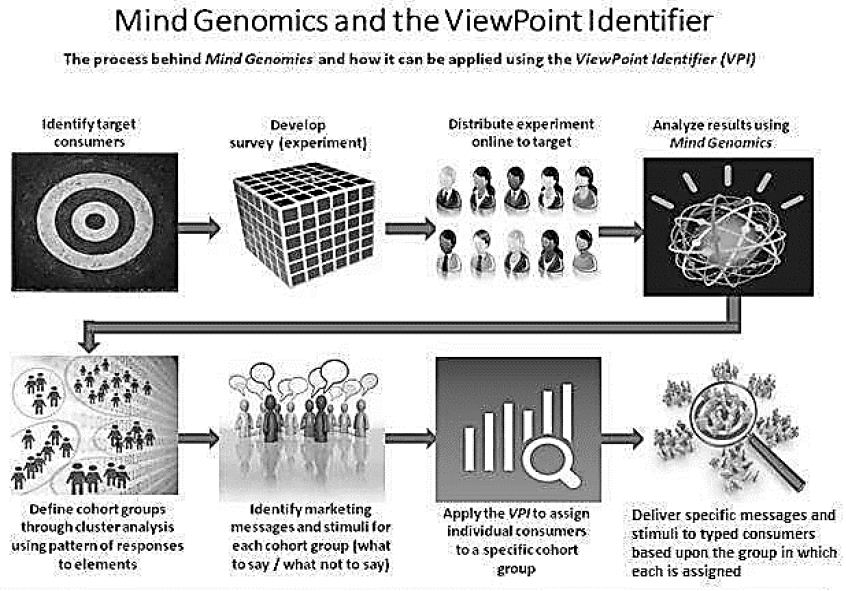
Methods: Protein-A affinity chromatography was used to isolate the IgG fraction of plasma in forty-two middle-aged and older adults who had experienced one or more TBI exposures. The Ig (1/40th dilution=7.5 ug/mL) were tested for neurotoxicity in mouse neuroblastoma cells using an acute neurite retraction assay indicative of Gq11/IP3/Ca2+ and RhoA/Rho kinase signaling pathways’ activation. Three different linear synthetic peptides corresponding to the second extracellular loop of the alpha 1A, alpha 2A or serotonin 2A receptors were used as target antigen in different enzyme-linked immunoassays. The second extracellular loop receptor peptides themselves (alpha 1A, alpha 2A) or a fragment (serotonin 2A) were tested for ability to prevent Ig-induced neurite retraction.

Results: Patients who had experienced either repeated TBI (N=10) or a single TBI with a co-morbid autoimmune disease (N=5) were significantly more likely to harbor neurotoxic plasma autoantibodies targeting both alpha 1 adrenergic and serotonin 2A receptors vs. patients having only a single TBI. Ig-induced neurotoxicity was significantly prevented by co-incubation with either 850 nM prazosin (alpha 1 adrenergic receptor) and/or 500 nM M100907 (serotonin 2A receptor) antagonists. Alpha 1 adrenergic receptor and serotonin 2A receptor Ig immunoreactive level and titer were significantly increased in repeated TBI and single TBI/autoimmune patients (N=7-8) compared to age-matched TBI patients without neurotoxic plasma Ig (N=4). SN.8, a linear synthetic peptide corresponding to a conserved region of the second extracellular loop (ECL) of the serotonin 2A receptor completely prevented neurite retraction induced by repeated TBI plasma Ig. A repeated TBI patient harboring alpha adrenergic receptor AAB alone experienced prospective steep decline in cognitive function over two years.

Conclusions: Repeated TBI and TBI with associated autoimmunity harbored more than one kind of neurotoxic catecholaminergic agonist GPCR autoantibody each associated with high risk for steep rate of cognitive decline. Specific immunoassays using the second extracellular receptor loop as target antigen are needed to detect each specific different GPCR autoantibody. A fragment of the second ECL of the serotonin 2A receptor (SN.8) neutralized Ig-induced neurotoxicity in repeated TBI or TBI with associated systemic autoimmunity.

Introduction

Traumatic brain injury (TBI) contributes to substantially increased global disability including the increased risk for later occurrence of major depressive disorder, Parkinson’s disease or dementia [1]. United States military veterans of the conflicts in Afghanistan and Iraq who sustained repeated TBI exposures are also likely to suffer with chronic post- traumatic stress disorder (PTSD). Certain symptoms of chronic PTSD overlap significantly with those of TBI including mood changes (anxiety, depression, suicidal ideation), and altered cognition (attention deficits, memory impairment). A distinct subset of chronic PTSD symptoms (nightmares, panic attacks) involving hyperarousal suggest dysregulated norepineprhine and epinephrine signaling on alpha 1-adrenergic receptors expressed in the brain and sympathetic nervous systems [2].

G-protein coupled receptors are highly druggable treatment targets, and prazosin, a selective alpha1 adrenergic receptor antagonist is effective for the treatment of nightmare disorder in chronic PTSD [3]. Traumatic brain injury and its later neurodegenerative sequelae (major depression, Parkinson’s disease, dementia) was previously associated with increased plasma agonist autoantibodies targeting the serotonin 2A receptor [4,5]. Here we tested a hypothesis that repeated exposures to traumatic brain injury promotes persistent neuroinflammation leading to the development of humoral autoantibodies targeting two, related catecholaminergic GPCRs, i.e. the serotonin 2A and the alpha 1A adrenergic receptors. We used immunoassays specific for the second extracellular loop regions of the alpha1 A receptor and serotonin 2A receptors to test for co-occurrence of these catecholaminergic receptor- targeting autoantibodies (AAB) and its association with clinical outcomes in 42 middle-age and older adult TBI-sufferers.

Methods

TBI Patients

Informed consent for the local Institutional Review Board-approved studies was obtained from all participants prior to blood drawing or cognitive testing. The participants belonged to two different cohorts, A and B. Cohort A included patients age 50 years or older (N=35) among whom approximately two-thirds of patients were previously reported to harbor plasma autoantibodies targeting a second extracellular loop region of the serotonin 2A receptor [4]. Here we report additional bioassay results in thirty of thirty-five consecutively-enrolled patients from cohort A, i.e. neurite retraction in mouse neuroblastoma cells induced by plasma IgG fraction; and whether plasma IgG-induced neurite retraction was significantly reduced (70% or greater) by the presence of either a highly selective serotonin 2A receptor antagonist (M100907) or a selective alpha 1 adrenergic receptor (prazosin) antagonist. Cohort B is comprised of younger patients age 40-60 years who suffered either a single or repeated TBI exposures. In Cohort B we not only tested Ig for bio-assayable 5-HT2AR-like and alpha 1AR-like neurite retraction, but also for immunoreactivity targeting the second extracellular loop of the alpha 1AR (and/or 5HT2AR).

TBI Exposure

All participants in Cohort A experienced direct force traumatic brain injury. Cohort B participants included patients who had experienced either direct force (n=6), blast TBI (n=5) or both types of TBI (n=1). In nearly all cases, the TBI exposure was judged to have been mild.

Peptides

QN.18, PP.15 (PAPEDETICQINEEP), and RT.18 (RQPDAGAAYPQCGLNDET) are linear synthetic peptides corresponding to the second extracellular loop of the human 5HT2AR, alpha1a AR or alpha 2a AR, respectively. SN.8 (SCLLADDN) is comprised of a subregion of the human 5HT2AR involved in mediating receptor activation All peptides were synthesized at Lifetein, Inc (Hillsborough, NJ). The peptides had purity ≥ 95% and were stored under desiccated conditions at -40 degrees C prior to use. On the day of an experiment an aliquot of lyophilized peptide was dissolved in sterile, phosphate buffered saline or deionized water prior to immunoassay or bioassay.

Protein-A Affinity Chromatography

Protein-A Affinity Chromatography was carried out as previously reported [4]. The resulting IgG fraction obtained from TBI patient plasma was stored at 0-4 degrees C prior to bioassay and immunoassay.

Mouse N2A Neuroblastoma Cells

Mouse N2A Neuroblastoma Cells were obtained from the American Type Culture Collection (Rockville, MD).

N2A Neurite Retraction Bioassay for 5HT2AR-like and Alpha 1AR-like Neurotoxicity

We used a previously reported acute neurite retraction assay in cultured mouse N2A neuroblastoma cells [6] to test the IgG fraction of plasma from adult TBI patients for autoantibodies (AAB) causing significant acute neurite retraction. A selective serotonin 2AR (M100907) and alpha 1AR (prazosin) antagonists was each incubated (separately) with TBI patient IgG to test for significant inhibition (>/=70%) of the AAB-induced N2A neurite retraction.

Enzyme Linked Immunoassay

Enzyme Linked Immunoassay were performed as previously described using the QN..18 second extracellular loop of the 5HT2AR [5] as the target peptide antigen. For the alpha 1AR and alpha 2AR immunoassays, the respective specific second extracellular loop peptide for each receptor PP.15 (alpha 1AR) or RT.18 (alpha 2AR) was substituted in place of QN 18.

Rat Plasma, Protein-G Affinity Chromatography, Enzyme Linked Immunoassays

Rat Plasma, Protein-G Affinity Chromatography, Enzyme Linked Immunoassays plasma was obtained from 25-week-old male spontaneously hypertensive rats (SHR) as previously reported [7]. The IgG fraction was isolated using protein-G affinity chromatography as previously reported [8]. Enzyme linked immunoassay was performed as previously described [7] using either the 5HT2AR second extracellular loop peptide QN.18 or the alpha 1A adrenergic receptor second extracellular loop peptide PP.15 as target antigen.

Statistics

Statistical analysis was performed using unpaired Students’ t-test and Fischer’s exact test.

Results

Co-occurrence of Plasma Alpha 1 Adrenergic- and Serotonin 2A-receptor Autoantibodies in TBI

Table 1 shows the clinical characteristics in a subset of 7/30 TBI patients (from Cohort A) whose plasma IgG had the properties of both alpha1AR targeting and serotonin 2AR target AAB. All seven patients had experienced either recurrent TBI or a single TBI exposure in the setting of having an underlying autoimmune disorder. The dose-response curves of IgG-induced N2A neurite retraction in these seven patients was compared to that of twenty additional patients who had experienced a single TBI and harbored either serotonin 2AR-targeting AAB alone or a lower level of uncharacterized AAB activity (Figure 1). Mean potency (neurotoxicity) in a 1/80th dilution from repeated TBI or autoimmune + single TBI plasma IgG significantly exceeded (P < 0.05) potency in an identical concentration of IgG from single uncomplicated TBI (Figure 1).

Table 1: Clinical characteristics in a subset of older adult TBI patients (Cohort A) who harbored both 5HT2AR-like and Alpha 1 AR- like bioactive Ig or Alpha 1 AR-like Ig alone.

tab 1

rTBI: Repeated Traumatic Brain Injury; Sys: Systemic; PTSD: Post Traumatic Stress Disorder; cognitive dysfunction.

fig 1

Figure 1: The indicated dilution of protein-A eluate fraction of plasma was incubated with mouse neuroblastoma cells and acute neurite retraction was determined as previously reported [ ]. Results are the mean ± SE of two or more measurements. *P<0.05: mean N2A neurite retraction in Ig from seven repeated or autoimmune TBI plasma significantly exceeded level in Ig from twenty patients who suffered a single TBI, not complicated by an autoimmune disorder.

Younger TBI patients many of whom are US military combat veterans having served in Afghanistan or Iraq they had a high rate of repeated TBI exposure and also suffer from post-traumatic stress disorder, whose symptoms overlap with those of TBI (e.g. anxiety and depression). The clinical characteristics in a subset of younger TBI patients (Cohort B) is shown in Table 2 with comparison to Cohort A. Cohort B patients had significantly lower mean age compared to Cohort B patients (Table 2). Six of twelve Cohort B patients tested had (N2A neurite retraction bioassay) evidence for both plasma 5HT2AR and alpha 1AR-like AAB (Table 2) including four patients who experienced repeat mild TBI and two patients who had a single TBI and a coexisting autoimmune disorder (not show in Table 2). The prevalence of chronic PTSD was quite high in Cohort B (75%) but it did not differ significantly from the PTSD prevalence in Cohort A (42%).

Table 2: Clinical characteristics in nested cohort of twelve younger TBI patients (Cohort B): comparison to subset of Cohort A patients harboring 5HT2A and/or alpha 1A receptor AAB.

tab 2

*Four patients had repeated TBI exposures, two patients had single TBI and an autoimmune disorder; ^ six patients harboring both 5HT2A and alpha1- receptor autoantibodies, one patient with only alpha1- receptor autoantibodies. AAB- autoantibodies, PTSD- post traumatic stress disorder. Alpha 1AR- alpha 1 adrenergic receptor.

When the results from Cohort A (N=30) and B (N=12) were combined, a striking association was evident between the presence of 5HT2AR and/or alpha 1AR-targeting bioactive Ig (vs. 5HT2AR Ig alone vs. neither AAB) and either recurrent TBI (7/12 vs 0/15 vs. 0/15; P=0.0016) or single TBI patients having a comorbid systemic autoimmune disorder (P=0.003) (Table 3). These data suggest that repeated TBI exposure carries an equivalent high risk as systemic autoimmunity for development of agonist autoantibodies targeting both 5HT2A and alpha 1A receptors (Table 4).

Table 3: Risk factors associated with combined presence of 5HT2AR and/or Alpha 1AR agonist Ig neurotoxic bioactivity in mouse N2A neuroblastoma cells.

tab 3

^ N=1 patient with recurrent TBI had alpha 1 AR AAB alone

Table 4: PTSD symptoms in Cohort B TBI patients: relation to AAB status

tab 4

^excluding obstructive sleep apnea

Agonist autoantibodies targeting each kind of receptor have been previously reported to be associated with an increased risk for dementia [9,10]. Neurodegenerative disease (dementia, cognitive dysfunction and/or Parkinson’s disease) was highly prevalent (5/7) among older Cohort A patients harboring both 5-HT2AR and/or alpha 1AR AAB (Table 1). In two such patients with recurrent TBI and chronic PTSD (Pt 4 and 6; Table 1) a 7.5 mg/mL (50 nanomolar) concentration of the plasma Ig caused potent 70-75% neurite retraction after 5 mins exposure in N2A cells (Figure 2A). Neurite retraction was substantially prevented by co-incubation with an 850 nanomolar concentration of prazosin (Figure 2A). Plasma Ig in two patients having Parkinsons’ disease (PD) and/or dementia (Pt 1 and 4; Table 1) mediated dose-dependent potent N2A neurotoxicity (i.e. neurite retraction) (Figure 2B). One of the patients (Patient 4, Table 1) who was observed prospectively (over two years) progressed from near normal baseline cognition to clinical dementia, in serial St. Louis University Mental Status testing (Figure 2c). The Patient 4 plasma alpha 1AR-targeting AAB was not detected in an enzyme-linked immunoassay specific for the second extracellular loop of the 5HT2AR (data not shown in Figure 2).

fig 2

Figure 2: A) Protein A- eluate (7.5 mg/mL) from two patients suffering with recurrent TBI, PTSD (Pts 4&6, Table 1) induced acute neurite retraction in N2A mouse neuroblastoma cells. The Ig- induced neurotoxicity (neurite retraction) was substantially prevented by co-incubating cells together with 850 nM concentration of the alpha 1 AR antagonist prazosin. B) Dose-response curves of neurotoxicity in the protein-A eluate fraction of plasma from TBI/PTSD (Pt 4) or TBI/Parkinson disease (Pt 1, Table 1). C) Pt 4 (TBI/chronic PTSD) harboring alpha1AR agonist Ig tested negative in 5HT2AR enzyme linked immunoassay, but experienced substantial 2-year decline in St. Louis University Mental Status (SLUMS) examination score. Dashed line indicates the cutoff score below which the score is indicative of dementia.

Taken together, these data suggested that younger recurrent TBI patients (including those in Cohort B) may be at substantially increased risk for the future development of clinically significant decline in cognitive function. An immunoassay specific for 5HT2AR Ig alone may not suffice to identify all such high- risk TBI patients.

The bioassay (N2A neurite retraction) data in all 42 Cohort A and B patients is summarized here. Twenty-one of 42 patients (50%) had IgG neurotoxicity which was significantly prevented by co-incubation of N2A cells with 200-500 nanomolar concentration of the highly selective 5HT2AR antagonist M100907 (Figure 3A). Fourteen of 42 patients (33%) had IgG neurotoxicity which was incompletely neutralized by M100907 and was not further characterized (Figure 3B). Eleven of 42 patients (26%) had IgG which was (blocked by M100907) and by co-incubation with 850 nanomolar concentration of the selective alpha 1 adrenergic receptor antagonist prazosin. Six patients (14%) demonstrated a low level of neurotoxicity in plasma which was not further characterized. One of 42 patients (2%) tested had an IgG which was solely inhibited by prazosin (alpha 1AR-like), but not by M100907 (5-HT2AR-like). The total exceeds 100% because patients (26%) harboring more than one Ig were counted twice. In an immunoassay specific for the second extracellular loop of the 5HT2AR, patients having 5HT2AR and/or alpha 1AR agonist-like neurotoxic bioactivity (N=12) had significantly higher level of 5HT2AR immunoreactivity compared to TBI patients (N=14) in whom 5HT2AR- or alpha 1 AR-like neurotoxicity could not be confirmed in bioassays (P=0.024) (Figure 3B). These data are consistent with a prior report that human pathologies’ 5-HT2AR Ig-induced neurotoxicity was highly correlated with plasma 5HT2AR immunoreactivity [5] using an enzyme linked immunoassay having QN..18, the entire second (5HT2AR) extracellular loop peptide, as target antigen.

fig 3

Figure 3: A) Neutralization of neurotoxicity in 21 of 42 TBI protein-A eluates by 200-500 nM concentration of the highly selective 5HT2AR antagonist M10097. B) Incomplete neutralization of neurotoxicity in 14 of 42 TBI protein A eluates by 200-500 nM concentration of M100907; C) binding to 5-HT2AR second extracellular loop peptide in protein-A eluates from TBI patients displaying (N=12) or not displaying (N=12) M100907-inhibitable neurotoxicity.

Sleep disorders including trauma nightmares are common in recurrent TBI patients suffering with chronic PTSD. Neutralization of combined (5HT2AR and alpha 1AR) plasma Ig-induced neurotoxicity in a representative patient with recurrent TBI and nightmare disorder is shown in Figure 4. Prazosin, an alpha 1 adrenergic receptor antagonist, is FDA approved to treat hypertension, and was effective in lessening the symptoms in traumatic nightmare disorder in combat veterans [3]. Here we conducted an exploratory analysis of whether alpha 1 AR agonist AAB may be associated with traumatic nightmare disorder in combat veterans suffering recurrent TBI.

fig 4

Figure 4: Ninety-three percent neutralization of neurotoxicity in the protein A eluate of plasma from recurrent TBI (Pt 5, Table 1) having traumatic nightmare disorder by 200 nanomolar concentration of the highly selective 5HT2AR antagonist M100907; eight-two percent neutralization by 850 nanomolar concentration of the specific Alpha 1AR antagonist prazosin. Results are mean ± SEM.

The prevalence of sleep-disorder (excluding obstructive sleep apnea) in Cohort B patients harboring alpha 1AR AAB vs Cohort B patients not harboring plasma alpha 1 AR AAB was increased (5/8 vs 1/4), but the sample size was too small and lacked sufficient power to detect a statistically significant difference. Of interest, Patient 4 harboring plasma alpha 1AR AAB was prescribed prazosin which provided symptomatic relief from traumatic nightmares. Yet despite regularly filling the prazosin prescription, he still experienced a substantial prospective decline in cognitive function over a two-year period. This observation may be consistent (in part) with the relatively short half-life of prazosin’s action and reports that alpha 1AR Ig mediates long-lasting receptor activation.

Mouse neuroblastoma N2A neurite retraction induced by the protein A eluate from a recurrent TBI patient harboring both alpha 1AR and 5HT2AR-targeting AAB was completely neutralized by 25 micromolar concentration of Y27632, a selective RhoA/Rho kinase inhibitor or by 50 micromolar concentration of 2-APB, an IP3R antagonist. These data are consistent with known positive coupling of TBI Ig-induced 5HT2AR and alpha 1AR signaling to Gq11/IP3R/Ca2+ and RhoA/Rho kinase signaling pathways [6].

In patients suffering with Alzheimer’s or vascular dementia, alpha 1 adrenergic receptor agonist autoantibodies were previously reported to target an epitope in the second extracellular loop of the receptor [10]. We next used enzyme linked immunoassays specific for binding to the second extracellular loop of the alpha 1 AR or the 5HT2AR to test plasma Ig from repeated and/or autoimmune TBI patients.

Alpha 1AR immunoreactivity and 5HT2AR immunoreactivity were both significantly elevated (P < 0.01) in the protein-A eluates from younger Cohort B patients who suffered repeated or autoimmune TBI (N=8), compared to level in four age-matched TBI patients lacking neurotoxicity (Figure 5A and 5B). Mean binding was approx. 2-fold higher than background (0.04 Absorbance units) in plasma harboring both alpha 1AR, and 5HT2AR AAB specificities. The Ig titer was also significantly elevated in co-occurring alpha 1AR and 5HT2AR plasmas compared to plasmas from TBI patients lacking neurotoxicity (Figure 6A-6B).

fig 5

Figure 5: Binding to a linear synthetic second extracellular loop peptide of the alpha 1A adrenergic receptor(A) or of the 5HT2A receptor (B) was significantly increased in protein-A eluates (1/40th dilution) from multiple or autoimmune TBI compared to uncomplicated TBI without bioassayable neurotoxicity. Background binding = 0.04 absorbance units. Results are mean ± SEM.

fig 6

Figure 6: Titer of binding to second extracellular loop peptide of the alpha 1A adrenergic receptor (A) or the 5HT2A receptor (B) was significantly increased in the protein-A eluates from multiple or autoimmune TBI vs. uncomplicated TBI lacking bio-assayable neurotoxicity. Background = 0.04 absorbance units.

As a further test of the specificity of recurrent TBI Ig for the alpha 1 AR and 5HT2AR, we used a synthetic peptide identical to the second extracellular loop of the alpha 2A adrenergic receptor (alpha 2R) as the target antigen in an enzyme-linked immunoassay. Since the alpha 2AR couples to Gi/Go subfamily of G proteins leading to decreased intracellular cyclic AMP, its activation is not expected to cause N2A neurite retraction. Alpha 2R agonism has peripheral sympatholytic effects (decreased blood pressure) and in the CNS mediates presynaptic inhibition of neurotransmitter release (epinephrine, norepinephrine) through actions on auto-receptors. To our knowledge, there has been no reports of spontaneously-occurring alpha 2R-targeting agonist autoantibodies in human disorders.

Mean plasma Ig binding (to the A2AR second extracellular loop peptide) in all eight younger TBI patients tested (Cohort B) was minimally elevated above background (1.25-fold) even though it was significantly higher (P < 0.05) compared to binding in four Cohort B TBI patients lacking Ig neurotoxicity (Figure  7A). The titer of A2AR peptide Ig -binding was similarly low, i.e. 1-1.25-fold vs. background (0.04 AU) in multiple TBI, autoimmune TBI, and in TBI lacking neurotoxicity (Figure 7B). Only one of twelve Cohort B patients tested (a patient with potent neurotoxicity who had suffered a single TBI) harbored alpha2R immunoreactivity at a significant level, i.e. 1.5-fold above background. The clinical significance of this finding is unknown. Taken together, these data demonstrating a much lower level of binding to the second extracellular loop of the alpha 2R, an aminergic GPCR family receptor related to the 5HT2AR [11] confirms the specificity of the results in TBI Ig for the alpha 1 AR and 5HT2AR.

fig 7

Figure 7: Absence of significant binding to a linear synthetic second extracellular loop peptide of the alpha 2A adrenergic receptor in the protein-A eluates (1/40th dilution) from multiple or autoimmune TBI compared to uncomplicated TBI lacking bio-assayable neurotoxicity. B) Non-significant, low titer of binding to alpha 2A adrenergic receptor second extracellular loop peptide in protein-A eluates from multiple or autoimmune TBI or uncomplicated TBI. Background binding = 0.04 absorbance units.

The orthosteric binding pockets of aminergic, family GPCR are conserved [9]. A novel small peptide antagonist of the 5HT2AR comprised of an epitope (SN.8) in the C-terminal region of the second ECL was previously reported to have completely neutralized the neurotoxic bioactivity in TBI and neurodegenerative disorders plasma Ig [5]. Here we tested for neutralization of N2A neurite retraction in recurrent or autoimmune TBI plasma by synthetic peptides corresponding to the entire second extracellular loop of the alpha 1A (PAPEDETICQINEEP) or the alpha 2A (RQPDAGAAYPQCGLNDET) adrenergic receptors. A twenty microgram per milliter concentration of SN.8 (SCLLADDN) completely neutralized neurotoxicity in 7.5 ug/mL concentration of autoantibodies in recurrent and single/autoimmune TBI plasma (N=4) (Figure 8A). An identical concentration of PAPEDETICQINEEP, which includes the epitope specific sequence APEDE (shown in bold text) previously reported to have blocked bioactivity in dementia plasma AAB [10] only partially prevented (52%) neurite retraction by the same four recurrent and single/autoimmune TBI plasma Igs (Figure 8B). An identical (twenty microgram per millilter) concentration of RQPDAGAAYPQCGLNDET comprising the entire second ECL of the alpha 2AR had no significant inhibitory effect on neurite retraction by two of two recurrent TBI plasma Ig tested (Figure 8C).

fig 8

Figure 8: Neurite retraction in a 1/40th dilution of the protein-A eluate from multiple or autoimmune TBI was A) nearly completely prevented by co-incubation with a 20 microgram per milliliter concentration of the SN.8 epitope-specific 5HT2AR second extracellular loop peptide, B) partially prevented by co-incubation with a 20 ug/mL concentration of a linear synthetic second extracellular loop peptide of the alpha 1A adrenergic receptor, or C) unaffected by co-incubation with a 20 ug/mL concentration of a linear synthetic peptide of the second extracellular loop of the alpha 2A adrenergic receptor. Results are mean ± SE.

A one-fourth dilution (~1 µg/mL) of the protein-G eluate of plasma in two 25-week-old male Spontaneously Hypertensive Rats (SHR) displayed two-fold increased binding to the second extracellular loop peptides of the 5HT2AR and the alpha 1A adrenergic receptors in two separate enzyme linked immunoassays (Figure 9A). The protein G eluate (1 µg/mL) from a representative twenty-five-week old male SHR caused significant N2A neurite retraction which was completely prevented by co-incubation with a twenty microgram per milliliter concentration of the SN.8 peptide (Figure 9B). Co-incubation with an identical (20 µg/mL) concentration of the PP.15 second extracellular loop peptide from the alpha1A adrenergic receptor had much less inhibitory effect on SHR Ig-induced N2A neurite retraction (Figure 9B).

fig 9

Figure 9: A) Binding to a second extracellular loop peptide of the 5HT2AR or Alpha1A AR was significantly increased in the protein-G eluate fraction of plasma in two, 25-week-old SHR rats compared to background = 0.032 AU. B) Neurite retraction in a 1/4th dilution (~1 µg/mL) of the protein-G eluate of plasma from a representative 25-week-old male SHR rat was completed prevented by co-incubation with a 20 microgram per milliliter concentration of SN..8, but was only 32% inhibited by an identical concentration of PP..15, the alpha 1A adrenergic receptor second extracellular loop peptide. Results are mean ± SEM.

Discussion

The alpha1 adrenergic receptor shares significant amino acid homology with the serotonin 2A receptor [11] in a region of the second extracellular loop involved in mediating long-lasting receptor activation. Both GPCR receptors positively couple to phospholipase C gamma/inositol triphosphate / Ca2+ release signaling pathway to promote IgG neurotoxicity in neuroblastoma cells. Repeated TBI plasma was associated with both significantly increased titer of plasma serotonin 2AR agonist IgG autoantibodies, and the appearance of additional agonist IgG having specificity for the alpha 1-adrenergic receptor based on neutralization of Ig bioactivity by a specific alpha1AR antagonist (prazosin). The striking association between multiple TBI, or single TBI/autoimmune disorder and co-occurrence of bio-assayable and immune-assayable 5HT2AR and alpha 1AR-targeting AAB suggests that specific methods for the early detection of both kinds of AAB specificities may be required to avoid missing TBI patients prone to experience rapid rate of cognitive decline. Patients with underlying systemic autoimmune disorder (e.g. autoimmune thyroid disease) who experienced only a single TBI still had the autoantibody equivalent of ‘repeated TBI exposure’ suggesting such patients may be at higher risk for future neurodegenerative complications compared to patients who experienced a single uncomplicated TBI exposure.

There are currently no medications available to slow the rate of cognitive decline in TBI patients. If future candidate drugs become available for testing, the availability of validated biomarkers (which can serve as surrogates for an increased risk of neurodegeneration) may be quite useful in identifying and monitoring high-risk TBI patients. Increased plasma 5HT2AR-immunoreactive AAB (vs lower AAB) was a significant predictor of a steep (two-year) rate of prospective cognitive decline in a cohort of older adult TBI patients from cohort A [9].

In subsets of Alzheimers’ and vascular dementia [10] autoantibodies targeted an epitope in the second ECL of the alpha 1AR (shown in bold, PAPEDETICQINEEP) located in a region N-terminal to the conserved (underlined) cysteine residue. On the other hand, 5HT2AR- targeting autoantibodies in diverse neurodegenerative pathologies were reported to target (QDDSKVFKEGSCLLADDN) a more highly conserved region of the second extracellular loop (shown in bold letters) including (underlined) amino acid residues which play a key role in mediating aminergic receptor activation [11]. For example, conserved amino acid residues leucine (L) and aspartate (D) play key roles in stabilizing hydrophobic interactions within the transmembrane core (L) and interhelical hydrogen bonding (D) important in activating GPCR signaling, respectively. Since the small hydrophobic SN.8 peptide (SCLLADDN) antagonist contains these two conserved amino acid residues it might ‘compete’ with the same amino acid residues on the native receptor for binding sites important in stabilizing and activating the receptor.

Persistent neuro-inflammation associated with repeated TBI and single/autoimmune TBI may increase the likelihood for occurrence of agonist autoantibodies directed against closely-related catecholamine receptors. Catecholamine receptors are expressed on immune cells and play a role in promoting acute and chronic inflammatory responses [12,13]. Treatment with either 5HT2AR [14] or alpha 1 AR antagonist medication [15] was previously reported to be associated with reduced mortality in severe Covid 19 infection. Plasma agonist 5HT2AR IgG autoantibodies were associated with hyperinflammation in severe Covid-19 infection and increased titer was associated with an increased risk of Covid-19 mortality [16].

Alpha 1 adrenergic receptor autoantibodies were previously reported to increase in subsets of human refractory hypertension [12], however, in the present study only two of forty-two patients (~5%) suffered with refractory hypertension. Alteration in regulatory T cells has been linked with hypertension in the genetically hypertensive male Spontaneously Hypertensive Rat (SHR) strain [17]. Male SHR rats (25-weeks-old) not subjected to TBI, spontaneously harbored both alpha 1A adrenergic and 5HT2A receptor immunoreactive autoantibodies, and the level and titer of the two kinds of plasma catecholaminergic agonist AAB were nearly indistinguishable. Acute N2A neurite retraction induced by male SHR Ig was not only prevented by the 5HT2A second extracellular loop receptor peptide SN.8 (in vitro), but systemic (in vivo) administration of SN.8 in male SHR rats was reported to mediate potent, long-lasting systolic and diastolic blood pressure-lowering [7].

Alpha 1 AR and 5HT2AR are expressed in overlapping, but distinct brain regions. Decreased expression of each receptor was reported in cerebral cortex from dementia patients [18,19] perhaps consistent with shared downstream Gq11/IP3/Ca2+ signaling pathway activation (by AAB) which is toxic in neurons. There has been no prior report of a specific association between alpha 1 AR agonist autoantibodies and TBI. A much larger study is needed to test the hypothesis that alpha 1AR autoantibodies may increase in association with specific symptoms in TBI with chronic PTSD (e.g. trauma nightmares, panic disorder, anxiety).

In summary, plasma alpha 1 adrenergic and serotonin 2A receptor agonist AAB co-occur in patients who experienced repeated TBI or single TBI in the setting of systemic autoimmunity and may contribute to higher risk for dementia. A small peptide antagonist, SN.8 comprised of a highly conserved region of the serotonin 2A receptor whose amino acid residues play key roles in stabilizing aminergic GPCR activation, prevented neurotoxicity from both 5HT2AR- and alpha 1AR-targeting autoantibodies by an unknown mechanism. These observations may have particular relevance to patients expressing both kinds of autoantibodies (without a history of TBI exposure) as the results of a recent study in the Zucker rat strain (which expressed both 5HT2AR and alpha 1AR AAB) indicated significant in vivo neuroprotection (by systemically-administered SN.8) in sham-injured, but not in TBI-injured rats [20].

Acknowledgements

Supported by a grant from the New Jersey Commission of Brain Injury Research (Trenton, New Jersey) NJCBIR22 PIL022 to MBZ.

References

  1. Walker KR, Tesco G (2013) Molecular mechanisms of cognitive dysfunction following traumatic brain injury. Frontiers in Aging Neuroscience 5: 29. [crossref]
  2. Charney DS, Woods SW, Nagy LM, Southwick SM, Krystal JH, et al. (1990) Noradrenergic function in panic disorder. J Clin Psychiatry 51: 5-11. [crossref]
  3. Raskind MA, Peskind ER, Hoff DJ, Hart KL, Holmes HA, et al. (2007) A parallel group placebo- controlled study of prazosin for trauma nightmares and sleep disturbance in combat veterans with post-traumatic stress disorder. Biol Psychiatry 61: 928-934. [crossref]
  4. Zimering MB, Pulikeyil AT, Myers CE, Pang KC (2020) Serotonin 2A Receptor Autoantibodies Increase in Adult Traumatic Brain Injury in Association with Neurodegeneration. J Endocrinol Diabetes 7: 1-8. [crossref]
  5. Zimering MB (2019) Autoantibodies in Type-2 Diabetes having Neurovascular Complications Bind to the Second Extracellular Loop of the 5-Hydroxytryptamine 2A Receptor. Endocrinol Diabetes Metab J 3: 118. [crossref]
  6. Zimering MB (2017) Diabetes Autoantibodies Mediate Neural- and Endothelial Cell- Inhibitory Effects Via 5-Hydroxytryptamine- 2 Receptor Coupled to Phospholipase C/Inositol Triphosphate/Ca2+ Pathway. J Endocrinol Diabetes 4: 10. [crossref]
  7. Grinberg M, Zimering MB (2022) Myristolated Serotonin 2A Receptor Peptide Promotes Long-Lasting Blood Pressure-Lowering and Reno protection in Hypertensive Rat Species. Endocrinol Diabetes Metab J 6. [crossref]
  8. Zimering MB, Grinberg M, Burton J, Pang K (2020) Circulating Agonist Autoantibody to 5-Hydroxytryptamine 2A Receptor in Lean and Diabetic Fatty Zucker Rat Strains. Endocrinol Diabetes Metab J 4: 413. [crossref]
  9. Zimering MB, Grinberg M, Myers CE, Bahn G (2022) Plasma Serotonin 2A Receptor Autoantibodies Predict Rapid, Substantial Decline in Neurocognitive Performance in Older Adult Veterans with TBI. Endocrinol Diabetes Metab J 6: 614. [crossref]
  10. Wallukat G, Prüss H, Müller J, Schimke I (2018) Functional autoantibodies in patients with different forms of dementia. PLoS One 13: e0192778. [crossref]
  11. Michino M, Beuming T, Donthamsetti P, Newman AH, Javitch JA, et al. (2015) What can crystal structures of aminergic receptors tell us about designing subtype-selective ligands?. Pharmacol Rev 67: 198-213. [crossref]
  12. Wenzel K, Haase H, Wallukat G, Derer W, Bartel S, et al. (2008) Potential relevance of alpha(1)-adrenergic receptor autoantibodies in refractory hypertension. PLoS One 3: e3742. [crossref]
  13. Grisanti LA, Perez DM, Porter JE (2011) Modulation of immune cell function by α(1)-adrenergic receptor activation. Curr Top Membr 67: 113-138. [crossref]
  14. Zimering MB, Razzaki T, Tsang T, Shin JJ (2020) Inverse Association between Serotonin 2A Receptor Antagonist Medication Use and Mortality in Severe COVID-19 Infection. Endocrinol Diabetes Metab J 4: 1-5. [crossref]
  15. Rose L, Graham L, Koenecke A, Powell M, Xiong R, et al. (2021) The Association between Alpha-1 Adrenergic Receptor Antagonists and In-Hospital Mortality From COVID-19. Front Med Lausanne 8: 637-647. [crossref]
  16. Zimering MB (2021) Severe COVID-19 Pneumonia is Associated with Increased Plasma Immunoglobulin G Agonist Autoantibodies Targeting the 5-Hydroxytryptamine 2A Receptor. Endocrinol Diabetes Metab J 5: 1-9. [crossref]
  17. Katsuki M, Hirooka Y, Kishi T, Sunagawa K (2015) Decreased proportion of Foxp3+ CD4+ regulatory T cells contributes to the development of hypertension in genetically hypertensive rats. J Hypertens 33: 773-783. [crossref]
  18. Lai MK, Tsang SW, Alder JT, Keene J, Hope T, et al. (2005) Loss of serotonin 5-HT2A receptors in the postmortem temporal cortex correlates with rate of cognitive decline in Alzheimer’s disease. Psychopharmacology 179: 673-677. [crossref]
  19. Szot P, White SS, Greenup JL, Leverenz JB, Peskind ER, et al. (2007) Changes in adrenoreceptors in the prefrontal cortex of subjects with dementia: evidence of compensatory changes. Neuroscience 146: 471-480. [crossref]
  20. Grinberg M, Burton J, Pang KC, Zimering MB (2023) Neuroprotective Effects of a Serotonin Receptor Peptide Following Sham vs. Mild Traumatic Brain Injury in the Zucker Rat. org 2023, 2023050004.

Social and Cultural Representation of Autism as Experienced by Mothers in Cameroon

DOI: 10.31038/PSYJ.2023554

Abstract

This study poses the problem of the socio-cultural significance of autism spectrum disorders in the Cameroonian cosmogonic universe. In doing so, we set ourselves the objective of understanding the representations and attributions given to this developmental psychopathology which occurs in the individual from early childhood. Based on work carried out in the African anthropo-sociocultural context, we can draw etiological explanations of autism more from the relationships transgenerational cosmic events that the ego undergoes. There is a generalized paranormal attribution both from the nosological and etiopathogenic point of view which always crystallizes on a fatalistic prognosis. Speeches were collected with an interview grid from four (04) mothers of autistic children living in the city of Yaoundé-Cameroon. It emerges from the analysis of the contents that these children are still considered crazy, mentally disordered or “snake children”. In many Cameroonian cultures, children with ASD are considered born to die. For some, they don’t want to stay in the world of the living. For others, they disrupt the family line by being born and dying multiple times; they are inhabited by an evil spirit which threatens the family and we cannot send them to school, because they are useless. This plunges their parents and neighbors into feelings of shame, guilt and hostility that affect their affective exchanges and their socio-cognitive development. This implies the need for better awareness of this disorder and the possibilities of care and schooling for children who present with them.

Keywords

Autism, Mother, Social representation, Child

Introduction

In each culture, mental illness is interpreted by giving it a specific meaning. We thus try to shed light on the origin of the disease for cultural management. In this work, it is about the social and cultural representations of the autistic child in Cameroon. Childhood autism is defined by Kanner [1] as an inability of children to establish normal relationships with people and to react normally to situations, accompanied by a disorder of affective contact, and appearing from the beginning of life. It is a global and early developmental disorder, which appears from the age of 3 years. The criteria that describe it, however, still pose problems due to its categorization in psychiatric disorders and on the other hand to the fact that in the majority of African cultures, it is caused by the curse and/or the presence of impure spirits. It can therefore be seen that in Africa and in Cameroon in particular, the problem does not lie in the existence of autistic disorders but rather in the mastery of its clinical description as it has been developed by the Association of American Psychiatrists [APA] [2] and by the World Health Organization [WHO] [3].

According to the traditional approach, mental illness is of the magico-religious type, divine punishment, attack by evil spirits, sorcery, transgression by the parents (especially the mother) of a prohibition, malevolence or jealousy of a co-wife are very widely spread. Thus in Mali, in the popular consciousness, the mentally retarded is considered as a person animated by evil spirits [4]. It represents the sign of a curse or a deterioration of social and family relations due to a transgression of ancestral laws. In Senegal, among the Wolofs and Lebous, psychopathological behavior stems from aggression from the outside world, either from a human enemy or from an angry spirit. According to Boyer [5], the child can be the object of alienating parental projections. According to her, in the face of relationship difficulties with a child, parents can set up this type of projection. She thus speaks of a particular psychopathological entity described by Zempleni [6] in Senegal: The “nit-ku-bon” child who could be an example of alienating parental projections.

The set of traits presented by the “nit-ku-bon” child, combining a refusal of verbal and visual communication, singular beauty, excessive wisdom, evoke early childhood autism [4]. In Africa, people with autism are sometimes perceived as idiots, victims of faults committed by their parents or other family members [7]. Some are considered as wizards, as lucky charms, or on the contrary as a curse. The Yoruba of Benin also call children with autism Akibus, which means “to be born and die”. They suspect her children of communicating with spirits and wanting to harm their families. In Cameroon, Lolo [8] had observed that autistic children are often considered as “children born to die”. According to her, they don’t want to stay in the world of the living and disrupt family dynamics by being born and dying multiple times. Parents perceive them as inhabited by an evil, and therefore threatening, spirit. These studies give a brief overview of the autistic child in Africa, but what exactly is Cameroon?

The prevalence of autism and ASD in Cameroon is not precisely known due to the lack of a national registry. This prevalence is estimated at 1/165 [9]. Autism statistics in Cameroon as given by the Ministry of Public Health in 2013, amount to 100, 000 children. According to the WHO, tens of millions of people are affected by autism in Africa [10]. This can be explained by the fact that a majority of countries on this continent are under-informed and do not have appropriate structures for the management of this syndrome. This therefore prompts us to question the social and cultural representation of autism in Cameroon. The objective of this article is to grasp the socio-cultural significance of autism in the anthropo-socio-cosmogonic context of Cameroon.

Methodology

This study is qualitative in nature. The qualitative approach is a research method that makes it possible to analyze and understand phenomena, behaviors, facts or subjects [11]. It is a question of apprehending the social and cultural representation of the autistic child in Cameroon. To fully understand this, the clinical approach was used. Its purpose is to describe the phenomena or the set of observable facts, of events as they occur to us. It therefore made it possible to explore the participants according to their perception, their feelings and their subjective reality that they each have of the autistic child. The clinical method by its singularity and its totality has made it possible to grasp the social and cultural representation of the autistic child in Cameroon. We mainly based ourselves on the case, with the aim of understanding in depth the phenomenon as experienced in a very specific context which is that of Cameroon. The study was done during a camp for parent and child with autism in Yaoundé Cameroon.

The sampling technique adopted in this work is called non-probability. Participants were chosen based on their ability to provide interesting and relevant information about how others perceive their child. They are four mothers of autistic children, of Cameroonian nationality. Data collection was done through semi-structured interviews. This made it possible to center the comments of the participants as well as the perception of the others vis-à-vis their children. These voluntary participants, after signing the informed consent, were free to end the interviews at any time. As a data analysis technique, we used content analysis based on verbatim statements.

Results

This section presents the results of the interviews.

Presentation of the Case

The characteristics of the participants are presented in the Table 1.

Table 1: The characteristics of the participants

Characteristic

Mother 1

Mother 2

Mother 3

Mother 4

Age 49 years old 31 years old 39 years old 45 years old
Ethnic group Bamiléké Yambassa Bamiléké Bamiléké
Marital status Married Married Married Bachelor
Child’s age 4 years old 7 years old 10 years old 11 years old
Age of diagnosis 3 years old 2 years old 3 years old 2 years old
Family history of disability Yes Yes No Yes

Thematic Analysis of Interview Content

Clinical interviews with each participant highlight a number of factors that explain the representation of the child’s disability.

The Autistic Child Seen as Crazy

Mother 1 addresses the issue of representation by questioning family members about the origin and condition of her child. She says: “The family was wondering what went wrong. We wondered if he was crazy; if he is mad; what have we not done and we really wanted to know what autism is”. But this mother believes that family members who call the child crazy or crazy know nothing about the issue of autism. The words of Mother 3 are in the same direction as those of Mother 1. Her child is also described as crazy or mentally disordered. “Sometimes we say he acts like a madman, we say he acts like a mental disorder”.

Child Seen as a Snake Child

As for mother 2, her verbatims on the social representation of autism are different from those of mother 1. In her environment, we speak of a snake child. “This kind of child is a snake child. It was a nurse who told me to go throw my child in the river, she is a nurse. My daughter if there is any advice I can give you, the child here, eh, it is the kind of child that should be sent back to the ancestors. You have to look for a river, you throw it there and you let it go to see the ancestors”. These words of the nurse show to what extent the Cameroonian medical profession has limits with regard to the diagnosis of autism. The representation of the disease as presented by mother 4 is similar to that of mother 2. She relates: “People always have something to say. Either the mother is a witch, or she tried to have an abortion, or she gave birth to a snake child, or she gave birth to a Mongolian child. With these words, she describes the meaning that society and culture give to the situation of her child who is autistic.

In view of the above, it can be said that autism is still poorly perceived in Cameroonian culture. Society considers children with autism to be lunatics, mentally retarded, “snake” children.

Discussion

This research was devoted to the study of the conception that Cameroonians have of autism spectrum disorders. In Africa, people with autism are sometimes perceived as idiots, victims of faults committed by their parents or other members of their family. We find that autistic children in Cameroon are perceived as crazy or “snake” children. This study is consistent with the study by Ebwel et al. [7] on social representations of autism in Africa where he refers to cultural semantics in the Democratic Republic of Congo to demonstrate that autistic children are assimilated to those with mental retardation and/or deafness. According to Lolo [8], autistic children in Cameroon are considered as “children born to die”. For her, they do not want to remain in the world of the living and disturb the family line by being born and dying several times. Parents perceive them as inhabited by an evil spirit that threatens the family. The Yoruba of Benin also call children with autism Akibus, which means “to be born and die”. They suspect them of communicating with spirits and wanting to harm their family. Children with autism are often hidden away, largely because of the stigma associated with having a child with a disability [12]. Indeed, it is shameful and unacceptable for some parents to have an autistic child. The guilt felt is amplified by the family and the neighborhood who attribute any fault to the consequence of a parental fault.

Conclusion

The aim of this study was to grasp the social and cultural representation of autism as experienced by mothers in Cameroon. Autism is a very severe developmental disorder that requires an extremely rigorous approach in the argumentation and assessment of the severity of the disorder. It is characterized by the inability of children to establish normal relationships with people and to react normally to situations. Within Cameroonian communities, children with autism are assimilated to those with mental retardation. The results of the interviews with the mothers who participated in this study show that autistic children are represented as crazy, mentally disordered, “snake” children… Therefore, it is important to raise public awareness about autism childhood in the Cameroonian context.

References

  1. Kanner L (1943) Autistic disturbances of affective contact.Nervouschild 2: 217-250.
  2. American Psychological Association (2000) Diagnostic and Statistical Manual of Mental Disorders, Fourth Edition, TextRevision (DSM-IV-TR)
  3. World Health Organization (1993) International classification of mental and behavioral disorders: clinical descriptions and diagnostic guidelines. Mason.
  4. Mbassa Menick MD (2013) Impact de la culture dans la prise en charge de l’enfant en pratiques éducative, familiale et sociale. Communication présentée aux conférences sur la semaine de l’enfance, organisée par l’Institut Français du Congo, Pointe Noire (Congo).
  5. Boyer F (2002) Reflection on the possible vulnerability of “first-born” migrant children in France.17-19.
  6. Zempleni A (1985) The child Nit Ku Bon.A traditional psychopathological picture among the Wolof and the Lebou of Senegal in L’enfant ancestre.The child Nit Ku Bon.A traditional psychopathological picture among the Wolof and the Lebou of Senegal in L’enfant ancestre 4: 9-42.
  7. Ebwel J M, Roeyers H, Devlieger P (2010) Approaches to social representations of autism in Africa.Childhood Psy 4: 121-129.
  8. Lolo B (1991) The dyad of the mother-child relationship or the care of the African child.Transition 31.
  9. Awa HDM, Um SN, Dongmo F, Chelo D, Manyinga HP N, et al. (2017) Evaluation of the Knowledge, Attitudes and Practices of Health Professionals on Autism in three Pediatric Health Facilities in Cameroon.HEALTH SCIENCES AND DISEASE 18: 1.
  10. Jarekji A (2010) Autism, a reality poorly understood by Africans.
  11. Claude G (2019) Qualitative study: Definition, techniques, steps and analysis. Scribbr.
  12. Grinker RR (2008) Unstrangeminds: Remapping the world of autism.Basic Books.

Assessing Preinjury Frailty in the Elderly Hip Fracture Patient to Promote Palliative Care Referral in Those at Risk for High Morbidity and Mortality

DOI: 10.31038/IJNM.2023423

Abstract

Objective: To assess preinjury frailty in elderly hip fracture patients as a predictor for postsurgical morbidity and mortality, prompting early referral to palliative care services in patients deemed high-risk for postoperative complications. Including palliative care in the multidisciplinary care of the high-risk patient has been shown to improve quality of life (QOL), increase patient and caregiver satisfaction, and reduce healthcare costs.
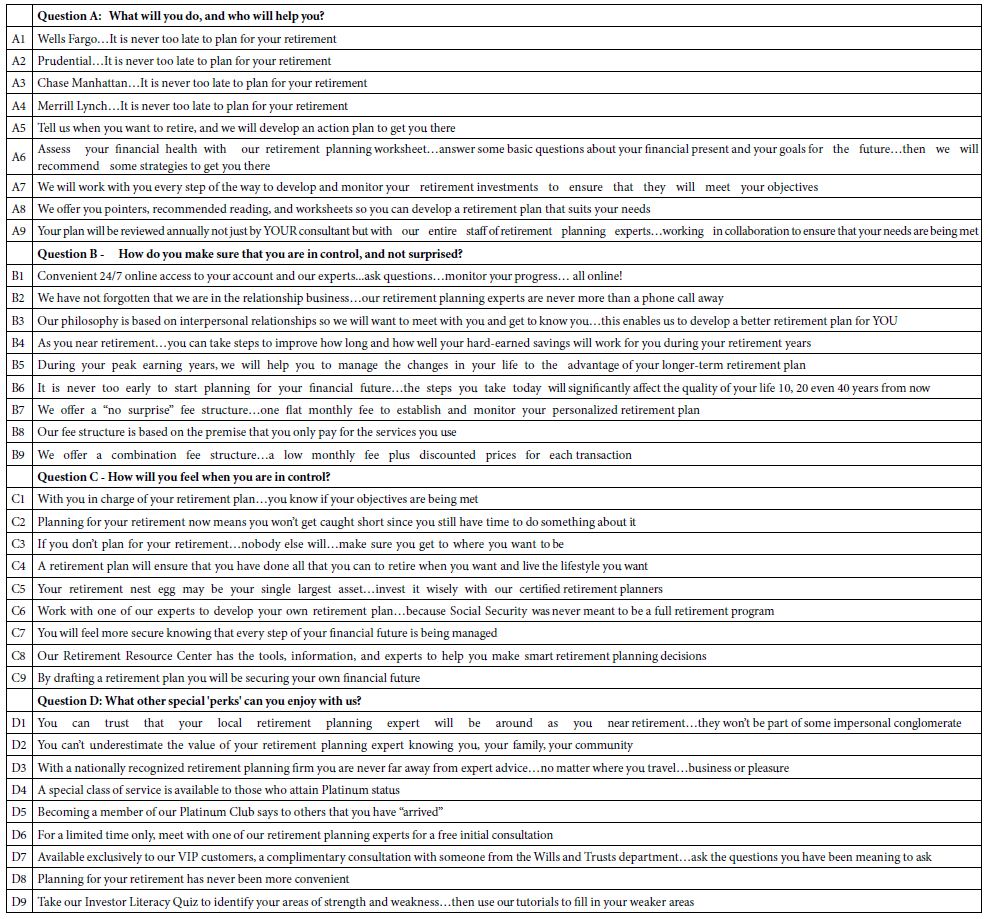
Design: The design is a quality improvement initiative.

Setting: The setting is an academic medical center, serving as the region’s Level 1 Trauma Center. There is no current process for measuring frailty as a predictor of postsurgical morbidity and mortality.

Participants: The project’s participants are elderly adults aged 65 and older presenting to the emergency room for treatment following a hip fracture.

Interventions/Measurements: A frailty measurement tool using PDSA (plan-do-study-act) cycles was selected. Next, a clinical decision-making algorithm for risk assessment and palliative care referral was designed and implemented for the project participants. Pre- and post-implementation referral rates and post-implementation risk identification and compliance with the utilization of the risk assessment tool were measured. This initiative aimed to begin preoperative frailty assessment with 50% compliance in the target population, with palliative care referral occurring per recommendations based on an algorithm.

Results: Patients in the post-implementation group were more likely to have their frailty risk evaluated and to receive a palliative care referral than the pre-implementation group. Rates of risk identification and palliative care referral increased by 68% and 85%, respectively, which surpassed the goals of this initiative.

Conclusion: Identifying patients with higher preinjury frailty can predict those at risk for mortality and morbidity, thus indicating those patients for whom palliative care referral may be beneficial. Using a standardized process for preinjury frailty screening and referral increased risk assessment and palliative care referral for elderly hip fracture patients.

Keywords

Hip fracture, Frailty, Frailty screening, Elderly, Palliative care

Introduction

In the United States, there are an estimated two million bone fractures annually [1]. These fractures account for over 432,000 hospital admissions and around 180,000 nursing home admissions [1]. Hip fractures account for 14% of these bone fractures [2], accounting for over 300,000 hospital admissions annually in the United States [3]. Hip fractures represent 72% of fracture-related medical expenses [2], with the estimated cost of hip fracture in the United States being $12-15 billion annually [4]. A low-impact trauma, such as a fall from standing, can result in a fragility fracture, with one of the most common fracture sites being the hip [5]. Fragility fractures result from a force that would not ordinarily result in a fracture [6]. In elderly patients aged 65 and older, a hip fracture is associated with high mortality [7]. Approximately 8-10% of elderly hip fracture patients die within 30 days of surgery [8]. About 20% of older women and 37% of older men die in the year following injury [9]. Hip fracture in this elderly population also increases morbidity [7]. According to Johnston et al. [9], approximately 42% of elderly hip fracture patients will fail to return to their pre-fracture mobility, and 35% will become dependent on personal assistance or an assistive device for ambulation. These patients are four times more likely to need long-term care [9]. This population is more likely to suffer complications such as deep venous thrombosis (DVT), pulmonary embolism (PE), pneumonia (PNA), infection, bleeding, nonunion/malunion, and anesthesia-related complications [10]. Hip fractures are associated with high healthcare costs, with the total annual cost estimated at $50,508 per patient in the United States [2]. Pre-fracture comorbidities are associated with even higher costs [11]. These estimates correspond to $5.96 billion yearly in healthcare spending [2].

According to Alexiou et al. [8], a hip fracture in the elderly can severely impact physical, mental, and psychological health and diminish quality of life (QOL). Due to the high morbidity and mortality associated with a hip fracture in the elderly patient, as well as the economic and caregiver burdens of the injury, early referral to palliative care should be considered to meet the holistic needs of the patient, families and the healthcare system [7]. According to Archibald et al. [12], early palliative care referral is not routinely occurring, thus missing an opportunity to improve the quality of care. Frailty is a state of increased vulnerability to illnesses or health conditions following a stressor event such as a hip fracture, thus increasing the incidence of disability, hospitalization, long-term care, and premature mortality [12]. Frailty is characterized by increased deficits and decreased strength, endurance, and physiological function [13]. These frail, elderly patients are at increased risk of adverse events such as infection, anemia, delirium, and falls [5,10]. Frailty is associated with a 29% increase in hospital costs [3]. Frailty is also associated with increased postoperative mortality [14]. Frail patients who undergo an emergent surgical procedure are 23 times more likely than robust patients to expire on postoperative day one [14]. In the elderly hip fracture population, there is a positive correlation between frailty score and incidence of 1-year mortality [15].

Problem

Many elderly hip fracture patients experience a downward health trajectory despite being without a life-threatening diagnosis [13]. Others have multiple medical diagnoses and comorbidities [13]. A severe illness or injury, such as a hip fracture, can negatively affect QOL due to the burden of symptoms, treatment, or caregiver stress [16]. “Clinical vulnerability of older adults after hip fracture is a consequence of pre-existing frailty that is worsened as a consequence of fracture-fragility, exacerbating disability and driving poorer clinical outcomes over time” [17]. According to Archibald et al. [12], a higher level of frailty in the elderly patient is associated with increased intra-operative resource and postoperative care requirements, thus increasing the length of stay (LOS) and the likelihood of being institutionalized in a long-term care facility following discharge. Even in low-risk procedures, frail patients have a greater than three times incidence of serious complications, including sepsis, pneumonia, and delirium [14,18]. The American College of Surgeons and the American Geriatrics Society recommend that frailty screening be performed as a routine preoperative assessment on patients ≥65 years of age [12]. “The ability of acute care providers to adequately prepare for, recognize and respond to the needs of frail older adults is paramount to aiding prognosis and care plan optimization” [12]. In elective surgery, frailty evaluation can be utilized to optimize preoperative function in the individual [19,20]. Conversely, for emergency or non-elective surgery, such as hip fracture repair, frailty evaluation can trigger early discussion regarding “ceilings of care…and the futility of escalating interventions after complications…” [19]. Preoperative frailty assessment can also ensure appropriate resources are available pending surgical or postsurgical complications [20]. Despite these recommendations, providers often overlook this screening [12].

Clinical Significance

The organization participating in the project is a Magnet-recognized hospital and Level 1 Trauma Center serving as the area’s academic medical center. In the project’s setting, the hospitalist group routinely admits patients who experience a hip fracture with orthopedic consultation. These patients, specifically those 65 years and older, are not routinely screened for frailty by the hospitalist or the orthopedic group. The hospitalist or orthopedic provider can assess a patient’s perioperative risk and individualized needs by incorporating routine frailty screening [14]. The Clinical Frailty Scale (CFS) is a risk stratification tool that evaluates frailty based on comorbidity, function, and cognition to assess a numerical frailty score ranging from very fit to terminally ill [21]. By incorporating a routine frailty screening, the provider can identify patients who would benefit from early palliative care consultation.

Including palliative care in the multidisciplinary care of frail, elderly hip fracture patients is appropriate as these injuries can pose a risk to QOL [22]. Palliative care providers assist with symptom management, QOL, and advanced care planning [23,24]. The palliative care team helps patients determine the best management or treatment options considering the patient’s prognosis and can assist in providing safe and effective pain management to elderly patients [23,24]. “Recent models of optimal palliative care integration emphasize referral at diagnosis, increasing presence as time progresses, and a shift in focus toward rehabilitation and survivorship care if a patient’s illness trajectory improves or toward end-of-life care and hospice referral if their trajectory declines” [24]. Palliative care is associated with lower healthcare utilization and cost savings by honoring patients’ wishes and decreasing the number of medical procedures performed [25]. Palliative care-associated savings average $2,642 per admission for patients discharged alive and $6,896 for patients who pass away during their hospitalization [26]. Despite the benefits of palliative care, this service is often underutilized in this patient population [26]. Patients not diagnosed with cancer are less likely to receive a timely referral [24]. Barriers to the utilization of palliative care occur due to a knowledge deficit on the purpose and benefits of these services [27]. Many patients and providers are uncomfortable discussing advanced directives, leaving patients open to potentially unwanted invasive procedures in an emergency [7]. Providers may be reluctant to consult palliative care to prevent loss of hope or increased fear [27]. Additionally, palliative care is frequently mistaken for end-of-life care. According to the World Health Organization (WHO), palliative care is an approach that seeks to improve the QOL of patients and their families facing life-threatening illnesses “through the prevention and relief of suffering by means of early identification and impeccable assessment and treatment of pain and other problems, physical, psychosocial, and spiritual” [16]. Radbrudh et al. [16] state that palliative care is not intended to expedite or postpone death but rather to manage symptoms. Palliative care has been shown to reduce pain symptoms and psycho-emotional stress, which correlates to higher patient satisfaction [28]. Palliative care assessment of every hip fracture patient is unrealistic due to limited resources; however, palliative care evaluation for those elderly hip fracture patients who score higher on the risk stratification scale, such as the CFS, is a practical approach [27].

Materials and Methods

This quality improvement (QI) project focuses on the principles of patient-centered care, which includes “respect for patient values, preferences, and expressed needs, coordination and integration of care, and providing emotional support alongside the alleviation of fear and anxiety associated with clinical care” [29]. Therefore, this project aims to enhance QOL by incorporating palliative care into holistic care through symptom management and patient and caregiver satisfaction [30]. These aims are accomplished by promoting open discussions regarding the goals of care and patient preferences [7].

Development of PICOT (Patient, Intervention, Comparison, Outcomes, Time) Question

The population of interest included patients aged 65 and older who had sustained a hip fracture. The primary intervention of interest was utilizing the CFS screening tool on each of these patients on admission, with a goal of at least 50% compliance with this risk assessment by the admitting provider. This intervention was compared to the current practice of not evaluating preoperative frailty in the target population, thus missing identifying those at increased risk for poor outcomes. The desired outcome included considering palliative care referrals for those who scored moderately frail and above. This project aimed to improve QOL and patient satisfaction in the target population. The project was implemented from November to December 2022, and the results were compared to the same period in 2021.

PICOT Question

In the elderly (≥years/age) hospitalized patient who experiences an acute fragility hip fracture (P), how does the implementation of the Clinical Frailty Scale (CFS) tool on hospital admission (I) compared to no frailty screening (C), increase the incidence of palliative care referral in the target population (O)?

Evidence: Review of Literature/Literature Search

A literature search was conducted with the previously mentioned PICOT question as the focus. The databases searched included PubMed and CINAHL; the search engine Google Scholar was also utilized. A PRISMA diagram (Figure 1) is included to describe the literature search. Two studies were excluded from the databases and three from the search engine due to duplication. PubMed was searched using the keywords (hip fracture AND frailty scale) and (hip fracture AND frailty). MeSH terms included the following: aged, conservative treatment, femoral fractures/therapy, femoral fractures/psychology, femoral fractures/rehabilitation, frailty/diagnosis, frailty/psychology, life expectancy, quality of life, activities of daily living, comorbidity, mobility limitation, recovery of function, walking, hip fractures/therapy, frail elderly, hip fractures/mortality, long-term care, frail elderly/statistics and numerical data, frail elderly/statistics and numerical data, decision making, hip fractures/complications, multimorbidity, and patient acceptance of health care. Boolean connectors included “Hip fracture AND frail AND mortality” and “hip fracture AND frail AND palliative care.” When limiting to publications over the past five years, PubMed revealed thirty-four studies with abstracts reviewed. Thirty-two articles were eliminated based on abstract evaluation lacking either hip fracture diagnosis or utilization of frailty scale. Two studies were retained for appraisal after being found to meet topic relevance.

fig 1

Figure 1: 1A PRISMA diagram
From : Page MJ, McKenzie JE, Bossuyt PM, Boutron I, Hoffmann TC, Mulrow CD, et al. The PRISMA 2020 statement: an updated guideline for reporting systematic reviews. BMJ 2021; 372:n71.
doi: 10.1136/bmj.n71. For more information, visit: http://www.prisma-statement.org/

CINAHL search was performed using the keywords (hip fract* AND frailty scale), (femoral neck fract* AND frailty scale), and (femoral neck fract* AND frail*). Limitations included studies from the last five years and the English language. The search revealed sixteen studies with all abstracts reviewed. Fifteen articles were eliminated, not meeting topic relevance; one was retained for appraisal. A search was conducted utilizing the Google Scholar database with the keywords “hip fracture” AND “palliative care” AND “elderly” AND “frail” AND “frailty scale.” Narrowing the studies to include the last five years and review articles revealed 23 results. Three of the studies were duplicates of a previous search. Ten articles were retained for review, and four were eliminated based on a review of the abstract; five did not contain information regarding hip fracture. One study was included for appraisal.

Evidence Synthesis

The four articles were appraised using the John Hopkins Evidenced-Based Practice Model for Nursing and Healthcare Professionals. The Research Evidence Appraisal Tool, Appendix E, was utilized for article evaluation. Each article was assigned a level and grade of evaluation, as seen in the Evaluation Table (Table 1) and Study Level and Quality Table (Table 2).

Table 1: Grade of evaluation

Article Citation

Conceptual Framework and Purpose

Design/Method

Sample/Setting

Major Variables Studied (and Their Definitions)

Measurement

Data Analysis

Findings

Appraisal: Worth to Practice

Braude, P., Carter, B., Parry, F., Ibitoye, S., Rickard, F., Walton, B., Short, R., Thompson, J., & Shipway, D. (2021). Predicting 1-year mortality after traumatic injury using the clinical frailty scale. Journal of the American Geriatrics Society, 70(1), 158-167. https://doi.org/10.1111/jgs.17472 No conceptual framework described

Aim: to determine the effect of frailty on 1-year mortality in older adults admitted following trauma

Observational study Level 1 Evidence Quality Grade A High Quality Severn Major Trauma Net-work’s major trauma center based in South West England

Patients ≥ 65 years/age admitted between Nov. 2018 and Sept. 2019 with traumatic injuries (N = 585)

DV: Mortality at 1 yearIV: Level of frailty as measured by CFS Frailty was measured by the CFS included age, sex, comorbidities, injury type and injury severity score CFSNumber deceased at 1-year f/u Median age: 81 years/old55.7% female 44.3% male 50.8% living with frailty (CFS ≥ 5) At 1-year f/u 29.6% had deceased Strengths: large sample size, easily replicated Limitations: did not include hip fracture patients, CFS scores prior to March 2019 were retro-spectively assessed.


Conclusion: Association between increasing severity of frailty and 1- year mortality (the chance of dying increased with a higher frailty score)

Note: DV: Dependent Variable, IV: Independent Variable, CFS: Clinical Frailty Scale, f/u: Follow-Up

Article Citation

Conceptual Framework and Purpose

Design/Method

Sample/Setting

Major Variables Studied (and Their Definitions)

Measurement

Data Analysis

Findings

Appraisal: Worth to

Practice

Chan, S., Wong, E. K., Ward, S. E., Kuan, D., & Wong, C. L. (2019). The predictive value of the clinical frailty scale on discharge destination and complications in older hip fracture patients. Journal of Orthopaedic Trauma, 33(10), 497- 502. https://doi.org/10.1097 /bot.000000000000 1518 No conceptual framework described

Aim: to determine if the CFS is associated with discharge destination, in-hospital complica- tions, and length of stay following hip fracture

Retrospective cohort study


Level 1 Evidence Quality Grade A High Quality

Setting: Un-named academic level 1 trauma center in Canada Sample: all patients age ≥ 65 years admitted with an isolated hip fracture (N = 423) DV1: Discharge destinationDV2: in- hospital complications

DV3: Length of stay

IV: Level of frailty as measured by CFS

Frailty was measured by the CFS

DV1 measured as either death or discharge to long-term care facility DV2 measured as presence or absence of the hospital complications DV3 measured in days of hospital admission

Data was evaluated by comparing DVs to frailty score Median age: 82.5 years/old

63.3% female

36.7% male


15.9% died or were

d/c’d to long term facility 81.8% De-veloped at least 1 compli- cation Median LOS was 7 days

Strengths: first study to examine the use of CFS to predict adverse outcomes

Limitations: small percentage of CFS scores determined in retrospect; universal health care which may affect discharge destinationConclusion: frailty is associated with adverse d/c destination, in-hospital complications and increased LOS

Note: DV: Dependent Variable, IV: Independent Variable, CFS: Clinical Frailty Scale, d/c’d: Discharged

Article Citation

Conceptual Framework and Purpose

Design/Method

Sample/Setting

Major Variables Studied (and

Their Definitions)

Measurement

Data Analysis

Findings

Appraisal: Worth to

Practice

Chen, C., Chen, C., Wang, C., Ko, P., Chen, C., Hsieh, C., & Chiu, H. (2019). Frailty is associated with an increased risk of major adverse outcomes in elderly patients following surgical treatment of hip fracture. Scientific Reports, 9(1), 1 – 9. https://doi.org/10.1038/s41598-019-55459-2 No conceptual framework described

Aim: to determine the effect of the level of frailty on post-operative

emergency room visits, readmission, and mortality

Observational cohort study

Level 1 Evidence Quality Grade A High Quality

Setting: an orthopedic ward in a medical center and a district hospital in Changhua County, Taiwan Sample: Patients ≥ 50 years treated for a hip fracture (N=245) DV1: 1-, 3-, and 6- month emergency department visits

DV2: readmission rates

DV3: mortality ratesIV: level of frailty on CFS

Frailty was measured by the CFS

DV1 measured number of emergency department visits to participating hospitals

DV2 measured as readmissions to participating hospitals due to postoperative complications

DV3 measured in number of all cause mortalities

Data was evaluated by comparing DVs to frailty score at 3 points in time of the study Prevalence of pre-frailty and frailty were markedly higher in womenFrail patients were typically older, had lower BMI, and worse cognitive function Strengths: study examined relationships adjusted for covariates

Limitations: based on subjective data, may not represent all geographical areas


Conclusion: frailty is associated with more short-term mortality; pre-frailty was more strongly associated with early ED visits and hospital readmissions

Note: DV: Dependent Variable, IV: Independent Variable, CFS: Clinical Frailty Scale, BMI: Body Mass Index

Article Citation

Conceptual Framework and Purpose

Design/Method

Sample/Setting

Major Variables Studied (and Their Definitions)

Measurement

Data Analysis

Findings

Appraisal: Worth to

Practice

Thorne, G. & Hodgson, L. (2021). Performance of the Nottingham hip fracture score and clinical frailty scale as predictors of short and long-term outcomes: A dual-centre 3-year observational study of hip fracture patients. Journal of Bone and Mineral Metabolism, 39(3), 494-500. No conceptual framework described

Aim: to report outcomes for patients with a hip fracture and compare the performance of the NHFS with the CFS

Observational cohort study

Level 1 Evidence Quality Grade A


High Quality

Setting: two non- specialist hospitals on the South Coast of England over a 3- year period from Jan. 2016 to Dec. 2018


Sample: Any patient admitted during this time frame who suffered a hip fracture (N=2,422)

DV1: Inpatient mortality

DV2: 30-day mortality

DV3: LOS

IV1: NHFS score

IV2: CFS

score

30-day mortality prediction after hip fracture with NHFS

Frailty measured by CFS Inpatient mortality and 30-day mortality were measured as a percentage

LOS measured in days

Data was evaluated by comparing inpatient mortality, 30-day mortality, and LOS based on CFS scoring and NHFS Median age: 85 years 70.6% female 29.4% male

30-day mortality: 5.8%


1-year mortality: 23.5%


Average LOS: 18.0 days

Strengths: large sample population, only study to compare NHFS and CFS in predicting mortality and \ hospital stayLimitations: 28% of patients did not have NHFS; 42% did not have CFSzConclusions:

Both CFS and NHFS are useful to predict survival rates for 1 year following injury; neither score predicted LOS

Note: DV: Dependent Variable, IV: Independent Variable, LOS: Length of Stay, NHFS: Nottingham Hip Fracture Score, CFS: Clinical Frailty Scale.

Table 2: Study Level and Quality

Article 1

Article 2

Article 3

Article 4

Level I

·                     Experimental study (RCT)

·                     Systematic Review of RCT’s

·                     Explanatory mixed method design that includes level I quant study


 Xa


 Xa


 Xa


Xa


Level II

·                     Quasi-experimental study

·                     System Review w/combination of RCTs, Quasi-exp, or quasi-exp. Only

·                     Explanatory mixed method design that includes only Level II quant study

Level III

·                     Non-experimental

·                     Systematic Review w/combination of exp./non-exp studies

·                     Qualitative study or meta-synthesis

·                     Exploratory, convergent or multiphasic mixed methods

·                     Explanatory mixed method design that includes only a level III quant study

Level IV

Opinion of respected authorities/expert committees, or consensus panels

·                     Clinical practice guidelines

·                     Consensus panels

·                     Position statements

Level V

·                     Integrative/Scoping/Literature Review

·                     QI, program, financial evaluation

·                     Case Reports

·                     Expert opinion

Note: a: High Quality; b: Good Quality; c: Low Quality or Major Flaws; Article 1: Braude et al., (2021); Article 2: Chan et al., (2019); Article 3: Chen et al., (2019); Article 4: Thorne and Hodgkin, (2021).

Table 3 includes the Synthesis Table Outcomes for each study appraised. The synthesis reveals the relationship between frailty and 1-year mortality, short-term mortality, and adverse discharge destinations, including long-term institutionalization and death, in-hospital complications, LOS, early emergency department visits, and hospital readmissions following initial injury/hospitalization. Recommendations for practice change include evaluating acute hip fracture patients ≥65 years of age on a frailty scale as a predictor tool (Table 4), thus assisting the provider in identifying patients who may benefit from palliative care consultation.

Table 3: Table of Recommendation(s) for Practice Change

Recommendation

References in Support of Recommendation

Rationale

Level of Evidence

Quality Rating

1.                   Patients ≥ 65

years of age experiencing an acute hip fracture should be screened on a CFS as a predictor for mortality.

Braude et al., (2021)


Chen et al., (2019)


Thorne & Hodgson (2021)

To identify those at risk

for 1-year or early

mortality following a

hip fracture as there is a

positive correlation

between severity of

frailty and mortality.


I


A

2.                   Patients ≥ 65 years of age experiencing an acute hip fracture should be screened on a frailty scale as a predictor for adverse discharge destinations, in-hospital complications, and increased LOS Chan et al., (2019) To identify those at risk

for adverse discharge

destinations such as

death or long-term

institutionalization, in-

hospital complications

and prolonged LOS.


I


A

Note: CFS: Clinical Frailty Scale, LOS: Length of Stay

Table 4: Table of Strength of Recommendation(s)

Recommendation

Strength of Evidence for Recommendation

References in Support of Recommendation

1. Patients ≥ 65 years of age experiencing an acute hip fracture should be screened on a CFS as a predictor for mortality.


*Strong evidence = Strongly recommend

Based on the JHEBP level of evidence and

quality ratings, strong & compelling evidence

with consistent results was found to support

organizational translation (Dang et al., 2022).


Braude et al., (2021)


Chen et al., (2019)


Thorne & Hodgson (2021)

2. Patients ≥ 65 years of age experiencing an acute hip fracture should be screened on a frailty scale as a predictor for adverse discharge destinations, in-hospital complications, and increased LOS


*Strong evidence = Strongly recommend


Based on the JHEBP level of evidence and

quality ratings, strong & compelling evidence

with consistent results was found to support

organizational translation (Dang et al., 2022).


Chan et al., (2019)


Note: CFS: Clinical Frailty Scale, LOS: Length of Stay

Theoretical/Project Framework

The Model for Improvement guides this QI project using PDSA (Plan-Do-Study-Act) cycles. Initially, project planning included researching the evidence to determine the effectiveness of the proposed intervention. The literature demonstrates that frailty screening is recommended preoperatively for patients aged 65 and older [12]. The benefits of palliative care in frail, elderly patients, regardless of diagnosis, have been established, with improved QOL, patient and family satisfaction, and healthcare costs. Secondly, the plan was formulated. The instructions regarding implementation were widely disseminated among the hospitalist APRNs. This information detailed the scope of the project and project goals, the CFS, and the benefits of including palliative care in the multidisciplinary team caring for the frail, elderly hip fracture patient. SMART (specific, measurable, achievable, relevant, and time-bound) goals describe the project’s aim. The project took place at a university teaching hospital and included the hospitalist APRNs responsible for evaluating frailty in each elderly hip fracture patient utilizing the CFS. The APRNs were then prompted to consider palliative care consultation for patients identified as moderately frail or above. The initial goal for this project was 50% or greater compliance with the use of a CFS and palliative care consultation in the specified population. Measuring progress included evaluating the electronic health record (EHR) of those patients in the target population by measuring the use of a CFS followed by suggested recommendations for palliative care consultation when appropriate. Results were assessed throughout the project implementation to guide further education and project revisions to promote compliance.

Project Design

The project was initiated on a small scale with the hospitalist APRNs performing the CFS, with tentative plans to include all hospitalist providers pending project results. Data was collected and documented. The daily hospitalist patient logs were checked for the inclusion criteria. Once these patients were identified, EHRs were reviewed for the utilization of a CFS by the hospitalist APRNs and the subsequent palliative care referral in those deemed moderately frail and above. The data results were then compared to the same patient population and time frame from one year prior. Data were evaluated to determine the effectiveness of the project.

Implementation

The patients participating in the described project were identified by age and diagnosis, including those aged 65 years and older who sustained an acute hip or femoral neck fracture and who were admitted to the medical center by a hospitalist APRN. On admission, these patients were evaluated for frailty utilizing the CFS. Palliative care consultation was recommended for those scoring moderately frail (6) or above. SWOT (strengths, weaknesses, opportunities, and threats) analysis was conducted on the projected project. Strengths identified included the support of the palliative care team and the hospitalist group. An additional strength was the recommendation of the American College of Surgeons and the American Geriatrics Society to perform frailty screening routinely preoperatively on patients ≥ 65 years [12]. A project weakness included resistance to change by providers within the hospitalist group and misconceptions regarding palliative care. There was concern among providers that frailty screening would be time-consuming and burdensome. Additionally, providers often deferred/refrained from initiating palliative care referrals for fear that their patients would give up hope in their recovery [27]. Some providers misconstrued palliative care as end-of-life care [16]. These weaknesses were mitigated by incorporating education regarding the benefits of palliative care and frailty screening.

By including palliative care providers in the care planning of these patients within the target population, this project provided opportunities for improvement in the patient’s QOL, patient and caregiver satisfaction [31], and healthcare costs [25]. The interdisciplinary care promoted by this project encouraged patient-centered care through the holistic shared management of healthcare challenges [32]. The concern about eliminating potential operative cases from the orthopedic service was a potential threat. This threat was reduced by communicating with the orthopedic team the goals of care, including promoting patient-centered care with optimal surgical recovery based on the patient’s and family’s personal preferences. Barriers identified included increased time and workload, negative attitudes towards change, and the potential for ineffective communication regarding project goals and implementation. Mitigating actions included acknowledging concerns and reinforcing project goals, benefits, patient-centeredness, and cost-effectiveness. The project’s facilitators included multidisciplinary collaborations, communication, and teamwork. The project’s hospitalist group is a large medical group within a university medical center with various expert specialties and consultants. There is excellent teamwork between the hospitalist group and consulting services, such as orthopedics and palliative care, with open communication. Team leaders from the hospitalist service supported the project.

Stakeholders and Project Team

The project team included the Doctoral of Nursing Practice (DNP) student, hospitalist APRNs, palliative care providers, the medical center’s nursing and ancillary staff, the DNP project chair, the DNP project committee member, and the statistician. This multidisciplinary team worked together to provide patient-centered and cost-effective quality care. The CFS was disseminated among the hospitalist APRNs. Instructions regarding implementation were distributed via email and in person to all hospitalist APRNs detailing the project’s scope, project goals, and the benefits of including palliative care in the multidisciplinary team caring for the frail, elderly hip fracture patient. Implementation of the project began in November 2022, with data collection and evaluation from November 1, 2022 – December 31, 2022. Pre-implementation data was also obtained from November 1, 2021 – December 31, 2021. Pre- and post-implementation data included age in years, gender, race, and time of visit. Additional post-implementation data included utilization of CFS, ranking on CFS, risk identified, and referral to palliative care if appropriate. Data was collected via the hospitalist’s daily census reports and EHR chart review. No patient identifiers were required, collected, or saved; therefore, Institutional Review Board (IRB) approval was unnecessary.

Results and Discussion

The frailty assessment was evaluated on the CFS, with frailty measured numerically from 1 (very fit) to 9 (terminally ill) [21]. A study by Rockwood et al. [33] shows a high correlation between the judgment-based CFS and the mathematically based Frailty Index (FI), with a Pearson coefficient of 0.80 and p < 0.01. There is an excellent consistency of the CFS with an experienced geriatric medicine specialist’s opinion (Cohen’s K: 0.80, p < 0.0001) [34]. There is a strong inter-rater reliability (Cohen’s K: 0.811, p < 0.001) and a strong test-retest reliability utilizing the CFS (Cohen’s K: 1.0, p < 0.001) [34]. Data collected for this project included the patient’s age, gender, race, CFS score, month of admission, eligibility, CFS used (yes/no), risk identified (yes/no), and palliative care referral (yes/no) based on findings. The total palliative care referral numbers were compared to the same data from one year prior during the same period. The goal outcome was palliative care referral for those elderly frail hip fracture patients who score moderately frail or above (CFS ≥ 6). Meeting this goal outcome represents QI, with the expected results being improved patient and family satisfaction and reduced healthcare costs.

Findings

During the pre-implementation period from November – December 2021, 24 patients met the criteria with admission by the hospitalist APRNs. Of those 24 patients, only one received a palliative care referral during their hospitalization. In comparison, during project implementation from November – December 2022, 19 patients met the same specified criteria. The CFS risk assessment was performed on 13 of these 19 patients. This number equates to 68.4% compliance with the utilization of the risk assessment tool, surpassing the goal of 50%. Seven of these 13 assessed patients were deemed less than moderately frail, scoring ≤ 5 on the CFS assessment performed by the admitting APRN. Therefore, palliative care referral was not recommended for these seven low-frailty patients. Six of these 13 patients were moderately frail or above (CSF ≥ 6). Four of these six patients with a CFS score of ≥ 6 received the recommended palliative care referral. Based on this data, there was 84.6% compliance with appropriately placed palliative care referrals. Of the 13 patients assessed for frailty, the APRNs performing the assessment appropriately followed the referral recommendations for 11 patients (Table 5).

Table 5: Results

Year

Number in specified population admitted by hospitalist APRN

Number in specified population in which CFS was utilized

Number of those assessed scoring ≥ 6 (moderately frail or above) on CFS

Number in target population receiving palliative care referral

2021

24

N/A

N/A

1

2022

19

13

6

4

Note: APRN: Advanced Practice Registered Nurse, CFS: Clinical Frailty Scale

Implications for Practice/Policy

The goal of this project is to identify those patients who are considered frail by utilizing a CFS on all hip fracture patients within the target population who are admitted to the medical center by the hospitalist service as recommended by the American College of Surgeons and the American Geriatrics Society [12]. These frail patients are considered at high-risk for complications and mortality [5,7], which may affect the patient or caregiver’s QOL due to symptom burden, caregiver stress, and complex treatment options [16]. Palliative care referral is recommended for those patients in the target population who score moderately frail and above (CFS ≥ 6). This QI project is intended to improve patient and caregiver QOL and reduce healthcare costs. Palliative care assists with symptom management and advanced care planning, promoting QOL by identifying and respecting the patient’s personal goals of care [23]. Palliative care is also associated with lowered healthcare utilization and costs, saving an average of $2,642 – $6,896 per patient by respecting the individual’s wishes regarding the plan of care [26]. The study’s strengths included the excellent collaboration between the hospitalist group and the palliative care team. Numerous studies also show the superiority of the CFS over other frailty assessments and a positive correlation between a higher frailty score and morbidity and mortality. Limitations include the small sample size and provider subjectivity of the CFS scoring. Additionally, the study only evaluated elderly patients who had sustained an acute hip fracture and did not address additional types of injuries or surgical procedures. Another limitation includes a lack of evaluation of long-term outcomes, including the patient’s perceived QOL or patient and caregiver satisfaction following palliative care consultation.

References

  1. Lewiecki ME, Wright NC, Curtis JR, Siris E, Gagel RF, et al. (2017). Hip fracture trends in the United States, 2002 to 2015. Osteoporos Int 29: 717-722.
  2. Adeyemi A, Delhougne G (2019) Incidence and economic burden of intertrochanteric fracture. JBJS Open Access 4: 1-6. [crossref]
  3. Kwak M, Digbeu B, Des Bordes J, Rianon N (2022) The association of frailty with clinical and economic outcomes among hospitalized older adults with hip fracture surgery. Osteoporos Int 33: 1477-1484. [crossref]
  4. Arshi A, Rezzadeh K, Stavrakis AI, Bukata SV, Zeegen EN (2019) Standardized hospital-based care programs improve geriatric hip fracture outcomes: An analysis of the ACS NSQIP targeted hip fracture series. J Orthop Trauma 33: e223-e228. [crossref]
  5. Pioli G, Bendini C, Pignedoli P, Giusti A, Marsh D (2018). Orthogeriatric Co-management – managing frailty as well as fragility. Inj 49: 1398-1402.
  6. Kani KK, Porrino JA, Mulcahy H, Chew FS (2018). Fragility fractures of the proximal femur: Review and update for radiologists. Skeletal Radiol 48: 29-45. [crossref]
  7. Koso RE, Sheets C, Richardson WJ, & Galanos AN (2018). Hip fracture in the elderly patients: A Sentinel event. Am J Hosp Palliat Care 35: 612-619. [crossref]
  8. Alexiou K, Roushias A, Varitimidis S, Malizos, K (2018). Quality of life and psychological consequences in elderly patients after a hip fracture: A review. Clin Interv Aging 13: 143-150. [crossref]
  9. Johnston CB, Holleran A, Ong T, McVeigh U, Ames E (2018). Hip fracture in the setting of limited life expectancy: The importance of considering goals of care and prognosis. J Palliat Med 21: 1069-1073. [crossref]
  10. Cannada LK, Mears SC, Quatman C (2020). Clinical Faceoff: When should patients 65 years of age and older have surgery for hip fractures, and when is it a bad idea?. Clin Orthop Relat Res 479: 24-27. [crossref]
  11. Allsop S, Morphet J, Lee S, Cook O (2020). Exploring the roles of advanced practice nurses in the care of patients following fragility hip fracture: A systematic review. J Adv Nurs 77: 2166-2184. [crossref]
  12. Archibald MM, Lawless M, Gill TK, Chehade MJ (2020). Orthopaedic [sic] surgeons’ perceptions of frailty and frailty screening. BMC Geriatr 20: 1-11. [crossref]
  13. Stow D, Spiers G, Matthews FE, Hanratty B (2019). What is the evidence that people with frailty have needs for palliative care at the end of life? A systematic review and narrative synthesis. Palliat Med 33: 399-414. [crossref]
  14. Nidadavolu LS, Ehrlich AL, Sieber FE, Oh ES (2020). Preoperative evaluation of the frail patient. Anesth Analg 130: 1493-1503. [crossref]
  15. Traven SA, Reeves RA, Althoff AD, Slone HS, Walton ZJ (2019). New five-factor modified frailty index predicts morbidity and mortality in geriatric hip fractures. J Orthop Trauma 33(7): 319-323. [crossref]
  16. Radbruch L, De Lima L, Knaul F, Wenk R, Ali Z, et al. (2020). Redefining palliative care – A new consensus-based definition. J Pain and Symptom Manage 60: 754-764. [crossref]
  17. Pizzonia M, Giannotti C, Carmisciano L, Signori A, Rosa G, Santolini F, et al. (2020). Frailty assessment, hip fracture and long‐term clinical outcomes in older adults. Eur J Clin Invest 51: 1-9. [crossref]
  18. Zhang X, Jiao J, Xie X, Wu X (2021). The association between frailty and delirium among hospitalized patients: An updated meta-analysis. J Am Med Dir Assoc 22: 527-534. [crossref]
  19. Dhesi JK, Lees NP, Partridge JS (2019). Frailty in the perioperative setting. Clin Med 19: 485-489. [crossref]
  20. Lee S, Nam J, Kim Y, Kim M, Choi J, et al. (2021). Predictive model for the assessment of preoperative frailty risk in the elderly. J Clin Med 10: 4612. [crossref]
  21. Church S, Rogers E, Rockwood K, Theou O (2020). A scoping review of the clinical frailty scale. BMC Geriatr 20: 1-18. [crossref]
  22. Sullivan NM, Blake LE, George M, Mears SC (2019). Palliative care in the hip fracture patient. Geriatr Orthop Surg & Rehabil 10: 1-7. [crossref]
  23. Harries L, Moore A, Kendall C, Stanger S, Stringfellow TD, et al. (2020). Attitudes to palliative care in patients with neck-of-femur fracture—A multicenter survey. Geriatr Orthop Surg Rehabil 11: 1-7. [crossref]
  24. Santivasi WL, Partain DK, Whitford KJ (2019). The role of geriatric palliative care in hospitalized older adults. Hosp Pract 48: 37-47. [crossref]
  25. Sampaio SG, Motta LB, Caldas CP (2019). Value-based medicine and palliative care: How do they converge?. Expert Rev Pharmacoecon Outcomes Res 19: 509-515. [crossref]
  26. Konda SR, Lott A, Egol KA (2020). Development of a value-based algorithm for inpatient triage of elderly hip fracture patients. J Am Acad Orthop Surg 28: e566-e572. [crossref]
  27. Davies A, Tilston T, Walsh K, Kelly, M (2018). Is there a role for early palliative intervention in frail older patients with a neck of femur fracture?. Geriatr Orthop Surg Rehabil 9: 1-6. [crossref]
  28. Flöther L, Pötzsch B, Jung M, Jung R, Bucher M, et al. (2021). Treatment effects of palliative care consultation and patient contentment. Med 100: 1-6. [crossref]
  29. Finkelman A (2022) Quality improvement: A guide for integration in nursing (2nd ed.), Jones & Bartlett Learning, Burlington, MA Chan S, Wong EK, Ward SE, Kuan D, Wong CL (2019). The predictive value of the clinical frailty scale on discharge destination and complications in older hip fracture patients. J Orthop Trauma 33: 497-502.
  30. Porter AS, Harman S, Lakin JR (2020). Power and perils of prediction in palliative care. Lancet 395: 680-681. [crossref]
  31. Flaherty C, Fox K, McDonah D, Murphy J (2018). Palliative care screening: Appraisal of a tool to identify patients’ symptom management and advance care planning needs. Palliat Care 22: E92-E96. [crossref]
  32. Poitras M, Maltais M, Bestard-Denommé L, Stewart M, Fortin M (2018). What are the effective elements in patient-centered and multimorbidity care? A scoping review. BMC Health Serv Res 18: 1-9. [crossref]
  33. Rockwood K, Song X, MacKnight C, Bergman H, Hogan D, et al. (2005). A global clinical measure of fitness and frailty in elderly people. CMAJ 173: 489-495. [crossref]
  34. Özsürekci C, Balcı C, Kızılarslanoğlu MC, Çalışkan H, Tuna Doğrul R, et al. (2019). An important problem in an aging country: Identifying the frailty via 9-point clinical frailty scale. Acta Clinica Belgica 75: 200-204. [crossref]

In the Elderly (≥65 years/age) Hospitalized Patient Who Experiences an Acute Fragility Hip Fracture, How Does the Implementation of the Clinical Frailty Scale (CFS) Tool Compared to No Frailty Screening, Increase the Incidence of Palliative Care Referral in the Target Population?

DOI: 10.31038/IJNM.2023422

Introduction

Frailty is a state of increased vulnerability to illnesses or health conditions following a stressor event such as a hip fracture, thus increasing the incidence of disability, hospitalization, long-term care, and premature mortality [1] Hip fracture is associated with high morbidity and mortality in the frail, elderly patient [2]. A hip fracture in the elderly can also severely impact physical, mental, and psychological health and diminish quality of life (QOL) [3]. Palliative care has been shown to mitigate these impacts by managing symptoms, thus improving patient QOL and patient and caregiver satisfaction [4,5].

The American College of Surgeons and the American Geriatrics Society recommend that frailty screening be performed as a routine preoperative assessment on patients ≥65 years of age [1]. A standardized assessment tool can be used to measure frailty in this patient population as a predictor of those at risk for high morbidity and mortality. The Clinical Frailty Scale (CFS) is a standardized assessment tool that measures frailty based on comorbidity, function, and cognition to assess a numerical frailty score ranging from very fit to terminally ill [6]. The CFS was used in a quality improvement study to measure frailty in this patient population. The study recommended palliative care consultation for those who scored moderately frail or above.

Including palliative care in the multidisciplinary care of frail, elderly hip fracture patients is appropriate as these injuries can pose a risk to QOL [7]. Palliative care providers assist with symptom management, QOL, and advanced care planning [4,5]. The palliative care team helps patients determine the best management or treatment options considering the patient’s prognosis and can assist in providing safe and effective pain management to elderly patients [4,5]. This quality improvement initiative demonstrated the correlation between implementation of a frailty assessment on this patient population and the increase in palliative care consultations. Further studies are needed to evaluate the impact of frailty screening and subsequent palliative care inclusion on symptom management, QOL, and patient and caregiver satisfaction.

References

  1. Archibald MM, Lawless M, Gill TK, Chehade MJ (2020) Orthopaedic [sic] surgeons’ perceptions of frailty and frailty screening. BMC Geriatr 20: 1-11. [crossref]
  2. Koso RE, Sheets C, Richardson WJ, Galanos AN (2018) Hip fracture in the elderly patients: A Sentinel event. Am J Hosp Palliat Care 35: 612-619. [crossref]
  3. Alexiou K, Roushias A, Varitimidis S, Malizos, K (2018) Quality of life and psychological consequences in elderly patients after a hip fracture: A review. Clin Interv Aging 13: 143-150. [crossref]
  4. Harries L, Moore A, Kendall C, Stanger S, Stringfellow TD, Davies A, et al. (2020) Attitudes to palliative care in patients with neck-of-femur fracture—A multicenter survey. Geriatr Orthop Surg Rehabil 11: 1-7. [crossref]
  5. Santivasi WL, Partain DK, Whitford KJ (2019) The role of geriatric palliative care in hospitalized older adults. Hosp Pract 48: 37-47. [crossref]
  6. Church S, Rogers E, Rockwood K, Theou O (2020) A scoping review of the clinical frailty scale. BMC Geriatr 20: 1-18. [crossref]
  7. Sullivan NM, Blake LE, George M, Mears SC (2019) Palliative care in the hip fracture patient. Geriatr Orthop Surg & Rehabil 10: 1-7. [crossref]

Big Data vs. Big Mind: Who People ARE vs. How People THINK

DOI: 10.31038/IMROJ.2023814

Abstract

This paper presents a new approach to understanding Big Data. Big Data analysis allows to better hypothesize regarding what people think more about certain issues by extracting information on how people move around, what interests them, what the context is, and what do they do. We believe, however, by allowing users also to answer simple questions their interests can be captured more accurately, as the new area of Mind Genomics tries to do. It introduces the emerging science of Mind Genomics as a way to profoundly understand people, not so much by their mind as by the pattern of their reactions to messages. Understanding the way nature is, however, does not suffice. It is vital to bring that knowledge into action, to use the information about a person’s mind in order to drive behavior, i.e., to put the knowledge into action in a way that can be measured. The paper introduces the Personal Viewpoint Identifier as that tool and shows how the Viewpoint Identifier can be used to evaluate entire databases. The paper closes with the vision of a new web, Big Mind analyzing huge amounts of data, where the networks developed show both surface behavior that can be observed, and deep, profound information about the way each individual thinks about a variety of topics. The paper presents a detailed comparison with the Text Mining approach to Big Data in order to understand the advantages of understanding the ‘mind’ beneath the observed behavior in combination with the observed behavior. The potential ranges from creating personalized advertisements to discovering profound linkages between the aspects of a person and the mind of the person.

Introduction

When we look at networks, seeking patterns, we infer from the behaviors and the underlying structure what might be going on in the various nodes. We don’t actually communicate with the nodes; they’re represented geometrically as points of connection. Analytically, we can look at behavior, imposing structural analysis on the network, looking at the different connections—the nodes, the nature of what’s being transacted, and the number and type of connections. By doing so, we infer the significance of the node. But, what about that mind in the node? What do we know? What can we know? And more deeply, is that mind invariant, unchangeable, reacting the same way no matter what new configurations of externalities are imposed?

These are indeed tough questions. The scientific method teaches us to recognize patterns, regularities, and from those patterns to infer what might be going on, both at the location and by the object being measured, the object lying within the web of the connections. Mathematics unveils these networks, different patterns, in wonderful new ways, highlighting deeper structures, often revealing hitherto unexpected relations. Those lucky enough to have programs with false colors see the patterns revealed in marvelous reds, yellows, blues, and the other rainbow colors, colors which can become dazzling to the uninitiated, suggesting clarity and insight which are not really the case. The underlying patterns are clearly not in color, and the universe does not appear to us so comely and well-colored. It is technology which colors and delights us, technology which reveals the secrets.

Now for the deeper question, what lies beyond the network, the edges, inside the nodes, inside the mind lying in the center of a particular connection? Can we ever interrogate a node? Can we ever ask a point on a network to tell us about itself? Does the point remain the same when we shift topics, so the representation is no longer how the nodes interact on one day, but rather interact on another day, or in another situation?

Understanding the environment where a business occurs requires collecting and analyzing massive amount of data related to the potential clients; what they think about the offered products and the level of satisfaction for the offered services/products. The problem of understanding the mind of potential clients is not new; it has been on the focus of marketing researchers for some time to mention a few. One of the most prominent tools to be used for this purpose is text mining, defined as a process to extract interesting and significant patterns to explore knowledge from textual data sources. Usually, the collected data are unstructured, i.e., collected from blogs, social media, etc. As the amount of unstructured data collected by companies is constantly increasing, text mining is gaining a lot of relevance [1-7].

Text mining plays a significant role in business intelligence, helping organizations and enterprises to analyze their customers and competitors to make better decisions. It also helps in telecommunication industry, business and commerce applications and customer chain management system.

Usually, text mining combine discovery, text mining techniques, decoding, and natural language processing techniques. The most important elements of this approach are powerful mining techniques, visualization technologies and an interactive analysis environment to analyze massive sets of data so as to discover information of marketing relevance [8,9].

In the world of today, a number of studies suggest that that the efforts to create a technology of text mining have as yet fallen short. Today’s (2020) reality in text mining suggest that the effort has performed not as well as was hoped, neither in terms of explicit hopes and predictions, nor the vaster implicit hopes and predictions. Companies which have applied automated analysis of textual feedback or text mining have failed to reach their expectations. emphasize just how hard text mining can be. Research in the area of natural language processing (NLP) encounters a number of difficulties due to the complex nature of human language. Thus, this approach has performed below expectations in terms of depth of analysis of customer experience feedback and accuracy [10].

There are specific areas of disappointment. For example, major obstacles have been encountered in the field of predicting with accuracy the sentiment (positive/negative/neutral) of the customers. Despite what one might read in the literature of consumer researchers and others employing text mining for sentiment analysis, the inability to successfully address these issues has disillusioned some. Some of the disillusionment is to be expected because sentiment analysis must be sensitive to the nuances of many languages. Feelings expressed by words in one language may not naturally translate when the words are translated. Only a few tools are available that support multiple languages. It may be that better feedback might actually be obtained with structure systems, such as surveys.

In this paper we propose a new approach to understand Big Data from the point of view of understanding the mind of the person who is a possible ‘node.’ We operationally define the world as a series of experiences that might be captured in Big Data, and for each experience create a way of understanding the different viewpoints or mind-sets of the persons undergoing that experience. The effect is to add a deeper level to Big Data, moving beyond the patterns of what are observed, to the mind-sets of the people who undergo the experience. In effect, the approach provides a deeper matrix of information, more two dimensional, the first being the structure of what is being done (traditional Big Data), and the second being the mind-set of the person(s) reacting to this structure. In essence, therefore, a WHAT and the MIND(s) behind the WHAT. We conclude with the prospect of creating that understanding of the MIND by straightforward, affordable experiments, and a tool (Personal Viewpoint Identifier) which allows one to understand the mind of any person in terms of the relevant action being displayed.

Moving from Analysis of an Object to Interrogating It

We move now from analysis of an object in a network to actually interrogating the object in order to understand it from the inside, to get a sense of its internal composition. The notion here is that once we understand the network as externalities and understand deep mind properties of the nodes in the network, the people, we have qualitatively increased the value of the network by an order of magnitude. We not only know how the points in the network, the people, react, but we know correlates of that reaction, the minds and motivations of these points which are reacting and interacting.

Just how do we do that when we recognize that this mind may have opinions, that the mind may have a desire to be perceived as politically correct, and that, in fact, this mind in the object may not be able to tell us really what’s important? How do we work with this mind to find out what’s going on inside?

It is at this juncture that we introduce the notion of Mind Genomics, a metaphor for an approach to systematically explore and then quantitatively understand how things are perceived by person(s) using the system. The output of that understanding comprises content (the components of this mind), numbers (a way to measure the components of the mind), and linkages (the assignment of the content and its numbers to specific points, nodes, people in the network) [11,12].

A Typical Problem – What Should the Financial Analyst Say to Convince a Prospect to Commit?

Lest the foregoing seem to be too abstract, too esoteric, too impractical, let’s put a tangible aspect onto the idea. What happens when the point or node corresponds to a person walking in to buy a financial retirement product from a broker whom the person has never met? How does this new broker understand what to say to the person at the initial sales interaction, that first ‘moment of truth’ when there is a chance for a meaningful purchase to occur? And what happens when the interaction occurs in an environment where the financial consultant or salesperson never even meets the prospective buyer, but rather relies upon a Web site, or a simple outward-bound call-center manned by non-professionals?

The foregoing paragraph lays out the problem. We have our network, nodes connected by the sales activity. By understanding the mind of the prospective customer, the financial analyst has a much greater chance of making the sale, in contrast to simply by knowing the age, gender, family situation, income, and previous Web searching behavior—of the prospect, all available from Big Data and grist for the analytic mill. We want to go deeper, into the mind of that prospect.

Psychologists and marketers have long been interested in understanding what drives a person to do something, the former (along with some philosophers) to create a theory of the mind, the latter to create products and services, and sell them. We know that people can articulate what they want, describe to an interviewer the characteristics of a product or service that they would like, often just sketchily, but occasionally in agonizing detail. And all too often this description leads the manufacturer or the service supplier on a wild-goose-chase, running after features that people really don’t want, or features which are so expensive as to make the exercise simply one of wish description rather than preparation for design.

A more practical way runs an experiment presenting the person, this node in the system, with different ideas, different descriptions about a product, obtains ratings of the description, and then through statistical modelling, discovers those specific elements in the description which link to a positive response. In other words, run an experiment treating this node, this point in a network, as a sentient being, not just as something whose behavior or connections are to be observed as objective, measurable quantities. Looking at the network as an array of connected minds, not connected points, minds with feelings, desires, and opinions, will enrich us dramatically in theory and in practice.

The experiment, or better the paradigm of Mind Genomics, is rather simple. We use a paradigm known as Empathy and Experiment, empathy to identify the ‘what,’ the content, and experiment to identify the values, the ‘important’ [13].

Our strategy is simple. We want to add a new dimension to the network by revealing the mind of each nodal point. To do so requires empathy, understanding the ‘what,’ and experiment, quantifying the amount, revealing the structure. Putting the foregoing into operational terms, we will identify a topic area relevant to the node, the person, uncover elements or ideas appropriate to the topic, and then quantify the importance of each element. After Empathy uncovers the raw materials, the elements, Experiment mixes and matches these elements into different combinations, obtains ratings of the combinations, and then estimates how the individual elements in the combination drive the response.

The foregoing paragraph described an experiment not a questionnaire. Rather, we infer what the person, the node, wants by the pattern of responses and from behavior we determine what elements produce positive responses and what elements produce negative responses [14].

Putting the Emerging Science of Mind Genomics into Action – Setting Up a Study and Computing Results

The best way to understand the concepts of Mind Genomics, its application to knowledge and to networks, is through an illustration. This paper presents the application of Mind Genomics to create a micro- science about choosing a financial advisor for one’s retirement planning. The case history shows the input and practical output of Mind Genomics, how a financial advisor can understand the mind and needs of a customer, identifying the psychological mind-set and relevant points from the very beginning of the interaction. A sense of the process can be obtained from Figure 1. The paper will explicate the various steps, using actual data from a Mind Genomics experiment.

fig 1

Figure 1: The process of Mind Genomics, from setup to analysis and application. Figure courtesy of Barry Sideroff, Direct Ventures, LLC.

To create and to apply the micro-science we follow the steps below. Although the case history is particularized to selecting a financial advisor, the steps themselves would be followed for most applications. Only the topic area varies.
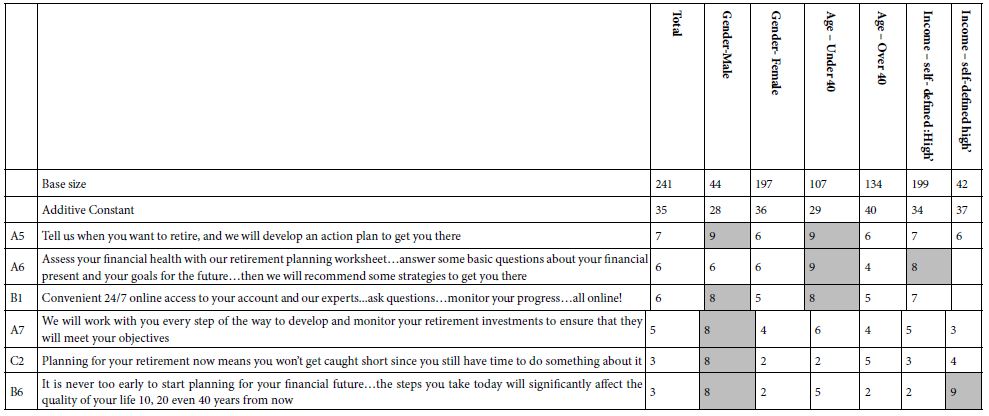
  1. We begin by defining the topic. We also specify the qualifications for the consumer respondents, those who will be part of what might initially look like a Web-based survey, but in reality, will participate in what constitutes a systematic experiment. For our study, the focus is on the interaction of the financial advisor with the consumer, with the specific topic being the sales of retirement instruments such as annuities. The key words here are focus and granularity. Specificity makes all the difference, elevating the study from general knowledge to particulars. Granularity means that the data provide results that can be immediately applied in practice.
  2. Since our focus here is on the inside of the mind, what motivates the person to listen to the introductory sales message of the financial planner, we will use simple phrases, statements that a prospective client of the financial analyst is likely to hear from the analyst himself or read in an advertisement. Table 1 presents the set of 36 elements divided into four questions (silos, categories), each question comprising exactly nine answers (elements.) The silos are presented as questions to be answered. This study used a so-called 4×9 matrix (four questions, nine answers per question.) The elements are short, designed to paint a word-picture, and are ‘stand-alone.
  3. A set of 36 elements covers a great deal of ground and typically suffices to teach us a lot about the particular minds of the participants, our respondents, or nodes in a web. The particular arrangement of four silos and nine elements is only one popular arrangement of silos and their associated elements. An equally popular arrangement is 6×6, six silos with six elements in Recent advances have shown good results with a much smaller set of 16 elements, emerging from four questions, each with four answers (four silos, four elements).
  4. Create vignettes, systematically varied vignettes (combinations). The 4×9 design requires 60 different vignettes. Each respondent will evaluate a completely different set of vignettes, enabling Mind Genomics to test a great deal of the possible ‘design’ space of potential combinations. Rather than testing the same 60 vignettes with many respondents, the strategy of testing different combinations tests more of the possible combinations. The pattern emerges with less error, even though each combination is tested by one, at most two respondents.


  5. The combinations, vignettes called profiles or concepts in other published work, comprise 2-4 elements, each element appearing five times. The elements appear against different backgrounds since all the elements vary from one vignette to another. The underlying experimental design, a recipe book controls which particular elements appear in each vignette. Although to the untutored eye the 60 different vignettes appear to be simply a random, haphazard collection of elements with no real structure, nothing could be further from the truth. The experimental design is a well-thought-out mathematical structure ensuring that each element appears independently of every other element, repeated the same number of times across each element., This allows us to deconstruct the response to the 60 test vignettes into the individual contribution of each element. Statistical analysis by OLS, ordinary least- squares regression, will immediately reveal which elements are responsible for the rating and which simply go along, not contributing anything.
  6. We see an example of a vignette in Figure 2A, program sets up the vignettes remotely on the respondent’s computer, presents each vignette, and acquires the rating. The bottom of the vignette shows the rating scale for the vignette. The respondent reads the vignette in its entirety and rates the vignette on the scale. The interview is relatively quick, requiring about 12 minutes for the presentation of the vignettes followed by a short classification questionnaire. The process is standardized, easy, disciplined, and quite productive in terms of well-behaved, tractable data that can be readily interpreted by most people, technical or non-technical alike. As long as the respondent is at least a bit interested and participates, the field execution of the study with respondents is straightforward. The process is automatic from the start of the experiment to the data analysis, making the system scalable. The experiment is designed to create a corpus of knowledge in many different areas, ranging from marketing to food to the law, education, and government. It is worth noting that whereas the 60 vignettes require about 12 minutes to complete, the shorter variation, the 4×4 with 24 vignettes, requires only about 3 minutes.
  7. The original rating scale that we see at the bottom of the vignette in Figure 2 is a Likert scale, or category scale, an ordered set of categories representing the psychological range from 1 (not at all interested) to 9 (very interested). For our analysis we simplify the results, focusing on two parts of this 9-point scale, with the lower part (ratings 1-6) corresponding to not interested and the upper part (ratings 7-9) corresponding to interested. We re-code ratings of 1-6 to the number 0 and ratings of 7-9 to the number The recoding loses some of the granular information, but the results are more easily interpreted. Although the 9-point scale provides more granular information, the reality is that managers focus on the yes/no aspect of the results.
  8. The Mind Genomics program also adds a vanishingly small random number to each newly create binary value, in order to ensure that the OLS (ordinary least-squares) regression does not crash in the event that a respondent assigns all vignettes ratings 1-6, or ratings 7-9, respectively. In that case, the transformed binary variables are all 0 or 100, respectively, and the random number adds need variability to prevent a ‘crash.’ The 60 vignettes allow the researcher to create an equation for each respondent Building the model at the level of the individual is a powerful format of control, known to statisticians as the strategy of ‘within- subjects design.’
  9. Some of the particulars underlying the modelling are:

a. The models are created at the level of the individual respondent, using the well-accepted procedure of OLS, ordinary least squares regression.

b. The experimental design ensures that the 36 elements are statistically independent of each other so that the coefficients, the impact values of the elements, have absolute value. The inputs are 0/1, 0 when the element is absent from a vignette, 1 when the elements is present in the vignette.

c. OLS uses the 60 sets of elements/ratings, one per vignette, as the cases. There are 36 independent variables and 60 cases, allowing sufficient degrees of freedom for OLS to emerge with robust estimates

d. We express the equation or model as: Binary Rating = k0 + k1(A1) + k2(A2)…k36(D9). For the current iteration of Mind Genomics, we estimate the additive constant k0, the baseline. Future plans are to move to the estimation of the coefficients, but ‘force the regression through the origin’, viz., to assume that the additive constant is 0.

e. The equation says that the rating is the combination of an additive constant, k0, and weights on the elements. The elements appear either as 0 (absent) or as 1 (present), so the weights, k1 – k36, show the driving force of the different elements.

Table 1: The raw material of Mind Genomics, elements arranged into four silos, each silo comprising nine elements.

tab 1

Understanding the Result Through the Additive Constant and the Coefficients

We now look at the strongest performing elements from the equation or model which relates the presence/absence of the elements to the transformed binary rating of 0 (not interested) or 100 (interested). The strongest performing elements appear in Table 2. The table shows all elements which generate an impact value or coefficient 8 or higher for any key subgroup, whether total sample, gender, age, or income, respectively.

  1. The total panel comprises 241 respondents. We can break out the total panel in self-defined subgroups, e.g., gender, age, and income. That information is available from the self-profiling classification, a set of questions answered by the respondent after the respondent rated the set of 60 vignettes.
  2. The additive constant tells us the conditional probability of a person saying interested in what the financial advisor has to say, i.e., assigns a rating of 7-9, when reading a vignette which has no elements (the baseline). Of course, by design all vignettes comprise elements, so the additive constant is an estimated We can use the additive constant as a baseline. For the total panel it is 35, meaning that 35% of the respondents would rate a vignette 7-9. Males are less likely to be positive whereas females are more likely to be positive (additive constants of 28 vs. 36). Those under 40 are far less likely to be positive, those over 40 are more likely to be positive (additive constant of 29 vs. 40). Income makes no difference.
  3. Beyond the baseline are the elements, which contribute to the total. We add up to four elements to the baseline to get an estimated total value, i.e., the percent of respondents who say that they would be interested in the vignette about the financial consult were the elements to be part of the advertising.
  4. To allow patterns to emerge the tables of coefficient show only those positive coefficients of +2 or higher, drivers of interest. Negative coefficients are not shown.
  5. The coefficients for the 36 elements are low. Table 2 shows the strongest elements only, and only elements which generate a coefficient or impact value of +8 for at least one subgroup. We interpret that +8 to mean that when the element is incorporated into the advertising vignette at least 8% more people will rate the vignette 7-9, i.e., say ‘I’m ’ The value +8 has been observed in many other studies to signal that the element is ‘important’ in terms of co-varying with a relevant behavior. Thus, the value +8 is used here, as an operationally defined value for ‘important.’
  6. Our first look into the results suggests nothing particularly strong emerges from the total sample. We do see six elements scoring well in at least one subgroup. However, we see no general pattern. That is, we don’t see an element working very well across the different groups. Furthermore, reading the different elements only confuses us. There are no simple patterns.
  7. Our first conclusion, therefore, is that the experiment worked at the simple level of discovering what is important, and what is not important. We are able to develop elements, test combinations, deconstruct the combinations, and identify winning The experiment, at least thus far, does not reveal to us deeper information about the mind(s) of the respondent. We will find that deeper information when we use clustering in the next section to identify mind-sets.

Table 2: Strong performing elements for the Total Sample and for key subgroups defined by how the respondent classifies himself or herself. The table presents only those strong-performing elements with average impacts of 8 or higher in at least one self-defined subgroup.

tab 2

Deeper, Possibly More Fundamental Structures of the Mind by Clustering

Up to now we have looked at people as individuals, perhaps falling into convenient groups defined by easy-to-measure variables such as gender, age, income. We could multiply our easy-to-measure variables by asking our respondents lots of questions about themselves, about their attitudes towards financial investors, about their feelings towards risk versus safety, and so forth. Then, we could classify the respondents by the different groups to which they belong, searching for a possible co-variation between group membership and response pattern to elements (Table 3).

Table 3: Performance of the strongest elements in the three mind-sets. emerging from the cluster analysis. People in MS1 appear to be the target group to be identified as the promising clients for the financial advisor.

tab 3

The just-described approach typifies the conventional way of thinking about people. We define people as belonging to groups and then search out the linkage between such groups and some defined behavior. Scientists call this strategy the hypothetico-deductive method, beginning first with a sense of ‘how the world might work,’ and then running an experiment to confirm, or just as likely, to falsify that hypothesis. We work from the top down, thinking about what might happen and proceeding merrily to validate or reject that thinking.

Let’s proceed in a different manner, without hypothesizing about how the world works. Let’s proceed with the data we have, looking instead for basic groups who show radically different, interpretable patterns. In the world of color this is analogous to looking for the basic colors of the spectrum, red, yellow, blue, which must emerge out of the measured thousands of colors of flowers. Let’s work from the bottom up, in a more pointillistic, empirical fashion, emulating Francis Bacon in his Novum Organum.

How then do we do this? How do we find naturally occurring groups of people in a specific population who show different patterns of behavior or at least responses for the micro, limited area? That is, we are working with a small corner of reality, one’s responses to messages about choosing a financial advisor. It’s a limited aspect of reality. How is that reality constituted? Are there different groups of minds out there, groups wanting different features? Are these groups of minds interpretable? To continue with the aforementioned metaphor, can we find the basic colors for this aspect of reality, the red/blue/yellow, not of the whole world, but the red/blue/yellow of choosing a financial advisor?

That we have limited our focus to the limited, micro area of messaging for client acquisition by a financial advisor makes our job easier:

  1. We are working in a corner, nook, a little region of reality. That small region is, however, quite granular. We already have rich material produced by our study. Our study with 36 elements and 241 profiles of impact values tells us how 241 individuals value the individual elements.
  2. Focusing only on that small wedge of reality, let us see whether there is a deeper structure, focusing only on the reality of choosing a financial advisor and using only the mind of the consumer as a way to organize reality. Continuing our metaphor of colors, we have come upon a new limited aspect of
  3. What are the basic dimensions of that new, limited aspect of reality? We have only two ground Parsimony and Interpretability, respectively Ground Rule 1, Parsimony: We should be looking for primaries, the fewer the better, for this new aspect of reality, our mind of selecting the investment advisor. Ground Rule 2, Interpretability: We must be able to interpret these primaries in a simple way. They must make sense, must tell a story.
  4. The foregoing introduction leads us naturally to our data, our 241 rows (one per respondent), and our 36 columns (one per element). The numbers in the 36 columns are the 36 coefficients from the model relating the presence/absence of the 36 elements to the binary transformed rating. We apply the method of cluster analysis to our 241 rows x 36 columns. We do not incorporate the additive constant into our cluster analysis, because it doesn’t give us information about the response to particular elements, the focus of the cluster analysis.
  5. Cluster analysis puts our 241 respondents first into two groups, then into three groups, then into four groups, and so forth. These are clusters, which we can call mind-sets or viewpoints because they represent different viewpoints that people have about what is important in the interaction with a financial advisor. Furthermore, the word ‘viewpoint’ emphasizes the psychological nature of the cluster, that we are dealing with the mind here, the mind as it organizes one small corner of reality, the interaction with a financial advisor.
  6. We end up with a solution suggesting three different viewpoints, as Table 3 shows. These three viewpoints are shown and named by virtue of the strongest performing elements in each viewpoint. The additive constants, our baselines, lie in the small range, and are fairly low in magnitude, 30-40. There is no mindset just ready to spring to attention, willing to buy the services of the financial advisor. That ready-to-act mind-set would be identified by a high additive constant.
  7. The total sample shows no strong elements. This means that without any knowledge of the mind of the prospect it’s unlikely that someone will know what to say, or the right thing to say. Perhaps the strongest message, with a coefficient of +7 (an additional 7% interested in working with the advisor) is the phrase: Tell us when you want to retire, and we will develop an action plan to get you there.
  8. The real differences come from the elements as responded to by the individuals in the different mind-sets. Our most promising group is Mind-Set 1, comprising 70 of our 241 respondents, or 28%. Use the six strong performing elements and one is likely to win over these respondents.
  9. If nothing else but the data in Table 3 are known, how might the salesperson ‘know’ that she or he is dealing with a prospect from Mind-Set 1, versus knowing that the person is in Mind-Set 2 or Mind- Set 3, the less promising mind-sets, the ones harder to convince? Table 3 simply tells us what to say, precisely, once we find the people, a major advance over knowledge that we began with, but not the whole story. It will be our job to assign a new person with some confidence to one of the three mind-sets, in order to proceed with the sales effort. Hopefully, most of the prospects will belong to Mind-Set 1.

fig 2

Figure 2: An example of a test vignette. The elements appear in a centered format with no effort to connect the elements, a format which enhances ‘information grazing.’ The vignette shows the ratings scale at the bottom, and the progress in the experiment at the top right (screen 15 out of 60).

Finding Viewpoints (Minds) in a Population

The foregoing results suggest that we might have significantly more success focusing on the group of people who are most ready to work with the financial advisor. But how do we find these people in the population? The analysis is data analytics, but exactly what should be done? And, in light of the enormous opportunities available to those who can consistently identify these mind-sets and then act on the knowledge, how can we create an affordable, scalable, ‘living’ mind-set assignment technology?

We walk around with lots of numbers attached to us. Data scientists can extract information about us from our tracks, whether these tracks are left by our behavior (e.g.. websites that we have visited), by forms that we have filled out and are commercially purchasable (e.g., through Experian or Trans Union or any of the other commercial data providers, by loyalty programs, etc.), or even by questionnaires that respondents complete in the course of their business transactions, medical transactions, and so forth.

All of the available data, properly mined, collated, analyzed, and reported, might well tell us when a person is ready to hire a financial advisor, e.g., upon the occasion of marriage, a child, a promotion, a job change, a move to another city, and so forth. But just what do we say to this particular prospect, the person standing before us in person, or interacting with our website, or even sitting at home destined to be sent a semi-impersonal phone message, email, or letter? In other words, and more directly, What are the precise words to say to this person?

Those in sales know that an experienced salesperson can intuit what to say to the prospect. Perhaps the answer is to hire only experienced, competent salespeople, with 20 years of experience. After the first 100 or them are hired, what should be done with the millions of salespeople who need a job, but lack the experience, the intuition, and the track of successes, and who are perhaps new to the workforce? In other words, how do we scale this knowledge of the mind of people, so that everyone can be sent the proper message at the right time, whether by a salesperson or perhaps even by e-commerce methods, by websites instead of salespeople?

The foregoing results in Table 3 show us what to say and to whom, especially to Mind-Set 1.. The problem now becomes one of discovering the mind-set to which a specific person belongs. Unfortunately, people do not come with brass plates across their foreheads telling us the viewpoints to which that person belongs. And there are so many viewpoints to discover for a person, as many sets of viewpoints as there are topic areas for Mind Genomics. The bottom line here is that data scientists working with so-called Big Data might be able to infer that a person is likely to be ready for a financial advisor, but as currently constituted, the same Big Data is unlikely to reveal the mind-set to which the individual person belongs. We have petabytes of data, reams of insights, but not the knowledge, the specificity about the way the mind works for any particular, limited, operationally defined topic in the reality of our experience.

We move now to the second phase of our work reported here, discovering the viewpoint to which any person belongs. We have already established the micro-science for the financial planner, the set of phrases to use for each of the three mind-sets uncovered and explicated in a short experiment. We know from our 241 respondents the mind-set to which each person belongs, having established the mind-sets and individual mind-set membership in the group membership by used cluster analysis. How then do we identify any new person, anywhere, as belonging to one of our three mind-sets, and thus know just what to say to that person?

In today’s computation-heavy world one might think that the best strategy is to ‘mine’ the data with an armory of analytic tools, spending hours, days, weeks, months attempting to figure out the relation between who a person is, and what to say, in this small, specific, virtually micro-world. Once that computation is exhausted, there may be some modest covariation between a formula encompassing all that is known about a person and membership in the mind-set. A simpler way, developed by authors Gere and Moskowitz, called the PVI (personal viewpoint identifier), does the same task in minutes, at the micro-level, with modest computer resources, and with the same granularity as the original Mind Genomics study from which the mind-sets emerged.

In simple terms, the PVI works with the data from the Mind Genomics study, viz., the specific information from which the mind-sets emerged. The PVI system perturbs the data, using a Monte-Carlo system, and over 20,000+ runs, identifies the combinations of elements which best differentiate among the segments. The PVI emerges with six elements, all taken from the original study, and with a two-point rating scale. The pattern of responses to the six questions assigns a new person to one of the three (or two) mind- sets.

Figure 2 shows an example of the introduction to the PVI, which asks for information from the respondent. It will be this information which allows the user of the PVI to create a database of ‘minds-sets’ of people for future research and marketing efforts. Furthermore, the introduction to the PVI has information about the time when the PVI is being completed (important for future work on best contact times), age, gender, etc. The specific questions can be included or suppressed, depending upon the type of information that will be necessary when the PVI is used (viz., research on the time-of-day dependence of mind-sets, if it actually exists.) As of this writing (2023)the PVI can be accessed at: https://www.pvi360.com/TypingToolPage.aspx?projectid=213&userid=2018.

Figure 3 shows the actual PVI portion, comprising three questions about one’s current life-stage (what is one thinking about in terms of retirement planning), and then six questions designed to assign the new person to one of the three mind-sets. It is important to realize that instead of requiring weeks and heavy computation, the entire process, from the set-up of the PVI to the deployment, is approximately 20 minutes. Like the work to set up a Mind Genomics experiment, system to create a PVI for that study is ‘templated’, making it appropriate for ‘industrial strength’ data acquisition. Several studies can be incorporated into one PVI, with studies randomized, and questions randomized, each study or project requiring only six questions, developed from the elements. The process is automatic and can be deployed immediately with thousands of participants within the hour.

fig 3

Figure 3: Introductory page to the PVI (personal viewpoint identifier

Figure 4 shows the feedback emerging immediately from the PVI. The shaded cell shows the mind-set to which the respondent belongs. The PVI stores the respondent’s background information (Figure 2) and mind-set information (Figure 4) in a database. Furthermore, the PVI is set up to send the respondent immediately to a website, or to show the respondent a video relevant to the mind-set to which the respondent has been assigned by the PVI (see Figure 5). Thus, the Mind Genomics system comprising knowledge acquisition by a small, affordable experiment, coupled with the PVI, expands the scope of Mind Genomics so that the knowledge of mind-set membership can be deployed among a far greater population, those who have been assigned to a mind-set by the PVI.

fig 4

Figure 4: The actual PVI for the study, showing three up-front ‘questions’ about one’s general attitude, and then six questions and a 2-point response scale for each, used to assign the person to one of the three mind-sets.

fig 5

Figure 5: Immediately feedback about mind-set membership

Evolving into BIG MIND – The Nature Marriage of PVI-enhanced Mind Genomics with Big Data

Up to now we have been dealing with small groups of individuals whose specific mind-sets or viewpoints in a specific, limited topic area we can discover, and then act upon. But what are we to do when we want to deal with thousands, millions, and even billions of new people? Consider, for example, the points in Figure 6, top panel. Consider these points as individuals. Measurement of behaviors show how these individuals connect with each other at a superficial level, at the phenotypical level. There are many visualization techniques which create the interconnections based upon one or another criterion. And from these visualizations we can ascribe something to the network. We can deduce something about the network and the nodes, although not much, perhaps. We are like psychologists studying the rat. If only the rat could talk, how much it would say about what it is doing and why? Alas, it is a rat, or perhaps a pigeon, the favorite test subjects of those who follow strict behaviorism, of the type suggested by BF Skinner and his Behaviorist colleagues and student at Harvard University. . (Full disclosure – author Moskowitz was a graduate student in some of Skinner’s seminars and colloquia, at Harvard, 1965-1968.)

fig 6

Figure 6: Set up template for the PVI, showing the ability to show the respondent a video or send the respondent to a landing page, depending upon the mind-set to which the respondent has been assigned by the PVI.

What happens, however, when we know the mind of each person, or at least the membership in, say, four or ten or perhaps 100 or perhaps 1000 different topic areas relevant to the granular richness of DAILY EXPERIENCE? What deep, profound understanding would emerge if we were to know the network itself, the WHO and BEHAVIOR of people, coupled with the structure of their MIND, viz., the ‘MIND OF EACH POINT IN THE NODE!

Consider Figure 6. The top panel shows the aggregate of people. We know WHO the people are. The bottom panel shows the network, WHAT the people do, how they link to each other. What if now we know WHY for each point, how each point thinks about a set of topics. We create a web of interconnected points and discover some of the commonalities of the points, not based on who the points are or what the points did, but rather how the points think about many relevant topics.

How do we move from Mind Genomics of one topic, say our choice of financial advisor, to many topics in common space, say the space of ‘personal finances’ and then through typing people around the world on a continuing basis, as life progresses and events progress: thousands, not hundreds, and finally millions, tens of millions of people. In essence this ‘project’ creates a true ‘wiki of the mind and society’, empirically sound, extensive, actionable, and archival for decades? In essence, how do we go from a map of nodes to a map of connected minds in the every-day life, and across the span of countries and time? (Figure 7)

fig 7

Figure 7: Example of nodes (i.e., people), perhaps connected by a network. The top panel shows the network of people as points. The bottom panel shows the potential of knowing the mind of each person, i.e., each point in the network.

To reiterate, our goal is to understand the specific mind-set memberships of each point in the network, where the point corresponds to a person. The big picture is thus millions, perhaps hundreds of millions of points, people, observed two ways, and even expanded a third way to billions of people who have completed the PVI, but who may be ‘imputed’ to belong to a mind-set through look-alikes. The is the DVI, the Digital Viewpoint identifier, explicated in step 3 below:

1. Granular Mental Information about Each Node

The minds or at least the pattern of mind-set membership of many people determined through Mind Genomics and the PVI, for a set of different topic areas. There may be as few as one topic area, or several dozen or even 100 or more topics. This information can be obtained through small-scale Mind-Genomics studies, executed and analyzed within 1-2 hours (www.BimiLeap.com), and followed by an easy-to-deploy PVI (www.PVI360.com).

2. Correlate Behavior Observed Externally with the Underlying Mind-sets

The interactions of nodes with each other, as measured objectively, either by who they are or by how they behave, such as what they view on the Web, what they order, with whom they interact in conversations. This information is readily available today from various sources, known collectively as Big Data.
3. Expand the PVI (Personal Viewpoint Identifier)

The goal here is to work with 1000 respondents, each of whom provides 5 minutes of her or his time to complete a set of PVI’s on a topic. Let’s choose a number of PVI, say 12. Each PVI of six questions takes about 15 seconds to compete. In three minutes, a person can do 12 PVI’s, comprising 72 questions.
4. Augment the Data

Let’s purchase publicly available information about these 1000 known respondents. The goal now is to predict the viewpoints of the 1,000 people on the 12 topics from purchasable data about those 1,000 people. Once that is done, one has developed a simple predictive model which uses purchasable data to estimate the mind-set membership of a person in each of 12 topic areas from purchasable information that can be readily obtained. This simple predictive model is the aforementioned DPI, Digital Personal Identifier. It has now become straightforward to create a ‘scoring system’ which moves systematically through the data already available, and ‘scores’ each respondent on 12, 120, or even 1200 different granular topics, to create a true Wiki of the Mind and Society.

5. Fast time frame, low cost: Let’s consider a simple scenario, the creation of this mass of data for the financial trajectory of a person, from early adulthood to late adulthood, through all the relevant financial aspects. Let’s assume 300 different identifiable activities involved in decision-making. The foregoing steps mean that within a period of six months to one year, and some concerted effort, it will become possible, and indeed quite straightforward, to move from say 300 topic studies to 300 micro sciences and viewpoints, to the creation of 300 digital viewpoint identifiers, to the application of those identifiers, i.e., scoring systems, to the purchasable data of 1-2 billion people. Within the Big Data the data scientist and entrepreneur will have an associated Big Mind, a vector of perhaps 300 numbers underneath each node, each person, each node corresponding to one of those 300 activities. The analytic possibilities emerging from knowing both the behavior and the mind-set of the behaving organism on 300 (or more) topics can only be surmised. One would not be far off to think that the possibilities are enormous for new understanding of behavior, a possibly new engineering of society.

Acknowledgments

Attila Gere thanks the support of the Premium Postdoctoral Researcher Program of the Hungarian Academy of Sciences.

References

  1. Ordenes FV, Theodoulidis B, Burton, J, Gruber, T, Zaki M (2014) Analyzing Customer Experience Feedback Using Text Mining: A Linguistics-Based Journal of Service Research 17: 278-295.
  2. Aciar S (2010) Mining Context Information from Consumer’s Reviews. 2nd Workshop on Context-Aware Recommender Systems (CARS-2010).
  3. Bucur C (2015) Using Opinion Mining Techniques in Tourism. Procedia Economics and Finance 23(Supplement C): 1666-1673.
  4. Ritbumroong T (2015) Analyzing Consumer Behavior Using Online Analytical Mining. In Marketing and Consumer Behavior: Concepts, Methodologies, Tools and Applications (1st ed, 894-910) IGI Global.
  5. Roll I, Baker RS, Aleven V, McLaren BM, Koedinger KR (2005) An analysis of differences between preferences in real and supposed contexts. User Modeling- Springer Berlin Heidelberg 367-376.
  6. Talib R, Hanif MK, Ayesha S, Fatima F (2016) Text Mining: Techniques, Applications and International Journal of Advanced Computer Science and Applications 7: 414-418.
  7. Zhong N, Li Y, Wu ST (2012) Effective Pattern Discovery for Text IEEE Transactions on Knowledge and Data Engineering 24: 30-44.
  8. Auinger A, Fischer M (2008) Mining consumers’ opinions on the In FH Science Day. 410;419.Linz, Österreich.
  9. Fan W, Wallace L, Rich S, Zhang Z (2010) Tapping the power of text mining, Communications of the ACM, vol. 49, no. 9, pp. 76-82, 2006.Fatima, F, Islam, W, Zafar, F, Ayesha, S. Impact and usage of internet in education in Pakistan. European Journal of Scientific Research 47: 256-264.
  10. Fenn, J, LeHong H (2012) Hype Cycle for Emerging Gartner.
  11. Gofman, A, Moskowitz H (2010) Isomorphic permuted experimental designs and their application in conjoint analysis. Journal of Sensory Studies 25: 127-145.
  12. Jung, C. H (1976) Psychological Types: A Revision (The Collected Works of C.G. Jung) Princeton, NJ: Princeton University Press.
  13. Moskowitz HR, Batalvi B, Lieberman E (2012) Empathy and Experiment: Applying Consumer Science to Whole Grains as Foods. In Whole Grains Summit (2012) (pp. 1-7) Minneapolis, MN: AACC International.
  14. Gofman A (2012) Putting RDE on the R&D Map: A Survey of Approaches to Consumer-Driven New Product Development. In A. Gofman, H. R. Moskowitz (Eds.), Rule Developing Experimentation: A Systematic Approach to Understand & Engineer the Consumer Mind (pp. 72-89) Bentham Books.

Developing an Inner Psychophysics for Social Issues: Reflections, Futures, and Experiments

DOI: 10.31038/IMROJ.2023813

Abstract

This paper introduces Inner Psychophysics, a new approach to measuring the values of ideas, applying the approach to the study of responses to 28 different types of social problems. The objective of Inner Psychophysics is to provide a number, a metric for ideas, with the number showing the magnitude of the idea on a specific dimension of meaning. The approach to create this Inner Psychophysics comes from the research system known as Mind Genomics. Mind Genomics presents the respondent with the social problem, and a unique set of 24 vignettes presenting solutions to the problem. The pattern of responses to the vignettes is deconstructed into the contribution of each ‘answer’, through OLS (ordinary least squares) regression. The approach opens up the potential of a ‘metric for the social consensus,’ measuring the value of ideas relevant to society as a whole, and to the person in particular.

Introduction

Psychophysics is the oldest branch of experimental psychology, dealing with the relation between the physical world (thus ‘physics’) and the subjective world of our own consciousness (thus ‘psycho’). The question might well be asked what is this presumably arcane psychological science dealing with up to date, indeed new approaches to science? The question is relevant, and indeed, as the paper and data will show. The evolution of ‘inner psychophysics’ provides today’s researcher with a new set of tools to think about the problems of the world. The founder of today’s ‘modern psychophysics,’ the late S.S. Stevens (1906-1973) encapsulated the opportunity in his posthumous book, ‘Psychophysics: An Introduction to its Perceptual, Neural and Social Prospects. Stevens also introduced the phrase ‘a metric for the social consensus,’ in his discussions about the prospects of psychophysics in the world of social issues. This paper presents the application of psychophysical thinking and disciplined rigor to the study of how people ‘think’ about large-scale societal problems [1,2].

The original efforts in psychophysics began about 200 years ago, with the world of physiologists and with the effort to understand how people distinguish different levels of the same stimulus, for example, different levels of sugar in water, or today, different levels of sweetener in cola. Just how small of a difference can we perceive? Or, to push things even more, what the is lowest physical level that we can detect? [3] These are the difference and the detection threshold, respectively, both of interest to scientists, but of relatively little interest to the social scientist and researcher.

The important thing to come out of psychophysics is the notion of ‘man as a measuring instrument,’ the notion that there is a metric of perception. Is there a way to assign numbers to objects or better to experiences of objects? In simpler terms, think of a cup of coffee. If we can measure the subjective perception of aspects of that coffee, such as its coffeeness’, then what happens when we add milk. Or add sugar. Or change coffee roast, and so forth. At a mundane level, can we measure how much perceived ‘coffeeness’ changes? With that in mind can we do this type of measurement for social issues?

Steven’s ‘Outer’ and ‘Inner’ Psychophysics

By way of full disclosure, author HRM was one of the last PhD students of the SS Stevens, receiving his PhD in the early days of 1969. Some 16 months before, Stevens had suggested that HRM ‘try his hand’ at something such as taste or political scaling, rather than pursuing research dealing with topics requiring sophistication in electronics, such as hearing and seeing. That suggestion would become a guide through a 54-year future, now a 54-year history. The notion of measuring taste forced thinking about the mind, the way people say things taste versus how much they like what they taste. This first suggestion, studying taste, focused attention on the inner world of the mind, one focused on what things taste like, why people differ in what they like, whether there are basic taste preference groups, and so forth. The well-behaved and delightfully simple regularities, ‘change this, you get that,’ working so well in loudness, seem to break down in taste.

If taste was the jumping off point from this outer psychophysics to the measurement of feelings such as liking, then the next efforts would be even more divergent. How does one deal with social problems which have many aspects to them? We are no longer dealing with simple ingredients, which when mixed create a food, and whose mixtures can be evaluated by a ‘taster’. We are dealing now with the desire to measure the perception of a compound, complex situation, the resultant of many interacting factors. Can the spirit of psychophysics add something, or we stop at sugar coffee, or salt in pickles?

Some years later, through ongoing studies of perception, it became obvious that one could deal with the inner world, using man as a measuring instrument. The slavish adherence of systematic change of the stimulus in degrees and the measurement, had to be discarded. It would be nice to say that a murder is six times more serious than a bank robbery with two people injured, but that type of slavish adherence would not create this new inner psychophysics. It would simply be adapting and changing the hallowed methods of psychophysics (systematically change, and then measure), moving from tones and lights to sugar and coffee, and now to statements about crimes. There would be some major efforts, such as the utility of money [4], efforts to maintain the numerical foundations of psychophysics because money has an intrinsic numerical feature. Another would be the relation between perceived seriousness of crime and the measurable magnitude punishment. But there had to be a profound re-working of the problem statement.

Enter Mathematics: The Contribution of Conjoint Measurement, and Axiomatic Measurement Theory

If psychophysics provided a strong link to the empirical world, indeed a link which presupposed real stimuli, then mathematical psychology provided a link to the world of philosophy and mathematics. The 1950’s saw the rise of interest in mathematics and psychology [5]. The goal of mathematical psychology in the 1950’s and 1960’s was to put psychology on firm theoretical footing. Eugene Galanter became an active participant in this newly emerging, working at once with Stevens in psychophysics at Harvard, and later with famed mathematical psychologist R. Duncan Luce. Luce and his colleagues were interested in ‘fundamental measurement’ of psychological quantities, seeking to measure psychology with the same mathematical rigor that physicists measured the real world. That effort would bring to fruition the Handbook of Mathematical Psychology [6], and the work of Luce and Tukey [7] well as the efforts of psychologist Norman Anderson [8] who coined the term ‘functional measurement.’

The simple idea which is relevant to us is that one could mix test stimuli, ideas, not only food ingredients, instruct the respondent to evaluate these mixtures, and estimate the contribution of each component to the response assigned to the mixture. Luce and Tukey suggested deeply mathematical, axiomatic approaches to do that. Anderson suggested simpler approaches, using regression. Finally, the pioneering academics at Wharton Business School, Paul Green and Yoram (Jerry) Wind showed how the regression approach could be used to deal with simple business problems [9,10].

The history of psychophysics and the history of mathematical psychology met in the systematics delivered by Mind Genomics. The mathematical foundations had been laid down by axiomatic measurement theory. The objective, systematized measurement of experience, had been laid down by psychophysics at first, and afterwards by applied psychology and consumer research. What remained was to create a ‘system’ which could quantify experience in a systematic way, building databases, virtually ‘wikis of the mind’, rather than simply providing one or two papers on a topic which solved a problem with an interesting mathematics. It was time for the creation of a corpus of psychophysically motivated knowledge, an inner psychophysics of thought, rather than the traditional psychophysics of perception.

Reflections on the Journey from the Outer Psychophysics to an Inner Psychophysics

New thinking is difficult, not so much because of the problems as the necessity to break out of the paradigms which one ‘knows’ to work, even though the paradigm may no longer serve its purpose in an optimal fashion. Inertia seems to be a universal law, whether the issue be science and knowledge, or business. This is not the place to discuss the business aspect, but it is the place to shine a light on the subtle tendency to stay within the paradigms that one learned as a student, the tried and true, those paradigms which get one published.

The beginning of the journey to inner psychophysics occurred with a resounding NO, from S. S. Stevens, in 1967, when author HRM asked permission to combine studies of how sweet an item tasted, and how much the item was liked. This effort was a direct step away from simple psychophysics, with the implicit notion of a ‘right answer’. This notion of a ‘right answer’ summarizes the worldview by Stevens and associates that psychophysics was searching for, invariance, for ‘rules’ of perception. Departures from the invariances would be seen as the irritating contribution of random noise, such as the ‘regression effect’ [11], wherein the tendency of research is to underestimate the pattern of the relation between physical stimulus and subjective, judged response. “Hedonics” was a complicating, ‘secondary factor’, which could only muddle the orderliness of nature, and not teach anything, at least to those imbued with exciting Harvard psychophysics of the 1950’s and 1960’s.

The notion of cognition, hedonics, experience as factors driving the perception of a stimulus, could not be handled easily in this outer psychophysics except parametrically. That is, one could measure the relation between the physical stimulus and the subjective response, create an equation with parameters, and see how these parameters changed when the respondent was given different instructions, and so forth. An example would be judging the apparent size of a circle of known diameter versus judging the actual size. It would be this limitation, this refusal to accept ideas as subject to psychophysics, that author HRM would end up attempting to overcome during the course of the 54-year journey.

The course of the 54-year journey would be marked by a variety of signal events, events leading to what is called in today’s business ‘pivoting.’ The early work on the journey dealt with judgments of likes and dislikes, as well as sensory intensity [12]. The spirit guiding the work was the same, search for lawful relations, change one parameter, and measure the change in a parameter of that lawful relation. The limited, disciplined approach of the outset psychophysics was too constraining. It was clear at the very beginning that the rigorous scientific approaches to measuring perceptual magnitudes using ‘ratio-scaling’ would be a ‘non-starter.’ The effort of the 1950’s and 1960’s to create a valid scale of magnitude was relevant, but not productive in a world where the application of the method would drown out methodological differences and minor issues. In other words, squabbles about whether the ratings possessed ‘ratio scale’ properties might be interesting, but not particularly productive in a world begging for measurement, for a yet-to-be sketched out inner psychophysics.

The movement away from simple studies of perceptual magnitudes was further occasioned by the effort to apply the psychophysical thinking to business issues, and the difficulties ensuing in the application of ratio scaling methods, such as magnitude estimation. The focus was no longer on measurement, but on creating sufficient understanding about the stimulus, the food or cosmetic product, so that the effort would generate a winner in the marketplace.

The path to understanding first comprises experiments with mixtures, first mixtures of ingredients, and then mixtures of ideas, steps needed to define the product, to optimize the product itself, and then to sell the product. Over time, the focus turned mainly to ideas, and the realization that one could mix ideas (statements, messages), present these combinations to respondents, get the responses to the combinations, and then using statistics such as OLS (ordinary least-squares regression) one could estimate the contribution of each idea in the mixture to the total response.

Inner Psychophysics Propelled by the Vision of Industrial-scale Knowledge Creation

A great deal of what the author calls the “Inner Psychophysics” came about because of the desire to create knowledge at a far more rapid level than was being done, and especially the dream that the inevitable tedium of a psychophysical experiment could simply be eliminated. During the 20th century, especially until the 1980’s, researchers were content to work with one subject at a time, the subject being call the ‘O’, an abbreviation for the German term Beobachter. The fact that the respondent is an observer suggests a slow, well-disciplined process, during which the experimenter presents one stimulus to one observer, and measures the response, whether the response is to say when the stimulus is detected as ‘being there,’ when the stimulus quality is recognized, or when the stimulus intensity is to be assigned a response to report its perceived intensity.

The psychophysics of the last century, especially the middle of the 20th century, focused on precision of stimulus, and precision of measurement, with the goal of discovering the relations between variables, viz., physical stimuli versus perception of those stimuli by the person. It is important to keep in mind the dramatic pivot or change in thinking that would ensue when reality and opportunity presented themselves as disturbances. Whereas psychophysics of the Harvard format searched for lawful relations between variables (physical stimulus levels; ratings of perceived magnitude), the application of the same thinking to food and to ideas was to search for usable relations. The experiments need not reveal an ‘ultimate truth’, but rather needed to be ‘good enough,’ to identify a better pickle, salad dressing, orange juice or even features of a cash-back credit card.
The industrial-scale creation would be facilitated by two things. The first was a change in direction. Rather than focusing one’s effort on the laws relating physical stimulus and subjective response (outer psychophysics), the new, and far-less explored area would focus on measuring ideas, not actual physical things (inner psychophysics).
The second would focus on method, on working not with single ideas, but deliberately with mixtures of ideas, presented to, and evaluated by the respondent. in a controlled situation. These mixtures of ideas, called vignettes, would be created by experimental design, a systematic prescription of the composition of each mixture, viz., which phrases or elements would appear in each vignette. The experimental design ensured that the researcher could link a measure of the respondent’s thinking to the specific elements. The rationale for vignettes was the realization that single ideas were not the typical ‘product’ of experience. We think of mixtures because our world comprises compound stimuli, mixtures of physical stimuli, and our thinking in turn comprises different impressions, different thoughts. Forcing the individual to focus on one thought, one impression, one message or idea, is more akin to meditation, whose goal is to shunt the mind away from the blooming, buzzing confusion of the typically disordered mind, filled with ideas flitting about.

The world view was thus psychophysics, search for relations and for laws. The world view was also controlled complexity, with the compound stimulus taking up the attention of the respondent and being judged. The structure of the mixtures appeared to be a ‘blooming, buzzing confusion’ in the words of Harvard psychologist William James. To create the Inner Psychophysics meant to prevent the respondent from taking active psychological control of the situation. Rather, the designed forced the respondent to pay attention to combinations of meaningful messages (vignettes), albeit messages somewhat garbled in structure, which avoided revealing the underlying structure, and thus prevented the respondent from ‘gaming’ the system.

As will be shown in the remainder of this paper, the output of this mechanized approach to research produced an understanding of how we think and make decisions, in the spirit of psychophysics, at a pace and scope that can be only described as industrial scale/

The Mind Genomics ‘Process’ for Creating an Experiment

The study presented here comes from a developing effort to understand the mind of ordinary people in terms of what can solve well-known social problems. At a quite simple level, one can either ask respondents to tell the researcher what might solve the problems, or present solutions to the respondent, and ask the respondent to scale each solution in terms of expected ability to solve the problem. The solutions are concrete, simple, relevant. The pattern of responses gives a sense of what the respondent may be thinking with respect to solving a problem.

The study highlighted here went several stages beyond that simple, straightforward approach. The stimulus for the underlying thinking came from traditional personality theory, and from cognitive psychology. In personality theory, psychologist Rorschach among many others believed that people were not often able to paint a picture of their own mind, at the deepest levels. Rorschach developed a set of ambiguous pictures and required the respondent to describe them, to tell a story. The pattern of what the respondent saw could tell the research how the respondent organized her or his perceptions of the world. Could such an approach be generalized, so that the pictures would be replaced by metaphoric words, rich with meaning? And so was born the current study. The study combines a desire to understand the mind of the individual, the use of Mind Genomics to do the experiment, and the acceleration of knowledge development through a novel set of approaches to the underlying experimental design (see also Goertz & Mahoney) [13]

Let us first look at the process itself.

  1. The structure of the experimental design begins with a single topic (e.g., a social problem), continues with four questions dealing with the problem, and in turn four specific answers to each question. Thus, there are three stages, easy to create, amenable to being implemented through a template. Good practice suggests that the 16 answers (henceforth elements) be simple declarative statements, 14 words or fewer, with no conjunctives. These declarative statements should be easily and quickly scanned, with as little attention, as little ‘friction’ as possible.
  2. A basic experiment specified 24 unique combinations or vignettes, each vignette comprising 2, 3 or 4 elements. No effort was made to connect these elements. Rather, each element was placed atop the other.
  3. The experimental design ensured that each element appeared exactly five times across the 24 vignettes, and that the pattern of appearances made each element statistically independent of the other 15 elements.
  4. The experimental design was set up to allow the 24 vignettes to be subject to OLS (ordinary least-squares) regression, at the level of the individual, or the level of the group, respectively.
  5. A key problem in experimental design is the underlying structure of what is tested, which is a single set of combinations. The quality of knowledge suffers because only a set of combinations is tested, one small region of the design space. There is much more to the design space. The researcher’s resources are wasted suppressing the noise in this region, either by eliminating noise (impossible in an Inner Psychophysics), or by averaging out the noise in this region by replication (a waste of resources).
  6. The solution of Mind Genomics is to permute the experimental design [14]. The permutation strategy maintains the structure of the experimental design but changes the specific combinations. The task of permuting requires that the four questions be treated separately, and that the elements within a question be juggled around but remain with the question. In this way, no element was left out, but rather its identification number changed. For example, A1 would become A3, A2 would become A4, A4 would become A2 and A3 would become or remain A3. At the initial creation of the permuted designs, each new design was tested to ensure that it ran with the OLS (ordinary least-squares) regression package.
  7. Each respondent would test a different set of 24 combinations. What was critical was to create a scientific experiment in which the experiment need not know anything about the topic to explore the full range of the topic as represented by the 16 elements. The data from the full range of combination tested would quickly reveal what elements performed well, and what elements performed poorly.
  8. The benefit to research was that research could become once again exploratory as well as confirmatory, due to the wide variation in the combinations. It was no longer a situation of knowing the answer or guessing at the answer ahead of time. The answer would emerge quickly.
  9. Continuing and finishing with an overview of the permuted design of Mind Genomics, it quickly became obvious that studies needed not be large nor expensive. The ability to create equations or models with as few as 5-10 respondents, because of the ability to cover the design space, meant that one could get reasonable indications with so-called ‘demo studies’, virtually automatic studies, set up and implemented at low cost. The setup takes about 20 minutes once the ideas are concretized in the mind of the research. The time from launch (using a credit card to pay) to delivery of the finalized results in tabulated form, ready for presentation, is approximately 15-30 minutes.
  10. It was important to create rapid summarizations of the results. Along with the vision of ‘industrial strength research’ was the vision of ‘industrial scale insights.’ These would be provided by simple templated outputs, along with AI interpretations of the strong performing elements for each key group in the population. The latter would develop into the AI ‘summarizer’.
  11. The final step, as of this writing is to make the above-mentioned system work simultaneously with a series of different studies, e.g., 25-30 studies, in an effort to create powerful databases, across topics, people, cultures, and over time. In the spirit of accelerated knowledge development, each study is a carbon copy of the other study, except for one item, the specific topic being addressed in the study. That is, the orientation, rating scale, and elements are identical. What differs is the problem being addressed.
  12. When everything else is held constant, only the topic being varied, we have then the makings of the database of the mind, done at industrial scale.

Applying the Approach to the ‘Solution’ of Social Problems

We begin with a set of 28 social problems, and a set of 16 ‘messages’ as tentative solutions to a problem. The problems are simple to describe and are not further elaborated. In turn the 16 elements or solutions are general approaches, such as the involvement of business, rather than more focused solutions comprising specific steps. These 28 problems are shown in Table 1 and the 16 solutions are shown in Table 2.

Table 1: The 28 problems

tab 1

The 28 problems enumerated in Table 1 represent a small number of the many possible problems one can encounter, and Table 2 shows a few of the many the solutions that might be applied. The number of problems is unlimited. For this introductory study, using the Mind Genomics template, we are limited to four types of solutions for a problem, and four specific solutions in each type.

Table 2: The 16 solutions (four silos, each silo with four solutions)

tab 2

The actual process follows these steps, which give a sense of the total effort needed for the project.

  1. Develop the base study (orientation page, rating scale, questions, answers); Figures 1a and 1b shows some relevant screen shots. Each problem is represented by a single phrase describing the problem. That phrase is called ‘the SLUG’. It will be the SLUG which changes in the various steps, one SLUG for each study (Figure 2).
  2. Create a copy of the base study, changing the nature of the problem in the introduction and in the rating scale. This activity requires about 3-5 minutes for each study due to its repetitive, simple nature. Then launch each study in rapid succession with the same panel requirements (50 respondents), and let each study amass the data from the 50 respondents. The field time is about 30 minutes when the studies are launched during the daytime, and when the respondents have been invited by an on-line panel provider specializing in this type of research. The expected time for Step 2 for 28 studies is about 3-4 hours, to acquire all of the data.
  3. Create the large scale datafile, comprising one set of 24 rows for each respondent. This effort ends up being simple a ‘cut and paste’ effort, with slight editing. The 24 rows of data per respondent ends up generating 1200 rows of data for each of the 28 studies. The final database will comprise the information about the study, about the respondent, and then the set of 16 columns to show the presence/absence of the 16 elements (answers to the question), as well a 17th column to show the rating assigned for the particular vignette, and an 18th column showing the ‘response time’ for the vignette, defined as the time between the appearance of the vignette on the respondent’s screen and the assignment of the rating.
  4. Pre-process the ratings by converting the 5-point rating scale to a new, binary scale. Ratings of 1-3 are converted to 0 to denote that the respondent does not feel that the combination of offered actions presented in the vignette will ‘solve’ the problem. In turn, ratings of 4-5 are converted to 100 to denote that the respondent does feel that the combination of offered actions will solve the problem. The binary transformation is generally more intuitive to users of the data, these users wanting to determine ‘no or yes.’ To these users the intermediate scale values are hard to interpret, even though those scale values are tractable for statistical analysis.
  5. Since the 24 vignettes evaluated by a respondent are created according to an underlying experimental design, we know that the 16 independent variables (viz., the 16 solutions) are statistically independent of each other. Thus, the program creates an equation or model relating the presence/absence of the 16 elements to the newly created binary variable ‘will work.’ We express the equation as: Work (0/100) = k1(Solution A1) + k2(Solution A2) + …. K16(Solution D4). To make the results comparable instant from the study to study the equation is estimated without an additive constant, to force all the information about the pattern to emerge from the coefficients.
  6. Each respondent thus generates 16 coefficients, the ‘model’ for that respondent. The coefficient shows the number of points on a 100-point scale for ‘working’ contributed by each of the 16 solutions. Array all the coefficients in a data matrix, each row corresponding to a respondent, and each column corresponding to one of the 16 solutions or elements.
  7. Cluster all respondents in the 28 studies into three groups independent of the problem topic, but simply based on the pattern of the 16 coefficients for the respondent. The clustering is called k-means [15]. The researcher has a choice of the measure of distance or dissimilarity. For these data we cluster using the so-called Pearson Model, where the distance between two respondents is based on the quantity (1-R), with R=Pearson Correlation Coefficient. The Pearson correlation coefficient for two respondents is computed across computed across the 16 pairs of coefficients). Note again that the clustering program ‘does not know’ that there are 28 studies. The structure of the data is the same from one study to another, from one respondent to another.
  8. Each respondent is assigned to one of the three clusters (now called mind-set). Afterwards, the researcher create summary models or equations, first for each study independent of mind-set, second for each mind-set independent of study, and finally for each combination of study and the three mind-sets. These summary models generate four tables of coefficients, first for total, and then for mind-set 1, mind-set 2, and mind-set 3, respectively. Each vignette clearly belongs to one of the respondents, and therefore belong both to one specific study of the 28, and to one of the three emergent mind-sets. For these final summary models, the (arbitrary) decision was made to discard all vignettes that were assigned the rating ‘3’ (cannot decide). This decision sharpens the data by considering only the vignettes where a respondent felt that the problem would be solved or not be solved.
  9. Build three large models or equations relating the presence/absence of the 16 elements (specific solutions) to the binary rating of ‘can solve the problem’, incorporating all respondents in a mind-set. Then build the three sets of models, for each problem, by respondents in the appropriate mind-set. This creates 28 (problems) x 3 (mind-sets) = 84 separate models. We look at the patterns across the tables to get a sense of the different mind-sets, how they differ from the Total Panel, and what seems to be the defining aspects for each mind-set.
  10. The effort for one database, for one country, easy easily multiplied, either to the same database for different countries, or different topic databases for the country. From the point of view of cost in today’s dollars (Spring, 2023), each database of 28 studies and 50 respondents per study can be created for about $15,000, assuming that the respondents are easy to locate. That effort comes to about $500 per study.

fig 1

Figure 1: Study name (left panel), four questions (middle panel), and four answers to one question (right panel)

fig 2

Figure 2: Self profiling question (left panel), and rating scale (right panel)

What Patterns Emerge from Problem-Solution Linkages – Total Panel

Let us now look at the data from the total panel. Table 1 shows us 16 columns, one per solution, and 28 rows, one per problem. Models were estimated after excluding all vignettes assigned the rating 3 (cannot decide). The table is sorted in descending order by ability for a specific solution, and from left to right, by median coefficient, both for solutions and for problems, respectively:

  1. The rows (problems) are sorted in descending order by the median coefficient for the problem across 16 solutions. This means that the problems at the top of the table are those with the highest median coefficients, viz., the most likely to be solved by the solutions proposed in the study.. The problems at the bottom of the table are those least likely to be solved by the solutions proposed in the study
  2. The columns (solutions) are sorted in descending order by the median coefficient for the solution across all 28 problems. This means that the solutions to the left, those with the highest median coefficients, are the most to solve problems. The solutions to the right, those with the lowest median coefficients, are least likely to solve problems.
  3. The medians are calculated for all coefficients, those shown and those not shown. The table shows only the strong performing combinations, those with coefficients of +20 or higher.
  4. Table 3 is extraordinarily rich. There are several strong-performing elements. The interesting observations, however, emerges from the pattern of darkened cells, those with strong coefficients. These tend to be solutions from group B (social action) and from group C (business). Initiatives from education and government do work, but without any additional information, there seems to be little belief in the efficacy of the public domain to produce a solution.

Table 3: Summary table of coefficients for model relating presence/absence of 16 solutions (column) to the expected ability to solve the specific problem.

tab 3

The Lure of Mind-sets

We finish this investigation by looking at mind-sets, one of the key features of Mind Genomics. The notion of mind-sets is that for each topic area one can discover different patterns of ‘weights’ applied by the respondent to the information. The analysis to create these mind-sets will use the 16 coefficients for each respondent, independent of the problem presented to the respondent.

The notion of combining all respondents, independent of the problem, may sound strange at first, but there is a spark of reason. We are simply looking at the way the person deals with a problem. We are more focused on general patterns, even if these end up being ‘weak signals.’ The fact that there are 28 different problems dealt with in the project is not relevant for the creation of the mind-set, but will become important afterwards, for the deeper understanding of each mind-set.

The rationale for combining problems and solutions (viz., coefficients) into one database comes from the well-accepted fact that consumers differ when they think about purchasing a product. Studies of the type presented here, but on commercial products, again and again show that when it comes to purchasing a food product, one pattern of weights suggests that the respondent pays attention to product features, whereas another pattern of weights applied to the same elements suggests that the respondent pays attention to the experience of consuming the product, or the health benefits of the product, rather than paying attention to the features [16]. Rarely do we go any deeper in our initial thinking about the individual differences.

    1. The coefficients for the three emergent mind-sets appear in Tables 2-4. Again, the tables are sorted by the median, and all coefficients of 20 or higher are shaded to allow the patterns to emerge. Our task here is to point out some of these general patterns.
    2. The range of coefficients is much larger for the mind-sets than for the total. Table 1 shows us many modest-size coefficients of 10-20 and a number of larger coefficients, 20 or higher. Tables 2-4 show us a much greater range of coefficients. We attribute the increased range to the hypothesis that people may deeply differ from each other in their mental criteria. Inner Psychophysics reveals that difference, doing so dramatically, and in a way that could not have been done before.
    3. The pattern of coefficients seems somewhat more defined, as if the respondents in a mind-set more frequently rely on the same set of solutions for the problems, although not always.

a. The mindsets do not believe that the key solutions will work everywhere, but just in some areas. The mind-sets do not line up in an orderly fashion. That is, we do not have a simplistic set of psychophysical functions for the inner psychophysics. We do have patterns, and metrics for the social consensus.

b. Mind-Set 1 (Table 2) appears to feel that business and education solutions will work most effectively. Mind-Set 1 does not believe strongly in the public sector as able to provide workable solutions to many problems.

c. Mind-Set 2 (Table 3) appears to feel that education and the law will work most effectively.

d. Mind-Set 3 (Table 4) appears to feel that law and business will work most effectively (Tables 4-6).

Table 4: Summary table of coefficients for model relating presence/absence of 16 solutions (column) to the expected ability to solve the specific problem (row). The data come from Mind-Set 1, which appears to focus on business as the preferred solution to problems.

tab 4

Discussion and Conclusion

The focus of this paper began with the desire to extend the notion of psychophysics to the measurement of internal ideas. As noted in the first part of this paper, the traditional focus of psychophysics has been the measurement of sensory magnitudes, and later lawful relations between the sensory magnitude as perceived and the physical magnitude as measured by standard instruments.

The early work in psychophysics focused on measurement, the assignment of numbers to perceptions. The search for lawful relations between these measured intensities of sensation and physical correlates would come to the fore even during the early days of psychophysics, in the 1860’s, with founder Gustav Theodor Fechner [17]. It was Fechner who would trumpet the logarithm ‘law of perception,’ such ‘laws’ being far more attractive than the very tedious effort to measurement the just notice differences, the underlying units of so-called sensory magnitude. Almost a century later Harvard psychophysicist S.S. Stevens (1975) would spend decades suggesting that this law of perception followed a power function of defined exponent, rather than a logarithmic function.

This paper moves psychophysics inward, away from the search for lawful ‘equations’ relating one set variables to another, viz., magnitudes of physical stimuli versus magnitudes of the co-varying subjective responses. This focus here is to measure ideas. The objective is to put numbers onto ideas, not by having the respondent introspect and rate the ideas, but rather by showing the magnitude of the linkage in the mind between ideas. The methods are experimentation, the results are numbers (coefficients of the equation), and the scope is to create this new iteration of psychophysics in a way consonant with the way we think about issues. The outcome comprises a set of relatively theory-independent methods which produce the raw material of this psychophysics for the consideration of both other researchers and for practical applications in the many areas of human endeavor.

References

      1. Stevens SS (1975) Psychophysics: Introduction to Its Perceptual, Neural, and Social Prospects. New York, John Wiley.
      2. Stevens SS (1966) A metric for the social consensus. Science 151: 530-541.
      3. Boring EG (1942) Sensation & Perception in the History of Experimental Psychology. Appleton-Century,
      4. Galanter E (1962) The direct measurement of utility and subjective probability. The American Journal of Psychology 75: 208-220.
      5. Miller GA (1964) Mathematics and Psychology, John Wiley, New York.
      6. Luce RD, Bush RR, Galanter E (Eds.) (1963) Handbook of Mathematical Psychology: Volume I. John Wiley.
      7. Luce RD, Tukey JW (1964) Simultaneous conjoint measurement: A new type of fundamental measurement. Journal of Mathematical Psychology 1: 1-27.
      8. Anderson NH (1976) How functional measurement can yield validated interval scales of mental quantities. Journal of Applied Psychology 61: 677-692.
      9. Green PE, Wind Y (1975) New way to measure consumers’ judgments,” Harvard Business Review 53: 107-17.
      10. Wind Y (1978) Issues and advances in segmentation research. Journal of Marketing Research 15: 317-337.
      11. Stevens SS, Greenbaum HB (1966) Regression effect in psychophysical judgment. Perception & Psychophysics 1: 439-446.
      12. Moskowitz HR, Kluter RA, Westerling J, Jacobs HL (1974) Sugar sweetness and pleasantness: Evidence for different psychological laws. Science 184:583-585. [crossref]
      13. Goertz G, Mahoney J (2013) Methodological Rorschach tests: Contrasting interpretations in qualitative and quantitative research. Comparative Political Studies 46: 236-251.
      14. Gofman A, Moskowitz H (2010) Isomorphic permuted experimental designs and their application in conjoint analysis. Journal of Sensory Studies 25: 127-145.
      15. Dubes R, Jain AK (1980) Clustering methodologies in exploratory data analysis. Advances in Computers 19: 113-228.
      16. Green PE, Srinivasan V (1978) Conjoint analysis in consumer research: issues and outlook. Journal of Consumer Research 5: 103-123.
      17. Fechner GT (1860) Elements of psychophysics (translated by H.E. Adler, 1966) Leipzig, Germany, Breitkopf and Hartel (Holt, Rinehart, and Winston).

Menace of Substance Abuse in Today’s Society: Psychosocial Support to Addicts and Those with Substance Use Disorder

DOI: 10.31038/IJNM.2023421

Abstract

Substance abuse among youths has been a problem to society in General. The continuous use of psychoactive substances among adolescents and youths has become a public concern worldwide because it potentially causes deliberate or unintended harm or injury. The consequences of drug abuse are not only on the individual user but also on his or her offspring, family and the society. This seminar topic discussed some drugs that are commonly abused by adolescents and youths such as cannabis, cocaine, amphetamine, heroin, codeine, cough syrup and tramadol. It also discussed the sources where abusers obtained drugs as well possible effects in terms of physical, psychological and social terms. The risk factors and the reason for substance abuse was discussed, how substance abuse interrupt the brain, which also tells us the ways of cubbing the menace of substance abuse by creating awareness about drug abuse and their adverse consequences through the aid of appropriate mass media tools. This write-up also discussed method of delivering customized information suitable to the target audience such as family, schools, workers, religious organization, homes in a sensitive manner. Also discussed is the strategies to use in collaboration with international agencies to monitor the sale of over-the-counter drugs and enforcing stricter penalties for individuals who are involved in trade of illicit drugs and many more. Recommendation are made where call on all categories of people including government ,family, community and National Agency for Food and Drug Administration and Control (NAFDAC) to contribute to preventing the menace of substance abuse. If the Nigerian youths should stop drug abuse, they will be useful to themselves, their families and the society in general.

Keywords

Substance abuse, Psychoactive substance, Society

Introduction

Substance abuse has been a cause of many debilitating conditions such as schizophrenia and psychosis, leading to psychiatric admissions. Substance abuse is emerging as a global public health issue. The recent world drug report-2019 of the United Nations Office on Drugs and Crime (UNODC) estimated that 271 million (5.5%) of the global population (aged between 15 and 64 years) had used drugs in the previous year. Also, it has been projected that 35 million individuals will be experiencing drug use disorders. Furthermore, the Global Burden of disease Study (2017), estimated that there were 585,000 deaths due to drug use, globally. The burden of drug abuse (usage, abuse, and trafficking) has also been related to the four areas of international concern, viz. organized crime, illicit financial flows, corruption, and terrorism or insurgency. Therefore, global interventions for preventing drug abuse including its impact on health, governance, and security, requires a wide spread understanding of the prevalence, frequently implicated drugs, commonly involved population, sources of the drugs and risk factors associated with the drug abuse. In Nigeria, the burden of drug abuse is on the rise and becoming a public health concern. Nigeria, which is the most populous country in Africa, has developed a reputation as a center for drug trafficking and usage mostly among the youth population, in which the menace is giving birth to a generation of drug addicts. Oftentimes, young men are seen with bottles of carbonated drinks (soft drinks), but laced with all kinds of intoxicating content. They move about with the soft drink bottles and sip slowly for hours while unsuspecting members of the public would easily believe that it is mere harmless soft drink.

According to Ladipo, a consultant psychiatrist at the Lagos University Teaching Hospital (LUTH), said that he had handled lot of mental cases in his career as fallouts of drug abuse, which often lead to mental disorder. He also stated that the effects of drug abuse and wrong use do not only take a toll on the individuals and their families but on society at large. According to UNODC, report on Drug use in Nigeria (the first large-scale, nationwide national drug use survey in Nigeria), one in seven persons (aged 15-64 years) had used a drug in the past year. Also, one in five individuals who had used drug in the past year is suffering from drug related disorders. Drug abuse has been a cause of many criminal offences such as theft, burglary, sex work, and shoplifting. A prevalence of 20-40% and 20.9% of drug abuse was reported among students and youths, respectively. Commonly abused drugs include cannabis, cocaine, amphetamine, heroin, diazepam, codeine, cough syrup and tramadol. Sources where abusers obtained drugs, were pharmacies/patent medicine shops, open drug markets, drug hawkers, fellow drug abusers, friends, and drug pushers. Drug abuse was common among undergraduates and secondary school students, youths, commercial bus drivers, farmers, and sex workers. Reasons stated for use include but not limited to increase physical performance, stress and to derive pleasure. Poor socioeconomic factors and low educational background were the common risk factors associated with drug abuse [1-10].

Objectives of the Seminar

  1. To identify the reasons and perceived benefits for substance abuse
  2. To identify psychological and social effects of substance abuse.
  3. To examine psychosocial supports rendered to substance users and addicts.
  4. To stimulate further discussions and research thoughts in an attempts to finding solutions to the menace

Clarification of Concepts

i. A Drug

It is any substance other than food that influences motor, sensory, cognitive or other bodily processes (APA, 2022).

ii. Drug Misuse

It is the use of a substance for a purpose not consistent with legal or medical guidelines (WHO, 2006).

iii. Psycho-Active Substance

Are substances that, when taken in or administered into the system, affect mental process, e.g., perception, consciousness, cognition or mood and emotions (WHO,2022).

iv. Substance Abuse

This, according to International Classification of Diseases (ICD10), is a pattern of psychoactive substance use that is capable of causing damage to physical or mental health. According to Diagnostic and statistical manual of mental disorders (DSM IV), it is a maladaptive pattern of substance use leading to significant clinical/social/legal/occupational distress or mental ill-health in the last 12 months.

Substance abuse can also be defined as;

  • Use of drugs without physician’s prescription.
  • Use of illicit drugs or legally banned drugs.

v. Addiction

This is a compulsive, chronic, physiological or psychological need for a habit forming substance, behaviour or activity having harmful effects and typically causing well defined symptoms such as irritability, anxiety, tremors upon withdrawal (NIH, 2019).

vi. Psychosocial

This are structured psychological or social interventions used to address substance-related problems (APA, 2022).

Literature Review

According to International Classification of Diseases ICD10 (2022), substance abuse as a pattern of psychoactive substance uses that is capable of causing damage due to physical or mental ill health. Substance abuse is emerging as a global public health issue, which is needed to be addressed. The effect of drug is due to the organism taking them and these drugs could be beneficial or harmful physically, psychological or physiologically. When the effects of drugs are beneficial, the drug is said to be serving its purpose but if otherwise, then a problem exists According to Abiodun et al. 1 in 7 persons aged 15-64 years in Nigeria had used a drug (other than tobacco and alcohol) in the past year. The past year prevalence of any drug use is estimated at 14.4% (range 14.0% -14.8%), corresponding to 14.3 million people aged 15-64 years who had used at least one psychoactive substance in the past year for non-medical purposes. Among every 4 drug users in Nigeria, 1 is a woman. More men (annual prevalence of 21.8% or 10.8 million men) than women (annual prevalence of 7.0% or 3.4 million women) reported past-year drug use in Nigeria. The highest levels of any past-year drug use were among those aged 25-39 years. 1 in 5 persons who had used drugs in the past year is suffering from drug user disorders. Cannabis is the most commonly used drug. An estimated 10.8% of the population or 10.6 million people had used cannabis in the past year. The average age of initiation of cannabis use among the general population was 19 years. Geographically, the highest past-year prevalence of drug use was found in the southern geopolitical zones (past year prevalence ranging between 13.8 percent and 22.4 percent) compared to the northern geopolitical zones (past year prevalence ranging between 10 percent and 13.6 percent). Two-thirds of people who used drugs reported having serious problems as result of their drug use, such as missing school or work, doing a poor job at work/school or neglecting their family or children.

Classification of Substance of Abuse

Classification of Substance of Abuse is given in Table 1.

Table 1: Classification according to Diagnostic Systematic Manual IV and International Classification of Diseases 10.

S/N

DSM(IV)

ICD10

1. Alcohol Alcohol
2. Stimulants (cocaine, amphetamines) Other substances including caffeine
3. Caffeine       ____
4. Cannabis Cannabinoids
5. Hallucinogens (lysergic acid, ecstasy, ketamine) Hallucinogen
6. Inhalants (fumes from petrol, glue, adhesive) Volatile solvents
7. Tobacco Tobacco
8. Opioid  (morphine, pentazocine, pethidine,  tramadol) Opioid
9. CNS depressants (sedatives, hypnotics, anxiolytics) Sedatives, hypnotics
10. Unknown substance/others (fecal, cow dump) Unknown substances/others

Substance Abuse Stages

In discussing substance abuse, it is generally agreed that substance is not a one-stage process. According to Brookdale, there are seven stages of substance abuse, namely:

Stage 1: Initiation
Stage 2: Experimentation
Stage 3: Occasional user
Stage 4: Regular user
Stage 5: Risky user
Stage 6: Dependent
Stage 7: Addiction

1. Initiation Stage

This is the first stage during which time the individual tries a substance for the first time. This can happen at almost any time in a person’s life, but according to National Institute on Drug Abuse, the majority of people with an addiction tried their drug of choice before 18 and had a substance use disorder by 20. The reasons a teenager experiments with drugs can vary widely, but two common reasons are because of either curiosity or peer pressure. This latter choice is made with intent of trying to fit in better with that particular group of peers. Another reason that teenagers are more likely to try a new drug than most age groups is due to how the prefrontal cortex in their brain is not yet completely developed. This affects their decision-making process, and as a result many teenagers make their choice without effectively considering the long-term consequences of their actions.

2. Experimental Stage

At the experimentation stage, the user has moved past simply trying the drug on its own and is now taking the drug in different contexts to see how it impacts their life. Generally, in this stage, the drug is connected to social actions, such as experiencing pleasure or relaxing after a long day. For teenagers, it is used to enhance party atmospheres or manage stress from schoolwork. Adults mainly enter experimentation either for pleasure or to combat stress. In this stage, there are little to no cravings for the drug and the individual will still be making a conscious choice of whether to use or not. They may use it impulsively or in a controlled manner, and the frequency of both options mainly depends on a person’s nature and reason for using the drug. There is no dependency at this point, and the individual can still quit the drug easily if they decide to. Some youths repulsed by first unpleasant experiment never to use it again. Others, however assured by the more seasoned users become occasional users

3. Occasional User Stage

The new user seems to be passive accepting drugs if and when offered rather than seeking it out himself, such person believes he or she can handle the situation.

4. Regular User Stage

As a person continues to experiment with a substance, its use becomes normalized and grows from periodic to regular use. This does not mean that they use it every day, but rather that there is some sort of pattern associated with it. The pattern varies based on the person, but a few instances could be that they are taking it every weekend or during periods of emotional unrest like loneliness, boredom or stress. At this point, social users may begin taking their chosen drug alone, in turn taking the social element out of their decision. The drug’s use can also become problematic at this point and have a negative impact on the person’s life. For example, the individual might begin showing up to work hung-over or high after a night of drinking alcohol or smoking marijuana. There is still no addiction at this point, but the individual is likely to think of their chosen substance more often and may have begun developing a mental reliance on it. When this happens, quitting becomes harder, but still a manageable goal without outside help. At this stage, users actually seek after the drugs and maintain their own supply; they show high motivation to get on drugs

5. Risky User Stage

The individual’s regular use has continued to grow and is now frequently having a negative impact on their life. While a periodic hangover at work or an event is acceptable for Stage 3, at Stage 4 instances like that become a regular occurrence and its effects become noticeable. Many drinkers are arrested for a DUI (Driving Under the influence) at this point, and all users will likely see their work or school performance suffer notably. The frequent use may also lead to financial difficulties where there were none before. Although the user may not personally realize it, people on the outside will almost certainly notice a shift in their behavior at this point. Some of the common changes to watch out for in a drug user include:

  • Borrowing or stealing money
  • Neglecting responsibilities such as work or family
  • Attempting to hide their drug use
  • Hiding drugs in easily accessible places (like mint tins)
  • Changing peer groups

6. Dependent Stage

This stage, the person’s drug use is no longer recreational or medical, but rather is due to becoming reliant on the substance of choice. This is sometimes viewed as a broad stage that includes forming a tolerance and dependence, but by now, the individual should already have developed a tolerance. As a result, this stage should only be marked by a dependence, which can be physical, psychological, or both.

For a physical dependence, the individual has abused their chosen drug long enough that their body has adapted to its presence and learned to rely on it. If use abruptly stops, the body will react by entering withdrawal. This is characterized by a negative rebound filled with uncomfortable and sometimes dangerous symptoms, that should be managed by medical professionals. In most cases, individuals choose to continue their use, rather than seeking help, because it is the easiest and quickest way to escape withdrawal.

7. Addictive Stage

At this stage, the drug becomes a major part of the user’s life. The user become obsessed with drugs obtaining them at all cost without consideration for food, job, family etc. Individuals at this stage feel as though they can no longer deal with life without access to their chosen drug, and as a result, lose complete control of their choices and actions. The behavioral shifts that began during Stage 4 will grow to extremes, with the user likely giving up their old hobbies and actively avoiding friends and family. They may compulsively lie about their drug use when questioned and are quickly agitated if their lifestyle is threatened in any way. Users, at this point, can also be so out of touch with their old life that they do not recognize how their behaviors are detrimental and the effects that it has had on their relationships.

8. Crisis/Treatment Stage

The final stage of addiction is the breaking point in a person’s life. Once here, the individual’s addiction has grown far out of their control and now presents a serious danger to their well–being. It is sometimes referred to as the crisis stage, because at this point the addict is at the highest risk of suffering a fatal overdose or another dramatic life event.

Of course, while crisis is the worst-case scenario for this stage, there is also a positive alternative that fits here instead. Either on their own or as a result of a crisis, this is when many individuals first find help from a rehab center to begin receiving treatment. As a result, this stage can mark the end of their addiction, as well as the start of new life without drugs and alcohol, that is filled with hope for the future

Drug/Substance Dependence

According to DSM IV (2018), it is defined as a maladaptive pattern of substance use leading to clinically significant impairment or distress occurring at any time in the same 12 months period as manifested by 3 or more of the following;

1. Tolerance

The individual needs a higher dose of the substance to achieve the usual initial satisfactory effect or the current dose doesn’t give the usual initial satisfactory effect.

2. Primacy

The substance of abuse becomes the priority in the abuser’s hierarchy of needs.

3. Withdrawal

This occurs once an abuser stops ingesting the substance the body begins to react to it negatively e.g. an individual abusing Valium (Diazepam) and stopped suddenly such person can experience seizures, insomnia.

Opioid withdrawal symptoms include; excessive yawning, tearing, diarrhea, diaphoresis, joint pain, vomiting

4. Harmful Use

Regardless of the negative effect the abuser continually engage in, the abuse even with the knowledge of its detrimental effects.

5. Inability to Cut Down

An individual who voluntarily stopped abusing substances finds himself/herself engaging in it.

6. Excessive Craving

The individual finds the substance pleasurable and ensure to find it at all cost.

Risk Factors Associated With Substance Abuse

  1. Age (15-24 yrs)
  2. Male Gender
  3. Siblings or parental exposure
  4. Parental deprivation (divorce, separation, death of spouse)
  5. Exposure to high-risk job (breweries, bar, tobacco companies)
  6. Advertisement
  7. Poor economic status
  8. Experiment/curiosity: Experimental Curiosity: Curiosity to experiment the unknown facts about drugs thus motivates adolescents into drug use. The first experience in drug abuse produces a state of arousal such as happiness and pleasure which in turn motivate them to continue.
  9. Peer pressure: Peer Group Influence: Peer pressure plays a major role in influencing many adolescents into drug abuse. This is because peer pressure is a fact of teenage and youth life. As they try to depend less on parents, they show more dependency on their friends.
  10. Lack of parental supervision: Many parents have no time to supervise their sons and daughters. Some parents have little or no interaction with family members, while others put pressure on their children to pass exams or perform better in their studies. These phenomena initialize and increases drug abuse.
  11. Personality Problems due to socio-economic Conditions: Adolescents with personality problems arising from social conditions have been found to abuse drugs. The social and economic status of most Nigerians is below average. Poverty is widespread, broken homes and unemployment is on the increase, therefore our youths roam the streets looking for employment or resort to begging. These situations have been aggravated by lack of skills, opportunities for training and re-training and lack of committed action to promote job creation by private and community entrepreneurs. Frustration arising from these problems lead to recourse in drug abuse for temporarily removing the tension and problems arising from it.
  12. The Need for Energy to Work for Long Hours: The increasing economic deterioration that leads to poverty and disempowerment of the people has driven many parents to send their children out in search of a means of earning something for contribution to family income.These children engage in hawking, bus conducting, head loading, scavenging, serving in food canteens etc. and are prone to drug taking so as to gain more energy to work for long hours.
  13. Availability of the Drugs: In many countries, drugs have dropped in prices as supplies have increased.

Theories of Drug Addiction

There are several theories that model addiction which are genetic theories, exposure theories (both biological and conditioning), and adaptation theories.

1. Genetic Theory

According to Danielle, stated that Genetic influences affect substance use and substance use disorders but largely are not specific to substance use outcomes.The genetic theory of addiction, known as addictive inheritance, attempts to separate the genetic and environmental factors of addictive behavior. Numerous large-scale twin studies have documented the importance of genetic influences on how much people use substances (alcohol, tobacco, other drugs) and the likelihood that users will develop problems. However, twin studies also robustly demonstrate that genetic influences affect multiple forms of substance use (alcohol, illicit drugs) as well as externalizing behaviors such as adult antisocial behavior and childhood conduct disorder. Accordling to stated that the majority of genetic influence on substance use outcomes appears to be through a general predisposition that broadly influences a variety of externalizing disorders and is likely related to behavioral undercontrol and impulsivity, which is a heterogeneous construct in itself.

2a. Exposure Theories: Biological Models

The exposure model is based on the assumption that the introduction of a substance into the body on a regular basis will inevitably lead to addiction. These theories suggest that brain chemistry, brain structure, and genetic abnormalities cause human behavior. The biological, as opposed to the conditioning models, believe that this is a consequence of biology. Underlying the exposure model is the assumption that the introduction of a narcotic into the body causes metabolic adjustments requiring continued and increasing dosages of the drug in order to avoid withdrawal. Although changes in cell metabolism have been demonstrated, as of yet they have not been linked with addiction. Some theorize that those drugs that mimic endorphins (naturally occurring pain killers), if used on a regular basis, will reduce the body’s natural endorphin production and bring about a reliance on the external chemical agent for ordinary pain relief. The neurological basis of substance abuse is an example of the biological models, as shown below (Figure 1).

fig 1

Figure 1: Neuro-Biological Basis of Drug Dependence

Dependence results from complex interaction of psychological effects of substance in brain area associated with motivation and emotion, combined with learning. Some area in the brain are responsible for pleasure which causes release of dopamine, for example dopamine level increases after sexual intercourse and intake of favorite meal, but for drug abusers, drugs became substituted for the activities that increases the level of dopamine, the brain learns to reinforce the pleasure by stimulating more of eating. The brain learns to substitute natural substances with natural activities and it increases dopamine level which causes increase pleasurable effect which is desired.

Anatomical Areas Involved in Drug Dependence

  1. Nucleus accumbiens
  2. Mesolimbic pathway in mid brain
  3. Central tegmental

2b. Exposure Theories: Conditioning Models

The basis of conditioning theories is that addiction is the cumulative result of the reinforcement of drug administration. The substance acts as a powerful reinforcer and gains control over the user’s behavior. In contrast to the biological models of the exposure theories, these conditioning models suggest that anyone can be driven to exhibit addictive behavior given the necessary reinforcements, regardless of their biology. The advantage of this theory is that it offers the potential for considering all excessive activities along with drug abuse within a single framework: those of highly rewarding behavior. There are many reinforcement models that have been defined including the opponent- process model of motivation and the well-known classical conditioning model. Both of these models define addiction as a behavior that is refined because of the pleasure associated with its reinforcement.

3. Adaptation Theories

The adaptation theories include the psychological, environmental and social factors that influence addiction. Advocates of these theories have analyzed how expectations and beliefs about what a drug will do for the user influence the rewards and behaviors associated with its use. They recognize that any number of factors, including internal and external cues, as well as subjective emotional experiences, will contribute to addictive potential. They support the views that addiction involves cognitive and emotional regulation to which past conditioning contributes.

The adaptation theory has also broadened the scope of addiction into psychological realms. Investigators have noted that drug users rely on drugs to adapt to internal needs and external pressures.

Common Signs of Drug Abuse

According to Williams, the common signs include:

A. Physical Warning Signs of Substance Abuse

These include

  • Bloodshot eyes, pupils larger or smaller than usual.
  • Changes in appetite or sleep patterns.
  • Sudden weight loss or gain.
  • Deterioration of physical appearance, personal grooming habits.
  • Unusual smells on breath, body, or clothing.
  • Tremors, slurred speech, or impaired coordination.

B. Behavioral Signs Of Substance Abuse

These include:

  • Drop in attendance and performance at work or school.
  • Unexplained need for money or financial problems. May borrow or steal to get it.
  • Engaging in secretive or suspicious behaviors.
  • Sudden change in friends, favorite hangouts, and hobbies.
  • Frequently getting into trouble (fights, accidents, illegal activities).

C. Psychological Warning Signs Of Substance Abuse

These include:

  • Unexplained change in personality or attitude.
  • Sudden mood swings, irritability, or angry outbursts.
  • Periods of unusual hyperactivity, agitation, or giddiness.
  • Lack of motivation; appears lethargic
  • Appears fearful, anxious, or paranoid, with no reason.

Reasons for Substance Abuse in Nigeria

The commonly reported reasons include the following:

  1. To increase physical performance
  2. To derive pleasure
  3. Desire to relax/sleep
  4. To keep awake
  5. To relieve stress
  6. To relieve anxiety
  7. Unemployment
  8. Frustration
  9. Easy access

Effects of Substance Abuse

The implications of substance abuse to the life of an individual are enormous and can be categorized as Physical, social and Psychological.

A. Physical Impact

There are also a number of issues affecting the physical health of the individual who is abusing drugs over a sustained period of time. According to the National Institute on Drug Abuse (2019), long-term drug abuse can affect:

  • The Kidneys. The human kidney can be damaged both directly and indirectly by habitual drug use over a period of many years. Abusing certain substances can cause dehydration, muscle breakdown, and increased body temperature—all of which contribute to kidney damage over time. Examples are, heroin, cocaine, marijuana.
  • The Liver. Liver failure is a well-known consequence of alcoholism, but it also can occur with individuals using opioids, steroids, inhalants, or habitually over many years. The liver is important for clearing toxins from the bloodstream, and chronic substance abuse can overwork this vital organ, leading to damage from chronic inflammation, scarring, tissue necrosis, and even cancer, in some instances. The liver may be even more at risk when multiple substances are used in combination.
  • The Heart. Many drugs have the potential to cause cardiovascular issues, which can range from increased heart rate and blood pressure to aberrant cardiac rhythms and myocardial infarction (i.e., heart attack). Injection drug users are also at risk of collapsed veins and bacterial infections in the bloodstream or heart.
  • The Lungs. The respiratory system can suffer damage related to smoking or inhaling drugs, such as marijuana and crack cocaine. In addition to this kind of direct damage, drugs that slow a person’s breathing, such as heroin or prescription opioids, can cause serious complications for the user.

Physical Signs Include

  • Insomnia
  • Tremor
  • Thought disturbance
  • Drowsiness
  • Weakness
  • Coma
  • Respiratory depression (depression of the central nervous system)
  • Sexually transmitted diseases(e.g. HIV/AIDS, hepatitis)
  • Death

B. Social Impact

Addiction creates social issues and public health concerns that extend beyond the home, school, and workplace to negatively impact larger groups of individuals.

  • Substance Abuse and the Home: Unfortunately, families all throughout society know the impact of addiction. If a person’s spouse or parent is abusing drugs, the results can be life-altering. It can result in financial hardships (due to job loss or money being diverted to fuel the habit). It may also cause reckless behavior that puts the family at risk. Addiction affects the entire family unit when one member is suffering.

Many cases of domestic violence within relationships are related to substance abuse. Addiction can happen on both sides of the conflict, not only by the abuser but also by the victim who uses drugs to cope. Drug use in the family is not limited to spouses or parents. Adolescents, especially during times of transition, may find themselves struggling with substance use. Children may experience maltreatment (including physical and sexual abuse and neglect), which may require the involvement of child welfare. Watching their parents suffer from substance use disorders may result in long-term mental and emotional disorders and delayed development. Children whose parents abuse drugs are more likely to end up using drugs or alcohol, as well.

  • Substance Abuse and the Workplace: Drug abuse social issues occur in the workplace, the substance use of employees can cause problems. An individual’s drug use will likely impact their work performance. Or, it may even stop them from going to work entirely. Substance abuse can lead to:
  • Decreased work productivity
  • Increased lateness and absences
  • Inappropriate behaviors at work, such as selling drugs to co-workers

These could lead to disciplinary actions and dismissal. Further, drug and alcohol abuse can lead to impaired judgment, alertness, and motor coordination, creating unsafe workplace conditions especially in an environment with heavy machinery.

Social Vices

One of the social effects of drug abuse on society is its direct link on criminal acts, murders etc. that affects the society at large.

D. Psychological Impacts

Substance abuse and mental health are linked because the psychological effects of drug addiction, including alcohol, cause changes in body and brain. A careful balance of chemicals keeps the cogs turning inside the body, and even the smallest change can cause one to experience negative symptoms.

  • Anxiety . There are a lot of similarities between anxiety and the effects of stimulants such as cocaine and methamphetamine. Conversely, using central nervous system depressants can also increase the risk of a person developing anxiety. A person could have a long-standing pattern of drug abuse and consequently develop anxiety problems. Many substances, particularly stimulants like cocaine, can cause anxiety as a dose-dependent side effects. Other drugs, like benzodiazepines, can bring about increased anxiety as part of their withdrawal syndromes.

Anxiety is best described as a disorder of the fight-or-flight response, where someone perceives danger that isn’t there. It includes the following physical and mental symptoms:

  • Rapid heart rate
  • Excessive worrying
  • Sweating
  • An impending sense of doom
  • Mood swings
  • Restlessness and agitation
  • Tension
  • Insomnia

Additionally, many addicts experience anxiety around trying to hide their habits from other people. In a lot of cases, it’s difficult to tell whether anxious people are more likely to abuse substances or if drugs and alcohol cause anxiety.

  • Depression. There is a clear association between substance abuse and depression. This relationship could be attributed to preexisting depression that led to drug abuse or it could be that substance use caused changes in the brain that increased depressive symptoms. Some people use drugs to self-medicate symptoms of depression, but this only alleviates the symptoms while the user is high. It may even make depression symptoms worse when the user is working through withdrawal. Many drugs have a withdrawal syndrome that includes depression or other mood disturbances, which can complicate recovery. The main symptoms associated with depression are:
  • Hopelessness
  • Lack of motivation
  • Dysregulated emotion
  • Loss of interest
  • Sleep disturbances
  • Irritability
  • Weight gain or loss
  • Suicidal ideation
  • Paranoia. Some drugs, like cocaine and marijuana, can cause feelings of paranoia that may amplify with long-term abuse. On top of this, people struggling with addiction may feel that they need to hide or lie about their substance use, indicating a fear of being caught. The fact that many substances of abuse are illegal can also contribute to mounting feelings of paranoia among long-term substance users.
  • Shame and Guilt. There is a stigma attached to addiction in society, and there’s a lot of guilt and shame for the individuals who struggle with the condition. Often, this is adding fuel to a fire that was already burning strong. People with substance use disorders tend to evaluate themselves negatively on a regular basis, which is a habit that has its roots in childhood experiences. Continual negative self-talk adds to feelings of shame and guilt. When you constantly feel as if you’ve done something wrong, it’s tempting to try to cover up these challenging emotions with drugs and alcohol. These unhelpful emotions contribute to the negative feedback loop that sends people spiraling into addiction.
  • A Negative Feedback Loop. From an outside perspective, someone with an addiction looks like they’re repeatedly making bad choices and ignoring reason. However, the truth is far more complicated and nuanced so much so that it can be very difficult for people to overcome a substance use disorder without inpatient or outpatient treatment. This is partly due to a negative feedback loop that occurs in the mind. When someone is addicted to drugs or alcohol, they feel a sense of comfort they haven’t been able to get elsewhere. Inevitably, this feeling is replaced by guilt and shame. They sober up and face the consequences of their actions. However, the weight of these feelings forces them to seek comfort in substances.
  • Loss of Interest. Loss of interest in activities you used to enjoy is a key symptom of both addiction and depression, but overcoming the former makes it much easier to gain control over the latter. It’s such a destructive symptom because of how demotivating it is to feel there’s no joy in the world. Everyone has passions and interests, but getting back to finding them isn’t easy for someone with these conditions [11-20].

Management of Substance Abuse

According to APA (2018), The management includes:

Pharmacologic Management

Pharmacologic management in substance abuse has two main purposes:

  • To permit safe withdrawal from substance of abuse and
  • To prevent relapse.

The drugs that consist the pharmcological intervention include:

  • alcohol withdrawal is usually managed with benzodiazepine-anxiolytic agent, which is used to suppress the symptoms of abstinence.
  • Disulfiram (antabuse). This may be prescribed to help deter clients from drinking.
  • Acamprosate (campral). This may be prescribed for clients recovering from alcohol abuse or dependence to help reduce cravings for alcohol and decrease the physical and emotional discomfort that occurs especially in the first few months of recovery.
  • It is a potent synthetic opiate used as a substitute for heroine in some maintenance programs.
  • it is a narcotic analgesic whose only purpose is the treatment of opiate dependence.
  • Naltrexone: It is an opioid antagonist often used in the treatment of overdose

1. Public Health approach: This Includes

Primary Level Management/Prevention

  • Creating awareness about substance abuse and their adverse consequences through aid of appropriate mass media tools delivering customized information suitable to the target audience such as family, schools, workers, religious organization, homes in a sensitive manner, Owing to the impact on all age groups of the society.
  • Provision of recreational activities for youths in urban areas.
  • Moral realignment for a derailed person.
  • Educational approaches targeting parents improving family lifestyle.
  • Drug education as part of school curriculum.
  • Screening ( drug screening for undergraduates)

Secondary Level Management

  • Laboratory tests such as
  • Blood test
  • Mean corpuscular volume
  • Urine drop test
  • Urinalysis
  • Detoxification
  • Treatment of associated mental and physical disorder
  • Psychotherapy
  • Cognitive behavioral therapy(CBT)
  • Family therapy
  • Maintenance of drug-free behavior such as use of anti-craving drugs

Tertiary Level Management

  • Occupational rehabilitation
  • Educational rehabilitation and counseling
  • Social rehabilitation
  • Provision of legal aid for abuser in legal dilemma
  • Social support

2. Psychosocial Supports To Substance Use Disorders

Psychosocial interventions are structured psychological or social interventions used to address substance-related problems. (APA,2022)..They can be used at different stages of drug treatment to identify the problem, treat it, and assist with social reintegration.The psychological aspects of development refer to an individual’s thoughts, emotions, behaviors, memories, perceptions, and understanding. The social aspects of development refer to the interaction and relationships among the individual, family, peers, and community (UNRWA, 2017). Psychosocial interventions can be used in a variety of treatment settings either as stand-alone treatments or in combination with pharmacological intervention. They can be implemented individually or in groups and delivered by a range of health workers. It is also considered to be the foundation of drug and alcohol treatment, especially for substances where pharmacological treatments have not been sufficiently evaluated. It involves the following

Psychological Supports for Substance Abuse Disorders and Addicts

A. Individual Therapy Interventions. The effectiveness of this interventions has been established primarily for alcohol use problems, although they have been applied to patients using other substances as well. The aim of the intervention is to help the patient understand that their substance use is putting them at risk and to encourage them to reduce or give up their substance use. It can range from 5 min of brief advice to 15-30 min of brief counseling. Intensive counseling is especially effective and there is a strong dose-response relation between counseling intensity and quitting success. In general, more the intense the treatment intervention greater is the rate of abstinence.

B. Motivation Interviewing. Motivational interviewing is a collaborative conversation style for strengthening a person’s own motivation and commitment to change. It is used to help people with different types of drug problems. Frequently, individuals are not fully aware of their drug problems or they can be ambivalent about their problems. It is often referred to as a conversation about change and it is used to help assist drug users to identify their need for change which is characterized by an emphatic approach in which the therapist helps to motivate the patient by asking about the pros and cons of specific behaviors, exploring the patient’s goals and associated ambivalence about reaching those goals, and listening reflectively to the patient’s response.

It seeks to address an individual’s ambivalence about their drug problems, as this is considered the main barrier to change.

It follows five stages:

  1. Expressing empathy for the client
  2. Helping the client to identify discrepancies between their behavior and their goals
  3. Avoiding arguments with the patient about their motivations and behaviors
  4. Rolling with the resistance of the patient to talk about some issues
  5. Supporting the patient s sense of self-efficacy

C. Cognitive Bhavioural Therapy. Cognitive behavioral therapy (CBT) is a umbrella term that encompasses cognitive therapy on its own and in conjunction with different behavioral strategies. Cognitive therapy is based on the principle that the way individuals perceive and process reality influences the way they feel and behave. As part of drug treatment, cognitive therapy helps clients to build self-confidence and address the thoughts that are believed to be at the root of their problems. Clients are helped to recognize the triggers for substance use and learn strategies to handle those triggers. Treatment providers work to help patients to identify alternative thoughts to those that lead to their drug use, and thus facilitate their recovery. Generally, cognitive therapy is provided after a client has been diagnosed as having drug dependence problems.

CBT treatment usually involves efforts to change thinking patterns. These strategies might include:

  • Learning to recognize one’s distortions in thinking that are creating problems, and then to reevaluate them in light of reality.
  • Gaining a better understanding of the behavior and motivation of others.
  • Learning to develop a greater sense of confidence in one’s own abilities.
  • Using role playing to prepare for potentially problematic interactions with others.
  • Learning to calm one’s mind and relax one’s body.

D. Contingency Management. Contingency management refers to a set of interventions involving concrete rewards for clients who achieve target behaviors. This approach is based around recognizing and controlling the relationship between behaviors and their consequences. It can be applied to drug users with different types of problems in a variety of settings. It has been used, for example, with opioid and cocaine users, and with homeless clients. Contingency management is used to maintain abstinence by reinforcing and rewarding alternative behaviors to drug use with the aim of making abstinence a more positive experience. Contingency management programs can, for example, be used during drug treatment to reward a user remaining abstinent or to incentivize a user’s presence at work in a social reintegration programme.

Social Skills Therapy. Social skills are defined as the ability to express positive & negative feelings in the interpersonal context without suffering loss of interpersonal reinforcement. Social skills training (SST) is a type of behavioral therapyused to improve social skills in people with mental disorders or developmental disabilities. Social skills can be taught, practiced and learned.The main purpose of social skills training is teaching persons who may or may not have emotional problems about the verbal as well as nonverbal behaviors involved in social interactions.

Another goal of social skills training is improving a patient’s ability to function in everyday social situations.

SST Techniques

  • Behavioral Rehearsal. Role play which involves practicing new skills during therapy in simulated situations
  • Corrective Feedback. Used to help improve social skills during practice
  • The educational component of SST that involves the modeling of appropriate social behaviors
  • Positive Reinforcement. used to reward improvements in social skills
  • Weekly Homework Assignments. Provide the chance to practice new social skills outside of therapy

E. Family Behavior Therapy (FBT). FBT focuses on how the behaviors of the person with the SUD affect the family as a whole and works to change those behaviors with the involvement of the entire family.Goals of family therapy include obtaining information about the patients and his factors which contribute to substance abuse. These include the patient’s attitude toward substance abuse, treatment adherence, social and vocational adjustment, level of contact with substance using peers, and degree of abstinence. Family support for abstinence, maintaining marital and family relationships are encouraged.Even the brief involvement of family members in the treatment program can enhance treatment engagement and retention.

F. Self Help Groups. Self-help groups are voluntary not-for-profit organizations where people meet to discuss and address shared problems, such as alcohol, drug or other addictions. Participants seek to provide support for each other, with senior members often mentoring or sponsoring new ones. Prominent examples include Alcoholics Anonymous and Narcotics Anonymous, and there is a range of other groups with similar purposes. As well as helping drug users, some self-help groups exist to support the family members of people with alcohol- and drug-related problems. Self-help groups can be used to help people to recognize their drug-related problems and can be a support during drug treatment, and they can help users to maintain abstinence and prevent relapse.

The groups aim to create a drug-free supportive network around the individual during the recovery process and provide opportunities to share experiences and feelings.

H. Therapeutic Communities. Residential rehabilitation programs (sometimes called therapeutic communities) are usually long-term programs where people live and work in a community of other substance users, ex-users and professional staff. Programs can last anywhere between 1 and 24 months (or more). The aim of residential rehabilitation programs is to help people develop the skills and attitudes to make long-term changes toward an alcohol- and drug-free life-style. Programs usually include activities such as employment, education and skills training, life skills training (such as budgeting and cooking), counseling, group work.

Implications

Nursing Education and Practice

  • Advocacy to focus on strengthening family support system, self help and peer group optimizations.
  • Creating awareness about substance abuse and their adverse consequences through aid of appropriate mass media tools delivering customized information suitable to the target audience such as family, schools, workers, religious organization, homes in a sensitive manner, Owing to the impact on all age groups of the society.
  • It is of prime importance to design and formulate an effective community based and a holistic strategy to address the needs of the drug abuser and their family comprehensively. Multiple measures such as identifying the psychosocial determinants that may determine the use of illicit drug, developing family prevention programs in the form of multi-dimensional family therapy and individual cognitive behavioral therapy
  • Sensitizing clinicians to identify patients at risk for nonprescription drug abuse, strengthening preclinical assessment to predict substance abuse liability, encouraging exercises as a potential treatment for drug abuse and building mechanisms for tracking and monitoring prescription drug abuse.
  • Formulating strategies in collaboration with international agencies to monitor the sale of over-the-counter drugs and enforcing stricter penalties for individuals who are involved in trade of illicit drugs.
  • Also, an important role to play in screening the adolescent, youths for drug use during routine medical checkup.

Nursing Research

  • Collaborate with other health personnel in research study relating to substance abuse thus providing new information in the Psychological care of clients with substance abuse [21-28].

Conclusion

Substance abuse is still a menace and has grown to become global subculture whose effects is cataclysmic and cuts across every society, creed, or race. However, no individual is born an abuser, but the multifarious human activities have through learning, interaction, and curiosity made man to develop this habit. It is empirical that substance abuse is more common amongst the youth especially in Nigeria. The habit develops as an attempt for instance to justify a curiosity in the daily interactions as man is a gregarious animal.

To the individual, its effects can be physiological and psychological, which gradually penetrates the society and affects all productive endeavors both socially and economically. As a menace, substance abuse has habitually become a means to an end which calls for individuals, families, groups, communities, societies and the Nigerian government to collaboratively join hands in curbing the menace. Psychosocial support is presented here as a way out of the menace. Mental health nurses are central to providing the support.

Recommendations

In an attempt to proffer some meaningful solutions to curb the menace of substance abuse, the following recommendations are presented to both government and the society at large.

(a) Government policies targeted at developing the society are more often than not mere paper work. Thus, the government should ensure that through its policies, jobs are created, social services are rendered, and above all, its policies should be feasible and capable of implementation.

(b) Hospitals and clinics should be well stocked with genuine drugs and trained physicians put in place to ensure proper prescription of drugs while monitoring how the patients take such drugs to avoid over or under dosage tendencies which will lead to drug abuse.

(c) There should be a proper scrutiny and licensing of patent medicine stores, and such should be operated by well-trained Pharmacists. Alongside this, street drug hawking should be discouraged since this can promote accessibility to drug abusers.

(d) Individuals, families, communities, and the entire society should ensure that moral values are inculcated in the youths, by joining the government’s fight against the menace.

(e) Implementing a policy of asking patients about their needs an wishes concerning psychosocial supports, as well routinely assessing their levels of psychosocial which may bring about meaningful progress for psychosocial care.

(f) Rehabilitation centers such as therapeutic and penal institutions should be equipped, employ trained staff as well as involve in proper guidance and counseling.

(g) Institutions like the National Drugs Law Enforcement Agency (NDLEA) and the National Agency for Food and Drug Administration and Control (NAFDAC) should be empowered to squarely deal with “Drug Barons” as well their traffickers, peddlers, and conduits. This is because at times, their performances are undermined by the threats they get as well as the purported connections such barons and the traffickers have with people in higher authority.

(h) Government should encourage even development at all levels by providing the required skills, social services and recreational facilities to reduce Rural-Urban migration, as it was also found that so many youths migrate from rural areas to urban areas to search for the greener pastures and facilities lacking in the rural areas.

(i) Non-Governmental Organizations (NGOs) and Community Based Organizations (CBOs) should encourage the sensitization campaigns against drug abuse as well as engage in rehabilitation programs.

(j) Educational Institutions at all levels whether public or private should organize workshops, lectures/ symposiums to enlighten the people on the dangers of drugs and substance abuse.

References

  1. Abubakar IJ, Abubakar SK, Abubakar G, Zayyanu S, Garba Mohammed K, et al. (2021) The Burden of Drug Abuse in Nigeria: A Scoping Review of Epidemiological Studies and Drug Laws. National library of medicine. National library Of Medcine. [crossref]
  2. American Psychological Association (2022) Breaking Free From Addiction.
  3. Abiodun O (2021) Drug abuse and its clinical implications with special reference to Nigeria. Central.
  4. Bramer WM, Rethlefsen ML, Kleijnen J, Franco OH (2017) Optimal database combinations for literature searches in systematic reviews: a prospective exploratory study.
  5. Yunusa U, Bello UL, Idris M, Haddad MM, Adamu D (2017) Determinants of substance abuse among commercial bus drivers in Kano Metropolis, Kano State, Nigeria. American. Journal of Nursing Science.
  6. Brookdale Premier Addiction Recovery (2022) Seven Stages of Addiction.
  7. Daniel M (2016) The Genetics of Addiction. Journal of Studies on Alcohol and Drug 77: 673-675.
  8. Drugs, Brains, and Behaviour, The Science Of Addiction (2014). National Institute on Drug Abuse.
  9. Adamson TA, Onifade PO, Ogunwale A (2010) Trends in socio demographic and drug abuse variables in Patients with alcohol and drug use disorders in a Nigerian treatment facility. West Afr J Med 29: 12-18. [crossref]
  10. Arli C (2020) Overview of Social Skills Training.
  11. Benjamin A, Chidi N (2014) Drug abuse, addiction and dependence, pharmacology and therapeutic. Swiss School of Public Health Journals.
  12. Behavioural Health Resources and Services Directory For Carrol Country (2020): Signs And Symptoms Of Drug Abuse.
  13. Dankani I (2017) Abuse of cough syrups: a new trend in drug abuse in north western Nigerian states of kano, Sokoto, Katsina, Zamfara and Kebbi. International Journal of Physical and Social Science 2: 199-213.
  14. Essien CF (2010) Drug use and abuse among students in tertiary institutions-the case of federal University of technology, Minna. Journal of Reseach in National Development.
  15. Erah F, Omaseye A (2017) Drug and alcohol abuse among secondary school students in a rural community in southsouth Nigeria. Annals of Medical and Surgical Practice Journal 2.
  16. Famuyiwa O, Aina OF, Bankole-Oki OM (2011) Epidemiology of psychoactive drug use amongst adolescents in metropolitan Lagos, Nigeria. European Child & Adolescent Psychiatry Journal 20: 351-359. [crossref]
  17. Gobir A, Sambo M, Bashir S, Olorukoba A, Ezeh O, etal. (2017) Prevalence and determinants of drug abuse among youths in a rural community in north western Nigeria. Tropical Journal of Health Sciences.
  18. Gureje O, Olley D (1992) Alcohol and drug abuse in Nigeria: view of the literature Contemporary Drug Problems.
  19. Makanjuola BA, Sabitua O, Tanimola M (2007) National Drug Laws EnforcementAgency (2020).
  20. Namadi M (2016) Drug abuse among adolescents in Kano metropolis, Nigeria. Ilimi Journal of Art and Social Sciences 2.
  21. Nigeria, Federal Ministry of Health, National Policy for Controlled Medicines, 2017.
  22. Pela OA, Ebie C (1982) Drug abuse in Nigeria: a review of epidemiological studies. National Library Of Medicine pubmed.
  23. Pharmacists Council of Nigeria (2020).
  24. Abubakar IJ, Abubakar SK, Abubakar G, Zayyanu S, Garba Mohammed K, et al. (2019) The Burden of Drug Abuse in Nigeria: A Scoping Review of Epidemiological Studies and Drug Laws. National library of medicine. National Library of Medcine. [crossref]
  25. Ladipo A (2021) Menace Of Drug Abuse. The Sun Journals.
  26. Lauren B (2022) Long Term Drug Addiction Effects. American Addiction Centers Drug Abuse.Com.
  27. Mohd F (2022) Social Skills Among Psychiatric Patient.
  28. Theories Of Substance Abuse (2022).