Author Archives: author

Numerical Simulation of Surface and Internal Wave Excitation due to an Air Pressure Wave

DOI: 10.31038/GEMS.2023533

Abstract

The excitation of surface and internal water waves by an air pressure wave has been numerically simulated in several model cases, using a nonlinear shallow water model of velocity potential. Water waves were excited when the air pressure wave speed was close to the water wave speed in the surface mode or internal mode. The surface mode waves traveling as free waves after being excited by an air pressure wave  were  also  amplified  by  the shallowing on a sloping seabed. When the air pressure wave with a speed close to that of the internal mode stopped, free surface waves in the internal mode hardly appeared, unlike the free internal waves.

Keywords

Surface wave, Internal wave, Air pressure wave, Proudman resonance, Nonlinear shallow water

Introduction

Internal waves in various waters, such as the East China Sea, e.g., [1,2], and Lake Biwa, e.g., [3,4], may gain large wave heights because the density ratio in water is not as large as that of surface waves. Although various sources of internal waves—tidal currents [5], wind- driven near-inertial waves [6], etc.—have been revealed, the causes of internal waves are unknown in many actual waters.

In the present study, we consider surface/internal wave excitation due to an air pressure wave. Regarding surface waves, air pressure waves of a few hectopascals often generate meteotsunamis around the world, e.g., [7,8,9]. For example, at the west coasts of Kyushu, Japan, meteotsunamis called “Abiki” are observed, e.g., [10,11]. Conversely, internal waves are also generated and amplified by air pressure waves due to meteorological factors including typhoons [12,13]. The excitation mechanism underlying these phenomena is the Proudman resonance [14], which is also known as the cause of other transient waves, e.g., [15,16,17,18,19]. Moreover, the resonance triggered by air pressure waves from a volcanic eruption may generate global tsunamis, e.g., [20,21]. Artificial waves can also be created by the resonance when an airplane moves on a very large floating airport [22].

In this basic research, numerical simulations of surface and internal wave excitations due to an air pressure wave have been generated in several model cases, using a nonlinear shallow water model of velocity potential. Although the wave dispersion and Coriolis force are not considered, the proposed simple model will provide an easy-to-use tool for predicting long-wave excitations from air pressure changes estimated in weather forecasts. We consider the cases in which the air pressure wave speed is close to the surface or internal mode speed.

Method

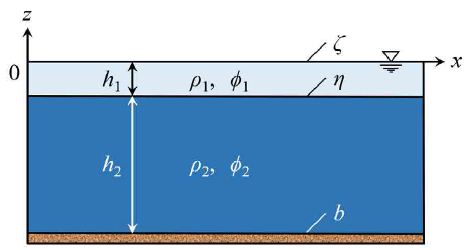
We consider the irrotational motion of inviscid and incompressible fluids in two layers, as illustrated in Figure 1.

FIG 1

Figure 1: Two-layer water

The still water depths of the upper and lower layers are h1(x) and h2(x), respectively, and h(x) = h1(x) + h2(x). We assume that the densities of the upper and lower layers, ρ1 and ρ2, respectively, are uniform and constant, and that the fluids do not mix even in motion. The water surface displacement, interface displacement, and seabed position are denoted by ζ(x, t), η(x, t), and b(x), respectively. Friction is ignored everywhere for simplicity. The velocity potentials of the upper and lower layers are ϕ1(x, t) and ϕ2(x, t), respectively.

The nonlinear shallow water equations of velocity potential considering the pressure on the water surface, p0(x, t), are

Upper Layer

∂η/∂t = ∂ζ/∂t + ∇[(ζ η) ∇ϕ1],      (1)

∂ϕ1/∂t = – [+ p0 /ρ1 + (∇ϕ1)2/2],      (2)

Lower Layer

∂η/∂t = –∇ [(η b) ∇ϕ2],       (3)

∂ϕ2 /∂t = – [+ (p1 + P2 )/ρ2  + (∇ϕ2 )2/2],      (4)

where ∇ = (∂/∂x, ∂/∂y) is a horizontal partial differential operator. The gravitational acceleration g is 9.8 m/s2, p1(x, t) is the pressure at the interface, and P2 = (ρ2ρ1)gh1. Equations (1)–(4) can be derived by reducing the nonlinear equations based on the variational principle [23].

Substituting Equation (3) into Equation (1), we obtain

∂ζ/∂t = – {∇ [(ζ η) ∇ϕ1] + ∇ [(η b) ∇ϕ2]}.       (5)

In the upper layer, reversing the direction of the integration with respect to z gives the following auxiliary equation as

∂ϕ1/∂t + + p1/ρ1  + (∇ϕ1)2/2 = 0,      (6)

which corresponds to the Bernoulli equation on z = η.

By substituting Equation (2) into Equation (6), we obtain

p1  = p0  + ρ1 g(ζ η),       (7)

which expresses the hydrostatic pressure distribution. By substituting Equation (7) into Equation (4), we obtain

∂ϕ2/∂t = – [+ p0/ρ2 + r-1g(ζ η) + (1 – r-1)gh1 + (∇ϕ2)2/2], (8)

where r = ρ2/ρ1 > 1.

By eliminating p1 from Equations (4) and (6), we obtain

∂ϕ1/∂t r∂ϕ2 /∂t = (r – 1)g(η + h1) – [(∇ϕ1 )2r(∇ϕ2)2]/2.                   (9)

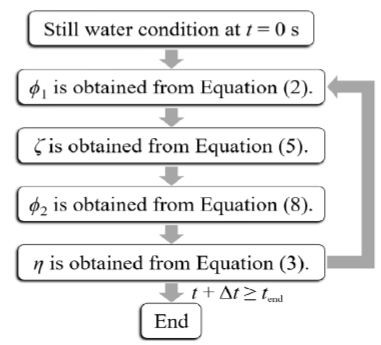
We explicitly solve the above equations using a finite difference method with the central difference in space and the forward difference in time. When the pressure at the water surface, p0, is known and the water surface displacement ζ is unknown, the procedure shown in

Figure 2 is repeated, starting from the initial still water state, to obtain new time-step values one after another.

FIG 2

Figure 2: Procedure for obtaining the surface displacement ζ,interface displacement η, and velocity potentials in the upper and lower layers, ϕ1 and ϕ2, respectively, when the pressure at the water surface, p0, is given.

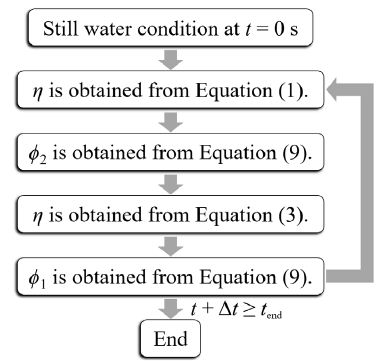
Conversely, when the pressure at the water surface, p0, is unknown and the water surface displacement ζ is known, we adopt the procedure shown in Figure 3, which was not used in the present calculations.

FIG 3

Figure 3: Procedure for obtaining the interface displacement η and velocity potentials  in the upper and lower layers, ϕ1  and ϕ2, respectively, when the surface displacement ζ  is given.

Conditions

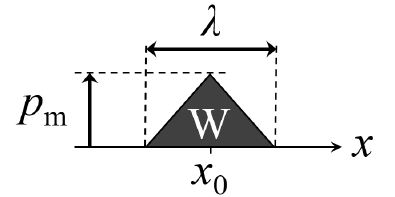
Focusing on one-dimensional wave propagation in the x-axis direction, we assumed that a steady air pressure wave W, as sketched in Figure 4, traveled in the positive direction of the x-axis with a constant speed vP. The waveform of the air pressure wave was an isosceles triangle, where the length of its base, i.e., the wavelength λ, was 10 km or 20 km. The maximum and minimum pressures pm of positive and negative air pressure waves, respectively, were 2hPa and −2 hPa, respectively, referring the values in the meteotsunami and eruption cases [11,21]. The position of the air pressure wave center at the initial time, i.e., t = 0 s, was x0 = 50 km.

FIG 4

Figure 4: Waveform of the steady air pressure wave W at the initial time, i.e., t = 0 s. The air pressure wave traveled in the positive direction of the x-axis with constant speed vp.

The densities of the upper and lower layers were ρ1 = 1000 kg/m3 and ρ2 = 1025 kg/m3, respectively. Both the initial velocity potentials ϕ1(x, 0 s) and ϕ2(x, 0 s) were 0 m2/s. The grid width Δx was 250 m and the time step interval Δt was 1 s.

Excitation of the Surface Mode

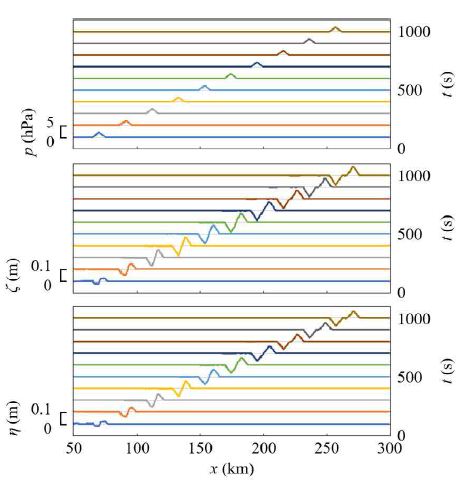
In Figure 4, the wavelength λ and the maximum pressure pm of the air pressure wave were 10 km and 2 h Pa, respectively. In the initial still water state, the total water depth h was 5000 m and the upper layer depth h1 was 1000 m, in Figure 1. For linear shallow water waves, the phase velocity of the surface mode, Cs, is √(gh) ≃ 220 m/s. When the traveling velocity of the air pressure wave, vp, is 207 m/s, which is close to Cs , the time variations of the air pressure distribution and both the surface and interface profiles are depicted in Figure 5, in which the results for 100 s ≤ t ≤ 1000 s are displayed every 100 s.

FIG 5

Figure 5: Time variations of the air pressure distribution, surface profile, and interface profile every 100 s. The still water depth h was 5000 m and the still water depth ratio h1/h was 0.2. The wavelength λ, maximum pressure pm, and speed vp of the air pressure  wave were 10 km, 2 hPa, and 207 m/s, respectively.

Figure 5 indicates that the crests and troughs in the surface mode were excited by the Proudman resonance not only at the surface but also at the interface, because the positions of the surface and interface were relatively close. When t = 100 s, the water wave crests have been generated at the air pressure rise, whereas the water wave troughs at the air pressure fall. The length of the water wave crests and troughs was approximately half the wavelength of the air pressure wave. Thereafter, the water wave crests gradually led away from the air pressure wave because the surface mode speed was greater than the air pressure wave speed. When t = 1000 s, the water wave crests were propagating as free waves, whereas the water wave troughs have been constrained by the air pressure wave, and the wavelength of each crest and trough was approximately the same as that of the air pressure wave.

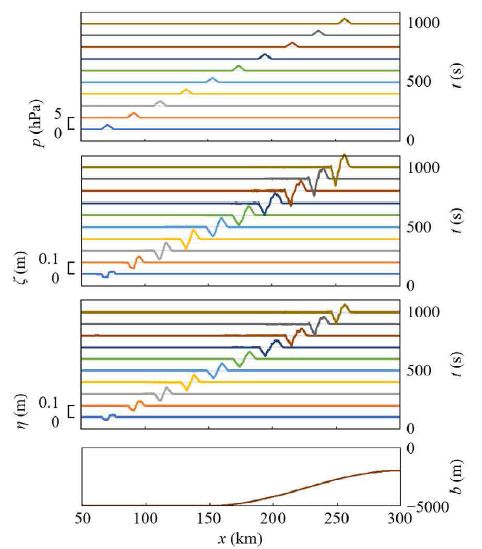
When the seabed is partially sloping, Figure 6 depicts the numerical results for the same conditions as in the case above, except for the topography, where the seabed position b is described as

b = −5000 m for 0 ≤ x < 150 km,

b = −3500 m − 1500 m × cos π (x/150 km – 1) for 150 km ≤ x ≤ 300 km. (10)

FIG 6

Figure 6: Time variations of the air pressure distribution, surface profile, and interface profile every 100 s. The seabed profile is also depicted, where the seabed position b is described by Equation (10). The initial water depth in the upper layer, h1 was 1000 m. The wavelength λ, maximum pressure pm, and speed vp of the air pressure wave were 10 km, 2 hPa, and 207 m/s, respectively.

As indicated in Figure 6, the second peaks of water wave crests were generated when the air pressure wave speed approached the surface mode speed on the slope. Moreover, both the water wave crests and troughs were amplified by shallowing on the slope after they moved away from the air pressure wave. It should be noted that the shallowing effect requires water waves that are traveling as free waves apart from the air pressure waves that excited the water waves. When an eruption creates air pressure waves with different speeds, as in the case of the 2022 Hunga Tonga–Hunga Ha`apai volcanic eruption,  the air pressure waves excite tsunamis at water depths corresponding to the air pressure wave speeds [24], and each tsunami traveling apart from the air pressure wave that excited it can be amplified by shallowing on a ridge, shelf slope, continental shelf, etc. Tsunamis traveling as free waves after being excited by air pressure waves may also be amplified by being passed by subsequent air pressure waves over topography [21], as indicated in the water wave crests at t = 1000 s in Figure 6. Moreover, bay oscillations, currents, and horizontally two-dimensional changes in topography may amplify tsunamis, similar to submarine earthquake tsunamis.

Excitation of the Internal Mode

The wavelength λ and the maximum pressure pm of the air pressure wave were 10 km and 2 hPa, respectively, in Figure 4. The still water depth h was uniformly 5000 m, and the still water depth ratio h1/h was 0.2, in Figure 1. The internal mode speed for linear shallow water waves without surface waves is

11

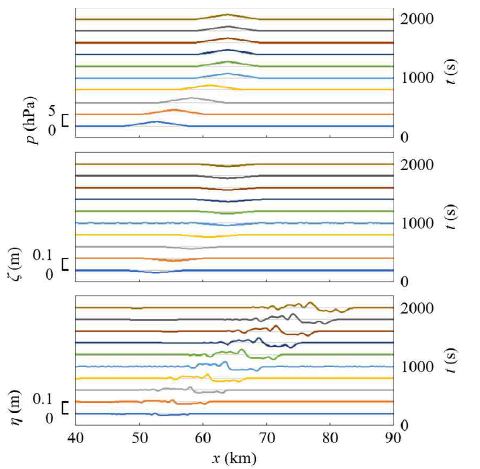
so Ci ≃ 14 m/s in the present case. We assumed that while 0 s ≤ t < 1000 s, the air pressure wave speed vp was 14 m/s, which was almost equal to Ci, whereafter the air pressure wave stopped at t = 1000 s, and the air pressure distribution was stagnated for t ≥ 1000 s. The time variations of the air pressure distribution and both the surface and interface profiles are depicted in Figure 7, in which the results for 200 s ≤ t ≤ 2000 s are displayed every 200 s.

FIG 7

Figure 7: Time variations of the air pressure distribution, surface profile, and interface profile every 200 s. The still water depth h was 5000 m and the still water depth ratio h1/h was 0.2. The wavelength λ, maximum pressure pm, and speed vp of the air pressure wave were 10 km, 2 hPa, and 14 m/s, respectively.

Based on Figure 7, the internal waves in the internal mode were excited by the Proudman resonance, and especially the crest was amplified remarkably. Conversely, free surface waves in the internal mode hardly appeared because the surface wave crest was constrained by the stagnant air pressure distribution.

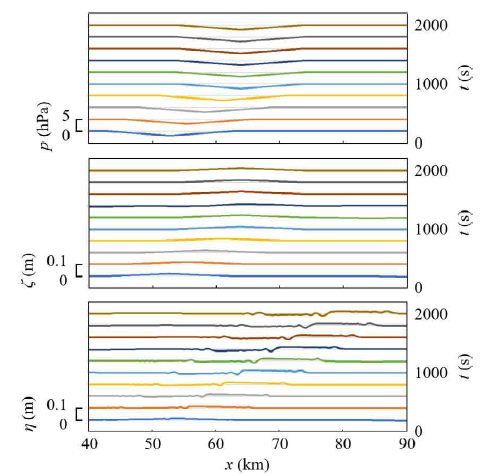
When the wavelength λ and the minimum pressure pm of the air pressure wave are 20 km and −2 hPa, respectively, Figure 8 presents the numerical results for the same other conditions as in the above case.

FIG 8

Figure 8: Time variations of the air pressure distribution, surface profile, and interface profile every 200 s. The still water depth h was 5000 m and the still water depth ratio h1/h was 0.2. The wavelength λ, minimum pressure pm, and speed vp of the air pressure wave were 20 km, −2 hPa, and 14 m/s, respectively.

In Figure 8, the waveform of the generated internal waves propagating as free waves is different from the vertically inverted waveform of the above-mentioned internal waves due to the air pressure wave of positive pressure, disregarding the difference in wavelength. Therefore, future work is required to investigate the stability of the upward and downward convex internal waves due to an air pressure wave, considering higher-order terms of the velocity potential.

Conclusion

The excitation of surface and internal water waves by an air pressure wave was numerically simulated using the nonlinear shallow water model of velocity potential. The water waves were excited when the air pressure wave speed was close to the water wave speed in each mode. The surface mode waves traveling as free waves after being excited by an air pressure wave were also amplified by the shallowing on the sloping seabed. When the air pressure wave, the speed of which was close to the internal mode speed, stopped, free surface waves in the internal mode hardly appeared, unlike the free internal waves.

In the present model, wave dispersion is ignored, so in the future, the excitation of relatively shorter water waves by air pressure waves should be investigated using a numerical model with higher-order terms of velocity potential.

Conflicts of Interest

The author declares no conflict of interest.

References

  1. Hsu MK, Liu AK, Liu C (2000) A study of internal waves in the China Seas and Yellow Sea using Continental Shelf Research 20 : 389-410.
  2. Nam S, Kim Dj, Lee SW, Kim BG, Kang Km, Cho YK (2018) Nonlinear internal wave spirals in the northern East China Scientific Reports 8.
  3. Kanari S (1973) Internal waves in Lake Biwa (H)—numerical experiments with a two layer model. Bulletin of the Disaster Prevention Research Institute 22 : 70-96.
  4. Jiao C, Kumagai M, Okubo K (1993) Solitary internal waves in Lake Bulletin of the Disaster Prevention Research Institute 43 : 61-72.
  5. Hibiya T (1988) The generation of internal waves by tidal flow over Stellwagen Journal of Geophysical Research 93 : 533-542.
  6. Le Boyer A, Alford MH (2021) Variability and sources of the internal wave continuum examined from global moored velocity Journal of Physical Oceanography 51: 2807-2823.
  7. Vilibić I, Monserrat S, Rabinovich A, Mihanović H (2008) Numerical modelling of the destructive meteotsunami of 15 June, 2006 on the coast of the Balearic Islands. Pure and Applied Geophysics, 165 : 2169-2195.
  8. Bailey K, DiVeglio C, Welty, A (2014) An examination of the June 2013 East Coast meteotsunami captured by NOAA observing systems. NOAA Technical Report, NOS CO-OPS 079.
  9. Niu X, Zhou H (2015) Wave pattern induced by a moving atmospheric pressure disturbance. Applied Ocean Research 52 : 37-42.
  10. Hibiya T, Kajiura, K (1982) Origin of the Abiki phenomenon (a kind of seiche) in Nagasaki Journal of the Oceanographical Society of Japan 38 : 172-182.
  11. Kakinuma T (2019) Long-wave generation due to atmospheric-pressure variation and harbor oscillation in harbors of various shapes and countermeasures against meteotsunamis. In Natural Hazards—Risk, Exposure, Response, and Resilience; Tiefenbacher JP, Ed : IntechOpen: London, Pg : 81-109.
  12. Geisler JE (1970) Linear theory of the response of a two layer ocean to a moving hurricane. Geophysical and Astrophysical Fluid Dynamics 1 : 249-272.
  13. Dotsenko SF (1991) Generation of long internal waves in the ocean by a moving pressure zone. Soviet Journal of Physical Oceanography 2 : 163-170.
  14. Proudman J (1929) The effects on the sea of changes in atmospheric Geophysical Journal International 2 : 197-209.
  15. Whitham GB (1974) Linear and Nonlinear Waves, John Wiley & Sons, Inc.: New York, NY, Pg : 511-532.
  16. Lee S, Yates G, Wu T (1989) Experiments and analyses of upstream-advancing solitary waves generated by moving disturbances. Journal of Fluid Mechanics 199 : 569-593.
  17. Kakinuma T; Akiyama M (2007) Numerical analysis of tsunami generation due to seabed deformation. In Coastal Engineering 2006; Smith JM, Ed : World Scientific Publishing , Pte. Ltd.: Singapore. Pg : 1490-1502.
  18. Dalphin J, Barros R (2018) Optimal shape of an underwater moving bottom generating surface waves ruled by a forced Korteweg-de Vries Journal of Optimization Theory and Applications 180 : 574-607.
  19. Michele S, Renzi E, Borthwick A, Whittaker C, Raby A (2022) Weakly nonlinear theory for dispersive waves generated by moving seabed deformation. Journal of Fluid Mechanics 937.
  20. Garrett CJR (1970) A theory of the Krakatoa tide gauge disturbances. Tellus 22 : 43- 52.
  21. Kakinuma T (2022) Tsunamis generated and amplified by atmospheric pressure waves due to an eruption over seabed Geosciences 12.
  22. Kakinuma T, Hisada M (2023) A numerical study on the response of a very large floating airport to airplane Eng 4 : 1236-1264.
  23. Kakinuma T (2003) A nonlinear numerical model for surface and internal waves shoaling on a permeable beach. In Coastal Engineering VI; Brebbia CA, Lopez- Aguayo F, Almorza D, Eds : Wessex Tech. Press, Pg : 227-236.
  24. Yamashita K, Kakinuma T (2022) Interpretation of global tsunami height distribution due to the 2022 Hunga Tonga-Hunga Ha’apai volcanic Preprint available at Research Square.

Double Cote’s Spiral in M83 Galaxies, NGC 1566 and Cyclone in the South Georgia and South Sandwich Islands

DOI: 10.31038/GEMS.2023532


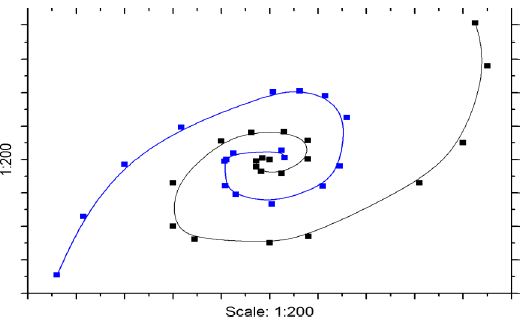
One comparative analysis of the shape of spiral galaxies and the subtropical cyclone that formed north of Georgia Island and passed north of the South Sandwich Islands, in the South Atlantic Ocean. Subtropical cyclones with double spirals appear to be common in these areas of the South Atlantic. A subtropical cyclone is a weather system that has some characteristics of a tropical cyclone and some characteristics of an extratropical cyclone. They can form between the equator and the 50th parallel. In mathematics, a spiral is a curve, which emanates from a point, moving farther away as it revolves around the point. The characteristic shape of hurricanes, cyclones, typhoons is a spiral. The characteristic equation of which spiral the Extratropical Cyclone (EC) Its double spiral shape, whose mathematical equation has already been defined as Cote’s spiral, Gobato et al. (2022) and similarly Lindblad (1964) show shape of double spiral galaxies, already studied among others is discussed here [44].

The South Georgia Group lies about 1,390 km (860 mi; 750 mi) east-southeast of the Falkland Islands, at 54°-55°S, 36°-38°W. It comprises South Georgia Island itself by far the largest island in the territory, and the islands that immediately surround it and some remote and isolated islets to the west and east-southeast. It has a total land area of 3,756 square kilometers (1,450 sq. mi), including satellite islands, but excluding the South Sandwich Islands, which form a separate island group [53,56]. A cyclone is a large air mass that rotates around a strong center of low atmospheric pressure, counterclockwise in the Northern Hemisphere and clockwise in the Southern Hemisphere as viewed from above (opposite to an anticyclone) [14,27,29]. A subtropical cyclone is a weather system that has some characteristics of a tropical cyclone and some characteristics of an extratropical cyclone. They can form between the equator and the 50th parallel [19,26,27].

These storms usually have a radius of maximum winds that is larger than what is observed in purely tropical systems, and their maximum sustained winds have not been observed to exceed about 32 m/s (64 knots). Subtropical cyclones sometimes become true tropical cyclones, and likewise, tropical cyclones occasionally become subtropical storms. Subtropical cyclones in the Atlantic basin are classified by their maximum sustained surface winds: Subtropical depressions have surface winds less than 18 m/s (35 knots), while subtropical storms have surface winds greater than or equal to 18 m/s [921,26,27,29].

In mathematics, a spiral is a curve, which emanates from a point, moving farther away as it revolves around the point [2325]. The characteristic shape of hurricanes, cyclones, typhoons is a spiral [26,27,29,3441]. There are several types of turns, and determining the characteristic equation of which spiral the cyclone bomb (CB) [28] fits into is the goal of the work. Spiral galaxies form a class of galaxy originally described by Edwin Hubble in his 1936 work The Realm of the Nebulae and, as such, form part of the Hubble sequence. Most spiral galaxies consist of a flat, rotating disk containing stars, gas and dust, and a central concentration of stars known as the bulge. These are often surrounded by a much fainter halo of stars, many of which reside in globular clusters [54].

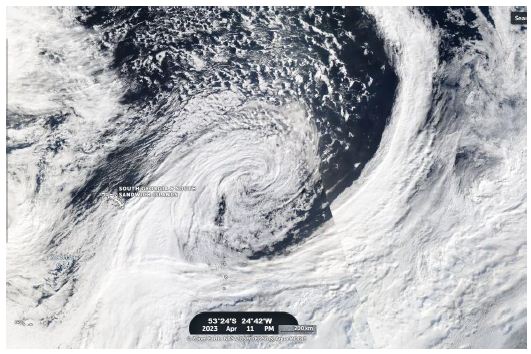
The core of cyclone presents the form of a double spiral, Figure 1, in the same way the study of the spiral of the galaxies of Lindblad, (1964) [32]. This spiral is denoted from Cotes Spiral Gobato et al. (2000) [711,1820,2225,44].

fig 1

Figure 1: Image of Georgia, scale 1:200, on April 11, 2003, PM, and nucleus at the coordinates given in the image [46] [Authors].

The very fine image quality of this camera, coupled with the huge light-collecting power of the VLT, reveals vast numbers of stars within the galaxy. The images were taken in three different parts of the infrared spectrum and the total exposure time was eight and a half hours, split into more than five hundred exposures of one minute each. The field of view is about 13 arcminutes across [49,55].

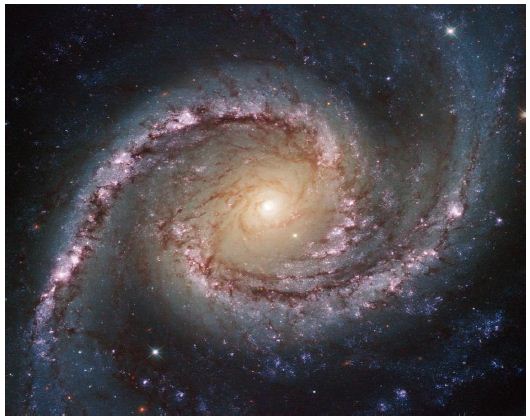
The Figure 2 show Hubble image captures hundreds of thousands of individual stars, thousands of star clusters and hundreds of supernova remnants in the spiral galaxy M83. Also known as the Southern Pinwheel, this galaxy is located 15 million light-years away from Earth in the constellation Hydra. It was discovered in 1752 by the French astronomer Nicolas Louis de Lacaille. With an apparent magnitude of 7.5, M83 is one of the brightest spiral galaxies in the night sky. It can be observed using a pair of binoculars most easily in May [49,50].

fig 2

Figure 2: Spectacular spiral galaxies using the impressive power of the HAWK-I [49,50]

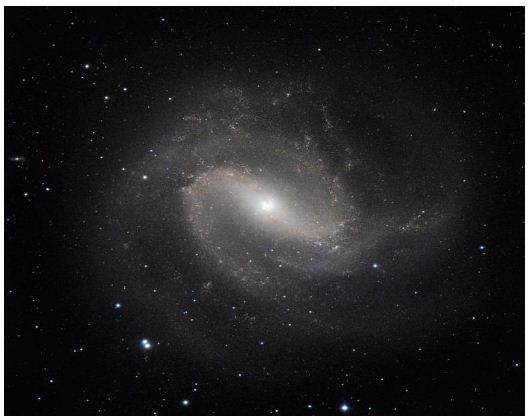
NGC 1566, sometimes known as the Spanish Dancer, is an intermediate spiral galaxy in the constellation Dorado, positioned about 3.5° to the south of the star Gamma Doradus (Figure 3). It was discovered on May 28, 1826 by Scottish astronomer James Dunlop. At 10th magnitude, it requires a telescope to view. The distance to this galaxy remains elusive, with measurements ranging from 6 Mpc up to 21 Mpc [50,51]. The small but extremely bright nucleus of NGC 1566 is clearly visible in this image, a telltale sign of its membership of the Seyfert class of galaxies. The centers of such galaxies are very active and luminous emitting strong bursts of radiation and potentially harboring supermassive black holes that are many millions of times the mass of the sun [50,51].

fig 3

Figure 3: Hubble image shows NGC 1566, a beautiful galaxy located approximately 40 million light-years away in the constellation of Dorado (The Dolphinfish). NGC 1566 is an intermediate spiral galaxy, meaning that while it does not have a well-defined bar-shaped region of stars at its center like barred spirals it is not quite an unbarred spiral either [50,51].

NGC 1566 is not just any Seyfert galaxy; it is the second brightest Seyfert galaxy known. It is also the brightest and most dominant member of the Dorado Group, a loose concentration of galaxies that together comprise one of the richest galaxy groups of the southern hemisphere. This image highlights the beauty and awe-inspiring nature of this unique galaxy group, with NGC 1566 glittering and glowing, its bright nucleus framed by swirling and symmetrical lavender arms [50,51].

NGC 1566 is an intermediate spiral galaxy, meaning that while it does not have a well-defined bar-shaped region of stars at its center like barred spirals it is not quite an unbarred spiral either [50,51]. The Figure 1 show the image of Georgia, scale 1:200, on April 11, 2003, PM, and nucleus at the coordinates given in the image. The Georgia, on April 11, 2003, PM and nucleus at the coordinates given in the image. The of Georgia, in an atmospheric pressure gradient model generated by the Zoom Earth system, on April 11, 2003, 12:30, with 951 mbar, and whose core was located at approximate coordinates of image. The image of Georgia, in surface wind model generated by the Zoom Earth system, on April 11, 2003, 12:00, with 5 km/h WSW, and nucleus at the coordinates given in the image.

The model of wind currents for the displacement of air masses observed in the images is consistent with that observed which presents a great turbulence in the vortex. The highlighted cyclone vortex still in turbulent formation presents two linear containment barriers, in an L shape. The subtropical cyclone that formed northwest of South Georgia and South Sandwich Island is here called Georgia. It moved 237 km in 12 h towards the West, when it was 589 km from South Georgia Island, to 809 km from the center of the coast of the South Georgia Island. During this time interval, it maintained an atmospheric pressure at sea level at its vortex close to 951 hPa. It presented rotational winds of 5 km/h approximately 8 km from the central vortex (Figure 4).

fig 4

Figure 4: Image of Georgia, scale 1:100, in surface wind model generated by the Zoom Earth system, on April 11, 2003, 12:00, with 5 km/h WSW, and nucleus at the coordinates given in the image.

The analogous shape of Georgia and the galaxies Messier 83 and NGC 1566, studied here, is clear. These present a double spiral, as studied by Lindblad [47], but with the Cote’s spiral form, Gobato et al. (2022) [8,9,11] (Table 1).

Table 1: Subtropical Cyclone Georgia: Location/Pressure

April 11, 2023

Coordinates

Pressure (hPa)

AM 5313’09”S 2745’05”W

951

PM 5316’42”S 2400’38”W

951

The subtropical cyclone that formed northwest of South Georgia & South Sandwich Island is here called Georgia. It moved 237 km in 12 h towards the West, when it was 589 km from South Georgia Island, to 809 km from the center of the coast of the South Georgia Island. During this time interval, it maintained an atmospheric pressure at sea level at its vortex close to 951 hPa. It presented rotational winds of 5 km/h approximately 8 km from the central vortex. With an approximate dimension of 1,000,000 km2, and an area of direct influence of 3,500,000 km2, the subtropical cyclone Georgia moved at an average speed of 19.75 km/h.

The mathematical model for the atmospheric pressure gradient used by ZoomEarth [43] matches the correct way to scale the atmospheric pressure, as can be seen in the comparison of the satellite images. The model of wind currents for the displacement of air masses observed in the images is consistent with that observed in which presents a great turbulence in the vortex. The image of Georgia, scale 1:20, on April 11, 2003, PM and nucleus at the coordinates given in the image. The image of Georgia, on a 1:100 scale, in an atmospheric pressure gradient model generated by the Zoom Earth system, on April 11, 2003, 12:30, with 951 mbar, and whose core was located at approximate coordinates of image, and image of Georgia, scale 1:100, in surface wind model generated by the Zoom Earth system, on April 11, 2003, 12:00, with 5 km/h WSW, and nucleus at the coordinates given in the image. The highlighted cyclone vortex still in turbulent formation presents two linear containment barriers, in an L shape. The have Georgia’s double spiral Cote’s shape. The analogous shape of Georgia and the galaxies Messier 83 and NGC 1566, studied here, is clear. These present a double spiral, as studied by Lindblad (1964) [47], but with the Cote’s spiral form, Gobato et al. (2022) [8,9,11,44].

References

  1. (2023) Creative CC BY-SA. Cyclone.
  2. American Meteorological Society (2020) Glossary of Meteorology:
  3. Landsea C (2009) Subject: (A6) What is a sub-tropical cyclone?
  4. Atlantic Oceanographic and Meteorological Laboratory.
  5. Armentrout D and Armentrout P (2007) Rourke Publishing (FL) Tornadoes, Series: Earth’s Power.
  6. Edwards R (2006) Storm Prediction National Oceanic and Atmospheric Administration. The Online Tornado.
  7. Gobato R, Mitra A and Valverde L (2022) Tornadoes analysis Concordia, Santa Catarina, Southern Brazil, 2022 season. Aeronautics and Aerospace Open Access Journal.
  8. Gobato R, Mitra A, Gobato MRR and Heidari A (2022) Cote’s Double Spiral of Extra Tropical Cyclones. Journal of Climatology & Weather Forecasting.
  9. Gobato R, Mitra A, Heidari A and Gobato MRR (2022) Spiral galaxies and powerful extratropical cyclone in the Falklands Islands. Physics & Astronomy International Journal.
  10. Gobato R, Heidari A, Mitra A and Gobato MRR (2022) Spiral Galaxies and Powerful Extratropical Cyclone in the Falklands Islands.
  11. Gobato R, Heidari A, Mitra A and Gobato MRR (2022) Extratropical Cyclone in the Falklands Islands and the Spiral Sumerianz Journal of Scientific Research.
  12. Gobato R, Heidari A, Mitra A and Gobato MRR (2022) Spiral Galaxies and Extratropical Cyclone.
  13. Gobato R, Mitra A (2022) Vortex Storms in the West of Santa Biomedicine and Chemical Sciences.
  14. Gobato R, Heidari A and Mitra A (2021) Mathematics of the Extra-Tropical Cyclone Vortex in the Southern Atlantic Ocean. Journal of Climatology & Weather Forecasting.
  15. Bluestein, HB (2013) Severe Convective Storms and Tornadoes: Observations and Dynamics, Series: Springer Praxis Books Springer-Verlag Berlin Heidelberg.
  16. Gobato R, Gobato MRR and Heidari A (2018) Evidence of Tornadoes Reaching the Countries of Rio Branco do Ivai and Rosario de Ivai, Southern Brazil on June 6, 2017. Climatol Weather Forecasting.
  17. Gobato R, Gobato MRR and Heidari A (2019) Evidence of Tornadoes Reaching the Countries of Rio Branco do Ivai and Rosario de Ivai, Southern Brazil on June 6, 2017.
  18. Gobato R, Gobato MRR and Heidari A (2019) Storm Vortex in the Center of Paraná State on June 6, 2017: A Case Study. Sumerianz Journal of Scientific Researcht.
  19. Gobato R, Heidari A, Mitra A and Gobato MRR (2020) Vortex Cote’s Spiral in an Extratropical Cyclone in the Southern Coast of Brazil. Archives in Biomedical Engineering and Biotechnology.
  20. Gobato R and Heidari A (2020) Vortex Cote’s Spiral in an Extratropical Cyclone in the Southern Coast of Brazil. J Cur Tre Phy Res App.
  21. Gobato R, Heidari A, Mitra A and Gobato MRR (2020) Cotes’s Spiral Vortex in Extratropical Cyclone Bomb South Atlantic Oceans. Aswan University Journal of Environmental Studies (AUJES)
  22. Gobato R, Gobato A and Fedrigo DFG (2016) Study of tornadoes that have reached the state of Parana. Parana J Sci Educ.
  23. Vossle DL (1999) Exploring Analytical Geometry with Mathematica. Academic Press,
  24. Casey J (2001) A treatise on the analytical geometry of the point, line, circle, and conic sections, containing an account of its most recent extensions, with numerous examples. University of Michigan Library.
  25. SharipovR (?) Course of Analytical Geometry. Bashkir State Univer-sity (Russian Federation)
  26. de Leão M and Rodrigues PR (1989) Methods of Differential Geometry in Analytical Mechanics, Series: Mathematics Studies. Elsevier Science
  27. Vasquez T (2002) Weather Forecasting Handbook (5th Edition) Weather Graphics
  28. Bluestein HB, Bosart LF and Bluestein Synoptical of Dynamic Meteorology and Weather Analysis and Forecasting: A Tribute to Fred Sanderson, Series: Meteorological Monographs 3(55) American Meteorological Society.
  29. Gobato R, and Heidari A (2020) Cyclone Bomb Hits Southern Brazil in 2020. Journal of Atmospheric Science Research.
  30. Rafferty JP (2010) Storms, Violent Winds, and Earth’s Atmosphere. Series: Dynamic Earth. Britannica Educational
  31. Krasny R (1986) A study of singularity formation in a vortex sheet by the point vortex approximation. Fluid Mech.
  32. Saffman PG (1992) Vortex Series: Cambridge monographs on mechanics and applied mathematics. Cambridge University Press.
  33. Sokolovskiy MA and Verron J (2000) Four-vortex motion in the two layer approximation – integrable case.
  34. Whittaker ET and McCrae Sir W (1989) Treatise on analytical dynamics of particles and rigid bodies. Cambridge Mathematical Library, Cambridge University
  35. George JJ (1960) Weather Forecasting for Aeronautics. Elsevier Inc.
  36. Yorke S (2010) Weather Forecasting Made Simple. Countryside Books Countryside Books.
  37. Anderson JD (1984) Fundamentals of Aerodynamics. McGraw-Hill
  38. Weisstein EW (2023) Cotes’s Spiral Cotes’s Wolfram MathWorld.
  39. Whittaker ET (2022) A Treatise on the Analytical Dynamics of Particles and Rigid Bodies: With an Introduction to the Problem of Three Bodies.
  40. Gobato R, Heidari A, Mitra A and Gobato MRR (2020) Cotes’s Spiral Vortex in Extratropical Cyclone bomb South Atlantic Oceans.
  41. Fischer R (1993) Fibonacci Applications and Strategies for Traders: Unveiling the Secret of the Logarithmic Spiral.
  42. Toomre A (?) Theories of Spiral Structure. Annual Review of Astronomy and Astrophysics.
  43. Oort jH (1970) The Spiral Structure of Our Galaxy, Series: International Astronomical Union. Becker, w. Contopoulos G.(eds.); Union Astronomique Internationale 38, Springer Netherlands.
  44. Nezlin MV and Snezhkin EN (1993) Rossby Vortices, Spiral Structures, Solitons: Astrophysics and Plasma Physics in Shallow Water Experiments, Series: Springer Series in Nonlinear Dynamics. Springer Verlag Berlin Heidelberg.
  45. Gobato R, Mitra A and Mullick P (2023) Double Spiral Galaxies and the Extratropical Cyclone in South Georgia and the South Sandwich Islands.Climate Research.
  46. Brazil’s Navy. Synoptic Letters (2023) Brazil’s navy. Synoptic Letters.
  47. (2023) Zoom Earth. NOAA/NESDIS/STAR, GOES-East, zoom.earth
  48. Lindblad B (1964) ON THE CIRCULATION THEORY OF SPIRAL STRUCTURE. ASTROPHYSICA NORVEGICA (12) Stockholms Observatorium, Saltsjobaden.
  49. Gobato R, adn Heidari A (2020) Vortex hits southern Brazil in 2020.
  50. NASA gov (2017) Messier 83 (The Southern Pinwheel)
  51. ESA/Hubble & NASA (2020) NGC 1566. European Space Agency.
  52. (2023) NGC 1566. Creative Commons.
  53. Jeynes C (2019) MaxEnt double spirals in space-time Maximum Entropy (Most Likely) Double Helical and Double Logarithmic Spiral Trajectories in Space-Time. Scientific Reports.
  54. (2023) South Georgia and the South Sandwich Islands. Creative Commons. CC BY-SA 3.0. https://en.wikipedia.org/wiki/South_Georgia_ and_the_South_Sandwich_Islands
  55. (2023) Spiral galaxy. Creative Commons.
  56. Heyer HH (2020) The classic spiral Messier 83 seen in the infrared with HAWK-I. ESO. https://www.eso.org/public/images/eso1020a/Gobato, Ricardo & Mitra, Abhijit & Mullick, Poulomi (2023) Double spiral galaxies and the extratropical cyclone in South Georgia and the South Sandwich Islands.

Significant of Molecular Genotyping Over Serological Phenotyping Techniques in Determination of Blood Group Systems among Multiple Transfused Patients and Blood Donors to Prevent Alloimmunization: A Review Article

DOI: 10.31038/CST.2023821

Summary

Erythrocyte serological phenotyping is very important in determining the identity of suspected alloantibodies and also to facilitate the identification of antibodies that may be formed in the future. Serological phenotyping is a conventional method which is based on the presence of visible haemagglutination or haemolysis. This technique has some limitations in successful determination of blood group due to presence of donor red blood cell in the circulation of recent multiple transfused patients, taking certain medications or some diseases condition which may alter the erythrocyte composition, this make accurate determination of blood group of such patients to be time consuming and difficult to interpret. It is often more complicated to determine the blood group if direct antiglobulin test of such patients were positive and there is no direct agglutinating antibody. Molecular Genotyping of blood group systems led to the understanding of the molecular basis of many blood group antigens, many blood group polymorphisms are associated with a single point mutation in the gene encoding of protein carrying the blood group antigen. This knowledge allows the use of molecular testing to predict the blood group antigen profile of an individual and to overcome the limitations of conventional serological blood group phenotyping. Determination of blood group polymorphism at the genomic level facilitates the resolution of clinical problems that cannot be addressed by serological techniques. Applications of blood group genotyping for red cell blood group antigens affecting several areas of medicine which includes identification of fetuses at risk for haemolytic disease of the newborn and candidates for Rh-immune-globulin, to determine antigen types for which currently available antibodies are weakly reactive, to determine blood group of patients who had recent multiple transfusion, to increase the reliability of repositories of antigen negative RBCs for transfusion, to select appropriate donor for bone marrow transplantation, to provide transfusion support for highly alloimmunized patients, to resolve ABO and Rh discrepancies, to confirm sub group of A2 status of kidney donors, to provide comprehensive typing for patients with haematological diseases requiring chronic transfusion and oncology patients receiving monoclonal antibody therapies that interfere with pretransfusion testing.

Keywords

Molecular, Serological, Red cell antigens, Alloantibodies and transfusion

Introduction

Blood group systems are characterized by the presence or absence of antigens on the surface of erythrocytes, the specificity of antigens is controlled by a series of genes which can be allelic or linked very closely on the same chromosome which persist throughout life and serve as identity markers. Presently, International Society of Blood Transfusion (ISBT) has acknowledged about 36 blood group systems and more than 420 blood group antigens have been discovered on the surface of the human red cell (Storry et al., 2016). The clinical importance of RBC antigens is associated with their ability to induce alloantibodies that are capable of reacting at 370C (body temperature), these antibodies have ability to cause destruction of erythrocytes. The major clinically significant antibodies include ABO, Rh, Kell, Kidd and Duffy antigens (Karafin et al., 2018). ABO antibodies are naturally occurring antibodies, while Rh and Kell antibodies are immunogenic in nature. The immune system produces alloantibodies when it is exposed to foreign antigens (incompatible erythrocyte) these antibodies form a complex with donor cells causing haemolytic transfusion reactions. Patients with Rh and Kell alloantibodies should be transfused with blood that is lacking the antigens because these antibodies are capable of causing severe haemolytic anaemia and haemolytic disease of the newborns (Singhal et al., 2017). Hence, it is important to transfused females of child-bearing age with compatible blood in order to reduce or minimize the possibility of sensitizing their immune system with clinically important antigens (Guelsin et al., 2015). Unexpected incompatibility reactions are the major risks of blood and blood products transfusion apart from transfusion transmissible infections, clinically significant alloantibodies play a critical role in transfusion medicine by causing either acute or delayed haemolytic transfusion reactions (HTRs) and haemolytic disease of the fetus and newborn (HDFN) ranging from mild to severe grades. The degree of production of alloantibodies that is capable of destroy foreign or donor red cells is higher amongst multi-transfused patients compared with general population (Karafin et al., 2017). Serological phenotyping of blood group system is a classical and conventional method of detecting erythrocyte antigen by haemagglutination or haemolysis, accurate phenotyping of blood group system among multi-transfused patients is a very complex process due to the presence of donor’s blood cells in the patient’s circulation except serological phenotyping of blood group system is performed before the initiation of transfusion. Blood group genotyping has recently been developed to determine the blood group antigen profile of an individual, with the goal of reducing risk or identifying a fetus at the risk of haemolytic disease of the newborn (HDN). Blood group genotyping improve the accuracy of blood typing where serology alone is unable to resolve red cell serological phenotyping especially in individuals with weak antigen expression due to presence of genetic variants or in case of rare phenotype where antisera are unavailable or in the case of recent multiple blood or blood products transfusion, or in patients whose RBCs are coated with immunoglobulin (Ye et al., 2016). Genotyping technique also help to determine which phenotypically antigen-negative patients can receive antigen-positive RBCs, to type donors for antibody identification panels, to type patients who have an antigen that is expressed weakly on RBCs, to determine Rh D zygosity, to mass screen for antigen-negative donors, ability to routinely select donor units antigen matched to recipients apart from ABO and Rh D which reduce complications in blood and blood products transfusion (Guelsin et al., 2010). The growth of whole-genome sequencing in chronic disease and for general health will provide patients’ comprehensive extended blood group profile as part of their medical record to be used to inform selection of the optimal transfusion therapy (Connie and Westhoff, 2019).  DNA-based genotyping is being used as an alternative to serological antibody-based methods to determine blood groups for matching donor to recipient because most antigenic polymorphisms are due to single nucleotide polymorphism changes in the respective genes. Importantly, the ability to test for antigens by genetic technique where there are no serologic reagents is a major medical advance and breakthrough to identify antibodies and find compatible donor units, which can be lifesaving.  The molecular genotyping of blood group antigens is an important aspect and is being introduced successfully in transfusion medicine. Genotyping has been shown to be effective and advantageous in relation to phenotype from genomic DNA with a high degree of precision (da Costa et al., 2013) A notable advantage of molecular testing is its ability to identify variant alleles associated with antigens that are expressed weakly or have missing or altered epitopes, thus helping to resolve discrepant or incomplete blood group phenotyping. The disadvantages of molecular testing are mainly the longer turnaround time and higher cost, compared with serologic typing (Marilia et al., 2019). The molecular basis for most erythrocyte antigens is known and numerous DNA analysis methodologies have been developed, all based on PCR which can detect several alleles simultaneously as long as the alleles studies have products of different sizes (Swati et al., 2018). The detection of blood group antigens is essential in transfusion practice in order to prevent alloimmunization, especially in multiple transfused patients. Erythrocyte antibodies that are clinically significant in transfusion medicine can lead to acute or delayed blood transfusion reactions and haemolytic disease of the fetus and newborn which increases the morbidity and mortality rate of the patients. In addition, alloimmunization may delay the localization of a compatible blood bag. The probability of an individual producing one or more anti-erythrocyte antibodies is approximately 1% per unit of blood transfused and in chronically multiple transfused patients, the alloimmunization rate may reach 50%. Both the blood donors and recipients can be genetically typed for all the clinically significant blood group antigens and antigen-matched blood can be provided to the recipient (Guelsin et al., 2010). This approach could significantly reduce the rate of alloimmunization.

Serological Phenotyping

Knowledge of the role of blood groups with their antigens and variants in alloimmunization was pivotal for the development of transfusion practices and medical interventions that require blood transfusion such as trauma, organ transplantation, cancer treatment, haematological diseases (like sickle cell disease, thalassaemia, and aplastic anemia). Serology has been considered the gold standard technique for blood group typing for a long time (Yazdanbakhsh et al., 2014). Serological methods detect the antigen expressed on the red cell using specific antibodies and can be carried out manually or by automated platforms. Typing blood group antigens using this method is easy, fast, reliable, and accurate for most of the antigens. However, serology has limitations, some of which cannot be overcome when it is used as a standalone testing platform (Das et al., 2020). Scarcity of serological reagents for some blood group systems for which there is no monoclonal antibody available is a major limitation to serological technique. In addition, human serum samples from different donors vary in reactivity, which is an issue when a nearly exhausted batch of reagent needs to be replaced. This is especially problematic when an alloantibody for that antigen is suspected to be causing adverse events after transfusion. In those circumstances, molecular methods can be used as an alternative or as a complementary test for identification of genes associated with the blood group antigens expression and prediction of antigenic profile.

Molecular Genotyping

The identification of genes that encode proteins carrying blood group antigens and the molecular polymorphisms that result in distinct antigenicity of these proteins is possible using molecular typing methods, which facilitate blood typing resolution in complex cases and overcome limitations of serological techniques when dealing with allo-immunized and multi-transfused patients (da Costa et al., 2013). In addition, molecular techniques have allowed identification of genes encoding clinically relevant antigens where serological reagents are not available. In those instances, genotyping is critical to resolve clinical challenges. Blood group genotyping is performed to predict blood group antigens by identifying specific polymorphisms associated with the expression of an antigen (Connie and Westhoff, 2019). Most variations in the blood group antigens are linked to point mutations, but for some, other molecular mechanisms are responsible, such as deletion or insertion of a gene, an exon or a nucleotide sequence (for example ABO, RH, and DO blood group systems), sequence duplication, (for example RHD gene and GE blood group system), nonsense mutation (for example RHD gene), and hybrid genes (for example RH, MNS, ABO, and CH/RG blood group systems) (Bakanay et al., 2013). In contrast to serological technique, molecular genotyping tests are performed on DNA obtained from nucleated cells and are not affected by the presence of donor’s red cells in patient’s sample, which is a common occurrence in samples of patients with recent multiple blood and blood products transfusions. Thus, erythrocyte genotyping can resolve blood group typing discrepancies in multi-transfused patients presenting with mixed field reactions, alloantibodies, or autoantibodies. Also, blood group genotyping can substantially help patients who were not previously phenotyped and need regular transfusions by facilitating management of these patients and preventing alloimmunization (Guelsin et al., 2015). Studies comparing serology and genotyping in multi-transfused population such as patients with thalassaemia and sickle cell disease have shown that genotyping is superior to serology for resolving discrepancies. Use of genotyped matched units has been shown to decrease alloimmunization rates, increase haemoglobin levels and in vivo erythrocyte survival, and diminish frequency of transfusions.

Erythrocyte Antigen Disparity and its significant in Transfusion Medicine

Patients who develop alloantibodies might have been received significantly multiple transfusions, or due to pregnancy making alloimmunization a particular problem for such patients especially those requiring chronic RBC transfusion support as a result of haematological diseases (Ngoma et al., 2016). Incidence of alloimmunization is highly variable between individual patients’ health condition, rate of exposure to a foreign antigen, ethnicity and geographical area. However, Knowledge of the genotypes of both patients and donors has led to a greater understanding of potential mechanisms for persistent alloimmunization despite serologic antigen matching for transfusion, also extended matching to include the Duffy, Kidd, and MNS systems has been shown to reduce the rate of alloimmunization (Jenna and Meghan, 2018). It is therefore clear that serologic phenotyping is inadequate to capture allelic diversity in minority populations. Without accurate characterization of the patient and donor genotypes, true antigen matching to prevent alloimmunization is not possible (Chou et al., 2013). In addition, there is still an inadequate understanding of the risk of alloimmunization with specific blood group gene haplotypes, particularly for RHD. Large, multi-institutional studies with genotyping of both patient and donor and better characterization of the specificity of antibodies formed are needed to clarify the clinical significance and immunogenic risks of variant alleles (Putzulu et al., 2017).

Blood Transfusion and Risk of Erythrocyte Alloimmunization

Erythrocyte alloimmunization is a serious adverse event of blood and blood products transfusions which can cause further clinical problems in the recipient patients including worsening of anaemia, development of autoantibodies, acute or delayed haemolytic transfusion reactions, bystander haemolysis, organ failure, and cause serious complications during pregnancies (Singhal et al., 2017). Frequent transfusions can lead to the production of multiple alloantibodies, which is often associated with autoantibodies requiring extensive serological workups and additional transfusions for proper treatment, increasing time and resources to find compatible RBC units (Yazdanbakhsh et al., 2014). Reported erythrocyte alloimmunization rates have considerable variations depending on the population and disease studied. The rates are estimated between 1 and 3% in patients that receive episodic transfusions, while for patients who receive chronic blood transfusions like patients with sickle cell disease, rates vary between 8 and 76% (Chou et al., 2013). The development of RBC antibodies is influenced by many factors including recipient’s gender, age, and underlying disease. The diversity of the blood group antigen expression among the donor and patient populations contributes substantially to the high alloimmunization rates (Ryder et al., 2014). Studies in sickle cell disease patients have reported that inflammation is associated with higher likelihood of alloimmunization, and it is suggested that the extent of the alloimmune response is higher when RBCs are transfused in the presence of an inflammatory signal. Several studies have suggested that genetic variation in immune-related genes and human leukocyte antigens might be associated with susceptibility to or protection from alloimmunization (Zimring and Hendrickson, 2008).

Consequences of Alloimmunization in Transfusion Medicine

Depending on the antigen and clinical significance of the antibody formed, patients can suffer morbidity and mortality due to an acute or delayed hemolytic transfusion reaction if incompatible blood or blood products are transfused (Jenna and Meghan, 2018). A rare but life-threatening consequence of recurrent transfusions is a hyperhaemolytic reaction which occurs in patients with hemoglobinopathies especially in sickle cell disease patients, the mechanism of hyperhaemolytic reaction in SCD could be a complication of alloimmunization, with possible contribution of an underlying genetic predisposition (Putzulu et al., 2017).  The development of RBC alloantibodies also impacts patient care by increasing the cost and time required to find compatible RBC units. Once an RBC antibody is identified, all subsequent transfusions must be negative for that antigen to prevent a delay haemolytic transfusion reaction from a robust secondary immune response (Ngoma et al., 2016).  An additional risk for previously sensitized patients is the inability to detect evanesced RBC antibodies at future transfusion events, failure to identify pre-existing antibodies is a significant contributor to haemolytic transfusion reaction. Minority patients may be at greater risk of complications from alloimmunization because the presence of antibodies may not be accurately characterized. One reason is that they are more likely to be negative for high-prevalence antigens (Jenna and Meghan, 2018). Antibodies to high-prevalence RBC antigens will react with all reagent RBCs. This is further complicated if the patient also has a positive direct antiglobulin test (DAT), as patients with SCD frequently do; the antibody to a high-prevalence antigen can then easily be confused with a warm autoantibody (Jain et al., 2016). In addition, because most reagent RBCs are not from minority populations, there is a risk that immunogenic Rh variants and other low-prevalence antigens are not expressed on the reagent RBCs, rendering antibody detection tests false-negative. Genotyping can be particularly useful to clarify antibody specificity, identify if there is a lack of a high-prevalence antigen, and identify appropriate donors.

Prevention of Alloimmunization and Improvement of Transfusion Therapy

Prevention of alloimmunization is desirable for any blood and blood products transfusion. Hence, patients not previously transfused or only having episodic blood transfusions, matching for all clinically significant antigens is not of great concern, but can result in alloimmunization against non-matched antigens (Agrawal et al., 2016). Patients previously transfused, particularly transfusion-dependent patients, the alloimmunization risk is higher and management of alloimmunized patients is of greater concern. Their alloimmunization status, including antigens of low clinical significance, is a critical part of their clinical history that may enable health care providers to take measures to prevent further alloimmunization (Singhal et al., 2017). Antigens have variable immunogenicity and not all blood group antigens are involved with the production of clinically significant antibodies after blood transfusion or pregnancy. Ideally, every blood transfusion should be compatible with the most clinically significant antigens to prevent alloimmunization (Swati et al., 2018). However, the standard pre-transfusion cross-matching is only performed for ABO blood group and the Rh (D) antigen; ABO matching is performed to avoid acute haemolytic transfusion reactions caused by natural IgM antibodies against ABO antigens, and Rh (D) matching is performed because of the high immunogenicity of the Rh (D), which is implicated in delay haemolytic transfusion reaction and haemolytic disease of foetus and newborn (Chou et al., 2013). Currently, recommendations for partial and extended donor unit or patient matching are limited to specific groups including patients on long-term transfusion protocol (sickle cell disease, thalassaemia, and aplastic anemia), patients who have developed alloantibodies and patients with warm autoimmune haemolytic anaemia (Kulkarni et al., 2018). Verification of compatibility for Rh (D, E, C, c, e) and K, which are the most frequent antigens involved in alloimmunization, is considered partial matching. Extended matching should include at least RH (D, C, E, c, e), KEL (K), FY (Fya, Fyb), JK (Jka, Jkb), MNS (S, s) and, if available, additional antigens (Osman et al., 2017). Prevention of an initial alloimmunization event may be even more important than previously appreciated to prevent the development of subsequent antibodies. For patients with a tendency toward forming RBC antibodies, and also having a RBC phenotype with either multiple negative antigens and/or lacking high-prevalence antigens, compatible units may become so rare as to make transfusion support virtually impossible (Wilkinson et al., 2012)

Screening for Clinically Significant Alloantibodies

Alloantibodies are antibodies produced in a patient as a result of exposure to foreign red cell antigen through transfusion of blood or blood products, pregnancy or transplantation (Agrawal et al., 2016). In countries such as Nigeria, there are multiple ethnic groups and racial or genetic heterogeneity among the population. This can often be associated with a wide variation of alloantibodies. Other common factors that facilitate alloantibody formation in the recipient include: the immune competence, the dose of the antigen the recipient is exposed to, the route of exposure and how immunogenic the foreign antigen is (Erhabor et al., 2015). Development of alloantibodies can lead to difficulty in finding compatible blood for transfusion or it can result in severe delayed haemolytic transfusion reaction if the antibody titre is low, undetected, missed and if antigen positive units is transfused. Evidenced-based best practice in the developing world requires that alloantibody testing is carried out as part of pre-transfusion testing of patients who require a red cell transfusion as well as pregnant women presenting to antenatal clinic at booking (Guelsin et al., 2015). The purpose of this test is to detect the presence of unexpected red cell antibody in the patient’s serum. Once these antibodies are detected during the alloantibody screening, every effort must be made to identify the specificity of the alloantibody by doing a panel test. The aim of identifying the specificity of the alloantibody in a patient that requires a red cell transfusion is to enable the Medical Laboratory or Biomedical Scientist to select antigen negative donor unit for appropriate crossmatch (indirect antiglobulin test) for such patient (Agrawal et al., 2016). Panel test in the case of a pregnant women coming for antenatal booking is to identify the alloantibody, determine whether the antibody can potentially cause HDFN and to allow the monitoring of the titre or quantification of the antibody every 4 weeks from booking until 28 weeks’ gestation and every 2 weeks thereafter until delivery. This information is important to determine the extent of developing foetus is affected by HDFN, decide whether to monitor the baby for anaemia using Doppler ultrasound, determine whether the baby will require intrauterine transfusion and to make an informed decision to possibly deliver the baby earlier. These evidence-based best practices are not being implemented in many settings in Nigeria (Erhabor et al., 2015). Testing of donor units for other clinically relevant red cell antigens other than ABO and Rh D is not routinely carried out (Singhal et al., 2017). This is a complete failure in stewardship by the Nigerian government and can compromise the transfusion service delivery to pregnant women and patients that require red cell transfusion. Settings and implement a policy to routinely test all group O donor units for haemolysins in other to identify group O donors with high titre of IgG anti A and/or anti B whose blood should be reserved only for transfusion to group O recipient while those that test negative can be transfused to A, B or AB individual as a way to maximizing the use of our limited allogeneic stock (Obisesan et al., 2015).

Applications of Molecular Genotyping Over Serological Phenotyping in Transfusion Medicine

Multiply-transfused Patients

The ability to determine a patient antigen profile by DNA analysis when haemagglutination tests cannot be used is a useful adjunct to a serologic investigation. Blood group genotyping in the transfusion setting is recommended for multiply transfused patients such as sickle cell disease (SCD), as part of antibody identification process (Castilho et al., 2018). Determination of a patient’s blood type by analysis of DNA is particularly useful when a patient, who is transfusion-dependent, has produced alloantibodies. This will help in the selection of antigen-negative RBCs for transfusion. It also assists in selection of compatible units for patients with discrepancies between genotype and phenotype, leading to increased cell survival and a reduction of the transfusion frequency (Bakanay et al., 2013). In addition to its contribution to the general accuracy of identification of red blood cell antigens, genotyping of transfusion dependent SCD patients allows assessment of the risk of alloimmunization against antigens

Patients Whose RBCs are Coated with IgG

Patients with autoimmune haemolytic anaemia (AIHA), whose RBCs are coated with IgG cannot be accurately typed for RBC antigens, particularly when directly agglutinating antibodies are not available, or IgG removal by chemical treatment of RBCs is insufficient. Blood group genotyping is very important for determination of the true blood group antigens of these patients (Jain et al., 2016). Patients received antigen-matched RBCs typed by blood group genotyping increases erythrocytes in vivo survival, as assessed by rises in haemoglobin levels and diminished frequency of transfusions.

Blood Donors

DNA-based typing can also be used to antigen-type blood donors both for transfusion and for antibody identification reagent panels. This is particularly useful when antibodies are not available or are weakly reactive (Huang et al., 2019). The molecular analysis of a variant gene can also assist in resolving a serologic investigation.

Resolution of Weak A, B, and D Typing Discrepancies

A proportion of blood donors and patients who historically have been typed as group O are now being recognized as group A or group B with the use of monoclonal antibodies capable of detecting small amounts of the immuno-dominant carbohydrate responsible for A or B specificity (Das et al., 2020). A typing result that differs from the historical record often results in time-consuming analyses. Since the bases of many of the weak subgroups of A and B are associated with altered transferase genes, PCR-based assays can be used to define the transferase gene and thus the ABO group (Nair et al., 2019). Similarly with the D antigen of the Rh blood group system, a proportion of blood donors that historically have been typed as D-negative are now reclassified as D-positive, due to monoclonal reagents that detect small and specific parts of the D antigen. The molecular basis of numerous D variants can be used to identify the genes encoding altered Rh D protein in these individuals (Huang et al., 2019).

Applications to Maternal-fetal Medicine

Alloimmunization against the Rh D antigen during pregnancy is the most frequent cause of haemolytic disease of the newborn (HDN). Immunization occurs when fetal cells, carrying antigens inherited from the father, enter the mother’s circulation following fetal-maternal bleeding. The mother, when not expressing the same antigen(s), may produce IgG antibodies towards the fetal antigen and these antibodies can pass through the placenta causing a diversity of symptoms, ranging from mild anaemia to death of the foetus (Erhabor et al., 2015). Apart from antibodies to the Rh D blood group antigen, other specificities within the Rh system and several other blood group antigens can give rise to HDN, but Rh D is by far the most immunogenic. Prenatal determination of fetal Rh D status is desirable in pregnancies to prevent sensitization and possible hydrops foetalis in foetuses of Rh D negative mothers with Rh D positive fathers. Fetal DNA has been detected in amniotic cells, chorionic villus samples, and as recently reported, in maternal plasma. It is now well accepted that a minute number of copies (as low as 35 copies/mL) of cell-free fetal RHD DNA in the maternal plasma can be utilized as a target for non-invasive genotyping of the foetus (Swati et al., 2018). Unlike fetal DNA isolated from the cellular fraction of maternal blood samples, free fetal DNA isolated from maternal plasma has been shown to be specific for the current foetus and is completely cleared from the mother’s circulation by postpartum. It has been reported that fetal RHD can be determined by PCR in DNA extracted from maternal plasma of pregnant women with Rh D positive foetuses, in a non-invasive procedure. PCR amplification of RHD in maternal plasma may be useful for the management of Rh D negative mothers of Rh D positive foetuses and for the study of foetus-maternal cell trafficking (Legler et al., 1999).

Conclusions

Determination of blood group polymorphism at the genomic level facilitates the resolution of clinical problems that cannot be addressed by serological technique. They are useful to determine antigen types for which currently available antibodies are weakly reactive; to type patients who have been recently transfused; to identify fetuses at risk for haemolytic disease of the newborn and to increase the reliability of repositories of antigen negative RBCs for transfusion. Mass scale genotyping, if applied to routine blood group of patients and blood donors, would significantly change the management of blood provision. Better matching of donor blood to patient would be the most significant benefit. This is primarily because a large numbers of low frequency antigens (or absence of high frequency antigen) are not routinely tested for, and donor-patient mismatches are only detected by serological cross-matching (only if an antibody has been generated) immediately prior to transfusion. This review overviews the current situation in this area and attempts to predict how blood group genotyping will evolve in the future.

Limitations

It is important to note that PCR based assays are prone to different types of errors than those observed with serological assays. For instance, contamination with amplified products may lead to false positive test results. In addition, the identification of a particular genotype does not necessarily mean that the antigen will be expressed on the RBC membrane.

Recommendation

As a word of caution, we should emphasize that the interpretation of molecular blood group genotyping results must take into account that potential contamination of PCR-based amplification assays and the observation that the presence of a particular genotype antigen does not guarantee expression of this antigen on the RBC membrane. The possibility to have an alternative to serological tests to determine the patient’s antigen profile should be considered for multiply transfused patients and for patients with autoimmune haemolytic anaemia (AIHA) by allowing the determination of the true blood group genotype and by assisting in the identification of suspected alloantibodies and in selection of antigen-negative RBCs for transfusion. This ensures a more accurate selection of compatible donor units and is likely to prevent alloimmunization and reduce the potential for haemolytic reactions. As automated procedures attain higher and faster throughput at lower cost, blood group genotyping is likely to become more widespread. We believe that the PCR technology may be used in a transfusion service in the next few years to overcome the limitations of serological technique.

References

  1. Agrawal A, Mathur A, Dontula S, Jagannathan L (2016) Red blood cell alloimmunization in multi-transfused patients: A Bicentric study in India. Global Journal of Transfusion Medicine 12(1): 12-17. [crossref]
  2. Bakanay SM, Ozturk A, Ileri T, Ince E, Yavasoglu S, Akar N (2013) Blood group genotyping in multi-transfused patients. Transfusion and Apheresis Science 48(2): 257-261. [crossref]
  3. Castilho L, Dinardo CL (2018) Optimized antigen-matched in sickle cell disease patients: Chances and challenges in molecular times—The Brazilian way. Transfusion Medicine and Hemotherapy 45(4): 258-262. [crossref]
  4. Chou ST, Jackson T, Vege S, Smith-Whitley K, Friedman DF, Westhoff CM (2013) High prevalence of red blood cell alloimmunization in sickle cell disease despite transfusion from Rh-matched minority donors. Blood 122(6): 1062-1071. [crossref]
  5. Connie M, Westhoff SB (2019) Blood group genotyping; Transfusion Medicine 133(17): 1814-1820. [crossref]
  6. da Costa DC, Pellegrino J, Guelsin GA, Ribeiro KA, Gilli SC, Castilho L (2013) Molecular matching of red blood cells is superior to serological matching in sickle cell disease patients. Revista Brasileira de Hematologia and Hemoterapia 35(1): 35-38. [crossref]
  7. Das SS, Biswas RN, Safi M, Zaman RU (2020) Serological evaluation and differentiation of subgroups of “A” and “AB” in healthy blood donor population in Eastern India. Global Journal Transfusion Medicine 20(5): 192-196. [crossref]
  8. Erhabor O, Malami AL, Isaac Z, Yakubu A, Hassan M (2015) Distribution of Kell phenotype among pregnant women in Sokoto, North Western Nigeria. Pan African Medical Journal 301(21): 1-9. [crossref]
  9. Guelsin GA, Rodrigues C, Visentainer JE, De-Melo, Campos. P, Traina F, Gilli SC (2015) Molecular matching for Rh and K reduces red blood cell alloimmunisation in patients with myelodysplastic syndrome. Blood Transfusion 13(1): 53-58. [crossref]
  10. Guelsin GA, Sell AM, Castilho L, Masaki VL, Melo FC, Hashimoto MN (2010) Benefits of blood group genotyping in multi-transfused patients from the south of Brazil. Journal of Clinical Laboratory Analysis 24(5): 311-316. [crossref]
  11. Huang H, Jin S, Liu X, Wang Z, Lu Q, Fan L, (2019) Molecular genetic analysis of weak ABO subgroups in the Chinese population reveals ten novel ABO subgroup alleles. Blood Transfusion 17(1): 217-222. [crossref]
  12. Jain A, Agnihotri A, Marwaha N, Sharma RR (2016) Direct antiglobulin test positivity in multi-transfused thalassemics. Asian Journal of Transfusion Science 10(1): 161-163. [crossref]
  13. Jenna, Khan, Meghan, Delaney (2018) Transfusion Support of Minority Patients: Extended Antigen Donor Typing and Recruitment of Minority Blood Donors. Transfusion Medicine and Hemotherapy,45(4): 271–276. [crossref]
  14. Karafin MS, Westlake M, Hauser RG, Tormey CA, Norris PJ, Roubinian NH (2018) Risk factors for red blood cell alloimmunization in the recipient epidemiology and donor evaluation study (REDS-III) database. British Journal Haematology 181(5): 672-681. [crossref]
  15. Kulkarni S, Choudhary B, Gogri H, Patil S, Manglani M, Sharma R (2018) Molecular genotyping of clinically important blood group antigens in patients with thalassaemia. The Indian Journal of Medical Research 148(6): 713-720. [crossref]
  16. Legler TJ, Eber SW, Lakomek M, Lynen R, Maas JH, Pekrun A (1999) Application of RHD and RHCE genotyping for correct blood group determination in chronically transfused patients. Transfusion 39(8): 852-855. [crossref]
  17. Marilia GQ, Cristiane MC, Luciana CM, Ana MS, Jeane EL (2019) Methods for blood group antigen detection; cost-effectiveness analysis of phenotyping and genotyping. Haematology Transfusion and cell therapy 41(1): 44-49. [crossref]
  18. Nair R, Gogri H, Kulkarni S, Gupta D (2019) Detection of a rare subgroup of A phenotype while resolving ABO discrepancy. Asian Journal of Transfusion Science 13(1): 129-131. [crossref]
  19. Ngoma AM, Mutombo PB, Ikeda K, Nollet KE, Natukunda B, Ohto H (2016) Red blood cell alloimmunization in transfused patients in sub-Saharan Africa: a systematic review and meta-analysis. Transfusion Apheresis Science 54: 296-302. [crossref]
  20. Obisesan OA, Ogundeko TO, Iheanacho CU, Abdulrazak T, Idyu VC, Idyu II, Isa AH (2015) Evaluation of Alpha (α) and Beta (β) Haemolysin Antibodies Incidence among Blood Group ‘O’ Donors in ATBUTH Bauchi Nigeria. American Journal of Clinical Medicine Research 3(3): 42-44. [crossref]
  21. Osman NH, Sathar J, Leong CF, Zulkifli NF, Raja, Sabudin RA, Othman A (2017) Importance of extended blood group genotyping in multiply transfused patients. Transfusion Apheresis Science 56(3): 410-416. [crossref]
  22. Putzulu R, Piccirillo N, Orlando N, Massini G, Maresca M, Scavone F (2017) The role of molecular typing and perfect match transfusion in sickle cell disease and thalassaemia: an innovative transfusion strategy. Transfusion Apheresis Science 56(1): 234-237. [crossref]
  23. Ryder AB, Zimring JC, Hendrickson JE (2014) Factors influencing RBC alloimmunization: Lessons learned from murine models. Transfusion Medicine and Hemotherapy 41(6): 406-419. [crossref]
  24. Singhal D, Kutyna MM, Chhetri R, Wee LYA, Hague S, Nath L (2017) Red cell alloimmunization is associated with development of autoantibodies and increased red cell transfusion requirements in myelodysplastic syndrome. Haematological 102(12): 2021-2029. [crossref]
  25. Storry JR, Castilho L, Chen Q, Daniels G, Denomme G, Flegel WA, Gassner C, de Haas M (2016) International society of blood transfusion working party on red cell immunogenetics and terminology: report of the Seoul and London meetings. International Society of Blood Transfusion Science 11(2): 118–122. [crossref]
  26. Swati, Kulkarni, Bhavika, Choudhary, Harita, Gogri, Shashikant, Patil, Mamta, Manglani, Ratna, Sharma, Manisha, Madkaikar (2018) Molecular genotyping of clinically important blood group antigens in patients with thalassaemia. Indian Journal of Medical Research 14(8): 713-720. [crossref]
  27. Wilkinson K, Harris S, Gaur P, Haile A, Armour R, Teramura G (2012) Molecular blood typing augments serologic testing and allows for enhanced matching of red blood cells for transfusion in patients with sickle cell disease. Transfusion 52(1): 381-388. [crossref]
  28. Yazdanbakhsh K, Ware RE, Noizat-Pirenne F (2014) Red blood cell alloimmunization in sickle cell disease: Pathophysiology, risk factors, in individuals with single and multiple clinically relevant red blood cell antibodies. Transfusion 54(8): 1971-1980. [crossref]
  29. Ye Z, Zhang D, Boral L, Liz C, May J (2016) Comparison of blood group molecular genotyping to traditional serological phenotyping in patients with chronic or recent blood transfusion. Journal of Biomedical Science 4(1): 1-4. [crossref]
  30. Zimring JC, Hendrickson JE (2008) The role of inflammation in alloimmunization to antigens on transfused red blood cells. Current Opinion in Hematology 15(6): 631-635. [crossref]

Climate Summit and the Egyptian Vision

DOI: 10.31038/GEMS.2023531


“We are meeting today and the environmental clock is ticking, marking the end of the planet if we do not do our best to preserve it”.

“Although not responsible for the climate crisis, the African continent faces the most negative consequences of the phenomenon and its economic, social, security and political implications. However, the continent is a model of serious climate action as far as its capabilities and available support allow”. With these words, the British Prime Minister, Boris Johnson and His Excellency President Abdel Fattah El-Sisi began their speeches before the Climate Summit in Glasgow, Scotland, which began on Sunday, October 31, 2021 under the auspices of the United Nations – known as the twenty-sixth Conference of the Parties to the Framework Convention on Climate Change – in the Scottish city of Glasgow and will continue until November 12 within the ceiling of high expectations in dealing with the problems of climate change besetting our planet. The event is abbreviated as “26COP”, which will last for two weeks and is an acronym for the words “26th Conference of the Parties to the Framework Convention on Climate Change,” For the first time, delegations representing 200 countries participated in the summit to discuss ways to reduce emissions by 2030 and help improve life on the planet.

The summit was honored by the honorable presence of the Arab Republic of Egypt with an official delegation headed by His Excellency President Abdel Fattah El-Sisi, President of the Republic, who gave an important speech at the summit, which is attended by world leaders as evidence that we are a large country with its position at the level of the continent and the whole world. Earth’s climate depends mainly on the sun, with about 30 percent of sunlight scattered back into space, some of it absorbed by the atmosphere and the rest absorbed by the Earth’s surface. The Earth’s surface also reflects part of the sunlight in the form of animated energy called infrared radiation. What is happening is that infrared radiation is delayed by “greenhouse gases” such as water vapor, carbon dioxide, ozone and methane, which cause infrared radiation to bounce back, raising the temperature of the lower atmosphere and the Earth’s surface.

Although greenhouse gases make up only one percent of the atmosphere, they form a blanket around the ground or a glass roof, which traps heat and keeps the Earth’s temperature at 30 degrees higher than otherwise. However, human activities contribute to making this cover “thicker” because natural levels of these gases are supported by carbon dioxide emissions from the combustion of coal, oil and natural gas, through the emission of more methane and nitrous oxide produced from agricultural activities and landuse changes, and through long-lived industrial gases that are not produced naturally. People usually use the terms global warming and climate change interchange, assuming they say the same thing. But there is a difference between the two: global warming refers to rising average temperatures near the Earth’s surface, while climate change refers to changes in atmospheric layers such as temperature, rainfall and other changes measured over decades or longer periods.

What is Climate Change?

Climate change refers to long-term shifts in temperature and weather patterns. These shifts may be natural – for example, through changes in the density of the Sun, slow changes in the Earth’s rotation around the Sun, or natural processes within the climate system (such as changes in the water cycle in the oceans), but since the nineteenth century, human activities have become the main cause of climate change on the planet. This is mainly due to the burning of fossil fuels, such as coal, oil and gas as a result of various industries and human activities such as the use of fuel in cars, deforestation, reforestation, urbanization, desertification, etc., where the burning of fossil fuels produces the emission of gases that act as a cover that wraps around the globe, especially carbon nan gas and methane, which leads to the capture of the sun’s heat and raising the earth’s temperatures. This releases carbon dioxide and landfills are a major source of methane emissions. Energy production and consumption, industry, transport, buildings, agriculture and land use are the main sources of emissions. Recent studies have shown that concentrations of these gases are now at their highest levels in two million years. Emissions continue to rise as a result of their continued sources. As a result, the globe is now 1.1 degrees Celsius warmer than it was in the late nineteenth century.

What are the Expected Effects of Climate Change?

The phenomenon of climate change is distinguished from most other environmental problems in nature by being global in nature, as it transcends the borders of countries to pose a danger to the whole world. The steady increase in surface air temperatures on the globe as a whole has been confirmed, with the global average increasing at a rate of 0.3 to 0.6 degrees over the past 100 years. Studies by the Intergovernmental Panel on Climate Change (IPCC) have indicated that the continuous rise in the global average temperature will lead to many serious problems such as sea level rise threatening to submerge some areas in the world, as well as the impact on water resources and crop production, in addition to the spread of some diseases. Climate change is sure to affect our health and our ability to farm, live, safety and work as the consequences of climate change include severe drought, water scarcity, severe fires, rising sea levels, saltwater infiltration of adjacent lands, floods, melting polar ice and degradation of biodiversity. In a 2018 United Nations report, scientists acknowledged that limiting global warming to no more than 1.5°C would help us avoid the worst climate impacts and maintain a livable climate. Conversely, the current trajectory of carbon dioxide emissions could increase global temperatures by up to 4.4°C by the end of the century.

Everyone Asks: Can We Stop the Phenomenon of Climate Change?

The honest scientific answer: It is only possible to slow the pace of global warming, not stop it completely, thus delaying the scale of the damage and reducing it until the end of the current century in the hope that we can coexist as a human race with the variables that we have caused. Climate change poses a great challenge to humanity, so do we have solutions to this phenomenon? The countries of the world have become aware of the danger of silence on the phenomenon of climate change and the need to confront it effectively, as the effects of climate change have existed for a while, but some countries of the world were not dealing with this crisis effectively and adequately, especially the industrialized countries that cause climate change and are negligent in the right of developing countries, where they do not take measures that protect the world from climate change and do not provide adequate funding. Despite this, there are some measures that can be taken to reduce this phenomenon and its catastrophic effects, the most important of which are:

Emission Reduction

This can be done by shifting existing energy systems from fossil fuels to new and renewable energy sources, such as solar or wind, thereby reducing climate-changing emissions. Here, a growing coalition of countries is committed to bringing emissions to net zero by 2050. However, current emissions must be cut by about half by 2030 to keep global warming below 1.5°C, and fossil fuel production must be reduced by about 6 percent per year during the decade 2020-2030.

Adaptation to Climate Impacts

Humanity must also adapt to the potential future consequences of climate change. Priority must be given to the most vulnerable people with the least resources to face climate risks, especially in developing countries that are least involved in and most affected by the phenomenon.

Financing the required amendments and procedures. Climate adaptation and coping with its effects require significant financial investments, but inaction on climate action comes at a high price. An important step is the fulfillment by industrialized countries and the main cause of the phenomenon of their commitment to provide financial allocations to developing countries so that they can adjust and move towards greener economies.

Is July 2021 really the hottest month in recorded history?

One of the parties says that July 2021 is the hottest month in the history recorded on the surface of the earth.

What is the Truth of That?

This was shown in a report by one of the US federal agencies concerned with monitoring the atmosphere and oceans in August 2021, where it announced that July 2021 was the hottest month in history since the start of the world’s temperature recording system on the planet 142 years ago. The recorded data reveal that the average temperature during this month over the earth, and the oceans together, increased by about 0.93 degrees Celsius, from the average temperature in the twentieth century, which is 15.8 degrees Celsius, and scientists believe that this is due to the long-term effects of the phenomenon of climate change. Has the number of days of extreme heat really doubled globally since the eighties of the last century?

Research conducted by the BBC found that the number of very hot days in which temperatures exceed 50°C, which are witnessed in different parts of the world annually, has doubled since the eighties of the last century. The total number of days when temperatures exceeded 50°C has increased in each of the past four decades. Between 1980 and 2009, temperatures exceeded 50°C for just 14 days, while the number rose to 26 days between 2010 and 2019. This has happened in increasing areas of our globe, which presents humanity with new challenges, especially in terms of health and livelihood aspects in general.

What are the Groups Most Affected by the Phenomenon of Climate Change?

Although all groups are affected by the results of the phenomenon of negative climate change, children bear the brunt of its effects, although they are the least responsible group for the occurrence of the phenomenon, as climate change poses a direct threat to the child’s ability to survive, develop and prosper.

In terms of:

  • The severity of weather phenomena such as hurricanes and heat waves threaten children’s lives and destroy infrastructure vital to their well-being.
  • Floods cause the destruction and damage of water and sanitation facilities, leading to the spread of various diseases,
  • which represent an imminent danger to humans in general and children in particular.
  • Drought and global change in rainfall lead to disruption in crop productivity and increased food prices, which means food insecurity and food deprivation for poor people, including of course children.

Children are the most vulnerable group to diseases that will become more prevalent as a result of climate change and drought, such as malaria, fever and pneumonia, which alone kills 2,400 children a day globally and is closely linked to under nutrition, lack of safe drinking water and air pollution, symptoms exacerbated by climate change.

The frightening and terrifying effects of climate change: In a report broadcast by the agency “AFP”, on the impact of climate change on humanity, it is clear that: Some 166 million people in Africa and Central America needed assistance between 2015 and 2019 due to food emergencies linked to climate change. Between 15 and 75 million people are at risk of famine by 2050. Some 1.4 million children will be severely stunted in Africa due to climate change in 2050. Agricultural yields have declined by 4-10% globally over the past 30 years.

Catches in the tropics have declined by 40-70%, with rising emissions.

  • As for the impact of climate change on internal migration, between 2020 and 2050, the rate will increase to 6 times the current rate.
  • Global warming will also have terrifying effects on “water stress”, with 122 million people in Central America, 28 million in Brazil, and 31 million in the rest of South America affected by a shortage of water allocations.

Climate change in Egypt and its negative effects Egypt is one of the countries most affected by the negative effects of climate change, and these effects are summarized as follows:

  1. Impact on food security
  2. Impact on water resources
  3. Impact on the ecosystem
  4. Impact on public health
  5. Impact on urban areas
  6. Impact on energy
  7. Impact on the economy

What about the Egyptian Strategy to Confront Climate Change?

The phenomenon of climate change is distinguished from most other environmental problems as it is global in nature, as it transcends the borders of countries to pose a danger to the whole world, as President Abdel Fattah El-Sisi participated in the Climate Change Summit under the auspices of the United Nations – known as the Twenty-sixth Conference of the Parties to the Framework Convention on Climate Change – in the Scottish city of Glasgow, which began on Sunday, October 31 and continued until November 12. During the closing session of the Glasgow Conference “COP 26”, it was announced that Egypt was chosen to host the 27th session of the COP27 conference on November 7 and 8 in Sharm El Sheikh, making Egypt the first country at the level of Africa to host the next climate summit, so the entire black continent will be represented in the conference, and therefore the whole world will see the efforts of Egypt and the African continent in confronting climate change.

The Egyptian strategy to confront climate change is represented in many points, the most important of which are:

  • Establishing the National Council for Climate Change to formulate the state’s general policies regarding dealing with climate change, and work to develop and update sectoral strategies and plans for climate change, in light of international agreements and national interests, and link these plans to the sustainable development strategy 2030.
  • Egypt protects its coasts on the White and Red Sea from the impact of sea level rise through clear plans carried out in cooperation between ministries and concerned scientific authorities.
  • Research bodies in Egypt are working to develop drought resistant agricultural crops and crops that reduce emissions.
  • Egypt is working to protect the agricultural area adjacent to the beaches from deterioration through mega projects.
  • Provide climate finance for the implementation of the adaptation component of the NDCs.
  • Egypt is implementing a huge desalination program (Ain Sokhna desalination plant at a cost of 2.3 billion pounds) and tertiary treatment of wastewater (Bahr Al-Baqar water treatment plant at a cost of 20 billion pounds) and Egypt is updating its strategy for low-emission development and implementing a huge renewable energy program (wind power generation project on the west coast of the Gulf of Suez at a cost of 4.3 billion pounds,)
  • Implementation of huge projects in the villages of the Egyptian countryside, such as the Decent Life project at a cost of 700 billion pounds.
  • Implementation of projects to preserve available water resources, such as the project of lining canals at a cost of 6 billion pounds. Egypt is the first country in the region to issue $750 million worth of green bonds last year.
  • Expansion of projects to establish greenhouses with the aim of adapting to climate change (the target during the next five years is about one million greenhouses.)
  • Expanding sustainable transport projects, developing the transport and communications network (at a total cost of 377 billion pounds until 2024), converting cars to work with electricity or natural gas, and operating trains with electricity to eliminate pollution.
  • Expanding health initiatives to maintain the health of citizens from various diseases.
  • Production of new varieties and hybrids of rice, such as short-lived varieties, which reduces methane emissions.

Facile Synthesis Process, Characterization Study and Determination of Thermoluminescence Kinetic Parameters of Combustion-Synthesized Nano Phosphor for Dosimetry and Long Persistent Applications

DOI: 10.31038/NAMS.2023634

Abstract

In this section, we describe the facile urea-assisted combustion synthesis technique that was used to synthesis of the Dy3+ activated Ca2MgSi2O7 phosphor at the already maintained muffle furnace temperature 600°C. In addition, the characterization studies of the synthesized powder samples are well reported on the basis of their structural, morphological, elemental, and thermal analysis. The synthesized Ca2MgSi2O7:Dy3+ nanophosphor was further characterized by using XRD, FESEM, EDX, and, TL analysis. The obtained XRD pattern indicates tetragonal crystal structures that are compatible with JCPDS card number #79-2425 and recognizes the formation of the desired Ca2MgSi2O7 host without any traces of impurity for confirmation of phase purity. The average crystallite size was estimated using Debye-Scherer’s formula, and was found to be in the range of ~27 nm. It performed a FESEM study to demonstrate exterior morphology. EDX spectra have been employed to establish the sintered phosphor’s elemental composition. The acquired TL glow curve have used to determine the thermal characteristics of the as-synthesized phosphor. Dy3+ doped samples have exposed for 15 min to UV exposure show optimum TL intensity at 112.21°C. With alterations to UV exposure time, it also becomes apparent that the ambient temperature corresponding to the TL peak remains constant. In order to conduct further research on characteristics including activation energy, order of kinetics, and frequency factor, samples with 4 mol% of Dy3+ exposed for varied UV exposure times were chosen. All of these parameters were assessed using the peak shape method. The aforementioned results suggest that an alternative preference for thermoluminescence dosimetry (TLD) and long-lasting applications is the combustion-synthesized Dy3+-doped Ca2MgSi2O7 nanophosphor.

Keywords

Combustion, XRD, FESEM, EDX, Tetragonal, Thermoluminescence (TL), Ca2MgSi2O7:Dy3+

Introduction

Researchers and material scientists have lately been paying special attention to compounds of nanosized luminescent materials of the melilite group doped with rare earth (RE) ions. Alkaline earth silicate phosphors have excellent qualities like high quantum efficiency, abundance, resistance to weathering, affordability, and environmental features. Silicates were also thought to be one of the best host materials for luminescence centers due to their chemical and thermal stability and long persistence times [1]. The reduction of particle size can result in remarkable modifications of some of their bulk properties, nanosized phosphors usually exhibit novel capabilities, such as higher luminescent efficiency [2], and remarkable application potential. The melilites are a large group of compounds characterized by the general formula , where M is a large monovalent or divalent cation, T1 is a small divalent or trivalent cation in tetrahedral, T2 is also a small cation in the other tetrahedral and X is an anion. Afterglow in melilite has already been well documented [3]. In the field of luminescence, the potential utility of lanthanide ions as activators has recently become widely recognized [4]. The afterglow properties of phosphors can be tailored to last for a few seconds to several hours using various activators [5]. Dy3+ is a very effective luminescent centre when utilized as an activator, according to several experimental results of luminescence in some inorganic systems. Furthermore, Dy3+ doped Ca2MgSi2O7 phosphor has been extensively explored for its thermoluminescence properties as a long-lasting phosphor. The persistent emission appears stronger when Dy3+ is added to the host because it is very likely that these ions are involved in electron trapping. With regard to the ability of two Dy3+ ions to substitute for the three ions of the host, it’s possible that the Dy3+ ions will play a role in the creation of defects that act as oxygen vacancies or electron traps [6,7]. Properties like linearity, dose range, energy response, repeatability, stability of stored information, and isotropy are taken into consideration while evaluating the performance of TLD [8]. The preparation of TLDs had good chemical and moisture stability as a result of the addition of SiO2.xH2O and the prudent choice of the chemical form of activators. To analyze the trap centers and trap level in an insulator or semiconductor driven by any radiation-source, TL is one of the most effective techniques [9]. Traps produced by the lattice imperfections play a significant role in the TL characteristics of the phosphors [10].

Accordingly, traps play an essential role in TL research. Understanding the composition of charge carriers’ trapping states is also important. The trapped electrons release energy when heated because they move back to their normal, lower-energy positions. By comprehensively analyzing the TL glow curve, one can learn regarding the trap states and recombination centers [11]. Nowadays, TL materials are widely studied as an effective tool for various applications in the fields of material characterization, archaeological and geological dating, radiation dosimetry, biological applications, age determination, geology or solid-state defect structure analysis, personnel and environmental monitoring etc., being done. Therefore, we suggest that the sintered Dy3+ doped Ca2MgSi2O7 phosphor is a preferable long-persistent phosphor and novel TL material because rare earth dysprosium [Dy3+] ions mainly act as trap centers. In our present investigation, the TL intensity is highly dependent on the concentration of dopants (Dy3+) ions. The maximum intensity of Dy3+ ions was 4 mol% and TL intensity optimum for 15 min UV exposure radiation time and then TL intensity decreases with further UV exposure.

In this article, we have described the synthesis-characterization and thermoluminescence characteristics of prepared the calcium magnesium silicate phosphor (Ca2MgSi2O7:Dy3+) by combustion synthesis utilizing urea (NH2CONH2) as fuel and boric acid (H3BO3) used as flux. Equipped phosphors were characterized and investigated by using X-ray diffractometer (XRD), field emission scanning electron microscopy (FESEM), energy dispersive X-ray spectroscopy (EDX) analysis and Thermoluminescence (TL) analysis in order to structural, morphological, elemental composition, and thermal properties of synthesized powder samples. The aim of this paper is to present the kinetic parameters of the main glow peak (385.21 K) of Ca2MgSi2O7:Dy3+, which have important aspects in the general description of physical characteristics of TL materials, using peak shape (PS) method, namely the order of kinetics (b), symmetry factor (µg), activation energy E (in eV), the frequency factor S (in s−1).

Experimental Analysis

Combustion Synthesis

In order to meet the demands of Material Science and Engineering to create inorganic materials with the appropriate composition, structure, and property, combustion synthesis (CS) has been developed as a standard approach. To sustain a self-propagating high reaction temperature, CS employs extremely exothermic (∆H ≤ 170 kJ/mol) redox (reduction-oxidation) chemicals and combinations, as well as explosive reactions. Metal nitrates serve as the oxidant while urea serves as the fuel in the combustion process. Additionally, this method has the ability to enhance materials, save energy, and protect the environment [12]. The combustion process’ key benefits include rapid heating rates, better processing times, energy efficiency, and the capacity to yield superfine, homogenous, nanocrystalline powders from the combustion products. A vital component of the simple method without a requirement for an expensive high-temperature furnace is the implementation of the enthalpy of combustion to produce and crystallize powders at low calcination temperatures [13]. This technology can effectively replace time-consuming traditional solid-state reaction and sol-gel processing techniques [14]. Numerous refractory materials, such as borides, nitrides, oxides, silicides, intermetallic, and ceramics, have been prepared using this technique.

Powder Sample Preparation

Combustion technique (Figure 1) was successfully employed for the preparation of M2MgSi2O7: Dy3+ (M=Ca) nanophosphor. The starting materials used for the preparation were of Analar grade with high- purity (i.e. 99.99%) and include calcium nitrate [Ca (NO3)2.6H2O], magnesium nitrate [Mg (NO3)2.6H2O], dysprosium nitrate [Dy (NO3)3.5H2O], and fumed silica (SiO2.xH2O). All metal nitrates were considered as sources of oxidizers, boric acid [H3BO3] as flux, and urea [NH2-CO-NH2] was used as fuel. The stoichiometric quantities of the mixture were stirred thoroughly using a magnetic stirrer to obtain a clear solution. The resulting solution was placed in a preheated muffle furnace maintained at 600°C for 5 min. Initially, the solution was thermally dehydrated and later ignited with the liberation of large amount of gases (N2, O2, etc.). Once ignited, the combustion propagates on its own without the need of any external heat. The silicate in a foamy form was obtained finally.

FIG 1

Figure 1: Synthesization of Ca2MgSi2O7: Dy3+ nanometer powder using combustion synthesis technique

After the completion of the process, the product was grinded well using agate mortar pastel to convert into a fine powder form. Further, the sample was post-annealed at 900°C for 2 h under an air atmosphere. In order to obtain white powder, the sample was then despondent cooled to room temperature. The resulting sample was put back together in an airtight bottle for additional characterization investigations such XRD, FESEM, EDX, and TL analysis. Assuming total combustion of the redox mixture for the synthesis of Ca2MgSi2O7 could be written as:

Ca (NO3)2.6H2O + Mg (NO3)2.6H2O + SiO2.xH2O + NH2CONH2 + H3BO3 → Ca2MgSi2O7 + H2O (↑) + CO2 (↑) + N2 (↑)                   (1)

Ca (NO3)2.6H2O + Mg (NO3)2.6H2O + SiO2.xH2O + Dy (NO3)3.5H2O + NH2CONH2 + H3BO3 → Ca2 MgSi2O7: Dy3+ + H2O (↑) + CO2 (↑) + N2 (↑)                                           (2)

Powder Sample Characterization

Phase structure and composition of the synthesized samples remained categorized by X-ray diffraction arrangement using Bruker D8 advance X-ray diffractometer with Cu-Kα radiation having wavelength 1.5405 Å at 40 kV, and 40 mA. The XRD data were measured over a scattering angle range of 10° to 80°. The surface morphology and EDX analysis performed with the help of FESEM (ZEISS EVO Series EVO 18 microscope) fitted with EDX spectra. Thermoluminescence (TL) glow curves of the UV-irradiated (254 nm) samples were plotted between emitted TL intensity and the corresponding temperature using routine TL set-up Nucleonix TLD reader (1009I) with constant heating rate 5°Cs-1.

Fuel and Oxidizers

Fuel and oxidizers must be utilized during the combustion synthesis process. All metal nitrates are employed as oxidizers, together with boric acid (H3BO3) as a flux and urea (NH2CONH2) as a fuel for combustion. The stoichiometric proportions of all metal nitrates and fuel are calculated using the propellant’s chemistry. With the calculation of oxidizer to fuel ratio, the elements were assigned formal valences as follows: Ca=+2, Mg=+2, Dy=+3, Si=+4, B=+3, C=+4, H=+1, O=-2, and N=0 [15].

Oxidizer and Fuel Ratio

Determining the oxidant to fuel ratio is the most important phase since it is the deciding factor that affects the characteristics of the nanomaterials that will be created. The oxidizer to fuel ratio is termed as “Ψ”, which is defined as following relation [16].

3

This ratio is very crucial in determining parameters such as reaction temperature and numerous characteristics of nanosized materials such as electrochemical, crystallinity, phase purity and morphology. Additionally, it has been also observed that the particle size of nanomaterial is influenced by the oxidant-fuel ratio. Hence, the oxygen/fuel ratio at which the heat generated by combustion is maximum is 1 [17].

Effect of Fluxes

Some unique fluxes, including Li2CO3 (lithium carbonate), NH4F (ammonium fluoride), NH4Cl (ammonium chloride), BaF2 (barium fluoride), YF3 (Yttrium Fluoride), AlF3 (aluminum fluoride), H3BO3 (boric acid) [18], KCl (potassium chloride), LiF (lithium fluoride), CaCl2 (calcium chloride) [19] etc. are additionally included with the initial precursors to enhance the creation of crystal structures and the properties of the materials, speed up the reaction, and decrease the reaction temperature. The morphological properties of silicate materials are influenced by flux, which additionally enhances the luminous efficiency of powders. The potential benefits and rate of the reaction are influenced by the reactants’ structural characteristics and the reaction circumstances. Any nano- and micro-phosphors’ crystal structure development depends significantly on fluxes. Any formation moves along more quickly because to these fluxes. The final outcome is the synthesis of phosphors with actual chemical structures [20].

Results and Discussion

Powder X-Ray Diffraction Analysis (XRD)

An efficient, necessary, analytical, and nondestructive method for material characterization is powder X-ray diffraction analysis [21]. Diffraction is an X-ray-based technique that provides information on a unit cell’s chemical composition, phase structure, and crystallinity, as well as its microstructure, crystallinity, and stress analysis. It also provides data on its percentage phase composition, inter-planar spacing, and lattice parameters. Figure 1 shows the crystal phase of the phosphor. Comparison of the recorded XRD patterns with the standard JCPDS card number #79-2425 showed good agreement [22]. Akermanite-type structure describes the crystalline structures of synthesized phosphor, which is a member of the tetragonal crystal system with the cell parameters a=b=7.8071 Å, c=4.9821 Å; and α=90°, β=90°, γ=90°, as well as space group is P¯421m (113 space number and D32d space group) and point group is -42 m. Ca2MgSi2O7 crystal structure has a cell volume of 303.663 Å3 and a molar density of 2.944 gm/cm3 [7,23]. The XRD pattern (Figure 2) shows that the sample is single phased, which is consistent with JCPDS file no. 79-2425.

FIG 2

Figure 2: XRD patterns of host & Dy3+ activated Ca2MgSi2O7 phosphor

Estimation of Crystallite Size (D)

The XRD measurement displays a slight shift towards the larger angle in contrast to the standard reference data. From the XRD diffraction peaks, the crystallite size was determined with the help of the Debye-Scherrer empirical formula [24,25].

Debye-Scherrer numerical expression as follows:

4

where k is the Scherrer constant, D is the crystallite size for the (hkl) plane, 𝜆 is the wavelength of the incident X-ray radiation [Cu-Kα (1.5405 Å)], β is the full width at half maximum (FWHM) in radiations, and 𝜃 is the corresponding angle of Bragg diffraction. Based on the Debye-Scherrer’s formula, the average particle size obtained from the XRD measurement is ~27 nm, which displays in nano form.

Analysis of Surface Morphology (FESEM) Micrographs

The combustion-synthesized phosphor’s morphology at a 2-micron scale can be seen in the FESEM micrograph (Figure 3), which suggests that the synthesized crystal is in nano form. The particles’ highly agglomerated crystallite shape gives them a frothy appearance. The precursor particles had a spherical shape and were microscopic in size. It also shows aggregated grains, which might be a result of the powder’s extended stay within a combustion furnace. Throughout the combustion reaction process, the particles cluster and get larger. In present case, we have determined the mean value of particle size by Image J software about 20.492 nm.

FIG 3

Figure 3: FESEM morphological Image of Dy3+ activated Ca2MgSi2O7 Phosphor with 20.00 K X magnification

Despite the fact that a sample containing stoichiometric proportions of redox mixture boils, goes through dehydration, and then decomposes, creating combustible gases which involves oxides of N2, H2O, and nascent oxygen when heated fast to 600°C. The doped phosphor lattice is able to develop in the ideal environment, which forms when the volatile combustible gases ignite, burn with a flame, and ignite. In addition, this procedure makes it possible to uniformly (homogeneously) dope rare-earth impurity ions in one step. We also anticipate that the particle surface shape may have an impact on the thermal characteristics of these phosphor materials.

Figure 4 shows the electron Image of the synthesized Ca2MgSi2O7: Dy3+ phosphor. It is clearly evident from the picture that the dysprosium ions are well deep trapped in the host crystal lattice sites. That is, they are indicating deeper traps. Dy3+ ions served as hole traps (Dy3+ + hole → Dy4+). Between the lower energy state (ground) and higher energy state (excited) state, Dy3+ ions serve as deep hole trap levels. Dy3+ ions may trap holes or electrons or just to create/modify defects as a result of charge compensation. The deeper traps are highly responsible for the persistent luminescence.

FIG 4

Figure 4: Electron image of synthesized Ca2MgSi2O7: Dy3+ phosphor

Analysis of Energy Dispersive X-ray (EDX) Spectroscopy

Using EDX spectra, the chemical constituents of the powder sample has been determined. Identification and measurement of the elemental composition of sample areas as small as a few nanometers are conventional procedures [26]. In EDX spectra, the presence of Ca, Mg, Si, O and Dy intense peak are present which preliminary indicates the formation of Ca2MgSi2O7: Dy3+ phosphor in Figure 5.

FIG 5

Figure 5: EDX Spectrum of Dy3+ activated Ca2MgSi2O7 phosphor

As well as the existence of dysprosium is clear in their corresponding EDX spectra. Their appeared no other emission apart from calcium (Ca), magnesium (Mg), silicon (Si), oxygen (O), and dysprosium (Dy) in Ca2MgSi2O7: Dy3+ EDX spectra of the phosphor. The elements present in the Weight% and Atomic% also determined which is represented in Table 1.

Table 1: Chemical composition of synthesized Ca2MgSi2O7: Dy3+ phosphor

Sr.

Element

Weight%

Atomic%

1. O K

54.98

71.64

2. Mg K

6.57

5.63

3. Si K

13.98

10.38

4. Ca K

23.50

12.22

5. Dy L

0.97

0.12

6. Totals

100.00

100.00

Thermoluminescence (TL) Analysis

TL Spectra

When some of the energy needed to irradiate a material is used to move electrons to traps, a phenomenon referred to as thermoluminescence (TL). This energy, which was trapped as trapped electrons, is released when the material’s temperature rises, turning the luminescence that results into TL emission [27]. The thermo luminescence dosimetry (TLD) of ionizing radiation, thermo luminescence dosimetry (TLD) for dating applications, and also provides insights on the trap levels are all extensively employed features of the TL technique [28]. The basic goal of TL experiments is to acquire data from an experimental glow curve, or from a series of experimental glow curves, and to analyze that data in order to determine values for all of the parameters with regard to the relevant luminescence mechanisms.The single and strong TL glow curve of UV-irradiated Dy3+ (4 mol%) activated Ca2MgSi2O7 with constant heating rate (5°C/sec) at different UV radiation times (i.e. 5 min, 10 min, 15 min, 25 min, 25 min) is shown in Figure 6. Since the population of trapped electrons in a metastable state reaches a maximum value at a specific time, the TL intensity in this case increases with increasing irradiation time up to 15 min, then decreases with time. From the TL glow curve of Ca2MgSi2O7:Dy3+ it was observed that single broad fitted peak are centered at 112.21°C. The corresponding depth of the trap at 112.21°C should be deeper (high temperature). Deeper traps are highly helpful for increasing the long persistent duration and afterglow process [7]. Therefore, TL data reveal the presence of single trapping levels in Ca2MgSi2O7:Dy3+ phosphor.

FIG 6

Figure 6: TL glow curve of synthesized Ca2MgSi2O7:Dy3+ phosphor

Concentration Effect of Dy3+ ions

It is obvious that the TL intensity rises with rising Dy3+ concentration, reaches a maximum value at 4 mol%, and then falls with increasing Dy3+ ion concentration. The distance between the activators ions decreases as the activator concentration rises. The ions get involved more frequently, and energy is transferred. On the other hand, the energy that the ions store decreases as the activator concentration rises [7,26]. Consequently, there is an optimum concentration of the activator ions. As is seen from figure the favorable concentration of Dy3+ in Ca2MgSi2O7 nanophosphor is about 4 mole % (relative to Ca2+). The ionic radii of Ca2+, Mg2+, Si4+ and Dy3+ are 1.12 Å, 0.58 Å, 0.26 Å, and 0.97 Å, respectively [29]. When Dy3+ ions doped into Ca2MgSi2O7 host lattice, they may prefer to occupy the Ca2+ crystallographic site rather than Dy3+ site, because the radius of the Dy3+ is very closer to that of the Ca2+ lattice site [30]. A positive centre (hole) is formed when a trivalent metallic ion (such as Dy3+) substitutes a divalent metallic ion in a host lattice. So, Dy3+ ions hardly incorporate into tetrahedral [MgO4] and [SiO4] and only incorporate into [CaO8] anions complexes in host lattice [31]. The traps are released when the phosphor is heated, and the intensity of the thermoluminescence is raised by radiative recombination at the Dy3+ ions.

Peak Shape Method

The most significant glow curve peak’s kinetic parameters are found using the peak shape approach (Figure 7), also referred to as Chen’s empirical method [32]. The kinetic/trapping parameters such as the trap depth or activation energy (E), the order of the kinetics (b), and the frequency factor (s) have a significant impact on the TL characteristics. The area under the curve, the heating rate, the form of the glow curve, and other analytical techniques have all been developed to get TL parameters. The next sections provide a brief overview of the peak shape approach and the findings it produced for the current investigation.

FIG 7

Figure 7: An illustration of a typical thermoluminescent light curve utilizing the peak shape approach

Calculation of Kinetic/Trapping Parameters

[a] Order of kinetics (b)

Recombination of de-trapped charge carriers with their counterparts is referred to as the order of kinetics (b), and the order of kinetics depends on the TL peak shape approach. The TL glow peak of the Ca2MgSi2O7:Dy3+ phosphor TL glow curves was calculated using Chen’s empirical formula.

The geometrical factor μg was calculated as:

5

Here, Tm is the temperature corresponding of high peak intensity, whereas T1 and T2 is the ascending and descending part of peak correspond to the full-width at half maxima (FWHM). The TL glow peak divided between first and second order of kinetics of geometric factor defined, first order kinetics (μg)=0.39-0.42, (μg)=0.49-0.52 is the second order kinetics and (μg)=0.43-0.48 is the mixed order of kinetics [33].

The calculated symmetry factor (g) for the single peak was 0.47-0.51, which is close to the value for the second-order kinetics. This demonstrates that the single band’s peaks are of second order. The outcome shows that, in compared to the first-order example, the chance of retrapping carriers is higher after the carriers from the traps corresponding to the single bands were freed [34].

[b] Activation energy (E)

We used the following equation to estimate the depth of the traps, (E). It is calculated by the general formula, which is valid for any kinetics. It is given by,

6

For general order kinetics cα and bα (α=τ, δ, ω) are calculated by following expression,

6.123

[c] Frequency factor (S)

After being exposed to ionizing radiation, the frequency factor is a probability that indicates the escape of electrons from the traps. After determining the kinetics order (b) and activation energy (E), the frequency factor (s) has been determined from the following equation and the values of b and E were substituted.

7

Here, β is heating rate, k is Boltzmann constant, and b is the order of the kinetics, which is 2 in this case. The TL glow curves were recorded by TLD reader (Nucleonix Model 1009I)) with a linear heating rate of 5°C s−1 [35].

Table 2 shows the effects of various UV exposure times, such as 5, 10, 15, 20, and 25 minutes, on the Ca2MgSi2O7:Dy3+ phosphor and several TL kinetic parameters, such as trap energy, symmetry factor, and frequency factor.

Table 2: Values of different Kinetic parameters of the main TL glow peak curves of Ca2MgSi2O7:Dy3+ phosphor calculated from using peak shape method.

UV Radiation Time

(oC)

(oC)

(oC)

E (eV)

Frequency Factor

5 min

86.43

112.21

139.36

25.78

27.15

52.93

0.51

0.72

1.2 × 10⁷

10 min

87.33

112.21

136.10

24.88

23.89

48.77

0.49

0.77

2.87 × 10⁷

15 min

87.33

112.21

136.10

24.88

23.89

48.77

0.49

0.77

2.87 × 10⁷

20 min

85.69

112.21

139.36

26.52

27.15

53.67

0.51

0.71

1.2 × 10⁷

25 min

85.69

112.21

136.10

26.52

23.89

50.41

0.47

0.66

1.1 × 10⁷

This method was applied to the cleaned main peak determined by means of trap energy (E), frequency factor (s) and symmetry factor (μg) were calculated using Eqs. (5) and (6). Symmetry factor (μg), average trap energy and frequency factor were found between in the range of 0.47-0.51, 0.66-0.77 eV and 1.1 × 10⁷ to 2.87 × 10⁷ s−1, respectively. Thus, in our case, we obtained the maximum thermo-luminescence [TL] in 15 min UV exposures time. In our case, symmetry factor (μg) is lies between 0.47-0.51, which signs that it is a case of second order kinetics, responsible for deeper trap depth. According to Sakai’s and Mashangva report, he is also reported that a trap depth between 0.65-0.75 eV is very appropriate for long afterglow properties [36,37].

It is obvious that the dysprosium ion, because of its inherent nature, is more to responsible for the hole trap level. That is, the dysprosium ion’s inherent properties enable it to produce a hole trap level as soon as it reaches the host crystal lattice. In a host lattice site, these hole trap levels are trapped extremely deeply. The material has long-lasting properties as a result of these deeper traps.

Conclusion

Tetragonal samples of Ca2 MgSi2O7 with 4 mol% dopant concentration of Dy3+ ions have been successfully synthesized by combustion synthesis technique method at 600°C, which appears to be the most feasible method for their production. For better understanding its spectroscopic and luminescent characteristics, several characterization approaches were investigated. Amorphous structure and nanoscale particle size were determined using XRD and FESEM analyses. The crystallite particle size has been calculated as 27 nm and 20.492 nm. The size of the crystallites has been achieved in the nano order and nano range with considerably greater uniformity. The surface morphology of the particles is shown by the FESEM data to have a flake-like structure, a uniform, homogenous, superfine crystal structure, and to have aggregated firmly. The EDX spectra confirmed the presence of Ca, Mg, Si, O and Dy elements in Ca2 MgSi2O7:Dy3+ phosphor. The TL glow curves are centered at 112.21°C for 15 min UV exposure time, which displays optimum UV exposure time. TL study shows that the optimum Dy3+ concentration was found for 4 mol%. The probability of recapturing released charge carriers before recombination is supported by the second order kinetics. The long after glow process is being enhanced considerably by Dy3+ ions. The activation energy of Ca2 MgSi2O7:Dy3+ was found to be 0.66-0.77 eV. On the basis of the value of the activation energy, we have suggested that the Combustion-synthesized Ca2MgSi2O7:Eu2+, Dy3+ phosphor is an excellent thermoluminescent material and a more efficient long persistent material. It may highly applicable for TL dosimetry and long persistent applications.

Future Scope of This Work

The advancement of energy-efficient transmission, storage, and generating technologies using nanomaterials has significantly enhanced the effectiveness of both conventional and renewable energy sources. The thermoluminescence properties of nanomaterials have highly applicable in archeological dating, forensic science, geology, medical dosimetry, environmental radiation, oncology radiation, biological science, radiation physics, medicine, neutron-dosimetry, UV radiation monitoring, high-level photon dosimetry radiation. Radiation therapy or radio-therapy have used in a cancer disease treatment and kill cancer cells. As-synthesized Ca2MgSi2O7: Dy3+ phosphor is an excellent thermoluminescent material and a more efficient long persistent material.

It is highly applicable in TL radiation dosimetry applications for personnel and environmental monitoring. The luminescent features of biomaterials have prospective applications in different areas such as DNA transplantation of tumor in the field of biological science, signal processing or image recognition in the field of computer science and information technology, drug delivery in the field of pharmaceutical science, and in the field of nutrition therapy, chemotherapy, as well as in the field of tissue engineering and bone-tissue engineering.

Acknowledgement

We gratefully acknowledge the kind support for the facility of XRD, FESEM, and EDX analysis Dept. of Metallurgical Engineering, NIT Raipur (C.G.). Authors are also thankful to Dept of physics, Pt. Ravishankar Shukla University, Raipur (C.G.) for providing us the facility of thermoluminescence (TL) analysis. We are also heartily grateful to Dept. of physics, Dr. Radha Bai, Govt. Navin Girls College Mathpara Raipur (C.G.), providing the facility of muffle furnace and other essential research instruments

Competing Interests

Authors have declared that no competing interests exist in this present research investigation.

Authors Contribution

Both authors contributed to the completion of this work. Author Dr. Shashank Sharma undertakes the manuscript designed and conducted the entire experiments and characterization studies, collected and analyzed the research data, and prepared the entire manuscript draft as well as supervised the results-discussion. Similarly, author Dr. Sanjay Kumar Dubey has properly checked the spelling mistake, punctuation, grammatical error, conceptualization, writing, review, editing and helped in sample preparation. Both authors read and approved the final manuscript.

References

  1. Prasannakumar JB, Vidya YS, Anantharaju KS, Ramgopal G, Nagabhushana H, et al. (2015) Bio-mediated route for the synthesis of shape tunable Y2O3: Tb3+ nanoparticles: photoluminescence and antibacterial properties. Spectrochimica Acta Part A: Molecular and Biomolecular Spectroscopy 151: 131-140.
  2. Hong DS, Meltzer RS, Bihari B, Williams DK, Tissue BM (1998) Spectral hole burning in crystalline Eu2O3 and Y2O3: Eu3+ Journal of Luminescence 76: 234-237.
  3. Gong Y, Wang Y, Jiang Z, Xu X, Li Y (2009) Luminescent properties of long-lasting phosphor Ca2MgSi2O7: Eu2+. Materials Research Bulletin 44: 1916-1919.
  4. Cai J, Pan H, Wang Y (2011) Luminescence properties of red-emitting Ca2Al2SiO7: Eu3+ nanoparticles prepared by sol-gel method. Rare Metals 30: 374-380.
  5. Talwar GJ, Joshi CP, Moharil SV, Dhopte SM., Muthal PL, et al. (2009) Combustion synthesis of Sr3MgSi2O8: Eu2+ and Sr2MgSi2O7: Eu2+ Journal of Luminescence 129: 1239-1241.
  6. Dutczak D, Milbrat A, Katelnikovas A, Meijerink A, Ronda C, et al. (2012) Yellow persistent luminescence of Sr2SiO4: Eu2+, Dy3+. Journal of Luminescence 132: 2398-2403.
  7. Sharma S, Dubey SK (2022) Significant Contribution of Deeper Traps for Long Afterglow Process in Synthesized Thermoluminescence Material. Journal of Mineral and Material Science 3: 1-6.
  8. Mckeever SWS (1985) Thermoluminescence of Solids, Cambridge University Press. London New York.
  9. Vij DR (1993) Thermoluminescence materials, PTR Prentice-Hall, Inc. A Simon a Schuster Company, Englewood Cliffs, New Jersey 7632.
  10. Yuan ZX, Chang CK, Mao DL, Ying W (2004) Effect of composition on the luminescent properties of Sr4Al14O25: Eu2+,Dy3+ Journal of Alloys and Compounds 377: 268-271.
  11. Kiisk V (2013) Deconvolution and simulation of thermoluminescence glow curves with Mathcad. Radiation Protection Dosimetry 156: 261-267.[crossref]
  12. Aruna ST, Mukasyan AS (2008) Combustion synthesis and nanomaterials. Current opinion in Solid State and Materials Science 12: 44-50.
  13. Ekambaram S,Patil KC (1995) Synthesis and properties of rare earth doped lamp phosphors. Bulletin of Materials Science 18: 921-930.
  14. Toniolo JC, Lima MD, Takimi AS, Bergmann CP (2005) Synthesis of alumina powders by the glycine-nitrate combustion process. Materials Research Bulletin 40: 561-571.
  15. Dubey SK, Sharma S, Diwakar AK, Pandey S (2021) Synthesization of Monoclinic (Ba2MgSi2O7: Dy3+) Structure by Combustion Route. Journal of Materials Science Research and Reviews 8: 172-179.
  16. Liu G, Li J, Chen K (2010) Combustion synthesis. Handbook of Combustion: Online 1-62.
  17. Kingsley JJ, Patil KC (1988) A novel combustion process for the synthesis of fine particle α-alumina and related oxide materials. Materials Letters 6: 427-432.
  18. Park B, Lee S, Kang J, Byeon S (2007) Single-Step Solid-State Synthesis of CeMgAl~ 1~ 1O~ 1~ 9: Tb Phosphor. Bulletin-Korean Chemical Society 28: 1467.
  19. MORAIS VRD, LEME DDR, Yamagata C (2018) Preparation of Dy3+-doped calcium magnesium silicate phosphors by a new synthesis method and its luminescence characterization.
  20. Sharma S, Dubey SK (2021) The significant properties of silicate based luminescent nanomaterials in various fields of applications: a review. International Journal of Scientific Research in Physics and Applied Sciences 9: 37-41.
  21. Bates S, Zografi G, Engers D, Morris K, Crowley K, et al. (2006) Analysis of amorphous and nanocrystalline solids from their X-ray diffraction patterns. Pharmaceutical Research 23: 2333-2349.[crossref]
  22. JCPDS (Joint Committee on Powder Diffraction Standard) PDF File No. #79-2425.
  23. Sharma S, Dubey SK (2023) Enhanced Luminescence Studies of Synthesized Ca2MgSi2O7: Ce3+ Phosphor. COJ Biomedical Science and Research 2: 1-9.
  24. Birks LS, Friedman H (1946) Particle size determination from X‐ray line broadening. Journal of Applied Physics 17: 687-692.
  25. Scherrer P (1918) Bestimmung der Grösse und der inneren Struktur von Kolloidteilchen mittels Röntgenstrahlen. Nachrichten von der Gesellschaft der Wissenschaften zu Göttingen, mathematisch-physikalische Klasse 98-100.
  26. Sharma S, Dubey SK (2022) “Specific Role of Novel TL Material in Various Favorable Applications.” Insights in Mining Science & Technology 3: 1-9.
  27. Vij DR (1998) Luminescence of solids, New York.
  28. Jüstel T, Lade H, Mayr W, Meijerink A, Wiechert DU (2003) Thermoluminescence spectroscopy of Eu2+ and Mn2+ doped BaMgAl10O17. Journal of Luminescence 101: 195-210.
  29. Shannon RD (1976) Revised effective ionic radii and systematic studies of interatomic distances in halides and chalcogenides. Acta Crystallographica Section A: Crystal Physics, Diffraction, Theoretical and General Crystallography 32: 751-767.
  30. Sharma S, Dubey, SK (2022) Importance of the Color Temperature in Cold White Light Emission of Ca2MgSi2O7: Dy3+ Journal of Applied Chemical Science International 13: 80-90.
  31. Jiang L, Chang C, Mao D (2003) Luminescent properties of CaMgSi2O6 and Ca2MgSi2O7 phosphors activated by Eu2+, Dy3+ and Nd3+. Journal of Alloys and Compounds 360: 193-197.
  32. Chen R (1969) Thermally stimulated current curves with non-constant recombination lifetime. Journal of Physics D: Applied Physics 2: 371.
  33. Sharma S, Dubey SK (2023) Enhanced Thermoluminescence Properties of Synthesized Monoclinic Crystal Structure. Global J Mater Sci Eng 5: 146.
  34. McKeever SW (1988) Thermoluminescence of solids (Vol. 3) Cambridge University Press.
  35. Chen R (1969) Glow curves with general order kinetics. Journal of the Electrochemical Society 116: 1254-1257.
  36. Mashangva M, Singh MN, Singh TB (2011) Estimation of optimal trapping parameters relevant to persistent luminescence.
  37. Sakai R, Katsumata T, Komuro S, Morikawa T (1999) Effect of composition on the phosphorescence from BaAl2O4: Eu2+, Dy3+ Journal of Luminescence 85: 149-154.

Synthesis of Nano-Gold Particles for Multi-functional Finishing of Cotton Fabrics

DOI: 10.31038/NAMS.2023633

Abstract

Gold nanoparticles (AuNPs) were synthesized in situ on cotton, one of the most popular cellulose materials, to achieve functionalization. The localized surface plasmon resonance of the AuNPs imparted the cotton fabric with colors, showing good colorfastness to washing and rubbing. Characterization of the surface morphology and chemical composition of the modified cotton fabric confirmed synthesis and coating of the AuNPs on cotton fibers. The relationship between the morphology of the AuNPs and the optical properties of the cotton fabric was analyzed. Acid condition enabled in situ synthesis of AuNPs on cotton. Cotton with AuNPs exhibited significant catalytic activity for reduction of 4-nitrophenol by sodium borohydride, and could be reused in this reaction. Treatment with AuNPs substantially improved the ultraviolet (UV)-blocking ability of the fabric and resulted in cotton with remarkable antibacterial activity. Traditional reactive dyes were applied to the cotton with AuNPs to enhance its color features. The catalytic properties of the AuNPs on the fabric were not influenced by dyeing with traditional dyes. AuNP-treated cotton fabric used as a flexible active substrate showed improved Raman signals of dyes on the fabric.

Keywords

Gold nanoparticles, Cotton, Coloration, Catalysis, Surface-enhanced Raman Scattering, Antibacterial

Introduction

Modification of cellulose fibers, in particular cotton products, using functional nanomaterials has attracted extensive attention, with the aim of imparting properties such as antibacterial, flame retardancy, and hydrophobic properties [1-7]. Many strategies have been developed to obtain such combinations of fabric and nanoparticles, including plasma treatment, electrostatic assembly, chelation by active groups, and in situ synthesis [8-12]. Anisotropic silver nanoparticles (AgNPs) have been assembled on cotton fabric via electrostatic interaction between nanoparticles and cotton fibers, endowing the textile with bright colors due to their unique optical property, i.e., localized surface plasmon resonance (LSPR) [13]. Cotton fabric with AgNPs was also modified, followed by treatment with fluorinated decyl polyhedral oligomeric silsesquioxane (FPOSS), to fabricate colored fabric with durable antibacterial and self-healing superhydrophobic properties. AgNPs have been combined with cotton under the binding effect of branched poly(ethylenimine) (PEI) [13]. Poly-butylacrylategrafted carbon nanotubes has been applied to cotton fabric using a common dipping–drying–curing finishing procedure [14]. The modified cotton showed various functions, such as enhanced mechanical properties and extraordinary flame retardancy. Core–shell-structured silica dioxide@zinc oxide (SiO2@ZnO) nanoparticles have been prepared and adhered to cotton fabric with the assistance of (3-Aminopropyl)triethoxysilane (APTES) or vinyltriethoxysilane (VTES) [15], resulting in textiles with antibacterial activity, UVprotection properties, and high durability. Titanium dioxide (TiO2) nanoparticles have also been used for functionalization of cotton to obtain fabric with selfcleaning and UV-blocking properties [16,17]. Among functional nanoparticles, gold nanoparticles (AuNPs) have received considerable attention from researchers, owing to their promising optical, electronic, magnetic, catalytic, and biomedical applications [18,19]. As the most stable metal nanoparticles, AuNPs can be prepared using straightforward routes and are resistant to oxidation, facilitating diverse applications. AuNPs present significant catalytic activity in various reaction systems. They exhibit unique optoelectronic features and possess excellent biocompatibility with appropriate ligands as well as high surface-to-volume ratio. The properties of AuNPs including the LSPR optical effect can be readily tuned by controlling their size, shape, and surroundings. Moreover, AuNPs have been widely used as effective active substrate materials for surface-enhanced Raman scattering (SERS) analysis. The Raman signals of molecules adsorbed on AuNPs can be extremely enhanced. Modification of textile materials with AuNPs can transfer some of these important properties to the resulting textile products. Cotton is the most widely used natural fibrous material for textile and clothing production. Modification of cotton is driven by growing consumer demand for enhanced functions of conventional textile products. In situ synthesis of nanoparticles on fabric/fibers is a simple and effective route to achieve functional modification of textile materials; For example, A hydrophobic hierarchical structure has been fabricated on cotton fabric by in situ growth of silica nanoparticles [20,21]. AgNPshas been synthesized in situ on cotton fabric by adjusting the pH value at room temperature. The as-synthesized AgNPs imparted vivid colors and strong antibacterial properties to the treated fabric. TiO2 nanoparticles have been synthesized with anatase structure using ultrasonic irradiation at low temperature and loaded them onto cotton fabric [22]. The TiO2-loaded cotton fabric exhibited UV-protection and self-cleaning features. ZnO nanoparticles have been synthesized in situ in the cellulosic pores of cotton fabric by reacting zinc nitrate and sodium hydroxide to obtain fabric with antibacterial and UV-protection properties [23]. In the previous research, AuNPs were synthesized in situ on silk fabric by heat treatment [24]. This silk fabric treated with AuNPs showed not only vivid colors but also enhanced Raman signals for use as an active SERS substrate for detection of trace analytes [25]. These results inspired us to develop cotton functionalized with AuNPs by in situ synthesis. In this study, cotton fabric was modified by AuNPs synthesized in situ through heat treatment. The optical properties of the resulting colorful fabric treated with AuNPs were analyzed based on color strength (K/S) curves and ultraviolet–visible (UV–Vis) diffuse reflectance absorption spectroscopy. The surface morphology of the cotton fabric before and after modification with AuNPs was investigated by scanning electron microscopy (SEM). The influence of pH on the in situ synthesis of the AuNPs was investigated. The catalytic activity and antibacterial features of the AuNP-treated cotton fabric were evaluated. Complex coloration of cotton fabric using both AuNPs and traditional dyes was also explored. Furthermore, cotton fabric with AuNPs was used as a flexible active substrate to enhance the Raman signals of dyes on the fabric.

Technical Details

The following chemicals were used
Tetrachloroauric(III) acid trihydrate, acetic acid, sodium hydroxide, 4-nitrophenol, and sodium borohydride, Cellulose powder, CI Reactive Red 3 and CI Reactive Red 195
The textile material used was Knitted cotton fabric
The instruments used for measurement are as follows
SEM
Plasma atomic emission spectrometer
Raman microscope system
Color i7 spectrophotometer
Liquor to fabric ratio was 50: 1
The following have been followed
Colorfastness to washing
Colorfastness to rubbing
Catalytic activity
Antibacterial testing against Gram negative bacterium (Figure 1)

FIG 1

Figure 1: Modification of cellulose fibers

Preparation and Characterization of Gold Nano-particles

Figure 2 shows a photograph of the treated cotton fabric samples. The cotton fabric treated in 0.025 mM HAuCl4 solution (Cot-Au-1) was light red, implying presence of AuNPs on the cotton fibers. The color of the cotton fabric with AuNPs changed from light red to red to dark red as the initial concentration of HAuCl4 was increased from 0.025 mM to 0.125 mM. Based on ICP-AES, the gold content of the cotton fabric with AuNPs was measured to be 0.386, 0.725, 0.921, 1.638, and 1.849 mg g-1 for Cot-Au-1, Cot-Au-2, Cot-Au-3, Cot-Au-4, and Cot-Au-5, respectively.

FIG 2

Figure 2: Treated cotton fabrics

The gold content of the samples increased as the concentration of HAuCl4 was increased. K/S curves were obtained to analyze the color changes. The peak of the K/ S curves for the treated cotton fabric remained unchanged, being located at 540 nm, with increasing gold content. However, the maximum value of the treated cotton fabric increased as the gold content was increased, consistent with its deepening color. UV– Vis diffuse reflectance absorption spectra of cotton fabric treated with AuNPs were measured. As shown in Figure 1c, a single absorption band located at 534 nm appeared in the UV–Vis absorption spectrum of CotAu-1, assigned to the characteristic LSPR mode of AuNPs. The LSPR band of cotton fabric treated with AuNPs red-shifted from 534 nm to 547 nm as the initial concentration of HAuCl4 was increased from 0.025 mM to 0.125 mM, along with an increase in the absorption band intensity. These changes in the color and LSPR property of the AuNP-treated cotton fabric may be related to the gold content, and the morphology and density of AuNPs on the cotton. SEM was employed to observe the surface morphology of the treated cotton fabric (Figure 3).

FIG 3

Figure 3: SEM images of a Cot-Au-1, b Cot-Au-2, c Cot-Au-3, d Cot-Au-4, and e Cot-Au-5

A number of nanoparticles were seen over the surface of fibers (Figure 2), demonstrating that AuNPs were synthesized in situ on the cotton. The size of the AuNPs on cotton was measured to be 8.7 ± 1.2, 8.6 ± 1.3, 14.1 ± 3.0, 17.4 ± 3.0, and 20.5 ± 3.8 nm for Cot-Au-1 to CotAu-5, respectively. Although the sizes for Cot-Au-1 and Cot-Au-2 were similar, Cot-Au-2 with higher LSPR intensity had higher density of AuNPs on fiber surfaces in comparison with Cot-Au-1. The size of AuNPs increased as the gold content of the samples increased as the Au ion concentration was changed from 0.05 mM to 0.125 mM. It was found that nearly all the nanoparticles on the cotton fibers were spherical for low gold content (Cot-Au-1, Cot-Au-2, and CotAu-3), whereas a few anisotropic AuNPs, such as triangular nanoplates, appeared when the gold content was increased to high level (Cot-Au-4 and Cot-Au-5). The anisotropy of the AuNPs led to the red-shift of the LSPR band observed in the UV– Vis diffuse reflectance absorption spectra of the AuNPtreated cotton fabric. As seen from the SEM images, the density of AuNPs reduced when the Au ion concentration was changed from 0.075 to 0.10 and 0.125 mM, due to generation of larger and anisotropic AuNPs. All these effects on the morphology (shape and size) and density of the AuNPs on cotton led to the changes in the LSPR property of the different samples. XPS was used to analyze the cotton fabric treated with AuNPs. XPS peaks assigned to O 1s and C 1s as the normal components of cellulose were seen in the XPS spectrum of Pri-Cot fabric. XPS peaks ascribed to Au element appeared in the XPS spectra after the cotton fabric was treated. The XPS spectrum for Cot-Au-4 displayed two principal bands at 82.2 and 85.8 eV, attributed to binding energies of 4f7/2 and 4f5/2 of metallic Au, respectively [26]. These XPS results indicate that AuNPs were successfully synthesized on the cotton fabric.

Influence of pH Value

We investigated the influence of the pH value on the in situ synthesis of AuNPs on the cotton fabric. The original pH value of the HAuCl4 aqueous solutions at 0.025–0.125 mM was around 4. The pH value of the reaction systems was adjusted by addition of acetic acid or NaOH aqueous solutions. The K/S curves and UV–Vis diffuse reflectance absorption spectra of cotton fabric treated has been obtained with 0.10 mM HAuCl4 solution at different pH values (3–6). As can be seen, the cotton fabric treated at pH 3 showed the highest K/S value of 1.71 among the different cotton samples. The K/S value of the AuNP-treated cotton fabric decreased as the pH value of the reaction system was increased. The maximum K/S decreased to 0.28 when the pH value was increased to 6. Vivid cotton fabric was obtained when using 0.10 mM HAuCl4 in the pH range of 3–6, although the cotton fabric changed slightly in color after heat treatment in HAuCl4 solution (0.10 mM) at pH 7 or above, implying that nearly no AuNPs were produced. The UV–Vis diffuse reflectance absorption bands of the cotton fabric treated with AuNPs at different pH values were centeredaround 540 nm. The intensity of the absorption bands decreased with increase in the pH value, consistent with the change trend of the K/S values. It can be inferred that acid condition facilitated in situ synthesis of AuNPs on cotton fabric, similar to the case of in situ preparation of AuNPs on ramie fibers [27]. It is well documented in literature that the pH value of the reaction system plays a vital role in formation of AuNPs through reduction of HAuCl4 [28-33]. Au ion complexes with chloride and/or hydroxide as ligands were suggested to be AuCl4 – (pH 3.3), AuCl3(OH)- (pH 6.2), AuCl2(OH)2 – (pH 7.1), AuCl(OH)3 – (pH 8.1), and Au(OH)4 – (pH 12.9) ions, corresponding to different ranges of pH [34,35]. The reduction potential of Au ion complexes depends remarkably on the pH value, with decreased reactivity as the pH is increased, in the order AuCl4 -[AuCl3(OH)-[AuCl2(OH)2 -[AuCl(OH)3 – [Au(OH)4 -. In the present study, AuNPs were synthesized in presence of cotton under acid condition, whereas Au ions were not reduced to form AuNPs in neutral or basic solution. The present results are consistent with previous analyses of the influence of pH on the formation of AuNPs. Mechanism of in situ synthesis of AuNPs It is well known that cellulose is the dominant component of cotton, consisting of long chains of Dglucose units [36]. In situ synthesis of AuNPs on cotton fabric in this study could result from reduction of Au ions by cellulose. Pure cellulose powder has been employed to reduce Au ions according to the same experimental procedure with cotton fabric. As shown in Figure S3, purplish red and grayish purple cellulose powders were produced after heat treatment in HAuCl4 solution, implying synthesis of AuNPs by cellulose. This result indicates that the reducing effect of cellulose in cotton led to in situ formation of AuNPs. Cellulose materials have been reported to act as reducing agents to synthesize AuNPs and AgNPs, owing to their abundant hydroxyl groups [37,38]. It is suggested that hydroxyl groups of cellulose play a pivotal role in the in situ formation of metal nanoparticles. The primary hydroxyl groups with higher reactivity in cellulose could be oxidized by Au ions during in situ synthesis of AuNPs. The reducing ends of cellulose in cotton could also contribute to reduction of Au ions to form AuNPs [39]. As proposed in previous research, oxygen-containing groups on the surface of cotton, including carboxylate and hydroxyl groups, can serve as active sites that might combine with AuNPs through complexing or electrostatic interaction [40]. Zeta potential measurements in our previous work indicated that cotton powder carries negative charge. It is suggested that a complexing or electrostatic interaction could lead to effective combination of synthesized AuNPs with cotton fabric in the present study. Cotton acted as a reducing agent and a stabilizing agent to prepare AuNPs on the fiber surface. Assessment of colorfastness is one of the important parameters to assess the properties and performance of textile products. The colorfastness to washing of the cotton fabric treated with AuNPs was tested by washing in presence of ECE reference detergent at 50oC for 45 min in each washing cycle. The DE values of the treated fabric before and after washing have been determined. After the first washing cycle, the DE values were measured to be 0.7 and 2.6 for Cot-Au-4 and Cot Au-5, respectively, revealing that color fading occurred for the cotton fabric treated with AuNPs during washing. However, the DE of the treated fabric increased slightly after the third washing cycle. These results demonstrate that the cotton fabric colored with AuNPs exhibited reasonably good colorfastness to washing. In addition, the colorfastness to rubbing of the treated cotton fabric was tested. The gray scale rating for the DE values of Cot-Au-2, Cot-Au-4, and Cot-Au-5 under dry and wet rubbing conditions was assessed. The dry rubbing colorfastness was rated as 5, 4–5, and 4–5 for Cot-Au-2, Cot-Au-4, and Cot-Au-5, respectively. The rating of the wet colorfastness of Cot-Au-2, Cot-Au-4, and Cot-Au-5 was estimated to be 4–5, 4, and 4, respectively. These results show that the cotton fabric treated with AuNPs exhibited good colorfastness to dry or wet rubbing. Investigation of catalytic activity AuNPs have been widely used as catalysts for various reactions [41-43]. In the present research, AuNPs were bound to cotton fibers after in situ synthesis. As the cotton fabric acts as a support for the nanoparticles (Scheme 1), they can be readily separated from the reaction system, enabling reuse of the catalyst. Reduction of 4-NP has been commonly used as a model catalytic reaction to evaluate the catalytic activity of metal nanoparticles [44]. The catalytic activity of the cotton fabric treated with AuNPs was assessed by monitoring the UV–Vis absorption spectra of aqueous solution during reduction of 4-NP using NaBH4. The color of the 4-NP solution changed from light yellow to green–yellow after addition of NaBH4. Nitro compounds are inert to NaBH4 in absence of catalyst, whereas metal nanoparticles can act as an electronic relay agent for electron transfer from NaBH4 to nitro compounds to accelerate the reduction reaction [45]. A new UV–Vis absorption peak for 4-NP solution appeared at 400 nm after NaBH4 was added, due to formation of 4-nitrophenolate ions. The evolution of the UV–Vis absorption spectra of 4-NP solution after mixture with NaBH4 in presence of pristine cotton fabric was recorded. The intensity of the absorption peak at 400 nm for 4-NP decreased only slightly, revealing that pristine cotton fabric showed no catalytic activity. Time-resolved UV–Vis absorption spectra of 4-NP solution with NaBH4 in presence of AuNP-treated cotton fabric have been obtained (Cot-Au-1 to Cot-Au-5). The absorption peak at 400 nm of 4-NP solution decreased distinctly in intensity after addition of NaBH4 in presence of all the fabric samples treated with AuNPs. Meanwhile, a new absorption peak arose at 300 nm due to the reduction process of 4-NP, implying formation of 4-AP [46,47]. The intensity of the absorption peak at 400 nm was plotted as a function of time to determine the reduction rate of 4-NP. The rapid intensity decrease of the peak at 400 nm indicates that the cotton fabric treated with AuNPs exhibited notable catalytic activity. It was found that the reduction system with Cot-Au-4 exhibited the highest reaction rate among the AuNPtreated cotton fabric samples. Reduction of 4-NP is generally considered to be a pseudo-first-order kinetic reaction on account of excess NaBH4 [48,49]. Plots of ln(At/A0) versus time have been obtained, where At and A0 denote the absorption intensity at 400 nm at time t and the initial stage, respectively. The linear correlation between ln(At/A0) and time confirms this pseudo-first-order hypothesis. The apparent rate constant (Kapp) of the catalytic reaction can be estimated from the linear slope of ln(At/A0) versus time. The Kapp value of the reduction reaction was found to be 1.89 9 10-2, 1.76 9 10-2, 2.29 9 10-2, 4.32 9 10-2, and 2.55 9 10-2 min-1 with Cot-Au-1, Cot-Au-2, CotAu-3, Cot-Au-4, and Cot-Au-5, respectively. The Kapp values obtained in this study are comparable to related literature results for AuNPs [50,51]. Comparing these Kapp values for the AuNP cotton fabric samples, CotAu-4 with the largest Kapp value showed the highest catalytic activity, although the gold content of CotAu-4 was lower than that of Cot-Au-5. The catalytic properties of the treated cotton fabric depend on the AuNPs on the surface of cotton fibers. It is believed that the catalytic activity is related to the shape, size, and density of AuNPs on the fabric. To evaluate the reusability of the catalyst, treated cotton fabric (CotAu-4) was separated from the reaction system and reused in repeated reduction reactions of 4-NP. The peak intensity at 400 nm versus reaction time for each complete conversion is plotted in Figure 6h. The treated fabric still exhibited strong catalytic activity even after seven cycles, indicating that the treated cotton fabric exhibited durable catalytic effect. UV-protection and antibacterial properties Treatment with AuNPs endowed the cotton fabric with additional functions. The UV transmittance and UV protection factor (UPF) values of the different fabric samples have been determined. Coating with AuNPs reduced the average transmittance values of the cotton fabric. Transmittance values in both the UVA (315–400 nm) and UVB (280–315 nm) regions showed a decreasing trend with increasing gold content on the cotton fabric. The UPF value of pristine cotton fabric was measured to be 65.1, while in situ synthesis of AuNPs on the cotton fabric increased the UPF value to 109.3, suggesting that the AuNPs improved the UV-blocking ability of the cotton fabric. The antibacterial properties of AuNPs have attracted great interest, and various potential antibacterial applications have been explored [52-54]. The antibacterial activity of cotton fabric treated with AuNPs was evaluated against Gram-negative bacterium E. Coli. The bacteria on the pristine cotton fabric and treated cotton fabric have been studied (CotAu-4). A full lawn of bacteria was seen on the plates corresponding to the pristine cotton fabric, whereas no bacteria colonies were found on the agar medium of the AuNP-treated cotton fabric, revealing that presence of AuNPs on the fabric inhibited growth of bacteria. These results demonstrate that the cotton fabric with AuNPs possessed significant antibacterial activity. Dyeing of AuNP-treated cotton fabric with traditional dyes to improve the color range and saturation of the fabric, traditional dyes including R3 and R195 were used to dye the AuNP-treated cotton fabric. Dyeing with traditional dyes imparted deeper color to the cotton fabric than that achieved based on the LSPR optical effect of the AuNPs. The K/S values of the cotton fabric observably increased after dyeing with R3 and R195. Due to the light color of AuNPs at low gold content (0.386 mg g-1), the K/ S curves of Cot-R3 were almost the same as for CotAu-R3-1. The K/S curves of Cot-R195 and Cot-Au-R195-1 were also the same. However, coating with more AuNPs gave rise to higher K/S values for the cotton fabric colored with AuNPs and traditional dyes (R3 and R195). The AuNPs and dyes played a combined role in the color of the cotton fabric, even though the traditional dyes dominated the optical properties of the colored cotton fabric. Coloration using traditional dyes did not influence the catalytic properties of the cotton fabric with AuNPs. The UV–Vis adsorption spectra of 4-NP solution with Cot-R195 changed very little after addition of NaBH4, demonstrating no evident catalytic activity of Cot-R195, consistent with the case of PriCot. The intensity of the UV–Vis absorption band at 400 nm of 4-NP solution in presence of Cot-Au-R195-4 decreased sharply after NaBH4 addition, revealing that the cotton fabric after complex coloration with AuNPs and traditional dyes retained strong catalytic activity. Moreover, the cotton fabric with AuNPs and R195 could be reused in the catalytic reaction, showing significant catalytic activity after seven cycles. These results attest that the catalytic properties of AuNPs on cotton fabric are retained after coloration with traditional dyes. SERS enhancement by AuNP-treated cotton fabric AuNPs have been widely used as active substrates for enhancing Raman signals due to their LSPR effect. Raman scattering spectra were obtained to investigate the SERS enhancement effect of the AuNP-treated cotton fabric. No distinct bands were seen in the Raman scattering spectrum of pristine cotton fabric. However, visible bands were found in the Raman scattering spectra after AuNPs were coated on the cotton fabric. Evident vibrational bands were seen at 1604, 1378, 1121, 1096, 519, 457, 435, 380, and 257 cm-1 in the Raman scattering spectra of the AuNP-treated cotton fabric, being characteristic Raman bands of cotton fibers [55,56]. Some of these bands are assigned to vibrations of b-1,4-glycosidic ring linkages between D-glucose units in cellulose. It was found that CotAu-5 exhibited the strongest Raman signal of cellulose among the AuNP-treated cotton fabric samples, which may be due to the optimal morphology and corresponding LSPR effect of the nanoparticles. Noble-metal nanoparticles on textiles can enhance the Raman signals of dyes used for coloration of fibers, leading to promising applications of SERS in the field of identification of cultural heritage, forensic analysis, and textile dyeing [57-61]. In the present study, we investigated the SERS enhancement of R3 on the AuNP-treated cotton fabric. The cotton fabric dyed with R3 without AuNPs showed unclear Raman bands from cellulose units and dye on the fabric. However, enhanced Raman bands were obtained from R3-dyed cotton fabric treated with AuNPs. The R3-dyed cotton fabric with higher gold content (Cot-Au-R3-4 and Cot-Au-R3-5) showed unambiguous enhanced Raman bands. The Raman scattering spectrum of pure R3 powder has been determined. Compared with the normal Raman scattering spectrum of R3, the SERS bands from Cot-Au-R3-4 and Cot-Au-R3-5 at 284, 385, 478, 1000, 1032, 1123, 1274, 1473, and 1589 cm-1 can be ascribed to R3 dye on the AuNP-treated cotton fabric, although tiny wavenumber shifts occurred due to interactions of the dye and cotton fibers as well as AuNPs. The AuNPs on the fabric enhanced the Raman signal of the dye on the fibers, facilitating nondestructive analysis of dyes on textiles and providing insights into the dyeing mechanism of fibers.

Conclusions

Cotton fabric was functionalized by AuNPs synthesized in situ by a heating method. The fabric was colored by the AuNPs by virtue of their LSPR optical effect. The intensity of the LSPR band of AuNPtreated fabric increased with increasing gold content in the cotton samples. The treated fabric showed good colorfastness to washing and rubbing. SEM and XPS investigations confirmed the synthesis and combination of AuNPs on cotton. The mechanism for in situ synthesis of AuNPs on cotton was investigated. The fabric with AuNPs exhibited notable catalytic activity, as shown by monitoring reduction of 4-NP to 4-AP. The cotton fabric with AuNPs showed improved UVprotection and excellent antibacterial properties. Traditional dyes were combined with the AuNP-treated cotton, revealing improved color properties. The fabric with such complex coloration still exhibited prominent catalytic activity. Cotton fabric with AuNPs can also act as a SERS substrate for analysis of dyes on the fabric.

References

  1. El-Shishtawy RM, Asiri AM, Abdelwahed NAM, Al-Otaibi MM (2011) In situ production of silver nanoparticle on cotton fabric and its antimicrobial evaluation. Cellulose 18: 75-82.
  2. Mohamed AL, El-Naggar ME, Shaheen TI, Hassabo AG (2017) Laminating of chemically modified silan based nanosols for advanced functionalization of cotton textiles. Int J BiolMacromol 95: 429-437. [crossref]
  3. Dhineshbabu NR, Arunmetha S, Manivasakan P, Karunakaran G, Rajendran V (2016) Enhanced functional properties of cotton fabrics using TiO2/SiO2 nanocomposites. J Ind Text 45: 674-692.
  4. Shaheen TI, El-Naggar ME, Abdelgawad AM, Hebeish A (2016) Durable antibacterial and UV protections of in situ synthesized zinc oxide nanoparticles onto cotton fabrics. Int J BiolMacromol 83: 426-432. [crossref]
  5. Alongi J, Malucelli G (2015) Cotton flame retardancy: state of the art and future perspectives. RSC Adv 5: 24239-24263.
  6. Alongi J, Carosio F, Malucelli G (2014) Current emerging techniques to impart flame retardancy to fabrics: an overview. PolymDegrad Stab 106: 138-149.
  7. Leng BX, Shao ZZ, de With G, Ming WH (2009) Superoleophobic cotton textiles. Langmuir 25: 2456-2460. [crossref]
  8. Cady NC, Behnke JL, Strickland AD (2011) Copper-based nanostructured coatings on natural cellulose: nanocomposites exhibiting rapid and efficient inhibition of a multidrug resistant wound pathogen, A. baumannii, and mammalian cell biocompatibility in vitro. AdvFunct Mater 21: 2506-2514.
  9. Dong H, Hinestroza JP (2009) Metal nanoparticles on natural cellulose fibers: electrostatic assembly and in situ synthesis. ACS Appl Mater Interfaces 1: 797-803. [crossref]
  10. Gorjanc M, Bukosek V, Gorensek M, Mozetic M (2010) CF4 plasma and silver functionalized cotton. Text Res J 80: 2204-2213.
  11. Tang B, Zhang M, Hou X, Li J, Sun L, Wang X (2012) Coloration of cotton fibers with anisotropic silver nanoparticles. IndEngChem Res 51: 12807-12813.
  12. Tang B, Kaur J, Sun L, Wang X (2013) Multifunctionalization of cotton through in situ green synthesis of silver nanoparticles. Cellulose 20: 3053-3065.
  13. Wu MC, Ma BH, Pan TZ, Chen SS, Sun JQ (2016) Silvernanoparticle-colored cotton fabrics with tunablecolors and durable antibacterial and self-healing superhydrophobic properties. AdvFunct Mater 26: 569-576.
  14. Liu YY, Wang XW, Qi KH, Xin JH (2008) Functionalization of cotton with carbon nanotubes. J Mater Chem 18: 3454-3460.
  15. El-Naggar ME, Hassabo AG, Mohamed AL, Shaheen TI (2017) Surface modification of SiO2 coated ZnO nanoparticles for multifunctional cotton fabrics. J Colloid Interface Sci 498: 413-422. [crossref]
  16. Bozzi A, Yuranova T, Guasaquillo I, Laub D, Kiwi J (2005) Self-cleaning of modified cotton textiles by TiO2 at low temperatures under daylight irradiation. J PhotochemPhotobiol A Chem 174: 156-164.
  17. El-Naggar ME, Shaheen TI, Zaghloul S, El-Rafie MH, Hebeish A (2016) Antibacterial activities and uv protection of the in situ synthesized titanium oxide nanoparticles on cotton fabrics. IndEngChem Res 55: 2661-2668.
  18. Daniel MC, Astruc D (2004) Gold nanoparticles: assembly, supramolecular chemistry, quantum-size-related properties, and applications toward biology, catalysis, and nanotechnology. Chem Rev 104: 293-346.
  19. Saha K, Agasti SS, Kim C, Li X, Rotello VM (2012) Gold nanoparticles in chemical and biological sensing. Chem Rev 112: 2739-2779. [crossref]
  20. Komeily-Nia Z, Montazer M, Latifi M (2013) Synthesis of nano copper/nylon composite using ascorbic acid and CTAB. Colloids Surf A PhysicochemEng Asp 439: 167-175.
  21. Chen XQ, Liu YY, Lu HF, Yang HR, Zhou XA, Xin JH (2010) In-situ growth of silica nanoparticles on cellulose and application of hierarchical structure in biomimetic hydrophobicity. Cellulose 17: 1103-1113.
  22. Sadr FA, Montazer M (2014) In situ sonosynthesis of nano TiO2 on cotton fabric. UltrasonSonochem 21: 681-691. [crossref]
  23. Prasad V, Arputharaj A, Bharimalla AK, Patil PG, Vigneshwaran N (2016) Durable multifunctional finishing of cotton fabrics by in situ synthesis of nano-ZnO. Appl Surf Sci 390: 936-940.
  24. Tang B, Sun L, Kaur J, Yu Y, Wang X (2014) In-situ synthesis of gold nanoparticles for multifunctionalization of silk fabrics. Dyes Pigm 103: 183-190.
  25. Liu J et al (2016) Surface enhanced Raman scattering (SERS) fabrics for trace analysis. Appl Surf Sci 386: 296-302.
  26. Medina-Ramirez I, Gonzalez-Garcia M, Palakurthi S, Liu J (2012) Application of nanometals fabricated using green synthesis in cancer diagnosis and therapy. In: Kidwai M (ed) Green chemistry—environmentally benign approaches. InTech, Rijeka.
  27. Tang B et al (2015b) Functional application of noble metal nanoparticles in situ synthesized on ramie fibers. Nanoscale Res Lett. [crossref]
  28. Bastu´s NG, Comenge J, Puntes V (2011) Kinetically controlled seeded growth synthesis of citrate-stabilized gold nanoparticles of up to 200 nm: size focusing versus Ostwald ripening. Langmuir 27: 11098-11105. [crossref]
  29. Chakraborty A, Chakraborty S, Chaudhuri B, Bhattacharjee S (2016) Process engineering studies on gold nanoparticle formation via dynamic spectroscopic approach. Gold Bull 49: 75-85.
  30. Ji X, Song X, Li J, Bai Y, Yang W, Peng X (2007) Size control of gold nanocrystals in citrate reduction: the third role of citrate. J Am ChemSoc 129: 13939-13948. [crossref]
  31. Kimling J, Maier M, Okenve B, Kotaidis V, Ballot H, Plech A (2006) Turkevich method for gold nanoparticle synthesis revisited. J Phys Chem B 110: 15700-15707. [crossref]
  32. Yu Chang S-S, Lee C-L, Wang CRC (1997) Gold nanorods: electrochemical synthesis and optical properties. J Phys Chem B 101: 6661-6664.
  33. Zhang P, Li Y, Wang D, Xia H (2016) High-yield production of uniform gold nanoparticles with sizes from 31 to 577 nm via one-pot seeded growth and size-dependent SERS property. Part PartSystCharact 33: 924-932.
  34. Goia D, Matijevic´ E (1999) Tailoring the particle size of monodispersed colloidal gold. Colloids Surf A 146: 139-152.
  35. Wuithschick M et al (2015) Turkevich in new robes: key questions answered for the most common gold nanoparticle synthesis. ACS Nano 9: 7052-7071. [crossref]
  36. Edwards HGM, Farwell DW, Webster D (1997) FT Raman microscopy of untreated natural plant fibres. SpectrochimActaA 53: 2383-2392.
  37. Dong H, Hinestroza JP (2009) Metal nanoparticles on natural cellulose fibers: electrostatic assembly and in situ synthesis. ACS Appl Mater Interfaces 1: 797-803. [crossref]
  38. Montazer M, Alimohammadi F, Shamei A, Rahimi MK (2012) In situ synthesis of nano silver on cotton using Tollens’ reagent. CarbohydrPolym 87: 1706-1712.
  39. Pinto RJB, Marques P, Martins MA, Neto CP, Trindade T (2007) Electrostatic assembly and growth of gold nanoparticles in cellulosic fibres. J Colloid Interface Sci 312: 506-512. [crossref]
  40. Velleste R, Teugjas H, Valjamae P (2010) Reducing end-specific fluorescence labeled celluloses for cellulase mode of action. Cellulose 17: 125-138.
  41. Kumar A, Mandal S, Selvakannan PR, Pasricha R, Mandale AB, et al. (2003) Investigation into the interaction between surface-bound alkylamines and gold nanoparticles. Langmuir 19: 6277-6
  42. Corma A, Garcia H (2008) Supported gold nanoparticles as catalysts for organic reactions. ChemSoc Rev 37: 2096-2126. [crossref]
  43. Zhao Y, Huang YC, Zhu H, Zhu QQ, Xia YS (2016) Three-inone: sensing, self-assembly, and cascade catalysis of cyclodextrin modified gold nanoparticles. J Am ChemSoc 138: 16645-16654. [crossref]
  44. Herves P, Perez-Lorenzo M, Liz-Marzan LM, Dzubiella J, Lu Y, Ballauff M (2012) Catalysis by metallic nanoparticles in aqueous solution: model reactions. ChemSoc Rev 41: 5577-5587.[crossref]
  45. Barnes WL, Dereux A, Ebbesen TW (2003) Surface plasmon subwavelength optics. Nature 424: 824-830. [crossref]
  46. Liang M, Su R, Huang R, Qi W, Yu Y, et al. (2014) Facile in situ synthesis of silver nanoparticles on procyanidin-grafted eggshell membrane and their catalytic properties. ACS Appl Mater Interfaces 6: 4638-4649. [crossref]
  47. Tang B, Li JL, Fan LP, Wang XG (2015a) Facile synthesis of silver submicrospheres and their applications. RSC Adv 5: 98293-98298.
  48. Ai L, Yue H, Jiang J (2012) Environmentally friendly lightdriven synthesis of Ag nanoparticles in situ grown on magnetically separable biohydrogels as highly active and recyclable catalysts for 4-nitrophenol reduction. J Mater Chem 22: 23447-23453.
  49. Abdel-Fattah TM, Wixtrom A (2014) Catalytic reduction of 4-nitrophenol using gold nanoparticles supported on carbon nanotubes. ECS J Solid State SciTechnol 3: M18-M20.
  50. Panigrahi S et al (2007) Synthesis and size-selective catalysis by supported gold nanoparticles: study on heterogeneous and homogeneous catalytic process. J Phys Chem C 111: 4596-4605.
  51. Cui Y, Zhao Y, Tian Y, Zhang W, Lu X .et al (2012) The molecular mechanism of action of bactericidal gold nanoparticles on Escherichia coli. Biomaterials 33: 2327-2333. [crossref]
  52. Emam HE, El-Hawary NS, Ahmed HB (2017) Green technology for durabformation of AuNPs. Int J BiolMacromol 96: 697-705.
  53. Wadhwani P, Heidenreich N, Podeyn B, Burck J, Ulrich AS (2017) Antibiotic gold: tethering of antimicrobial peptides to gold nanoparticles maintains conformational flexibility of peptides and improves trypsin susceptibility. BiomaterSci 5: 817-827. [crossref]
  54. Edwards HGM, Farwell DW, Webster D (1997) FT Raman microscopy of untreated natural plant fibres. SpectrochimActaA 53: 2383-2392.
  55. Zorko M, Vasiljevic J, Tomsic B, Simoncic B, Gaberscek M, et al (2015) Cotton fiber hot spot in situ growth of Stober particles. Cellulose 22: 3597-3607.
  56. Fateixa S, Wilhelm M, Nogueira HIS, Trindade T (2016) SERS and Raman imaging as a new tool to monitor dyeing on textile fibres. J Raman Spectrosc 47: 1239-1246.
  57. Leona M, Lombardi JR (2007) Identification of berberine in ancient and historical textiles by surface-enhanced Raman scattering. J Raman Spectrosc 38: 853-858.
  58. Leona M, Stenger J, Ferloni E (2006) Application of surfaceenhanced Raman scattering techniques to the ultrasensitive identification of natural dyes in works of art. J Raman Spectrosc 37: 981-992.
  59. Meleiro PP, Garcia-Ruiz C (2016) Spectroscopic techniques for the forensic analysis of textile fibers. ApplSpectrosc Rev 51: 258-281.
  60. Zaffino C, Ngo HT, Register J, Bruni S, Vo-Dinh T (2016) ‘‘Dry-state’’ surface-enhanced Raman scattering (SERS): toward non-destructive analysis of dyes on textile fibers. Appl Phys A Mater Sci Process.
  61. Meleiro PP, Garcia-Ruiz C (2016) Spectroscopic techniques for the forensic analysis of textile fibers. ApplSpectrosc Rev 51: 258-281.

On the Modelling of Heat Conduction in Crystals via Higher-grade Terms

DOI: 10.31038/NAMS.2023632

Abstract

The paper investigates models expressed by equations with higher-grade spatial derivatives which are devised for describing transport phenomena in nanosystems. Particular attention is addressed to the Guyer-Krumhansl equation as a prototype of equations with higher-grade terms. First the thermodynamic consistency of the equation is investigated and conclusions are found for appropriate properties of the coefficients. Next a rather new approach is developed in that evolution equations are not given from the outset but are determined by applying a representation formula that makes the consequences of the second law directly operative. In this approach the free energy, the entropy flux, and the entropy production are considered as constitutive functions that eventually generate the desired evolution equation. Some equations derived in this way prove to be highly non-linear. The approach though leads also to simple models such as the one expressedby the well-known Maxwell-Cattaneo equation.

Keywords

Heat conduction in nanosystems, Higher-grade derivatives, Non-local equations, Guyer-Krumhansl equation

Introduction

In nanoscale systems the heat carrier mean free path may result comparable with the geometric dimensions. While equilibrium properties are well established within statistical mechanics [1], the order of dimensions explains why the literature shows a deep attention to heat transport equations of non-local character at the macroscopic level (see, e.g. [2-4]). Among the approaches involved in the derivation of macroscopic equations it is worth mentioning the recourse to the Boltzmann equation [5], phonon hydrodynamics models [6] or arguments within non-equilibrium thermodynamics [7]. The thermal properties of crystals at low temperatures is often modelled by the Guyer-Krumhansl equations for heat conduction [8]. For definiteness, in the uncoupled harmonic limit the equation for the heat flux reads

1

where the superposed dot is the time derivative and ∇ is the gradient operator. Within continuum physics, eq. (1) can be viewed as a rate equation for q where q˙ depends linearly on q itself, a source field r and the second-grade gradients ∇∇q. Owing to the derivation within the kinetic theory and the associated approximations, it is natural to inquire about the thermodynamic consistency within continuum physics. Further, we may look for generalizations suggested by the continuum context. For instance, we may view λ, ν, ζ as constants but even more generally as temperature dependent parameters. Thermodynamically the analysis of (1) is of interest within the so called rational thermodynamics [9] also because so far investigations have been mainly performed through other approaches (see, e.g., [10]). Further, we observe that, in general, the thermodynamic restrictions involve inner products and leave the transverse (orthogonal) parts of vectors or tensors fully undetermined. The application of an appropriate representation formula allows us to look for the general structure of thermodynamically-consistent constitutive equations.This paper has a twofold purpose. First, to examine the validity of the thermodynamic consistency of rate equations like (1) with temperature dependent coefficients. Secondly, to apply the representation formula for the rate q˙ so that a generalization is given of eq.(1) and higher-grade terms, compatible with thermodynamics, are determined.

Representation Formula

The body under consideration occupies the region Ω  in the three- dimensional space. Given an origin O, with any point of the body is associated a vector position x. We denote by ∇ = ∂x  the gradient operator. For any vector, say f , we define the norm |f | by |f | = (f · f )1/2. The symbol Skw denotes the set of skew-symmetric tensors.

Let w, f be two vectors. Letting 2 abve  we have

2 above

If w is subject to

w · f = g                                                   (2)

then

then kinda

If the transverse part w is undetermined then we can represent it in the form

thenkinda

where u is an arbitrary vector. Hence, in view of (2) we can represent w in the form

3

A number of applications of this representation formula, and of the analogous one for tensors, are developed in refs [11,12].

Thermodynamic Consistency of the Rate Equation

Let ε be the internal energy density,  per unit mass, and ρ the mass density. The assumption that the body is rigid makes ρa constant. The balance of energy can be written in the form

4

where q is the heat flux, r is the energy supply, and the superposed dot denotes the time derivative.

Let θ be the absolute temperature and η the entropy density. The balance of entropy is expressed by

4 kinda

where k is the extra-entropy flux and is the entropy production. Substitution of ρr – ∇.q from the balance of energy (4) and using the free energy

5

be the set of variables. We then assume   η , k, ϒ , q˙ are continuous functions of r and    continuously differentiable. Indeed we first let  q˙ be given by (1) and allow λ, ν,  ζ   depend on the temperature θ. Compute ψ and substitute in (5) to obtain

6

To avoid lengthy calculations we observe that replacing q˙ through (1) leads to

6 kinda

as far as the dependence on ∇∇θ and ∇∇∇θ is concerned. The arbitrariness  and symmetry of ∇∇θ and ∇∇∇θ imply before inthat , in that

123

and the like for before thought . Though not necessary we put

weput after

Thus it follows follows after . Moreover the arbitrariness of of after and and after implies

implies after

Hence eq. (6) simplifies to

which pina

which is a restriction on the functions and before and λ, ν, ζ For definiteness we let

789

and 9 after is  constant.  Hence hence after which is consistent with the condition condition after Incidentally, in stationary and uniform conditions conditions after, eq. (1) reduces to the Fourier form
form after

In light of the results (9) we infer

infer after

thus showing that the heat conductivity conductvity after is required to be positive. In addition, the entropy production is
and then

Since since after is the specific heat, we guarantee the condition by before by letting letting after

In summary, we have considered the rate equation for q, as given from the outset in the form (1), and have determined conditions for the thermodynamic admissibility. Instead, we now start with the Clausius-Duhem inequality (5) and look for possibly more general thermodynamically-consistent rate equations for q.

Generalized Rate Equations

Rate equations are now derived by appealing to the Clausius-Duhem inequality (5) and the representation formula (3). We continue to let let after be the set of variables and assume assume after Hence eq. (6) reads

F 1

Since  ψ, k, and ϒ are independent of and after  then the arbitrariness of implies again the classical relation

f 2

For definiteness we keep assuming

F 3

Hence it follows that

10

We then apply the representation formula (3) with the identifications

10 down

Hence the general representation of q˙ is

11

where u is an arbitrary vector-valued function of let after

Models with k = 0

If k = 0 then (11) simplifies to

12

If also u = 0 then we can write

12 (1)

In one-dimensional settings (x-direction) we have

12 (2)

More interestingly, let 12 let after Equation (12) becomes

12 (3)

The particular case 3p 1 results in

3p 2

that is the Maxwell-Cattaneo equation [13,14] with relaxation time 3p 3 and heat conductivity 3p 4

Models with K ≠ O

First we let u = 0 and observe that, by (11), 3p 5 in a non-linear form.

By analogy with eq. (1) we assume

3p 6

where 3p 7 is the second-order tensor with components 3p 8. Hence eq. (11) can be written in the form


3p 9

Notice that

AFTER notice 1

where the prime 0 means differentiation with respect to temperature.

Hence we obtain

after notice 2

If, rather, we let if 1 be constants then then after results in the addition of a term proportional to to after but also a term term after in the expression of q˙ . This shows the qualitative role of u in the formulation of constitutive equations. As an aside, observe that the flux flux after is given in [15]; here the whole value of k is established by (9) subject to the constancy of sigma

Conclusions

Models of nanosystems within continuum physics are often established by using highergrade spatial derivatives so as to account for the mean free path of particles comparable with the geometric dimensions. This paper addresses attention to the Guyer-Krumhansl equation (1) as a prototype of equations with higher-grade terms. Owing to the kinetic derivation of (1) it is natural to contrast the equation with the basic requirements of continuum physics. Here this is performed in relation to the thermodynamic consistency namely the compatibility with the second law via the Clausius-Duhem inequality. Definite conclusions are shown to follow if attention is confined to appropriate coefficients last constant along with the requirements (9)).

Next a rather new approach is developed in that evolution equations are determined by applying a representation formula that makes the consequences of the second law directly operative. In this approach we consider the free energy, the entropy flux, and the entropy production as constitutive functions that eventually generate the desired evolution equation. Some equations derived in this way prove to be highly non-linear.

It seems then that this way is profitable in establishing involved higher-grade equations within continuum physics. The approach though leads also to simple models such as the one expressed by the well-known Maxwell-Cattaneo equation.

Acknowledgments

The research leading to this work has been developed under the auspices of INDAM-GNFM.

References

  1. Kittel C (1956) Introduction to Solid State Physics, Wiley.
  2. Zhu CY, You W, Li ZY (2017) Nonlocal effects and slip heat flow in nanolayers. Sci Reports 7:9568.
  3. Dong Y, Cao BY, Guo ZY (2011) Generalized heat conduction laws based on thermomass theory and phonon J App Phys 110: 063504 (2011).
  4. Hennessy MG, Myers TG (2020) Guyer-Krumhansl heat conduction in thermoreflectance experiments, in Multidisciplinary Mathematical Modelling. Applications of Mathematics to the Real World, Font and T.G. Myers eds. Springer.
  5. Xu M, Li X (2012) The modeling of nanoscale heat conduction by Boltzmann transport equation. Int J Heat Mass Transf 55: 1905-1910.
  6. Alvarez FX, Jou D, Sellitto A (2009) Phonon hydrodynamics and phonon-boundary scattering in J Appl Phys 105: 014317.
  7. Lebon G (2014) Heat conduction at micro and nanoscales: a review through the prism of Extended Irreversible J Non-Equilib Thermodyn 39: 36-59.
  8. Guyer RA, Krumhansl JA (1966) Solution of the linearized phonon Boltzmann equation. Phys Rev 148: 766-778.
  9. Truesdell C (1969) Rational Thermodynamics, A Course of Lectures on Selected Topics, McGraw-Hill, New York.
  10. Sellitto A, Cimmelli VA, Jou D (2016) Mesoscopic Theories of Heat Transport in Nanosystems. Springer, New York.
  11. Morro A, Giorgi C (2023) Mathematical Modelling of Continuum Physics, Birchk¨auser, Cham.
  12. Morro A, Giorgi C (2023) Techniques for the thermodynamic consistency of constitutive equations. Thermo 3: 260-276.
  13. Straughan B (2011) Heat Waves, Springer, Berlin.
  14. Joseph DD, Preziosi L (1989) Heat Waves. Rev Mod Phys 61: 41-73.
  15. Cimmelli VA, Jou D, Ruggeri T, V´an P (2014) Entropy principle and recent results in non-equilibrium theories. Entropy 16: 1756-1807.

Collecting Evidence and Testimonies of Severe Human Rights Violations – The Importance of the Mind

DOI: 10.31038/AWHC.2023621

Abstract

Especially since the recent atrocities in Ukraine and Iran, but also in Syria and China, the close interaction between psychological recovery of survivors, and efforts to investigate and prosecute severe human rights violations has become an issue of concern. Investigations and the collection of evidence, especially witness statements, are conducted by national and international authorities, including international courts, but also by NGOs and journalists. While preservation of evidence, that should be guided by the relevant UN/WMA standard, the “Istanbul Protocol” and witness statements, are an important and necessary part of such investigations, the protection of already psychologically distressed or even traumatized victims against suffering and traumatizing interviews or re-traumatization has become a concern in international, such as EU, standards, and is also mentioned in the Istanbul Protocol as reference standard, but without giving sufficient concrete guidance. Mental health is an important part in this process, as outlined in this article. An interdisciplinary working group of the World Psychiatric Association Scientific Section on Psychological Consequences of Persecution and Torture has developed and tested a new standard protocol that is recommended to be used when interviewing survivors of extreme human rights violations to address this concerns, especially in the context of the important global efforts to involve direct and indirect victims such as family members in collecting evidence as important first step in identifying, documenting, investigating and prosecuting such crimes.

Keywords

Human rights, Torture, Genocide, War, Therapeutic justice, Psychology, Victims


Human rights violations, and especially those usual described as “extreme violations” such as torture, war crimes, or genocidal actions, are not only destructive to societies, but also have been demonstrated to have severe, often lifelong impact on the mental health of individuals and communities, including transgenerational trauma transmission [1] and epigenetic sequels [2-4]. They must be seen as the probably at present most severe challenges to public mental health [5,6]. New and usually interdisciplinary strategies and interventions targeting not only individuals but communities and societies at large, might have to be developed and implemented, usually in the context of the general mental health and psychosocial services (MHPSS) approach [7,8] recommended by the UN and WHO. In spite of the development of a number of international legal and humanitarian treaty systems and instruments in humanitarian and human rights law, and of monitoring institutions such as the office of the UN High Commissioner for Human Rights, of International Criminal courts, and of offices of the UN special rapporteurs on subjects like torture, on the rights of women and children, and on genocide, the impunity of perpetrators is still a major challenge so far not sufficiently addressed in an effective way in national or international courts, except in a few exceptional cases. This means not only that the risk of future violations by the same or other perpetrators or countries must be expected to increase, but also that the suffering of victims will continue or even increase [9,10]. New strategies like the application of the legal principle of Universal Jurisdiction [11], that permits countries to prosecute, arrest and put on trial perpetrators of such extreme violations like torture or other crimes under international law, have been implemented in countries such as Germany, Austria, and France, yielding first results and conviction of some perpetrators. This must be seen as an important tool in the unfortunately common situation, that an efficient investigation and fair legal process is not possible in the country of origin of the victims who are escaping to safer third countries such as EU countries or the United States. Evidence is a strong element necessary in this process [12].

One of the key areas identified in this context, is that of an interdisciplinary approach in the collection of evidence and in the psychological support off survivors and witnesses, who must be expected to suffer by re confrontation with highly traumatic memories during witness statements, medical examination [13], and during the court hearings.

Medical evidence, including especially also psychological evidence, can play an important role in this context, and international standards such as the Minnesota protocol [14] and the recently updated Istanbul protocol (Manual on Effective Investigation and Documentation of Torture and Other Cruel, Inhuman or Degrading Treatment or Punishment) [15,16] have been developed and are supported by the United Nations and other international bodies and organisations to ensure proper procedures in examining victims and survivors. The Istanbul protocol also underlines the importance of protecting survivors during examination and during and after the witnessing and investigation process against undue distress and secondary victimisation or re-traumatization by the necessary legal interventions. In a similar way, standards by the European Union (mostly framework directives influencing the legal process in all EU countries), such as the reception guidelines for refugees or the “minimum standards on the rights, support and protection of victims of crime”, have initiated a paradigm shift to underline the importance of such psychological support and protection against secondary trauma in the necessary legal procedures besides legal recommendations.

The EU … states in article 9 of the “crime victims” directive that:

“victims of crime should be protected from secondary and repeat victimisation, from intimidation and from retaliation, should receive appropriate support to facilitate their recovery and should be provided with sufficient access to justice”.

In this context, a number of projects have demonstrated, that giving testimony about human rights violations in an adequate setting can be as or even more important than established medical treatment models or that giving testimony can improve their impact. A probably first example was the “testimony therapy” approach developed in Latin America [17,18] when a legal fight against impunity was impossible during total social control by local dictatorships. Creating a testimony or witness statement against perpetrators of torture by survivors became a key element of this special form of psychotherapy and has inspired also other new treatment approaches [19]. This is an insight that is also used on the level of communities and societies as part of a transitional justice process, for example in so-called truth and reconciliation commissions in South Africa or Rwanda [20-23], though results appear to be not always satisfactory. The discussion compares here the concepts of “restorative” vs. “punitive” justice, but in any case, impunity of perpetrators must be seen as a major challenge to survivors’ psychological health and wellbeing in whatever setting [9]. The EU Network for investigation and prosecution of genocide, crimes against humanity and war crimes (The Genocide Network), Eurojust and the Office of the Prosecutor of the International Criminal Court published on 21 September 2023 guidelines for civil society organisations, which seek to collect and preserve information to contribute to investigations and prosecutions at national level or before the ICC on “Documenting international crimes and human rights violations for accountability purposes”.

A necessary conclusion in this context is, that giving witness statements and evidence for example in proper medical examination and court testimony can be an important part of recovery and healing for survivors and witnesses [21], in addition to supporting the legal process.

Unfortunately, neither the before mentioned standard examination protocols, nor the support of survivors of extreme violence are sufficiently covered by most medical curricula.

The interdisciplinary team of the World Psychiatric Association Scientific Section on Psychological Consequences of Persecution and Torture have therefore developed a training programme and protocol to improve the psychological aspects of evidence collection and to protect witnesses and survivors during the legal process or investigation.

The protocol was applied, tested, and modified as part of a project supported by the UN Voluntary Fund for the Victims of Torture, with survivors of human rights violations from Syria and to Ukraine, in collaboration with legal NGOs active in this process and with the WPA section since 2018.

We developed a protocol focusing on the specific steps of the medical accompaniment and required psycho-social support in the context of collecting evidence and testimonies of international crimes and severe human rights violations based on our work experiences and research. In the following part of this article, we want to present this protocol for discussion and dissemination in the international medical and legal communities, considering especially the possible use in the recently started process of universal jurisdiction, International Criminal courts and the collection of evidence for example in Syria and the Ukraine. The protocol also underlines and is referring to the afore- mentioned Istanbul protocol of the United Nations and the World Medical Association, [15,16,24] and is to be seen as supporting, and not replacing this important standard, focusing on the psychological and mental health aspects of examination, witnessing and witness support.

This last aspect is important, but often neglected in forensic settings in the interaction with survivors and witnesses, who can be seen also as indirect victims, probably due to the historical focus of the forensic sciences either on the bodies, or in forensic mental health on evaluation of perpetrators, or on the evaluation of competence.

We see a psychological and/or psychiatric examination as an integral and important part of the above legal process, keeping in mind that this has to consider the stigma against mental health and the possible distress by survivors during re confrontation with traumatic memories, as also culture specific issues such as cultural idioms of distress, that can be part of the evidence [25-27]. We have summarized the key points on the importance of mental health assessment in Table 1.

Table 1: Summary: Relevance of mental health in the examination of witnesses of crimes

tab 1

Guideline and Protocol

The WPA section therefore recommends the following steps:

(Note: For the following process, we recommend an interdisciplinary approach, and installation of a well experienced and trained team)

  1. Preparation of the case. All evidence available should be collected, and translated by lawyers, and for medical findings by the medical team (Medteam). The Medteam will analyse medical data to identify issues as mentioned in attachment I (note: here: Table 1) and familiarize team members with history and experience of the survivor/witness, in order to better prepare for testimony and examination and avoid repetition of details in the examination, to consult with experts knowledgeable of the situation and of transcultural issues, to identify experts or translators to be added to the process. The team leaders will offer legal and psychological training of the legal and medical team, including in the Istanbul Protocol.
  2. Preparatory contact with witness, to present the team, build trust and confidence and the approach in the protocol, identify further issues as in table/attachment, agree on procedures with client, reduce stigma anxiety, provide support to locate and bring medical and other documentation, answer questions in regard to treatment and legal framework
  3. Conduct “Welcome” meeting with support team on arrival for court hearing, psychological preparation and further rapport and trust building, if necessary or adequate in the process, medical or diagnostic interventions.
  4. Offer support during hearings by legal, medical and psychological team members, and if necessary, organize immediate crisis intervention and medical treatment, including interventions to reduce distress. If required they will also provide advice or specific expertise to the court.
  5. Debriefing and measures for stress reduction and relieve immediately after testimony will be offered
  6. Follow up support including psychosocial support (following the Interagency Standing Committee (IASC) mental health and psychosocial services (MHPSS) model [28,29], provision or organization of medical support, and of further expertise as required by court, team or survivor/witness, including contact with local specialized service institutions.

Summary

Providing for mental health aspects in interacting with witnesses of human rights violations is important not only for supporting evidence collection and aiding investigation and prosecution by lawyers, but also addresses the necessary protection of often psychologically severely traumatized, vulnerable and suffering survivors and witnesses. The guideline/protocol offers concrete advice in protecting witnesses during necessary interviews and examinations, as outlined by the UN Istanbul Protocol. This approach has become even more important in the context of present wide spread violations of international humanitarian and human rights laws in Ukraine, Syria and other countries.

References

  1. Kizilhan JI, Noll-Hussong M, Wenzel T (2021) Transgenerational Transmission of Trauma across Three Generations of Alevi Kurds. Int J Environ Res Public Health 19. [crossref]
  2. Kellermann NP (2013) Epigenetic transmission of Holocaust trauma: can nightmares be inherited? Isr J Psychiatry Relat Sci 50: 33-39. [crossref]
  3. Vukojevic V, Kolassa IT, Fastenrath M, Gschwind L, Spalek K, et al. (2014) Epigenetic modification of the glucocorticoid receptor gene is linked to traumatic memory and post-traumatic stress disorder risk in genocide survivors. J Neurosci 34: 10274-10284. [crossref]
  4. Yehuda R, Daskalakis NP, Lehrner A, Desarnaud F, Bader HN, et al. (2014) Influences of maternal and paternal PTSD on epigenetic regulation of the glucocorticoid receptor gene in Holocaust survivor offspring. Am J Psychiatry 171: 872-880. [crossref]
  5. Wenzel T, Kienzler H, Wollmann A (2015) Facing Violence – A Global Challenge. Psychiatr Clin North Am 38: 529-542. [crossref]
  6. Wenzel T, Schouler-Ocak M, Stompe T (2021) Editorial: Long Term Impact of War, Civil War and Persecution in Civilian Populations. Front Psychiatry 12: 733493. [crossref]
  7. Duckers M, van Hoof W, Willems A, Te Brake H (2022) Appraising Evidence-Based Mental Health and Psychosocial Support (MHPSS) Guidelines-PART II: A Content Analysis with Implications for Disaster Risk Reduction. Int J Environ Res Public Health 19. [crossref]
  8. Te Brake H, Willems A, Steen C, Duckers M (2022) Appraising Evidence-Based Mental Health and Psychosocial Support (MHPSS) Guidelines-PART I: A Systematic Review on Methodological Quality Using AGREE-HS. Int J Environ Res Public Health 19. [crossref]
  9. Williams S (1999) Violence against women. Ending impunity for sexual violence. Links (Oxford) 1-2. [crossref]
  10. Zawati HM (2007) Impunity or immunity: wartime male rape and sexual torture as a crime against humanity. Torture 17: 27-47. [crossref]
  11. Macedo S (2004) Universal jurisdiction: national courts and the prosecution of serious crimes under international law. University of Pennsylvania Press.
  12. Gallagher K (2009) Universal Jurisdiction in Practice: Efforts to Hold Donald Rumsfeld and Other High-level United States Officials Accountable for Torture. Journal of International Criminal Justice 7: 1087-1116.
  13. Bruin Re, Reneman M, Bloemen E (2006) Care full: medico-legal reports and the Istanbul Protocol in asylum procedures. Pharos.
  14. Keten A (2020) Minnesota Autopsy Protocol. J Forensic Leg Med 72: 101944.
  15. Iacopino V, Haar RJ, Heisler M, Lin J, Fincanci SK, et al. (2022) Istanbul Protocol 2022 empowers health professionals to end torture. Lancet 400: 143-145. [crossref]
  16. Koseoglu Z (2022) Launch of the revised version on the Istanbul Protocol. Torture 32: 89. [crossref]
  17. Pakman M (2004) The epistemology of witnessing: memory, testimony, and ethics in family therapy. Fam Process 43: 265-274. [crossref]
  18. van Dijk JA, Schoutrop MJ, Spinhoven P (2003) Testimony therapy: treatment method for traumatized victims of organized violence. Am J Psychother 57: 361-373. [crossref]
  19. Kizilhan JI, Neumann J (2020) The Significance of Justice in the Psychotherapeutic Treatment of Traumatized People After War and Crises. Front Psychiatry 11: 540. [crossref]
  20. Kaminer D, Stein DJ, Mbanga I, Zungu-Dirwayi N (2001) The Truth and Reconciliation Commission in South Africa: relation to psychiatric status and forgiveness among survivors of human rights abuses. Br J Psychiatry 178: 373-377. [crossref]
  21. Stein DJ, Seedat S, Kaminer D, Moomal H, Herman A, et al. (2008) The impact of the Truth and Reconciliation Commission on psychological distress and forgiveness in South Africa. Soc Psychiatry Psychiatr Epidemiol 43: 462-468. [crossref]
  22. Swartz L, Drennan G (2000) The cultural construction of healing in the Truth and Reconciliation Commission: implications for mental health practice. Ethn Health 5: 205-213. [crossref]
  23. Taylor L (2022) Colombia’s truth commission reveals the devastating health impact of half a century of conflict. BMJ 378: o2023. [crossref]
  24. Keten A, Nicolakis J, Abaci R, Lale A (2022) An Evaluation within the Context of the Istanbul Protocol of the Medico-Legal Examinations of Turkish Detainees during the Recent State of Emergency in Turkey. J Law Med 29: 254-259. [crossref]
  25. Cork C, Kaiser BN, White RG (2019) The integration of idioms of distress into mental health assessments and interventions: a systematic review. Glob Ment Health (Camb) 6: e7. [crossref]
  26. Jacob KS (2019) Idioms of distress, mental symptoms, syndromes, disorders and transdiagnostic approaches. Asian J Psychiatr 46: 7-8. [crossref]
  27. Kaiser BN, Jo Weaver L (2019) Culture-bound syndromes, idioms of distress, and cultural concepts of distress: New directions for an old concept in psychological anthropology. Transcult Psychiatry 56: 589-598. [crossref]
  28. Marshall C (2022) The inter-agency standing committee (IASC) guidelines on mental health and psychosocial support (MHPSS) in emergency settings: a critique. Int Rev Psychiatry 34: 604-612. [crossref]
  29. O’Callaghan P (2014) Case study: ten lessons learned while carrying out a MHPSS intervention with war-affected children in the Democratic Republic of Congo in 2011. Int J Emerg Ment Health 16: 241-245. [crossref]

Developer Goals for e-Commerce Startups: Applying AI-enhanced Mind Genomics to Thinking about Everyday Issues

DOI: 10.31038/PSYJ.2023553

Abstract

Mind Genomics explored responses for an e-commerce website, focusing on a website with ‘deep knowledge’ of the user’s preferences. To understand the application of Mind Genomics in a real-world setting, the timing of the setup and the fielding were limited to a total of 120 minutes. The data were collected in Spring, 2019. Four years later, newly developed AI analysis further interpreted the results. The initial analysis in 2019 deconstructed the ratings assigned by the respondents to vignettes, combinations of messages, describing the website. The respondents used an anchored 5-point scale, with the anchors ‘buy’ and ‘not buy’, respectively. The deconstruction by OLS regression revealed the contribution of each element to the ‘buy’ rating. Clustering the 46 respondents using the 16 coefficients uncovered three Mind-Sets: MS1-Help the client grow, MS2-Client Consulting, and MS3-Generate Leads. Four years later AI was applied to each group in the population, using six standard AI queries applied to all positive elements which were deemed to be strong drivers of ‘buy.’ This paper shows the possibility of rapid and insightful learning on new topics. Learning is promoted through experimental design coupled with human validation, and AI interpretation.

Introduction

The computer, the Internet, the Internet of Things, and the focus on real-time optimization continue to empower our modern age. You can’t go a single day without encountering a constant stream of ads and requests to buy. These advertisements often feature items that have already been purchased or viewed, as well as items left in a shopping cart. They are based on microsecond analyses of the shopping behavior of consumers. The analytic abilities are now so powerful that big data looks antiquated when compared to the small data generated constantly.

This paper explores what could be considered an important issue, the need to improve the flow of information between the customer and the online retailer. Online retailers function best with a large amount of data about their customers.

For roughly a decade, brands and retailers have been promoting their strategies for being “consumer centric” This means that they want to put the customer at the heart of all the work they do. In effect, this puts the consumer into the driver’s seat, with consumers ‘telling the brands’ what brand experience to create for them. When it comes to analyzing consumer behavior and preferences, retail analysts are tasked with interpreting data from consumers – such as sales figures, consumer trends and satisfaction ratings to develop insights for managing the retail enterprise profitably.

Retailers, the brands they carry, and internet service providers are increasingly criticized by privacy advocates and regulators for using data collected from consumers to develop detailed profiles on each one to tailor the commercial experience and to precisely target their messages. In response, most data collectors now offer opt-out methods to limit the data collection, its uses, and sharing with third parties, but doing so is not obvious. There is a widespread growing belief or, at the very least, a loudly expressed recognition, that data created by an individual belongs to them and should be controlled by them, similar to the requirements set forth in the EU’s 2018 General Data Protection Regulation [1].

Our world is inundated with data. As the speed and volume of data increase, our ability to form scientific questions, track trends, or subject the rapid pace of life to scientific inquiry is lost. Amidst massive amounts of data and massive optimization opportunities, it becomes increasingly hard to ‘think slow’.

We are accustomed to the slow, majestic, ingrained, now entrenched system of hypothetico-deductive reasoning [2]. It is a basic concept that scientists, or even individuals, can ‘advance,’ when they form a hypothesis and test it rigorously, trying to falsify the hypothesis. As technology speeds up the production of data and its acquisition, it is also necessary to accelerate knowledge and thought. In the harder sciences like biology and chemistry it may take exceptional creativity to produce knowledge, but in the human-centered sciences this may not be a major problem. With the advancements in computer technology, some paradigm shifts may already be possible [3].

Recurring Issues in the World of More Knowledgeable Websites

With the increasing excitement and, occasionally, almost manic positive responses about websites ‘knowing people’ comes the issue of privacy at the most obvious, but more deeply the morality of machines which have been programmed to learn about people The topic of this paper is the desire of respondents for websites (viz., provider technology) to ‘know them’, or perhaps the opposite, the fear that the machine may know too much, and the consequent loss of privacy. Some of this issue is one’s own desire for privacy, but some of it is the ‘morality’ of machine knowledge about facts relevant to individuals, and the implications of the wide availability of such knowledge. The issue is not ‘all or not’ either, for with knowledge by websites of people comes the smoother operation of interactions, the reduction of annoying, and occasionally harmful friction.

Mind Genomics: The Promise and Vision for the Future

Mind Genomics is a new, emerging science which traces back to three disciplines [4-8]. These are:

  1. Experimental psychology which searches for the causes of human behavior. The specific area of experimental psychology giving rise to Mind Genomics is psychophysics, the discipline which searches for lawful patterns in between what is presented and what we perceive For Mind Genomics that relation is between the words describing a situation and the judgment we say we would make.
  2. Statistics, The respondent reads combinations of elements, messages, describing this ordinary situation, and rates the feeling on a scale provided by the researcher.
  3. Consumer research, which examines how consumers make decisions in everyday life, in which we live, work, succeed or fail. The goal is not to develop a new theory or to disprove an existing one, though these noble endeavors are possible. The only goal is to make sense of these patterns.

It is important now to keep in mind that the effort is more in the world of ‘hypothesis-generating’ than in the world of ‘hypothesis-testing.’ Quite often researchers really have no hypotheses to test but are constrained to do the study as if it were guided by a hypothesis. Mind Genomics does not care about that. It is simply a tool to discover patterns that may be interesting regarding how people think.

The process of Mind Genomics is a simple one, beginning with the question of what do people do about the information they receive as they are instructed to make a decision? Typically, the respondent is presented with the situation, using a simple story, even a single sentence. It is the goal to find regularities and relations within nature. Such discoveries generate the raw material for understanding how people think. When these discoveries are amalgamated from well-done experiments and when they reach critical mass, they form a coherent database, and in turn these coherent databases become the foundation of technology and science.

This study forms part of a new initiative in Mind Genomics which aims to massively accelerate the acquisition of information and insights for everyday life, including topics such as subjective feelings toward e-retailing, including ‘smart websites.’Another motivation is to show, through a research program integrating artificial intelligence and systematized human testing, if the two can be used to reveal aspects of everyday life or even weak signals about changing attitudes.

This study was done in 2019 before the massive expansion of AI into the world of everyday consumer research analytics. The original study was done without any focus on what AI could add to the research effort, but rather focused on what people would want for a system in which they would give up their privacy. The actual data analysis reflects what people were thinking in 2019. The subsequent AI analysis, in turn, was done in the third week, of May 2024, with a view to what the data might mean for a business issue.

The project itself in each phase ran on an accelerated schedule. For the first part of the project, the actual research, the total time involved was less than three hours from start of the project (create the experiment) to the acquisition of analyzed data. For the second part of the project, the AI analysis of the results obtain four years before, the analysis took 30 minutes, consisting of an automated AI-driven reanalysis of the data tables The actual study itself with people came shortly after the first experience integrating AI and Mind Genomic by hand, with AI providing the raw information first, that information transformed into the test stimuli [9]. The effort presented here moves the process in the opposite direction, with AI providing a second, deep analysis of results already obtained.

The First Part of the Project – The Creation and Execution of the Survey with the Respondents

Mind Genomics is now scripted. It follows a templated process which reduces the “angst” of doing experiments as well as the time and effort required to collect data. Experience over a half century has shown that individuals are anxious when asked to “do science.

Mind Genomics scripts are designed to make sure that researchers can present the information in the correct format. In the actual experiment, relevant messages about a subject (called “elements”) are combined into short, easily readable vignettes. A vignette consists of 2-4 messages. People then rate the combinations using a scale. Each respondent ends up rating 24 different vignettes. The vignettes are different for each respondent, but all the elements remain the same [10].

Mind Genomics’ studies have been scripted to allow them to be run on a computer, smartphone, or tablet, with results available in a very short time. The information in Table comes from the study, text taken from the actual input by the researcher, and put together in the report to document the study. The information in Table 1 is available within five minutes after the end of the study, as is the basic analysis. The AI summarization requires an extra 20-30 minutes after the end of the field work. (Table 1)

Table 1: Key information about the study provided by the Excel report.

TAB 1

The setup begins with naming the study and the instructions to provide four questions relevant to the topic of study. Researchers are asked to structure four questions in a way that they “tell a story,” and then provide four answers to each question. Figure 1 shows the template. In 2019, it took several hours to create the four questions for each question and four answers.

FIG 1

Figure 1: The templated request of four questions (left panel) and four answers as used by respondent to manually provide questions and answers.

Since Mind Genomics became available to the public more than 10 years ago as a DIY (do it yourself) technology, there have been many instances where researchers felt overwhelmed with the task of creating the elements.

It is now possible to use artificial intelligence to generate questions. The researcher only needs to write a paragraph into the Idea Coach box in the Mind Genomics template and the AI will return 30 different questions. The Idea Coach technology, which was launched in 2022, was three years after this study was conducted.

Figure 2 shows three additional set up screen shots from BimiLeap. These include the orientation page (left panel), the rating scale (middle panel), and the researcher’s file information about the rationale for the experiment as well as key words for a later search (right panel).

FIG 2

Figure 2: Three setup screen shots for BimiLeap. These are the orientation page (left panel), the rating scale (middle panel) and the file information (right panel).

The researcher can select the respondents’ source using the screen in Figure 3 following the study’s launch. This is done quickly within the BimiLeap software. Respondents are ‘sourced from’ a panel provider that specializes in online surveys. There are a number of panel providers around the world. These panel providers maintain lists of respondents with their qualifications. They are individuals who have agreed, in exchange for a reward from the supplier, to take part in similar studies. The researcher does not need to know about the agreement. The panel provider only needs to find the right respondent.

FIG 3

Figure 3: Sources of respondents selected by the researcher at the end of the project.

Mind Genomics research can include elements (questions, answers, etc.) in many different languages and alphabets. However, the instructions on how to set up the study as it is done by the researchers are only available in a limited number of languages.

The actual experiment with the subject lasted about 3 minutes. The experiment starts with a brief orientation. The respondent then answers a few self-profiling questionnaires (Figure 4, bottom panel). Finally, the BimiLeap program presents 24 different vignettes that have been systematically created. The vignettes contain 2-4 elements, at most one answer to a single question but often no answer to one or two of the questions (see Figure 4, top panel).. It will be this very incompleteness of the combinations which allows the analysis by OLS (ordinary least-squares), and the estimate of absolute values for the coefficients.

FIG 4

Figure 4: Sample four-element vignette (top), and self-profiling classification (bottom).

The experimental design allows for the analysis of each individual’s ratings, respondent by respondent, as well as analysis of groups comprised of any set of 46 respondents who participate in this study. The vignettes have been set up in a way that each person evaluates 24 unique vignettes. This design structure allows the researcher to explore different aspects of a problem without having to select which combination of elements gives the best chance for discovery.

Database Structure, Analysis, and Reports – Total Panel

It is easy to analyze the data because the experiment design has been preselected in a way that all the 24 combinations of different sets are isomorphs. The vignettes are different, but the mathematical structure is identical. The researcher will have a powerful analytical tool that allows them to explore a large part of the “design space” (the combinations). More respondents, and therefore more people, means that more design space will be covered.

A simple database makes it possible to perform the analysis. The database is divided into 24 rows, each of which corresponds with one of the vignettes that a respondent has tested. The database for the study contains 1104 rows, or 46×24, of data. Each respondent contributes 24 rows to the database, one row for each of the 24 vignettes evaluated by that respondent. The Columns are allocated for bookkeeping (row number, how the respondent profiles herself or himself), a column for the order of rating of the 24 vignettes (1-24), then 16 columns to show absence or presence (value 0 or 1) of an element, and finally the assigned rating and the response time. The response time is the number of seconds between the appearance of a vignette and the answer.

The program then creates two binary variables: TOP (ratings 5, 4 transformed into 100) and BOT (ratings 1, 2 and 4 transformed into 100). BimiLeap adds a vanishingly small number of random numbers for each BOT or TOP value to create needed This prophylactic measure ensures the required variability, even if the respondent rates all the vignettes as either 5 or 4 (all transformed TOP become 100) or 1 or 2 (all transformed BOT become 100).

Table 2 shows the parameters of the equation, expressed as: TOP = k0 + k1A1 + k2A2 .. k16D4 . This equation can be estimated accurately because the OLS regression does not have any correlation issues between variables. The coefficients emerging from the OLS are absolute values, so a 5 has half of the value as a 10 It is crucial to understand this necessary property, which allows Mind Genomics to create a science. The researcher can quickly grasp the dynamics in the data revealed by the experiment when the coefficients show the real magnitude of the effects.

Table 2: Elements for the Total Panel which drive TOP (Sounds interesting). Only elements with coefficients > 1 are shown.

TAB 2

As a side note, this vision of absolute coefficients is often counter-intuitive to ‘experts’ who believe that the respondent needs all the information from the different questions to make a decision. Admirable as that point of view is, which ends up presenting complete vignettes to each respondent, the results data is almost impossible to understand, because the absolute coefficients have no meaning. It is only differences which have meaning. There is no possibility of databasing the results unless the entire study is replicated. Only then do the coefficients have meaning.

Table 2 shows the results from the Total Panel, of 46 respondents, each rating a unique set of 24 vignettes. The Table shows us places for the 16 coefficients, along with the additive constant.

This constant indicates the likelihood of respondents saying ‘buy’ in the absence of any element in the vignette. The vignettes are all designed with a minimum of two and maximum four elements. The additive constant can be thought of as a statistical correction factor. On the other hand, we can use this as a base, or a tendency for respondents to respond “buy”. This will help us gain this insight. Table 2 indicates that 45% of the responses will be 5 or 5, when they know what the system is, even when there are no specific elements to qualify the product. We could have measured this change over the years if we had done the same type of experiment.

In the interests of revealing patterns, the convention in this paper and others is to show only positive coefficients of value 2 or higher. Coefficients of 1, 0 and negative are of no interest. The low coefficients indicate that an element’s presence in a vignette “doesn’t add”. This does not necessarily mean the element detracts or is insignificant.

Eight out of 16 elements have coefficients greater than 1. All the rest generate coefficients that are 0 or negative. . However, only one element is really successful, “create amazing ads” with a coefficient of 6. Subgroups are likely to be hiding strong performers, as we shall soon see.

We now move to the AI interpretation of these results from the total panel. AI analysis should only be viewed as a set of tentative observations by a heuristic. AI can provide a quick answer before taking the time to analyze the entire dataset. The BimiLeap report has been upgraded to provide AI responses to the following six queries, using the coefficients for the key subgroup being summarized.

The following are the six queries.

Interested in

Create a label for this segment:

Describe this segment:

Describe the attractiveness of this segment as a target audience:

Explain why this segment might not be attractive as a target audience

Which messages will interest this segment

These queries primarily consider moderate or high performing elements with coefficients greater than +5. The elements with coefficients below 4 are considered, but not relied upon.

The AI summarization of the data, based on the six queries appears in Table 3.

Table 3: AI first scan and interpretation of the strong performing elements for the Total Panel.

TAB 3

Results from Self-profiling Questionnaire

The BimiLeap program instructed respondents to put themselves into one of four groups, based upon how they feel about an outside website having deep knowledge of oneself. Table 4 shows the pattern of coefficients generated by the two polar opposite groups, the first very excited and positive about the situation, the second bothered. As one might expect, the additive constants are higher for the positive group, and much lower for the negative group. Furthermore, there are more strong-performing elements in the positive group. Table 4 shows the coefficients of the elements. Table 5 shows the AI analysis of the patterns.

Table 4: Elements which drive TOP (Buy) for the two key segments emerging from the self-profiling question: How important is it that the website know my mind to give me offers?

TAB 4(1)

TAB 4(2)

TAB 4(3)

Table 5: Elements which drive TOP (Buy) for the three Mind-Sets, emerging from k-means clustering of all the element coefficients from the 46 respondents.

TAB 5

Dividing Respondents According to Mind-Sets Using the Coefficients

The final analysis of the data will be focused on creating Mind-Sets. These are groups of respondents that have been created by using the K-means Clustering Program based upon the similarity of the patterns made by their coefficients. We use the 16 coefficients whether they are positive or negative for clustering. The additive constant is not used in clustering [11].

BimiLeap. It generates two Mind-Sets at first, then three Mind-Sets. The Mind-Sets encompass all respondents. A person belongs to only one mind-set for the two mind-set solution, and again to only one mind-set for the three mind-set solution. The clustering results in meaningful groups that can be interpreted, despite the fact that the process is mechanical and mathematical.

Table 6 lists the elements that make up the successful performance of the Three-Mind-Solution. In order to save space, the two-mind solution is not included. The AI results are shown in Table 7, emerging after applying the six AI queries to the Mind-Sets.

Table 6: AI interpretation of the strong performing elements) by AI for the three-Mind-Set solution.

TAB 6(1)

TAB 6(2)

TAB 6(3)

Table 7: The IDT, Index of Diverged Thought, showing the performance of the elements, and thus the strength of the thinking behind the specific Mind Genomics study.

TAB 7

Understanding Performance Using an Index Number (IDT, Index of Divergent Thought)

Researchers in many fields ask the same question: “How did we perform?” With Mind Genomics and AI still at an early stage, but available worldwide at the touch of a button, it becomes a matter of whether the research produced anything valuable. It is important to note that the notion of “value” does not refer to personal worth of data for the researcher or to reproducibility of science. Instead, for Mind Genomics we ask whether or not the study produced any high-performing elements. When we find strong elements, there’s a link between the element and rating questions. In these studies, the researchers are looking for this link. In those elements, the issue at hand can be better understood.

We present IDT Index of Divergent Thought as part of our effort to “systematize” the use of Mind Genomics, in an era of simple-to-use AI-powered techniques. IDT’s objective is to determine the effect of elements. IDT produces a simple, indexed result. This is shown in Table 8. When we divide the study into six groups, each sum of positive coefficients for that group is weighted by the relative number of respondents for that group. The six groups are Total, Mind-Sets 1 & 2 for the 2-Mind-Set solution, and Mind Sets 1, 2, & 3 for the 3-Mind-Set solution. The IDT is the weighted sum of positive coefficients. The weight is the ratio between the respondents per group and the total of 138.

The IDT by itself is simply an index number about how well the elements performed. With continuing use of the IDT as a metric, it may become possible to measure the degree to which a person grows in the ability to think creatively. One could imagine charting the IDT value for a person or group of people as they are challenged to think through various problems. The IDT gives us a way of measuring the ‘strength’ of alternative efforts to deal with the same issue, with different issues, after teaching interventions, and so forth. The alternatives may be the same researcher over time, the performance of studies done by individuals vs. those done by collaborating groups, and so forth. The IDT is objective, a simple index quickly calculated as part of the report to the researcher.

Discussion and Conclusions

The Mind Genomics method has been used to investigate the decision-making process for the world of the ‘everyday.’ Rather than focusing on topics of deep significance and with a long history of investigation, the researcher using Mind Genomics investigates simpler problems, such as what does a person want from a website which ‘knows’ the user. It is within that world view that the current study was done.

What emerges from Mind Genomics is far more than a simple snapshot of human decision making at the level of the concrete issue. One can sense from the use of commonplace features as elements that behind these everyday statements lay an entire universe of motivations, a universe that might totally disappear or at least lose its vitality if the statement were couched in the general, rather than in the specific. It is the richness in the meaning of everyday experience which provides deep learning. In other words, Mind Genomics provides emotion-rich, philosophically rich metaphors that ordinary, academic language cannot.

Armed with that point of view the paper no longer talks only about websites which know the person. Rather, the paper talks to the issue of emotional responses to different ways of weighting information to decide. different ways of responding to recommendations from a ‘machine’ and the concern with the nature and trustworthiness of machines which know the person. The issues lose a bit in the translation when they are stated in the form of generalities, but create immediate, palpable internal sensations when they are described by daily, identifiable events, viz., by realistic metaphors.

Beyond the actual data from the Mind Genomics exercise, however, lies the second layer of AI analysis. The AI process was told to look at the elements in general, especially those with coefficients of +6 or higher, along with the additive constant, and summarize the results through six queries. The objective of the exercise was to publicly present the data, and then the AI interpretation of the data, untouched by human hands. No attempt was made to structure the output of the AI, this effort being among the first to attempt a machine-level summarization. It is likely that we will see significant advances in ‘insights and languages, as the ever-evolving AI amplifies the structured outputs of Mind Genomics experiments.

References

  1. EU (2023) “What is GDPR, the EU’s new data protection law?”, https: //gdpr.eu/what-is-gdpr/, accessed May 28 (2023).
  2. Sprenger J (2011) Hypothetico‐ confirmation. Philosophy Compass 6: 497-508.
  3. Kim TW, Mejia S (2019) From artificial intelligence to artificial wisdom: what Socrates teaches us. Computer 52: 70-74.
  4. Longoni C, Bonezzi A, Morewedge CK (2019) Resistance to medical artificial intelligence. Journal of Consumer Research 46: 629-650.
  5. Longoni C, Cian L (2022) Artificial intelligence in utilitarian vs. hedonic contexts: The “word-of-machine” effect. Journal of Marketing 86: 91-108.
  6. Manikonda L, Deotale A, Kambhampati S (2018) December. What’s up with privacy? User preferences and privacy concerns in intelligent personal assistants. In: Proceedings of the (2018) AAAI/ACM Conference on AI, Ethics, and Society 229-235.
  7. Ashoori M, Weisz, JD (2019) In AI we trust? Factors that influence trustworthiness of AI-infused decision-making processes. arXiv preprint arXiv: 1912: 02675.
  8. Lara F, Deckers J (2020) Artificial intelligence as a socratic assistant for moral enhancement. Neuroethics 13: 275-287.
  9. Zemel R, Choudhuri, SG, Gere A, Upreti H, Deitel Y, Papajorgji P, Moskowitz H (2019) Mind, Consumers, and Dairy: Applying Artificial Intelligence, Mind Genomics, and Predictive Viewpoint Typing. In Current Issues and Challenges in the Dairy Industry. IntechOpen.
  10. Gofman A, Moskowitz H (2010) Isomorphic permuted experimental designs and their application in conjoint analysis. Journal of Sensory Studies 25: 127-145.
  11. Likas A, Vlassis N, Verbeek, JJ (2003) The global k-means clustering algorithm. Pattern Recognition 36: 451-461.

Russia’s Domestic and International Politics: No Explanation Possible without the Cognitive- Developmental Approach

DOI: 10.31038/PSYJ.2023552

Abstract

Russia’s war on Ukraine is not a failure by accident but reflects mentality and stance of the Kremlin and greater parts of the Russian people. Russia’s domestic policy is characterized by autocracy and his international politics follows imperial dreams, prosecuted by most brutal methods. Obviously, the political consciousness of the Russians has not progressed to the rates and standards that shape mind and behavior both of politicians and electorate in the most advanced nations of our time. It is argued that political sciences must consider research conducted by the cognitive-developmental approach to understand divergent political cultures more thoroughly. Contemporary nations operate on differently developed stages of mind and cognition with far-reaching effects on moral reasoning, social understanding, and humanitarian standards. There is evidence that a weaker development of the fourth stage of human cognition, the stage of formal operations, accounts to backwardness concerning the process of civilization. This seems to be the main cause to the existence of the chasm between the “Russian World” and the “Free World”.

Keywords

Developmental stages, Civilization process, Political consciousness, International politics, Democracy, Autocracy, Moral values, Humanism

Introduction

Since February 2022, social scientists, politicians, journalists, and the public have been more and more realizing that the differences between Russia on the one side and Western nations on the other side concerning culture, politics, and mentality are much greater than previously assumed. Even a few weeks before the war, only a small number of the 2.000 experts visiting the Munich Security Conference expected Russia was to attack Ukraine, while the majority assumed Russia would only try to blackmail the West and Ukraine for receiving some guarantees and concessions. Many Western observers previously believed that the Russian Federation would share common norms and standards concerning international treaties, territorial integrity, warfare, and humanism at least to that rate to be hindered from starting a brutal war against a nation to whom it had maintained a lot of connections in terms of language, culture, and family ties. Though many experts and observers still continued in preserving their naïve illusions even during the whole year 2022, some others recognized that the war might evidence the huge cultural gulf between Russia and the West, a cultural chasm which has existed for generations and centuries but was overlooked for long. The war threw a new light on how to understand Russia, its society, culture, politics, and people, both the past and the contemporary Russia.

In fact, the tremendous differences are manifest concerning domestic and international politics, economy and judiciary, culture and mass media, family life and morals. They seem to touch every aspect of life, refuting the assumption that the use of modern media, rise of higher education, international contacts, and participation in globalization might prompt and unify the standards of politics and morals on a worldwide scale, at least with reference to the comparison between Russia and the West. It is obvious now that Russia has not shared the advancements in political culture, morals, and humanism to that rate the Western nations, including for example Japan and South Korea, have accomplished over the past generations. Russia has not successfully progressed to heights which are identifiable in the most advanced nations of our time.

Many experts may agree on the existence of this cultural chasm as outlined in the previous sentences [1,2]. However, the cultural gap may be much deeper than most critics of contemporary Russia even believe. I am going to maintain that the cultural gap is describable in terms of developmental stages as they are known and worked out by professional developmental psychology. This kind of research and theory is almost unknown among most political scientists, historians, sociologists, journalists, and politicians. Even the harshest critics of Russia, seeing it as backbencher concerning modernization and progress, understanding it as Stalinist or partially even as medieval, usually have no idea of possibility and necessity to apply developmental psychology to scrutinize Russia specifically and cultural differences between nations generally.

In several essays, E. Fein and A. Wagner have described Russian politics in terms of psychological stage theory, using theories of adult development [3,4]. Adult development describes stage developments unfolding and discernible among adults within a given society or between adults of different societies. This approach illuminates the backwardness of contemporary Russia in a fresh and astonishing way, dwarfing the common political science studies related to Russia by showing their limited precision and their insufficient or almost missing explanatory power.

This article goes beyond that as it erases the boundaries between developmental psychology and adult development theories. Theories of adult development actually do not bridge the gap to child development; it remains unclear how adult development follows those stages children go through. More precisely, theories of adult development sometimes describe about ten stages, maintaining there are some adults in modern societies operating on stages two or three of ten possible ones [5,6]. Then they have the problem to connect these assumptions with the fact that there are prior stages to consider, those provided for children and teenagers. When modern adults might stay on stage three of ten possible ones, where did they stay when they were six or 14 years of age?

Therefore, my own approach solely bases on the most common stage theory known in developmental psychology, on the theory of stage development according to Jean Piaget. It describes four main stages, covering the development from neonate over child and adolescent to adult phases [7]. My approach, called structural-genetic theory programme, is developed as a general theory of history, and expounds the history of human development from archaic to modern societies, including the history of culture, politics, law, religion, sciences, philosophy, arts, and morals (XXX).

Archaic or ancient humans share with modern children stage two and sometimes stage three but do not develop stage four, which is a stage that only adolescents and adults of modern societies are able to develop. The evolution of stage four – the stage of formal operations – originated late in history, usually in Europe during the 17th and 18th centuries, and did not reach the average people before the 20th century. Stage four has evolved stepwise from generation to generation over the past centuries. Stage four has continually grown within the most advanced nations of today, while developing and threshold countries are somewhat behind concerning that development. While the most advanced nations of today stay comparably highest on formal operations, people of threshold countries are more or less somewhat behind, while people living in traditional regions within the developing nations often do not attain the fourth stage at all. These uneven stage developments across world society account for uneven developments of politics, morals, and humanism (XXX).

The structural-genetic theory programme refers for example autocracy, missing human rights, corruption and criminality, maltreatment of women and children, brutal punishment laws, and superstition to lack or weak development of the fourth stage, while a strong development of that stage reversely accounts for democracy, protection of civil rights, humanism, rationality and enlightenment (XXX). Therefore, it is claimed that the comparably cultural backwardness of current Russia must be explained in terms of developmental psychology, that is, it is rooted in comparably weaker developments of the fourth stage in the minds of people.

On the whole, Piagetian stage theory delivers a sharper and deeper foundation to the phenomena mentioned than adult development theories, with foundations that are much more precisely and more consistently based. There is no gap between child and adult development, but adult development is continuously connected to child development. Sciences need only one stage theory, not two of them.

Civilization Theory and Piagetian Psychology

There has been a forerunner of the structural-genetic theory programme. The civilization theory of Norbert Elias [8] shares many assumptions, including the description according to that humankind went through psychogenetic stages from childhood to adulthood. Elias compares ancient or medieval adults to children, seeing adults of modern societies as the only ones to have surmounted children’s stages. He describes medieval humans as people characterized by narrowness of mind, inability to overlook complex relations, cognitive egocentrism, low thresholds of shame and embarrassment, low forms of conscience, strong and wild passions especially concerning sexuality and aggression. According to Elias they have a strong Id and a weak Super-Ego, allowing the I to follow his drives and passions. Modern adults have overcome the child’s psyche and are therefore more civilized. The history of civilization, the transition from medieval to modern times, roots in this psychogenetic development of humankind. Elias recognized that non-European nations have been following this path during the 20th century. According to that theory, Russians can be categorized as backbenchers concerning the civilization process.

Piagetian theory and Piagetian Cross-Cultural Psychology can evidence that what Elias had already described, thereby using better data and theoretical models than Elias had had available. All humans all over the world develop the sensorimotor and the preoperational stages likewise, but then divergences between ethnicities appear. The preoperational stage is the modal stage of archaic or premodern adults, the stage that explains archaic mind, behavior, and culture mainly. Some of them develop also the concrete operational stage, mainly partially and mostly bound to certain issues and tasks. They never develop the formal operational stage, the fourth and final stage [9-14].

The preoperational stage matches to children between their second and their tenth year roughly, and the concrete operational stage covers developments between the sixth and the 12th year of age. The formal operational stage stepwise unfolds between the 12th and the 25th year of age. That implies that archaic or premodern humans usually stay on stages of children between their third and their tenth year, most often between their fourth and their seventh year. Archaic humans may differ in life experience and knowledge from preschool children, but not regarding their psychological stage structures. More, every single phenomenon developmental psychology found to describe children, empirical research also discovered as main feature of archaic adults. The commonalities regarding stage structures are encompassing and complete, leaving no room for any differences whichever. Modern adults, however, distribute on developmental ages between 10 and 25. While some modern adults stay on substage A of formal operations (10-15 years of age), others exhibit substage B (from 15 years onwards) (XXX).

Children and archaic adults share the same patterns concerning numbers, logic, physics, social affairs, political understanding, morals, religious phenomena, and worldview, right across the whole range of mind, consciousness, and world understanding. Both groups likewise believe in ghosts and sorcerers, magic and oracles, and share animistic understandings of nature and movements. Both groups hold on a law-and-order justice and discern laws as holy and unchangeable things. Both groups have religious feelings towards natural phenomena and view the cosmos as some kind of God by itself. Both groups have the same attitudes towards myths and fairy tales and apply the same categories of causality, chance, and probability. Both groups support autocracy and deny democracy. The commonalities include even small details such as the understanding of shadows or the ignorance of syllogisms.

Against this background is it possible to reconstruct the history of culture, sciences, philosophy, religion, politics, law, morals, and arts in terms of developmental stages [15-18]. The preoperational stage carries and defines the historically early stages of these branches of culture, no matter where and when in world history, and the higher stages carry their trajectories through later times. The modern structures of these branches mentioned are mainly nothing else than manifestations of the formal operational stage. On the whole, modern, industrial society simply is a manifestation of the fourth stage. As stage theory is the deepest description of the psychogenesis of humankind, as the structural-genetic theory programme delivers the most fundamental description of the history of the branches because it directly refers this description to the core structures of the four stages respectively (XXX).

Developmental Psychology and Political Studies

Stage Theory and Political Behavior in World Politics

Psychological stages have widely shaped the evolution of political institutions and political thought [19,20]. They do not only account for the existence of autocracy or democracy but also for the rate of brutality and criminality concerning political behavior, or for the values and moral standards shaping political conduct. Politicians governing developing nations have been tending more to brutal and criminal behavior than politicians ruling the most advanced nations of our time. Not political institutions and legal frameworks account for that difference, as most political studies suggest or imply. Psychological stages cause these differences as they cause both institutions and mentality of people. Nations operating on lower stages have no problems in accepting violent rulers, they are loyal to dictators and tolerate their insane methods. Only nations on higher stages rebuke both autocracy and violent and absurd methods of politicians. Political sciences, however, don’t know about the necessity to apply developmental psychology to the study of political phenomena. I have yet published some book chapters and some articles to outline the link between political sciences and stage theory.

For example, the former president of the Philippines, Rodrigo Duterte, won elections for presidency due to his official statements he, as mayor of Davao, had killed drug-users and dealers by his own gun on regular controls he had done through his city with his motorbike. He won the election campaign because the nation wanted to have a strong man capable to solve problems by most brutal methods. Then staying in power, hundreds of private persons and police officers alike received 300 USD for every assassination of both addicts and dealers. More than 10.000 persons were killed anywhere in the streets or in their homes, without any supervision or judicial procedures. More, the Philippines had no special drug problem though, at least less than many other nations (XXX). It is apparent that such phenomena could never happen in the most advanced nations of today, and even not in advanced developing nations such as Brazil or Argentina.

Prince Johnson murdered Liberia’s president Samuel Doe in September 1990 and made a detailed two-hours-film of the slow and brutal torture and killing of Doe. The video became the biggest attraction in Liberia and was widely cast in West Africa over years. It did not endanger Johnson’s presidency but ran in bars and shops from morning to night, entertaining the appetite and appealing the taste of some nations at best (XXX). Again, such things could never happen in Brazil or Argentina. It is impossible to imagine Angela Merkel sitting on a motorbike hunting addicts with her own gun or even Donald Trump casting videos showing a torture of “sleepy Joe”.

Even people with most limited knowledge of developmental psychology should immediately grasp that only stage theory can explain these great differences in political behavior. There are huge differences with this regard between contemporary nations whether political sciences and journalism can address or envisage this or not. These pieces of information are the best precondition to understand the necessity to apply stage theory to political studies, to the ignorance of our intellectual and political elite, and – to Russia.

Stage Theory as Explanatory Model to the Evolution of Democracy

Developmental psychology does not only explain daily political behavior and political mentality. It explains also whether a nation prefers autocracy or democracy. The structural-genetic theory programme has outlined that not social structures or power constellations account for autocracy/democracy but stage developments concerning a nation’s political consciousness (XXX). Jean Piaget delivered the decisive data to develop this new theory of political systems. He evidenced that children by their tenth year roughly see rules and laws as unchangeable and holy, made by God or the elderly. They think people are not allowed to make rules and to govern society on their own, by applying democratic customs and procedures. Teenagers, however, surmount this idea of divine and autocratic government, and establish ideas and customs of democratic leadership. Accordingly, stage theory accounts for the existence both of autocracy and democracy [21]. Subsequent research has repeatedly confirmed Piaget’s early study. Teenagers have a better understanding of liberty rights, tolerance of dissident opinions, and democratic procedures, while children focus on the privileges of rulers and hold on strict principles of obedience [22-30].

Not before 2013 did an encompassing study with about 100 pages exist to evidence that humankind went through exactly the same stages of political systems and ideas as those outlined by developmental psychology, as those found among children. It is now sufficiently and coherently worked out that stage theory is able explaining the rise of democracy (XXX). The gradual rise of formal operations during the time 1750 to 1950 is the main cause to the continuous rise of liberty rights, rule of law, and democracy, first in the West, later on in other regions of the world. The era of Enlightenment worked out the ideas of liberalism, while the era of revolution at the end of the 18th century and the era of modernization during the following centuries put the liberal ideas into praxis and created the institutions of democracy. The emergence of the stage of formal operations has carried the whole process of civilization manifest in political systems, political consciousness, moral standards in political behavior, and political values. The decline of violence, corruption, mafia connections, and warfare mentality is consequence of psychogenetic advancements. This late description or discovery is insofar astonishing as Piaget himself in his early study launched a lot of remarks that there are parallels to history, while for example decades later Radding also made some formulations related, being by no means the only author with this regard. However, it was the structural-genetic theory programme to develop the new theory consistently and fundamentally (XXX).

The Political System in Russia

Russia transformed from monarchy to communist dictatorship in 1917. Democracy existed in Russia only during the last decade of the last century, while since 1999 with Putin in power Russia slowly turned into autocracy again, holding democratic institutions only as a mere façade. Already in the year 2000, the new government overtook greater parts of mass media in order to control public opinion in favor of the Kremlin. By 2008, the Kremlin is said to control 90% of mass media. The new government put former KGB agents into central positions of state and administration with clear intention that the secret service should dominate the whole state and society. In fact, with Putin the former KGB overtook the power in Russia and removed both the new democratic elites and the Jelzin “family” from influential positions. By 2006, 78% of the Russian state elite had a background with the “services”. From the scratch on these people aimed at abolishment of liberalism, democracy, and rule of law. Liberty rights were contained and there was nobody anymore to enjoy legal protection against prosecution or attacks by agents or officials. The division of jurisprudence, legislation, and government slowly dissolved [31].

The new power elite overtook the economic empires made by the Oligarchs of the 1990s and thousands of enterprises, thus dominating whole branches, media, energy, building, finances, etc. They forced former entrepreneurs to resign and to hand over their property, or just killed them, when they refused to give in. It was just brutal force that made the grand robbery feasible. Or, they used justice and police to accuse any businessmen to get their property into their hands. Especially the accusation of not having paid taxes offered a good pretext for expropriation.

It was common that true Mafia organizations killed entrepreneurs, overtook their property, and shared their conquest with either local state officials or even with the Kremlin. Or, that state officials overtook enterprises, thereby using the help of Mafiosi. Coalitions with Kremlin, administration, police, and Mafia became widespread. Robbery, basing on such coalitions, did not only concern enterprises but entailed also private houses or appartements. Violence decided over business success and ownerships referring to enterprises and houses.

The Kremlin dominates at the top of the corrupt system. When gangsters or service agents want see their robbery secured or even guaranteed, then they must share with the Kremlin. The Kremlin receives this way its shares from all parts of economy throughout the country. Secret services or the Kremlin now control 70% of Russia’s Gross Domestic Product. Russia is practically a feudal state where the Kremlin approves ownerships in exchange of shares or contributions. Thereby it is possible that in case of missing loyalty or missing shares, the Kremlin expropriates owners to overtake the property by its own, or by consigning it to other persons or groups. The Kremlin allows or withdraws ownerships from any conglomerates, enterprises, or businessmen for whichever reasons. It is maintained that there does not take place any transfer of capital over 50 Mio. USD in Russia without the personal permission of Putin himself. Therefore, he could accumulate more than 200 Billon USD for his own fortune and build his own “Versailles” close to Sochi.

The slow transformation from democracy to autocracy accelerated since the invasion of February the 24th. Since that time every trace of opposition has vanished, and strict loyalty and obedience is requested from any citizen in the state. The question arises why did the Russian people accepted that transformation? Why did they allow gangsters to overtake office and economy? Why did they endure their slavery and loss of rights? According to the new theory of political systems presented above the ultimate cause to the existence of autocracy is the weak development of the adolescent stage of formal operations. Dictators can only rule when greater parts of a nation support them, accept them and are loyal to them. Without support and wish of the people dictators cannot keep their power and rulership. The existence of autocracies depends on the political consciousness of greater parts of the nation. In fact, psychological stages account for dictatorship.

Without knowledge of the structural-genetic theory programme, authors studying Russia have recognized that the majority of Russians already in the beginning of Putin’s rulership were in favor of autocracy and saw it as the best method to rule the country, to recover both economy and Russia’s greatness in world politics. Russians disrespected democracy and liberty rights as Western propaganda and as accountable to the chaos of the 1990s. The Russian people have elected Putin and his party time and again during the past two decades, especially people living in the countryside and in the provinces. State propaganda has its share but educated people fully staying on the fourth stage would neither swallow this propaganda nor back the whole system generally. “A majority of people deliberately accepted the new system that cemented the way of government prevailing in Russia since the time of the czars.” The deep connection between political consciousness of people on the one hand and the actual political system on the other hand completely matches to expectations of the psychological stage theory mentioned above. The structural-genetic theory programme claims to be able to explain the primitive and uncivilized political system of Russia.

Theories of Adult Development and the Political System of Russia

Elke Fein and Anastasija Wagner belong to those having applied theories of psychological development to the study of Russian society. They use, as mentioned above, theories of adult development to understanding contemporary Russia. They apply among others the stage theory of social forms and political behavior outlined and devised by Stephen Chilton [32]. The lowest stage 1 (“punishment and obedience”), expressed by physical compulsion, threats, seizure by force, and extortion, is manifest in pecking orders, slavery, and prisons. The second stage (“individual instrumental purpose and exchange”), expressed by barter, trading, bribery, deterrence by revenge, prebend, curses, exhibits in feudal systems, patronage systems, and hostages. The third stage (“mutual interpersonal expectations, relationships and conformity”), expressed by friendship and romantic love, is to find in client systems, social patronage, and corporatism. The stage four (“social system and conscience maintenance”), basing on mutual support of moral system, manifests in modern army, bureaucracy, tyranny of majority rule, and absolutism. Stage five (“prior rights and social contract or utility”) includes mutual respect, rational debate, fair competition, and scientific testing, and materializes in democracies and preservation of civil rights and liberties. Finally, stage 6 (“universal ethical principles”) bases on mutual care and undistorted communicative action and is still Utopia.

According to Fein, the Russian society after 1990 by today displays a mixture of stage 2 and stage 3, basing on patron-client-relations, clientelism, barter, or “blat”. Therefore, democracy and rule of law, tolerance and civil rights could not function in Russia because the political consciousness of people has been too weakly developed. Institutions can function only on that level of developmental complexity people have attained in their mind. “Unless the institution’s structure is preserved by people at the appropriate stage, the institution will regress to less developed forms.” The Russian political elite and electorate could not adopt the democratic institutions and practices introduced by B. Jelzin and thus the new formal institutions came to be devaluated in favor of clientelism, patronage, and brutal violence.

Thus, there is no great gulf between the political system of the USSR and that of contemporary Russia, at least measured by some criteria. The Soviet regime was ruled by “truth” and “dogma”. It was an ideological dictatorship, basing on clientelism and patronage, thus exhibiting the levels 2 and 3 according to Chilton. Stalinism was created by the Georgian clan culture.

The political consciousness of the Russians did not advance and remained blockaded on earlier stages, those stages that already prevailed in the USSR, and could not compete with the advancements taking place in the West especially between 1970 and today. “Modern and postmodern values and logics have neither become the dominant structures of public reasoning nor of political action on a larger scale. Sustainable post-conventional action logics, for example, would also include post-materialist and other post-conventional values, such as critical self-reflection, putting higher weight on good relationships and inner growth as compared to material goods, increasing feelings of empathy, tolerance, and respect for other cultures, social and political minorities and even the rights and dignity of political opponents.”

Fein also resorts to the stage theory of Susanne Cook-Greuter. Stage 0 (pro-social) is followed by stage 1 (symbiotic) and stage 2 (impulsive). Stage 2/3 (self-protective) bases on minimal self-description and characterizes many Russians including Putin. Stage 3 (conformist/rule-oriented) is followed by stage 3/4 (self-conscious) and stage 4 (conscientious), then by stage 5 (autonomous) and stage 6 (unitary). I do not comment Cook-Greuter’s stage theory here. Fein earmarks an early stage such as 2/3 as modal stage of many Russians, and this shows at least that Fein sees the Russians as tremendously backward in terms of personality development and political consciousness. Self-protective persons (stage 2/3) “see the world only from the perspective of their own needs and wants. They are as yet incapable of insight into themselves or others in a psychological sense. This is why they are generally wary of others’ intentions and assume the worst. Everything to them is a war of wills, and life a zero-sum game. Their ‘I win, you lose’ mentality inevitably causes friction and hurt feelings wherever they go, especially with others at more conventional stages. In turn, others experience self-protective people often as manipulative and exploitative, because in their perspective, the only way one can get what one wants is by controlling others and protecting oneself.” According to that research, self-protective individuals do not feel responsible for failure they cause, because they do not understand the connection between action and consequences. “Others are to blame, never oneself.”

Wagner and Fein researched the behavior of Putin by using several data bases, especially by analyzing his speeches, articles written about him, and other sources. The data were coded and interpreted by the stage theory of Cook-Greuter. They found Putin’s mind and behavior matching to stage 2 with 24% of his actions and statements, to stage 2/3 with 46%, to stage 3 with 25%, and to stage 3/4 with 5% of them. Thus Putin’s personality is dominated by the self-protective stage. “This structure does not show empathy with others, and often does not view them as equal others with legitimate, potentially differing perspectives on things. Instead, it perceives all outside actors and events through an egocentric, somewhat narcissist lens, primarily asking: ‘how does it affect me?’ and ‘what’s in it for me?’… And due to a lack of more differentiated coping strategies, they consequently try to control, hunt or eliminate them by all means. If there are no enemies, they invent or create them.” Fein shows that this attitude characterizes both the treatment of other nations and the own past. Russian foreign politics sees the ambitions and problems of other nations in an astonishing way only through own lenses. For example, Russia cannot recognize that the Eastern European nations’ hurry for membership to NATO or other alliances originated in its own conduct against these nations. Russia caused the problems but is incapable to connect its own mistakes with the unpleasant results and therefore always blames others.

The same attitude is identifiable concerning the interpretation of the own past. Russia addressed his own past seriously only during the Jelzin era, with “Memorial” that researched the crimes of the Stalin era, and with historians to scrutinize Stalin’s responsibility for the outburst of war [33]. Afterwards, with the beginning of the Putin era, the open and critical confrontation with the own past radically declined and was finally abolished. Stalin, the USSR, Russia’s role in the war, and the whole past was glorified and whitewashed, any form of criticism of the own past was prosecuted and criminalized. “I claim that self-protective logics of reasoning and action have come to function as a strategy to avoid a more differentiated confrontation with the after-effects of these dislocations and with the Soviet past in general, at least during the past ten years.” Higher psychological stages, being able to self-reflexive operations, do not whitewash own mistakes and ignore them but would accept them as facts. “Even psychological lay people would probably agree that self-reflexive efforts to confront past crimes and traumas constitute a more complex, more differentiated and thus more developed way of dealing with a criminal and traumatizing past than trying to whitewash, repress, or relativize it, for example by setting it off against the ‘positive sides of history’ or by denying or avoiding questions of responsibility.”

Since Putin took office as president, Russia’s rating on Transparency International’s Corruption Scale has dropped from rank 82 in 2000 to rank 136 in 2014 (www.transparency.org). While in Western societies, during the past centuries, models of cognition and social conduct have developed from concrete, interpersonal logics to more abstract and formal logics, Russian society preserved the concrete-personal relations as dominant form of society, thus continuing traditional relations such as patronage, clientelism, and corruption. Corruption belongs to everyday practices in traditional society and is seen as problem only when society attains the mode of preserving abstract rules and impersonal functionalities.

Premodern peoples usually stay on moral stages 1 or 2, only small percentages of a premodern population reach stage 3 [34]. These three stages manifest moral reasoning bound to concrete personal relationships only. They ignore any moral considerations referring to society, abstract rules, or general principles. Only stage 4 refers to abstract bodies such as state and society, that is, principles and institutions outside the range of personal interrelationships. Therefore, the problem of corruption can only be recognized on stage 4. This stage 4 was nonexistent in imperial Russia and seems to be missing or only very weakly developed in contemporary Russia. Corruption can only be defeated when people attain the stage 4 at modal stage, otherwise persons see no problem in preferring those who pay most or to whom they are personally connected. Corruption is visible as problem only when rule-oriented cultures of reasoning (at least stage 4) and their respective action logics emerge.

“Historians have described society in late tsarist Russia as a society of physical presence or as a gift giving society, in which the efficiency of power depended on the quality and stability of personal networks. The latter, in turn, were built and stabilized through practices of exchanging material and immaterial goods against loyalty, personal service, or obedience. Patron-client relationships were universal, unquestioned phenomena structuring the whole society, including its social, economic, and political institutions. At the same time, typical elements of modern statehood, such as impersonal institutions, the rule of law, and professional work ethics based on personal skills, formal qualifications, and specialized knowledge were nonexistent.”

Clerks were not appointed due to their qualifications but due to their personal relationships to patrons. Offices were distributed as reward for loyal behavior to the aristocrat, ultimately to the Czar. There was no spirit of lawfulness and strict obedience to rules, as Weber had described as prerequisite of modern bureaucracy. Higher education and professional education were missing in 19th century Russia. While Germany had already a three-stage school system and two state examinations as condition to join state service, Russia introduced compulsory school education not before 1917 and demanded from clerks only the knowledge of reading and writing but not any specific skills. “Most officers served exclusively because of the honor or of earning a certain rang or medal, without really taking an interest in the files or in the essence of the matter. They signaled anything that came to them by the chambers” [35].

Though higher qualifications and abstract rules played a higher role during the Soviet regime, it is quite obvious, that patron-client relations, clan structures, and blat-relations (personal networks to receive goods and to circumvent formal procedures) have dominated the Soviet society throughout the last century. “The Russian mentality is oriented toward personalizing one’s contacts… In Russia, formalities never meant more than personal relations. It is a country which is governed by mores rather than laws” [36].

This stage of consciousness has continued in Russia by today. Concrete personal relations and moral stages below stage 4 still shape contemporary Russian mentality. “Many observers therefore continue to think of corruption and the direct exchange of services based on relations of mutual trust as the true organizational principle of Russian society.” Russia is a patrimonial and neo-feudal state. Most archaic social relations continue, including clan structures, Mafia structures, and secret service networks to undermine market economy, rule of law and democracy. “In this sense, it is not accurate to say that impersonal systems in today’s Russia are ‘defect’. Rather, they have never fully developed in the first place due to a lack of sufficiently complex reasoning structures able to sustain them as a dominant culture… So even though a general developmental progress of cognition and culture can be analyzed here, post-Communist Russia still does not meet the modernity standards set by Weber. This is due to a missing systematic-stage political culture, which neither the Soviet nor the post-Soviet Russian government was interested in fostering. This also explains the difficulty of modern type (systematic-level) democratic institutions to take root in Russia.”

Social Affairs and Morals in Contemporary Russia

When Russians have developed the fourth stage of formal operations in a weaker way than people of the most advanced nations have done, as the previous analysis evidences, then Russian society is expected to manifest lower stages of personality development, social norms, and morals throughout. I want to document this by some short descriptions of the role of violence in society, the role of street fights, the impact of domestic violence, the situation in prisons, alcoholism, and the treatment of handicapped persons. These different phenomena emerge from a lower stage of personality development and moral consciousness than most advanced nations have reached during the past generations. Using the terms of N. Elias, it is quite apparent that Russian society is less civilized than some other nations are nowadays.

The enormous readiness of Russian people to exert cruel violence currently manifests in its war on Ukraine. While some politicians such as Gerhart Baum adamantly deny any difference between Russian aggressiveness and those of other nations in wartimes, not only the American Institute for the Study of War but also other observers maintain the special aggressiveness and cruelty of the Russian army not only today but also in former times [37]. Butscha und Irpin reflect the normal way of Russian warfare. “What happens in Ukraine over the last three months is an orgy of epic, unbounded violence. Mass executions and bestial torture, assassinations of civilians, just so, just for boredom, for fun, with rapes and murders of parents before their children’s eyes and conversely, with violence against women and girls between 8 and 80 years of age.” [38] Jeffrey Hawn maintained that the Russian army, quite different to Western armies, has not developed an institutional culture to minimize losses among civilians; there simply are no protective mechanisms against unjustified violence in place. Main targets of the Russian attacks are apartment blocks where thousands of normal people live. Destruction of whole cities, as already practiced in Syria, to take civilians all means to survive, is the normal Russian way of warfare. Waiting for the winter to destroy power stations and heating facilities to hope for the death of thousands of civilians in their cold homes, this is a normal strategy in the eyes of Russian military. “Russia has presented to the whole world its senseless Russian anger, its sinister barbarism, his criminal mentality, cruelty, violence and its contempt of human dignity and human life, both that of Ukrainians and its own soldiers.”

Deadly and bloody gladiator fights in arenas before thousands of spectators belonged to the most influential entertainment opportunities of ancient times (XXX). This culture of violence has vanished due to risen psychological stages shaping morals and emotions. Residual forms of that may exist in current box fights, while in Russia harder forms of entertainment fighting have survived, combats that would be impossible to stage in Western Europe. The custom is called Strelka championship (mixed-martial-arts combats) conducted right across Russia. Everybody in the streets is allowed to participate at the combats, without any preparation and exercise. The organizer asks bystanders to enter the ring and to join, giving them joke names and money when they win. Those, who fight bravely and in an entertaining way, can become famous across the country. The fighters are simply amateurs that fight each other without any rules [39].

This culture of violence penetrates the personal and family relations likewise. Russian statistics document 50.000 crimes in 2015, where violence in private homes was involved. 36.000 of them refer to violence used against women. According to UN statistics, 14.000 women in Russia are annually killed by their relatives, especially by their husbands. 40% of all crimes, that entailed use of violence, took place in private homes and family. Especially 2/3 of heavy body injuries and premediated assassinations are committed inside the own family. 600.000 women are annually beaten in Russia. Since March 2017, a new law passed the Duma to remove all those attacks, which do not cause remaining body damages, from penalty consequences. Those persons, who cause only moderate injuries, are not prosecuted by law, but must pay for regulatory offences only [40]. Though the US population has more than double the size, only 1.800 women are killed in the USA. The ratio with this regard between the USA and Russia thus amounts almost 1:20, albeit the USA exhibits much more violence than European nations do. For example, 122 women were killed in Germany in 2018.

Domestic violence is frequently accompanied by alcohol. According to Russian police, 80% to 95% of culprits commit domestic violence under alcohol abuse. Every fifth Russian dies from alcohol abuse, according to WHO statistics. Alcohol causes more than 50% of deaths in the age groups between 15 and 54 years of age, with reference to men 59% and to women 33%. Alcohol intoxications, liver cirrhosis, injuries and homicides under alcohol impact belong to the special causes leading to death [41]. Alcohol abuse is typical for many developing nations and was also a great problem in Europe generations ago but has decreased over time in consequence of education and greater consciousness. In Africa, alcohol abuse has played a great part till yesterday or even today, greater parts of whole village populations were drunken on an almost daily basis. It can be maintained that there does exist a link between the civilization process and alcohol consumption.

Russia manifests his brutal behavior against human beings also in his detainment policy. 480.000 people were imprisoned in Russia in March 2021. Only the United States have higher rates of imprisonment than Russia has. The chance to get imprisoned is great as judicial courts convict most of the defendants: If persons are charged, they have still little chance to get rid of accusations and of conviction to go to jail. While European nations at the average pay for every prisoner 68,30 € per day, Russia has the lowest costs with 2,40 € per prisoner per day.

The Russian detainment system does not aim for resocialization of personality but for its breaking. Withdrawal from sleeping, total ban of speaking, torture, beating, raping, and electro shocks belong to common practices. Or some prisoners must stay in frost or in uncomfortable body positions over hours. The cells are overcrowded, and the staff exerts his power without much control [42,43].

Similar tendencies are to find in the treatment of handicapped persons. Nearly 10% of people living in Russia suffer from handicaps, though these 14 million people are hardly seen in public. It is widely avoided to hint at their mere existence, as handicaps are not subject of official discussion. Since Soviet times, most people shares negative attitudes against handicapped persons, they are seen as people with low worth. Parts of people wanted them even to be eliminated. Though Western NGOs did a lot to improve the situation of handicapped persons in Russia, public transportation, offices, and the whole public space do not consider the needs of handicapped persons. Elevators, ramps, sound signals, and braille are widely missing to relieve their mobility [44,45].

Usually, handicapped persons are removed from their families and brought to shelters for disabled. In Soviet times, families were not even allowed to rise their disabled children on their own. However, still nowadays it is usage that they spend their lives in shelters and not in their families. Time and again, they were tied to their beds, beaten, locked in their rooms, and completely socially ignored. Handicapped persons are usually excluded from education and job market. “There aren’t any institutions to employ mentally handicapped persons in a responsible way. When these persons have finished their school, then they have nothing to expect from the employment system.”

War on Ukraine

Some weeks after the occupation of Crimea, I prognosticated Russia’s try of total conquest of Ukraine in future. I wrote that the only possibility to rescue Ukraine from that fate would be the deployment of sufficient Western troops in the country (XXX). Ukraine had no hostile feelings against Russia by 2013. Ukraine’s commitment to democracy and rule of law, and his wish to join European Union, caused Russia’s readiness to undermine Ukraine’s policy by brutal force [46-50]. Instead of continuing friendly relations with Ukraine, Russia decided to subdue Ukraine by war. The result was a unified and patriotic Ukraine that will hate Russia probably for generations. Outcomes of that policy are a hostile Ukraine, decisive resistance of democratic nations around the world, Russia’s decline of power and influence in many parts of the world, decline of its GDP for many years, problems of preserving power in Russia, thousands of casualties in Ukraine and Russia, devastation of Ukraine’s infrastructure, industry, and towns, and uncountable damages and injuries.

Only a tremendous weakness of formal operations, consciousness, rationality, and overview, including a to that matching far-reaching lack of information and knowledge, can cause such failures. Only people staying on lower stages of formal operations are inclined to disrespect the rights of other nations, to believe that they themselves have the right to decide over that what other nations should do and whether they have the right to exist as independent nations or not, to start wars to conquer a foreign nation and to subdue its population, and to sacrifice thousands of people for such criminal targets. Only uncivilized and criminal persons lead wars for imperial dreams, for the enlargement of territory, and for restauration of former influences, causing losses not seen in Europe for many decades. Only persons staying on lower stages of the civilization process disrespect a couple of international treaties, international law, and humanitarian standards. It is incredible that there are persons that are inclined to devastate a so-called brother nation, thereby even maintaining the non-existence of any difference between Russians and Ukrainians.

Observers rightly estimated that the war on Ukraine is not only “Putin’s war”. Greater parts of the Russian people support imperial dreams concerning the restauration of the Russian Empire with Ukraine as an indispensable part. These people accept that Russia has the right to decide over its influence sphere and over Ukraine’s policy. They support wars when they lead to victory and to an increase in power. Even the consideration of state propaganda cannot divert from the fact that only weakness of formal operations – weakness of political consciousness and morals – can explain such uncivilized stance.

Conclusions

It is apparent that the wrong policy of the West, that is, the missing containment of Russia and the lacking prevention of Russia’s invasion, has originated in illusions concerning the civilization level of Russian society. Due to the missing education in Elias’ civilization theory and the structural-genetic theory programme, Western politicians and journalists simply overlooked the backwardness of Russian society generally and Russian policy specifically. They simply assumed that Russians politicians would share the political consciousness, the moral stages, the humanitarian standards, and the values that are deeply rooted in the minds of politicians and people living in the most advanced nations of today. They could not even imagine the abysses that separate the “Russian World” from the “Free World”. The prevalent ideology of Cultural Relativism penetrating the minds of the educated elite in the West has caused these illusions mentioned.

Of course, there are percentages of people in Russia who strictly object to the course of the Kremlin and to the backward stance of Russia. Those Russians, who fight against the Kremlin policy, express the better part of Russia and have deserved greatest respect. Mikhail Kasjanov, Alexei Navalny, Irina Scherbakowa and Marina Owsjannikowa belong to the large group of Russians that represent the best Russia has to offer. They align with those Ukrainians such as Ihor Terechow, Dmytro Kuleba, Wolodimir Selenski and Sergij Osachuk, who define higher standards of European politics.

Declarations

Funding and/or Conflicts of Interests/Competing Interests

The article was written without any funds. There are no conflicts of interest to report. The article aligns with the binding ethical standards.

Compliance with Ethical Standards

Disclosure of potential conflicts of interest: There are no conflicts to report. Research involving human participants and/or animals: The study does not base on experimental procedures conducted with humans or animals. Informed consent: There are no other persons whose interests might be infringed, or no ethical standards to be violated.

References

  1. Gloger K (2022) Putins Welt. Das neue Russland, die Ukraine und der Westen. München: Piper Verlag.
  2. Eltchaninoff M (2022) In Putins Kopf. Logik und Willkür eines Autokraten. Stuttgart: Cotta´sche Buchhandlung.
  3. Fein E (2016) Cognition, cultural practices, and the working of political institutions: an adult developmental perspective on corruption in Russian history. Behavioral Development Bulletin 12: 1-19.
  4. Fein E (2010) Adult development theory and political analysis: An integral account of social and political change in Soviet and Post-Soviet Russia. Integral Review 6: 82-114.
  5. Wagner A, Fein E (2016) Vladimir Putin as a political leader: challenges to an adult developmentally-informed analysis of politics and political culture. Behavioral Development Bulletin 21: 204-222.
  6. Cook-Greuter S (1990) Maps for living: Ego-development stages from symbiosis to conscious universal embeddedness (79-104) In: M. L. Commons, C. Armon, L. Kohlberg, F. A. Richards, T. A. Grotzer & J. D. Sinnott (eds.), Adult development Part 2: Models and methods in the study of adolescent and adult thought. New York: Praeger.
  7. Piaget J, Inhelder B (1969) The psychology of the child. New York: Basic books.
  8. Elias N (1982) Power and civility. New York: Pantheon.
  9. Dasen P, Berry JW (Eds.) Culture and cognition. Readings in cross-cultural psychology. London: Methuen & Co.
  10. Havighurst R, Neugarten B (1955) American Indian and white children. Chicago: University Press.
  11. Luria AR (1982) Cognitive development. Its cultural and social foundations. Boston, Mass.: Harvard University Press.
  12. Hallpike C (1979) Foundations of primitive thought. Oxford: Clarendon press.
  13. Werner H (1948) Comparative psychology of mental development. New York: Follet.
  14. Flynn J R (2007) What is intelligence? Cambridge, London: Cambridge University Press.
  15. Radding C M (1985) A world made by men. Cognition and society. Chapel Hill: The University of North Carolina Press.
  16. Piaget J, Garcia R (1989) Psychogenesis and the history of sciences. New York: Columbia University Press.
  17. Gablik, S. 1976. Progress in art. London: Thames & Hudson.
  18. Ibarra L (2007) Creencias, mitos y rituales en el mundo pre-hispanico. Guadalajara: Universidad de Guadalajara.
  19. Rosenberg S, Ward D, Chilton S (1988) Political reasoning and cognition. A Piagetian view. Durham & London: Duke University Press.
  20. Rindermann H (2008) Relevance of education and intelligence for the political development of nations. Intelligence 36: 306-322.
  21. Piaget J (1932) The moral judgment of the child. New York: The Free Press.
  22. Adelson J, Bell L (1970) Adolescent perspectives on law and government. Law and Society Review 495-504.
  23. Connell RW (1971) The child´s construction of politics. Melbourne: University Press.
  24. Damon W (1977) The social world of the child. San Francisco, London, Washington: Jossey Bass Inc.
  25. Durio HF (1976) A taxonomy of democratic development. A theoretical interpretation of the internalising of democratic principles. Human Development 19: 197-219.
  26. Easton D, Hess R (1962) The child´s political world. Midwest Journal of Political Science 6: 229-246.
  27. Gallatin J, Adelson J (1970) Individual rights and the public good: A cross-national study of adolescence. Comparative Political Studies 2: 226-244.
  28. Zellman G, Sears DO (1971) Childhood origins of tolerance for dissent. Journal of Social Issues 27: 109-136.
  29. Tapp J, Kohlberg L (1971) Developing senses of law and legal justice. Journal of Social Issues 27: 2.
  30. Lickona T (1976) Moral development and behaviour. New York: Holt, Rinehart & Winston.
  31. Belton C (2022) Putins Netz. Wie sich der KGB Russland zurückholte und dann den Westen ins Auge fasste. Hamburg: Harper Collins Deutschland.
  32. Chilton S (1988) Defining political development. Boulder & London: Lynne Rienner Publishers.
  33. Suvurow V (2008) The chief culprit. Annapolis, Maryland: Naval Institute Press.
  34. Hallpike C (2004) Evolution of moral understanding. London: Prometheus Research Group.
  35. Schattenberg S (2008) Die korrupte Provinz? Russische Beamte im 19. Frankfurt: Campus Verlag.
  36. Ledeneva A V (1998) Russia´s economy of favours: Blat, networking, and informal exchange. Cambridge, London: Cambridge University Press.
  37. Hoffmann J (2003) Stalins Vernichtungskrieg. München: Herbig.
  38. Medwedew S (2022) Entfesselte Gewalt als Norm.
  39. Schetschenko N (2018) Blut and Knock-outs: Russlands Amateur-Fight Club ist nichts für Zartbesaitete. Russia Beyond.
  40. Hebel C (2019) Morde an Frauen in Russland: Wo Gewalt zu Hause ist. In: Spiegel Online.
  41. Eller C (2011) Trinken bis zum Tod. Über die russische Volksdroge Alkohol und ihre Auswirkungen.
  42. Dubowy, A. 2021. Das russische Strafvollzugssystem.
  43. Ballin A (2021) Russlands Strafvollzug soll die Menschen brechen.
  44. Fröhlich C (2018) Behinderung und Inklusion.
  45. Siegl E (2012) Weggesperrt und vergessen.
  46. Kappeler A (2022) Kleine Geschichte der Ukraine. München: C. H. Beck.
  47. Kern F (1952) Recht und Verfassung im Mittelalter. Darmstadt: Wissenschaftliche Buchgesellschaft.
  48. Lickona T (1976) Moral development and behaviour. New York: Holt, Rinehart & Winston.
  49. Piaget, J. 1959. The child´s conception of the world. New York: Littlefield, Adams & Co.
  50. Wittfogel K A (1957) Oriental despotism. A comparative study of total power. New Haven: Yale University Press.