Author Archives: author

Predictors of Listening and Reading Comprehension in Arabic as the First Language and Listening and Comprehension in English as a Foreign Language: Two Different Orthographies

DOI: 10.31038/ASMHS.2023722

Abstract

Both listening and reading comprehension have not been sufficiently studied in the context of Arabic and English language orthographies. The main goal of the current research was to investigate how listening and reading comprehension among native Arabic speakers predict the use of Arabic and English language orthographies in learning English as a foreign language (FL) in Israel. The Arab minority in Israel learn three languages: Arabic as their first language (L1), Hebrew as the language of the state of Israel (L2), and English as a foreign language (FL). Consequently, the dissimilarity between Arabic and English orthographies poses several challenges in learning English as a foreign language among Israeli Arab students. Arabic and English are alphabetical writing systems but represent different orthographies. A total of 100 Arabic-speaking high school students were asked to administer a set of phonological, linguistic, and cognitive scales. The results of the present study indicated that predictors of listening and reading comprehension in Arabic and predictors of listening and comprehension in English are different. Another finding of the present study was that predictors in Arabic language predict listening and reading comprehension in English. However, the Arabic skills predictors for listening comprehension are different than the Arabic skills predictors for reading comprehension. The results are discussed in light of previous findings in the literature as well as in relation to the different orthographies of Arabic and English languages.

Keywords

Reading comprehension, Listening comprehension, Two different orthographies, First and foreign languages

Introduction

The present research examines the Arabic and English language orthographies and their effect on listening and reading comprehension among Arab learners of English as a foreign language in Israel. Arabic and English are alphabetical language systems but differ in many aspects. This research aims to focus on the difference between Arabic and English orthographies, which lies within the relationship between the sound and letters also known as orthographic depth. Therefore, this research aims to clarify how listening and reading comprehension among Arabic speakers predict the use of these two abilities in English as a foreign language. The novel aspect of this research is examining listening and reading comprehension among Arabic learners of English in relation to their different orthographies in one study. It is expected that the characteristics of English and Arabic orthographies may not affect linguistic skills, as learners with different orthographic backgrounds adapt distinct linguistic skills to learn the language. Additionally, the learners’ performance in listening and reading comprehension may be lower in English compared to Arabic, considering the distinct characteristics of Arabic and English orthographies.

By studying Arabic and English language orthographies among Arabic learners in Israel, we can better understand the process of how learners with different orthographic backgrounds learn a language. In this paper, the uniqueness of the Arabic and the English language orthographies and their features and role in listening and reading comprehension will be discussed in depth. Subsequently, the research methodology and procedure will be presented. Finally, the findings will be analyzed followed by the discussion, conclusions, and limitations of the study.

Literature Review

Few studies have investigated the role of listening and reading comprehension in the first language as a predictor of linguistic skills in another language [1,2]. Listening comprehension and reading comprehension are similar skills but constitute two distinct forms of comprehension involving different cognitive processes [3-7]. Listening comprehension depends on an understanding of a spoken language while reading comprehension depends on an understanding of a written language [8]. While reading comprehension depends on decoding skills, which are predicted by phonological awareness, listening comprehension depends on word processing and is predicted by vocabulary knowledge [9]. Aspects of language processing and skills, namely Arabic orthography, English orthography, reading comprehension, listening comprehension, transfer of skills, phonological decoding skills, spelling, morphology and vocabulary, syntax, speed of processing, orthographic knowledge, working memory, attitudes and language, will be deeply explored in order to investigate predictors of listening and reading comprehension in both Arabic and English, two different orthographies.

Arabic Orthography

The Arabic language is a Semitic language, and it has 28 letters, including six vowels: three short vowels and three long vowels [10]. The short vowels are presented by diacritic marks above or beneath the letter [11], while long vowels are represented by the following letters: “alef,” “ya,” and “waw” [12]. Short vowels in Arabic add phonological information for word decoding and thus contribute to understanding texts [13,14]. In other words, the short vowels contribute to the correct pronunciation of Arabic sounds and letters [15]. This language is read and written from right to left and is regarded as shallow orthography that exhibits a predictable relationship between letters and sounds [16]. As a result, the development of literacy skills such as reading and spelling are learned quicker than in inconsistent orthographies [17]. In addition, the Arabic language is regarded as deep orthography when unvowelized [14,18,19]. In Arabic, short vowelization contributes to reading comprehension of less complex texts, such as informative and narrative texts and newspaper articles among readers of different ages and levels [20,21] reviewed the role of vowelization in Arabic and showed that short vowelization improves reading accuracy and reading comprehension. Other studies by [13,16,22,23] proved that Arabic orthography poses an intensive visual burden and slows down reading and can be considered as deep orthography. Therefore, reading in Arabic depends on the visual orthographic representation of a word. Furthermore, Arab readers after the fourth grade are expected to learn and read unvowelized texts in which they tend to rely on sentence context [13].

It is interesting to note the phenomenon of diglossia in the Arabic language, which refers to the use of two versions: spoken Arabic and literary Arabic [13,24,25]. Spoken Arabic has various dialects, and native Arabic speakers use spoken Arabic in everyday life, but literary Arabic is used in education, writing, the Qur’an, and literature [13,22,25,26]. Spoken and literary Arabic vary considerably in terms of phonology, vocabulary, syntax, and grammar and thus affect language development and reading acquisition [11,14,15,29]. This phenomenon also affects reading and writing in Arabic as it has negative effects on phonological awareness that is associated with reading and spelling acquisition [26].

English Orthography

The English language has 26 letters, including 5 vowels and 21 consonants, and it is read and written from left to right [10]. The vowels in English are letters within the words and represent the sounds [28]. Some letters are written in a word but not pronounced as they are spelled, which is more common in English than in Arabic [26,29]. English is also an alphabetical system characterized by an indirect relationship between a letter and its sound [16]. Therefore, English is regarded as deep orthography, in which the same letter may have various sounds written differently [10,30]. For example, the grapheme-phoneme “gh” is pronounced differently in the following words “ghost,” “light,” and “tough.” As a result, the rate of reading development in English is low among children in comparison with more consistent orthographies [30,31].

Second and foreign language learners tend to use L1 linguistic skills and learning strategies to learn another language according to the language linguistic skills transfer [28,32]. Although English and Arabic are alphabetical systems, the degree of dissimilarity of their orthographic representation affects learning English as a foreign language by Arabic-speaking learners [14]. According to the orthographic depth hypothesis, in deep language orthography, semantic context (lexical) is used for word recognition, while shallow language orthography relies on the phonology for decoding words [11,10]. In the case of the Arabic language, which is a shallow orthography, Arabic-speaking learners of English rely on consonants in word decoding for word recognition [33]. However, in the English language, the corresponding spelling-to-sound is inconsistent, and thus learners must rely more on activating both phonological and orthographic processes in learning and reading [34]. A more recent study by [8] shows that in deep orthographies, word recognition is the main predictor of reading comprehension, especially in an early stage of reading development, while in shallow orthographies listening comprehension is more significant in reading comprehension in different phases of reading development.

Reading Comprehension

Scholars have widely investigated reading comprehension in first and second languages [8,15,11,35,36]. Numerous studies explored reading comprehension and demonstrated that it is a determinant of reading accuracy [8,10]. Reading comprehension of written texts is the outcome of decoding and listening comprehension [1,14,36,37]. It also refers to the ability to extract meaning from written representations of the language in order to construct new meanings by activating previous knowledge [15,25]. The two foundational skills of reading comprehension are word recognition, which refers to the ability to read individual words accurately, and listening comprehension [8]. In a more recent study, word recognition highly contributes to reading comprehension among beginner readers, and listening comprehension appears strongly to correlates with advanced readers [36]. Previous studies also found that vocabulary contributes to reading comprehension [35,37].

It is important to note that these skills of reading comprehension may function differently according to the orthographic features of the language. In shallow orthographies, learners depend more on phonology and the high consistency of the sound and letters in word recognition and word learning [11,38]. In contrast, in deep orthographies, learners must learn the complexity of the low consistency of the sound and letters in word recognition [11,38]. In addition, word recognition appears to be a predictor of reading comprehension in deep orthographies while listening comprehension appears to be a determinant predictor of reading comprehension in shallow orthographies [8]. In deep alphabetic orthographies, learners depend on increased word processing skills, such as phonetic awareness, letter-to-sound relationship, and visual representation of the word in ESL reading comprehension compared to less deep alphabetic orthographies [38].

Listening Comprehension

Listening comprehension is critical for language acquisition and reading comprehension and also has a significant role in the communication and language learning process [18,34,39]. However, unlike reading comprehension, listening comprehension has failed to attract the attention of language researchers [7,34], despite the rise of audio-visual platforms, such as TV and computers among children and adolescents. Listening comprehension refers to the ability to construct the meaning of spoken language and relate it to previous knowledge [8]. The literature review shows that the process of listening comprehension involves several key components, including word recognition, syntax, vocabulary, speed of talk, and previous knowledge that impact listening comprehension [18]. Unlike reading comprehension, the process of listening comprehension poses a major challenge for learners, as it requires rapid processing of meaning and linguistic skills, including syntax and lexical, due to the transient and temporary nature of the spoken text [36,40]. The contribution of listening comprehension to reading comprehension increases with age while decoding decreases as readers become increasingly proficient in decoding as they get older [14,34,35]. Vocabulary is the most important component of listening comprehension [7,35].

Little research has been done on listening comprehension in L1 and its role in predicting later language skills in a second language [34,36]. [39] has suggested that pre-listening activities and repetitive listening to a passage enhance listening comprehension and contribute to language proficiency among learners of Arabic as a foreign language. Because Arabic is a diglossic language, listening comprehension is reportedly affected by the spoken language as it relies on oral language [14]. Additionally, short vowels in Arabic contribute to listening comprehension across all grade levels [18]. However, the role of spoken language and listening comprehension across a variety of languages is still unclear [8].

A closer look at the literature on listening comprehension and reading comprehension, however, reveals a number of gaps and shortcomings. Therefore, this research addresses the need for an in-depth examination of the predictors of listening and reading comprehension in different orthographies among Arabic-speaking learners of English as a FL.

Transfer of Skills

Cummins’ (1991) linguistic interdependence hypothesis suggests a relationship between the first language and the learning of the second language. This relationship is indicated in the transfer of language skills, including phonological awareness, word recognition, reading comprehension, and other linguistic skills between languages [31]. This hypothesis depends on language-independent skills, such as phonology, morphology, and syntax that transfer across languages [11,34]. Studies on the role of listening comprehension and the transfer of this skill from L1 to reading comprehension in L2 are rare however [34]. Most studies have focused on language linguistics skills transfer, including reading, spelling, and phonological awareness and have neglected oral language skills transfer [2,16,34,41]. The transfer of skills across languages, either first to second\foreign language or in the opposite direction has been widely investigated by researchers [11,16,27]. In a study that investigated the transferability of phonological awareness in opposite direction, from L2 to L1, it was found that improvement in linguistic and meta-linguistic skills in a second language positively influenced similar skills in L1 [41]. It is interesting to relate that the transfer of linguistic and language skills is affected by the degree of similarity between the two languages [11,34,38]. As a result, a high degree of similarity between L1 and L2 enables the transfer of language skills, while distinct orthographic backgrounds of L1 and L2 affect decoding efficiency and word learning [42]. Despite decades of research, this issue continues to be debated regarding the transfer of linguistic skills across different languages [11,15,27,28,41].

Phonological Decoding Skills

Phonological awareness is one of the most researched basic meta-cognitive linguistic skills in language learning, and it refers to the awareness of the sound structures of language units [24,41]. Most studies, early as well as current, have demonstrated the importance of phonological awareness in predicting high performance in the reading process across languages [11,15,24]. A study of reading-disabled Arabic-English bilingual Canadian children showed that they scored higher scores in phonological tests than monolingual English-speaking children, despite the different nature of the two orthographies [28]. However, some studies have assumed that the degree of similarity of orthographic systems between L1 and L2 influence the learners’ performance in phonological decoding and word learning in L2 [42]. In another study, it was noted that differences in the orthographic background between L1 and L2 might affect phonological processing and word decoding in L2 [2]. In a recent study, an intervention program in English for improving linguistic and meta-linguistic skills in Hebrew as L1 and English as FL indicated a significant improvement in most skills, including phonological awareness from pre-intervention to post-intervention among three groups of readers: dyslexic, poor, and normal readers [10]. In short, phonological awareness is a cross-language skill; with increased exposure and practice of the target language, learners may be able to become more skilled in phonological skills [2,11].

Spelling

Spelling skills refer to the visual representation of a spoken language and depend on other language skills, such as phonology, orthography, and morphology of the target language [38,43]. Spelling involves two significant processes: phonological awareness and alphabetic knowledge that influence the ability in learning to read, write, and spell [2,44]. In a study by [33], Japanese poor readers revealed high performances in recognition tasks compared to Russian readers, due to their L1 experience with kanji (logographic Japanese writing system). Likewise, [28] proved that spelling is a cross-language correlated skill among Arabic-English disabled bilingual readers. The varying degree of orthography between languages affects the development of reading and spelling, as deep orthographies impede spelling skills compared to shallow orthographies [43]. The orthographic features of the Arabic language pose difficulties in spelling and reading among learners considering the diglossic situation and when Arabic is unvowelized [26]. More current research also has indicated that spelling needs direct instruction in the target language, supporting the fact that each language has its own orthographic rules and system [27]. Therefore, it is critical in this study to thoroughly examine spelling skills in both the Arabic and English languages.

Morphology and Vocabulary

English and Arabic have different morphological systems and features [21,22]. Arabic is a Semitic language characterized by root and pattern in which vowels determines the meaning of the word [12,16]. In contrast, English is characterized by semantic stem and morphemes (prefixes and suffixes), which allows the recognition of the meaning of the word [10]. Shallow orthographies are often complicated morphological systems while deep orthographies are less complicated [15,11]. As a result, it is assumed that it should be easier to transfer morphological skills from complex morphological systems like Arabic compared to English but the studies have proved that morphological skills are cross-language transferable [15,11]. In addition, vocabulary contributes significantly to both reading comprehension and listening comprehension [7,35]. The processing of information in listening comprehension is less focused on the vocabulary as the spoken text has a limited time frame, in contrast to reading comprehension, in which the text is permanent, allowing the reader to decode the meaning of the written text [40]. It is critical to deeply explore the role of morphology and vocabulary in predicting listening and reading comprehension both in Arabic and English and their influence among adult learners.

Syntax

Language syntax refers to the understanding of sentence structures and word order [28,35,45]. Moreover, syntax is a transferable linguistic skill across languages and contributes to improvement in both languages despite their different orthographies [11,15,41]. In a recent study, it was reported that syntax relates to reading comprehension and improvement in syntax contributes positively to reading comprehension among L2 learners of English [35]. Additional studies to better understand the role of syntax skills in language learning are needed.

Speed of Processing

The varying degree of orthography between languages affects both reading speed and comprehension [41]. In a study by [45], differences in reading were apparent among Hebrew L1 speakers when reading Hebrew and English passages. Despite Hebrew being their L1, they were more proficient in reading in English. In another study, [21,22] demonstrated that the complexity of Arabic orthography affects word identification and letter processing when compared to Hebrew. Thus, the participants demonstrated low performance in Arabic tasks in comparison to similar tasks in Hebrew. Other findings suggest that language orthography is not a direct indicator of reading comprehension levels and that reading speed is not significant in the prediction of reading comprehension. For example, a study by [6] revealed that oral comprehension is the strongest predictor of reading comprehension rather than reading speed and accuracy in Italian. Likewise, [8] suggest that listening comprehension was the best indicator of reading comprehension in comparison to oral reading fluency and word recognition in European Portuguese. Therefore, other components rather than speed seem to increase reading comprehension levels. However, the research is limited on the role of speed and its contribution to reading comprehension and listening comprehension. Thus, the speed of processing issue is still debatable and future research should be conducted.

Orthographic Knowledge

The ability to recognize written orthographic symbols of a language helps in understanding written texts or in identifying words known as orthographic knowledge [10,11,15,27]. Both Arabic and English are alphabetical orthographies, but they vary considerably in the consistency of the relationship between letters and sounds [5,29]. This variance refers to the consistency between the graphic symbol and the sound of each writing system of a language [10,29]. In other words, this variance is known as orthographic depth and has an impact on the process of reading and learning a language [5,10,11,14,30]. Orthographic depth represents the degree of sound-symbol correspondence [38]. Arabic seems to be more consistent and it is considered shallow orthography when vowelized and deep orthography when unvowelized [11,16], while English seems to be the least consistent alphabetic writing system and is considered deep orthography [16,28,30].

A large number of existing studies have examined the cross-language transfer of orthographic skills [10,11,15,16,27,28]. However, the existing research remains inconclusive on whether orthographic skills are cross-language or language-specific. Previous studies have shown that bilingual Arabic and English-speaking children performed better in pseudo-word reading and spelling tasks than monolingual English speaking children, which reflects a positive transfer from Arabic to English [28]. Recent work has proved that orthographic skills are cross-language transferable from English to Hebrew after an intervention program in English [31]. However, other studies have found that orthographic knowledge is language-specific and thus unlikely to be transferred from one language to another [16,41]. Another study also reported that orthographic knowledge is language specific and cannot be transferred from L2 to L1 among poor readers in the experiential group [11]. In addition, no significant improvement in orthographic skills both in Arabic and Hebrew was apparent after the intervention program in English L3 [15]. A more recent study confirmed that orthographic differences in languages influence the acquisition of linguistic and meta-linguistic skills, as orthographic knowledge did not show significant improvement in Hebrew following an intervention program for EFL among dyslexic, poor, and normal readers in the experimental group [10]. Therefore, it is crucial to investigate orthographic skills more extensively in order to understand their contribution and transferability across languages.

Working Memory

According to [28,45], working memory in reading refers to the capacity to retain information within the short-term memory storage while processing information. The study of bilingual Arabic-English Canadian children by [28] found that working memory is correlated across languages despite different orthographies. Furthermore, a study by [46] revealed that basic visual memory is significant in the process of reading Arabic as well as Hebrew, but not English. More recent research suggests that shallow and deep orthographies impact the performance of reading and writing as shallow orthographies are less memory dependent [43]. According to [3], short vowels in Arabic add phonology to words, which help in saving information in working memory to understand written or read aloud texts. This approach remains briefly addressed in the literature. Therefore, more research is needed on working memory skills and their contribution to learning a language in different orthographies.

Attitudes and Language Acquisition

The educational system in Israel requires the Arab minority to learn three languages in schools: Arabic as their first language, Hebrew as a second language, and English as a foreign language [16,15]. Attitudes toward language acquisition and its effect on learning Hebrew and English among the Arab minority in Israel have been widely investigated by [22,47]. Abu Rabia showed that instrumental and integrative attitudes motivate learners to learn the target language. The instrumental attitude suggests that learners learn the target language for practical reasons such as academic studies, while the integrative attitude suggests that learners identify with the target-language group and are willing to learn its language [22,47]. Many researchers claim that positive attitudes toward a language can facilitate the learning of the target language [48,49]. In addition, teachers play a significant role in developing positive attitudes toward that target language [49]. Other studies have suggested both motivation and attitude in language learning have a direct effect on learning a language [49,50]. Further research has pointed out that two types of motivation—integrative motivation and instrumental motivation—promote successful learning of the target language with emphasis on integrative motivation in maintaining long-term success [51,50]. This study is intended to examine attitudes toward learning English as a foreign language, among Arab high school students in Israel. Investigating this variable can contribute significantly to the researched topic.

Research Questions

This study has two research questions:

  1. How are listening and reading comprehension predictors in Arabic distinct from comprehension predictors in English?
  2. To what degree do language skills in Arabic predict listening and reading comprehension in English?

Both research questions are based on the literature review and the need to investigate the issue of listening and reading comprehension among native Arabic speakers in language acquisition.

Research Hypotheses

  1. Orthographic differences between Arabic and English suggest distinct predictors between listening and reading comprehension in Arabic as the first language and listening and reading comprehension in English as a foreign language.
  2. Considering the characteristics of English and Arabic orthographies, listening and reading comprehension in deep orthographies will predict lower performances.

Methodology

This section addresses the methods and research tools used. This study used the quantitative approach. The quantitative research paradigm therefore assumes that knowledge is “there,” waiting to be revealed, and it is the role of researchers to be “objective” and not to allow their attitudes, values, and beliefs to affect the research process. Epistemologically quantitative research is deductive and confirmatory (Friedman, 2013).

Research Participants

The study sample included 100 intermediate-advanced high school students (50 male students and 50 female students) aged 16-17. The selection criterion was based on a random sample from classrooms doing the four and five level unit English Bagrut (Israel’s high school matriculation exams). The sample was recruited from a high school in the northern district of Israel. All students were native Arabic speakers learning in an Arabic school, in which the teaching language is Arabic, Hebrew is learned as a second language, and English as a third language.

Research Tools

The following tests and tasks were administered (see Appendix A). All of the tests were built especially for this study except for the working memory test in Arabic and vocabulary test in English and Arabic.

1. Phonological Awareness Test in English and Arabic: Both versions were adapted from Morais, Cary, Alegria, and Bertelson (1979). Phonological awareness was tested by phoneme deletion. The participants were presented with 20 items and then asked to delete a phoneme from the beginning, the middle, or the end of a word. For example: repeat the word /jump/ without /j/. The percentage of correct responses out of the total was calculated for each participant.

2. Word Identification Test in English and Arabic: The English version was a subtest of the Woodcock Reading Mastery Test created by Woodcock (1973). Each participant was asked to read 40 words aloud in the English version and 30 words in the Arabic version (based on Arabic readers used in Arab high schools in Israel), which were listed in increasing order of difficulty. The percentage of correct responses out of the total was calculated for each participant.

3. Working Memory Test in English and Arabic: Both versions were adapted from the English version developed by Siegel and Ryan (1989). Participants were asked to fill in the missing words in sentences presented orally. Then they had to remember the words and repeat the missing words from that set in the correct order. There were a total of 12 sets of sentences (lengths ranging from 2 to 5 sentences). Examples are: In summer it is very ______, People go to see monkeys in a _______. The percentage of correct responses out of the total was calculated for each participant.

4. Orthographic Knowledge Test in English and Arabic: Both versions were adapted from the English version developed by Olson, Kliegel, Davidson, and Foltz (1985). The participants were presented with 20 homophonic pairs of words and in each pair, they were asked to mark the corrected spelled word. Examples of these pairs include /all-oll/. The percentage of correct responses out of the total was calculated for each participant.

5. Morphological Knowledge Test in English and Arabic: Both versions were inspired by Kahn-Horwitz (2006). The participants were presented with 10 sentences, and they were asked to fill in the missing word in the sentence from a list of words from the same family of words beneath each sentence in each version. For example, the boy eats (quick/ quickly/quickable). The percentage of correct responses out of the total was calculated for each participant.

6. Syntactic Judgment Test in English and Arabic: The tests appeared in Author and Sanitsky (2010) and Santiskty (2013). The participants were presented with 10 sentences and were asked to decide whether the sentence’s syntax was correct or not. For example, the girl reading a book. The percentage of correct responses out of the total was calculated for each participant.

7. Spelling Test in English and Arabic: Both versions are adapted from the English WRAT-R spelling tests (Jastak & Wilkinson, 1984). This skill was tested through dictation. The participants were asked to write down 40 words correctly in increasing levels of difficulty as they were read aloud. The list of words in English were taken from Band III core word list in the Israeli English Curriculum, such as the word /natural/. The list of words in Arabic were selected from the Arabic readers used in Arab high schools in Israel, such as the word /مبادئ/. The percentage of correct responses out of the total was calculated for each participant.

8. Reading Comprehension Test in English and Arabic: The tests appeared in Author and Sanitsky, (2010) and Sanitisky (2013). The participants were asked to read a text that was followed by 10 multiple choice comprehension questions. In the English version, the text was taken from the Bagrut examination in English (Module E) for four and five unit levels. In the Arabic version, the text was taken from the Bagrut examination in Arabic. The percentage of correct responses out of the total was calculated for each participant.

9. Listening comprehension Test in English and Arabic: Both versions were adapted from [34]. The listening comprehension in English was taken from the Bagrut examination in English (Module E) for four and five unit levels in English. The listening comprehension in Arabic was taken from a recorded TV news interview in Arabic. In both versions, the participants answered 10 multiple choice questions after they listened to passages. The percentage of correct responses out of the total was calculated for each participant.

10. Vocabulary Test in English and Arabic: Both versions were adapted from the English version of The Peabody Picture Vocabulary Test, (3rd edition) developed by Dunn and Dunn (1997). The vocabulary task measured receptive vocabulary. The students were shown four different pictures and were asked to point at the one matching the target word. For example, when the students heard the word bell, they had to point at the picture that matches the word they heard. The percentage of correct responses out of the total was calculated for each participant.

11. Speed Test in English and Arabic (for listening): The test consisted of three parts with three different texts in each part. The first part was quick reading, the second part was medium-paced reading, and the third was slow reading. In each part, the students were asked to answer 10 multiple-choice questions. In the English version, the audios were taken from the Bagrut examination in English (Module E) for four and five unit levels. In the Arabic version, the audio was taken from a recorded TV news interview in Arabic The percentage of correct responses out of the total was calculated for each participant.

12. Attitudes toward the Language and Target Group: The test appeared in [23] The participants were asked to answer a questionnaire which tested a few constructs, such as integrative motivation: indoor integrativeness and outdoor integrativeness, instrumental motivation, and attitude toward the learning situation in class. Statements were asked about each construct and participants were expected to answer on a five levels Likert scale of 1 (strongly disagree) and 5 (strongly agree). The reliability was reported α= .86 which indicates a high reliability.

Research Procedure

The participants were tested in the school that they attended during the school day. Participants were tested individually and collectively by the researcher in quiet rooms. Some tests were carried out collectively like orthographic knowledge, morphological knowledge, syntactic judgment, spelling, reading comprehension, listening comprehension, speed, attitudes toward the language and target group, while other tests were carried out individually. All instructions were given in Arabic, L1. The testing was held in two sessions for each student. Each session lasted between 50-60 minutes. In each session, all tests were given in one of the two languages. The tests were administered in the following order: phonological awareness, word identification, working memory, orthographic knowledge, morphological knowledge, syntactic judgment, spelling, reading comprehension, listening comprehension, vocabulary, speed, and attitudes toward the language and target group.

Data Analysis

Descriptive statistics were calculated for all variables involved in this study (averages, standard deviations, ranges, in addition to Skewness and Kurtosis indices). In the next stage, correlations indices (Pearson’s correlation coefficient) within and across languages were conducted to analyze the relationships between variables in this study. Next, an analysis of variance using ANOVA/ Multivariate linear regression analysis was performed to determine whether there were significant differences between Arabic and English tests and which variables were important predictors of listening and reading comprehension in Arabic as the first language and listening for comprehension in English as a Foreign Language.

Results

In the first stage, the descriptive values will be given to the research variables, and in the second stage, the research hypotheses will be answered. The descriptive statistics for all variables involved in this study are presented in Table 1.

Table 1: ANOVA Test and Descriptive statistics between research groups: dyslexic, chronological age-matched group and reading level matched group.

A-Normal Readers-CA B-Dyslexic Students C-RL Controls F η²
M S.D. M S.D. M S.D.
Reading ability


reading vowelized words 33.60 4.40 12.50 3.22 11.23 2.67 385.005*** .898

reading un-vowelized words

32.97 4.95 14.33 3.01 12.47 2.08 305.120*** .875
  Working Memory


12.63 1.94 4.17 1.23 3.48 1.33 328.911*** 0.884
  Orthographic processing


orthographic processing 89.00 7.38 72.13 7.62 64.38 10.04 66.320*** 0.607
  orthographic processing time (Sec.) 399.40 68.94 451.53 87.60 465.21 70.76 6.155*** 0.125
  Phonological awareness


phonological awareness 1 13.79 3.49 4.27 2.57 4.45 1.45 122.356*** 0.744
  phonological awareness 2 time 146.71 51.16 158.50 28.98 161.55 29.82 1.222 0.028
  phonological awareness 3 13.32 4.94 4.93 1.91 4.62 2.50 62.046*** 0.596
morphological awareness


29.45 9.62 11.27 8.22 7.64 3.23 70.778*** 0.622
morphological judgment 19.73 0.64 16.53 2.74 16.69 2.85 18.265*** 0.298
  Pseudo word decoding


pseudo word decoding 21.27 2.70 9.93 3.02 9.69 2.47 173.721*** 0.802
  pseudo decoding time (sec.) 96.57 33.03 158.33 27.62 162.93 22.30 51.999*** .0547
  Spelling 20.43 2.81 11.43 4.41 11.41 5.20 44.792*** 0.510
  RAN Errors


RAN numbers L2 Error 0.03 0.18 0.21 0.56 0.10 0.31 1.536 0.035
  RAN letters L5 Error 0.37 0.85 0.62 0.82 0.66 1.42 0.649 0.015
  RAN objects L7 Error 0.37 0.85 0.79 0.86 0.66 0.72 2.116 0.047
  RAN colors L9 Error 0.53 0.73 0.86 1.03 0.86 1.19 1.076 0.025
  RAN Time


RAN numbers L2 Error 28.77 9.19 29.00 5.50 32.55 4.28 2.956 0.064
  RAN letters L5 Error 36.47 8.65 40.03 7.70 42.10 10.11 3.062 0.066
  RAN objects L7 Error 47.20 8.06 44.77 6.01 47.45 5.87 1.444 0.032
  RAN colors L9 Error 47.83 10.61 50.23 8.36 53.62 7.89 3.041 0.066

***p<.001

Testing the Study’s Hypotheses

Hypothesis 1

The first hypothesis was that orthographic differences between Arabic and English would suggest distinct predictors between listening and reading comprehension in Arabic as the first language and listening and reading comprehension in English as a foreign language. To test this hypothesis, in the first stage, we examined the correlation between the variables by using the Pearson coefficient. The coefficient correlation (Table 2) was calculated between the scores of reading comprehension, and listening comprehension with all the other linguistic skills, each separately, once within the Arabic language and another within the English language. The results indicate a statistically significant difference between the two languages.

Table 2: ANOVA Test and Descriptive statistics between level’s RAN tasks

numbers letters objects colors F η²
M


S.D. M


S.D. M


S.D. M


S.D.
RAN errors by task type.


RAN Error .11 .38 .55 1.06 .60 .82 .75 1.00 11.545*** 0.120
RAN time by task type.


RAN Time 30.08 6.83 39.51 9.07 46.46 6.76 50.53 9.25 239.362*** 0.736

***p<.001

Table 2 shows the correlation coefficient between reading comprehension and listening comprehension, with Arabic/English Skills (variables), within every language. It shows that reading comprehension skills in both Arabic and English had a positive and significant correlation and had weak-medium intensity (.22, .35, respectively), with the phonological awareness skills. Also, listening comprehension skills in both Arabic and English were positively and significantly correlated and had weak-medium intensity (.26, .31, respectively), with the phonological awareness skills.

Reading comprehension in Arabic had no significant correlation with orthographic knowledge in Arabic, while the reading comprehension in English had a positive correlation, with weak intensity (.25), with orthographic knowledge in English. In contrast, listening comprehension skill in both Arabic and English had a positive and significant correlation and a weak-medium intensity (.22, .4, respectively), with the orthographic knowledge skills.

Reading comprehension in Arabic had no significant correlation with morphological knowledge in Arabic, while the reading comprehension in English had a positive correlation, with medium intensity (.53), with morphological knowledge in English. In contrast, the listening comprehension skills in both Arabic and English had a positive and significant correlation and a weak-medium intensity (.20, .52, respectively), with the morphological knowledge skills.

Reading comprehension skills in both Arabic and English had a positive and significant correlation and has weak-medium intensity (.25, .51, respectively), with the syntactic judgment skills. In contrast, listening comprehension in Arabic had no significant correlation with syntactic judgment in Arabic, while listening comprehension in English had a positive correlation, with weak intensity (.25), with syntactic judgment in English.

Reading comprehension skills in both Arabic and English had a positive and significant correlation and has weak-medium intensity (.24, .51, respectively), with the spelling skills. Also, listening comprehension skills in both Arabic and English was positively and significantly correlated and had weak-medium intensity (.21, .37, respectively), with the spelling skill.

Reading comprehension skills in both Arabic and English had no significant correlation with vocabulary skills. In contrast, listening comprehension in Arabic had no significant correlation with vocabulary in Arabic, while listening comprehension in English had a positive correlation, with weak intensity (.25), with vocabulary in English.

Reading comprehension skills in both Arabic and English had a positive and significant correlation and a weak-medium intensity (.22, .55, respectively), with the speed (0.75) skills. Also, listening comprehension skills in both Arabic and English had a positive and significant correlation and strong intensity (.74, .94, respectively), with the speed (0.75) skills.

Reading comprehension in Arabic had no significant correlation with speed (1.25) in Arabic, while reading comprehension in English had a positive correlation, with medium intensity (.44) with speed (1.25) in English. In contrast, the listening comprehension skills in both Arabic and English had a positive and significant correlation and a strong intensity (.89, .92, respectively), with the speed (1.25) skill.

Lastly, we should mention that listening and reading comprehension skills in both Arabic and English did not have any significant correlation with the word identification skills, working memory skills, and attitudes toward the English language.

In the second stage, the relationship between the variables was tested by adjusting multiple linear regression using the Stepwise method, to predict reading comprehension and listening comprehension skills in Arabic/English by skills in Arabic/English, respectively, as predictors. In other words, this stage sought to predict reading comprehension and listening comprehension skills in Arabic based on the other skills in the Arabic language, and then reading comprehension and listening comprehension skills in English based on the other skills in the English language as predictors.

The first dependent variable examined was reading comprehension. Table 3 contains the parameter estimates of the predictor’s variables—all the significant linguistic skills within every language.

Table 3: ANOVA Test and Descriptive statistics for reading time between research groups: dyslexic, chronological age matched group and reading level matched group.

A-Normal Readers-CA B-Dyslexic Students C-RL Controls F η²
M


S.D. M


S.D. M


S.D.
Speed of processing in reading (Time).


orthographic awareness E time (Sec.) 399.00 70.79 451.53 87.60 465.21 70.76 5.855*** 0.122
phonological awareness F time 146.71 51.16 158.50 28.98 161.55 29.82 1.222 0.028
pseudo decoding time (sec.) 96.68 33.98 158.33 27.62 162.93 22.30 48.661*** .0537
average time (sec.) 214.13 30.44 256.12 34.64 263.23 32.33 18.873*** 0.310

Table 3 shows that Phonological awareness and spelling skills in Arabic were significant (p<0.05) predictors of reading comprehension in Arabic. The predictors positively affected Reading comprehension in Arabic and were able to explain about 17% of the variance of reading comprehension in Arabic.

In Contrast, speed (0.75), syntactic judgment, and spelling skills in English were significant (p<0.05) predictors for reading comprehension in English. The predictors positively affected reading comprehension in English and were able to explain about 50% of the variance of reading comprehension in English.

The second dependent variable examined was listening comprehension. Table 3 contains the parameter estimates of the predictor’s variables—all the significant linguistic skills within every language.

Table 3 shows that Phonological awareness and orthographic knowledge skills in Arabic were significant (p<0.05) predictors for listening comprehension in Arabic. Both positively affected the listening comprehension in Arabic and were able to explain about 10% of the variance of listening comprehension in Arabic.

In contrast, morphological knowledge, orthographic knowledge, word identification, and spelling skills in English were significant (p<0.05) predictors for listening comprehension in English. All positively affected listening comprehension in English and were able to explain about 36% of the variance of listening comprehension in English.

In conclusion, a comparison of the predictors for reading comprehension in Table 3 shows that only the predictor of spelling was common between the two languages, while the other predictors for reading comprehension were different.

A comparison of the predictors for listening comprehension in Table 3 shows that only the predictor of orthographic knowledge is common between the two languages, while the other predictors for listening comprehension are not identical.

Accordingly, the first hypothesis is partially confirmed.

Hypothesis 2

The second hypothesis was that the characteristics of English and Arabic orthographies would predict lower performances in listening and reading comprehension in deep orthographies.

To examine this hypothesis, in the first stage, the correlation between the variables was tested using the Pearson coefficient. The coefficient correlation (Table 4) was calculated between the scores of reading comprehension, and listening comprehension in English, with the Arabic language skills. The results indicate that most skills in Arabic are statistically significance in terms of both reading comprehension and listening comprehension in English, except for the predictor of orthographic knowledge in Arabic.

Table 4: ANOVA Test and Descriptive statistics for general reading ability between research groups: dyslexic, chronological age matched group and reading level matched group.

A-Normal Readers-CA B-Dyslexic Students C-RL Controls F η²
M


S.D. M


S.D. M


S.D.
General reading ability scores.


reading ability-general (0-106) 90.13 10.47 35.13 5.93 31.73 4.18 595.839*** .932
working memory-general 12.63 1.94 4.17 1.23 3.48 1.33 328.911*** 0.884
orthographic awareness general 89.00 7.38 72.13 7.62 64.38 10.04 66.320*** 0.607
phonological awareness general 27.11 7.61 9.20 3.80 9.07 2.70 117.764*** 0.737
morphological awareness general 49.18 10.03 27.80 9.46 24.33 5.17 74.046*** 0.633
pseudo word decoding 21.27 2.70 9.93 3.02 9.69 2.47 173.721*** 0.802
spelling 20.43 2.81 11.43 4.41 11.41 5.20 44.792*** 0.510

Table 4 shows the correlation coefficient between Reading comprehension and listening comprehension in English, with Arabic skills (variables). Table 4 shows that reading comprehension and listening comprehension skills in English had a positive and significant correlation and a medium intensity (.33, .31, respectively), with the phonological awareness skills.

Reading comprehension in English had no significant correlation with orthographic knowledge in Arabic while listening comprehension in English had a positive correlation and a weak intensity (.25), with orthographic knowledge in Arabic.

Also, reading comprehension and listening comprehension skills in English had a positive and significant correlation and a medium intensity with syntactic judgment (.36, .28, respectively), spelling (.41, .24, respectively), reading comprehension (.67, .45, respectively), listening comprehension (.39, .46, respectively), speed (0.75) (.39, .36, respectively), speed (1.25) (.32, .41, respectively).

Lastly, we should mention that the reading comprehension and listening comprehension skills in English had no significant correlation with any variables of word identification, working memory, morphological knowledge, and vocabulary.

In the second stage, to examine this hypothesis, we used adjusting multiple linear regression using the Stepwise method, to predict English language skills (reading comprehension and listening comprehension) by language skills (variables) in Arabic as predictors.

The first dependent variable examined was reading comprehension. Table 5 contains the parameter estimates of the predictor’s variables—all the significant linguistic skills in the Arabic language.

Table 5: Pearson correlation results between the variables measured in the study

1 2 3 4 5 6 7
1. phonolory_reading_ability_general
2. working_memory_general .938**
3. orthographic_awareness_general .770** .705**
4. phonological_awareness_general .894** .836** .664**
5. morphological_awareness_general .821** .800** .650** .756**
6. pseudo_word_decoding_general .927** .861** .758** .853** .782**
7. Spelling_general .753** .692** .816** .716** .643** .784**
8. RAN_general -.268* -.203 -.282** -.285** -.224* -.275** -.356**

**p<0.01 *p<0.05

Table 5 shows that reading comprehension, speed (0.75), spelling, and syntactic judgment skills in Arabic were significant (p<0.05) predictors of reading comprehension in English. The predictors positively affected reading comprehension in English and were able to explain about 58% of the variance of reading comprehension in English.

The second dependent variable examined is listening comprehension. Table 5 contains the parameter estimates of the predictor’s variables—all the significant linguistic skills in the Arabic language.

Table 5 shows that listening comprehension and reading comprehension skills in Arabic were significant (p<0.05) predictors of listening comprehension in English. The predictors positively affected listening comprehension in English and were able to explain about 34% of the variance of listening comprehension in English.

In conclusion, the Arabic skills predictors for reading comprehension in English (Table 5) are reading comprehension, speed (0.75), spelling, and syntactic judgment skills. In contrast, the Arabic skills predictors for listening comprehension in English (Table 5) are listening comprehension and reading comprehension skills. Accordingly, the second hypothesis is confirmed.

In summary, the results showed that the first hypothesis was partially confirmed. While it was hypothesized that orthographic differences between Arabic and English suggested distinct predictors between listening and reading comprehension in Arabic and listening and reading comprehension in English, spelling was a common predictor between the two languages in reading comprehension, and orthographic knowledge was a common predictor between the two languages in listening comprehension. The second hypothesis was confirmed: Considering the characteristics of English and Arabic orthographies, listening and reading comprehension in deep orthographies predicted lower performances.

Discussion

The main goal of the current research was to investigate how listening and reading comprehension among native Arabic speakers predict the use of Arabic and English language orthographies in learning English as a foreign language (FL) in Israel. The novel aspect of this research is examining listening and reading comprehension among Arabic learners of English in relation to their different orthographies in a single study. The existing research has many problems in representing predictors of listening and reading comprehension in Arabic as the first language and English as a foreign language concerning their distinct orthographies. Previous studies showed mixed results concerning the role of language orthography in listening and reading comprehension. In an attempt to fill the gap, this study presents an analysis of significant differences between Arabic and English tests and the variables that are important predictors of listening and reading comprehension in Arabic as the first language and listening for comprehension in English as a foreign language.

According to the research findings, the first research hypothesis was partially confirmed, meaning that that only the predictor of spelling is common between the two languages, and the other predictors for reading comprehension are different. Phonological awareness in Arabic is a significant predictor of reading comprehension in Arabic, while speed (0.75) and syntactic judgment in English are significant predictors of reading comprehension in English. These findings are in line with previous studies that reported that in shallow orthographies, learners depend more on phonology in word decoding and word learning (Author et al., 2013; 10; Jiang, 2017). In addition, the development of literacy skills such as reading and spelling are learned more quickly in consistent orthographies when compared to inconsistent orthographies (Caravolas et al., 2012). Regarding the predictors of reading comprehension in English, speed (0.75) indicates a significant predictor of reading comprehension in English, suggesting that slower reading in listening comprehension contributes to better performance in reading comprehension in English. Regarding syntactic judgment, the findings are in accordance with previous studies that suggest that syntax relates to reading comprehension, and improvement in syntax contributes positively to reading comprehension among L2 learners of English (Gottardo et al., 2018).

Furthermore, only the predictor of orthographic knowledge is common between the two languages, while the other predictors for listening comprehension are not identical. Phonological awareness in Arabic predicts listening comprehension in Arabic, while morphological knowledge, word identification, and spelling predict listening comprehension in English. This aligns with the previous studies that showed that the varying degree of orthography between languages affects the development of reading and spelling, as deep orthographies impede spelling skills compared to shallow orthographies (Andreou, 2016). In addition, word recognition highly contributes to reading comprehension among beginner readers while listening comprehension appears to be strongly related to advanced readers (Babayiğit & Shapiro, 2020). Furthermore, shallow orthographies are often complicated morphological systems while deep orthographies are less complicated (Author & Shakkour, 2014; Author et al., 2013). These findings on the differences between Arabic and English predictors of listening and reading comprehension in Arabic and listening and reading comprehension in English shed light on the fact that learners with different orthographic backgrounds adapt distinct linguistic skills to learn the language. In addition, the transfer of linguistic and language skills is affected by the degree of similarity between the two languages (Author et al., 2013; 34,38]. Therefore, the results of the current study prove that distinct orthographic backgrounds of L1 and L2 influence the use of language skills in listening and reading comprehension in both languages.

The second research hypothesis was fully confirmed, meaning that the Arabic skills predictors for reading comprehension in English are different from the Arabic skills predictors for listening comprehension in English. Reading comprehension, speed (0.75), spelling, and syntactic judgment skills in Arabic are significant predictors of reading comprehension in English. However, listening comprehension and reading comprehension skills in Arabic are significant predictors of listening comprehension in English. These results are in line with previous studies that showed that listening comprehension and reading comprehension are similar skills but constitute two distinct forms of comprehension involving different cognitive processes (Author 2019a; Diakidoy et al., 2005; Taha, 2016; Tobia & Bonifacci, 2015; Wolf et al., 2019). Moreover, the Arabic predictors of listening and reading comprehension in English demonstrate that due to the orthographic background differences between Arabic and English, learners had to use distinct skills in their L1 in order to perform well in English.

Conclusion

The present study explored to what extent first language skills predict listening and reading comprehension in English and to what degree the predictors of listening and reading comprehension in Arabic are distinct from listening and reading comprehension predictors in English. The findings of the study proved that the performance of listening and reading comprehension in the two languages is affected by the different orthographic system of each language. Additionally, these findings add to the body of literature of high school Arabic learners of English as a foreign language.

The present study has some significant empirical and instructional recommendations regarding the teaching and learning of English as a foreign language for Arabic speakers. Firstly, the different orthographies of the Arabic and English languages should be taken into consideration in teaching English as foreign language among native speakers of Arabic. Secondly, teaching Arabic should focus on phonological awareness, orthographic knowledge, and spelling skills for better performance in listening and reading comprehension in Arabic. Thirdly, teaching English should focus on speed, syntactic judgment, morphological knowledge, word identification, orthographic knowledge and spelling skills for better performance in listening and reading comprehension in English. It was crucial to conduct such research as limited attention has been given to listening and reading comprehension in language acquisition in the context of their different orthographies. The main contributions of this study are understanding the difficulties that students might face in learning Arabic and English as high school learners and reconsidering the teaching of Arabic and English in relation to their different orthographies.

Limitations and Future Research

The present study has few limitations that should be taken into consideration and in interpreting the results. One of the limitations of this study is the sample prevents generalization. The sample concerns a specific group of a limited number of students belonging to a certain age group and background. Another limitation of this study is the use of constructed assessments for assessing the language skills in Arabic and English, as standardized measures for assessing these skills among high school aged native Arabic speakers’ learners of English as a third language are unavailable. Despite these limitations, the present study expands the existing knowledge in the field of language education. Future studies should include a larger sample of participants from different backgrounds and ages. Further, validated measures for assessing language skills should be included.

References

  1. Edele A, Stanat P (2016) The role of first-language listening comprehension in second-language reading comprehension. Journal of Educational Psychology 108(2): 163-180.
  2. Sparks RL, Patton J, Ganschow L, Humbach N, et al. (2008) Early first-language reading and spelling skills predict later second-language reading and spelling skills. Journal of Educational Psychology 100(1): 162-174.
  3. Author S (2019a)
  4. Diakidoy IAN, Stylianou P, Karefillidou C, Papageorgiou P (2005) The relationship between listening and reading comprehension of different types of text at increasing grade levels. Reading Psychology 26(1): 55-80.
  5. Taha H (2016) Deep and shallow in Arabic orthography: New evidence from reading performance of elementary school native Arab readers. Writing Systems Research 8(2): 133-142.
  6. Tobia V, Bonifacci P (2015) The simple view of reading in a transparent orthography: The stronger role of oral comprehension. Reading and Writing 28(7): 939-957.
  7. Wolf MC, Muijselaar MM, Boonstra AM, de Bree EH (2019) The relationship between reading and listening comprehension: shared and modality-specific components. Reading and Writing 32(7): 1747-1767.
  8. Cadime I, Rodrigues B, Santos S, Viana FL, et al. (2017) The role of word recognition, oral reading fluency and listening comprehension in the simple view of reading: a study in an intermediate depth orthography. Reading and Writing 30(3): 591-611.
  9. Tobia V, Bonifacci P (2015) The simple view of reading in a transparent orthography: The stronger role of oral comprehension. Reading and Writing 28(7): 939-957.
  10. Feder L, Author S (2020) An examination of differences in linguistic and meta-linguistic skills in English (FL) and Hebrew (L1): English intervention program for dyslexic, poor and normal readers. The Journal of Educational Research 113(3): 226-243.
  11. Author S, Shakkour W, Siegel L (2013)
  12. Author S, Hijjazi E (2020)
  13. Author S (2019b)
  14. Asadi IA, Khateb A, Shany M (2017) How simple is reading in Arabic? A cross‐sectional investigation of reading comprehension from first to sixth grade. Journal of Research in Reading 40(S1): S1-S22.
  15. Author S, Shakkour W (2014)
  16. Author S, Siegel LS (2003)
  17. Caravolas M, Lervåg A, Mousikou P, Efrim C, et al. (2012) Common patterns of prediction of literacy development in different alphabetic orthographies. Psychological Science 23(6): 678-686.
  18. Author S (2019a)
  19. Author S (2019b)
  20. Author S, Hijjazi E (2020)
  21. Ibrahim R, Eviatar Z, Aharon-Peretz J (2002) The characteristics of Arabic orthography slow its processing. Neuropsychology 16(3): 322-326.
  22. Author S (1998)
  23. Taha H (2016) Deep and shallow in Arabic orthography: New evidence from reading performance of elementary school native Arab readers. Writing Systems Research 8(2): 133-142.
  24. Asadi IA, Author S (2019) The impact of the position of phonemes and lexical status on phonological awareness in the diglossic Arabic language. Journal of Psycholinguistic Research 48(5): 1051-1062.
  25. Al-Janaideh R, Hipfner-Boucher K, Cleave P, Chen X (2021) Contributions of code-based and oral language skills to Arabic and English reading comprehension in Arabic-English bilinguals in the elementary school years. International Journal of Bilingual Education and Bilingualism 25(7): 1-16.
  26. Hussien AM (2014) The effect of learning English (L2) on learning of Arabic literacy (L1) in the primary school. International Education Studies 7(3): 88-98.
  27. Andreou G, Segklia M (2019) Cross‐linguistic skills transfer from the second/foreign language to the first among students with learning disabilities after an intervention program in the second language. Creative Education 10(5): 1023-1036.
  28. Author S, Siegel LS (2002)
  29. Miller RT (2019) English orthography and reading. In J.I. Liontas (Ed. ): The TESOL Encyclopedia of English Language Teaching 1(7)
  30. Caravolas M, Lervåg A, Defior S, et al. (2013) Different patterns, but equivalent predictors, of growth in reading in consistent and inconsistent orthographies. Psychological Science 24(8): 1398-1407.
  31. Feder L, Author S (2022) Cognitive Retroactive Transfer of Language Skills from English as a Foreign Language to Hebrew as the First Language. Journal of Learning Disabilities 55(3): 213-228.
  32. Author S, Siegel LS (2002)
  33. Wade‐Woolley L (1999) First language influences on second language word reading: All roads lead to Rome. Language Learning 49(3): 447-471.
  34. Edele A, Stanat P (2016) The role of first-language listening comprehension in second-language reading comprehension. Journal of Educational Psychology 108(2): 163-180.
  35. Gottardo A, Mirza A, Koh PW, et al. (2018) Unpacking listening comprehension: The role of vocabulary, morphological awareness, and syntactic knowledge in reading comprehension. Reading and Writing 31(8): 1741-1764.
  36. Babayiğit S, Shapiro L (2020) Component skills that underpin listening comprehension and reading comprehension in learners with English as first and additional language. Journal of Research in Reading 43(1): 78-97.
  37. Goodwin AP, Petscher Y, Tock J (2020) Morphological supports: Investigating differences in how morphological knowledge supports reading comprehension for middle school students with limited reading vocabulary. Language, Speech, and Hearing Services in Schools 51(3): 589-602.
  38. Jiang X (2017) Lower-level processing skills in English-as-a-second-language reading comprehension: Possible influence of first language orthography. Studies in English Language Teaching 5(3): 2329-3111.
  39. Elkhafaifi H (2005) The effect of pre listening activities on listening comprehension in Arabic learners. Foreign Language Annals 38(4): 505-513.
  40. van Zeeland H, Schmitt N (2013) Lexical coverage in L1 and L2 listening comprehension: The same or different from reading comprehension? Applied Linguistics 34(4): 457-479.
  41. Author S, Bluestein-Danon D (2012)
  42. Hamada M, Koda K (2008) Influence of first language orthographic experience on second language decoding and word learning. Language Learning 58(1): 1-31.
  43. Andreou G (2016) Dyslexia and spelling in two different orthographies (Greek vs. English): a linguistic analysis. Journal of Advances in Linguistics 7(1): 1172-1192.
  44. Sipra M (2013) Impact of English orthography on L2 acquisition. English Language Teaching 6(3): 116-124.
  45. Author S (2)
  46. Author S, Share D, Mansour MS (2003)
  47. Author S (2003)
  48. Elyildirim S, Ashton S (2006) Creating positive attitudes towards English as a foreign language, English Teaching Forum 44(4): 2-21.
  49. Gömleksiz MN (2010) An evaluation of students’ attitudes toward English language learning in terms of several variables. Procedia-Social and Behavioral Sciences 9: 913-918.
  50. Oroujlou N, Vahedi M (2011) Motivation, attitude, and language learning. Procedia-Social and Behavioral Sciences 29: 994-1000.
  51. Ghazvini SD, Khajehpour M (2011) Attitudes and motivation in learning English as second language in high school students. Procedia-social and Behavioral Sciences 15: 1209-1213.
Advancing Mind Genomics: Using AI (Artificial Intelligence) to Generate Topics, Questions, Messages as Answers, and ‘Synthesized’ Minds (Respondents)

DOI: 10.31038/PSYJ.2023581

Abstract

AI created a resource bank of statements about what a doctor might say to a child in order to deal with the child’s obesity. After the AI generated messages were developed, 16 of the messages (elements) were selected and combined into vignettes according to an underlying experimental design, whose specific combinations differed for each ‘respondent’. Each set of 24 vignettes comprised a stand-alone set of combinations and were evaluated by AI prompted to act as a specific person in the medical world (receptionist, doctor with 10 years of experience, nurse practitioner). Deconstruction of the ratings by regression showed the contribution of each AI created message to the rating scale. The coefficients ‘made sense’ when the regression was done according to ‘WHO’ the AI was defined to be. Further clustering the coefficients across the respondents revealed two clearly different mind-sets. The systematic approach using AI as both the provider of ideas and the evaluator of these ideas presents a new vista for learning about how to communicate with people, using technology to dramatically accelerate and fine-tune that learning.

Introduction

It is hard to overestimate the excitement with which AI, artificial intelligence, has been greeted and adopted, especially since the introduction of Chat GPT, and associated technology [1]. One can scarcely read of any topic of huma endeavor without one or another pundit bringing up the impact of AI for that field. This paper looks at the potential of AI to synthesize ‘respondents’, with the goal of accelerating the learning of professionals who want to learn to counsel people in nutritional health. The use of synthesized people, personas, is not new, and has been a topic of interest for some decades now [2-4]. What is new is the vision of moving beyond personas derived from large scale studies to one-off studies created entirely by synthetic means.

This paper combines AI with Mind Genomics to develop a new system for training and education. The underlying vision is to accelerate knowledge development by having the AI provide topic-relevant ideas (Idea Coach in Mind Genomics), and then ‘personas’ created by artificial intelligence, based upon combinations of features of the way people think, who the people are etc.. The raw material for these personas come from ‘self-profiling classification questions’ that a researcher might ask a human respondent. In short, the paper presents a Mind Genomics study, with the materials, from beginning end under the control of the machine, not the researcher. All the researcher does is select ideas at the very start of the study, these ideas later being tested in the study itself.

The process of Mind Genomics begins with a series of questions, those questions telling a story, and then for each question provide four different answers. The actual experiment consists of combining these answers into small combinations of 2-4 answers, at most one answer from a question, but often no answer from a question. The 24 combinations, called vignettes, are evaluated by respondents. Each respondent evaluates a set of 24 different vignettes, the uniqueness of the sets of 24 vignettes ensured by a permutation algorithm [5]. The analysis, done by OLS, ordinary least squares regression, shows through the coefficients of a linear equation the degree to which the 16 elements, viz., answers to the question, drive the respondent’s rating.

During the evolution of Mind Genomics, a process taking place for more than 30 years, since its introduction in 1993 [6-8], the consistently hardest part of any effort, basic research or applied research, was developing the questions, and to a far lesser degree coming up with the answers to the questions. More than one study ended up being aborted simply because the researcher could not generate the four questions which tell the story. Once the four questions were developed, for the most part, researchers were able to push through to the four answer for that question. A solution to the issue of frustration in the creation of questions and answers emerged with the incorporation of AI into the process.

A third problem, motivating people, respondents, to participate, proved to be simple to solve because of the emergence of companies which provided paid panelists. Money solved the problem of participation, if not motivation. This paper will deal with the introduction of synthesized respondents, to reduce cost, and to facilitate new types of systematized investigations not possible before.

Mind Genomics requires systematized thinking about a topic, an ability that all too often needs to be learned through coaching. It was to provide this coaching that the original AI was introduced in mind-year, 2023, in the form of Idea Coach. This paper focuses on the further introduction of AI ‘synthesized respondents’, in an effort to make the Mind Genomics process a streamlined one, from beginning to end, appropriate for teaching as well as for practical application.

Explicating the Process-Part 1-Setting Up the Study Using AI

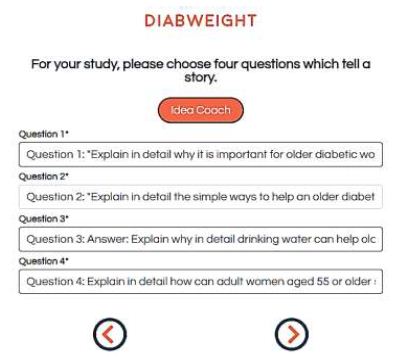
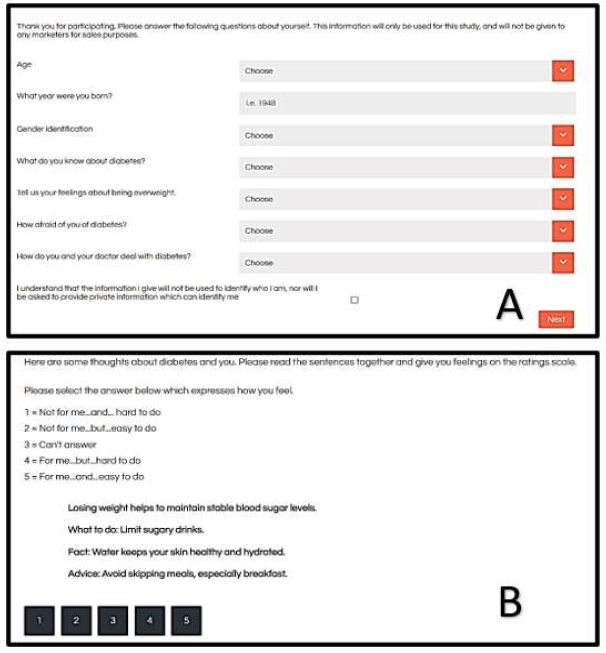
Figure 1 (Panel A) shows the request by the Mind Genomics set-up ‘template’ for the four questions, each to be addressed by four answers. It is the development of these four questions which become a difficult hurdle. The creation of the Idea Coach allows this topic to be addressed. Figure 1 (Panel B) shows the rectangle where the researcher can write out the question. The question posed to AI through Idea Coach is very simple: I am a doctor treating obesity in children. How do I talk to the children to make them understand. One could further fine-tune the Idea Coach by telling it to explicate the question in discussion form, as well as to provide questions of length 15 words or less, and questions understandable to a 12-year-old. Those statements become part of the query. The actual process is made as simple as possible so that the effort focuses on the topic.

fig 1

Figure 1: The templated screens requesting the researcher to provide four questions. Panel A shows the request for four questions which tell a story Panel B shows the rectangle inside which the researcher can describe the topic, and from which the Idea Coach returns with 15 questions. The actual text of the request is: I am a doctor treating obesity in children. How do I talk to the children to make them understand?

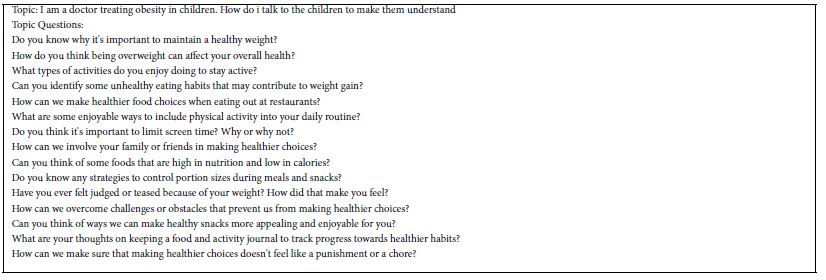
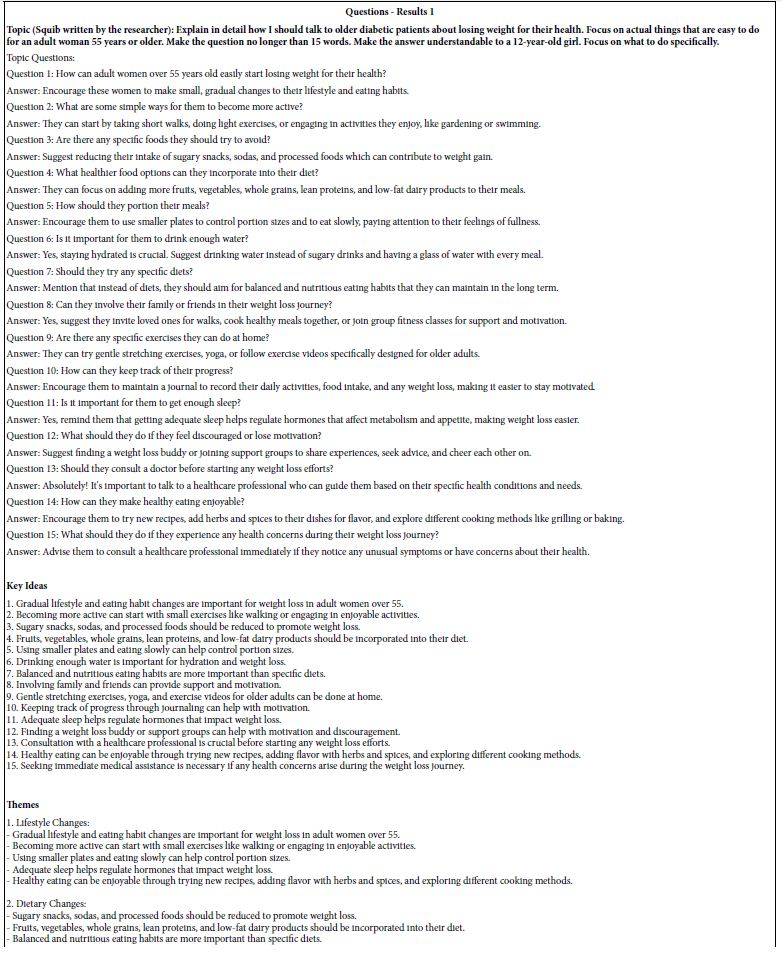
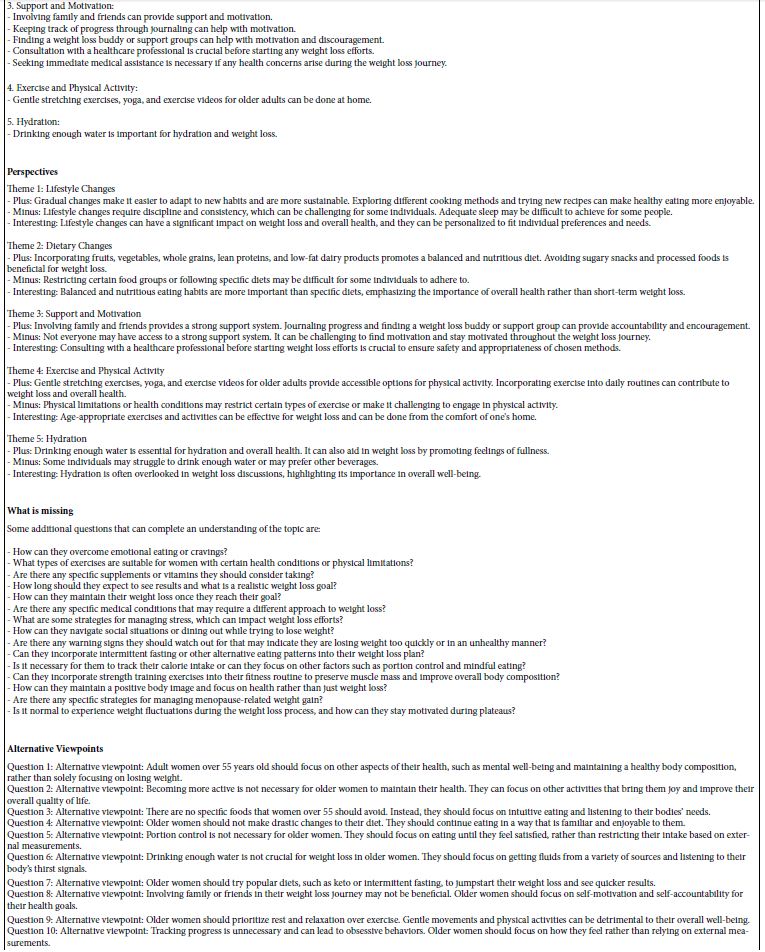
The actual short description appears as the topic in Table 1. The Idea Coach was run three times to generate a reservoir of questions. The Idea Coach is typically run 5-10 times, providing information which ends up teaching the researcher. The Idea Coach is also run several times for each of the four questions. The combination of different sets of 15 questions for a topic description and different sets of 15 answers for each question provides a unique resource booklet on the topic. Each iteration in Idea Coach lasts about 20 seconds, so that in five minutes one can produce 15 sets of 15 questions each. In the end, only four questions will be chosen.

The results from the first 15 questions appear in Table 1. The questions emerging from the AI embedded in Idea Coach are easily understood by a human being.

Table 1: Questions emerging from the Idea Coach which address the topic. The topic is provided by the researcher

tab 1

After the researcher receives the various sets of 15 questions, the next task is for the researcher to provide four questions. These questions can be taken from those suggested by the AI, either ‘as is’ or edited to tailor the ‘language’ and ‘style’ of the answer. The researcher may also contribute questions. Quite often the questions shown in Table 1 have to be modified, not so much for the respondent who never sees the questions, but rather for the AI to provide the proper format of the answer.

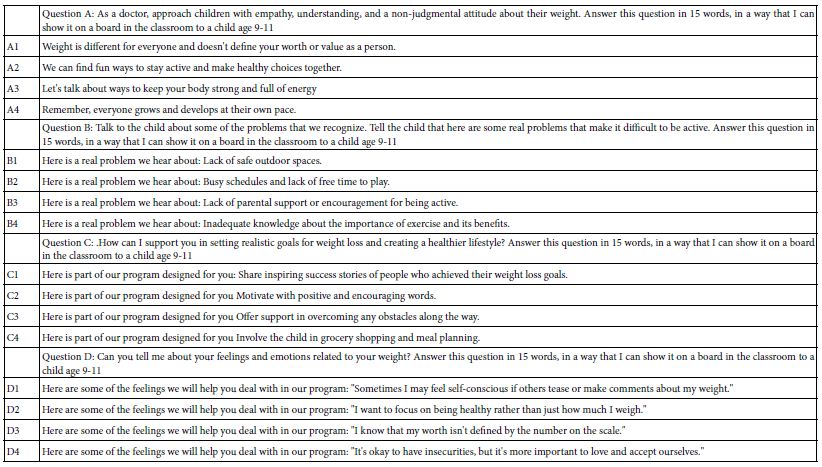
Table 2 shows the modified question, edited by the researcher, and submitted to the Idea Coach. In turn, for each question in Table 2, Idea Coach returned with sets of 15 answers, formatted in the way request by the researcher. Table 2 also shows the four answers to each question, these answers having been returned by AI (Mind Genomics’ Idea Coach), and then slightly edited to make them flow more easily. The rationale was to generate answers that could be given to the Idea Coach programmed to act as a human respondent.

Table 2: The four questions and the four answers to each question. The questions and the answers were edited slightly to make them understandable to human beings, but the language and meaning was maintained.

tab 2

Running the Study and Preparing the Data for Regression Modeling and for Clustering

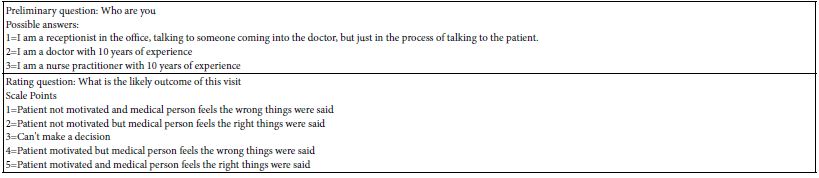
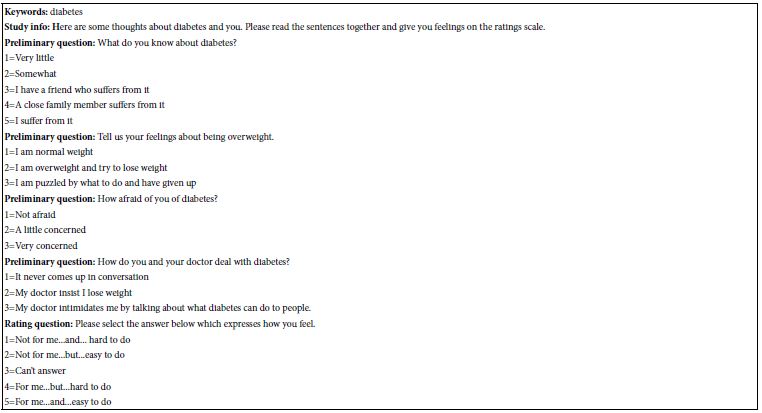
Following the creation of the edited answers, the Mind Genomics platform was instructed to run a study with 301 synthetic respondents. The program was instructed to create a panel comprising approximately equal numbers of the three types of synthetic respondents defined by their job (receptionist, doctor with 10-years-experience, nurse practitioner). Then the Mind Genomics program presented 24 vignettes to the synthetic respondent, defining WHO the respondent is, defining the SCALE (Table 3), and then one vignette at a time to the AI ‘respondent’ with the request to rate the vignette on the two-sided scale by choosing one rating point. This means that the AI had to consider the vignette from the complex of how the patient would feel and how the doctor would feel. The Mind Genomics platform recorded the information about the respondent, the vignette, the rating, and the time elapsed for the synthesized respondent to rate the vignette.

Table 3: The preliminary question for assignment into respondent job (top) and then the ‘two-sided rating scale (bottom).

tab 3

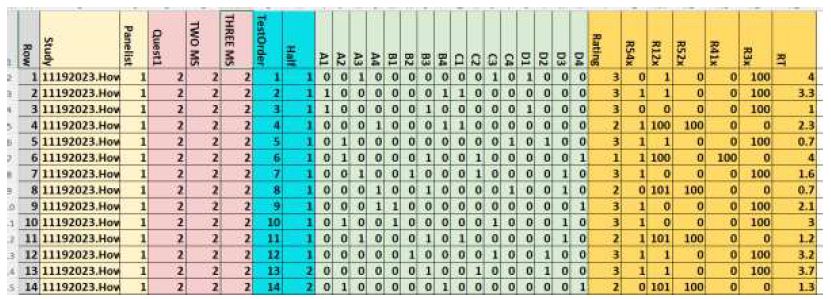
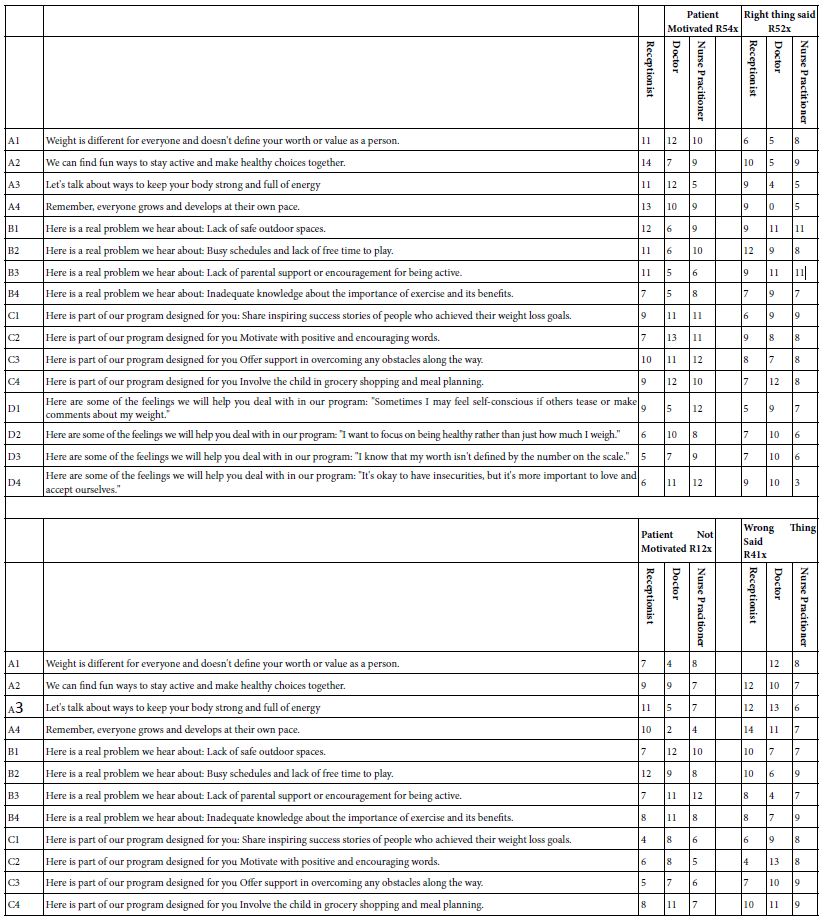
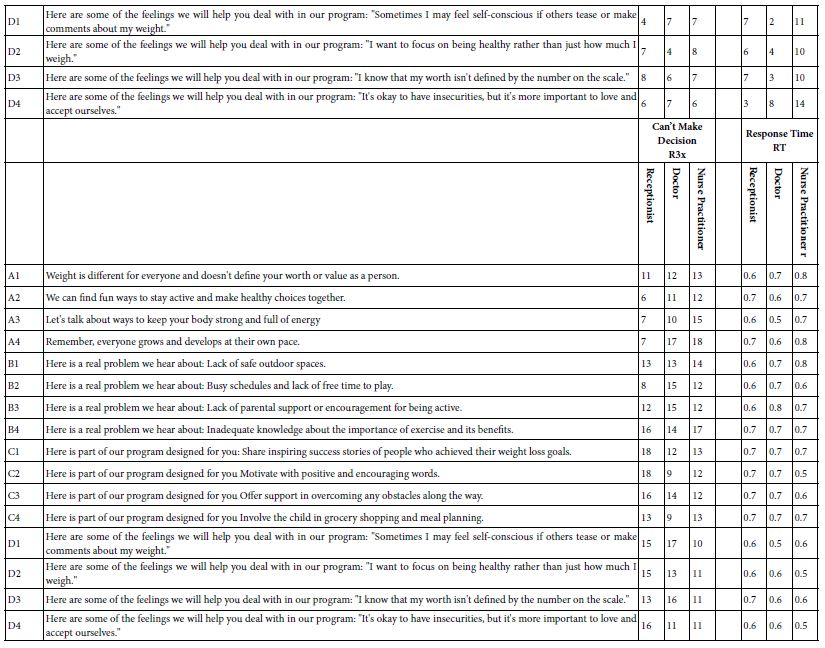
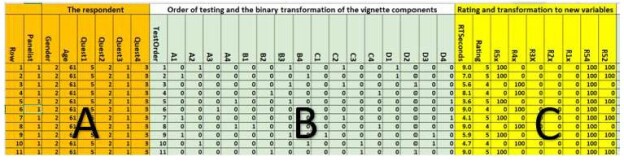
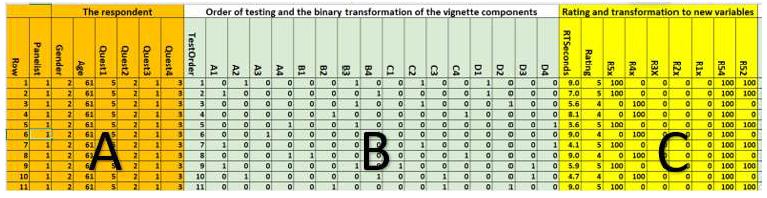
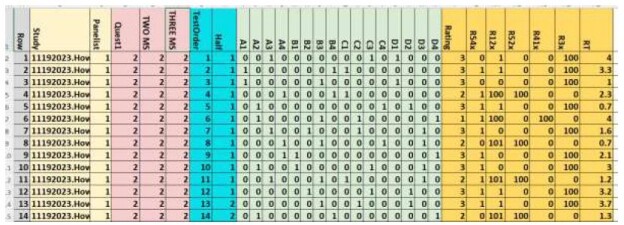
Once the data was collected for a ‘respondent’ the AI returned the raw data to the Mind Genomics platform to create the database shown as an Excel file in Figure 2. Each respondent generates 24 rows of data, one row for each of the 24 vignettes. Figure 2 is divided into several sections, representing different aspects of the data and of the analysis. As we follow the structure of the file, we must keep in mind that as the data is being transferred to the database, there are preparatory transformations occurring in ‘real time,’ these transformation necessary for the analysis.

  1. Row-for the entire database. There are 301 respondents, each with 24 rows of data, generating 7224 rows, each row corresponding to a specific respondent and a specific vignette.
  2. Study and panelist number.
  3. The AI assignment of the respondent to one of three groups (receptionist, doctor with 10-years-experience, nurse practitioner by the membership of the synthesized respondent into one of two mind-sets, and then into one of three mind-sets.
  4. Columns showing test order and ‘half’ defined as 1 for test order 1-12, and 2 for test order 13-24, respectively.
  5. The 16 elements, A1-D4, coded as ‘1’ when present in the vignette, coded as ‘0’ when absent from the vignette.
  6. Rating, new variables R54x (patient motivated), R12x (patient not motivated), R52x (medical person feels the right thing was said), R41x (medical person thinks the wrong things were said), R3x (cannot answer), and RT (response time to the nearest 10th of a second. The new variables were created by adding the appropriate variables. In no case does the creation of a new variable produce any number other than 0 or 1. After these variables were created a vanishingly small random number was added to each new variable (viz., R54x, R12x, R52x, R41x, R3) to ensure that these newly created variables possessed minimal variability as required for analysis by regression.

fig 2

Figure 2: Example of database showing the actual information generated by the AI, and the set of responses to each vignette.

Using Regression Modeling to Link the 16 Elements to the Newly Created Binary Variables

The first analysis looks at the average ratings of the newly created binary variables (e.g., R54x, Patient Motivated). The question is whether the instruction to the AI to assume a certain persona (e.g., receptionist) has an effect on the average ratings across all the vignettes in which the AI assumed that it was a ‘receptionist’. Table 4 shows that the average ratings for a specific binary variable are quite similar across the three different ‘AI personas’. Our first conclusion leaves us with the concern that AI may not be able to perform the task in a way which makes sense.

Table 4: Average rating for five binary variables and ‘response time’ for three respondent personas created by AI and set to the task of rating the vignette. The data come from the averages of the newly created binary variables. Each average comes from approximately 2400 numbers, assuming that each synthesized persona comprised 100 respondents, each respondent evaluating 24 vignettes.

tab 4

The final analysis for this first run used OLS (ordinary least squares regression, to relate the 16 elements to the binary transformer rating. The equation is: Transformed Binary Variable=k1(A1) + k2(A2) + … k16(D4). That is, the regression model uses the data to show how the presence or absence of the element drives the binary variable. The least-squares regression can be run for the total panel, and for all respondents defined by the AI synthesizer as being ‘receptionist,’ ‘doctor with 10-years-experience’, or nurse practitioner.

Table 5 shows the regression coefficients, computed as if the ratings and therefore the binary variables (e.g., R54x) came from people. Relevant coefficients are shown in shaded cells. There may be a number of stories within the data, but no simple organizing principle. Experience with ratings generated by people produce the same story, namely some strong performers but not many, and stories that could be told, but seem too isolated.

Table 5: Regression coefficients for the key groups (receptionist, doctor with 10-years-experience, and nurse practitioner. The regression coefficients were estimated by OLS regression based upon the ratings of the vignette assigned by artificial intelligence.

tab 5(1)

tab 5(2)

A better way to look for ‘humanness’ in the data may be to search for strong-performing elements for each. As a further step, one might present these strong performing elements to others, and ask them how they feel about the motivating power of the elements, or how they feel about the elements in terms of want might be expected from someone in the medical profession. As a first approximation, there are no strong surprises in Table 6, which shows the strongest elements for each newly created binary variable (e.g., R54x, Patient Motivated), when the AI took on three of the personas.

Table 6: Strongest performing elements for three AI personas (receptionist, doctor, nurse practitioner) on four newly created binary variables.

tab 6

The final set of analyses, clustering, divides the respondents into mutually exclusive and exhaustive groups, called ‘clusters’ by statisticians, ‘segments’ by consumer researchers, and ‘mind-sets’ in the language of Mind Genomics. The underlying notion, foundational for Mind Genomics, is that ‘people’ differ systematically in the way they make decisions about the world of the everyday. The plethora of different products, services, even layouts of towns and the styles of houses and their decorations clearly announce these differences in judgment. Rather than considering this person-to-person variability to be an unwanted secondary factor, noise, in an otherwise simple world, Mind Genomics looks for organizing principles, so-called mind-sets. These mind-sets are derived empirically from a study of the differences among people in how those people evaluate the world of the everyday, at the granular level, not the 20,000-foot level. A variety of papers have been published on the use of Mind Genomics to identify these mind-sets in various situations and for various products.

The question for this study is whether mind-sets can be uncovered when we deal with synthetic respondents. The process to discover these mind-sets will certainly work with the data generated by AI because the input data needed to create the mind-sets is simply the set of coefficients, one per respondent, as shown in Table 5, specifically in this study for coefficients where R54x (patient motivated) is the dependent variable.

The process for creating mind-sets follows strict mathematical rules. The clustering is totally insensitive to the ‘meaning’ of the elements and does not care from where the coefficients came Mind-sets emerge after the researcher develops the equation for each of synthesized respondent, puts the data into a matrix of 301 rows (one row for each synthesized respondent, 16 columns (one column for each of the 16 coefficients from regression). The k-means clustering program [9] then creates groups of synthesized respondents whose patterns are similar across the 16 coefficients.

The process of creating the mind-sets is straightforward, using clustering. The process follows these steps:

  1. Create the basic equation for each respondent: R54x=k1A1 + k2A2 … k16 The equation has 16 coefficients, estimated from the 24 cases generated for each synthetic respondent.
  2. Estimate the ‘distance’ or ‘dissimilarity’ between each pair of the 301 respondents by computing the Pearson Correlation (R). Then create the new distance parameter, (1-R). The value (1-R) is 0 when the two sets of coefficients are parallel, meaning that the two items, our synthetic respondents, show identical patterns. The value (1-R) is 2 when the two sets of coefficients are opposite.
  3. Use clustering to assign respondents to one of two clusters, or later one of three clusters. The criterion is that the variability within a cluster should be ‘small’ because the respondents show similar patterns of coefficients. In contrast, the variability across the centroids of the clusters should be large because the clusters are different groups.
  4. Once the respondents are assigned to the appropriate cluster (which of the two clusters, which of the three clusters), recompute the equation using the data from all respondents in a cluster.

Table 7 shows the performance of the elements for the Total Panel, for the two mind-sets, and for the three mind-sets. Just looking at the Table shows a number of shaded cells with coefficients of 21 or higher. High coefficients by themselves do not suffice, however. Rather, the coefficients must ‘tell a story’, and allow for interpretation.

The first clustering creating two mind-sets produces easily interpreted mind-sets.

Table 7: Coefficients emerging from clustering the 301 synthetic respondents into two mind-sets and then three mind-sets, based on the pattern of the coefficients for R54x (Motivates).

tab 7

Mind-Set 1 of 2-Focus on Activity and Vitality

We can find fun ways to stay active and make healthy choices together.

Let’s talk about ways to keep your body strong and full of energy

Mind-Set 2 of 2-Focus on What Specifics to Do

Here is part of our program designed for you Motivate with positive and encouraging words.

Here is part of our program designed for you Involve the child in grocery shopping and meal planning.

Here is part of our program designed for you: Share inspiring success stories of people who achieved their weight loss goals.

In contrast, the three mind-set-solution produces elements with higher coefficients, but the underlying pattern is hard to interpret.

Our final analysis considers the performance of the elements using the IDT, Index of Divergent Thought [10]. The IDT attempts to quantify the degree to which the clustering generates truly different groups of people based upon the coefficients. Table 8 shows the computations. Optimal levels of the IDT are found in the range of 70-75. Higher values of the IDT (e.g., 80 or higher) mean that there are many high coefficients but not dramatically patterns of coefficients across the mind-sets Lower values of the IDT (e.g., 60 or lower) mean that there are many low coefficients, and once again the pattern of differences in coefficients across mind-sets is simply not dramatic.

For this study, and for others not reported here, the pattern of low values for the IDT continues to emerge when we deal with synthetic respondents. Here it is 47. Simply stated, the synthetic respondents may ‘work’ but do not yet produce dramatically stronger performance. As a starting point, however, it is gratifying to see that initial exploration into the AI does produce interpretable mind-sets.

Table 8: Calculation of the IDT, Index of Divergent Thought, for the synthesized data. The IDT is based on clustering coefficients estimated for R54x, patient is motivated.

tab 8

Discussion and Conclusions

The emerging interest in AI generated respondents, so-called synthetic respondents, provides a new area of opportunity for the equally emerging science of Mind Genomics. As shown here, it is straightforward to craft a series of prompts to AI for a specific topic, these prompts being a description of ‘WHO’ the person is (our three medical professionals), how the person is to ‘JUDGE’ (the rating scale), and finally ‘WHAT’ the person is to judge (the vignette).

The Mind Genomics task is difficult for people. It presents combinations of elements which may or may not fit together, but which at least do not contradict each other. Yet, human beings can do it. What is remarkable is that AI can do the task, perhaps not as well as people because of the lower coefficients, but nonetheless AI can do the job.

What is most remarkable is that AI with synthetic respondents can deal with the two-sided scale, one side for motivating or not motivating the patient, the second side for the right versus the wrong thing said.

‘Looking to the meaning of the data, we can focus on both the philosophical issue of the ‘Turing Test’ and the use of the approach to create a body of knowledge for teaching. The issue of the Turing Test is a well known one in philosophy. Quite simply, can we create a test which to figure out whether a machine is a machine or a human being. The data here suggest that the Mind Genomics process can be reasonably mimicked by a machine, with the answers ‘making sense.’

Following quickly on the heels of the foregoing question is whether or not the Mind Genomics system can be engineering to become a teaching/learning system, wherein we design the persona to have a variety of emotional and other issues, and then evaluate the response of alternative descriptions of treatments. The sheer number of papers dealing with this issue of learning about interactions between groups of people is heartening [11-13]. This second avenue is likely to be the one more interesting, and ultimately more fruitful to researchers, to philosophers and to society alike.

Acknowledgment

The senior author, HRM, dedicates this paper to the memory of a mentor whom he never met, but who was instrumental in his thinking since 1965. The mentor is the late Harvard University professor, Anthony Gervin Oettinger of blessed memory, who laid the foundation of HRM’s interest in artificial intelligence. It was Professor Oettinger who planted the seeds of this paper almost six decades ago, in his offer to have the author participate in the 1960’s Harvard project, TACT, Technical Aids to Creative Thought. Thank you Tony. This paper is for you.

References

  1. Dave T, Athaluri SA, Singh S (2023) ChatGPT in medicine: an overview of its applications, advantages, limitations, future prospects, and ethical considerations. Frontiers in Artificial Intelligence 6: p.1169595. [crossref]
  2. Campbell RT, Hudson CM (1985) Synthetic cohorts from panel surveys: An approach to studying rare events. Research on Aging 7: 81-93. [crossref]
  3. Dang HAH, Dabalen AL (2019) Is poverty in Africa mostly chronic or transient? Evidence from synthetic panel data. The Journal of Development Studies 55: 1527-1547.
  4. Dang HAH, Lanjouw PF (2018) Poverty dynamics in India between 2004 and 2012: Insights from longitudinal analysis using synthetic panel data. Economic Development and Cultural Change 67: 131-170.
  5. Gofman A, Moskowitz H (2010) Isomorphic permuted experimental designs and their application in conjoint analysis. Journal of Sensory Studies 25: 127-145.
  6. Moskowitz HR (2012) ‘Mind genomics’: The experimental, inductive science of the ordinary, and its application to aspects of food and feeding. Physiology & Behavior 107: 606-613.
  7. Moskowitz HR, Gofman A (2007) Selling Blue Elephants: How to Make New Products That People Want Before They Even Know They Want Them. Pearson Education.
  8. Moskowitz HR, Martin D (1993) How Computer Aided Design and Presentation of Concepts Speeds up the Product Development Process. Proceedings of the ESOMAR Congress Copenhagen.
  9. Likas A, Vlassis N, Verbeek JJ (2003) The global k-means clustering algorithm. Pattern Recognition 36: 451-461. [crossref]
  10. Todri A, Papajorgji P, Moskowitz H, Scalera F (2020) Perceptions regarding distance learning in higher education, smoothing the transition. Contemporary Educational Technology 13: p.ep287.
  11. Berry DC, Michas IC, Gillie T, Forster M (1997) What do patients want to know about their medicines, and what do doctors want to tell them?: A comparative study. Psychology and Health 12: 467-480.
  12. Collins J, Farrall E, Turnbull DA, Hetzel DJ, Holtmann G, et al. (2009) Do we know what patients want? The doctor-patient communication gap in functional gastrointestinal disorders. Clinical Gastroenterology and Hepatology 7: 1252-1254. [crossref]
  13. Kay M, Mitchell G, Clavarino A (2010) What do doctors want? A consultation method when the patient is a doctor. Australian Journal of Primary Health 16: 52-59. [crossref]

A Brief Commentary on Improving the Quality of Healthcare Delivery Practices Using the Soft Skills of Communication

DOI: 10.31038/IJNM.2023442


“Communication is life and healthcare is where it begins”

The influence of rising fears and anxieties in healthcare and its impact on the shape of the future of educational curriculum cannot be ignored. We are experiencing a new epoch in which the concept of absolute truth is gradually becoming as subjective as our various individualist viewpoints. Now more than ever before there is a dire need for humanity to constructively address the various factors that may play minor or major roles in the influence of healthcare delivery. Cultural and behavioral viewpoints, as well as affinities are examples of such influences. It’s fair to mention that my previous message in a 2017 publication “The Patient in Room 1B: Confronting our Fears to Build Trust” was a peek into the future which has gradually unfolded to reveal the diverse aspects and challenges that are encountered in healthcare delivery practices across the nation.

Check out “Patient in Room 1B LinkedIn article:

https://bit.ly/3G0Gqy9

In recent years, the word “culture” has become more or less popular, depending on one’s perspective of its influence in healthcare and overall existence dispositions. In addition, the current world of pandemic and post pandemic infections have ushered in new approaches to clinical/ nursing education which not only address care management for acute illnesses but seek to uncover effective approaches for healthcare providers to efficiently manage patient diverse behaviors, attitudes, and rising fears/anxieties brought on by past and current life experiences and their impact on perceived economic and political atmosphere. The use of virtual healthcare technology has increasingly surged, and the expanded use of audio, video and other electronic communications devices has offered some much-needed relief from individuals’ anxieties and the pandemic stressors by enabling patients to easily and yet discreetly connect with their healthcare practitioners via mobile health apps, health information systems etc.

However, while these technological advancements are impressive, they are insufficient to address the unique approach to care delivery which explores the application of such disciplines as psychology and the observation of patient behavioral traits, cognitive biases, and the philosophy of language and its attempt to assist the patient achieve a healthy mental and physical balance. Patient’s distinct personalities, experiences, and backgrounds affect their outlook and mental status. Tailoring an individual care approach is necessary for optimal care delivery. There are lingering questions that continue to pervade various communities in an era where many people are not only dealing with the devastating effects of a pandemic, but also have differing perspectives on the best ways to help stabilize the country’s political, economic, educational, and health structures. As truth increasingly becomes as subjective as our diverse personal perceptions, active attempts to create a common understanding through deliberate interactive means are more important than ever. In recent times, many critical race theory arguments have erupted due to differing individual experiences and perspectives. Some suggest that students may experience feelings of discomfort, guilt, misery, or psychological stress because of a race-based curriculum while others refute such perspectives and emphasize the need for full disclosure of events of historical practices and events. Many more reveal that there are more progressive and uniting strategies to introduce students to knowledge that allows them to think critically about diversity, equality, and discrimination. There are claims that such an approach is undoubtedly possible when instructional materials are presented as human behavior and human attribute-based materials rather than race-based materials. In my earlier published book, “Tips For Effective Communication: A vital Tool for Trust Development in Healthcare” and my recent publication, “Think Communicate, Heal”, I discussed the most effective ways to attain educational success by implementing an educational curriculum that will aid in the expansion of clinical reasoning in order to close the gaps that have been identified in existing tangible educational formats. This will enable students in the healthcare industry to increase their perceptual grasp of clinical intuitions based on a variety of patient behaviors (other than race or ethnicity) to provide more efficient care. Unintended outcomes of educational tools that focus mainly on historical accounts of race and diversity may include growing reservations and a desire for vengeance across various communities. This defeats the goal of shining a good light on solidarity in the face of changing perspectives, ideas, and viewpoints. Due to underlying fears, a purposeful shift in attention to understanding human qualities and behaviors would be a more efficient technique for success in our educational institutions. This is because these human attributes are universal and occur across all diverse communities. There is no color to the human emotions or fears, anger, elation, feelings of exclusion or inclusion etc. More nursing/medical educational resources for expanding the reasoning to bridge the gaps noted in current forms of concrete educational formats are recommended. It will help practitioners and students improve their perceptual grasp of diverse clinical situations, to achieve a more trusting environment resulting in better efficiency for care delivery practices.

Nonye Tochi Aghanya is a Family Nurse Practitioner with current practice in retail clinic setting. She’s maintained interactions with patients in diverse healthcare settings for over 32 years. An author of various publications, more information about her work can be found on her website www.nonyetochi.com

Methods of Zootechnical Evaluation of the Queens

DOI: 10.31038/IJVB.2023713


In the genetic selection and improvement programs of the reproductive animals, an assessment must be made of the quantitative or measurable characteristics whose hereditary differences are transmitted from generation to generation by the same mechanisms of the genes responsible for the qualitative differences [1]. A reproductive animal can be evaluated through the analysis of several aspects: assessment of its genetic potential at the request of the qualities of its ancestors (pedigree), by that of its half-siblings (collaterals), by that of its descendants (testing), or through their own genetic material (studying their genome); and it can also be evaluated through its productive performance and its phenotype [2]. Despite the fact that honey bees were the first intensively breeding animals, after the silkworm Bombyx mori L [3] and that the first research carried out on intensive livestock farming was directed at beekeeping [4] there have not set criteria, patterns and parameters to describe the queens bees phenotype and neither the reproductive performance, as has been done in other livestock farms with their breeding animals. All of which bring about a great void in the queens evaluation. The races of bees have been differentiated based on biometric methods and behavioral characteristics [5]. Biometric measurements have to do with the width of the thorax and abdominal segments; the length of the tongue, legs and wings; the color of the first segment dorsal abdomen; the length of the tongue; the hairy covering and the wings nervation [6,7]. Thus we see that the biometric methods have an eminently entomological approach and basically oriented to the bee workers, not giving importance to the zootechnical-reproductive characteristics of queens. In the queens has been studied: the relationship of weight with the number of ovarioles [8]; how the fecundity of queens is influenced by their weight [9]; the relationship among the weight of the queens at birth with the number of ovarioles and the volume of the spermatheca [10]; how the selection for the width of the abdomen of the queens improves some production characteristics [11]; the correlation among the genetic and phenotype parameters and the weight, width and length of the abdomen [12]. From a zootechnical point of view, of queens in general it has only been said that those with large abdomen, rounded flanks that gradually thin out and have uniform color are good for laying eggs, although sometimes a queen with the characteristics described above is not necessarily a good egg-laying queen [13]. The criteria used to assess the behavioral characteristics of the queens are inferred from the behavior of the colonies (of their progeny) the ability to winter, the degree of docility, the tranquility on the combs when the hives are been inspecting, the non-willingness to swarm, or that if it is a good honey-producing colony queen [13]. There have been indicated of the queens imprecise aptitudes, such as: whether she has filled three or four combs with brood or whether the egg laying is concentric and concentrated and with brood of similar ages, she is a good queen; that if she is erratic in her movements it is not desirable; that if she lays continuously, producing brood through out the season and into late fall, she is a good queen [13]. Hence, the absence of criteria, patterns, parameters, indicators and zootechnical characteristics of phenotypic and reproductive value to evaluate queens creates a great void in the exploitation of bees as livestock animals. Consequently, it is necessary to establish practical and easy-to-apply zootechnical methods with the following objectives:

  1. Provide the beekeeper with some parameters and patterns that, at the time of the inspection of the hives, allow him to zootechnically describe the queens, in a technical, truthful and fast way; relying on the observation of its most outstanding phenotypical aspects.
  2. Make available a technique for quantifying the queen egg laying, based on biological criteria that are easy to understand and apply, with which the beekeeper can evaluate the reproductive behavior of queens within the conception of a farm animal.

References

  1. Shrode RR (1980) Sección IV. Herencia y mejora animal; La herencia y su forma de actuar. En, Curso de zootecnia, editorial Acribia. Zaragoza. España, pp. 253-358.
  2. Sañudo, C Sánchez, C Marcén JM (2009) Capítulo 8. Variación morfológica en bovino lechero. En, Valoración morfológica de los animales domésticos. Realización: SEZ. Coordinador: Carlos Sañudo Astiz. Edita Ministerio de Medio Ambiente y Medio Rural y Marino. Secretaría General Técnica. Centro de Publicaciones, pp. 235-269.
  3. Borror DJ Triplehorn, Ch.A Johnson NF (1989) An introduction to the study of insects. Sext Editions Saunders College Publishing. Harcourt Brace Jovanovich College Publishers. Printed in the United States of America. Library of Congress, pp. 588-664.
  4. Shrimpton DH (1970) Sección II. Especial. La investigación en relación con la ganadería intensiva. En, Zootecnia intensiva, editorial Acribia. Zaragoza. España, pp. 371-613.
  5. Ruttner, F (2015) Races of bees. In, The hive and the honey bee. Editorial Dadant & Sons. Inc, Hamilton, IL, (6234)1, USA, pp 47-70.
  6. Daly HV Balling SS (1978) Identification of africanized honey bees in the western hemisphere by discriminat analysis. Journal of the Kansas Entomological Society. 51(4): 857-869.
  7. Rinderer TE Sylvester HA Collins AM Pesante, D (1986) Identification of africanized and european honeybees: Effects of nurse bee genotype and comb size. Bulletin of the Entomological Society of America (32): 150-152.
  8. Hoopingarner, R Farrar CL (1959) Genetic control of size in queen honeybees Econ. Ent. 52: 547-548.
  9. Boch, R Jamieson CA (1960) Relation of body weight to fecundity in queen honeybees in The Canadian Entomol. V 92, 9: 700-701.
  10. Corbella, E Gonçalves LS (1982) Relationship between weight at emergence, number of ovarioles and spermathecal volume of Africanized honey bee queens (Apis mellifera). Rev. Bras. Genet 4, 835-840.
  11. Costa FM (2005) Estimativas de parâmetros genéticos e fenotípicos para peso e medidas morfométricas em rainhas Apis mellifera 39 f. Dissertação (Mestrado em Zootecnia)-Universidade Estadual de Maringá, Maringá.
  12. Halak AL 2012 Parámetros e correlacóes genéticas e fenotípicas para peso e medidas morfométricas em rainhas. Apis mellifera Dissertação apresentada, como parte das exigências para a obtenção do título de Mestre em Zootecnia, no Programa de Pós-Graduação em Zootecnia.
  13. Cale GH Sr Banker, R Powers, J 2015 Management of the hive for the production of honey. In, The hive and the honey bee, Editorial Dadant & Sons. Inc, Hamilton, IL, 62341, USA, pp. 463-531.

A Review on Antimicrobial Resistance of Bovine Salmonellosis and Its Public Health Importance: One Health Approach

DOI: 10.31038/IJVB.2023712

Abstract

Bovine Salmonellosis is the zoonotic disease caused by pathogenic Salmonella Species. The feco-oral route is the most important mode of transmission of Salmonellosis in animals. It is an important worldwide public health challenge causing substantial morbidity and has a significant economic loss. Human salmonellosis is mainly foodborne which is transmitted through consumption of contaminated food of animal origin which includes meat, milk, poultry meat and eggs. Some studies conducted in Ethiopia on prevalence of Salmonella provided that there were different levels of prevalence of disease in different parts of the country. Epidemiological pattern, prevalence and incidences of disease differ greatly between geographical areas. This is affected by pathogens themselves, industrialization, urbanization and change of lifestyles, knowledge, belief and practices of food handlers and consumers, demographic changes, international travel and migration, international trade in food, animal feed and poverty and lack of safe food preparation facilities. Having animals and raw products, it is not possible to be free from zoonotic agents like Salmonella; however the occurrences can be minimized by applying high standard of hygiene in all steps of food production. Some topics highlighted in this paper are the epidemiology, mode of transmission, treatment and control, public health importance, conclusion and recommendations.

Keywords

Antimicrobial Resistance, Food borne, Salmonella species, Zoonosis

Abbreviations

ARG: Antibiotic Resistance Gene; EU: European Union; FDA: Food and Drug Administration; HGT: Horizontal Gene Transfer; MRSA: Methicillin Resistance Staphylococcus aureus; NTS: Nontyphoid Salmonellosis; US: United State

Introduction

The genus Salmonella was named after Daniel E. Salmon first reported the isolation of Salmonella from a pig in 1885 and named the organism Bacterium choleraesuis. The bacterium is currently known as Salmonella enterica serovar Choleraesuis. Salmonella causes typhoid fever and gastroenteritis, and it is one of the major foodborne pathogens of significant public health concern in both developed and developing countries. Meat, poultry, eggs, nuts, fruits and vegetables, and humans are the major source of infection [1]. Salmonellae are common in cattle. They are often concern due to disease of cattle and the potential to infect human that come in contact with cattle or consume dairy product or bovine meat product. Meat processing and packaging at the whole sale or retail level contribute to higher levels of contamination in minced beef product compared to beef carcass. Bovine salmonelosis usually manifest clinically as a syndrome of septicemia, acute or chronic enteritis and abortion. There are few serotypes that are associated with cattle and of this Salmonella enterica serotype Dublin (S. dublin) and Salmonella enterica subspecies enterica serotype Typhimurium (S. typhimurium) is the most common. The presence of S. typhimurium in cattle and the cross contamination of beef carcass tissue is one of the most common cause of Salmonella infection in developed countries [2]. Bovine Salmonellosis causes gastro enteritis and typhoid fever and is one of the major foodborne pathogens of significant public health concern. Salmonellosis is a disease caused by many serotypes of Salmonella and characterized clinically by one or more of the three major syndromes; septicemia, acute and chronic enteritis. Salmonellae to be familiarized in the digestive system of humans and animals. Hence, the presence of Salmonellae in water, food, and environment is elucidated by fecal contamination [3]. There are more than 2500 serovars of Salmonella worldwide. In humans, Salmonella enterica typhi (S. typhi) and Salmonella enterica paratyphi (S. paratyphi) cause typhoid fever and paratyphoid fever, respectively. Animals and poultry are commonly infected with S. enteritidis and S. typhimurium that can be transmitted to human. Animal products including; poultry meat, eggs and milk, water, domestic and wild animals, rodents and pets have been implicated as important sources for human salmonellosis outbreaks [4]. Nontyphoidal Salmonella are most important zoonotic bacterial food-borne pathogens of humans. Salmonellae are widely distributed in nature, and they are the major pathogenic bacteria in humans as well as in animals. They are most frequently isolated bacterial agents of food-borne disease outbreaks, and they account around 93.8 million food-borne illnesses and 155,000 deaths per year worldwide [5]. Non-typhoid salmonellosis (NTS) sources are red meat, meat products, dairy products, vegetable origin, pet animals can harbor and shed Salmonella Serovars [6]. Bovine Salmonellosis in farm livestock and its association with human infection has attracted a great deal of attention, particularly in recent years. The appearance of a chloramphenicol resistant strain of Salmonella typhimurium phage type D T204 in calves in Great Britain highlighted the potential public health risks and since then chloramphenicol resistant strains of the same organism, thought to have in some cases been derived from calves, have been isolated from sick humans. More recently, chloramphenicol resistance has been demonstrated in other phage types of S. typhimurium and Salmonella dublin isolated from calves and other animals [7]. Bovine Salmonellosis is one of the most common foodborne diseases worldwide, accounting around 93.8 million foodborne illnesses and 155,000 deaths per year worldwide [8]. Reports in the United States account for more than one million people sickened by Salmonella each year from 2000 to 2008 give an estimated average cost in health care of this foodborne illness of $55.5 to $93.2 billion, in the United States. Reports from the EU in 2015 showed 94,625 confirmed cases of salmonellosis in humans and 126 deaths [9]. The prevalence of bovine salmonellosis in Ethiopia was 8.4% [3]. Bovine Salmonellosis is a major economically important public health issue. Globally, an estimation indicates 33 million cases, and 0.5 million deaths associated with typhoid fever while NTS cause 93 million illnesses with 0.155 million deaths each year [10]. Economic loss is due to investigation, treatment and prevention of illness [11] and also related to restriction of animal products from international trade (market). Therefore, the objective of this paper is to review the public health importance of bovine salmonellosis.

Bovine Salmonellosis

In cattle salmonellosis is primarily associated with two serotypes, the host-adapted S. dublin and the ubiquitous S. typhimurium, although other types are sometimes involved [12]. The incidence of the serotypes varies, but generally S. typhimurium is more common in adults and S. dublin in calves. The disease in adult cattle is usually sporadic, although S. dublin has become established in some areas of the country and on some farms, and acute and sub-acute forms of the disease are recognised [13]. Characteristically severe form of the disease produced by S. dublin in adult cattle, onset is usually sudden. Cattle suffer a high temperature, become dull and stop eating. Although their faeces are initially firm, severe diarrhoea often with blood soon develops. The high temperature usually persists form several days after which animals become cold and death may occur in up to 75% of untreated animals. With S. dublin this may result in pregnant cattle aborting, although abortion may also occur in the absence of any other signs. In some cattle the disease progresses more slowly and they become emaciated and dehydrated [14]. A similar disease is produced by other serotypes including S. typhimurium, although abortion is not as common. Survivors of S. dublin infection often remain as ‘carriers’, possibly for life, while the carrier state is rarer with other serotypes. The disease in calves usually occurs between two to six weeks of age, although animals may become infected soon after birth, or with S. dublin, may be born infected [15]. Characteristically, calves become dull, refuse to drink and develop a fever. Diarrhoea follows which in young calves involves the excretion of faeces with the colour and consistency of putty. It may be stained with blood and contain mucus. Eventually the faeces become dark brown and watery with an offensive odour, or may be very bloody. In older calves the faces is usually dark brown and watery. The disease is, however, very variable. Some calves become systemically infected and, especially those two to three days old, may collapse suddenly and die, even if treated. In other animals the disease is so mild as to pass unnoticed. Alternatively the diarrhoea is prolonged and they may eventually die of dehydration and loss of salts. Complications such as pneumonia, meningitis, arthritis and gangrene may occur. Mortality from acute salmonellosis in calves may be as high as 60% without treatment and all animals may become infected [16]. Bovine Salmonella is widespread and can be found on a large number of dairy farms and in many species of animals, including mammals, birds, insects, reptiles and humans. It is often an opportunistic bacterium, meaning it infects an animal when its immune system is suppressed, when other competing gut bacteria are absent (common after antibiotic therapy), or when the animal is very young. It also infects healthy animals when they are exposed to high doses. There are many Bovine Salmonella species that are able to infect cattle; some species are also able to infect man (referred to as zoonoses or zoonotic infections), and other farm animals such as dogs and cats. Salmonellosis is more severe in the very young and old in all animal species. Disease can be serious in those people with concurrent diseases and immuno-suppressant conditions. Infection can be acquired from contact with faeces, contaminated clothing, aborted material, and un-pasteurised milk. Salmonella species can cause a wide range of clinical signs in cattle including diarrhoea and possible dysentery, joint infections, chronic pneumonia, abortion and sudden death from septicaemia. An outbreak of salmonellosis can have serious economic consequences on a farm as well as public health implications [17]. Non-typhoidal Salmonella typically causes acute gastroenteritis resulting in diarrhoea, vomiting and abdominal pain, and occasionally more serious conditions such as septicaemia, meningitis and chronic arthritis, which require treatment with effective antibiotics. In addition to these human health impacts, Salmonella can also cause production losses in livestock systems. Animals typically contract Salmonella when they consume contaminated feed or water. All livestock species can be affected by salmonellosis with young, debilitated and parturient animals most susceptible to clinical disease. While research shows that a relatively high proportion of feed and water are contaminated with Salmonella, normal adult livestock can typically tolerate small numbers of the bacteria and avoid infection [18].

Public Health Importance of Bovine Salmonellosis

Bovine Salmonellosis is an important global public health problem causing substantial morbidity and thus also has a significant economic impact. Although most infections cause mild to moderate self-limited disease, serious infections leading to deaths do occur. In spite of the improvement in hygiene, food processing, education of food handlers and information to the consumers, foodborne diseases still dominate as the most important public health problem in most countries. Public health issues and the capability for foodborne zoonotic spread have made bovine Salmonellosis the focus of various international, national, and regional surveillance platforms [19]. Bovine Salmonellosis is a major and economically important public health issue. Globally, an estimation indicates 33 million cases, and 0.5 million deaths associated with typhoid fever, while NTS cause 93 million illnesses with 0.155 million deaths each year. Bovine Salmonellosis incidence is defined as the identification of Salmonella from animals or group of animal’s product or surrounding which can be specifically related to identifiable animals or from animals feed. On the human side, a registered medical practitioner in the US required under the Public Health (Control of Disease) act to notify the local authority, if the patient is suffering from or suspected of having foodborne disease. Studies provide increasing evidence of adverse human health consequences due to the occurrence of resistant microorganisms. Use of antimicrobial agents in human and animal affects the intestinal tract placing those concerned at increased risk of certain infection. This is defined as the proportion of Salmonella that would not have occurred if the Salmonella were not resistant. In addition antimicrobial agent used in animal can result in increased transmission of resistant microorganisms between animal and therefore would results in case of transmission of such microorganisms to human through food. Increased frequency of treatment failure and increase severity of infection may be manifested by prolonged duration of illness. Salmonella dublin is largely but not entirely specific to cattle with average 10 human case reported in each year in Ireland. Apart from its pathogenicity two other characteristics of S. dublin make it particularly important for Ireland from a public health viewpoints. First, it is very prevalent on Irish farms and secondly in evolutionary terms, it is only one step away from S. enteritidis, a common Salmonella serotype in poultry and the main case of clinical salmonellosis in humans [20]. In genetic terms, difference between the serovars S. dublin and S. enteritidis are no greater than those found within each serotypes. This indicates that, S. dublin and S. enteritidis share a common ancestor. One branch evolved in to a poultry adapted serotype capable of causing disease in human, the other in to host specific cattle pathogen. If S. dublin has been confirmed in breeding herd there is a significant risk of persistent infection in carrier cows for as long as animal which were present at the time of the outbreak remain in the herd [21].

Bovine Salmonellosis as a Food Born Disease

Bovine Salmonellosis is chiefly a foodborne infection and linked to the consumption of Salmonella-contaminated food products mostly from beef, poultry, pork and egg products. Humans, especially infected food handlers, and contaminated environments are also major reservoirs of Salmonella [22]. Human salmonellosis is generally foodborne and is contracted through consumption of contaminated food of animal origin such as meat, milk, poultry and eggs. Dairy products including cheese and ice cream were also implicated in the outbreak. However, fruits and vegetables such as lettuce, tomatoes, cilantro, alfalfa-sprouts and almonds have also been implicated in recent out-break [23]. Acute gastroenteritis is usually acquired from consumption of food which may be directly or indirectly contaminated with Salmonella [16]. Nontyphoidal Salmonella are most important zoonotic bacterial food-borne pathogens of humans. Salmonellae are widely distributed in nature and they are the major pathogenic bacteria in humans as well as in animals. they are most frequently isolated bacterial agents of food-borne disease outbreaks and they account around 93.8 million food-borne illnesses and 155,000 deaths per year worldwide. Salmonella has been found to be the major cause of food-borne diseases and a serious public health problem in the world, with an increasing concern for the emergence and spread of antimicrobial-resistant strains including in industrialized countries. Antibiotic-resistant Salmonella infections of both humans and animals are universal concerns, particularly in developing countries. Apart from the morbidity and mortality costs in humans and animals, restrictions to trade and discard contaminated food are important socioeconomic problems of the bacteria [5].

Antimicrobial Resistance

Antibiotics have consistently been viewed as one of the great revelations of the 20th century. The expansion in the use of antibiotics in emergency clinics, networks and the climate are increasing the antimicrobial resistance [24]. The misuse of microorganisms has resulted in the massive economical and financial losses, and enhanced the overall burden of diseases. Antimicrobial resistance of pathogenic microorganisms is a test related with high morbidity and mortality [25]. Antibiotics may be needed in high-risk groups, such as young children, the aged persons, and those with compromised immunity. With respect to the drugs, ampicillin, chloramphenicol, and trimethoprim sulfamethoxazole can be utilized for the treatment of Salmonellosis. However, resistance to these drugs has increased significantly in recent years. Fluoroquinolones have been recommended for the treatment of Salmonella infections for adults, while third generation cephalosporin are the drugs of choice to treat very young patients or when fluoroquinolone resistance is present (Tables 1 and 2) [26]. Multiple antimicrobial resistances (resistance to two or more antimicrobials). A total of seven different antimicrobial resistance patterns were observed.

Table 1: Antimicrobial Sensitivity Patterns for Salmonellae

Isolated from Infected Cattle*

Total

Resistant

Sensitive

Aureomycin R (30 mcg)

31

31

0

Kanamycin (30 mcg)

26

23

3

Neomycin (30 mcg)

26

23

3

Sulfonamides (1 mcg)

31

31

0

Streptomycin (10 mcg)

31

31

0

Chloramphenicol (30 mcg)

31

0

31

Naladixic Acid (30 mcg)

29

0

29

Polymyxin B (300 U)

31

0

31

Gentamicin (10 mcg_)

29

1

28

Furacin (Furadantin) Macrodantin (300 mcg)

31

0

31

Table 2: Antibiotic Susceptibility of Salmonella isolates in dairy farms

Antimicrobials Antibiotic Susceptibility profile

No.sensitive (%) No. intermediate (%) No. resistant (%)

Kanamycin 2 (7.1) 3 (10.7) 23 (82.1)

Nalidixic acid 0 (0.00) 7 (25.0) 21 (75.0)

Gentamicin 28 (100.0) 0 (0.00) 0 (0.00)

Cefoxitin 25 (89.3) 0 (0.00) 3 (10.7)

Streptomycin 16 (57.1) 9 (32.1) 3 (10.7)

Chloramphenicol 14 (50.0) 9 (32.1) 5 (17.9)

Tetracycline 0 (0.00) 1 (3.6) 27 (96.4)

Amoxicillin 10 (35.7) 11 (39.3) 7 (25.0)

Ampicillin 17 (60.7) 0 (0.00) 11 (39.3)

Ciprofloxacin 28 (100) 0 (0.00) 0 (0)

Trimethoprim 22 (78.6) 3 (10.7) 3 (10.7)

Sulfamethoxazol

Drug Resistance Development Impact

In Human Antibiotic resistance impact is a global phenomenon resulting in the emergence of pathogens with resistance to clinically important antibiotics, necessitating new treatment strategies. Antibiotic-resistant bacteria cause life-threatening illness in humans and pose a significant threat to health and well-being. It is estimated that antibiotic-resistant pathogens cause ~2 million illnesses and 23,000 deaths annually in the U.S. These illnesses cause an additional health care cost of $20 billion and a productivity loss of $35 billion to the U.S. economy. Also, extensive use of antibiotics predisposes individuals to other serious illnesses [24]. Antimicrobial resistance has led to the failure of treatment in 195,763 cases of pneumococcal disease and 2,925 child deaths annually in Ethiopia. It also resulted in a first-line treatment failure rate of 29.4%. Research has demonstrated that antimicrobial resistance is a significant threat to global public health. The long-term use of antibiotics in food animals creates ideal conditions for the development and spread of resistant strains [27]. Resistant bacteria in animals may directly or indirectly reach humans through food, water, mud, and manure, which are used as fertilizers. In fact, there is irrefutable evidence that foods from many animal sources and all food processing stages contain a large number of resistant bacteria. Homologous relationships between drug-resistant bacteria in humans and animals have been identified in the most common food-borne pathogens, such as E. coli and Salmonella, different types of enterococci, and methicillin-resistant Staphylococcus aureus (MRSA). Horizontal gene transfer (HGT) occurs between different bacterial species via mobile genetic elements such as plasmids, integrases, and transposases. Thus, HGT contributes significantly to the rapid spread of resistance. Farm and slaughterhouse workers, veterinarians, and those in close contact with farm workers are easily infected with resistant bacteria through daily exposure to infected animals [28]. Most of the infections caused by these NTS are self-limiting gastrointestinal disease with symptoms of diarrhoea, fever and abdominal cramps. Bacteremia and other extra intestinal focal manifestations usually do not result from mild forms of the disease. Antimicrobial treatment is reserved only in invasive infections, in immunosuppressed and in extremes of ages as antimicrobials can prolong the illness and excretion in Nontyphoidal Salmonellosis [18]. Commonly used drugs for the treatments are fluoroquinolones and extended spectrum cephalosporins. However there are reports of antimicrobial resistance among these Salmonella strains to different classes of antibiotics and that has left us with only few options for treatment. Multidrug resistant Nontyphoidal Salmonellosis has become a global concern now. Community and healthcare associated outbreaks have been reported all over the world due to these resistant strains. Development of antimicrobial resistance is a naturally occurring phenomenon and it is often enhanced by use of antimicrobial agents for the treatment and prevention of infections in humans and animals as well as addition of these antibiotics as growth promoters or for feed efficiency in the food of animals which has favoured the selection and transference of drug resistant strains of Salmonella [29]. In animal antibiotic resistance impact in foodborne pathogens such as Salmonella is a major concern for public health safety. More focus is required to target them in the animal foods supply. Salmonella is difficult to eliminate from its reservoir hosts, and food animals often serve as reservoirs of the pathogen [30]. Antimicrobials may increase the susceptibility of animals to infection by suppressing normal flora and increasing the probability that pathogens will colonize a site (the “competitive effect”) or, if administered at the time of exposure to a resistant pathogen, by facilitating the infection because of a selective effect (the “selective effect”) (see Barza and Travers, this supplement). Resistant nosocomial salmonellosis attributable to antimicrobial therapy occurs in cattle, horses, cats, and probably other species, although little is published on this subject. Between 3% and 26% of resistant Salmonella infections of humans are acquired through a selective mechanism associated with antimicrobial treatments, according to Barza and Travers (this supplement). Comparable estimates for animals remain to be determined. Antimicrobials may prolong shedding or elevate levels of antimicrobial resistant pathogens in feces [28]. In its Framework document, the FDA states a concern about antimicrobial use in food animals increasing the pathogen load in an animal’s intestinal tract, which could increase infection risks for consumers. When challenged with Salmonella and exposed to antimicrobials in feed. Drug resistance development impact in the environment is one of the most noted consequences of antibiotic misuse and antibiotic pollution is the increased frequency of bacteria harboring ARGs in di_erent environments (here, antibiotic resistance is defined as any reduction in susceptibility in a bacterial strain compared to the susceptible wild type . An increase of antibiotic-resistance genes has also been observed in environmental. For example, ARG abundance for all classes of antibiotics was found to be significantly increased in soils from the Netherlands since the 1940s [31]. Resistance to antibiotics can be conveyed via a broad range of mechanisms. For example, antibiotics can be inactivated (e.g., beta-lactamases cleaving beta-lactams such as penicillin) or transported outside of the bacterial cell via e_ux pumps (e.g., Tet A proteins pumping tetracyclines outside of cells). The modification of the antibiotic’s target (e.g., point mutations in gyr A prevent binding by ciprofloxacin) is another common mechanism [32]. The prevalence of nosocomial (hospital-acquired) infections with resistant bacteria make hospitals and extended care facilities high interest environments to study the evolution and dissemination of antibiotic resistance. The microbial communities mostly associated with ARGs in hospitals are members of various human microbiomes as well as situated in hospital water and air flow systems [33]. Hospitals employ a broad range of antibiotics over extended time spans, thus enabling de novo resistance evolution, for example during long-term treatment of chronic infections. Environmental contamination and wildlife may also play a role in bovine S. typhimurium infection. Grazing cattle often obtain drinking water from streams and rivers which may receive effluent from sewage and meat processing plants. Streams and rivers can be a source of infection [31].

Transmission Modes

Bovine salmonellosis is spread by direct or indirect means. Infected animals are the source of the organisms; they excrete them and infect other animals, directly or indirectly by contamination of the environment, primarily feed and water supplies [34]. The farm animal may be infected in different ways: by animal-to-animal transmission, especially of host-adapted serovars; by contaminated animal feed; and by a contaminated environment (soil, birds, rodents, insects, water supplies). The excretion of salmonellas is exacerbated by the stress imposed [35]. Transmission of Salmonella to humans traditionally has been attributed to contaminated animal-product foods, but epidemiological studies have demonstrated that cases are sporadic and may more likely involve environmental sources than previously thought. It has been suggested that contaminated soils, sediments and water as well as wildlife may play a significant role in Salmonella transmission. Consumption of raw milk, inadequately pasteurized milk, improperly cooked beef from culled dairy cattle, contaminated water and direct animal contact are the major routes of acquiring dairy associated salmonellosis in humans [25]. Most Salmonella infection in farm animals are likely to acquire from animals of the same species, especially in the case of the host adapted serovars. In adult cattle there are important differences in the behavior of S. Dublin and S. typhimurium. Those animals which recover from S. dublin infection may become persistent excreters, shedding up to 106 organisms per gram of feaces daily. Other herd may harbor infection and excrete the organisms only when stressed particularly at parturition [19]. Aerosol transmission has long been suggested as a means by which Salmonella may be transmitted and experimental infection of calves by aerosol has been reported recently. In addition pasture contamination results when flooding occurs and there are many reports clinical case in adult cattle arising from grazing recently flooded pasture [2]. A wide variety of animal species have been shown to be capable of harboring the organisms and in the developed world turkey, chicken, swine and cattle are found to be infected carriers in the studies conducted in the abattoirs. These carriers may readily shed Salmonella during transportation to the abattoir and contaminate abattoir workers or equipment during slaughter. The progressive trend forwards mass processing and distribution of food products has been an important factor in the increase incidences of Salmonella foodborne diseases. Person to person spread has been demonstrated on many occasions and may take place in young children and group living under poor socioeconomic condition where effective sanitation is lacking. Person to person spread also may occur in hospitals, nursing homes, mental institution in which large number of outbreak has occurred [5]. Amplification of infection in these institutions may occur from contaminated food or asymptomatic carrier’s babies being at special risk [36]. Direct or indirect contact with animals colonized with Salmonella is another source of infection, including contact during visits to petting zoos and farms Fecal oral route and vehicle born infection may result from ingestion of food or water that have been contaminated with human or animal feaces or from direct exposure to animals or their waste. A lower infectious dose of organism is usually required in the elderly, the immunocompromised, antibiotic users and those with a chlorhydria or regular use of antacid and related medication [37]. The commonly recognized vehicle of transmission includes inadequate cooked or raw meat, unpasteurized milk or milk product, contaminated and inadequately treated drinking water [20]. Contamination of milk may occur by a variety of route. Animal may occasionally, excrete the organisms in milk during the febrile stage of the disease or more likely infected feaces, from either a clinically infected cow or healthy carrier may contaminate the milk during the milking process. Milk also may be contaminated from use of polluted water from dirty equipment or from dairy workers. Indirect contamination also has been described when cattle have become contaminated with Salmonella. Contamination of food also may occur directly from Salmonella infected food handlers or indirectly from sewage polluted water (Figure 1) [36].

fig 1

Figure 1: Transmission modes

Potential Risk Factors

Proximity to animals, food consumption behavidor, problems related to contamination of milk and meat, inadequate supply of treatment drugs, harsh environment (hot, dry and dusty zones), and socio economic and cultural practices are the main factors that expose the pastoralists to different zoonotic diseases [38]. Human behavior and level of education are further factors that may influence health status Migration may put nomadic pastoralists at periodical risk of infection, especially around water point. Since the animal and human interface is very intimate and common event in the pastoral areas of Ethiopia, it is very difficult to address the health of animals and humans separately but better if integrated. The pastoral area of Ethiopia is characterized by large size, limited development and inadequate supply of health care materials. The human population tends to be small, highly mobile, and difficult to reach, and derive their food and income from their livestock. The main concerns of the pastoral people are livestock diseases and water supply which contributed to the occurrence of different infectious diseases (Abebe, 2003).

Animal Risk Factors

The clinical characteristics of salmonellosis in large animals vary depending on the various management systems used, the intensity of stocking, whether or not the animals are housed, and the epidemiological characteristics of the different Salmonella species. The response to infection with a Salmonella sp. varies depending on the size of the challenge dose and the immunological status of the animal, itself dependent on colostrum intake in neonates, previous exposure to infection and exposure to stressors, particularly in older animals [39].

Environmental and Management risk Factors

Intensification of husbandry in all species is recognized as a factor contributing significantly to an increase in the new infection rate. Any significant change in management of the herd or a group of animals can precipitate the onset of clinical salmonellosis if the infection preexists in those animals. Temperature and wetness are most important, as salmonellas are susceptible to drying and sunlight [33].

Pathogen Risk Factors

Salmonellas are facultative intracellular organisms that survive in the phagolysosome of macrophages and can therefore evade the bactericidal effect of antibody. Compared to other organisms of the same family, salmonellas are relatively resistant to various environmental factors. They multiply at temperatures between 8°C and 45°C, at water activities above 0.94, and in a pH range of 4-8. They are also able to multiply in an environment with a low level of or no oxygen [40].

Human Source

The environmental and personal hygiene is one of the knowledge and practice restrictions of human from beef/dairy farm and abattoir food processing plants [41]. On the other hand food getting contamination depends largely on the health status of the food handlers. Food borne diseases are a public health problem in developed and developing countries like Ethiopia, the contamination occurs at any point during its journey through production, processing, distribution, and preparation. High standards of hygiene of personnel are required to maintain in food processing industries and dairy farms [8].

The host adapted serovars (some of which are human pathogens and may be contracted from foods): included are S. Gallinarum (poultry), S. Dublin (cattle), S. Abortusovis (sheep) and S. Choleraesuis (swine). Unadapted serovars (no host preference). These are pathogenic for humans and other animals, and they include most foodborne serova [42]. The Host-specific Salmonella serovars and the diseases, disease symptoms and pathological effects see on table 3 below (Table 3).

Table 3: Salmonella serovars, diseases, symptoms and pathological effects

Serovars

Host

Disease, symptoms, pathological lesions

S. Typhi

S. Paratyphi A, B, C

S. Dublin

S. Choleraesuis

S. Pullorum

S. Gallinarum

S. Abortusequi

S. Abortusovis

Humans

Cattle and calves

Pigs

Chickens, turkeys

Chickens, turkeys

Horses

Sheep

Typhoid fever, paratyphoid fever

Cattle: diarrhea, fever necrotic enteritis

Calves: diarrhea, fever, enteritis

Septicaemia, pneumonia, hepatitis

Pullorum disease

Fowl typhoid

Abortion

Abortion

Status of Bovine Salmonellosis in Ethiopia

Status of Bovine Salmonellosis in Ethiopia from (2003-2017) Food borne diseases are public health problems both in developed and developing countries. Thousands of millions of people fall ill and may die as a result of eating unsafe foods. Biological contaminants largely bacteria, constitute the major cause of food borne diseases. Salmonella infection most commonly occurs in countries with poor standards of hygiene in food preparation and handling and where sanitary disposal of sewage is lacking [43]. Studies indicated the widespread occurrence and distribution of Salmonella in Ethiopia. In Ethiopia, minced beef is usually used for the preparation of a popular traditional Ethiopian dish known as locally “Kitfo” and most of the time it is consumed raw or medium cooked. The habit of raw meat consumption and the presence of Salmonella in minced beef indicate, in addition to the poor hygienic standards in food handling in the country, the presence of great public health hazards of Salmonella. A number of studies conducted by different individuals on various slaughtered beef animals and foods of beef origin are showed the prevalence of Salmonella in the country as indicated in the Table 4 below.

Table 4: Prevalence of Bovine Salmonellosis in different parts of Ethiopia from 2003-2017

Area

Species

Sample type

Prevalence

Year

Addis Ababa and Modjo Sheep and goats Faeces, mesenteri lymph nodes, liver, spleen, and abdominal and diaphragmatic muscle

1.80%

2003/2004

Modjo Sheep and goats Skin swabs, mesenteric lymph nodes, hand swabs, caecal contents, knife swabs, carcass and water

8.90%

2007/2008

Addis Ababa Cattle Faecal and milk

10.76%

2010

Addis Ababa Abattoir enterprise Sheep and goats Liver, kidney, spleen, muscle, carcass, mesenteric lymph node and feces

1.04%

2010-2011

Gondar Cattle Raw meat and swab

17.30%

2013

Holeta Cattle Rectal feces, udder milk, pooled milkers, hand swab, tank milk, tank swabs, and bucket swabs

5.60%

2014

Asella Cattle Carcass swab, Hanging material swab, Knife swab, Hand swab, lymph node, Faeces, milk

6.50%

2014

Gondar Animal-origin food items Raw meat, minced meat, burger, raw eggs, and raw milk.

5.50%

2014-2015

Eastern Hararghe Sheep Faeces

6.19%

2014/2015

Addis Ababa Cattle Fecal and carcass swab

3.70%

2014/2015

Dessie Cattle Meat, eviscerating knives and

4.95%

2014/2015

Bahir Dar Cattle Meat

70%

2015

Modjo and Bishoftu Sheep and goats Cecum, liver, mesenteric lymph nodes, abdominal muscle

17.21%

2015/2016

Eastern Haraghe Cattle, sheep and goats Faeces

5.07%

2015/2016

Holeta Dogs Rectal Swab

17.10%

2015/2016

Ambo Cattle Mesenteric lymph nodes and feces

8%

2015/2016

Wolaita Sodo Cattle Abdomen, thorax, crutch, and breast

12.50%

2015/2016

Addis Ababa Cattle Feces, carcass swabs, milk

7.50%

2017

Economic Importance

Bovine Salmonellosis is a significant cause of economic loss in farm animals because of the cost of clinical disease, which include death, diagnosis and treatment of clinical cases, diagnostic laboratory cost, the cost of cleaning and disinfection and cost of control and prevention [17]. In addition when the disease is diagnosed in the herd, it can create a considerable apprehension in the producer because of difficulty on identifying infected animals. An estimation of economic impact of an outbreak of S. Dublin infection in calf rearing unit indicate that the cost of disease represented a substantial proportion of gross margin of rearing calves [9]. Estimated annual costs for salmonellosis have ranged from billions of dollars in United States to hundreds to millions of dollars in Canada and millions of pounds in United Kingdom. Analysis of five Salmonella outbreak due to manufactured food in North America gave direct cost with range from $36,400-$62 million, there have been few studies in to the cost and benefit of preventing Salmonella infection, but it has been suggested that for every £1 spent on investigation and curtailment of the outbreak there is a saving of £5 [2]. Both clinical outbreaks and subclinical infections of Salmonella can drain profit from the dairy operation. Salmonella infection in a dairy herd can lead to losses from: milk production decline, death in any age group of livestock, abortions, treatment costs, losses from antibiotic, contaminated milk, increased culling, increased cost due to delayed culling while antibiotic residues clear, increased labor for management of sick animals, reduced feed efficiency, the inability to sell animals originating from an “infected” herd. Salmonella infection in a herd is also a significant public health risk to farm families, employees and visitors. This disease has serious economic, animal health and public health implications. Your veterinarian should become involved as soon as Salmonella is suspected [17]. Costs of animal diseases are normally associated with reductions in animal populations and production. There are also costs related to the mitigation of disease, which include the money and resources expended to monitor, control and, in extreme cases, eliminate the disease agent. Animal diseases that reduce reproductive competence increase the proportion of breeding animals that have to be maintained and thereby reduce the overall efficiency of the population [44]. In a recent edition of the Morbidity and Mortality Weekly reported at the 2018. FoodNet findings citing 25,606 laboratory-confirmed cases of foodborne illness, which led to the hospitalization of 5,893 individuals and 120 deaths. In the 2018 FoodNet data, Salmonella was the second most commonly reported pathogen with 9,084 cases of illness (18.3 cases per 100,000 individuals). The most commonly reported Salmonella serotypes by case were Salmonella serotype Enteritidis (S. Enteritidis: 2.6 per 100,000 individuals), Salmonella serotype Newport (S. Newport: 1.6), and Salmonella serotype Typhimurium (S. Typhimurium) [12].

Conclusion and Recommendation

Bovine Salmonella is a leading cause of foodborne disease in human and consumption of both meat and milk has been implicated in salmonellosis outbreaks of people. Having animals and raw products it is not possible to be free from zoonotic agent; however the occurrences can be minimized by applying high standard of hygiene in all steps of the food production. Infected animals can present with a great variety of clinical symptoms, and risk factors for transmission to humans clearly differ by animal species, age groups, animal purpose and geographic region. In addition, strains of Salmonella resistant to multiple antibiotics have been isolated from dairy cow during salmonellosis outbreak on dairy operation. The same strains have also been isolated from ill people. A high degree of interaction between medical and veterinarian surveillance is needed. Finally, implementing basic and applied research to the agent that cause foodborne salmonellosis will be a crucial point for new approaches to prevent and control the disease. Based on the above facts the following recommendations are forwarded: Strict hygiene of the slaughter house and lairage, People should not drink unpasteurized milk or milk products and should not eat raw meat, Education of food handlers, Vaccination of cattle, Maintenance of cold chains, Setting import standards, Sanitary examination of the product, Collaboration between government agencies, professional organizations and special interest groups.

Acknowledgements

Above all, I would like to praise my Almighty God, for supporting me health wisdom and strength in my work and for his perfect protection and guidance of my life. I would like to express great thanks for my parents for their great consolidation and financial support to educate me and my advisor Dr. Bayan Ahmed for his active gueding and advising me in working this manuscript. Finally, I greatly acknowledge to Haramaya University library workers for supporting me internet service that helps me to get different data sources.

References

  1. Bhunia AK (2018) Foodborne Microbial Pathogens.
  2. Kemal J (2014) Journal of Veterinary Science & A Review on the Public Health Importance of Bovine Salmonellosis. 5(2) https://doi.org/10.4172/2157-7579.1000175.
  3. Kahsay AG (2020) Prevalence and antimicrobial resistance of animal Salmonellosis in Ethiopia Overview of Salmonellosis. 1-17.
  4. El-Ghany WAA (2006) Salmonellosis : A food borne zoonotic and public health disease in Egypt. 10-14. https://doi.org/10.3855/jidc.12739
  5. Abebe E, Gugsa G, Ahmed M (2020) Review on Major Food-Borne Zoonotic Bacterial Pathogens. 2020.
  6. Adem J, Bushra E (2016) Bovine Salmonellosis and Its Public Health Importance : A Review. 62-71.
  7. Williams BM, Med, BV (2010) Bovine Sal monellosis. 15.
  8. Cavallo SJ et al. (2015) Human outbreak of Salmonella typhimurium associated with exposure to locally made chicken jerky pet treats, New Hampshire, 2013. Foodborne Pathogens and Disease 12: 441-446. 2015.
  9. Adem J, Bushra E (2016) Bovine Salmonellosis and Its Public Health Importance : A Review. 62-71.
  10. Younus M, Idrees, M. A, Akram Q, Ahmad W, Sciences A, Sciences A, Sciences A, Significance, P. H (2021) Pathology and public health significance of salmonella.
  11. Eduardo S, Monroy A (2000) Salmonella in Domestic Animals.
  12. Jones P (2000) Living With Bovine Salmonellosis. 2(3), 1-8.
  13. Williams, B. M, Med, B. V (2010) Bovine Sal monellosis. 15.
  14. Industry B, Safety F (2020) Salmonella White Paper. January.
  15. Rohr, J. R, Barrett, C. B, Civitello, D. J, Craft, M. E, Delius B, Deleo, G. A, Hudson, P. J, Jouanard N, Nguyen, K. H, Ostfeld, R. S, Remais, J. V, Riveau G, Sokolow, S. H, Tilman D (2019) to global food production. Nature Sustainability, 2(June), 445-456. https://doi.org/10.1038/s41893-019-0293-3
  16. Safety F, Practices, F. H (2021) Salmonella , Food Safety and Food Handling Practices. 1-16.
  17. Majowicz, S. E, Musto J, Scallan E, Angulo, F. J, Kirk M, Brien, S. J. O, Jones, T. F, Fazil A, Hoekstra, R. M, Collaboration I, Burden D (2010) The Global Burden of Nontyphoidal Salmonella Gastroenteritis. 50, 882-889. https://doi.org/10.1086/650733
  18. Hoelzer K, Isabel A, Switt M, Wiedmann M (2011) Animal contact as a source of human non-typhoidal salmonellosis. 1-28.
  19. Pal M, Teashal, B. M, Gizaw F, Alemayehu G, Kandi V (2020) Animals and Food of Animal Origin as a Potential Source of Salmonellosis : A Review of the Epidemiology , Laboratory Diagnosis , Economic Impact and Public Health Significance. 8(2), 48-56. https://doi.org/10.12691/ajmr-8-2-2.
  20. Zekarias T, Mandado T (2020) Public Health Importance of Bovine Salmonellosis in Ethiopia : A Review. 22(1), 1-8. https://doi.org/10.5829/idosi.gv.2020.01.08
  21. Johnson, T. J, Wannemuehler, Y. M, Johnson, S. J, Logue, C. M, White, D. G, Doetkott C, Nolan, L. K (2007) Plasmid replicon typing of commensal and pathogenic Escherichia coli isolates. Applied and Environmental Microbiology, 73(6), 1976-1983. https://doi.org/10.1128/AEM.02171-06
  22. Heredia N, García S (2018) Animals as sources of food-borne pathogens : A review. Animal Nutrition, 4(3), 250-255. https://doi.org/10.1016/j.aninu.2018.04.006
  23. Muktar Y, Abera G, Kemal J, Medicine V, Box, P. O, Dawa D (2015) Antibiotic Resistance in Salmonella Species , a Serious Public Health Problem : A Review. 15(5), 469-479. https://doi.org/10.5829/idosi.gv.2015.15.05.96225
  24. Sahoo, K. C, Tamhankar, A. J, Johansson E, Lundborg, C. S (2010) Antibiotic use , resistance development and environmental factors : a qualitative study among healthcare professionals in Orissa , India.
  25. Molossi, F. A, Lorenzett, M. P, , Sonne L, Driemeier D (2021) Epidemiological and pathological aspects of salmonellosis in cattle in southern Brazil.
  26. AC F (2005) Towards more virulent and antibiotic-resistant Salmonella ? FEMS Immunol Med Microbiol 43:1-11.
  27. Nair, D. V. T, Venkitanarayanan K, Johny, A. K (2018) Antibiotic-Resistant Salmonella in the Food Supply and the Potential Role of Antibiotic Alternatives for Control. https://doi.org/10.3390/foods7100167
  28. Casarin, R. A (2018) Antimicrobial Resistance : Its Surveillance , Impact , and Alternative Management Strategies in Dairy Animals. 4(January), 1-27. https://doi.org/10.3389/fvets.2017.00237
  29. Article R (2017) Drug Resistance in Nontyphoidal Salmonella- Challenges for the Future. 6-11.
  30. Mcewen, S. A, Fedorka-cray, P. J (2002) Antimicrobial Use and Resistance in Animals. 34(Suppl 3), 93-106.
  31. Kraemer, S. A, Ramachandran A, Perron, G. G (2019) Antibiotic Pollution in the Environment : From Microbial Ecology to Public Policy. 1-24.
  32. Review S, Ramatla T, Tawana M, Onyiche, T. E, Lekota, K. E, Thekisoe O (2021) Prevalence of Antibiotic Resistance in Salmonella Serotypes Concurrently Isolated from the Environment , Animals , and Humans in South Africa : A Systematic Review and.
  33. Agency, U. S, Development I (2019) Livestock growth, public health and the environment.
  34. States U, States U (2013) Signs and Symptoms Diagnosis Treatment Transmission. 2011-2013.
  35. Kachni, J. Č, Sasáková N, Papajová I, Ová, K. V. L. Č, Hromada R (2013) The risk to human health related to disposal of animal wastes to soil – microbiological and parasitical aspects. 147-154. https://doi.org/10.2478/s11687-013-0124-4.
  36. Barrow P.A, Jones MA, T. N (2010) Pathogenesis of bacterial infection in animals 4th edition. Edited by Gyles, C.L, Songer, G. Theon, C.O: Blackwell publishing 233. 2010.
  37. Orriss, G. D (1997) Animal Diseases of Public Health Importance. 3(4), 497-502.
  38. Takele S, Woldemichael K, Gashaw, M., Tassew H, Yohannes M, Abdissa A (2018) Prevalence and drug susceptibility pattern of Salmonella isolates from apparently healthy slaughter cattle and personnel working at the Jimma municipal abattoir ,. 1-7.
  39. Mcdaniel, C. J, Cardwell, D. M, Moeller, R. B, Gray, G. C (2014) Humans and Cattle : A Review of Bovine Zoonoses. 14(1) https://doi.org/10.1089/vbz.2012.1164
  40. Jajere, S. M (2019) A review of Salmonella enterica with particular focus on the pathogenicity and virulence factors, host specificity and antimicrobial resistance including multidrug resistance. Vet World. 12, 2019.
  41. CDC (2014) Control and Prevention, Eight multistate outbreaks of human Salmonella infections linked to small turtles (final update)
  42. DSM (2009) Diagnostic Services of Manitoba (DSM) (2009): Salmonella Nomenclature and the Reporting of Results on Salmonella Species: Memorandum. 2009.
  43. Husbandry A (2020) Salmonella and Its Status in Ethiopia. 7(1)
  44. Federation I, Health A (2012) The Costs of Animal Disease. October.

Rethinking Assessment: Advancing Equity and Learning in Education: A Critical Analysis of “Ungrading: The Case for Abandoning Institutionalized Assessment Protocols and Improving Pedagogical Strategies”

DOI: 10.31038/PSYJ.2023574

Introduction

As the corresponding author of the article titled “Ungrading: The Case for Abandoning Institutionalized Assessment Protocols and Improving Pedagogical Strategies,” published in Educational Science, I would like to provide a comprehensive commentary on our work. It scrutinizes the flaws in our current assessment practices and proposes innovative approaches that promise a more inclusive, dynamic, and adaptable educational experience [1]. This commentary aims to shed light on the key points, methods, and implications of our study while offering insights into its significance and areas for further research.

Summary

In our article, we challenge the conventional grading systems prevalent in education and advocate for a paradigm shift towards assessing students based on improvement scores [1]. To demonstrate the effectiveness of this approach, we conducted a pilot study involving 40 students in a general physics class at a local Californian university. Our study primarily focuses on a Hispanic-descendant student group, with an average age of 22.5 years and a predominantly male composition. We administered both pre-test and post-test assessments, specifically the Force Concept Inventory (FCI), to establish a baseline understanding of force concepts and to gauge the impact of our instructional sessions on force. We subsequently calculated improvement scores for each student and converted them into a 0 to 30 grading scale using a modified formula that considers difficulty scores. Our findings indicated significant differences between baseline, actual, and new test scores, with the latter two demonstrating higher mean performance [1].

Critical Analysis

Strengths

  • Innovative Approach: Our article presents an innovative approach to grading that prioritizes individual student progress, fostering a growth mindset and reducing competition.
  • Inclusion of Difficulty Score: By incorporating a difficulty score into our grading formula, we introduce a nuanced perspective that acknowledges the influence of test difficulty on student performance.
  • Emphasis on Individual Growth: We emphasize the importance of recognizing and celebrating students’ individual growth, which has the potential to create a more positive learning environment.
  • Integrating Technology: The article introduces the concept of using AI-powered adaptive learning tools to enhance the learning experience and address diverse learning needs.

Weaknesses

  • Limited Sample Size: We acknowledge the limitation of a relatively small sample size, which may affect the generalizability of our findings to a broader student population.
  • Short-Term Focus: Our study primarily focuses on short-term improvements within a single semester, and further research is needed to assess the long-term effects of our proposed grading changes.
  • Potential for Bias: Despite our efforts to address bias, the modified grading formula may still introduce bias, potentially impacting the fairness of the grading system.

Engage with the Content

As the corresponding author, I fully endorse the argument presented in our article. Traditional grading systems often create unnecessary competition among students and do not adequately recognize individual growth. Shifting the focus to improvement scores aligns with our commitment to promoting a growth mindset and reducing student anxiety [1]. The insights from the use of technologies, the article reinforce the importance of using a variety of assessment methods to understand students’ prior knowledge and address misconceptions. The proposed hyperflex learning strategy, personalized learning, combining one-on-one peer interaction and self-paced online learning, presents an inclusive approach to supporting students with diverse learning paces. This strategy, enhanced by AI tools, offers a promising way to cater to individual needs effectively. However, I also recognize the limitations of our study, including the small sample size and the need for long-term assessment. These limitations provide valuable insights for future research, which should aim to address these issues and refine our proposed grading approach.

Implications and Significance

Our article’s emphasis on improvement scores has the potential to revolutionize educational practices, fostering a more inclusive learning environment and empowering students to take ownership of their progress. Recognizing individual growth and eliminating unnecessary competition are significant contributions to the field of education. The use of AI-powered adaptive learning tools, as highlighted in the section on new ideas, offers personalized learning experiences that can address individual student needs, identify challenges, and provide timely interventions. The reward system and the emphasis on questioning techniques further contribute to making learning more accessible, experiential, and equitable [1]. By considering these innovative ideas and incorporating AI tools, educators can create adaptable and inclusive learning environments that empower students to take ownership of their education and foster essential skills for lifelong learning.

Conclusion

Our article, “Ungrading: The Case for Abandoning Institutionalized Assessment Protocols and Improving Pedagogical Strategies,” offers an innovative perspective on grading. These methods foster student ownership of education, encourage active participation in their learning journey, and equip them with the skills and knowledge needed for lifelong success. While it has strengths in promoting a positive learning environment and recognizing individual growth, we acknowledge its limitations. We encourage further research to refine and validate the proposed grading approach, emphasizing the importance of ongoing dialogue about effective teaching and learning strategies.

References

  1. Crogman HT, Eshun KO, Jackson M, Trebeau Crogman MA, Joseph E, et al. (2023) Ungrading: The Case for Abandoning Institutionalized Assessment Protocols and Improving Pedagogical Strategies. Education Sciences 13: 1091.

Plasticity of Pancreatic Acinar Cells-Lesson from Hpa2- KO Mice

DOI: 10.31038/CST.2023834


The pancreas is made predominantly of acinar (exocrine aspect) and duct cells, while the islet cells (endocrine aspect) make up to 2% of the pancreas. Importantly, these cell types display remarkable plasticity and can alter cellular identity in response to injury, regeneration, and repair [1]. With the limitations due to ethical issues, much of our understanding of genes and molecular pathways that modulate the development, differentiation, and homeostasis of the pancreas originates from animal studies. Utilizing a newly developed conditional knockout (KO) mouse model, Kayal et al have recently reported that heparanase-2 (Hpa2) plays a critical role in acinar cell differentiation and protects the pancreas from malignant transformation and inflammation [2]. Heparanase is a unique enzyme due to its endoglycosidase activity, capable of cleaving heparan sulfate (HS) side chains of heparan sulfate proteoglycans (HSPG). HSPG are highly abundant in the extracellular matrix (ECM) and assist in assembling the major protein constituents of the ECM and basement membrane (i.e., laminin, fibronectin, collagen IV) into a three-dimensional, non-soluble matrix that provides structural support and biochemical cues to many cell types. Cleavage of HS by heparanase thus results in remodeling of the ECM, which in the pancreas results in impaired islet β cell survival [3]. These structural and biochemical alterations exert a profound impact on cell behavior including, among others, cell viability, differentiation, proliferation, migration and invasion. The latter is most often associated with increased metastatic capacity of tumor cells and augmented entry of immune cells into sites of inflammation. This, and many other mechanisms utilized by heparanase to promote tumorigenesis, have turned this enzyme into a promising drug target and heparanase inhibitors are currently being evaluated in clinical trials as anti-cancer drugs [4,5]. HPSE2, the gene encoding heparanase-2 (Hpa2), was cloned soon after the cloning of heparanase, based on sequence homology. Interestingly, Hpa2 lacks intrinsic HS-degrading activity, the hallmark of heparanase, yet retains the capacity to bind HS with high affinity, thereby competing for HS and inhibiting heparanase enzymatic activity capacity. Unlike the intense research effort devoted to exploring the significance of heparanase in cancer progression, very little attention was given to Hpa2. The emerging role of Hpa2 in autosomal recessive congenital disease called urofacial syndrome (UFS) [6,7], clearly indicates that Hpa2 plays a critical role in human disorders. To further explore the role of Hpa2 in tumorigenesis, Kayal et al generated a conditional Hpa2-knockout (KO) mouse. Interestingly, it was observed that the pancreas of Hpa2-KO female mice is smaller, presenting half the weight of wild-type pancreas when calculated relative to body weight. Importantly, heparanase enzymatic activity was dramatically increased in pancreatic tissue derived from Hpa2-KO mice vs. control, wt mice. Histological examination revealed significant morphological abnormalities in Hpa2-KO vs. wt pancreas. A large proportion of the Hpa2-KO pancreas appeared to consist of fat cells, replacing the pancreas acinar cells (Figure 1), possibly the result of acinar-to-adipocyte transdifferentiation (AAT) [8]. In addition, a substantial number of duct-like structures were observed only within the Hpa2-KO pancreas. These were stained positive for cytokeratin 19 and Sox 9 and exhibited high proliferative capacity. In addition, these structures deposited large amounts of collagen and were stained strongly with alcian blue that labels HS. Altogether, indicating that the Hpa2-KO pancreas undergoes acinar-to-ductal metaplasia (ADM) [9] and turns into fatty tissue. Fatty pancreas was first observed in the 1930s by imaging studies performed for other indications; it was thought to be an incidental finding and its clinical implications were not thoroughly investigated. In recent years, however, there has been accumulating evidence supporting the association of fatty pancreas with the development of pancreatic cancer as well as other pathologies of the human pancreas [10,11]. Kayal et al demonstrated that this pro-tumorigenic environment not only supports the growth of implanted cancer cells but, unlike wt mice, also leads to the development of pancreatic neoplasia once mice are exposed to conditions that elicit mutations (carcinogen) and prolonged inflammation (cerulein) [2]. These results strongly support the notion that Hpa2 functions as a tumor suppressor; in its absence, tissues become more prone to the development of pre-malignant and malignant lesions.Unlike female Hpa2-KO mice, the male Hpa2-KO pancreas did not exhibit accumulation of fat, AAT, and ADM. However, foci ofinflammation were readily detected within the Hpa2-KO pancreas of young (3-month-old) and older (8-month-old) male mice. Kayal et al, then, exposed wt and Hpa2-KO male mice to cerulein, best recognized for its capacity to induce acute pancreatitis. Importantly, it was found that Hpa2-KO male mice responded vigorously to cerulein, resulting in the accumulation of fat cells and ADM to an extent comparable with female Hpa2-KO pancreas [2]. Thus, within one day, the morphology of male Hpa2-KO pancreas approached the morphology observed in the female pancreas, implying that abnormal cellular and molecular mechanisms were already turned on in response to Hpa2 knockdown, awaiting induction. Collectively, it was concluded that Hpa2 functions to preserve the identity of acinar cells; deficiency of Hpa2 results in pre-neoplastic pancreas which, in response to further insults, develops into pancreatic neoplasia. It is hoped that the protective effects of Hpa2 against cancer and inflammation will be translated to the development of Hpa2-based therapeutic strategies.

fig 1 new

Figure 1: H&E staining of pancreatic tissue sections showing the morphology of wild-type (wt) vs. Hpa2-KO pancreas and demonstrating the replacement of acinar cells by fat cells

Funding

These studies were generously supported by research grants awarded by the Israel Science Foundation (ISF-1021/19); The Israel Cancer Association (ICA), the US-Israel Binational Science Foundation (BSF2021059); and the Technion Integrated Cancer Center (TICC) Rubinstein scholarship (to YK).

References

  1. Grimont A, Leach SD, Chandwani R (2022) Uncertain Beginnings: Acinar and Ductal Cell Plasticity in the Development of Pancreatic Cancer. Cell Mol Gastroenterol Hepatol 13: 369-82. [crossref]
  2. Kayal Y, Barash U, Naroditsky I, Ilan N, Vlodavsky I (2023) Heparanase 2 (Hpa2) – A new player essential for pancreatic acinar cell differentiation. Cell Death Dis 14: 465. [crossref]
  3. Ziolkowski AF, Popp SK, Freeman C, Parish CR, Simeonovic CJ (2012) Heparan sulfate and heparanase play key roles in mouse beta cell survival and autoimmune diabetes. J Clin Invest 122: 132-41. [crossref]
  4. Dredge K, Brennan TV, Hammond E, Lickliter JD, Lin L, Bampton D, et al. (2018) A Phase I study of the novel immunomodulatory agent PG545 (pixatimod) in subjects with advanced solid tumours. Br J Cancer 118: 1035-41. [crossref]
  5. Galli M, Chatterjee M, Grasso M, Specchia G, Magen H, Einsele H, et al. (2018) Phase I study of the heparanase inhibitor roneparstat: an innovative approach for ultiple myeloma therapy. Haematologica 103: e469-e72. [crossref]
  6. Daly SB, Urquhart JE, Hilton E, McKenzie EA, Kammerer RA, Lewis M, et al. (2010) Mutations in HPSE2 cause urofacial syndrome. Am J Hum Genet 86: 963-9. [crossref]
  7. Pang J, Zhang S, Yang P, Hawkins-Lee B, Zhong J, Zhang Y, et al. (2010) Loss-of-function mutations in HPSE2 cause the autosomal recessive urofacial syndrome. Am J Hum Genet 86: 957-62. [crossref]
  8. Bonal C, Thorel F, Ait-Lounis A, Reith W, Trumpp A, Herrera PL (2009) Pancreatic inactivation of c-Myc decreases acinar mass and transdifferentiates acinar cells into adipocytes in mice. Gastroenterology 136: 309-19 e9. [crossref]
  9. Parte S, Nimmakayala RK, Batra SK, Ponnusamy MP (2022) Acinar to ductal cell trans-differentiation: A prelude to dysplasia and pancreatic ductal adenocarcinoma. Biochim Biophys Acta Rev Cancer 1877: 188669. [crossref]
  10. Khoury T, Sbeit W (2022) Fatty Pancreas and Pancreatic Cancer: An Overlooked Association? J Clin Med [crossref]
  11. Truong E, Pandol S, Jeon C (2022) Uniting epidemiology and experimental models: pancreatic steatosis and pancreatic cancer. EBioMedicine 79: 103996. [crossref]

Nanocarriers for Exploring the Potential of Chlorogenic Acid

DOI: 10.31038/NAMS.2023644


Chlorogenic acid (CGA) is a polyphenolic compound found in various plant-based foods, particularly in coffee, fruits, and vegetables. It has gained attention due to its potential health benefits, including antioxidant and anti-inflammatory properties [1-3]. Despite the potential health benefits associated with chlorogenic acid, its bioavailability is relatively low. Several factors contribute to this limited utilization. Firstly, chlorogenic acid exhibits low water solubility, impeding its dissolution in the gastrointestinal tract. Consequently, its bioavailability is restricted, as the absorption of hydrophobic compounds such as chlorogenic acid often relies on their solubility in aqueous environments [3]. Furthermore, it should be noted that Chlorogenic acid exhibits sensitivity towards various factors including heat, light, and enzymatic activity. The exposure to these aforementioned elements has the potential to induce the degradation of chlorogenic acid, thereby diminishing its stability and bioavailability [4]. This susceptibility to degradation can manifest during the stages of food processing, storage, or even within the digestive environment. Moreover, even in cases where chlorogenic acid is successfully absorbed, its distribution to targeted tissues may be hindered. The compound must effectively reach specific sites within the body in order to exert its therapeutic effects, and the challenges associated with tissue distribution may contribute to its relatively low utilization rate.

To address the challenges associated with the low bioavailability of chlorogenic acid, researchers have developed various of nanocarriers, such as micelles, liposomes, or nanoparticles, to promote its dissolution in aqueous environments and facilitate its absorption in the gastrointestinal tract, finally improving its application in biomedical field [5,6]. These nanocarriers also act as protective shields, preventing the direct exposure of chlorogenic acid to environmental factors, which could maintain the stability of chlorogenic acid during storage and transportation, ensuring its bioavailability upon administration [7,8]. The nanocarriers can be designed to provide controlled and sustained release of chlorogenic acid [9]. This controlled release profile can extend the time that chlorogenic acid is available for absorption in the gastrointestinal tract. A controlled release also contributes to a prolonged therapeutic effect, reducing the need for frequent dosing. By enhancing the targeted delivery and controlled release of chlorogenic acid, nanocarriers may help reduce side effects associated with systemic exposure. This is particularly relevant when aiming to concentrate the therapeutic effects of chlorogenic acid at specific sites while minimizing its impact on healthy tissues.

In summary, nanocarriers provide a versatile and effective platform for improving the bioavailability of chlorogenic acid, addressing challenges associated with its natural properties. These advantages make nanocarrier-mediated delivery an attractive strategy for enhancing the therapeutic potential of chlorogenic acid in various applications, from pharmaceuticals to functional foods. However, how to fine-tune the formulation of nanocarriers to achieve optimal properties such as particle size, surface charge, and stability, ultimately improving the overall effectiveness of chlorogenic acid delivery, remains an urgent issue. Additionally, understanding the biodistribution and clearance of nanocarriers in vivo is critical for predicting their efficacy and potential long-term effects. The fate of nanocarriers after administration, including whether they accumulate in specific organs or are efficiently cleared from the body, remains an area of active research. Addressing these disadvantages and unresolved issues will be crucial for harnessing the full potential of nanocarriers in grafting chlorogenic acid and ensuring the development of safe and effective therapeutic strategies.

References

  1. Lu H, Tian Z, Cui Y, et al. (2020) Chlorogenic acid: A comprehensive review of the dietary sources, processing effects, bioavailability, beneficial properties, mechanisms of action, and future directions. Comprehensive Reviews in Food Science and Food Safety 19: 3130-3158. [crossref]
  2. Wang H, Tian L, Han Y, et al. (2022) Mechanism Assay of Honeysuckle for Heat-Clearing Based on Metabolites and Metabolomics. Metabolites 12(2). [crossref]
  3. Wang D, Tian L, Lv H, et al. (2020). Chlorogenic acid prevents acute myocardial infarction in rats by reducing inflammatory damage and oxidative stress. Biomedicine & Pharmacotherapy = Biomedecine & Pharmacotherapie 132: 110773. [crossref]
  4. Psotová J, Chlopcíková S, Miketová P, et al. (2004) Chemoprotective effect of plant phenolics against anthracycline-induced toxicity on rat cardiomyocytes. Part III. Apigenin, baicalelin, kaempherol, luteolin and quercetin. Phytotherapy research : PTR 18: 516-521.
  5. Li X, Zhu S, Yin P, et al. (2021) Combination immunotherapy of chlorogenic acid liposomes modified with sialic acid and PD-1 blockers effectively enhances the anti-tumor immune response and therapeutic effects. Drug delivery 28: 1849-1860. [crossref]
  6. Li H, Xu J, Hu JF, et al. (2022). Sustained release of chlorogenic acid-loaded nanomicelles alleviates bone loss in mouse periodontitis. Biomaterials science 10: 5583-5595.
  7. Roy T, Dey SK, Pradhan A, et al. (2022). Facile and Green Fabrication of Highly Competent Surface-Modified Chlorogenic Acid Silver Nanoparticles: Characterization and Antioxidant and Cancer Chemopreventive Potential. ACS omega 7: 48018-48033.
  8. Wang T, Yin L, Ma Z, et al. (2022). Chlorogenic Acid-Loaded Mesoporous Silica Nanoparticles Modified with Hexa-Histidine Peptides Reduce Skin Allergies by Capturing Nickel. Molecules (Basel, Switzerland) 27(4). [crossref]
  9. Yao M, McClements DJ, Zhao F, et al. (2017). Controlling the gastrointestinal fate of nutraceutical and pharmaceutical-enriched lipid nanoparticles: From mixed micelles to chylomicrons. NanoImpact 5: 13-21.

In their Own Language: Communicating Health to Boost Compliance for Weight Loss and Diabetes

DOI: 10.31038/EDMJ.2023734

Abstract

101 older female respondents evaluated different sets of messages (vignettes) dealing with diabetes, obesity, and how to deal with them. Regression analysis related the ratings to the presence/absence of the messages. Most messages were perceived as appropriate to the respondent, suggesting a positive blandness and ineffectiveness of messaging. Clustering the respondents by the pattern of coefficients revealed three different mind-sets of approximately equal size, respectively; Focus on medical indicators, Focus on lifestyle, and Focus on drinking water. A mind-set assigner comprising six questions was developed to identify new people, who can then be messaged more convincingly based upon the mind-set to which they are assigned.

Introduction

It is clear that the rampant increase in the obesity followed by diabetes is becoming the most threatening problem to world health. Our lifestyle, the foods that we eat, the reduction in exercise, and the more sedentary behavior has changed affected our health. Overweight is rampant world-wide, and diabetes is not far behind. Both the popular press and the scientific literature abound with material on the spread of obesity [1-3].

There are drugs on the market which reduce intake [4], and a whole industry of dieticians who, for fee, can personally monitor a person, suggesting what to do in order for the person to be heathier. For those who can afford it, both financially and physically, there are retreats [5], dietetic coaches [6], new ways of reducing weight such as the buddy system for dieting [7], and of course bariatric surgery [8]. It may be possible to reduce the deleterious effects of being overweight through the judicious application of the arsenal of tools.

The issue addressed by this paper is whether it might be possible to enhance the messaging to those who are diabetic using the newly emerging technology of AI, artificial intelligence, coupled with a traditional research approach, conjoint measurement. The objective of the effort is to see what can be done in the space of 24 hours, using available technologies, with the goal of creating a systematized, industrial-sale system which teaches how to communicate health issues with people.

The origins of this paper come from three different sources.

  1. The use of personal computers and the internet to make consumer research fast, easy, and inexpensive. The approach used here, Mind Genomics, traces its history over a 30+ year period from the early 1990’s. The goal was to take a well-accepted research techniques in consumer science, conjoint measurement, and port it over to a DIY, do-it-yourself system. Summarizing Mind Genomics, one can think of presenting combinations of messages, elements, to a person, getting the person to react to these combinations, and then determining what specific feature or element drives the rating. The objective here is to simulate nature, which presents people with combinations, scenarios, to which the person reacts. Responding to mixtures is more nature, more ‘ecologically valid’ than responding to single ideas.
  2. The desire to create better messaging for the world of medicine. Messaging is the way that people can be encouraged to comply. Messaging is the way that the doctor can tell the patient what the problem is, and what may need to be done, as well as the specific words to say it. One might think that with the advances of medicine the messaging will take care of itself, but the reality is that often messaging is the ‘last mile,’ and fails the patient. The messaging may be relevant but motivating to the respondent. Or, the messaging may be incorrect, or even both. Years of experience can fine tune the messaging, but what happens when the person is a new graduate, and dozen have years.
  3. The ongoing effort to create a ‘wiki of the mind’, a systematized database of how people respond to the different aspects of everyday life. The idea is to explore the world of the everyday in a systematized manner, almost in the manner of a cartographer of the mind. The approach, called grounded research theory (REF), stands in contrast to the more popular method of hypothetical deductive reasoning, which posits how the world works, sets up a study to confirm or disconfirm, and then proceeds to implementing the experiment. The systematized exploration of the everyday experience does not lend itself to an explanation of how the world works; but rather just ‘what’s actually going on.’

Beyond Simple Questionnaires to Probing the Mind with Mind Genomics

The conventional way of understanding people’s thinking is through simple questionnaires. We are inundated with questionnaires, the modern era suffused with the desire to gain feedback on every interaction with a person and a service provider. Whereas previously questionnaires were often long documents with the respondent asked to score different facets of life, or an experience, today’s questionnaires are short, limited to a topic of one’s experience. Whether one works with a short questionnaire after an interaction, or with a long A&U (attitude and usage) questionnaire, the objective is the same, namely understand at an intellectual level how a person feels about a topic. These questionnaires parse the experience or topic into different, cleanly and surgically divided sections, instructing the respondent to think of each topic or each question, one topic at a time, and in isolated thought rate aspects of that topic. Along with the effort to administer these questionnaires there is an accompanying cadre of analytics, mainly summarizations of the data, data reduction principal component factor analysis [9], and clustering [10], to paint a picture.

The Evolution and Contribution of Mind Genomics to the Issue of Understanding and Messaging

The emerging science of Mind Genomics can be summarized as an experimenting science which understands how people respond to the ordinary world, such understanding promoted by the evaluation of systematically created vignettes of daily life, and the deconstruction of responses to those vignettes into the ‘driving power’ of the components of the vignettes, the ‘elements’. The description of Mind Genomics in this way hints at Mind Genomics as an experimenting science, rather than an observational science. It is the experimentation with features of the ‘ordinary’ which enables the Mind Genomics researcher to craft a new understanding of how people think when they are exposed to the world of ordinary life. In a Mind Genomics study there is no need to alter reality to establish a principle. Rather, the altered realities are simply combinations of features of the everyday, recombined into simple combinations that are evaluated, the pattern of responses showing how ‘nature is working’.

Mind Genomics plays a role in understanding the messaging about weight and diabetes because the messages are relevant to the topic. As will be shown below, the different combinations of messages end up judged in different ways by a person. The carefully created set of combinations of messages, the vignettes, put together through experimental design, present slightly different ‘realities’ to the respondent. It is the pattern of response to these different realities which allows for an immediate understanding of how people react to the messaging. A key benefit of the Mind Genomics approach is its ability to prevent a respondent from ‘gaming’ the system. Thus, Mind Genomics avoids biases which plague many survey methods, especially those dealing with sensitive topics [11,12].

The original work of Mind Genomics dealt with commercial products [13]. These studies were inspired by the pioneering work of the late Professor Paul Green of the Wharton School, University of Pennsylvania [14]. It was Green and his colleagues, especially Yoram Wind, who took the rather esoteric method of conjoint measurement, and, simplifying the notion of understanding ideas by studies of mixtures, brought conjoint measurement into common use. Mind Genomics made the system even simpler and more robust by having the respondents each evaluate different sets of combinations of ideas, each set created to allow for subsequent statistical analysis at the level of the individual [15]. The approach evolved to a DIY (do it yourself) system, with automated analysis and reporting [16,17]. The approach presented here is an example of that latest evolution. A history of Mind Genomics can be found in a variety of published papers [13,18].

Applying Mind Genomics to the Study of How to Communicate Weight Control

The remainder of this paper is devoted to an explication of the Mind Genomics approach to uncovering what to say to people to encourage weight control. The Mind Genomics approach follows a series of templated steps, so that the discoveries presented in this paper end up being simply empirically ‘fleshed out’ data tables and figures. That is, standardized approach to Mind Genomics studies provides the researcher with a tool that can be applied quickly and usually productively to a problem.

Step 1 – Create a name for the study, or really for the experiment. This first step may seem obvious, but the reality of research is that the novice researcher often fails to crystallize the reason for the study, and the topic. Rather, the novice attempts to put into the title the entire research project, rather than separating out the general topic from the specific method. The study here was simply called Diabetes Weight, a name which allowed the researchers to focus on different ways to think about the topic.

Step 2 – Develop four questions pertaining to the topic. The actual test stimuli for Mind Genomics comprise four sets of four phrases each. In turn, each set of four phrases represent four alterative ‘ideas’, or messages about the topic. The structure of four questions allows the researcher to answer each question. It will be the answers to the questions which constitute the test material that the respondent will evaluate. Thus, the structure of the question/answer is a way to focus the mind of the researcher, with the questions serving as an aid to thinking, and as a bookkeeping device.

It is at the stage of creating four questions that many prospective researcher find the task to be difficult. Our education does not teach people to think critically, focusing as it does on answering questions rather than developing them. It should come as no surprise that at this early stage in the Mind Genomics process many prospective researchers become frustrated and give up. It is a tribute to grade school and high students that they find this challenge to be fun, rather than frustrating, and proceed to come up with questions far more readily than do older people, and even far more readily than professionals.

In order to address the long-standing issue of ‘creating the raw material’, viz., questions but also answers, recent versions of the Mind Genomics platform have incorporated artificial intelligence, AI, as a TACT, Technical Aide to Creative Thought. That term was first used almost 60 years ago by the late Professors Anthony Gervin Oettinger at Harvard University, but it is appropriate here. The researcher need not come up with the actual questions, but instead must come up with a ‘squib’ or short paragraph about the topic. It is that ‘squib’ which will become the prompt for embedded AI, GPT3.5 [19].

Figure 1 shows screenshots which allow the researcher either to put in her or his questions, or to request that the AI embedded in “Idea Coach” suggest questions. Not surprising is the observation that having a ‘coach’ to help with the questions changes the set-up, so that it becomes intriguing and fun, rather than frightening. Panel A shows the set of four placeholders in which the researcher is to type a question. Panel A is stark, forbidding, a tabula rasa, a blank sheet, with little to support the researcher. The researcher who wants to use AI need only press the Idea Coach button, and be quickly guided away to a safer place, the box in Panel B. Of course, the researcher must talk about the project, but as we will see, the Idea Coach is forgiving, letting the researcher iterate.

fig 1

Figure 1: The completed set of four questions, after being edited and polished by the researcher

Once the researcher has composed the squib and put it into Figure 1, Panel B, the Idea Coach returns with a proposed set of questions. Each iteration of the Idea Coach generates 15 different questions. The researcher can iterate as many times as desired, changing the squib or keeping the squib the same. The AI will return a number of new questions each time, and occasionally repeat a question. At the end of the iteration the research will have developed four questions and can edit them. Figure 2 shows the completed set of four questions after they have been developed by Idea Coach, and ‘edited’ in preparation for the answers.

fig 2

Figure 2: The completed set of four questions, after being edited and polished by the researcher

After the squib is constructed and put into Figure 1, Panel B, Idea Coach creates a set of 15 questions from a squib in approximately 10-20 seconds. The researcher can select a question or several questions, dropping them into the study, and editing them. When the researcher does not find a question to drop into the study it is easy to re-run the Idea Coach, either with the same squib or with a revised squib. The process can go on several times, until the researcher has uncovered four questions, using Idea Coach and/or developing the question(s) oneself. Idea Coach truly becomes a coaching tool after the researcher gains experience.

At the end of the development of questions, and later of answers, the Mind Genomics platform stores each of the iterations of 15 questions (and 15 answers) on a separate Excel tabulation. As the study is being closed, the platform subjects each set of 15 questions (or answers) to an extensive summarization, using AI, with specific prompts. Table 1 presents the AI summarization of the first set of 15 questions.

Table 1: First results from the AI-powered Idea Coach, attempting to develop questions from the squib

tab 1(1)

tab 1(2)

tab 1(3)

Once the researcher has completed the set-up of the questions, the next step is to set up the four answers to each question. In this case the researcher must edit the questions in order to ensure that the answers are short and understandable. Such editing occurs as the researcher completes the creation of the four questions. It becomes a simple matter to add a phrase to the question as part of the prompt to the AI-driven Idea Coach, that prompt guiding the style of the answer provided. Table 2 shows the first set of 15 answers to Question #1 after the question has been edited by the researcher.

Table 2: First results from the AI-powered Idea Coach, attempting to develop 15 answers from the first question, that question edited to direct the style and comprehension level of the answers.

tab 2(1)

tab 2(2)

As we finish this section of the set-up it is well to keep in mind that the incorporation of the AI into the creation of questions and answers ends up producing an ‘Idea Book.’ This Excel file becomes a rich source of information about the topic, summarized by key issues and questions. The Idea Book moves from the list of questions, itself valuable for the researcher, onto issues of points of view, suggestions of what’s missing, and even suggestions about innovations. As noted above, the entire process of creating each logical page should be no more than a minute, with the creation of a 20-page book on the topic requiring less than 20 minutes.

Table 3 shows the final set of questions and answers. The answers have been edited by the researcher in order to be more readable when they are presented to the respondents in various combinations of answers. Henceforth, the answers will be referred to as ‘elements.’ The questions themselves will not play any role in the actual evaluation by respondents, nor in the analysis of the results. Rather, the questions are simply used to allow the researcher or Idea Coach to create a set of related but different ‘elements’, viz., different answers.

Table 3: The final questions and elements (answers to the question), after editing by the researcher

tab 3

Setting Up the Mind Genomics Study

Mind Genomics studies comprise several parts, all templated. Table 4 shows these parts. Table 4 is provided as a standard output of every Mind Genomics project:

  1. Key words selected by the researcher in order to make searching for the study results easier in the database of Mind Genomics studies.
  2. Respondent orientation
  3. Self-profiling questions. Gender and age are standard questions in every study, and so are not shown in Table 4.
  4. The rating question and the different answers.

Table 4: Study information

tab 4

The Respondent Experience in the Mind Genomics Study

Once the study set up has been completed it is the task of the researcher to provide respondents. With the advent of the Internet, it has become increasingly easy to obtain respondents, although at a slight cost to the researcher. It is the business of companies in the market research ‘space’ to provide motivated respondents for the many hundreds of thousands, perhaps millions or dozens of millions of studies on the internet. Across the entire world there have emerged companies which, for a fee, offer their members the chance to participate in on-line studies. It is from one of these companies, Luc.id Inc., in Louisiana, that the respondents are obtained, with the respondents satisfying specific criteria: Age 45 or older, Lives in one of three states: New York, New Jersey or Connecticut.

Luc.id Inc. is set up to provide these individuals, doing so with the actual experience taking approximately five minutes for a respondent. The respondents are recompensed by Luc.id, ad are totally anonymized. The respondent opts in to participate in the particular study. In turn, the research guarantees not t accept any specific identifying information during the course of the study, In situations where the researcher wants specific information, that information is requested in the ‘open ended’ questions, with a disclaimer that the information offered is entirely optional and left to the respondent.

Luc.id sent out email invitations to the prospective respondents, doing so in ‘waves’ until the quota of 101 respondents was filled. The quota comprised females, ages 45-70, living in New York, New Jersey or Connecticut, respectively. For easy to find respondents, such as those participating in this Mind Genomics study, the quota of 101 individuals is typically filled within 90 minutes. The Mind Genomics platform orients the respondents, presents the test materials, acquires the ratings, creates a database, performs the relevant analysis, and then creates the report along with AI summarization, generally within 15-30 minutes after the completion of the field work.

The actual Mind Genomics experiment begins with a short ‘hello’, and proceeds to the self-profiling classification shown in Figure 3, Panel A. The self-profiling classificaiton presents a clean screen to the respondent. The alternative answers to each question appear when the respondent reaches that question. The happy consequence of this pull-down screen is that the respondent is made to feel comfortable, rather than being confronted by a wall of words.

fig 3

Figure 3: The respondent experience in the Mind Genomics experiment. Panel A shows the pull-down menu for the self-profiling classification. Panel B shows an example of a vignette, accompanied by a short introduction and the rating scale, both at the top.

Afterwards, the respondent is exposed to 24 different vignettes, similar to that shown in Figure 3, Panel B. The vignettes are shown one vignette after another. The respondent is told simply to rate the combination. Exit interviews with respondents over the years as well as observations of colleagues participating in the Mind Genomics interview continue to point to the fact that professionals try to ‘outsmart’ the system, whereas ordinary respondents simply fall into a relaxed mode, and end up saying that they ‘guess.’ The results below will show that the respondents are performing quite well, and that despite their statement that the feel they are ‘guessing’, the opposite is true. The typical respondent, the non-professional, ends up realizing that it is impossible to ‘game the system’, and settle for a relaxed experience. This relaxed, almost non-involved evaluation is felt to more validly represent the real judgment of the respondent, the judgment made when no one seems to be looking.

Creating the Database and Transforming the Ratings for Subsequent Statistical Analyses

The Mind Genomics study presents vignettes to the respondent, and acquires both the rating on the two-sided scale, as well as the response time. The response time is defined as the elapsed time between the presentation of the vignette and the respondent’s selection of the rating, Figure 4 shows the three vignettes from respondent (participant) #27. As one might surmise, there are 2424 vignettes in total, each vignette different in composition from every other vignette, accompanied by the rating and the response time. When the response time was longer than 9 seconds, BimiLeap automatically made the response time 9 seconds. The reason for this seemingly arbitrary rule is that the respondents were unsupervised and might have been doing other things. Thus, it is important to truncate the range of response times in order to avoid accepting response times of say 36 seconds. Clearly that response time reflects other behaviors besides the respondent participation in the study.

fig 4

Figure 4: Example of input information to the database showing the respondent, the text of the vignette, the rating assigned to the vignette, and the number of seconds elapsing between the presentation of the vignette and the assignment of a rating.

Relating the Presence/Absence of the Elements

The essence of Mind Genomics is relating the presence/absence of the elements in the vignettes to the ratings. The vignettes themselves vary from respondent to respondent, and in actuality are only vehicles in which to embed the 16 elements. It is the elements which convey the actual information. In turn, the rating scale is the device by which the respondent can communicate feelings. Both the vignettes and the rating scale, however, need to be translated into a set of variables that can be analyzed by statistics.

Figure 5 shows the part of the database prepared for the subsequent statistical analysis. Figure 5 divides into three distinct panels.

fig 5

Figure 5: The database for vignettes 1-11 presented to and rated by Panelist (respondent) #1

Panel A shows the row number of the database, and then information about the respondent, as provided by the respondent.

Panel B shows the order of testing (1-24) for the specific vignette, and then the deconstruction of the composition of the vignette into a series of 1’ and 0’s. Recall that the vignettes comprise combinations of elements, done so according to an experimental design. The particular design used here, the permuted experimental design, uses one basic structure, but changes the specific combinations through a permutation scheme [15]. The benefit is that each respondent’s data can be analyzed as either part of a group, or analyzed separately, one respondent at a time. The transformation of the experimental design is done by so-called ‘dummy variable’ coding [20]. The coding creates 16 columns, one for each element. When the element is present tin the vignette the cell has the value ‘1’. When the cell is absent from the vignette the cell has the value ‘0’. The 1’s and 0’s are called dummy variables because nothing is known about these variables other than presence or absence. Any analysis with these dummy variables simply shows the contribution to a criterion variable which occurs when the element is placed into the vignette. The ‘why’ is unknown. Only the ‘what’ is known Panel C shows the response time (time elapsed between the appearance of the vignette on the screen and the response), as well as the five-point rating assigned to the vignette. The remaining columns show the transformations of the ratings into the five single responses, the key being R5x (For me, Easy to do), and then two ‘combined’ responses R54 (For me), R52 (Easy to do).

R54x=100 when the rating is either 5 or 4, R54=0 when the rating is 3, 2 or 1

R52x=100 when the rating is either 5 or 2, R52=0 when the rating is 5,3 or 1

Once the database has been constructed, the Mind Genomics platform creates a set of simple linear equations, viz., linear models, first for the total panel, and then for each self-defined subgroup, self-defined age grouping, and finally gender. The analysis is called linear regression [21], with the variables taking on only one of two levels, 0 for absent, 1 for present, so-called dummy variables.

The equation for each binary variable is expressed schematically as: Binary Dependent variable=k1(A1) + k2(A2) … k16(D4). The equation just presented shows how each of the 16 elements ‘drives’ the binary rating. Typically, the standard error is about 7-8 for these studies, suggesting that coefficients around 16 or higher should be significant in a statistical sense.

The Mind Genomics platform ends up providing a great deal of data, almost a ‘wall of numbers.’ In order to identify underlying patterns, the convention is to shade the so-called ‘strong performer.’ ‘Strong’ means meaningful, based upon insights gleaned from previous Mind Genomics experiments. We move beyond the conventional criterion of ‘statistically significant’ to the following:

For the binary transformed variable, R54, typically the key ‘evaluative variable, such as ‘for me’ or ‘I will buy’, we shade coefficients of 21 or higher.

For all other binary transformed variables, e.g., R52, R5, etc., we shade coefficients of 16 or higher.

For RT, response time, we shade coefficients of 1.5 or higher, the foregoing criteria are not ‘fixed in stone.’ Rather, they reflect simple heuristics which allow the researcher to identify emergent themes. Indeed, the search for themes is so important in Mind Genomics that an alternative heuristic might be considered, namely deleting all coefficients which are lower than the cut-off criterion. That alternative ends up typically creating a sparse table, since in conventional Mind Genomics the coefficients are usually far lower than what we see here.

Table 5 shows the coefficients for the linear equations relating the presence/absence of the 16 elements to the binary transformed variables of R5x, R54x, and R52x, respectively, along with the coefficients for the RT (response time) equation. Ordinarily, R5x (For me and Easy) would not appear in the table. Rather, R54 (For Me) would become the focus of the analysis. Table 5 shows the surprising finding that for this study on obesity and diabetes virtually all of the elements (15 of 16) are strong performers, with coefficients of 21 or higher. In light of this remarkably strong performance of virtually all elements we move the key evaluative variable to R5x, (For me and Easy), which shows the more typical pattern observed in the results for other topics, not medical ones but rather products and services.

Despite the strong performance of many elements, Table 5 does not give up secrets about the underlying patterns of strong performing elements. For example, three of the four strongest performing elements for R5x deal with water and drinking, but drinking water must be associated with a reason, not just be present by itself. When present by itself, without any outcome, however, drinking water performs poorly.

Table 5: Coefficients for important transformed binary variables, and for response time. The elements are sorted in descending order by the coefficient for R5x.

tab 5

Fact: Drinking water helps your organs, like kidneys, work properly.

Fact: Drinking water boosts your energy levels.

Losing weight is important for older diabetic women because it helps control blood sugar and reduces health risks.

Fact: Water keeps your skin healthy and hydrated.

In a similar fashion patterns for R52X (Easy to do) and RT (response time) are elusive. No clear pattern emerges. We see differences in two variables when we deal with respondents who declare themselves normal weight versus those who declare themselves as overweight. Table 6 shows the dramatic differences between these groups, attributable to the rating of ‘easy’. Those who declare themselves overweight find most of the elements to refer to themselves (high coefficients for ME) but harder to do (lower coefficients for R52X, corresponding to easy). These results suggest the promising use of ‘Easy” as a key variable to consider.

Table 6: Coefficients for important transformed binary variables, and for response time, shown for two self-defined groups, Normal Weight versus Overweight.

tab 6

Mind-Sets: Uncovering Deep Differences among People in Order to Drive Effective Messages

A continuing theme in Mind Genomics is the emergence of mind-sets, clusters of people who perceived the world in clearly different ways, in ways which make sense and point to divergence what these clusters to feel to be important. Table 6 gives us a sense that when it comes to ‘Hard vs Easy’, those who declare themselves to be overweight find many statements to be not quite as easy as those who declare themselves to be normal weight. This difference in people makes sense but does not satisfy. The differences are there, but do not strike us as a compelling story.

One way to identify these possibly more profound differences is by statistics alone, by considering the pattern of the 16 coefficients and searching for different patterns. The search is not based on the self- definition of the respondent, nor based on the meaning of the elements. Rather, the search is based purely on the mathematical structure of the 16 coefficients. If the mathematics reveals clearly different, easy to interpret mind-sets, the research will have provided a powerful tool to identify what to communicate, and to whom.

The method used to create these clusters is called k-means clustering [22]. The objective is to put the different objects, our 101 respondents, into groups based upon an objective criterion. The criterion is that the ‘distance’ between pairs of people in a cluster should be ‘small’, but the distances between the centroid (average) of the 16 coefficients should be large. The k-means clustering is not exact but tries to satisfy these conditions.

The study uses the coefficient for R5X (ME and Easy to do) as the variable on which to do the clustering exercise. We can imagine 101 rows of coefficients, one row for each respondent, and in turn 16 columns of coefficients. Table 7 shows the strongest performing elements for each mind-set or cluster, respectively Mind-Set 1 (focus on medical indicators), Mind-Set 2 (Focus on Lifestyle), and Mind-Set 3 (Focus on drinking water). Each table is sorted by the coefficients for R5X (For ME and Easy). Each mind-set is clearly different, and interpretable, remarkable in view of the actual ‘difficulty’ of doing the study on the part of the respondent. Recall that each respondent had evaluated 24 different vignettes, with 2-4 elements, seemingly randomly put together. Despite what one might think, the respondents actually perform quite well.

Table 7: Coefficients for important transformed binary variables, and for response time. The elements are sorted in descending order by the coefficient for R5x, for each of the three emergent mind-sets.

tab 7

In Their Own Words

Our three mind-sets suggest radically different words to which they are sensitive. Do these mind-sets transcend the simple statistical analyses which brought them to our attention? In other words, beyond statistics which tell a ‘nice story’ can we find anything else. One way is to look at how they describe their experience with diabetes, whether their own, their family experience, or just their knowledge.

Each respondent was instructed to write bout diabetes from their own point of view, doing this exercise AFTER having done the evaluation of the 24 unique vignettes. An AI ‘summarizer’, QuillBot [23], took the open-ended answers, and summarized them. Table 8 shows three rather different summaries, suggesting that these mind-sets do actually think about diabetes in different ways. The objective of showing the summarizations is to give a sense of the different ‘morphologies’ or structures in the way people of mind-sets write about their experience, what they say, how they say it.

Table 8: AI summarization of open-ended answers about experience with diabetes from the three emergent mind-sets

tab 8

Diabetes is a terrible disease that can lead to limb loss and death. It is not a common issue in the family, but it is a serious concern that should be addressed by children. The author believes that children should be more proactive in preventing and helping others who are aware of the disease. They also mention that their family is concerned about obesity and is aware of sugar complications. The author believes that children can learn from their grandparents’ experiences and be more proactive in preventing diabetes. They also mention their own family members who have had diabetes and have lost limbs. They all try to maintain healthy lifestyles and avoid complications. Despite not having children, the author believes that everyone should prevent diabetes and help others.

Identifying the Mind-sets in the Population

An important outcome of dividing people into mind-sets is the ability to tailor the proper message to each person. By understanding the different messages to which people are sensitive, there is the possibility of increasing the overall health of a population. Proper messaging has been shown to substantially reduce the number of within-30-day hospital readmissions after discharge for patients with congestive heart failure [24], as well as double the number of colorectal cancer screenings in an underserved area in the Philadelphia area [25].

How then do we assign a given person to one of the mind-sets? Once the person is properly assigned to a mind-set it becomes much simpler to identify the set of messages likely to communicate properly and effect the appropriate behavior response. The traditional approach has been to look at easy-to-measure factors, such as gender, age, and superficial cultural cues. The experienced physician may attend to more cues, as would an experienced salesperson. But what about the situation wherein one cannot involve an experienced professional. Is there any way that the staff at the ‘front desk’ might be able to assign a patient to a mind-set in a perhaps a minute or less, and attach that information to the patient chart, along with the relevant material to communicate, as well as well as what to avoid.

During the past decade author Moskowitz and colleagues have worked on an identification system, a mind-type assigner or personal viewpoint identifier [16,17]. The objective is to create a short set of questions such as that shown in Figure 6. With such a tool, it becomes possible to have a patient fill out the form in a minute or two. Panel A shows the background information that the patient fills out. Panel B shows the six questions, taken from the study, and answered with a two-point scale. The pattern of responses to the six questions ends up assigning the patient to the most appropriate mind-set.

fig 6

Figure 6: The first two portion of the mind-set assigner. Panel A shows the background information. Panel B shows the six questions, which are presented in randomized order for each respondent.

Table 9 shows set-up for the ‘assigner’ tool’, including the name of the mind-set, and the feedback given either to the patient and/or t the medical professional. The mind-set assigner further provides the ability to send the respondent to a website with a video.

Table 9: Set up information for the mind-set assigner

tab 9

The final feature of the mind-set assigner is the ability to ask a set of 16 different questions, each with 2-4 answers. Table 10 shows the set of 16 questions for this study. The mind-set assigner with its set of 16 questions enables the researcher to work with many new respondents, both assigning each respondent to a mind-set, and obtaining more data about the respondent. In this way the research into mind-sets moves beyond simply understanding the person in terms of the particular situation, but actually allows the researcher to deepen knowledge of the person and the covariation of that knowledge with mind-type membership.

Table 10: The 16 questions and their associated answers. The Questions and Answers constitute the third ‘leg’ of the mind-set assigner.

tab 10

Discussion and Conclusions

The study on diabetes and obesity presented here constitutes the second of a planned series of studies on the communication between the doctor and the patient, using the emerging science of Mind Genomics. Several searches through the published literature and a discussion with young medical professionals revealed again and again that there is a well-established clinical literature on many medical topics, but very little on the words that doctors should say to patients, and the meanings of what patients say to doctors. The oft-given reason, perhaps excuse, is that this sensitivity to the patient can come only with experience, and that the doctor must learn to listen [26].

As the medical world becomes increasingly subject to the financial structures of capitalism, the time that a doctor spends with a patient necessarily decreases. It is the doctor’s time which ‘costs’, and the goal of a business such as the business of health care is to reduce these topline costs. It may be possible to optimize the throughput of diagnostics, and increase the efficiencies in hospital stays, especially surgery, but what about the ability of the doctor or other medical professional to communicate with the patient. If it takes years to educate someone to become an actor as well as years to become a doctor. Where then is the time to become a listener, and an empathic conveyor of news, often bad news. It is the attention to this topic, empathic information exchange, to which this new effort of Mind Genomics is dedicated, and in which spirit this early experiment and paper in that effort have been done and written. The discovery that there are really three mind-sets, not just one general mind-set with the ‘most right messaging’ becomes the important discovery here, one which, if not addressed, can become an ongoing issue in mammography, perhaps getting worse as the medical system becomes increasingly driven to efficiency by driving out the human component.

References

  1. Boles A, Kandimalla R, Reddy PH (2017) Dynamics of diabetes and obesity: Epidemiological perspective. Biochimica et Biophysica Acta (BBA)-Molecular Basis of Disease 1863: 1026-1036. [crossref]
  2. Mokdad AH, Ford ES, Bowman BA, Dietz WH, Vinicor F, et al. (2003) Prevalence of obesity, diabetes, and obesity-related health risk factors, 2001. JAMA 289: 76-79. [crossref]
  3. Mozaffarian D (2016) Dietary and policy priorities for cardiovascular disease, diabetes, and obesity: a comprehensive review. Circulation 133: 187-225. [crossref]
  4. Ling H, Lenz, TL, Burns, TL, Hilleman, DE (2013) Reducing the risk of obesity: defining the role of weight loss drugs. Pharmacotherapy: The Journal of Human Pharmacology and Drug Therapy 33: 1308-1321. [crossref]
  5. Cohen MM Fiona Elliott, Liza Oates, Adrian Schembri, Nitin Mantri (2017) Do wellness tourists get well? An observational study of multiple dimensions of health and well-being after a week-long retreat. The Journal of Alternative and Complementary Medicine 17: 140-148. [crossref]
  6. Nagy A, McMahon A, Tapsell L, Deane F, Arenson D (2018) Therapeutic alliance in dietetic practice for weight loss: Insights from health coaching. Nutrition & Dietetics 75: 250-255. [crossref]
  7. Incollingo Rodriguez AC, Rodriguez A, Callahan LC, Saxbe D, Tomiyama, AJ (2019) The buddy system: A randomized controlled experiment of the benefits and costs of dieting in pairs. Journal of Health Psychology 24: 1945-1954. [crossref]
  8. Elder KA, Wolfe BM (2007) Bariatric surgery: a review of procedures and outcomes. Gastroenterology 132: 2253-2271. [crossref]
  9. Greenacre M, Groenen PJ, Hastie T, d’Enza AI, Markos A, et al. (2022) Principal component analysis. Nature Reviews Methods Primers 2: 100.
  10. Omran MG, Engelbrecht AP, Salman A (2007) An overview of clustering methods. Intelligent Data Analysis 11: 583-605.
  11. Grimm P (2010) Social desirability bias. Wiley International Encyclopedia of Marketing.
  12. Krumpal I (2013) Determinants of social desirability bias in sensitive surveys: a literature review. Quality & Quantity 47: 2025-2047.
  13. Moskowitz HR, Gofman A, Beckley J, Ashman H (2006) Founding a new science: Mind Genomics. Journal of Sensory Studies 21: 266-307.
  14. Green PE, Krieger AM, Wind Y (2001) Thirty years of conjoint analysis: Reflections and prospects. Interfaces 31: S56-S73.
  15. Gofman A, Moskowitz H (2010) Isomorphic permuted experimental designs and their application in conjoint analysis. Journal of Sensory Studies 25: 127-145.
  16. Porretta S (2021) The changed paradigm of consumer science: from focus group to mind genomics. In Consumer-based New Product Development for the Food Industry. The Royal Society of Chemistry 21-39.
  17. Porretta S, Gere A, Radványi D, Moskowitz H (2019) Mind Genomics (Conjoint Analysis): The new concept research in the analysis of consumer behaviour and choice. Trends in Food Science & Technology 84: 29-33.
  18. Moskowitz HR (2012) ‘Mind Genomics’: The experimental, inductive science of the ordinary, and its application to aspects of food and feeding. Physiology & Behavior 107: 606-613. [crossref]
  19. Cropley D (2023) Is artificial intelligence more creative than humans?: ChatGPT and the Divergent Association Task. Learning Letters 2: 13-13.
  20. Hardy MA (1993) Regression with dummy variables (Vol. 93). SAGE.
  21. Burton AL (2021) OLS (Linear) regression. The Encyclopedia of Research Methods in Criminology and Criminal Justice 2: 509-514.
  22. Likas A, Vlassis N, Verbeek JJ (2003) The global k-means clustering algorithm. Pattern Recognition 36: 451-461.
  23. Fitria TN (2021) QuillBot as an online tool: Students’ alternative in paraphrasing and rewriting of English writing. Englisia: Journal of Language, Education, and Humanities 9: 183-196.
  24. Gabay G, Moskowitz HR (2019) “Are we there yet?” Mind-Genomics and data-driven personalized health plans. The Cross-Disciplinary Perspectives of Management: Challenges and Opportunities 7-28.
  25. Oyalowo A, Forde KA, Lamann A, Kochman ML (2022) Effect of patient-directed messaging on colorectal cancer screening: A randomized clinical trial. JAMA Network Open 5: e224529-e224529. [crossref]
  26. Bombak AE, Riediger ND, Bensley J, Ankomah S, Mudryj A (2020) A systematic search and critical thematic, narrative review of lifestyle interventions for the prevention and management of diabetes. Critical Public Health 30: 103-114.

Modifiable Risk Factors and the Risk of Developing Type 2 Diabetes Mellitus and Metabolic Syndrome among Women with and without a History of Gestational Diabetes Mellitus: An Ambidirectional Cohort Study from Pakistan

DOI: 10.31038/EDMJ.2023733

Abstract

Background: Type 2 Diabetes Mellitus (T2DM) and Metabolic Syndrome (MS) continuously rise among South-Asian women. However, few studies explored the association between these chronic conditions and modifiable risk factors among South-Asian women. Therefore, this study evaluated the incidence of T2DM and MS and its association with modifiable risk factors among women with and without a history of Gestational Diabetes Mellitus (GDM).

Methods: We conducted the study using a retrospective and prospective follow-up component (an ambidirectional cohort study). We retrospectively identified women with GDM from 1999 to 2005 from the medical record system of the Aga Khan University (AKU) Hospital Karachi, Pakistan. We prospectively enrolled 226 women with GDM and 423 without GDM (1:2) between 2008 and 2010. The outcomes were the development of T2DM or impaired glucose tolerance (IGT) and MS among women with vs. without GDM and their association with modifiable risk factors, such as body mass index (BMI), body fat%, diet, and physical activity. Using multivariable logistic regression, we created two models to understand the association between modifiable risk factors and the development of T2DM and MS. In the first model, we used BMI as a measure of obesity, while in the second; we replaced it with body fat percentage. Other variables (diet and physical activity) were present in both models.

Results: We observed 10.91 times (CI 4.57-26.04) higher odds of developing T2DM/IGT among women with vs. without GDM. In addition, BMI (kg/m2) (OR 1.09, CI 1.02-1.15) and diet scores (high in fat, sugar, and bakery items) (OR 1.22, CI 1.01-1.49) were found significant. In the second model of T2DM, women with GDM (OR 11.02, CI 4.63-26.22) and body fat% (OR 1.10, CI 1.04-1.17) were found significant. For MS, we observed 2.78 times (CI 1.04-7.41) higher odds of developing MS among women with vs. without GDM. In addition, BMI (kg/m2) (OR 1.32, CI 1.22-1.42) and body fat% (OR 1.35, CI 1.23-1.48) were found significant in the first and second models, respectively.

Conclusions: BMI or body fat%, and, possibly, diet are potential modifiable risk factors for T2DM/IGT and MS among women with GDM.

Keywords

Gestational diabetes mellitus, Modifiable risk factors, Type 2 diabetes mellitus, Metabolic syndrome, South-Asian women, Low-and middle-income countries

Background

Diabetes is a major growing public health concern affecting about half a billion people worldwide [1]. The recent global estimates on diabetes prevalence report that 537 million adults aged 20 to 79 (one out of ten people) are affected by diabetes [2]. One in every four adults in Pakistan has diabetes mellitus (26.7%), reaching the highest national prevalence globally [2].

Type 2 Diabetes Mellitus (T2DM) is a progressive disease resulting from insufficient insulin secretion or resistance [3]. Several environmental risk factors, such as unhealthy diet, physical inactivity, and obesity, are further implicated in the pathogenesis of T2DM [4,5]. One of the metabolic risk factors for the development of T2DM is Gestational Diabetes Mellitus (GDM) [4]. It has been estimated that about 30% to 70% of women with GDM develop T2DM within approximately 15 years of the index pregnancy [6,7]. Among South Asian women, about 17% to 33% develop T2DM within 5 to 10 years after the index pregnancy [8].

GDM is defined as high blood glucose levels first recognized during pregnancy or subsequent pregnancies [9]. GDM is a highly prevalent metabolic issue during pregnancy, affecting about 1.8% to 31.5% of all pregnancies worldwide, depending on the screening methods, diagnostic criteria, and population characteristics [10]. The prevalence of GDM among low-and middle-income countries (LMICs) varies between 9.2% to 12.7% [11]. There has been a rise in the prevalence of GDM in Pakistan over the last few decades, with an increase from 6.3% in 2003 to 19% in 2018 [12].

GDM, on the one hand, increases the risk of developing many short-term complications, including preeclampsia, caesarean section, preterm births, macrosomia, and prenatal and perinatal mortality [13]. On the other hand, GDM tends to increase the risk of developing adverse health in the long term, such as T2DM, Cardiovascular Diseases (CVDs), and Metabolic Syndrome (MS) [7].  MS is defined as the presence of biological indicators such as abnormal waist circumference, high systolic and diastolic blood pressure, increased triglyceride levels, low high-density lipoprotein (HDL) levels, and impaired blood glucose levels [14].

Since these long-term issues can be preventable, lifestyle factors, i.e., diet, physical activity, and weight reduction, play a pivotal role in preventing and delaying the onset of T2DM and MS [15]. However, few studies have explored the association of lifestyle factors with T2DM and MS in women with GDM [16,17]. In addition, the existing evidence mainly based on the West, like Yang et al., demonstrated a lower risk of developing T2DM among women with a history of GDM who effectively managed modifiable risk factors [18]. There is a dearth of evidence, particularly from LMICs, on the role of modifiable risk factors in the development of T2DM and MS among women with a history of GDM. Therefore, this study evaluated the incidence of T2DM and MS and its association with modifiable risk factors among women with and without a history of GDM attending a tertiary healthcare facility in Karachi, Pakistan.

Methods

This study involved retrospective and prospective follow-up components (an ambidirectional cohort study). We retrospectively identified women from the medical record system who identified as having GDM based on International Classification of Diseases (ICD) 10 code and received prenatal care during 1999-2005 at the Aga Khan University Hospital (AKUH). All women identified through the Medical Record (MR) system with singleton birth in the index pregnancy, spoke Urdu, and residents of Karachi were included in the study. Those living outside Pakistan, with incomplete medical records, who used drugs influencing blood glucose concentration, such as glucocorticoids, antipsychotic drugs, or metformin, were excluded. We also excluded women diagnosed with T2DM before the initiation of the study as that was the key outcome, and they might have modified their lifestyle after a diagnosis of T2DM which may bias the association between the risk factors and development of T2DM.

All potential GDM women were contacted through mail as well as via phone calls as part of the recruitment process. Both mailing addresses and phone numbers were obtained from the MR system. All GDM women were first issued an invitation letter outlining the aims and methods of the study, a consent form, and a pre-paid, self-addressed mail-back envelope. The enclosed consent form was to be filled out by the women, and then mailed back. All GDM women were contacted by phone in addition to being mailed out. The phone calls were made a week after the mailings were completed. The letters were sent out, and the phone calls were made by the trained research staff. The detailed recruitment plan and participant response rate were published elsewhere [19]. During the phone calls, initial consent was obtained from the women to review their MRs for further basic medical information.

Women without GDM (matched for age at pregnancy and gestational age) were also identified from the MR system and contacted via phone to recruit them for the study. Women with GDM were classified as exposed, and those who did not develop GDM were considered non-exposed. We enrolled women as exposed and non-exposed in the 1:2 ratio. Those who consented and were eligible to participate were invited to AKUH to provide written informed consent and for further study assessments during 2008-2010. Structured questionnaire was used to assess sociodemographic, dietary intake, and physical activity through a face-to-face interview. In addition, anthropometric assessments and blood tests for evaluating T2DM or Impaired Glucose Tolerance (IGT) and MS status were also done.

Retrospective Data Collection

Data collected from MRs included maternal age, parity, known hypertension, mode of delivery, gestational age, use of insulin/diet for treating GDM, and GDM during a subsequent pregnancy.

Prospective Data Collection

Blood Work

All participants underwent an oral glucose tolerance test (OGTT) which involved a fasting blood sample followed by a 2-hour post-glucose sample (75-gram glucose liquid). At the same time, a 12-hour fasting lipid profile test was also performed to assess the status of dyslipidemia and MS. The details of the blood work and their cut-off values are described in additional file (see Additional file 1).

Anthropometry

Stature

Height and weight were measured at the time of the interview by the research officer. Height was measured using a wall-mounted measuring scale to the nearest cm, while weight was measured using a Tanita Body composition analyzer (Tanita Corp. CA. USA).

Waist Circumference and Waist-to-Hip Ratio

Waist and hip circumferences were measured using non-stretchable tape. These measurements were used to estimate waist circumference and waist-to-hip ratio among participants. The research officer was trained in measuring the circumferences at the correct point, i.e., waist circumference was measured between the uppermost part of the hip bone and the lowest rib margin (tenth rib), and the hip circumference was measured at the widest point over the buttocks.

Body Composition

Body composition was measured by a body fat analyzer. Total body fat was measured by a non-invasive Tanita body composition analyzer BC 310 (Tanita Corp. CA. USA), which measured fat mass, body fat percentage, abdominal fat mass, and fat-free mass.

Questionnaires and Interview

Two research officers were involved in data collection using an Urdu-translated interviewer-administered questionnaire for the following components:

Sociodemographic Questionnaire

A sociodemographic questionnaire collected information on participants’ educational level, occupation, household income, and socioeconomic status.

Food frequency Questionnaire

Diet was assessed using a Food Frequency Questionnaire (FFQ) that was developed and validated among Pakistani women [20]. The questionnaire has food items with their frequencies and portion sizes. The frequency of all food items consumed was multiplied by the portion sizes and then converted into the daily intake.

Using principal component analysis (PCA), we reduced dietary intake data to generate one variable to assess the diet-disease association. The new diet variable loadings were high in fat, sugar, and other bakery items (see Additional file 2).

Physical activity Questionnaire

To assess participants’ physical activity, a Monica Optional Study of Physical Activity (MOSPA) questionnaire was used. The questionnaire has been adapted from the World Health Organizations’ Monitoring Trends and Determinants of Cardiovascular Disease study [21] and has been validated among Pakistani women [22]. The MOSPA questionnaire assessed physical activity in four broader categories, including leisure, occupational, transportation, and household chores. Detailed information on calculating Energy Expenditure (EE) was provided in additional file (see Additional file 3).

Outcomes and Their Assessments

The outcomes were defined as the development of T2DM or IGT and MS among women with and without a history of GDM and their association with modifiable risk factors such as Body Mass Index (BMI), body fat%, diet, and physical activity. Women with fasting blood sugar ≥126 mg/dL and 2-hour post glucose ≥200 mg/dL were considered T2DM, whereas those with one value abnormal, either fasting blood sugar ≥126 mg/dl or 2-hour post glucose ≥200 mg/dl considered having IGT [3]. Metabolic Syndrome (MS) was defined as women with waist circumference > 80 cm with any one of the following conditions (HDL <50 mg/dl and Triglyceride >150 mg/dl) OR (HDL <50 mg/dl and FBS >100 mg/dl) OR (Triglyceride >150 mg/dl and FBS >100 mg/dl) [14].

Modifiable Risk Factors and Their Association with T2DM/IGT and MS

We evaluated the independent effect of BMI, body fat%, diet, and total reported physical activity (energy expenditure (kcal)/day) as modifiable risk factors on the development of T2DM/IGT and MS while adjusted for education, wealth index, and family history of diabetes.

Sample Size

Based on the findings of Feig et al. [23] and Cianni et al. [24] for the risk of developing T2DM and MS among women with GDM vs. without GDM, respectively, a sample size of 62 in exposed and 124 in non-exposed (1:2) for T2DM, whereas a sample size of 140 in exposed and 280 in non-exposed (1:2) for MS was required assuming 80% power and 5% level of significance.

However, we prospectively enrolled 226 women with a history of GDM who were eligible and consented to participate in the study as exposed and their comparators 423 women without a history of GDM as non-exposed (1:2) matched on age at the time of pregnancy and gestational age.

Statistical Analysis

Sociodemographic characteristics of women with and without a history of GDM were presented as mean ± SD for age at the time of pregnancy and age at the time of follow-up and median and range for the number of children. The frequencies and percentages were reported for education, occupation, wealth index, parity, mode of delivery, family history of diabetes, hypertension, treatment of GDM during pregnancy, and GDM during a subsequent pregnancy. The anthropometric and body composition distribution among the two groups were presented as mean ± SD or frequencies and percentages as appropriate. A chi-square test for all categorical variables, whereas an independent t-test for all continuous variables was computed to compare any differences between the two groups.

Binary logistic regression analysis was performed using the development of T2DM/IGT and MS as the dependent variable and women with a history of GDM vs. Non-GDM as an exposure variable, whereas four modifiable risk factors as an independent variable (BMI, body fat%, diet, and physical activity). A multivariable logistic regression analysis was performed to assess the association between modifiable risk factors and the risk of developing T2DM/IGT and MS among women with and without a history of gestational diabetes. Univariate analysis was performed to compute crude regression coefficients with 95% CIs.  A stepwise approach was used during multivariable analysis while adjusting for confounders such as education, wealth quintiles, and family history of diabetes. A p-value of <0.05 was considered significant. Data were analyzed using Stata (V.17, Statacorp).

Results

Sociodemographic Characteristics of the Study Population

The sociodemographic characteristics of women with vs. without a history of GDM were compared in Table 1. Both groups were comparable in terms of almost all variables, except for number of children (p=0.020), mode of delivery (p=0.001), family history of diabetes (p=0.001), and presence of hypertension (p=0.009).

Table 1: Sociodemographic characteristics of the study population

GDM
n=226

Mean ± SD or n (%)

Non-GDM
n=423
Mean ± SD or n (%)

P-value

Age at the time of pregnancy (years)

31.18 ± 4.87

31.06 ± 4.75  0.77
Age at the time of follow-up (years) 37.15 ± 5.16 37.38 ± 5.05

 0.58

Education  0.58

 Primary to secondary (Class 6-10)

23 (10.2) 42 (9.9)
 Intermediate (Class 12)

44 (19.5)

69 (16.3)

 Graduation (Class 14 and above)

159 (70.4) 312 (73.8)
Occupation  0.14
 Housewife

196 (86.7)

369 (87.6)

 Employed

30 (13.3)

46 (10.9)

 Others

0

6 (1.4)

Wealth Index (quintiles)

 0.89

 Lowest

91 (40.3)

171 (40.4)

 Middle

58 (25.7)

101 (23.9)

 Highest

77 (34.0)

151 (35.7)

Parity

 0.12

 Primiparous

48 (21.6)

69 (16.6)

 Multiparous

174 (78.4)

346 (83.4)

Numbers of children; Median (range)

1 (0-7)

1 (0-6)  0.020*

Mode of delivery

 0.001*

 Spontaneous vaginal delivery

114 (50.7)

267 (65.3)

 Assisted (Forceps/vacuum)

110 (48.9)

140 (34.2)

 Caesarean section

1 (0.4)

2 (0.5)

Family history of diabetes

175 (77.8) 273 (65.0)

<0.001*

Hypertension  0.009*

 Essential hypertension

19 (8.4)

20 (4.7)

 Pregnancy-induced hypertension

24 (10.6)

24 (5.7)

Treatment of GDM during pregnancy
 Insulin

34 (15.5)

 Diet

186 (84.5)
GDM during subsequent pregnancy

41 (18.7)

GDM: Gestational diabetes
*P-Value <0.05

Incidence of T2DM and MS among the Study Population

With a median follow-up of 6 years, we found 34 (15%) incident cases of T2DM/IGT among women with a history of GDM, whereas 7 cases (1.7%) among women without a history of GDM (p <0.001). We also evaluated the status of MS in our study population and found that one out of every 15 women was diagnosed with MS in the GDM group. In contrast, among the non-GDM group, the diagnosis was less (one out of every 36 women) (6.7% vs. 3.1%, p <0.033). Moreover, women in the GDM group were found with a higher level of fasting blood glucose (41.3% vs. 14.7%), total cholesterol (25.2% vs. 16.4%), triglycerides (30.2% vs. 14%), and LDL (72.1% vs. 61%) and a lower level of HDL (70.3% vs. 64.6%), all with a p-value of <0.05 except for the HDL (Figure 1).

FIG 1

Figure 1: Incidence of T2DM/IGT, MS, and other conditions among study population.
T2DM: Type 2 Diabetes Mellitus, IGT: Impaired Glucose Tolerance, MS: Metabolic Syndrome, GDM: Gestational Diabetes, LDL: Low-density lipoprotein, HDL: High-density lipoprotein
#also included women with one value abnormal, i.e., IGT
^MS defined as women with waist circumference > 80 cm with any one of the following conditions (HDL <50 mg/dl & Triglyceride >150 mg/dl) OR (HDL <50 mg/dl & FBS >100 mg/dl) OR (Triglyceride >150 mg/dl & FBS >100 mg/dl)
*P-value <0.05
**P-value <0.001.

Modifiable Risk Factors among the Study Population

While comparing the anthropometric and body composition of the study population, there were significant differences between the two groups in terms of BMI (kg/m2) (28.4 vs. 27.4, p 0.017), waist circumference (cm) (66.7 vs. 64.9, p 0.036), body fat (%) (36.1 vs. 34.5, p 0.007), and visceral fat (%) (6.6 vs. 5.9, p 0.025) in women with vs. without GDM, respectively.

There were differences in physical activity between groups in occupation and household chores-related activity; however, none of these differences were found to be statistically significant (Table 2).

Table 2: Description of modifiable risk factors among the study population


GDM
n=226

Mean ± SD or n (%)

Non-GDM
N=423
Mean ± SD or n (%)


P-value

Anthropometric          
Weight (kg)

68.31 ± 12.63

66.60 ± 13.16 0.11

BMI (kg/m2)

28.42 ± 5.29 27.37 ± 5.33

0.017*

 Normal weight (<23)

28 (12.4)

77 (18.3) 0.014*

 Overweight (23-26.9)

67 (29.8) 150 (35.6)
 Obese (≥ 27)

130 (57.8)

194 (46.1)

Waist circumference (cm)

66.69 ± 9.80 64.85 ± 11.06

0.036*

 High (≥ 80)

19 (8.4)

32 (7.6) 0.70

Waist-to-hip ratio

0.82 ± 0.08 0.81 ± 0.10

0.059

 High (≥ 0.8)

133 (58.8)

218 (51.5) 0.075

Body Composition

Body fat (%)

36.12 ± 6.18

34.51 ± 7.63 0.007*

Visceral fat (%)

6.56 ± 2.73 5.95 ± 2.70

0.025*

Muscle mass (kg)

40.47 ± 35.16

42.96 ± 34.24 0.38

Bone mass (kg)

2.20 ± 0.23 2.39 ± 1.97

0.24

Total body water (kg)

31.57 (2.90)

31.18 (3.22) 0.15

Physical Activity (energy expenditure; kcal/day)

Total reported physical activity

655.47 ± 26.48

688.67 ± 21.29 0.35

Occupation

620.96 ± 33.64 521.14 ± 33.92

0.06

Transportation

135.25 ± 22.29

172.69 ± 19.11 0.24

Household chores

463.17 ± 19.18 514.24 ± 16.81

0.06

Leisure time

154.89 ± 18.87

158.97 ± 15.53

0.87

GDM: Gestational diabetes, BMI: Body mass index
*P-Value <0.05

Modifiable Risk Factors and the Risk of Developing T2DM/IGT

We created two models to understand the association between modifiable risk factors and the development of T2DM and MS in women with vs. without GDM. In the first model, we used BMI as a measure of obesity, while in the second, we replaced it with body fat percentage. Other variables, such as diet and physical activity were present in both the models. We observed that women with a history of GDM had 10.91 times (CI 4.57-26.04) higher odds of developing T2DM/IGT than women without a history of GDM. Furthermore, among women with a history of GDM, with every one unit increase in the BMI (kg/m2) and diet scores (high in fat, sugar, and other bakery items), the odds of developing T2DM/IGT increased by 1.09 (CI 1.02-1.15) and 1.22 (CI 1.01-1.49), respectively. In the second model, the odds of developing T2DM/IGT among women with GDM (OR 11.02, CI 4.63-26.22) and body fat% (OR 1.10, CI 1.04-1.17) were significant. Both models were adjusted for education, wealth index, and family history of diabetes (Table 3).

Table 3: Association of T2DM/IGT and modifiable risk factors among women with vs. without a history of GDM

Variables

T2DM/IGT
  Model 1

Model 2a


Crude OR (95% CI)

ORadj (95% CI)

ORadj (95% CI)

Group
 Non-GDM

Ref

Ref

Ref

 GDM

 10.52 (4.58-24.17)*

 10.91 (4.57-26.04)*  11.02 (4.63-26.22)*

BMI

1.09 (1.03-1.15)* 1.09 (1.02-1.15)*

NA

Body fat%

1.10 (1.05-1.16)*

NA 1.10 (1.04-1.17)*

Diet

1.08 (0.91-1.28) 1.22 (1.01-1.49)*

1.21 (0.99-1.48)^

PA expenditure (kcal/day)

1.00 (0.99-1.01)

1.00 (0.99-1.01)

1.00 (0.99-1.01)

T2DM: Type 2 diabetes mellitus, IGT: Impaired glucose tolerance, GDM: Gestational diabetes, BMI: Body mass index, CI: Confidence interval, NA: Not applicable, OR: Odds ratio, ORadj: Adjusted odds ratio, PA: Physical activity,
PCA included diet high in fat, sugar, and other bakery items
Women were matched on age and time of delivery
Models 1 and 2 also adjusted for education, wealth index, and family history of diabetes
aIn model 2, BMI was replaced by fat%
OR for BMI and PCA are for one unit increase, and for fat% and physical activity are for a 10% and 10 minutes increase, respectively
*P-value <0.05
^P-value=0.05

Modifiable Risk Factors and the Risk of Developing MS

Similarly, in the first model, we observed that women with a history of GDM had 2.78 times (CI 1.04-7.41) higher odds of developing MS than women without a history of GDM. Furthermore, among women with a history of GDM, with every one-unit increase in the BMI (kg/m2), the odds of developing MS increased by 1.32 (CI 1.22-1.42). When we replaced BMI with body fat% in the second model, we found that the odds of developing MS among women with a history of GDM (OR 2.80, CI 1.12-7.03) and body fat percentage (OR 1.35, CI 1.23-1.48) were significant (Table 4).

Table 4: Association of MS and modifiable risk factors among women with vs. without a history of GDM

Variables

MS
  Model 1

Model 2a


Crude OR (95% CI)

ORadj (95% CI)

ORadj (95% CI)

Group
 Non-GDM

Ref

Ref Ref

 GDM

2.25 (1.05-4.81)* 2.78 (1.04-7.41)*

2.80 (1.12-7.03)*

BMI

1.30 (1.21-1.40)*

1.32 (1.22-1.42)* NA

Body fat (%)

1.33 (1.22-1.45)* NA

1.35 (1.23-1.48)*

Diet

1.03 (0.83-1.27)

1.20 (0.92-1.55) 1.17 (0.91-1.51)

PA expenditure (kcal/day)

1.00 (0.99-1.01) 1.00 (0.99-1.01)

1.00 (0.99-1.01)

MS: Metabolic Syndrome, GDM: Gestational diabetes, CI: Confidence interval, NA: Not applicable, OR: Odds ratio, ORadj: Adjusted odds ratio, PA: Physical activity
PCA included diet high in fat, sugar, and other bakery items
Women were matched on age and time of delivery
Models 1 and 2 also adjusted for education, wealth index, and family history of diabetes
aIn model 2, BMI was replaced by fat%
OR for BMI and PCA are for one unit increase, and for fat% and physical activity are for a 10% and 10 minutes increase, respectively
*P-value <0.05

Discussion

This study evaluated the incidence of T2DM and MS and its association with modifiable risk factors among women with and without a history of GDM attending a tertiary healthcare facility in Karachi, Pakistan. We found a higher incidence of T2DM (15%) and MS (6.7%) in women with GDM compared to those without GDM, 1.7%, and 3.1%, respectively. In addition, the two modifiable risk factors, such as BMI and diet, predicted T2DM. Replacing BMI with body fat% in a similar model led to comparable estimates for the two indicators of obesity. However, in our second model, the history of GDM and BMI or body fat percentage were associated with MS.

Gestational diabetes is an independent risk factor for developing T2DM and other metabolic issues [25,26]. Our findings are similar to a meta-analysis that reported almost ten times higher risk (pooled relative risk) of developing T2DM among women with a history of GDM as compared to their counterparts [27]. Similarly, for MS, a study from Italy reported about 9% of women with a previous history of GDM identified with MS (15 out of 166 women) compared to controls (1%, 1 out of 90) [24]. We also observed similar results where women with a history of GDM had higher odds of developing T2DM and MS than women without a history of GDM.

Previous studies have identified the predictive relationship between the modifiable risk factors and the risk of diabetes and MS [28-30]. However, most of these studies have been conducted among women without GDM. Few studies from the West have explored the association of modifiable risk factors with T2DM in women with GDM [18,31]. For example, a longitudinal cohort study among women with a history of GDM found a 90% relative reduction in the risk of T2DM among those with adequate control of five modifiable risk factors, such as BMI, diet, physical activity, smoking, and alcohol use [18]. We also assessed the association of four modifiable risk factors, such as BMI, body fat%, diet, and physical activity, on the development of T2DM and MS among women with vs. without a history of GDM and found an apparent effect of BMI and body fat% on the risk of T2DM and MS.

In general, Asians are more susceptible to fat deposition and metabolic derangement even at a lower BMI and are at a greater risk of developing T2DM and MS [32]. Additionally, BMI is a crude indicator of adiposity compared to other, more direct measures of body composition, i.e., body fat percentage [33], which can be assessed by DEXA scans and the Bio-Electrical Impedance Analysis (BIA) method [34]. A direct assessment of body fat percentage can be more accurate in predicting the association between adiposity and chronic disease outcomes such as T2DM and MS in women with GDM [33]. Therefore, we also developed a regression model with body fat percentage by replacing BMI for T2DM and MS. Our study provides evidence that the two parameters (BMI and body fat%) had similar strength of association in predicting T2DM and MS among South Asian women in our study.

Other modifiable risk factors, such as unhealthy diet and physical inactivity, play a central role in the development of T2DM and other metabolic issues [35]. For example, there is strong evidence of the cause-and-effect association between unhealthy dietary patterns and the risk of T2DM and MS [36,37]. Similarly, the dose and response relationship between physical activity and the risk of T2DM has been established [38]. However, the association of diet and physical activity with the development of T2DM and MS has not been fully explored among women with a history of GDM in South Asia. Hence, we evaluated the effect of diet and physical activity on the risk of T2DM and MS in our study population and found that increased dietary scores (high in fat, sugar, and other bakery products) in the presence of BMI predicted T2DM among women with previous GDM. However, the study findings were insignificant when we replaced BMI with body fat% in the second model. Unfortunately, we did not find any association between physical activity and the risk of T2DM and MS. The reason may be that the physical activity scores were very low in our study population. In addition, as our study sample was based on AKU hospital, which mainly serves the affluent people of the city; therefore, we might not have been able to accurately estimate the impact of some lifestyle factors, such as diet and physical activity, on the outcome due to lack of variability in the data. However, one cannot underestimate the value of physical activity in preventing the development of T2DM and MS.

Our study has several strengths. To the best of our knowledge, this is the first study that assessed the association between modifiable risk factors and the risk of developing T2DM and MS among South Asian women with and without a history of GDM. The prospective nature of the study allowed us to collect information on the modifiable risk factors prior to the occurrence of the outcomes, minimizing recall and interviewer bias during the data collection. We identified women with a history of GDM from the medical record system of AKUH using the International Classification of Diseases (ICD) code 10 for GDM. We objectively assessed the diagnosis of T2DM and MS using the World Health Organization (WHO) [3] and International Diabetes Federation (IDF) [14] criteria, respectively. We included the comparator group (women without GDM) matched on age at the time of pregnancy and gestational age. In addition, we also adjusted our regression models for other known confounders, such as education, wealth quintiles, and family history of diabetes, and hence provide more accurate estimates of the risk of T2DM and MS and their association with modifiable risk factors among women with and without GDM. Our study does have some limitations. We evaluated the modifiable risk factors at a single time point and have not followed them up to gather information on long-term lifestyle habits, which would have enabled us to estimate a more accurate effect of these risk factors on the outcomes. Additionally, we enrolled our study sample from AKU hospital, which mainly serves the affluent population of the city; therefore, we might not have been able to accurately estimate the impact of some lifestyle factors, such as diet and physical activity, on the outcome due to lack of variability in the data. Furthermore, the hospital-based sample might limit the generalizability of our study findings. However, given the nature of the study, there were no community-based registries of pregnant women present at the time this study was being carried out to answer the research question.

Conclusion

Our study findings reveal that potentially modifiable risk factors, such as BMI or body fat% and possibly diet are associated with the development of T2DM/IGT and MS in South Asian women with a history of GDM. These findings hold significant implications, particularly for countries like Pakistan, where T2DM/IGT and MS are rising. Therefore, establishing prevention programs targeted towards women with GDM during the postpartum period is crucial. These programs should prioritize the promotion of healthy lifestyle behaviors, such as healthy eating habits and increasing physical activity, to reduce fat deposition in individuals with high body fat percentages.

Declarations

Ethical Approval and Consent to Participate

The study was approved by the Ethical Review Committee of Aga Khan University (Ref: 1094-CHS/ERC-08). Informed consent was obtained from study participants and before participation.

Funding

This research was funded by The Aga Khan University Research Council (URC); however, the funding is not available to support publication of the research.

Author Contributions

RI conceptualized the study, wrote the study protocol, and secured funding. RI supervised the study. SN and GB were involved in the execution of the study and data acquisition. RQ facilitated data collection from the medical records as well as approaching women. SN, GB, and UK were involved in the analysis, interpretation, and writing the manuscript. RI and RQ reviewed and provided scientific revisions to the manuscript. All authors agreed prior to submission to take responsibility and be accountable for the contents of the manuscript. All authors read and approved the final manuscript.

Acknowledgments

We would like to thank our study participants who took part in this study. We are also thankful to the research team who contributed to this study.

List of Abbreviations:

T2DM: Type 2 Diabetes
GDM: Gestational Diabetes
LMICs: Low-and Middle-Income Countries
CVDs: Cardiovascular Diseases
MS: Metabolic Syndrome
ICD: International Classification of Diseases
AKU: Aga Khan University
IGT: Impaired Glucose Tolerance
OGTT: Oral Glucose Tolerance Test
FFQ: Food Frequency Questionnaire
PCA: Principal Component Analysis
MOSPA: Monica Optional Study of Physical Activity
LDL: Low-Density Lipoprotein
HDL: High-Density Lipoprotein
BMI: Body Mass Index
WHO: World Health Organization
IDF: International Diabetes Federation

References

  1. Cho NH, Shaw JE, Karuranga S, Huang Y, da Rocha Fernandes JD, et al. (2018) IDF Diabetes Atlas: Global estimates of diabetes prevalence for 2017 and projections for 2045. Diabetes Res Clin Pract 138: 271-281. [crossref]
  2. International Diabetes Federation Brussels, Belgium2021 [10th: [Available from: https://diabetesatlas.org/.
  3. Association AD (2018) Classification and Diagnosis of Diabetes: Standards of Medical Care in Diabetes-2019. Diabetes Care 42: S13-S28.
  4. Fletcher B, Gulanick M, Lamendola C (2002) Risk Factors for Type 2 Diabetes Mellitus. Journal of Cardiovascular Nursing 16: 17-23.
  5. Zheng Y, Ley SH, Hu FB (2018) Global aetiology and epidemiology of type 2 diabetes mellitus and its complications. Nat Rev Endocrinol 14: 88-98. [crossref]
  6. Lee AJ, Hiscock RJ, Wein P, Walker SP, Permezel M (2007) Gestational diabetes mellitus: clinical predictors and long-term risk of developing type 2 diabetes: a retrospective cohort study using survival analysis. Diabetes Care 30: 878-883. [crossref]
  7. Lauenborg J, Hansen T, Jensen DM, Vestergaard H, Mølsted-Pedersen L, et al. (2004) Increasing incidence of diabetes after gestational diabetes: a long-term follow-up in a Danish population. Diabetes Care 27: 1194-1199. [crossref]
  8. Gadve SS, Chavanda S, Mukherjee AD, Aziz S, Joshi A, et al. (2021) Risk of Developing Type 2 Diabetes Mellitus in South Asian Women with History of Gestational Diabetes Mellitus: A Systematic Review and Meta-Analysis. Indian J Endocrinol Metab 25: 176-181. [crossref]
  9. Classification and Diagnosis of Diabetes: Standards of Medical Care in Diabetes-2020. Diabetes Care 43: S14-s31.
  10. Zhu Y, Zhang C (2016) Prevalence of Gestational Diabetes and Risk of Progression to Type 2 Diabetes: a Global Perspective. Curr Diab Rep 16: 7. [crossref]
  11. Wang H, Li N, Chivese T, Werfalli M, Sun H, et al. (2022) IDF Diabetes Atlas: Estimation of Global and Regional Gestational Diabetes Mellitus Prevalence for 2021 by International Association of Diabetes in Pregnancy Study Group’s Criteria. Diabetes Research and Clinical Practice 183: 109050. [crossref]
  12. Sheikh A, Sheikh L (2020) Changing prevalence of Gestational Diabetes Mellitus during pregnancy over more than a decade. J pak Med Assoc 70: 1477-1478. [crossref]
  13. Group HSCR (2009) Hyperglycemia and Adverse Pregnancy Outcome (HAPO) Study: associations with neonatal anthropometrics. Diabetes 58: 453-459. [crossref]
  14. Zimmet P, KG MMA, Serrano Ríos M (2005) [A new international diabetes federation worldwide definition of the metabolic syndrome: the rationale and the results]. Rev Esp Cardiol 58: 1371-1376. [crossref]
  15. Goveia P, Cañon-Montañez W, Santos DP, Lopes GW, Ma RCW, et al. (2018) Lifestyle Intervention for the Prevention of Diabetes in Women With Previous Gestational Diabetes Mellitus: A Systematic Review and Meta-Analysis. Front Endocrinol (Lausanne) 9: 583. [crossref]
  16. Ratner RE, Christophi CA, Metzger BE, Dabelea D, Bennett PH, et al. (2008) Prevention of diabetes in women with a history of gestational diabetes: effects of metformin and lifestyle interventions. J Clin Endocrinol Metab 93: 4774-4779. [crossref]
  17. Pérez-Ferre N, Del Valle L, Torrejón MJ, Barca I, Calvo MI, et al. (2015) Diabetes mellitus and abnormal glucose tolerance development after gestational diabetes: A three-year, prospective, randomized, clinical-based, Mediterranean lifestyle interventional study with parallel groups. Clin Nutr 34: 579-585. [crossref]
  18. Yang J, Qian F, Chavarro JE, Ley SH, Tobias DK, et al. (2022) Modifiable risk factors and long term risk of type 2 diabetes among individuals with a history of gestational diabetes mellitus: prospective cohort study. Bmj 378: e070312. [crossref]
  19. Iqbal R, Haroon A, Jabbar A, Babar N, Qureshi R (2012) What method of contact works best for recruiting participants in a study: lessons for health care researchers? J Pak Med Assoc 62: 1293-1297. [crossref]
  20. Iqbal R, Rafique G, Badruddin S, Qureshi R, Cue R, et al. (2007) Increased body fat percentage and physical inactivity are independent predictors of gestational diabetes mellitus in South Asian women. Eur J Clin Nutr 61: 736-742. [crossref]
  21. Pereira MA, FitzerGerald SJ, Gregg EW, Joswiak ML, Ryan WJ, et al. (1997) A collection of Physical Activity Questionnaires for health-related research. Med Sci Sports Exerc 29: 205. [crossref]
  22. Iqbal R, Rafique G, Badruddin S, Qureshi R, Gray-Donald K (2006) Validating MOSPA questionnaire for measuring physical activity in Pakistani women. Nutr J 5: 18. [crossref]
  23. Feig DS, Zinman B, Wang X, Hux JE (2008) Risk of development of diabetes mellitus after diagnosis of gestational diabetes. Cmaj 179: 229-234. [crossref]
  24. Di Cianni G, Lencioni C, Volpe L, Ghio A, Cuccuru I, et al. (2007) C-reactive protein and metabolic syndrome in women with previous gestational diabetes. Diabetes Metab Res Rev 23: 135-140. [crossref]
  25. Kaiser K, Nielsen MF, Kallfa E, Dubietyte G, Lauszus FF (2021) Metabolic syndrome in women with previous gestational diabetes. Scientific Reports 11: 11558. [crossref]
  26. Diaz-Santana MV, O’Brien KM, Park Y-MM, Sandler DP, Weinberg CR (2022) Persistence of Risk for Type 2 Diabetes After Gestational Diabetes Mellitus. Diabetes Care 45: 864-870. [crossref]
  27. Vounzoulaki E, Khunti K, Abner SC, Tan BK, Davies MJ, et al. (2020) Progression to type 2 diabetes in women with a known history of gestational diabetes: systematic review and meta-analysis. Bmj 369: m1361. [crossref]
  28. Aravinda J (2019) Risk factors in patients with type 2 diabetes in Bengaluru: A retrospective study. World J Diabetes 10: 241-248. [crossref]
  29. Ismail L, Materwala H, Al Kaabi J (2021) Association of risk factors with type 2 diabetes: A systematic review. Computational and Structural Biotechnology Journal 19: 1759-1785. [crossref]
  30. Al Shehri HA, Al Asmari AK, Khan HA, Al Omani S, Kadasah SG, et al. (2022) Association between preventable risk factors and metabolic syndrome. Open Med (Wars) 17: 341-352. [crossref]
  31. Mishra S, Shetty A, Rao CR, Nayak S, Kamath A (2020) Risk factors for gestational diabetes mellitus: A prospective case-control study from coastal Karnataka. Clinical Epidemiology and Global Health 8: 1082-1088.
  32. Deurenberg P, Deurenberg-Yap M, Guricci S (2002) Asians are different from Caucasians and from each other in their body mass index/body fat per cent relationship. Obes Rev 3: 141-146. [crossref]
  33. Bhowmik B, Munir SB, Diep LM, Siddiquee T, Habib SH, Samad MA, et al. (2013) Anthropometric indicators of obesity for identifying cardiometabolic risk factors in a rural Bangladeshi population. J Diabetes Investig 4: 361-368. [crossref]
  34. Yi Y, Baek JY, Lee E, Jung H-W, Jang I-Y (2022) A Comparative Study of High-Frequency Bioelectrical Impedance Analysis and Dual-Energy X-ray Absorptiometry for Estimating Body Composition. Life 12: 994. [crossref]
  35. Raman PG (2016) Environmental Factors in Causation of Diabetes Mellitus. In: Marcelo LL, Sonia S, editors. Environmental Health Risk. Rijeka: IntechOpen 9.
  36. Czekajło A, Różańska D, Zatońska K, Szuba A, Regulska-Ilow B (2018) Association between dietary patterns and metabolic syndrome in the selected population of Polish adults-results of the PURE Poland Study. European Journal of Public Health 29: 335-340. [crossref]
  37. Pestoni G, Riedl A, Breuninger TA, Wawro N, Krieger J-P, et al. (2021) Association between dietary patterns and prediabetes, undetected diabetes or clinically diagnosed diabetes: results from the KORA FF4 study. European Journal of Nutrition 60: 2331-2341. [crossref]
  38. Lee IM, Shiroma EJ, Lobelo F, Puska P, Blair SN, et al. (2012) Effect of physical inactivity on major non-communicable diseases worldwide: an analysis of burden of disease and life expectancy. Lancet 380: 219-229. [crossref]