Author Archives: author

Modifiable Risk Factors and the Risk of Developing Type 2 Diabetes Mellitus and Metabolic Syndrome among Women with and without a History of Gestational Diabetes Mellitus: An Ambidirectional Cohort Study from Pakistan

DOI: 10.31038/EDMJ.2023733

Abstract

Background: Type 2 Diabetes Mellitus (T2DM) and Metabolic Syndrome (MS) continuously rise among South-Asian women. However, few studies explored the association between these chronic conditions and modifiable risk factors among South-Asian women. Therefore, this study evaluated the incidence of T2DM and MS and its association with modifiable risk factors among women with and without a history of Gestational Diabetes Mellitus (GDM).

Methods: We conducted the study using a retrospective and prospective follow-up component (an ambidirectional cohort study). We retrospectively identified women with GDM from 1999 to 2005 from the medical record system of the Aga Khan University (AKU) Hospital Karachi, Pakistan. We prospectively enrolled 226 women with GDM and 423 without GDM (1:2) between 2008 and 2010. The outcomes were the development of T2DM or impaired glucose tolerance (IGT) and MS among women with vs. without GDM and their association with modifiable risk factors, such as body mass index (BMI), body fat%, diet, and physical activity. Using multivariable logistic regression, we created two models to understand the association between modifiable risk factors and the development of T2DM and MS. In the first model, we used BMI as a measure of obesity, while in the second; we replaced it with body fat percentage. Other variables (diet and physical activity) were present in both models.

Results: We observed 10.91 times (CI 4.57-26.04) higher odds of developing T2DM/IGT among women with vs. without GDM. In addition, BMI (kg/m2) (OR 1.09, CI 1.02-1.15) and diet scores (high in fat, sugar, and bakery items) (OR 1.22, CI 1.01-1.49) were found significant. In the second model of T2DM, women with GDM (OR 11.02, CI 4.63-26.22) and body fat% (OR 1.10, CI 1.04-1.17) were found significant. For MS, we observed 2.78 times (CI 1.04-7.41) higher odds of developing MS among women with vs. without GDM. In addition, BMI (kg/m2) (OR 1.32, CI 1.22-1.42) and body fat% (OR 1.35, CI 1.23-1.48) were found significant in the first and second models, respectively.

Conclusions: BMI or body fat%, and, possibly, diet are potential modifiable risk factors for T2DM/IGT and MS among women with GDM.

Keywords

Gestational diabetes mellitus, Modifiable risk factors, Type 2 diabetes mellitus, Metabolic syndrome, South-Asian women, Low-and middle-income countries

Background

Diabetes is a major growing public health concern affecting about half a billion people worldwide [1]. The recent global estimates on diabetes prevalence report that 537 million adults aged 20 to 79 (one out of ten people) are affected by diabetes [2]. One in every four adults in Pakistan has diabetes mellitus (26.7%), reaching the highest national prevalence globally [2].

Type 2 Diabetes Mellitus (T2DM) is a progressive disease resulting from insufficient insulin secretion or resistance [3]. Several environmental risk factors, such as unhealthy diet, physical inactivity, and obesity, are further implicated in the pathogenesis of T2DM [4,5]. One of the metabolic risk factors for the development of T2DM is Gestational Diabetes Mellitus (GDM) [4]. It has been estimated that about 30% to 70% of women with GDM develop T2DM within approximately 15 years of the index pregnancy [6,7]. Among South Asian women, about 17% to 33% develop T2DM within 5 to 10 years after the index pregnancy [8].

GDM is defined as high blood glucose levels first recognized during pregnancy or subsequent pregnancies [9]. GDM is a highly prevalent metabolic issue during pregnancy, affecting about 1.8% to 31.5% of all pregnancies worldwide, depending on the screening methods, diagnostic criteria, and population characteristics [10]. The prevalence of GDM among low-and middle-income countries (LMICs) varies between 9.2% to 12.7% [11]. There has been a rise in the prevalence of GDM in Pakistan over the last few decades, with an increase from 6.3% in 2003 to 19% in 2018 [12].

GDM, on the one hand, increases the risk of developing many short-term complications, including preeclampsia, caesarean section, preterm births, macrosomia, and prenatal and perinatal mortality [13]. On the other hand, GDM tends to increase the risk of developing adverse health in the long term, such as T2DM, Cardiovascular Diseases (CVDs), and Metabolic Syndrome (MS) [7].  MS is defined as the presence of biological indicators such as abnormal waist circumference, high systolic and diastolic blood pressure, increased triglyceride levels, low high-density lipoprotein (HDL) levels, and impaired blood glucose levels [14].

Since these long-term issues can be preventable, lifestyle factors, i.e., diet, physical activity, and weight reduction, play a pivotal role in preventing and delaying the onset of T2DM and MS [15]. However, few studies have explored the association of lifestyle factors with T2DM and MS in women with GDM [16,17]. In addition, the existing evidence mainly based on the West, like Yang et al., demonstrated a lower risk of developing T2DM among women with a history of GDM who effectively managed modifiable risk factors [18]. There is a dearth of evidence, particularly from LMICs, on the role of modifiable risk factors in the development of T2DM and MS among women with a history of GDM. Therefore, this study evaluated the incidence of T2DM and MS and its association with modifiable risk factors among women with and without a history of GDM attending a tertiary healthcare facility in Karachi, Pakistan.

Methods

This study involved retrospective and prospective follow-up components (an ambidirectional cohort study). We retrospectively identified women from the medical record system who identified as having GDM based on International Classification of Diseases (ICD) 10 code and received prenatal care during 1999-2005 at the Aga Khan University Hospital (AKUH). All women identified through the Medical Record (MR) system with singleton birth in the index pregnancy, spoke Urdu, and residents of Karachi were included in the study. Those living outside Pakistan, with incomplete medical records, who used drugs influencing blood glucose concentration, such as glucocorticoids, antipsychotic drugs, or metformin, were excluded. We also excluded women diagnosed with T2DM before the initiation of the study as that was the key outcome, and they might have modified their lifestyle after a diagnosis of T2DM which may bias the association between the risk factors and development of T2DM.

All potential GDM women were contacted through mail as well as via phone calls as part of the recruitment process. Both mailing addresses and phone numbers were obtained from the MR system. All GDM women were first issued an invitation letter outlining the aims and methods of the study, a consent form, and a pre-paid, self-addressed mail-back envelope. The enclosed consent form was to be filled out by the women, and then mailed back. All GDM women were contacted by phone in addition to being mailed out. The phone calls were made a week after the mailings were completed. The letters were sent out, and the phone calls were made by the trained research staff. The detailed recruitment plan and participant response rate were published elsewhere [19]. During the phone calls, initial consent was obtained from the women to review their MRs for further basic medical information.

Women without GDM (matched for age at pregnancy and gestational age) were also identified from the MR system and contacted via phone to recruit them for the study. Women with GDM were classified as exposed, and those who did not develop GDM were considered non-exposed. We enrolled women as exposed and non-exposed in the 1:2 ratio. Those who consented and were eligible to participate were invited to AKUH to provide written informed consent and for further study assessments during 2008-2010. Structured questionnaire was used to assess sociodemographic, dietary intake, and physical activity through a face-to-face interview. In addition, anthropometric assessments and blood tests for evaluating T2DM or Impaired Glucose Tolerance (IGT) and MS status were also done.

Retrospective Data Collection

Data collected from MRs included maternal age, parity, known hypertension, mode of delivery, gestational age, use of insulin/diet for treating GDM, and GDM during a subsequent pregnancy.

Prospective Data Collection

Blood Work

All participants underwent an oral glucose tolerance test (OGTT) which involved a fasting blood sample followed by a 2-hour post-glucose sample (75-gram glucose liquid). At the same time, a 12-hour fasting lipid profile test was also performed to assess the status of dyslipidemia and MS. The details of the blood work and their cut-off values are described in additional file (see Additional file 1).

Anthropometry

Stature

Height and weight were measured at the time of the interview by the research officer. Height was measured using a wall-mounted measuring scale to the nearest cm, while weight was measured using a Tanita Body composition analyzer (Tanita Corp. CA. USA).

Waist Circumference and Waist-to-Hip Ratio

Waist and hip circumferences were measured using non-stretchable tape. These measurements were used to estimate waist circumference and waist-to-hip ratio among participants. The research officer was trained in measuring the circumferences at the correct point, i.e., waist circumference was measured between the uppermost part of the hip bone and the lowest rib margin (tenth rib), and the hip circumference was measured at the widest point over the buttocks.

Body Composition

Body composition was measured by a body fat analyzer. Total body fat was measured by a non-invasive Tanita body composition analyzer BC 310 (Tanita Corp. CA. USA), which measured fat mass, body fat percentage, abdominal fat mass, and fat-free mass.

Questionnaires and Interview

Two research officers were involved in data collection using an Urdu-translated interviewer-administered questionnaire for the following components:

Sociodemographic Questionnaire

A sociodemographic questionnaire collected information on participants’ educational level, occupation, household income, and socioeconomic status.

Food frequency Questionnaire

Diet was assessed using a Food Frequency Questionnaire (FFQ) that was developed and validated among Pakistani women [20]. The questionnaire has food items with their frequencies and portion sizes. The frequency of all food items consumed was multiplied by the portion sizes and then converted into the daily intake.

Using principal component analysis (PCA), we reduced dietary intake data to generate one variable to assess the diet-disease association. The new diet variable loadings were high in fat, sugar, and other bakery items (see Additional file 2).

Physical activity Questionnaire

To assess participants’ physical activity, a Monica Optional Study of Physical Activity (MOSPA) questionnaire was used. The questionnaire has been adapted from the World Health Organizations’ Monitoring Trends and Determinants of Cardiovascular Disease study [21] and has been validated among Pakistani women [22]. The MOSPA questionnaire assessed physical activity in four broader categories, including leisure, occupational, transportation, and household chores. Detailed information on calculating Energy Expenditure (EE) was provided in additional file (see Additional file 3).

Outcomes and Their Assessments

The outcomes were defined as the development of T2DM or IGT and MS among women with and without a history of GDM and their association with modifiable risk factors such as Body Mass Index (BMI), body fat%, diet, and physical activity. Women with fasting blood sugar ≥126 mg/dL and 2-hour post glucose ≥200 mg/dL were considered T2DM, whereas those with one value abnormal, either fasting blood sugar ≥126 mg/dl or 2-hour post glucose ≥200 mg/dl considered having IGT [3]. Metabolic Syndrome (MS) was defined as women with waist circumference > 80 cm with any one of the following conditions (HDL <50 mg/dl and Triglyceride >150 mg/dl) OR (HDL <50 mg/dl and FBS >100 mg/dl) OR (Triglyceride >150 mg/dl and FBS >100 mg/dl) [14].

Modifiable Risk Factors and Their Association with T2DM/IGT and MS

We evaluated the independent effect of BMI, body fat%, diet, and total reported physical activity (energy expenditure (kcal)/day) as modifiable risk factors on the development of T2DM/IGT and MS while adjusted for education, wealth index, and family history of diabetes.

Sample Size

Based on the findings of Feig et al. [23] and Cianni et al. [24] for the risk of developing T2DM and MS among women with GDM vs. without GDM, respectively, a sample size of 62 in exposed and 124 in non-exposed (1:2) for T2DM, whereas a sample size of 140 in exposed and 280 in non-exposed (1:2) for MS was required assuming 80% power and 5% level of significance.

However, we prospectively enrolled 226 women with a history of GDM who were eligible and consented to participate in the study as exposed and their comparators 423 women without a history of GDM as non-exposed (1:2) matched on age at the time of pregnancy and gestational age.

Statistical Analysis

Sociodemographic characteristics of women with and without a history of GDM were presented as mean ± SD for age at the time of pregnancy and age at the time of follow-up and median and range for the number of children. The frequencies and percentages were reported for education, occupation, wealth index, parity, mode of delivery, family history of diabetes, hypertension, treatment of GDM during pregnancy, and GDM during a subsequent pregnancy. The anthropometric and body composition distribution among the two groups were presented as mean ± SD or frequencies and percentages as appropriate. A chi-square test for all categorical variables, whereas an independent t-test for all continuous variables was computed to compare any differences between the two groups.

Binary logistic regression analysis was performed using the development of T2DM/IGT and MS as the dependent variable and women with a history of GDM vs. Non-GDM as an exposure variable, whereas four modifiable risk factors as an independent variable (BMI, body fat%, diet, and physical activity). A multivariable logistic regression analysis was performed to assess the association between modifiable risk factors and the risk of developing T2DM/IGT and MS among women with and without a history of gestational diabetes. Univariate analysis was performed to compute crude regression coefficients with 95% CIs.  A stepwise approach was used during multivariable analysis while adjusting for confounders such as education, wealth quintiles, and family history of diabetes. A p-value of <0.05 was considered significant. Data were analyzed using Stata (V.17, Statacorp).

Results

Sociodemographic Characteristics of the Study Population

The sociodemographic characteristics of women with vs. without a history of GDM were compared in Table 1. Both groups were comparable in terms of almost all variables, except for number of children (p=0.020), mode of delivery (p=0.001), family history of diabetes (p=0.001), and presence of hypertension (p=0.009).

Table 1: Sociodemographic characteristics of the study population

GDM
n=226

Mean ± SD or n (%)

Non-GDM
n=423
Mean ± SD or n (%)

P-value

Age at the time of pregnancy (years)

31.18 ± 4.87

31.06 ± 4.75  0.77
Age at the time of follow-up (years) 37.15 ± 5.16 37.38 ± 5.05

 0.58

Education  0.58

 Primary to secondary (Class 6-10)

23 (10.2) 42 (9.9)
 Intermediate (Class 12)

44 (19.5)

69 (16.3)

 Graduation (Class 14 and above)

159 (70.4) 312 (73.8)
Occupation  0.14
 Housewife

196 (86.7)

369 (87.6)

 Employed

30 (13.3)

46 (10.9)

 Others

0

6 (1.4)

Wealth Index (quintiles)

 0.89

 Lowest

91 (40.3)

171 (40.4)

 Middle

58 (25.7)

101 (23.9)

 Highest

77 (34.0)

151 (35.7)

Parity

 0.12

 Primiparous

48 (21.6)

69 (16.6)

 Multiparous

174 (78.4)

346 (83.4)

Numbers of children; Median (range)

1 (0-7)

1 (0-6)  0.020*

Mode of delivery

 0.001*

 Spontaneous vaginal delivery

114 (50.7)

267 (65.3)

 Assisted (Forceps/vacuum)

110 (48.9)

140 (34.2)

 Caesarean section

1 (0.4)

2 (0.5)

Family history of diabetes

175 (77.8) 273 (65.0)

<0.001*

Hypertension  0.009*

 Essential hypertension

19 (8.4)

20 (4.7)

 Pregnancy-induced hypertension

24 (10.6)

24 (5.7)

Treatment of GDM during pregnancy
 Insulin

34 (15.5)

 Diet

186 (84.5)
GDM during subsequent pregnancy

41 (18.7)

GDM: Gestational diabetes
*P-Value <0.05

Incidence of T2DM and MS among the Study Population

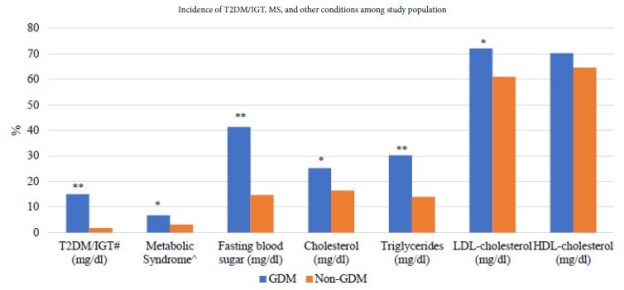
With a median follow-up of 6 years, we found 34 (15%) incident cases of T2DM/IGT among women with a history of GDM, whereas 7 cases (1.7%) among women without a history of GDM (p <0.001). We also evaluated the status of MS in our study population and found that one out of every 15 women was diagnosed with MS in the GDM group. In contrast, among the non-GDM group, the diagnosis was less (one out of every 36 women) (6.7% vs. 3.1%, p <0.033). Moreover, women in the GDM group were found with a higher level of fasting blood glucose (41.3% vs. 14.7%), total cholesterol (25.2% vs. 16.4%), triglycerides (30.2% vs. 14%), and LDL (72.1% vs. 61%) and a lower level of HDL (70.3% vs. 64.6%), all with a p-value of <0.05 except for the HDL (Figure 1).
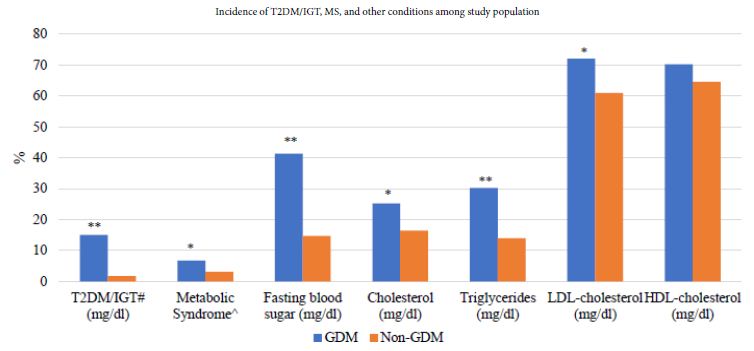
FIG 1

Figure 1: Incidence of T2DM/IGT, MS, and other conditions among study population.
T2DM: Type 2 Diabetes Mellitus, IGT: Impaired Glucose Tolerance, MS: Metabolic Syndrome, GDM: Gestational Diabetes, LDL: Low-density lipoprotein, HDL: High-density lipoprotein
#also included women with one value abnormal, i.e., IGT
^MS defined as women with waist circumference > 80 cm with any one of the following conditions (HDL <50 mg/dl & Triglyceride >150 mg/dl) OR (HDL <50 mg/dl & FBS >100 mg/dl) OR (Triglyceride >150 mg/dl & FBS >100 mg/dl)
*P-value <0.05
**P-value <0.001.

Modifiable Risk Factors among the Study Population

While comparing the anthropometric and body composition of the study population, there were significant differences between the two groups in terms of BMI (kg/m2) (28.4 vs. 27.4, p 0.017), waist circumference (cm) (66.7 vs. 64.9, p 0.036), body fat (%) (36.1 vs. 34.5, p 0.007), and visceral fat (%) (6.6 vs. 5.9, p 0.025) in women with vs. without GDM, respectively.

There were differences in physical activity between groups in occupation and household chores-related activity; however, none of these differences were found to be statistically significant (Table 2).

Table 2: Description of modifiable risk factors among the study population


GDM
n=226

Mean ± SD or n (%)

Non-GDM
N=423
Mean ± SD or n (%)


P-value

Anthropometric          
Weight (kg)

68.31 ± 12.63

66.60 ± 13.16 0.11

BMI (kg/m2)

28.42 ± 5.29 27.37 ± 5.33

0.017*

 Normal weight (<23)

28 (12.4)

77 (18.3) 0.014*

 Overweight (23-26.9)

67 (29.8) 150 (35.6)
 Obese (≥ 27)

130 (57.8)

194 (46.1)

Waist circumference (cm)

66.69 ± 9.80 64.85 ± 11.06

0.036*

 High (≥ 80)

19 (8.4)

32 (7.6) 0.70

Waist-to-hip ratio

0.82 ± 0.08 0.81 ± 0.10

0.059

 High (≥ 0.8)

133 (58.8)

218 (51.5) 0.075

Body Composition

Body fat (%)

36.12 ± 6.18

34.51 ± 7.63 0.007*

Visceral fat (%)

6.56 ± 2.73 5.95 ± 2.70

0.025*

Muscle mass (kg)

40.47 ± 35.16

42.96 ± 34.24 0.38

Bone mass (kg)

2.20 ± 0.23 2.39 ± 1.97

0.24

Total body water (kg)

31.57 (2.90)

31.18 (3.22) 0.15

Physical Activity (energy expenditure; kcal/day)

Total reported physical activity

655.47 ± 26.48

688.67 ± 21.29 0.35

Occupation

620.96 ± 33.64 521.14 ± 33.92

0.06

Transportation

135.25 ± 22.29

172.69 ± 19.11 0.24

Household chores

463.17 ± 19.18 514.24 ± 16.81

0.06

Leisure time

154.89 ± 18.87

158.97 ± 15.53

0.87

GDM: Gestational diabetes, BMI: Body mass index
*P-Value <0.05

Modifiable Risk Factors and the Risk of Developing T2DM/IGT

We created two models to understand the association between modifiable risk factors and the development of T2DM and MS in women with vs. without GDM. In the first model, we used BMI as a measure of obesity, while in the second, we replaced it with body fat percentage. Other variables, such as diet and physical activity were present in both the models. We observed that women with a history of GDM had 10.91 times (CI 4.57-26.04) higher odds of developing T2DM/IGT than women without a history of GDM. Furthermore, among women with a history of GDM, with every one unit increase in the BMI (kg/m2) and diet scores (high in fat, sugar, and other bakery items), the odds of developing T2DM/IGT increased by 1.09 (CI 1.02-1.15) and 1.22 (CI 1.01-1.49), respectively. In the second model, the odds of developing T2DM/IGT among women with GDM (OR 11.02, CI 4.63-26.22) and body fat% (OR 1.10, CI 1.04-1.17) were significant. Both models were adjusted for education, wealth index, and family history of diabetes (Table 3).

Table 3: Association of T2DM/IGT and modifiable risk factors among women with vs. without a history of GDM

Variables

T2DM/IGT
  Model 1

Model 2a


Crude OR (95% CI)

ORadj (95% CI)

ORadj (95% CI)

Group
 Non-GDM

Ref

Ref

Ref

 GDM

 10.52 (4.58-24.17)*

 10.91 (4.57-26.04)*  11.02 (4.63-26.22)*

BMI

1.09 (1.03-1.15)* 1.09 (1.02-1.15)*

NA

Body fat%

1.10 (1.05-1.16)*

NA 1.10 (1.04-1.17)*

Diet

1.08 (0.91-1.28) 1.22 (1.01-1.49)*

1.21 (0.99-1.48)^

PA expenditure (kcal/day)

1.00 (0.99-1.01)

1.00 (0.99-1.01)

1.00 (0.99-1.01)

T2DM: Type 2 diabetes mellitus, IGT: Impaired glucose tolerance, GDM: Gestational diabetes, BMI: Body mass index, CI: Confidence interval, NA: Not applicable, OR: Odds ratio, ORadj: Adjusted odds ratio, PA: Physical activity,
PCA included diet high in fat, sugar, and other bakery items
Women were matched on age and time of delivery
Models 1 and 2 also adjusted for education, wealth index, and family history of diabetes
aIn model 2, BMI was replaced by fat%
OR for BMI and PCA are for one unit increase, and for fat% and physical activity are for a 10% and 10 minutes increase, respectively
*P-value <0.05
^P-value=0.05

Modifiable Risk Factors and the Risk of Developing MS

Similarly, in the first model, we observed that women with a history of GDM had 2.78 times (CI 1.04-7.41) higher odds of developing MS than women without a history of GDM. Furthermore, among women with a history of GDM, with every one-unit increase in the BMI (kg/m2), the odds of developing MS increased by 1.32 (CI 1.22-1.42). When we replaced BMI with body fat% in the second model, we found that the odds of developing MS among women with a history of GDM (OR 2.80, CI 1.12-7.03) and body fat percentage (OR 1.35, CI 1.23-1.48) were significant (Table 4).

Table 4: Association of MS and modifiable risk factors among women with vs. without a history of GDM

Variables

MS
  Model 1

Model 2a


Crude OR (95% CI)

ORadj (95% CI)

ORadj (95% CI)

Group
 Non-GDM

Ref

Ref Ref

 GDM

2.25 (1.05-4.81)* 2.78 (1.04-7.41)*

2.80 (1.12-7.03)*

BMI

1.30 (1.21-1.40)*

1.32 (1.22-1.42)* NA

Body fat (%)

1.33 (1.22-1.45)* NA

1.35 (1.23-1.48)*

Diet

1.03 (0.83-1.27)

1.20 (0.92-1.55) 1.17 (0.91-1.51)

PA expenditure (kcal/day)

1.00 (0.99-1.01) 1.00 (0.99-1.01)

1.00 (0.99-1.01)

MS: Metabolic Syndrome, GDM: Gestational diabetes, CI: Confidence interval, NA: Not applicable, OR: Odds ratio, ORadj: Adjusted odds ratio, PA: Physical activity
PCA included diet high in fat, sugar, and other bakery items
Women were matched on age and time of delivery
Models 1 and 2 also adjusted for education, wealth index, and family history of diabetes
aIn model 2, BMI was replaced by fat%
OR for BMI and PCA are for one unit increase, and for fat% and physical activity are for a 10% and 10 minutes increase, respectively
*P-value <0.05

Discussion

This study evaluated the incidence of T2DM and MS and its association with modifiable risk factors among women with and without a history of GDM attending a tertiary healthcare facility in Karachi, Pakistan. We found a higher incidence of T2DM (15%) and MS (6.7%) in women with GDM compared to those without GDM, 1.7%, and 3.1%, respectively. In addition, the two modifiable risk factors, such as BMI and diet, predicted T2DM. Replacing BMI with body fat% in a similar model led to comparable estimates for the two indicators of obesity. However, in our second model, the history of GDM and BMI or body fat percentage were associated with MS.

Gestational diabetes is an independent risk factor for developing T2DM and other metabolic issues [25,26]. Our findings are similar to a meta-analysis that reported almost ten times higher risk (pooled relative risk) of developing T2DM among women with a history of GDM as compared to their counterparts [27]. Similarly, for MS, a study from Italy reported about 9% of women with a previous history of GDM identified with MS (15 out of 166 women) compared to controls (1%, 1 out of 90) [24]. We also observed similar results where women with a history of GDM had higher odds of developing T2DM and MS than women without a history of GDM.

Previous studies have identified the predictive relationship between the modifiable risk factors and the risk of diabetes and MS [28-30]. However, most of these studies have been conducted among women without GDM. Few studies from the West have explored the association of modifiable risk factors with T2DM in women with GDM [18,31]. For example, a longitudinal cohort study among women with a history of GDM found a 90% relative reduction in the risk of T2DM among those with adequate control of five modifiable risk factors, such as BMI, diet, physical activity, smoking, and alcohol use [18]. We also assessed the association of four modifiable risk factors, such as BMI, body fat%, diet, and physical activity, on the development of T2DM and MS among women with vs. without a history of GDM and found an apparent effect of BMI and body fat% on the risk of T2DM and MS.

In general, Asians are more susceptible to fat deposition and metabolic derangement even at a lower BMI and are at a greater risk of developing T2DM and MS [32]. Additionally, BMI is a crude indicator of adiposity compared to other, more direct measures of body composition, i.e., body fat percentage [33], which can be assessed by DEXA scans and the Bio-Electrical Impedance Analysis (BIA) method [34]. A direct assessment of body fat percentage can be more accurate in predicting the association between adiposity and chronic disease outcomes such as T2DM and MS in women with GDM [33]. Therefore, we also developed a regression model with body fat percentage by replacing BMI for T2DM and MS. Our study provides evidence that the two parameters (BMI and body fat%) had similar strength of association in predicting T2DM and MS among South Asian women in our study.

Other modifiable risk factors, such as unhealthy diet and physical inactivity, play a central role in the development of T2DM and other metabolic issues [35]. For example, there is strong evidence of the cause-and-effect association between unhealthy dietary patterns and the risk of T2DM and MS [36,37]. Similarly, the dose and response relationship between physical activity and the risk of T2DM has been established [38]. However, the association of diet and physical activity with the development of T2DM and MS has not been fully explored among women with a history of GDM in South Asia. Hence, we evaluated the effect of diet and physical activity on the risk of T2DM and MS in our study population and found that increased dietary scores (high in fat, sugar, and other bakery products) in the presence of BMI predicted T2DM among women with previous GDM. However, the study findings were insignificant when we replaced BMI with body fat% in the second model. Unfortunately, we did not find any association between physical activity and the risk of T2DM and MS. The reason may be that the physical activity scores were very low in our study population. In addition, as our study sample was based on AKU hospital, which mainly serves the affluent people of the city; therefore, we might not have been able to accurately estimate the impact of some lifestyle factors, such as diet and physical activity, on the outcome due to lack of variability in the data. However, one cannot underestimate the value of physical activity in preventing the development of T2DM and MS.

Our study has several strengths. To the best of our knowledge, this is the first study that assessed the association between modifiable risk factors and the risk of developing T2DM and MS among South Asian women with and without a history of GDM. The prospective nature of the study allowed us to collect information on the modifiable risk factors prior to the occurrence of the outcomes, minimizing recall and interviewer bias during the data collection. We identified women with a history of GDM from the medical record system of AKUH using the International Classification of Diseases (ICD) code 10 for GDM. We objectively assessed the diagnosis of T2DM and MS using the World Health Organization (WHO) [3] and International Diabetes Federation (IDF) [14] criteria, respectively. We included the comparator group (women without GDM) matched on age at the time of pregnancy and gestational age. In addition, we also adjusted our regression models for other known confounders, such as education, wealth quintiles, and family history of diabetes, and hence provide more accurate estimates of the risk of T2DM and MS and their association with modifiable risk factors among women with and without GDM. Our study does have some limitations. We evaluated the modifiable risk factors at a single time point and have not followed them up to gather information on long-term lifestyle habits, which would have enabled us to estimate a more accurate effect of these risk factors on the outcomes. Additionally, we enrolled our study sample from AKU hospital, which mainly serves the affluent population of the city; therefore, we might not have been able to accurately estimate the impact of some lifestyle factors, such as diet and physical activity, on the outcome due to lack of variability in the data. Furthermore, the hospital-based sample might limit the generalizability of our study findings. However, given the nature of the study, there were no community-based registries of pregnant women present at the time this study was being carried out to answer the research question.

Conclusion

Our study findings reveal that potentially modifiable risk factors, such as BMI or body fat% and possibly diet are associated with the development of T2DM/IGT and MS in South Asian women with a history of GDM. These findings hold significant implications, particularly for countries like Pakistan, where T2DM/IGT and MS are rising. Therefore, establishing prevention programs targeted towards women with GDM during the postpartum period is crucial. These programs should prioritize the promotion of healthy lifestyle behaviors, such as healthy eating habits and increasing physical activity, to reduce fat deposition in individuals with high body fat percentages.

Declarations

Ethical Approval and Consent to Participate

The study was approved by the Ethical Review Committee of Aga Khan University (Ref: 1094-CHS/ERC-08). Informed consent was obtained from study participants and before participation.

Funding

This research was funded by The Aga Khan University Research Council (URC); however, the funding is not available to support publication of the research.

Author Contributions

RI conceptualized the study, wrote the study protocol, and secured funding. RI supervised the study. SN and GB were involved in the execution of the study and data acquisition. RQ facilitated data collection from the medical records as well as approaching women. SN, GB, and UK were involved in the analysis, interpretation, and writing the manuscript. RI and RQ reviewed and provided scientific revisions to the manuscript. All authors agreed prior to submission to take responsibility and be accountable for the contents of the manuscript. All authors read and approved the final manuscript.

Acknowledgments

We would like to thank our study participants who took part in this study. We are also thankful to the research team who contributed to this study.

List of Abbreviations:

T2DM: Type 2 Diabetes
GDM: Gestational Diabetes
LMICs: Low-and Middle-Income Countries
CVDs: Cardiovascular Diseases
MS: Metabolic Syndrome
ICD: International Classification of Diseases
AKU: Aga Khan University
IGT: Impaired Glucose Tolerance
OGTT: Oral Glucose Tolerance Test
FFQ: Food Frequency Questionnaire
PCA: Principal Component Analysis
MOSPA: Monica Optional Study of Physical Activity
LDL: Low-Density Lipoprotein
HDL: High-Density Lipoprotein
BMI: Body Mass Index
WHO: World Health Organization
IDF: International Diabetes Federation

References

  1. Cho NH, Shaw JE, Karuranga S, Huang Y, da Rocha Fernandes JD, et al. (2018) IDF Diabetes Atlas: Global estimates of diabetes prevalence for 2017 and projections for 2045. Diabetes Res Clin Pract 138: 271-281. [crossref]
  2. International Diabetes Federation Brussels, Belgium2021 [10th: [Available from: https://diabetesatlas.org/.
  3. Association AD (2018) Classification and Diagnosis of Diabetes: Standards of Medical Care in Diabetes-2019. Diabetes Care 42: S13-S28.
  4. Fletcher B, Gulanick M, Lamendola C (2002) Risk Factors for Type 2 Diabetes Mellitus. Journal of Cardiovascular Nursing 16: 17-23.
  5. Zheng Y, Ley SH, Hu FB (2018) Global aetiology and epidemiology of type 2 diabetes mellitus and its complications. Nat Rev Endocrinol 14: 88-98. [crossref]
  6. Lee AJ, Hiscock RJ, Wein P, Walker SP, Permezel M (2007) Gestational diabetes mellitus: clinical predictors and long-term risk of developing type 2 diabetes: a retrospective cohort study using survival analysis. Diabetes Care 30: 878-883. [crossref]
  7. Lauenborg J, Hansen T, Jensen DM, Vestergaard H, Mølsted-Pedersen L, et al. (2004) Increasing incidence of diabetes after gestational diabetes: a long-term follow-up in a Danish population. Diabetes Care 27: 1194-1199. [crossref]
  8. Gadve SS, Chavanda S, Mukherjee AD, Aziz S, Joshi A, et al. (2021) Risk of Developing Type 2 Diabetes Mellitus in South Asian Women with History of Gestational Diabetes Mellitus: A Systematic Review and Meta-Analysis. Indian J Endocrinol Metab 25: 176-181. [crossref]
  9. Classification and Diagnosis of Diabetes: Standards of Medical Care in Diabetes-2020. Diabetes Care 43: S14-s31.
  10. Zhu Y, Zhang C (2016) Prevalence of Gestational Diabetes and Risk of Progression to Type 2 Diabetes: a Global Perspective. Curr Diab Rep 16: 7. [crossref]
  11. Wang H, Li N, Chivese T, Werfalli M, Sun H, et al. (2022) IDF Diabetes Atlas: Estimation of Global and Regional Gestational Diabetes Mellitus Prevalence for 2021 by International Association of Diabetes in Pregnancy Study Group’s Criteria. Diabetes Research and Clinical Practice 183: 109050. [crossref]
  12. Sheikh A, Sheikh L (2020) Changing prevalence of Gestational Diabetes Mellitus during pregnancy over more than a decade. J pak Med Assoc 70: 1477-1478. [crossref]
  13. Group HSCR (2009) Hyperglycemia and Adverse Pregnancy Outcome (HAPO) Study: associations with neonatal anthropometrics. Diabetes 58: 453-459. [crossref]
  14. Zimmet P, KG MMA, Serrano Ríos M (2005) [A new international diabetes federation worldwide definition of the metabolic syndrome: the rationale and the results]. Rev Esp Cardiol 58: 1371-1376. [crossref]
  15. Goveia P, Cañon-Montañez W, Santos DP, Lopes GW, Ma RCW, et al. (2018) Lifestyle Intervention for the Prevention of Diabetes in Women With Previous Gestational Diabetes Mellitus: A Systematic Review and Meta-Analysis. Front Endocrinol (Lausanne) 9: 583. [crossref]
  16. Ratner RE, Christophi CA, Metzger BE, Dabelea D, Bennett PH, et al. (2008) Prevention of diabetes in women with a history of gestational diabetes: effects of metformin and lifestyle interventions. J Clin Endocrinol Metab 93: 4774-4779. [crossref]
  17. Pérez-Ferre N, Del Valle L, Torrejón MJ, Barca I, Calvo MI, et al. (2015) Diabetes mellitus and abnormal glucose tolerance development after gestational diabetes: A three-year, prospective, randomized, clinical-based, Mediterranean lifestyle interventional study with parallel groups. Clin Nutr 34: 579-585. [crossref]
  18. Yang J, Qian F, Chavarro JE, Ley SH, Tobias DK, et al. (2022) Modifiable risk factors and long term risk of type 2 diabetes among individuals with a history of gestational diabetes mellitus: prospective cohort study. Bmj 378: e070312. [crossref]
  19. Iqbal R, Haroon A, Jabbar A, Babar N, Qureshi R (2012) What method of contact works best for recruiting participants in a study: lessons for health care researchers? J Pak Med Assoc 62: 1293-1297. [crossref]
  20. Iqbal R, Rafique G, Badruddin S, Qureshi R, Cue R, et al. (2007) Increased body fat percentage and physical inactivity are independent predictors of gestational diabetes mellitus in South Asian women. Eur J Clin Nutr 61: 736-742. [crossref]
  21. Pereira MA, FitzerGerald SJ, Gregg EW, Joswiak ML, Ryan WJ, et al. (1997) A collection of Physical Activity Questionnaires for health-related research. Med Sci Sports Exerc 29: 205. [crossref]
  22. Iqbal R, Rafique G, Badruddin S, Qureshi R, Gray-Donald K (2006) Validating MOSPA questionnaire for measuring physical activity in Pakistani women. Nutr J 5: 18. [crossref]
  23. Feig DS, Zinman B, Wang X, Hux JE (2008) Risk of development of diabetes mellitus after diagnosis of gestational diabetes. Cmaj 179: 229-234. [crossref]
  24. Di Cianni G, Lencioni C, Volpe L, Ghio A, Cuccuru I, et al. (2007) C-reactive protein and metabolic syndrome in women with previous gestational diabetes. Diabetes Metab Res Rev 23: 135-140. [crossref]
  25. Kaiser K, Nielsen MF, Kallfa E, Dubietyte G, Lauszus FF (2021) Metabolic syndrome in women with previous gestational diabetes. Scientific Reports 11: 11558. [crossref]
  26. Diaz-Santana MV, O’Brien KM, Park Y-MM, Sandler DP, Weinberg CR (2022) Persistence of Risk for Type 2 Diabetes After Gestational Diabetes Mellitus. Diabetes Care 45: 864-870. [crossref]
  27. Vounzoulaki E, Khunti K, Abner SC, Tan BK, Davies MJ, et al. (2020) Progression to type 2 diabetes in women with a known history of gestational diabetes: systematic review and meta-analysis. Bmj 369: m1361. [crossref]
  28. Aravinda J (2019) Risk factors in patients with type 2 diabetes in Bengaluru: A retrospective study. World J Diabetes 10: 241-248. [crossref]
  29. Ismail L, Materwala H, Al Kaabi J (2021) Association of risk factors with type 2 diabetes: A systematic review. Computational and Structural Biotechnology Journal 19: 1759-1785. [crossref]
  30. Al Shehri HA, Al Asmari AK, Khan HA, Al Omani S, Kadasah SG, et al. (2022) Association between preventable risk factors and metabolic syndrome. Open Med (Wars) 17: 341-352. [crossref]
  31. Mishra S, Shetty A, Rao CR, Nayak S, Kamath A (2020) Risk factors for gestational diabetes mellitus: A prospective case-control study from coastal Karnataka. Clinical Epidemiology and Global Health 8: 1082-1088.
  32. Deurenberg P, Deurenberg-Yap M, Guricci S (2002) Asians are different from Caucasians and from each other in their body mass index/body fat per cent relationship. Obes Rev 3: 141-146. [crossref]
  33. Bhowmik B, Munir SB, Diep LM, Siddiquee T, Habib SH, Samad MA, et al. (2013) Anthropometric indicators of obesity for identifying cardiometabolic risk factors in a rural Bangladeshi population. J Diabetes Investig 4: 361-368. [crossref]
  34. Yi Y, Baek JY, Lee E, Jung H-W, Jang I-Y (2022) A Comparative Study of High-Frequency Bioelectrical Impedance Analysis and Dual-Energy X-ray Absorptiometry for Estimating Body Composition. Life 12: 994. [crossref]
  35. Raman PG (2016) Environmental Factors in Causation of Diabetes Mellitus. In: Marcelo LL, Sonia S, editors. Environmental Health Risk. Rijeka: IntechOpen 9.
  36. Czekajło A, Różańska D, Zatońska K, Szuba A, Regulska-Ilow B (2018) Association between dietary patterns and metabolic syndrome in the selected population of Polish adults-results of the PURE Poland Study. European Journal of Public Health 29: 335-340. [crossref]
  37. Pestoni G, Riedl A, Breuninger TA, Wawro N, Krieger J-P, et al. (2021) Association between dietary patterns and prediabetes, undetected diabetes or clinically diagnosed diabetes: results from the KORA FF4 study. European Journal of Nutrition 60: 2331-2341. [crossref]
  38. Lee IM, Shiroma EJ, Lobelo F, Puska P, Blair SN, et al. (2012) Effect of physical inactivity on major non-communicable diseases worldwide: an analysis of burden of disease and life expectancy. Lancet 380: 219-229. [crossref]
Do Late, Low-level Interventions Improve Chronic War Trauma Related Symptoms?

DOI: 10.31038/AWHC.2023642

Introduction

In the last decades, multiple wars with long term social, economic, and psychological consequences have challenged health care systems both in countries of origin and in host countries, with vast groups of survivors living as internally or internationally displaced persons, as refugees from their homes. Those who stay or cannot escape to the often not much more stable third country environments face health care infrastructures and ongoing challenges. Many are distressed from events or health care deficits (see the WHO mental health GAP model), encountered already before the war and aggravated by brain drain, persecution, massacres and multiple barriers facing them in health care services [1-3]. The high rate of posttraumatic stress and other trauma-spectrum disorders [4,5], including unspecific reactions, such as severe depressive episodes with increased suicidal ideation [6], further challenge post-war mental health services. Different challenges can be observed in host countries [7,8], even in those with a high level of health care services, when refugees with different language and cultural background, often living far from specialized service institutions, and with no means to afford such services would urgently require them. Untreated trauma spectrum disorders tend to become chronic and might lead to indirect and transgenerational trauma disorders [6,9,10].

In recent decades, many international organizations such as UNHCR, WHO, UNICEF and Interagency standing committees have spearheaded and promoted the use of MHPSS (mental health and psychosocial services) models [11-13]. They address this low-resource situations, characterized by the presence of often only less than 5 fully trained mental health experts such as Psychiatrists and Psychotherapists, that are in turn also available to only a limited group of patients in each country. The MHPSS model includes therefore also the building of community based and less expert-oriented services provided by helpers with different professional backgrounds or expertise, but no or very limited training in Psychology, Psychiatry, or Psychotherapy.

Psychoeducation in regard to mental health and trauma related reactions or disorders has frequently become an important component in such programs [14-18] as it appears to require no extensive training of trainers or professional experience of service providers. It is used either as the main or only intervention or as additional offer (adjunct therapy) in addition to more complex validated approaches such as Eye-movement Desensitization (EMDR) [19,20] or trauma-focused forms of traditional Psychotherapy.

Still, in recent years few studies have evaluated this type of intervention, that could be seen as a good and efficient approach to alleviate the suffering of larger population groups suffering from the impact of large-scale violence and also other catastrophic events.

A special challenge will be neglected groups at a time when the collective trauma, in our example, the war in former Yugoslavia, has been nearly forgotten in the public discourse, while the psychological impact and resulting symptoms in survivors will last [21-23], even when some treatment has been provided before. Many survivors have been displaced to European host countries, with a different cultural environment, after being exposed to a genocidal environment in their homes. A number of studies have documented psychological sequels, including Posttraumatic Stress Disorder (PTBS) and depressive symptoms shortly after the war [24-26], but limited research has been done on the long term sequels and their treatment still persisting today.

In our study, that is part of a science teaching project, we therefore aim to evaluate the impact of psychoeducation, provided by trained experts, in a naturalistic setting with survivors of a genocidal war (“Ethnic cleansing”), still suffering from by then, at this later stage, chronic symptoms, years after escaping their traumatic environment, while living in relative safety.

Due to the large data pool elicited in the different measurement points, we focus on data on the most relevant general mental health indicators, BDI and GHQ scores, while further data will be published separately.

Method

We used networks of the ethnic Bosnian survivors in the two probably most important host countries, Austria and Germany, to recruit participants in a convenience sample of survivors still seeking treatment for persisting symptoms, even after earlier treatment, who had received medication or Psychotherapy earlier without satisfactory subjective improvement. All participants were offered Cognitive Behavior Therapy (CBT) based psychoeducation by Psychotherapists from their own ethnic group, language and culture. The intervention was based on the German language standard manual for CBT-based psychoeducation (as published by Liedl, Schäfer und Knaevelsrud (2013) [27]). A second group, with random assignment, who received only general supportive conversations on a regular basis, in equal frequency and length as the intervention group, was used as control group.

Aims

We conducted the research to evaluate the zero-hypothesis, that no benefit would be obtained by CBT based psychoeducation in the defined group, and further, if there was a gender difference in this regard. A secondary aim was to evaluate present psychological status, quality of life, and possible long term sequels present even in a safe and supportive environment, with earlier access to medical or psychotherapeutic treatment. A further question was, if the environment, -which means living in Austria or in Germany with different health care systems, – would be reflected in different baseline values or intervention outcomes.

We evaluated both specific, PTBS related, and unspecific symptoms such as depression, using standard instruments, as listed below, at baseline T1, and at conclusion of the intervention (T2). In this publication we focus on the general health and depression scores of this study as the most relevant indicators.

Inclusion criteria were that participants had to be survivors of the ethnic cleansing in Bosnia-Herzegowina, in an age range between 40-70 years, who had no history of earlier psychotic episodes or of other Psychiatric or medical disorders potentially interfering with memory or participation in the study. Informed consent was taken by all participants, and an ethics votum by the University supervising the research was obtained (06.07.2022, Sigmund Freud University ECBV77MDBAU66L89496). Further we selected only participants suffering from PTSD symptoms, based on standard cut-off scores in standard questionnaires (HTQ) [28,29], or depression (BDI) (Table 1).

Table 1: Values for depression, PTSD symptoms, number of events and quality of life, elicited to assess inclusion criteria in psychopathology scores, number of events.

Germany (n=32)

Austria (n=32)
M SD M

SD

BDI

14.78

10.95 17.62 9.19

GHQ28

35.22 10.08 36.12

8.87

HTQ

52.84

31.30 60.22 26.85

WHOQOL

71.41 15.38 66.72

14.30

Sample

The sample included a nearly equal number of female and male participants with an average age of 52,61 Jahren (SD=6,63), and an age range between 40 and 70 years. The majority (85%) had a primary or second level education.

Instruments

The Beck-Depressions-Inventar (BDI) is the probably most common specific instrument to evaluate depression, validated successfully in many languages [30-32].

The General Health Questionnaire (GHQ-28) is the most frequently used general screening questionnaire for a broader range of symptoms, and also to identify those in need of mental health related treatment (Table 2) [33-35].

All questionnaires were applied in earlier validated mother-language (Bosnian or Croatian) versions.

The HTQ yielded an average of 15 reported potentially traumatic events in Austria, and 11 in Germany, which might indicate that at least in our sample, Austrian participants had been more severely exposed during the war.

Table 2: Baseline reassessment, using t-test for independent variables. No significant differences between groups.

Experimental gruppe

Kontroll gruppe   95% KI
M SD M SD t p  


BDI

18.38

11.37 14.03 8.35 1.742 .087 -0.640 9.328

GHQ28

37.16 9.35 34.19 9.42 1.265 .211 -1.722

7.660

HTQ

62.00

30.75 51.06 26.86 1.515 .135 -3.492 25.367

WHOQOL

67.53 15.94 70.59 13.91 -0.819 .416 -10.538

4.413

Results

Again preliminary statistical analysis gave at a first impression that of a highly significant improvement only in the intervention group (at t(31)=3.636 and p<.001), while further analysis yielded no significant difference between both groups, (at t(62)=0.104 und p=.917). At F(2)=0.957 and p=3.87 no significant interaction between measurement points, experimental and control group membership.

At F(2)=0.355 and p=.703, no significant gender difference between intervention and control group was observed at T2 (outcome) in GHQ scores (Tables 3 and 4).

Table 3: Descriptive statistics of the intervention on BDI depression scores in intervention as compared to the control group.

M

SD

Intervention Group

T BDI 1

18.38


11.37

T BDI 2

13.94

11.52

Control Group

T BDI 1

14.03


8.349

T BDI 2

13.91

7.880

Results were analysed using correction Greenhouse-Geisser after primary statistical analysis, and yielded η2=.071, at F(2)=4.761 and p=.013, indicating a moderate intervention effect of CBT psychoeducation as compared with the control group.

Table 4: Descriptive statistics of the intervention on GHQ summary scores in intervention as compared to the control group.

M

SD

 Intervention group

T 1 GHQ28


37.16


9.35

T 2 GHQ28

33.00

9.97

 Control group

T1 GHQ28


34.19


9.42

T2 GHQ28

32.75

9.17

Discussion and Limitations

While our results indicate a possible positive effect of a structured low level (CBT psychoeducation) intervention in participants suffering from depression after exposure to war related events on symptoms of depression, general mental health indicators as measured by the General Health Questionnaire overall score, did not improve in the intervention group as compared to an attention only (conversation) control group. No significant difference was found regarding this observation between female and male participants.

In addition, our results confirm that long term symptoms might be not improved by the protection given by a safe environment and access to health care. The high level exposure and symptom levels of at least some groups of refugees living in Germany and Austria still would require specialist treatment. This cannot be replaced by low-level interventions, as offered in the psychoeducation model, and probably similar low-level interventions in the MHPSS model, even if they are culture and language sensitive and provided by trained helpers from their own ethnic and language group.

It can on the other hand not be excluded that displacement in a foreign culture and language environment, despite large communities from the country of origin being available in both host countries, might contribute to this problem. This is a limitation of our study, in addition to the convenience sample approach dictated by the naturalistic setting of treatment seeking general population members, and the selection of a common group present as refugees in many countries. Further, participants had received different types of earlier treatment, and do not constitute a strictly homogenous group, which still can be seen as a typical situation in most countries, as highly specific treatment centers for war victims are not always available to most survivors, even in high-economy host countries.

Conclusions

Besides the obvious conclusion that further research in the long-term effect and treatment needs of war survivors with larger samples is urgently needed to identify both mental health needs and effective but affordable, low-barriers interventions, further conclusions can be drawn. Our data, while being based on a pilot study with limited resources, indicate that low-level but standardized interventions such as psychoeducation might only have a limited positive impact on specific, like on depression related symptoms, if at all. This could be provided by trained general health care professionals, such as nurses that provide a large part of the services in many countries, have a high rate of acceptance, and lower barriers to their patients then the few psychotherapists or psychiatrists living in faraway capitals. Results also indicate that specialized professional services to address long term sequels are still required and should not be neglected, also due to the suffering and considerations as a secondary and maybe even transgenerational effect of severe violence-related trauma.

We are grateful to Prof. Dr. Omar Gelo, Vienna for his statistical supervision.

References

  1. Mattson S (1993) Mental health of Southeast Asian refugee women: an overview. Health Care Women Int 14: 155-165.
  2. Karmi G (1992) Refugee health. BMJ 305: 205-206.
  3. The world’s refugee populations. Popul Newsl 51: 1-8.
  4. Hecker T, Huber S, Maier T, Maercker A (2018) Differential Associations among PTSD and Complex PTSD Symptoms and Traumatic Experiences and Postmigration Difficulties in a Culturally Diverse Refugee Sample. J Trauma Stress 31: 795-804. [crossref]
  5. Vinson GA, Chang Z (2012) PTSD symptom structure among West African war trauma survivors living in African refugee camps: a factor-analytic investigation. J Trauma Stress 25: 226-231. [crossref]
  6. Wenzel T, Rushiti F, Aghani F, Diaconu G, Maxhuni B, et al. (2009) Suicidal ideation, post-traumatic stress and suicide statistics in Kosovo. An analysis five years after the war. Suicidal ideation in Kosovo. Torture 19: 238-247. [crossref]
  7. Refugee Problems in Shanghai. Br Med J 2: 983.
  8. Refugee health in Iowa. Iowa Med 77: 354-355.
  9. Kizilhan JI, Berger T, Sennhauser L, Wenzel T (2023) The psychological impact of genocide on the Yazidis. Front Psychol 14: 1074283. [crossref]
  10. Kizilhan JI, Noll-Hussong M, Wenzel T (2021) Transgenerational Transmission of Trauma across Three Generations of Alevi Kurds. Int J Environ Res Public Health 19: 81. [crossref]
  11. Marshall C (2022) The inter-agency standing committee (IASC) guidelines on mental health and psychosocial support (MHPSS) in emergency settings: a critique. Int Rev Psychiatry 34: 604-612.
  12. Duckers M, van Hoof W, Willems A, Te Brake H (2022) Appraising Evidence-Based Mental Health and Psychosocial Support (MHPSS) Guidelines-PART II: A Content Analysis with Implications for Disaster Risk Reduction. Int J Environ Res Public Health 19: 7798. [crossref]
  13. Te Brake H, Willems A, Steen C, Duckers M (2022) Appraising Evidence-Based Mental Health and Psychosocial Support (MHPSS) Guidelines-PART I: A Systematic Review on Methodological Quality Using AGREE-HS. Int J Environ Res Public Health 19: 3107. [crossref]
  14. Wiechers M, Strupf M, Bajbouj M, Boge K, Karnouk C, et al. (2023) Empowerment group therapy for refugees with affective disorders: results of a multicenter randomized controlled trial. Eur Psychiatry 66: e64. [crossref]
  15. Kananian S, Kip A, Schumm H, Giesebrecht J, Nicolai A, et al. (2022) Culturally adapted cognitive behavioural group therapy for mental disorders in refugees plus problem solving training (ReTreat): study protocol for a multicentre randomised controlled trial. BMJ Open 12: e061274. [crossref]
  16. Spanhel K, Schweizer JS, Wirsching D, Lehr D, Baumeister H, et al. (2019) Cultural adaptation of internet interventions for refugees: Results from a user experience study in Germany. Internet Interv 18: 100252. [crossref]
  17. Carlsson J, Sonne C, Vindbjerg E, Mortensen EL (2018) Stress management versus cognitive restructuring in trauma-affected refugees-A pragmatic randomised study. Psychiatry Res 266: 116-123. [crossref]
  18. Mohlen H, Parzer P, Resch F, Brunner R (2005) Psychosocial support for war-traumatized child and adolescent refugees: evaluation of a short-term treatment program. Aust N Z J Psychiatry 39: 81-87. [crossref]
  19. Yurtsever A, Konuk E, Akyuz T, Zat Z, Tukel F, et al. (2018) An Eye Movement Desensitization and Reprocessing (EMDR) Group Intervention for Syrian Refugees With Post-traumatic Stress Symptoms: Results of a Randomized Controlled Trial. Front Psychol 9: 493. [crossref]
  20. Acarturk C, Konuk E, Cetinkaya M, Senay I, Sijbrandij M, et al. (2015) EMDR for Syrian refugees with posttraumatic stress disorder symptoms: results of a pilot randomized controlled trial. Eur J Psychotraumatol 6: 27414. [crossref]
  21. Bogic M, Ajdukovic D, Bremner S, Franciskovic T, Galeazzi GM, et al. (2012) Factors associated with mental disorders in long-settled war refugees: refugees from the former Yugoslavia in Germany, Italy and the UK. Br J Psychiatry 200: 216-223. [crossref]
  22. Priebe S, Matanov A, Jankovic Gavrilovic J, McCrone P, Ljubotina D, et al. (2009) Consequences of untreated posttraumatic stress disorder following war in former Yugoslavia: morbidity, subjective quality of life, and care costs. Croat Med J 50: 465-475. [crossref]
  23. Basoglu M, Livanou M, Crnobaric C, Franciskovic T, Suljic E, et al. (2005) Psychiatric and cognitive effects of war in former yugoslavia: association of lack of redress for trauma and posttraumatic stress reactions. JAMA 294: 580-590. [crossref]
  24. Jensen SB (1996) Mental health under war conditions during the 1991-1995 war in the former Yugoslavia. World Health Stat Q 49: 213-217. [crossref]
  25. Nelson BD, Fernandez WG, Galea S, Sisco S, Dierberg K, et al. (2004) War-related psychological sequelae among emergency department patients in the former Republic of Yugoslavia. BMC Med 2: 22. [crossref]
  26. Nickerson A, Priebe S, Bryant RA, Morina N (2014) Mechanisms of psychological distress following war in the former Yugoslavia: the role of interpersonal sensitivity. PLoS One 9: e90503. [crossref]
  27. Liedl AS, U Knaevelsrud, C Psychoedukation bei posttraumatischen Störungen: Schattauer; 2013.
  28. Patel AR, Newman E, Richardson J (2022) A pilot study adapting and validating the Harvard Trauma Questionnaire (HTQ) and PTSD checklist-5 (PCL-5) with Indian women from slums reporting gender-based violence. BMC Womens Health 22: 22. [crossref]
  29. Berthold SM, Mollica RF, Silove D, Tay AK, Lavelle J, et al. (2019) The HTQ-5: revision of the Harvard Trauma Questionnaire for measuring torture, trauma and DSM-5 PTSD symptoms in refugee populations. Eur J Public Health 29: 468-474. [crossref]
  30. Bouman TK, Kok AR (1987) Homogeneity of Beck’s Depression Inventory (BDI): applying Rasch analysis in conceptual exploration. Acta Psychiatr Scand 76: 568-573. [crossref]
  31. Campbell IM, Burgess PM, Finch SJ (1984) A factorial analysis of BDI scores. J Clin Psychol 40: 992-996.
  32. Maggi G, D’Iorio A, Aiello EN, Poletti B, Ticozzi N, et al. (2023) Psychometrics and diagnostics of the Italian version of the Beck Depression Inventory-II (BDI-II) in Parkinson’s disease. Neurol Sci 44: 1607-1612. [crossref]
  33. Yunusa MA, Obembe A (2013) Prevalence of psychiatric morbidity using GHQ-28 among cleft lip patients in Sokoto. Ann Afr Med 12: 135-139. [crossref]
  34. Sterling M (2011) General Health Questionnaire – 28 (GHQ-28). J Physiother 57: 259. [crossref]
  35. Willmott SA, Boardman JA, Henshaw CA, Jones PW (2004) Understanding General Health Questionnaire (GHQ-28) score and its threshold. Soc Psychiatry Psychiatr Epidemiol 39: 613-617. [crossref]
Group Therapy, Spaces of Sharing and Psychodrama for Patients with SMI: A Review of the Literature

DOI: 10.31038/PSYJ.2023573

Abstract

The development or diagnosis of a mental illness is often a traumatic event. People who undergo a mental crisis and/or are diagnosed with a serious, chronic mental illness often experience a sharp disconnection from their previous life and self-image. A person living with mental illness may adopt the identity of a “sick” person and experience self-stigmatization, diminished enjoyment of life, and loss of hope in realizing their plans for the future. This review of literature attempts to contribute to our understanding of the unique qualities of group therapy and of the therapeutic method of psychodrama in particular, and its ability to act as a receptacle for empathic sharing among participants and to increase the coping competence of patients with severe mental illness (SMI).

Keywords

Group therapy, Mental illness, Psychodrama, Sharing, Support

Introduction

Many studies deal with the experience of coping with severe mental illness (SMI). Mental illness may cause changes in an individual’s personality, behavior, thoughts and feelings, both during the disease’s active phases and in its aftermath. This can result in a feeling of alienation from one’s own recognizable self [1,2]. Patricia Deegan, one of the forerunners of the recovery movement, describe how a diagnosis of mental illness “paints” a person’s entire perception and subjective experience. She and others describe the self-stigmatization, social isolation, the feeling of failure, the detachment and alienation, that take over a patient [3-7].The experience of coping with mental illness is often accompanied by a loss of internal and interpersonal dialogue, and a personal experience of one-dimensionality and emptiness. Patients suffering from these conditions can benefit from therapeutic methods that provide opportunities for group sharing and rich dialogue, offering partners to mirror one another, and providing visibility and a voice to convey the patient’s inner narrative [8,9]. This review attempts to illuminate the unique qualities of group therapy and psychodrama, and the potential of the therapeutic circle of sharing within it to create a supportive space enabling self-expression and enpathy, and to increase the ability of patients with SMI to cope with the sense of isolation and distress they experience.

The Therapeuric Group and the Psychodramatic Sharing for Patients with SMI[1]

Numerous studies have revealed the immense benefit of group therapy in people coping with shared distress, especially patients with SMI [10-13]. Unlike traditional therapy in which the structural power imbalance between the therapist and the patient could potentially perpetuate feelings of powerlessness, group therapy provides the participants with an experience of equality of status with the other participants and even with the therapist [14,15], and a sense of acceptance and belonging [16]. Dreikurs emphasized the above-mentioned dimension of equality that exists in group therapy, in which individuals are valued for who they are in the group and for their self-disclosure and honesty, and not for what they have achieved in their lives (14). Others have found that individuals who felt understood and protected in group therapy reported greater improvement in overall well-being [17].

A number of studies that have examined the effect of psychodrama as a therapeutic method, have noted its efficacy in reducing depression [18,19], anxiety and stress [20,21], and treating trauma and PTSD [22,23]. The unique nature of psychodramatic group therapy is beneficial in ways that traditional psychotherapy is often inadequate. The psychodrama group acts as an accommodating space for coping with experience of distress of the participants by creating a space for self-expression and a human encounter, mutual support, and sharing [24,25]. Roine and others describe the ability of psychodrama to evoke spontaneity and uncover creativity in challenging patients [26,27]. The psychodramatic stage allows patients to approach their feelings and thoughts in situations where the verbal dialogue of analytic psychotherapy is limited [9].

J. L. Moreno, the founder of psychodrama, was the first to highlight the potential of psychodrama as a tool even for people coping with SMI. Contrasting his approach to Freud’s, Moreno claimed that the focus of the psychodynamic therapy process, that which also allows it to be of value in working with difficult mental illnesses and psychotic cases, does not take place in the transference between the client and the therapist, but rather in the encounter that takes place between people and between roles. Using the “tele”, the emotion that arises in interpersonal encounters and in the interaction between different roles, psychodrama aspires to induce the recovery process even in those people with mental illness that Freudian psychoanalysis avoided addressing [28]. This therapeutic dimension of interaction and interpersonal encounter is expressed via various components of the psychodrama work, among them the auxiliary ego, the double, role reversal, encounter, and sharing [24].

Sharing is a fundamental concept in the therapeutic sphere and culture. John [29] dubbed the contemporary era “the age of sharing” and connected the prominence of the therapeutic ethos of sharing emotions to, among others, the digital culture and sharing on the internet, especially on social networks. This, in a manner that corresponds to the Lacanian notion of extimacy (extimité) as a human condition in which the center of the subject is both external and internal to itself simultaneously. John and others argue that the subject only gets in touch with their selfhood by making it public and sharing it with others [24,29,30]. John dates sharing’s initial formulation as a therapeutic concept—as it relates to the context of sharing emotions in a group—to the Oxford Group founded in 1922, out of which emerged Alcoholics Anonymous (AA) about a decade later. This notwithstanding, we should note that during that period the notion of sharing was already quite clearly a component of Moreno’s approach to psychodramatic group work.

The psychodramatic sharing, also known as the sharing phase, is the phase in which the group members share their experiences and issues from their lives that relate to the work of the protagonist [25,31]. Moreno describes sharing as the phase in which the focus moves from the stage to the audience, the phase in which “the strangers” in the group reveal their emotions and cease to be strangers. They repay the protagonist with love and gift both the protagonist and themselves the experience of group catharsis [32]. By sharing personal experiences relevant to the protagonist’s work, the group members ensure that the protagonist does not feel lonely or embarrassed at the end of their work, rather they feel like one of the many people who experience similar challenges. The sharing helps the protagonist break free from their role and expedites their return to reality and to the group as one of its members. The protagonist, who was detached from the group during the psychodramatic work, undergoes an accelerated reintegration back into the group structure via the sharing [33]. Sharing is an important phase for the group members as well. It grants them the opportunity to speak their own minds as if each and every one of them is the protagonist for a moment.

The psychodramatic sharing is rarely dealt with in the research literature, and there is little evidence-based study that sheds light on the influence of this therapeutic component. A recent qualitative action research study following an open inpatients psychodrama group in a psychiatric hospital demonstrates the role of group sharing in enabling self-expression, and mutual support, which offers a relief of the distress of psychiatric inpatients coping with SMI [24]. In another study that measured the ongoing influence of the psychodramatic therapeutic process on the participants [34], the HAT (Helpful Aspects of Therapy) test was used to help the participants report on the events that occurred in the therapeutic framework as events that either helped or hindered the therapeutic process. The results of the HAT test revealed that out of ten therapeutic categories—which included the main psychodramatic tools and the performance of psychodramatic vignettes on the stage—the two therapeutic components that comprised the largest number of events reported as helpful to the process were “the sharing of other group members” (24% of the therapeutic events reported as helpful) and “the participant’s own sharing in the group” (18.5% of the therapeutic events reported as helpful). Combined, these two categories that are related to sharing comprise 42.5% of the events reported as helpful to the treatment.

Conclusion

The aim of this article was to provide a theoretical framework for understanding the unique qualities of psychodrama group therapy and the potential of the therapeutic circle of group sharing within it to create an accommodating space of self-expression and mutual support, which offers relief for the experiences of isolation and distress of patients with SMI. The findings described above attest to the beneficial influence that group sharing should have in the framework of psychodrama therapy; however, these are isolated findings, and there is clearly room for further research addressing the contribution of the psychodramatic sharing to the therapeutic process of patients with mental illness.

[1] For a more complete and detailed overview of the sharing concept, including empirical data, see Ron, 2022.

References

  1. Brewin CR, Andrews B, Valentine JD (2000). Metaanalysis of risk factors for posttraumatic stress disorder in trauma-exposed adults. Journal of Consulting and Clinical Psychology 68: 748-766. [crossref]
  2. Mueser KT, Rosenberg SD, Goodman LA, Trumbetta SL (2002) Trauma, PTSD, and the course of severe mental illness: an interactive model. Schizophrenia Research 53: 123-143. [crossref]
  3. Deegan PE (2004) Rethinking Rehabilitation: Freedom. Proceedings of the 20th World Congress of Rehabilitation International: Rethinking Rehabilitation, Oslo, Norway.
  4. Orkibi H, Bar N, Eliakim I (2014) The effect of drama-based group therapy on aspects of mental illness stigma. The Arts in Psychotherapy 41: 458-466.
  5. Roe D, Lachman M (2005) The subjective experience of people with severe mental illness: A potentially crucial piece of the puzzle. Israel Journal of Psychiatry and Related Sciences 42: 223-230. [crossref]

  6. Yanos PT, Roe D, Lysaker PH (2010) The impact of illness identity on recovery from severe mental illness. American Journal of Psychiatric Rehabilitation 13: 73-93. [crossref]
  7. Yanos PT, Roe D, Lysaker PH (2011) Narrative enhancement and cognitive therapy: a new group-based treatment for internalized stigma among persons with severe mental illness. Journal of Group Psychotherapy 61: 577-595. [crossref]
  8. Lysaker PH, Lysaker JT (2004) Dialogical transformation in the psychotherapy of schizophrenia (205-219) In: H. Hermans & C. Dimaggio (eds.), The Dialogical Self in Psychotherapy. London: Routledge.
  9. Ron Y (2018) Psychodrama’s role in alleviating acute distress: A case study of an open therapy group in a psychiatric inpatient ward. Froniers in. Psycholology 9: 2075. [crossref]
  10. Fagin L (2010) Is it possible to make acute wards into therapeutic communities? (21-36) In: J. Radcliffe, K. Hajek, L, Carson & O. Manor (eds.), Psychological Groupwork with Acute Psychiatric Inpatients. London: Whiting & Birch.
  11. Shulman L (2009) The Skills of Helping Individuals, Families, Groups, and Communities 6th ed. Belmont, CA: Thomson Brooks/Cole.
  12. Whitaker DS (2001) Using Groups to Help People, 2nd London: Routledge.
  13. Yalom ID, Leszcz M (2020) The Theory and Practice of Group Psychotherapy 6th ed. New York: Basic Books.
  14. Dreikurs R (1955) Group psychotherapy and the third revolution in psychiatry. International Journal of Social Psychiatry 1: 23-32.
  15. Fehr SS (2003) Introduction to Group Therapy, 2nd ed. New York: Routledge.
  16. Wise s, Nash E (2019) Healing Trauma in Group Settings: The Art of Co-Leader Attunement. New York: Routledge.
  17. Mackenzie KR, Tschuschke V (1993) Relatedness, group work, and outcome in long-term inpatient psychotherapy groups. The Journal of Psychotherapy, Practice and Research 2: 147-156. [crossref]
  18. Sharma N (2017) Effect of psychodrama therapy on depression and anxiety of juvenile delinquents. International Journal of Indian Psychȯlogy 5: 38-47.
  19. Souilm NM, Ali SAO (2017) Effect of Psychodrama on the Severity of Symptoms in Depressed Patients. American Journal of Nursing Research 5: 158-164.
  20. Erbay LG, Reyhani ˙I, Ünal S, Özcan C, Özgöçer T, Uçar C, Yıldız, S (2018) Does Psychodrama Affect Perceived Stress, AnxietyDepression Scores and Saliva Cortisol in Patients with Depression? Psychiatry Investigation 15: 970-975. [crossref]
  21. Wieser M (2007) Studies on treatment effects of psychodrama psychotherapy (271-292) In: C. Baim, J. Burmeister & M. Maciel (eds.), Psychodrama: Advances in Theory and Practice. London: Routledge.
  22. Bucută MD, Dima G, Testoni I (2018) When you thought that there is no one and nothing”: The value of psychodrama in working with abused women. Frontiers in Psychology 9: 01518. [crossref]
  23. Giacomucci S, Marquit J (2020) The effectiveness of trauma-focused psychodrama in the treatment of PTSD in inpatient substance abuse treatment. Frontiers in Psychology .19: 00896. [crossref]
  24. Ron Y (2022) The role of group sharing: An action research study of psychodrama group therapy in a psychiatric inpatient ward. Psych 4: 626-639.
  25. Ron Y, Yanai L (2021) Empowering through psychodrama: A qualitative study at domestic violence shelters. Frontiers in Psychology 12: 600335. [crossref]
  26. Røine E (1997) Psychodrama: Group Psychotherapy as Experimental Theatre, 1st ed. London: Jessica Kingsley.
  27. Schacht M (2007) Spontaneity-creativity: The psychodramatic concept of change (21-40) In: C. Baim, J. Burmeister & M. Maciel (eds.), Psychodrama: Advances in Theory and Practice. London: Routledge.
  28. Moreno JL (1940) Psychodramatic treatment of psychoses. Sociometry 3: 115-132.
  29. John NA (2017) The Age of Sharing, 1st ed., Cambridge: Polity.
  30. Mateus S (2010) Public Intimacy. Sphera Pública 10: 57-70.
  31. Giacomucci S (2021) Social Work, Sociometry, and Psychodrama: Experiential Approaches for Group Therapists, Community Leaders, and Social Workers. Singapore: Springer Nature.
  32. Moreno JL (2008) Psychodrama and sociodrama. In J. Fox (ed.), The Essential Moreno: Writings on Psychodrama, New Paltz, NY: Tusitala Publishing.
  33. Lipman L (2003) The triadic system: Sociometry, psychodrama and group psychotherapy—an overview (3-13) In Psychodrama in the 21st Century: Clinical and Educational Applications. New York: Springer.
  34. Gonzalez AJ, Martins PJ, Lima M (2018) Studying the efficacy of psychodrama with the hermeneutic single case efficacy design: Results from a longitudinal study. Frontiers in Psychology 9: 1662. [crossref]

Review on the Conventional and Herbal Alternatives in the Treatment of Haemorrhoids

DOI: 10.31038/JPPR.2023611

Abstract

Haemorrhoids commonly known as piles are among the common anus disorders. It causes the swollen and inflammation of the vein tissues in the anal area. It may be internal haemorrhoids which are characterized with defecation covered with red blood or a painless bleeding during bowel movement. It may also be external haemorrhoids which are characterized by a painful swelling or a hard lump around the anus a condition known as thromboses. It is caused by an increased pressure in the lower rectum due to straining during bowel movement, prolong sitting on toilet, constipation, pregnancy, obesity, low fibre diets, heavy lifting, anal intercourse among others. Effective options are available in the treatment of haemorrhoids, although prescription of conventional drugs may reduce the pain and swelling but they cannot address the cause. Herbs and other botanical medicine can help strengthen and tone the blood vessels, decrease inflammation and stop bleeding. The paper aimed to review both the conventional forms as well as the herbal alternative in the treatment of haemorrhoids.

Keywords

Haemorrhoids, Constipation, Thrombosis, Inflammation, Bleeding, Herbs

Introduction

Haemorrhoids are swollen and inflamed vein in the anal area which is extremely common. It is commonly known as piles and affects most people over the age of 50 and sometimes young people can get them as well. Haemorrhoid is the most common disorder affecting the rectum (last part of the large intestine) and the anus (the opening of the rectum). Haemorrhoids occur as result of a prolong local pressure such as that caused by a pregnancy or a job requiring long hours of sitting which result into swollen and irritation of haemorrhoidal vein [1]. Haemorrhoids may cause irritation and pain especially during defecation. The condition is aggravated by constipation and straining during defecation. In some cases, hemorrhoids may bleed and occasionally clots form in the swollen vein, leading to a severe pain, a condition called thrombosed haemorrhoids [2]. Sometimes haemorrhoids may be associated with painful cracks in the anus (a condition called anal fissure) and itching around the anus, a condition known as pruritus ani [3,4]. Haemorrhoids may be divided into two types; external haemorrhoids and internal haemorrhoids based on their location and symptoms. The external haemorrhoids originate below the dentate line and covered by anoderm. They are characterized by painful swelling and hard lump around the anus that result with the formation of blood clot [5]. On the other hand internal haemorrhoids originate above the dentate line and covered by the anal mucosa. They are characterized by red blood covering feces (a condition called haematochezia), protruding of the anus with pain and itching [5,6]. Figure 1 below showed the pictures of both internal and external haemorrhoids.

People who suffer from haemorrhoids are advised to include in their diet the fibre rich foods such as fresh fruits, vegetables, whole grains product and equally to take plenty of fluids. A mild bulk formatting or softening laxative may also be recommended.

FIG 1

Figure 1: Internal and External Haemorrhoids [7]

Sign and Symptoms

Typical sign and symptoms of haemorrhoids include; anal pain, burning or itching, bright red blood seen on toilet paper, in the toilet bowl or on the surface of the stool after defecation. Round swellings or protrusions in the anal area may also be present.

Causes of Haemorrhoids

Haemorrhoids are caused by genetic weakness of the veins in the rectal area, ageing, setting or standing for a long period of time, anything that causes increased pressure in the veins such as pregnancy, heavy lifting, frequent straining during elimination, obesity, abdominal obesity, anal intercourse among others [1,4]. Some times food and life style such as low fibre diets with resulting constipation, spicy foods, alcohol intake was reported to be linked with the development of haemorrhoids and the aggravation of the acute haemorrhoids symptoms [7,8]. Intolerable pain, severe bleeding or swelling severe enough to prevent normal defecation necessitate the reason why to seek medical attention.

Diagnosis

Haemorrhoids are diagnose through precise history and thorough physical examination through digital rectal examination or anoscopy [9]. Unless bright red blood is clearly seen from haemorrhoids, any patient with rectal bleeding should undergo flexible sigmodoscopy or colonoscopy especially those at the risk of colorectal cancer [10]. The internal haemorrhoids are diagnosed based on appearance and the degree of prolapsed as follows;

Grade I

Haemorrhoids congested/bleeding without prolapsing (that is non-prolapsing haemorrhoids).

Grade II

Haemorrhoids prolapsing during defecation but reduce spontaneously afterward (that is prolapsing haemorrhoids on straining).

Grade III

Haemorrhoids prolapsing during defecation only manually reducible (that is prolapsing haemorrhoids requiring manual reduction), and

Grade IV

Haemorrhoids prolapsed, irreducible (that is non-reducible prolapsing haemorrhoids which include acutely thrombosed, incarcerated haemorrhoids (Clinical Practice Committee, 2004) [11].

Complicated haemorrhoids are often diagnosed as acutely thrombosed external haemorrhoids as well as the strangulated internal haemorrhoids (Figure 2) [10].

FIG 2

Figure 2: (A) Strangulated internal haemorrhoids and (B) Acute thrombosed external haemorrhoids

Treatment

Although prescription of cortisone and anaesthetic product may reduce the pain and swelling of haemorrhoids but they cannot address the causes. Preparations for the relieve haemorrhoids and anal discomfort fall into two main groups; the first group includes the creams and suppositories that act locally to relieve inflammation and irritation. The second group includes the ones that relieve constipation which contribute to the formation of and the discomfort from haemorrhoids and the anal fissure (White and Fooster, 2000). Preparations from the first group often contain a soothing agent with antiseptic, astringent, or vasoconstrictor properties. Ingredients of this group include zinc oxides, bismuth, hamamelis (witch hazel), Peru balsam and ephedrine. Others include a mild anaesthetic such as lignocaine. In some cases ointment containing corticosteroids are recommended [12]. Anti-inflammatory: Cortisone, anaesthetic such as benzocaine (lanacane cream) and lignocaine (Anodesyn, germoloids, boots haemorrhoids ointment) reduces pain and swelling. Ointment and creams such as anacal and anusol cream also reduces pain and swelling (BMA, 2004) [13]. Taking bath with warm water containing soothing herbs inform of essential oil provide a relief to haemorrhoids. Good candidate here includes calendula, comprey, camomile, lavenda and St John’s wort (White and Fooster, 2000). Severe and persistently painful haemorrhoids that continue to be troublesome in spite of all measures may need to be remove surgically (White and Fooster, 2000).

Prevention

Dietary and lifestyle modifications were among the most preventive measures for haemorrhoids [14]. Food rich in fibre and in proanthocyanins and anthocyanidin (two compounds that improve the health of blood vessels) can help to prevent haemorrhoids and can also help in healing the current ones. Also taking multivitamins nutrients improve blood vessels healings and hence help in reducing the risk of haemorrhoids. Similarly, oral fluids, regular exercise, refraining from straining and reading on the toilet, avoiding drugs causing constipation or diarrhea reduce the risk of haemorrhoids [15]. However, dairy foods, meat, fatty foods tend to be constipating, so it is a good idea to minimize or cut back the use of these products.

Contraindication

Most people experience no adverse effect, however sometimes preparations containing local anaesthetic may cause irritation or even a rash in the anal area. The main risk is that self-treatment of haemorrhoids may delay diagnosis of bowel cancer (White and Fooster, 2000). Anti-inflammatory drugs cause allergic reactions, rashes, thinning of the skin and mucous membrane.

Conventional Drugs Used in the Treatment of Haemorrhoids

Several modern drugs and traditional medicine in variety of formats such as pill, suppository, cream and wipes were available. Generally most of the drugs contains phebotonic agent which helps to increase vascular tone, reduce venous capacity, decrease capillary permeability, facilitate lymphatic drainage and has anti-inflammatory effects [16]. They can be categorized into the following:

Soothing and Astringent Agents

This group helps to sooth and makes the skin less oily and stops the wound from bleeding. These include the following:

Aluminium acetate, Bismuth, Peru balsam, Zinc oxides, etc.

Vasoconstrictors

This group helps for veins constriction and strengthens the blood vessels. Example is ephedrine.

Topical Corticosteroids

Examples are hydrocortisone, budesonide, prednisolone.

Local Anaesthetics

These are pain killers, it affect a small part of the body. Examples are Laxatives: bisacodyl, co-danthramer, co-danthrusate, docusate, glycerol, senna, sodium picosulfate, etc.

Herbal Remedies

Herbs and other botanical medicines can help strengthen and tone blood vessels, decrease inflammation and stop bleeding. Herbs applied directly to haemorrhoids can ease symptoms, stop bleeding and speed healing [17]. They can also help reduce the constipation that often accompanies haemorrhoids. Therefore it is recommended to use creams, salves or suppositories that contain combinations of soothing, anti-inflammatory and astringent herbs such as calendula, comfrey, chamomile, lavender, St John’s wart and plantain. Distilled witch hazel is also an excellent astringent that shrinks swollen haemorrhoids and control bleeding. Cypress essential oil may help shrink swollen veins and reduce bleeding. Blend combine soothing herbs that foster wound healing with cooling astringent witch hazel. The following formulation was found to be effective in the treatment of haemorrhoids (White and Fooster, 2000). Dosage: Four (4) table spoons of distilled witch hazel, half (1/2) table spoon of comfrey tincture, half (1/2) table spoon of horse chestnut tincture, 50 drops of lavender essential oil and 50 drops of cypress essential oil. Combine all the ingredient and store in an airtight amber bottle away from heat and light and to be use twice a day using cotton-wool ball deep into the bottle and applied direct on to the haemorrhoids. It can be inserted into the anal opening if internal haemorrhoids are present [18].

Horse Chestnut (Aesculus hippocastanum)

Traditionally it is used for strengthening and toning of veins. It is an anti-inflammatory and therefore decreases swelling. It is also an astringent and tends to reduce bleeding. The herb can be used for treating both the external and internal haemorrhoids.

Dosage

One cup of tea three times a day. The tea is prepared by adding one teaspoon of the dried seeds in 250 ml of hot water. Externally, it is used by soaking a clean flannel in the tea, ring out and then apply to the swollen tissues as often as needed.

Ginkgo (Ginkgo biloba)

Traditionally Ginkgo leaf extracts help in strengthening the blood vessels. It is also an anti-inflammatory as it relieves pain and itching.

Dosage

A quarter to one teaspoon of its tincture two to three times per day or 40 – 60 mg of capsules two to three times per day.

Butcher’s Broom (Ruscus aculeatus)

Traditionally used as anti-inflammatory and it strengthens the blood vessels.

Dosage

One cup of tea three times per day prepared from one to two teaspoon of the dried leaf in 250 ml hot water or half to one teaspoon of the tincture two to three times per day in an empty stomach.

Witch Hazel (Hamamelis virginiana)

This is a strong astringent herb. It stops bleeding and shrinks swollen tissues.

Dosage

The extract product is applied to the swollen tissue three times per day. Caution; never use the product internally.

Dandelion (Taraxacum officinale) and Yellow Dock (Rumex crispus)

These two plants share some common characteristics. Both are considered as weeds, the young green leaves of both can be eating and the roots of both plants are mild, gentle laxatives. The roots are used for treating constipation that comes with haemorrhoids.

Dosage

One to three cups per day prepared from two teaspoon of the dried chopped root in 250 ml hot water or half to three teaspoon of its tincture per day.

Mint (Mentha piperita)

It is also called peppermint, is a herb with downy leaves with purple white flowers. Its seeds contain pungent oil used as flavouring agent. It is used to relief pain and reduced itching of haemorrhoids.

White Dammar (Vateria indica):

It is used traditionally to heal haemorrhoids. It exerts anti-inflammatory action and hastens healing [19-21].

Conclusion

Many people get relief with home treatment but the main reason to seek medical attention are intolerable pain, severe bleeding or swelling severe enough to prevent normal defecation. There are several available home treatments (both conventional and herbal) which can be an alternative to the present day surgical methods. Conventional drugs were accompanied with many side effects while herbal alternatives are characterized with less contraindication, low cost and commonly available as such herbal alternatives are categorized as the best home treatment solutions for haemorrhoids.

References

  1. Azeemuddin M, Gollaplle LV, Mohammed R, Agadi HT, Mirza RB, et al. (2014) An Improved Experimental Heamorrhoids in Rats: Evaluation of Antiheamorrhoidal Activity of a Herbal formulation. Pharmacology 1: 1-7. [crossref]
  2. Lee JH, Kim HE, Kang JH, Shin JY, Song YM (2014) Factors associated with hemorrhoids in korean adults: korean national health and nutrition examination survey. Korean J Fam Med 35: 227-236. [crossref]
  3. Lin JK (1989) Anal manometric studies in hemorrhoids and anal fissures. DisColon Rectum. 32: 839-842. [crossref]
  4. Thomson WH (1975) The nature and cause of haemorrhoids. Proc R SocMed 68: 574-575. [crossref]
  5. Hindustan AA, Chitta SK, Kishore KRB, Kranthi G, Krishna MCH, et al. (2010) Herbal Treatment for Heamarrhoids. JITPS 1: 236-244.
  6. Hosking SW and Johnson AG (1988) Bleeding anorectal varices–a misunderstood condition. Surgery 104: 70-73. [crossref]
  7. Shivani T, Vijayabhaskar K, Srinivasa PR, Anil Kumar B, Yadav K (2019) Anti-Hemorrhoidal Activity of Leaf Butanol Fraction Portulaca Oleracea , Belonging To the Family Portulacaceae. Journal of Pharmacy and Biological Sciences 14: 16-20.
  8. Pigot F, Siproudhis L, Allaert FA (2005), Risk factors associated with hemorrhoidal symptoms in specialized consultation. Gastroenterol Clin Biol 29: 1270-1274. [crossref]
  9. Lohsiriwat V (2013) Approach to hemorrhoids. Curr Gastroenterol Rep 15. [crossref]
  10. Lohsiriwat V (2012) Hemorrhoids: from basic pathophysiology to clinical management. World J Gastroenterol 18: 2009-2017. [crossref]
  11. Clinical Practice Committee (2004) American Gastroenterological Association. American Gastroenterological Association medical position statement: Diagnosis and treatment of hemorrhoids. Gastroenterology 126: 1461-1462.
  12. Bouskela E, Cyrino FZ, Marcele G (1994) Possible Mechanism for the Inhibitory effect of Ruscus Extracts on Increased Microvascular Permiability Induced by Histamine in Hamster Cheek Pouch. Cardiovasc Pharmacol. 24: 281-285. [crossref]
  13. BMA 6th Pg: 114-115.
  14. Alonso-Coello P, Mills E, Heels-Ansdell D, López-Yarto M, Zhou Q, Johanson JF, et al. (2006) Fiber for the treatment of hemorrhoids complications: a systematic review and meta-analysis. Am J Gastroenterol 101: 181-188. [crossref]
  15. Lohsiriwat V (2014) Update on common anorectal diseases. Tech Coloproctol 18: 87-88.
  16. Misra MC (2005) Drug treatment of haemorrhoids. Drugs 65: 1481-1491. [crossref]
  17. Brinkhaus B, M. Lindner DS, Hahn EG (2000) Chemical, pharmacological and clinical profile of the East Asian medical plant Centella asiatica. Phytomedicine 7: 427-448. [crossref]
  18. Salvati EP (1990) Management of acute hemorrhoidial disease. Perspect Colon Rectal Surg. 3: 309-314. [crossref]
  19. Linda BW, Steven F (2000) The Herbal Drugstore. Herbs Companion Press pg: 282-284.
  20. Lohsiriwat V (2009) Hemorrhoids: from basic pathophysiology to clinical management. World J Gastroenterol 18: 2009-2017. [crossref]
  21. John AH (2004) New Guide to Medicine and Drugs, British Medical Association.

Aichi Synchrotron Radiation Center for Industrial Use

DOI: 10.31038/NAMS.2023643

Abstract

Aichi Synchrotron Radiation Center was designed for industrial use in main following discussion among academia, industry and local government in the Aichi area. In addition to the hardware, attention was given to quick and user-friendly use. The unique process for users will be described and the performance for 10 years will be reviewed.

Keywords

Synchrotron radiation, Industrial use, Beamlines, XAFS, Advanced materials

Introduction

The Aichi Synchrotron Radiation Center (AichiSR) started its open use with 6 beamlines on March 26, 2013 and has grown steadily during 10 years to 12 beamlines with over 10,000 hours of used beamtime in the 2022 fiscal year. The facility is owned by Aichi Science & Technology Foundation, which cooperates with industry, academia, and the Aichi Prefectural Government. The AichiSR is responsible for maintenance, operation of the facility, and user services. The AichiSR is the 8th SR facility constructed for public use in Japan as of 2023. Since three general-purpose facilities already exist (Photon Factory, UVSOR, and SPring-8), other facilities can be designed for specific purposes. When we first started discussing on SR facility in the Aichi area in 1991, the Photon Factory and UVSOR were already operating, and construction of the SPring-8 had begun. Therefore, our aim was to construct a compact and easily accessible facility. Based on open seminars carried out in 2000 and 2001, we learned that there were a large number of active SR users in industry and universities in the Aichi area, and some of them expressed a desire to have an SR facility in this area. Considering the needs of industrial and academic researchers, working mainly in the fields of applied physics and chemistry, in 2003 we, Nagoya University SR group, proposed a plan called “Photo-Science Nano-factory”. In this proposal, a center would be constructed with the synchrotron radiation facility as a core facility and providing other high-level measurement and analysis methods such as transmission electron microscopy, scanning electron microscopy, secondary ion mass spectroscopy, nuclear magnetic resonance and so on [1]. The technicians, scientists, and researchers working at the facility would fully support the needs of users. Research laboratories, incubation laboratories, and conference and meeting rooms would also be constructed. This plan attracted the attention of both industry and the Aichi Prefectural Government.

Based on opinions expressed by both industry and academia, the design of the light source was based on a 1.2-GeV storage ring with a booster ring for top-up operation, and 4 superconducting bending magnets (Superbends) for hard X-rays, 8 normal conducting bending magnets (Normal-bends) for soft X-rays, and one undulator for VUV. The working group was made up of members of Nagoya University, members of the Aichi Prefectural Government, and power users from industry and brushed up the design. A plan for implementation of the Nano-factory was completed, and the final report of the “Knowledge Hub Aichi” project based on the Nano-factory was submitted to Aichi Prefecture. In 2009, Aichi Prefecture approved construction, which then started in 2010. In the summer of 2011 the accelerators were installed, and commissioning began in 2012. The first light was observed in the summer of 2012, and the opening ceremony took place on March 22, 2013. The construction costs, 7.2Billion Yen, for the facility were covered by Aichi Prefecture (50%), donations from industry in Japan (20%) and the Japanese National Government (30%). Therefore, from the beginning, the AichiSR facility was a common local and national asset, and is basically open to any researcher without restrictions based on region or country.

Facility Overview

Accelerators

The accelerators consist of a 50MeV LINAC, a 50MeV-1.2GeV booster ring and a 1.2GeV storage ring [2]. The storage energy of 1.2 GeV was chosen based on the desire to construct a compact ring (72m circumference) that could supply hard X-rays (up to about 26 keV) into more than 8 beamlines from 4 Superbends with a magnetic field of 5T [2,3]. The Superbends are cooled by one cryopump for one Superbend without using any liquid He or N2 (there are no coolant vessels), overhauling once a year.

The combination of compactness and the ability to produce both hard and soft X-rays was a basic requirement during the design phase. The booster ring has two purposes. Firstly, it removes the need to ramp up the magnetic field in the bending magnets of the storage ring, thus avoiding any possible nonlinear dependence of the magnetic field in the Superbends on the driving current. Secondly, it allows the storage ring to be run in a top-up mode. Light with the same quality and the same brilliance is required for experimental repeatability and for checking the reproducibility of products that are a strong requirement from industry users. The top-up operation has been conducted from the beginning of the open use. Brilliance curves are shown in Figure 1.

4-hours beamtime is allocated to one shift and two shifts a day are scheduled as (I) 10:00-14:00, and (II) 14:30-18:30, from Tuesday through Friday for users, while the facility is dedicated to machine study on Monday. For most of the experiments 4-hour is long enough since the beamlines and end-stations are set up before users come according to discussion with beamline staff as mentioned in use flow.

FIG 1

Figure 1: Brilliance curves of the light from Superbend (red), Normal-bend (blue), and undulator (brown) at AichiSR. Those of some other facilities in Japan are also plotted.

Beamlines

In Table 1, the six beamlines constructed at the first stage are: 1) hard X-ray absorption fine structure (XAFS) and fluorescence X-ray analysis (BL5S1: 5~22 keV), 2) tender X-ray XAFS and photoelectron spectroscopy (BL6N1: 1.75~6 keV), 3) ultra-soft X-ray XAFS, vacuum ultraviolet (VUV) and photoelectron spectroscopy (BL7U: 30~1000 keV), 4) powder X-ray diffraction (BL5S2: 5~20 keV), 5) X-ray reflection, thin film and surface diffraction (BL8S1: 9.1, 14.37, 22.7 keV), and 6) wide/small-angle X-ray scattering (BL8S3: 8.2 and 13.5 keV) [4]. These 6 beamlines were selected out of 9 beamlines proposed (other 3 beamlines were protein structure analysis, micro/nano processing, and infrared imaging beamlines) and user demands were investigated using questionnaires from active and potential users and direct hearing from power uses in industry to focus to 6 beamlines.

Table 1: Beamlines open for users at present (Beamlines in italic are the first 6 beamlines)

Spectroscopy Beamlines (from 30 eV to 26 keV)

Diffraction, Scattering, Imaging Beamlines

BL7U(VUV, Soft X-ray XAFS, PES)

Energy Range:  30~1000 eV

BL1N2(Soft X-ray XAFS, PES)

Energy Range: 0.15~2.0 keV

BL6N1(Tender X-ray XAFS, PES)

Energy Range: 1.75~6.0 keV

BL5S1(Hard X-ray XAFS)

Energy Range:  5~22 keV

BL11S2(Hard X-ray XAFS)

Energy Range: 5~26 keV

BL2S1(Protein (Nagoya University))

Energy: 11.0, 17.2 keV

BL5S2(Powder X-ray Diffraction)

Energy Range: 5~20 keV

BL8S1(Thin Film Diffraction)

Energy: 9.1, 14.37, 22.7 keV

BL8S3(Wide/Small Angle X-ray Scattering)

Energy: 8.2, 13.5 keV, Camera Length: 0.2~6.4 m

BL8S2(X-ray Topography, X-ray CT)

Energy Range: 7~24 keV

Fortunately, protein structure analysis beamline (BL2S1) was constructed by Nagoya University using a supplementary budget from the Japanese Government, nano processing and imaging beamline (BL8S2) by an Aichi Prefecture Research Project.

Demand for the hard X-ray XAFS beamline was high and 2 beamlines maybe necessary from the beginning. It turned out to be true and BL5S1 reached to 100% of available beamtime. Then, BL11S2 was constructed by Aichi Prefecture Government.

BL2S1 and BL11S3 in Table 2 were constructed by a private company in Aichi. The number of beamlines became twice of the first 6 beamline within 10 years.

Table 2: Beamlines owned by a private company

BL2S3 (Hard X-ray XAFS and X-ray diffraction)

BL11S3 (X-ray CT)

In Figure 2, yearly change of the beamtime, with fraction of user category (Big, Medium/small-companies, Industry-Academia collaboration, Universities, and Public Research Institutes), beamlines, and beamtime used for measurement acting service (red line). Influence of COVID-19 is clear in 2020 and 2021, that is the saturation of used beamtime (not dipped) and steep increase of the beamtime used for measurement active service. We carefully controlled the infection path (without shut-down of facility) and there was no infection at AichiSR.

FIG 2

Figure 2: Yearly change of beamlines and beamtime used

Measurement Acting Service

Measurement acting service is common for most of the facilities. In AichiSR, especially for soft X-ray or VUV absorption experiments, a transfer vessel was developed before COVID-19 to keep samples under a high vacuum or in a high purity inert gas while transferring them to high-vacuum/high-purity chambers at AichiSR. User can send the vessel to or carry in AichiSR. The vessel was designed to be used by other member facilities of the project “Photon-Beam Platform” for different experiments at different beamlines in Japan [5].

Beamtime Assignment Process

The key factors that were considered with regard to industrial use are: 1) ease of use (low threshold for entry), 2) measurements under in-situ and in-operand conditions, 3) repeated experiments on the same topic, 4) short time from application to execution, and 5) nondisclosure of results. To realize 4), applications are accepted every two months. All users pay for beamtime, but the charge is much lower for academic use under the condition that results are disclosed. It turned out those factors (from 1~4) are quite convenient for academic users too.

To realize those key factors the use-flow as shown in Figure 3 is taken at our facility. (1) Consultation: contact to our consultation office to discuss details of your experimental plan and with coordinator and if necessary with beamline staff. (2) applications are accepted every two months. (3) Decisions on usage follow a first-come-first-served basis. The review process for proposals focuses on safety and technical possibility rather than evaluation. Allocation of beamtime is informed within two weeks. When there is a vacancy of the beamtime, it is announced and allocation is made within one week at the shortest. (4) Necessary to complete several forms for use, such as radiation worker registration application form, radiation worker approval certificate, written pledge, and so on. (5) At the reception desk you can obtain an entry card and a personal radiation measurement badge. (6) Prepared samples are mounted on the sample stage. Beamline instruments are usually adjusted and checked by our beamline staff members (two per one beamline and all of them are PhD holders) before your beamtime. Support on instrument operation, sample measurements, and necessary assistance are provided. Analysis support can also be provided within the beamtime, and (7) after the experiments, signing a form of completion, return of entry card, and radiation badge to the box at the reception desk are required.

For university and public institute users, experimental results have to be reported in a form within 50 days after the experiment. This disclosure of the results allows a much lower fee (half) than that of big company (fee for medium-small sized company is also a half to encourage their usage). If academic users pay the full fee, disclosure of results is exempted.

FIG 3

Figure 3: Use flow

Industrial Use

In 2022, 65% of our users were from industry (including industry-academia collaborations), 28% was purely academic and the remainder was from public research institutes, as shown in Figure 4. The research fields of these users were very diverse, as shown in Figure 5. The fraction is almost unchanged during 10 years. The beamtime increased by about twice as can be seen in Figure 1.

FIG 4

Figure 4: AichiSR users from industry, universities and public research laboratories in 2022 of 12 beamlines. The fraction is almost unchanged during 10 years. The beamtime increased by about twice as can be seen in Figure 1.

As can be seen in Figure 5, production type of industry is diverse, but 50% of users are related to R&D for automobiles. Chemicals, Research services, or Electronic devices come next. Though the fraction is smaller, users from quite a wide variety of research fields come to use AichiSR.

FIG 5

Figure 5: Fraction of production type of industry. Beamtime used by automobile and related R&D is 50% and has been top for last 10 years. Chemicals, Research service, or Electronic devices comes next changing year by year. The beamtime is of industrial use only.

The goal of industrial research is not to publish papers, but to produce profitable products. Therefore, evaluation of proposals for beamtime should not be performed based on scientific importance or impact on novel technology. Repeated experiments are also important in industry.

Beamline and beamtime assignments are carried out through negotiation between coordinators and users as described above. Use of multiple beamlines for one application is possible, and sometimes we actually suggest this to users.

Use Situation of Beamlines

Popularity of Beamlines

Figure 6 shows the fraction of usage techniques by 10 open-use beamlines at AichiSR in 2022. There are 5 beamlines that cover the energy from 30eV to 26keV without gaps as listed in Table 1. Hard X-ray XAFS (BL5S1 and BL11S2) covers 26%, soft X-ray XAFS (BL1N2 and BL6N1) covers 23% of the beamtime, thus XAFS measurement occupy 49%. 58% of the beamtime is used for absorption measurements when the VUV (BL7U) is included. It is well recognized that AichiSR is strong for the XAFS measurements. XAFS has been used to develop new materials to obtain new functions and new devices, such as exhaust catalysts, Li-ion batteries, semiconductors, nanoparticles, and many others.

Current problem is that most of the beamlines are full almost all through the year. Especially in the last quarter of each year the applied beamtime overflows from the available time of XAFS beamlines. Construction of new beamlines and modification of other less busy beamlines are being seriously discussed.

FIG 6

Figure 6: Usage faction of measurement techniques in 2022

An Example of XAFS Measurement

An example of XAFS measurement is shown in Figure 7. The native passive film structure on SUS304 surface was investigated using Hard-X-ray XAFS, (BL5S1) and photoelectron spectroscopy (XPS, BL6N1 and BL7U). The XAFS spectra clearly showed an ordered network-structure (at least<1nm) of Cr(IV) oxide. In addition, the XPS spectra indicated that the chromium oxide was transformed into a chromium oxyhydroxide such as a -O-Cr-OH- structure. Fourier-Transformed EXAFS spectra of the SUS304 substrate and the two reference samples are shown in Figure 7. The measured energy range of 5690-7084eV that is the k range of 0-16.9 Å1. The overlapped curve to the measured spectrum shows the simulated spectrum using the FEFF method.

FIG 7

Figure 7: FT-EXAFS spectra of the SUS304

Figure 8 shows a new structural model of the native passive film on the SUS304 substrate obtained by the experiments described above. The left and right figures show a Cr-terminated structure and an OH/O terminated one, respectively [6].

FIG 8

Figure 8: Structure model of the native passive film

Summary

After 10 years of discussion and planning by universities, industry, and local government in the Aichi area, the Aichi Synchrotron Radiation Center was designed for industrial and academic use. The choice of accelerators, beamlines, and service management was determined based on discussion and feedback involving industry and academia. Of the six beamlines available, the highest priority was given to XAFS beamlines that allow analysis of elements from Li to U. In addition to the hardware, attention was given to the development of operating procedures that were quick and user-friendly. The facility became available for public use in March 2013. In 2013, 55% of the experiments involved XAFS analysis (hard X-ray, soft X-ray and VUV regions). 6 beamlines increased to 12 beamlines and the used beamtime also increased twice of the first year. The beamtime allocated to industrial use increased from 2,976 hours in 2013 to 6,700 hours in 2022. The range of research fields for users of the facility was found to be very broad, and the beamtime used by automobile and related R&D is 50% and has always been top at AichiSR.

References

  1. Takashima Y, Yamane T, Takeda Y, Soda K, Yagi S, et al. (2007) AIP Conference Proceedings (American Institute of Physics) 879: 75-78.
  2. Yamamoto N, Takashima Y, Hosaka M, Morimoto H, Takami K, et al. (2010) Proceedings of IPAC2010 (Kyoto Japan) 2567-2569.
  3. Yamamoto N, Takashima Y, Hosaka M, Takami K, Mano A, et al. (2011) Proceedings of IPAC2011 (San Sebastian, Spain) 2987-2989.
  4. Yamamoto N, Takashima Y, Katoh M, Hosaka M, Takami K, et al. (2010) The 10th International Conference on Synchrotron Radiation Instrumentation (Melbourne, Australia, American Institute of Physics) 591-594.
  5. Nakanishi Y,Yagi S, Ohta T (2010) IEEJ Electronics, Information and Systems 130: 1762-1767 (in Japanese).
  6. Shimizu S, Ito S,Asaoi H, Miyamawa T, Muto M et al. (2016) Hyomen Kagaku 37: 422-428 (in Japanese).

An Extensive Research on Immune-modulating MOFbased Nanodrug for Enhanced Photothermal Therapy of Melanoma

DOI: 10.31038/NAMS.2023642


Abstract

Original research on the application of MOF-based nanodrugs for photothermal and immune therapy of melanoma has been developed. This study, aimed at addressing the limitations of melanoma treatment, constructed indocyanine green (ICG) loaded GSH-responsive PD-1 inhibitory polypeptide AUNP12-modified MOF nanodrugs for photothermal and immune therapy of melanoma. The AUNP12 could be released to bind PDL-1, effectively blocking the PD-1/PD-L1 pathway at high concentrations of glutathione (GSH). This MOF-based nanodrugs could promote the maturation of DC cells, while the ICG exhibits strong photothermal effects, achieving synergistic photothermal and immunotherapy for melanoma.

MOF-based Nanodrugs for Melanoma Treatment General Achievements

Melanoma is a cutaneous neoplasm arising from the malignant transformation of melanocytes, exhibiting a high degree of malignancy and a propensity for metastasis, thereby resulting in a poor clinical prognosis and a heightened fatality rate [1]. The chief limitations of traditional clinical interventions (surgery, radiation therapy, and chemotherapy) primarily lie in their limited efficacy in suppressing metastatic lesions and their substantial toxic and side effect [2]. Hence, the focal point in the clinical management of malignant melanoma is how to efficaciously inhibit its growth and metastasis with reduced toxicity, constituting a pivotal juncture in clinical practice and a current scientific research challenge.

Immunotherapy has recently emerged as an advanced therapeutic strategy with attracted widespread attention in clinical and foundational research. Immune checkpoint blockade holds promise in the treatment of melanoma, particularly through the inhibition of programmed cell death protein-1 (PD-1)/programmed cell death ligand-1 (PD-L1) [3]. Nevertheless, the currently available immunotherapeutic antibodies targeting melanoma exhibit expensive, considerable toxicity, robust immune reactions, and substantial interindividual variability. In contrast, PD-1 inhibitory peptide AUNP12 (AUR-12/Aurigene-012), developed by Aurigene and Pierre Fabre, is characterized by its affordability and minimal adverse effects and is presently in the preclinical research phase [4].

Nevertheless, research has illuminated the limited efficacy of singular immune checkpoint blockade in restraining tumor growth and metastasis [5]. A synergistic approach, with methodologies such as chemotherapy, photodynamic, or photothermal therapy, can amplify therapeutic potency [6,7]. Photothermal therapy, an exceedingly promising novel method for tumor treatment, relies on the conversion of external light sources into localized thermal energy to kill neoplastic cells, particularly suitable for cutaneous malignancies. Remarkably, studies have also reported the capability of photothermal therapy to stimulate an immune response within the host organism, by generating endogenous antigens during the thermal ablation of tumor tissue, subsequently activating cytotoxic T cells [8,9]. Therefore, the synergistic treatment of immune checkpoint blockade and photothermal therapy holds extensive promise in the management of melanoma.

This work “The GSH responsive indocyanine green loaded PD-1 inhibitory polypeptide AUNP12 modified MOF nanoparticles for photothermal and immunotherapy of melanoma” has designed and constructed a nanomedicine that combines the photothermal and immunotherapy [10]. Through click chemistry, AUNP12, linked by disulfide bonds, was modified onto the surface of a metal-organic framework (MOF) and loaded with the photothermal converter indocyanine green (ICG) which has strong photothermal effect. The PD-1 inhibitory peptide AUNP12 could be responsive release from MOF-based nanodrug and promote the maturation of DC cells, which combine with the ICG to achieve synergistic photothermal and immunotherapy for melanoma (Figure 1).

FIG 1

Figure 1: The schematic diagram of ICG-MOF-SS-AUNP12 nanoparticles for synergistic photothermal and immunotherapy.

Conclusion

The MOF-based nanodrugs exhibits potent photothermal effects for tumor cell ablation while intelligently releasing PD-1 inhibitory peptides to enhance DC cell maturation. The study primarily furnishes a concept of substantial value, albeit at a relatively preliminary stage. With a clinical translation objective in mind, the exploration of a secure and efficacious delivery modality for nanomedicines is essential in the future. Taking into account the unique biological characteristics of melanoma, a comprehensive research effort is currently underway to explore alternative drug delivery methods, such as microneedle-based transdermal delivery, with the ultimate goal of developing innovative treatment strategies for this deadly cancer.

Acknowledgements

This work was financially supported by the National Natural Science Foundation of China (32101134, 32101161), Program of Science and Technology Department of Sichuan Province (23NSFSC0884, 2022YFS0203), the Technology Innovation Project of Science and Technology Bureau of Chengdu (2022-YF05-01468-SN, 2022-YF05-01724-SN).

References

  1. Garbe C, et al. (2022) European consensus-based interdisciplinary guideline for melanoma. European Journal of Cancer 236-255. [crossref]
  2. Long GV, et al. (2023) Cutaneous melanoma. Lancet 485-502.
  3. Kubli SP, et al. (2021) Beyond immune checkpoint blockade: emerging immunological strategies. Nature Reviews Drug Discovery 899-919. [crossref]
  4. Zhan MM, et al. (2016) From monoclonal antibodies to small molecules: the development of inhibitors targeting the PD-1/PD-L1 pathway. Drug Discovery Today 1027-1036.
  5. Chen W, et al. (2018) Combining photothermal therapy and immunotherapy against melanoma by polydopamine-coated Al2O3 nanoparticles. Theranostics 2229-2241. [crossref]
  6. Lu J, et al. (2018) Breast Cancer Chemo-immunotherapy through Liposomal Delivery of an Immunogenic Cell Death Stimulus Plus Interference in the IDO-1 Pathway. ACS Nano 11041-11061. [crossref]
  7. Li Y, et al. (2019) Nanotechnology-based photoimmunological therapies for cancer. Cancer Letters 429-438. [crossref]
  8. Huang L, et al. (2019) Mild photothermal therapy potentiates anti-PD-L1 treatment for immunologically cold tumors via an all-in-one and all-in-control strategy. Nature Communications 4871.
  9. Balakrishnan PB, et al. (2020) Photothermal therapies to improve immune checkpoint blockade for cancer. International Journal of Hyperthermia 34-49. [crossref]
  10. Hao Y, et al. (2023) The GSH responsive indocyanine green loaded PD-1 inhibitory polypeptide AUNP12 modified MOF nanoparticles for photothermal and immunotherapy of melanoma. Frontiers in Bioengineering and Biotechnology. [crossref]

The Process of Being Hospitalized for Bowel Preparation before Colonoscopy

DOI: 10.31038/IJNM.2023441

Abstract

Background: Inadequate bowel preparation before a colonoscopy is troublesome for patients and costly for healthcare. Therefore, some patients are hospitalized for bowel preparation, but the number of patients and criteria involved in decision-making vary.

Aim: To investigate the variables included in decision-making concerning whether patients should be hospitalized for bowel preparation before colonoscopy.

Methods: Qualitative dynamic system modeling, including interviews with patients, nurses, and physicians and examining guidelines

Findings: The decision to offer hospitalization for bowel preparation was discussed only in a few cases with patients, and there was no dialogue with primary care. The decision was based on guidelines, rules of thumb, and healthcare professionals’ subjective judgment and did not follow evidence-based criteria.

Conclusion: Several factors, such as dialogue across healthcare sectors, involving patients in decision-making and adjusting clinical guidelines, were identified in the model that can be used to improve clinical practice and the experiences of patients.

Keywords

Clinical decision making, Colonoscopy, Qualitative

Introduction

Worldwide, colonoscopy is the most common method for diagnosing diseases of the intestinal mucosa, such as cancer or inflammatory conditions [1]. The number of colonoscopies is steadily increasing in most countries [2]. Likewise, in Denmark, where the implementation of a screening program for colorectal cancer for the population between the ages of 50 and 74 years has significantly increased the number of colonoscopies [3]. To ensure adequate visualization of the intestinal mucosa and thereby optimize the possibility of successful diagnosis and treatment during the colonoscopy, bowel preparation is crucial [4]. Bowel preparation implies that the patient must follow specific diet restrictions and consume laxatives to achieve successful bowel cleansing [5]. Most patients manage bowel preparation at home, while some patients are hospitalized, but overall patients experience bowel preparation as unpleasant and challenging due to uncontrolled diarrhoea, nausea, and sleep deprivation [6,7]. A guideline from the European Society of Gastrointestinal Endoscopy highlights that 18–35% of bowel preparation is inadequate in patients undergoing colonoscopy [8]. Notably, a study found that outpatients had more adequate bowel preparations than inpatients [9]. In the context of three major gastroenterology centres in the Capital Region of Denmark, the complex challenges of daily decision-making concerning the management of the growing number of colonoscopies and the shortage of available hospital beds have been identified. An overview of the number of colonoscopies at each of the three hospitals and the number of patients hospitalized for bowel preparation are illustrated in Table 1.

This study aimed to investigate the variables included in the decision and to determine whether patients were offered hospitalization for bowel preparation.

Table 1: Overview of colonoscopies and hospitalizations for bowel preparation at three hospitals in Denmark


Site


Colonoscopies per year (2020)


Colonoscopies per month #


Hospitalization for bowel preparation

 n (%) #

HGH

5689

475

477

490

15 (3.2)

12 (2.5)

12 (2.4)

AHH

7500

361

422

459

34 (9.4)

29 (6.9)

40 (8.7)

BFH

5581

430

521

535

29 (6.7)

22 (4.2)

26 (4.9)

HGH: Herlev and Gentofte Hospital, AHH Amager and Hvidovre Hospital, BFH Bispebjerg and Frederiksberg hospital.
#Numbers from HGH and AHH are from April, May, and June 2021, and numbers from BFH are from January, February, and March 2022.

Methods

Design

We developed a descriptive model based on participatory system modelling (SDM) to explore the interactions between variables included in the process of deciding if a patient is offered hospitalization for bowel cleansing [10]. The intended outcome was to help stakeholders illustrate the process of decision-making, and thereby also highlight potential areas for improvement of the process. SDM is a method used to explore and understand complex decision-making involving multiple actors [10]. In the data collection phase, this entails identifying the current and potential decision-makers, understanding their influence and rationale behind the decision-making. Relevant policies and guidelines are also considered as part of the data. The data was analyzed and discussed using a qualitative approach. This study was conducted in the Capital Region in Denmark at the Departments of Gastroenterology at three university hospitals: Herlev and Gentofte Hospital (HGH), Amager and Hvidovre Hospital (AHH), and Frederiksberg and Bispebjerg Hospital (FBH).

Data Collection

Data were collected from March to June 2021 and included patients admitted for bowel preparation before colonoscopy, above 18 years of age, capable of giving informed consent, and able to speak and understand Danish. Patients were contacted after admittance and before bowel preparation. After obtaining informed consent, the time for a telephone interview was agreed upon with the patient one or two days after discharge. The interviews included questions on experiences of hospital admission and bowel preparation, as well as data on patients’ living conditions, support from primary care, and functional status (using the Barthel Index for Activities of Daily Living (ADL)) [11]. Data regarding patients’ age, gender, diagnosis, and cause for colonoscopy were obtained from the patients’ medical records. Physicians’ and nurses’ written documentation regarding their considerations and reasoning on whether this patient should be hospitalized for bowel preparation and, their knowledge of clinical guidelines. Ward managers’ experiences and general views on hospital admission for bowel preparation were investigated at each hospital through individual interviews. In the cases where the patients received help from home care, primary care nurses in the municipality were interviewed by telephone regarding their views on the possibility of the patients carrying out bowel preparation at home. Clinical guidelines at the three hospitals were collected to identify formal criteria for admission for bowel preparation.

Data Analysis

The analytic process developed continuously alongside the data collection. First, we identified key variables that potentially influenced the decision for hospitalization. The basic structure of a model was first agreed upon by the group of authors. A template was developed from which data were collected. In an iterative process, the data were discussed and analyzed at each group meeting. The analysis focused on the development of a descriptive model; therefore, data were grouped into categories and re-grouped until the model was clear. The process continued until a consensus was reached on the final model.

Ethics

All patients were informed orally and in writing about the project, after which they provided informed consent and agreed to have their anonymized responses published. Healthcare professionals were informed orally and agreed to have their anonymized responses published. Permission to store data confidentially was obtained from the Danish Data Protection Agency (ID no: P-2020-1172). According to Danish law, no formal ethical approval was needed for this study.

Results

A model of the decision process and related variables in the decision on hospitalization before colonoscopy was developed (Figure 1). The study included 17 patients (5 from HGH, 3 from FBH, and 9 from AHH). The median age of the patients was 74 years (ranging from 50 to 86), of whom 10 were male. The demographics of the participating patients are shown in Table 2. Of those involved in the decision-making process, 10 physicians and 12 nurses were also included. Two of the physicians were the patient’s family physician, and 10 were hospital-employed physicians from the Departments of Gastroenterology. The 12 nurses were employed in outpatient clinics and had between 1 and 15 years of experience in the specialty of gastroenterology. Furthermore, nine nurses from the municipalities were contacted. Management at the departments was interviewed at the hospitals.

fig 1

Figure 1: A flow chart model of the decision process for patients to either stay at home or be hospitalized for bowel preparation before a colonoscopy

Table 2: Demographics of the participating patients

Number

Age (years)

Gender

Cohabitating

Housing type

Home care services

Bartell score

Cause of referral for colonoscopy

1

80

male

no

sheltered housing medication

18

suspected colorectal cancer

2

85

female

no

apartment none

20

suspected colorectal cancer

3

74

female

no

apartment cleaning, shopping, food preparation, laundry, medication, treatment of ulcer, personal hygiene, and mobilization

10

diarrhea, reduced appetite, weight loss

4

64

female

no

apartment cleaning

20

suspected colorectal cancer

5

74

female

no

house tube feeding 4 times a day

20

bleeding from the rectum

6

70

female

yes

house none

20

abdominal pain and bleeding from the rectum

7

81

male

no

apartment cleaning, shopping, and laundry

18

diarrhea for several weeks

8

74

female

no

house help for anti-embolism stockings twice a day and wound care twice a week

19

suspected colorectal cancer

9

69

male

no

apartment personal hygiene daily, bath two times a week, cleaning every 14 days

18

suspected colorectal cancer

10

76

male

yes

house change of bladder catheter every ten week

16

abdominal pain, weight loss, suspected colorectal cancer

11

63

male

no

house every morning for medicine, cleaning every 14 days.

18

removal of polyps

12

83

female

yes

house shower once a week, medicine and food delivery twice a week, and incontinence treatment daily

15

alternating bowel movements

13

82

male

no

nursing home medication, help with personal hygiene, and mobilization every day

5

suspected colorectal cancer

14

50

male

no

apartment cleaning every other week

20

suspected colorectal cancer

15

81

male

no

house cleaning every other week

20

diarrhea for six months

16

73

male

yes

house none

20

suspected colorectal cancer

17

86

male

no

house none

19

bleeding from the rectum

Referral for Colonoscopy

Overall, there were different ways in which patients could be referred for colonoscopy. However, the decision on whether the patient should be admitted to the hospital for bowel preparation was formally decided by a physician employed at the hospital, and no signs of nurses being involved in this decision were found. Sometimes the decision was made concerning the patient visiting the outpatient department and sometimes as an administrative decision, without seeing or talking to the patient.

Decision

The three hospitals had very different administrative guidelines for identifying patients who needed hospitalization for bowel preparation. One hospital’s guidelines stated that patients with severe renal insufficiency (creatinine clearance > 30 ml/min), congestive heart failure (NYHA III or IV), or needing help from healthcare professionals to go to the toilet must be admitted during bowel preparation. The second hospital only used general guidelines for being hospitalized, such as diabetes, heart disease, kidney disease, or disability. The third hospital had no guidelines and relied on an individual assessment by the admitting physician. In some cases, the possibility of hospital admission for bowel preparation was discussed with the patient and/or relatives, i.e., when the referral for colonoscopy was decided after a visit to the outpatient clinic or if a clear decision was stated in the referral from a family physician. The arguments for admitting patients included being nervous about undergoing bowel preparation at home, faecal incontinence, dizziness, difficulty walking, and insufficient help at home. In the guidelines for the two hospitals, only difficulty walking was mentioned as a recommendation for admission, but despite that, in all cases, the recommendations from the family physician were followed without question by both the nurse and admitting physician. Most often, when the hospital physician decided that a patient should be hospitalized for bowel preparation; the decision was primarily based on the physician’s subjective judgment, without talking to the patient or primary care or following guidelines (if there were any). Reasons such as suffering from a cognitive disability or a previously cancelled colonoscopy due to inadequate bowel preparation were not mentioned in the guidelines. Still, both nurses and physicians agreed that these patients should be admitted for bowel preparation without further dialogue with the patient. At one hospital, there was an administrative rule of thumb stating that there could be no more than two patients admitted for bowel cleansing at a time. This rule of thumb would therefore determine when a colonoscopy could take place.

Collaboration with Primary Care

The care offered by the six municipalities included in this study was very similar. However, there was considerable variation between municipalities’ rules for visitation for help with bowel preparation at home. Significantly, the notification deadline for the preparations varied. One municipality needed to be advised 24 hours before, while another municipality needed three days. At the administrative level, there was broad agreement from the nurses in primary care to follow their service catalogue, in which it was specified, which services they could offer a citizen who had to go through bowel preparation before a colonoscopy. The services the primary sector could offer included help to read and understand the instructions for bowel preparation, medication administration, help with toilet visits, change of diapers, change of bed linen, follow-up visits, phone calls to make sure the person was okay, and visitation based on an emergency call from the person. However, in practice, there were several challenges, such as planning the visits, which could make it difficult to help with toilet visits because it was unpredictable when the person needed to go to the toilet. Even if a person had an emergency call, some healthcare professionals expressed concerns since it could take a long time from the call until someone came for help. Optimally, the person should, to a certain extent, be able to control bowel movements and manage toilet visits relatively independently. Similarly, if the person needed help during the night, there would be a long waiting time, and the primary care nurse would need a key to the home. They also required that the person be cognitively well-preserved and follow the bowel preparation instructions.

Patients’ Experiences

Some patients were thankful that they were admitted to a hospital ward instead of undergoing bowel preparation at home. In addition, receiving the medication from the nurses at the precise hours contributed to a feeling of being taken care of and safe. The loss of control over bodily responses meant that they had to run to the toilet, and not knowing whether they would be able to hold back the faeces was highly stressful. Some patients felt embarrassed due to the lack of privacy in the hospital ward as they shared the toilet with another patient. They needed unrestricted access to the toilet, and the lack of privacy made them uncomfortable. Patients mentioned the importance of being well-informed. Some felt a lack of information but, even so, found it safer to be admitted than to undergo bowel preparation at home. On a few occasions, the patients went through bowel preparation, but their colonoscopy was cancelled due to miscommunication regarding their medication. For example, if the patient had not paused an anticoagulant drug or iron, the coloscopy could not be completed, and it had to be scheduled for weeks later. Consequently, the patients had to undergo bowel preparation once again. A situation that made the patients frustrated and angry. Generally, the patients feared managing the bowel preparation procedure at home because of their fear of making a mess.

Discussion

Our results indicate that nurses and primary care was not involved in the decision-making process whether a citizen could undergo bowel preparation at home with assistance from home care nurses or if hospital admission would be necessary. These results may contrast with the Danish healthcare systems’ vision of coherent care pathways across regions, municipalities, and the primary healthcare sector, intending to improve and coordinate tasks in close collaboration [12]. It also contrasts with the highly experienced nurses’ ability to include their assessment of the patient in clinical decision making. Our results also indicate that the services primary care could offer align with the care needs of most patients during hospitalization for bowel cleansing. This suggests that more patients might conduct bowel cleansing at home with the support of primary care. However, primary care faced challenges related to the time sensitivity of assisting patients. Considering the substantial number of patients hospitalized for bowel cleansing, it may be worthwhile to further explore involving primary healthcare professionals in the decision-making process, potentially leading to the development of new workflows. This approach may not only help patients feel confident about undergoing bowel cleansing at home but also avoid the costs associated with hospitalization. Moreover, it is worth noting that one of the patients in our study resided in a nursing home, which raises questions about the necessity of hospitalizing the patient for bowel cleansing. It may be reasonable to involve healthcare professionals from nursing homes in the decision-making to identify potential barriers in assisting patients during bowel cleansing. This collaborative effort could lead to development of workflow that eliminates the need for hospitalization in such cases.

Overall, we found no national guidelines describing which criteria should determine which patients should be hospitalized for bowel preparation before a colonoscopy. Furthermore, the practices at the three hospitals varied. Studies indicate that factors such as high age, male sex, low level of physical activity, lower educational level, several comorbidities, diabetes, chronic constipation, and polypharmacy are associated with inadequate bowel preparation [13-16]. However, none of these factors was reflected in the hospitals’ local guidelines. Although comprehensive European guidelines underline the importance of sufficient bowel preparation for a successful colonoscopy [8], it has not been possible to clarify recommendations identifying factors that determine whether a patient should be hospitalized for bowel preparation or undergo bowel preparation at home. Another study also found that several patients were referred directly to colonoscopy without being in contact with the hospital. These patients participated in screening programs, follow-up on colon cancer screening tests, and surveillance colonoscopy. This may be problematic, as many patients undergo colonoscopy unnecessarily because no physician has engaged in a conversation with the patients regarding the indications and risks of the procedure or the reason why some patients decide not to show up for the colonoscopy [17]. A recent study found that patients’ decision on whether to undergo a colonoscopy was characterized by uncertainty about what to expect [18]. Shared decision-making has been found to improve patients’ feelings of being well-informed [19] and to improve patients’ attentiveness and adherence to recommendations [20]. Thereby, whether shared decision-making is a tool to reduce the number of inadequate bowel preparations should be discussed. We found no studies investigating shared decision-making concerning patients referred to colonoscopy, but shared decision-making is recommended in other gastroenterological settings such as general screening for colon cancer [21,22]. Several factors have been related to the adequacy of bowel preparation, and inpatient status represents one of the strongest independent predictors of inadequate colon cleansing. Inadequate inpatient bowel preparation may increase the length of hospital stay by about 25% and costs by 30% compared to adequate preparation [14]. Ideally, patients understand and are well prepared for the procedure, which requires dialogue between patients and healthcare professionals [17]. However, some patients miss pieces of information [18]. The completion of bowel preparation is incredibly challenging for older patients, and a low score of ADL has been found to be a significant predictor of inadequate bowel preparation [23]. However, in our study, the patients had a high Barthel score, indicating a high level of physical functional performance. This indicate that no formal assessment of patients’ physical status are included in the decision of whether a patient should be hospitalized. Furthermore, undergoing bowel cleansing is a stressful procedure, unfamiliar to most patients. Therefore, relying solely on scores such Barthel may not provide an accurate assessment of patients’ ability to independently manage bowel cleansing at home. In our study, other factors, such as psychological aspects or previous experiences of inadequate bowel cleansing, influenced the decision for hospitalization.

Hospitalization for bowel preparation is associated with an almost two-fold higher risk of inadequate bowel preparation before colonoscopy. This may be associated with the fact that inpatients have more comorbidities than patients undergoing bowel preparation at home. Likewise, it may be associated with nurses’ and physicians’ need for specific education in bowel preparation [24-26]. Interventions, such as videos or phone calls the day before the colonoscopy, have been explored, but the optimal solution has still not been found [27].

The findings in this study might not be transferrable to settings outside Denmark, even though the high number of patients not sufficiently prepared for colonoscopy is well known in many countries. In addition, there are factors influencing the decision for hospitalization that have not been considered in this study, including the economic constraints of the healthcare system, the lack of nurses influencing the number of beds available, the need for further improvement of the medication used for bowel preparation, and screening the level of patients’ constipation before a decision on admission. This will probably also affect the future administrative procedures of patient care. Moreover, we did not explore the perspectives of the relatives, which could have provided insight into the feasibility and appropriateness of asking close relatives to support their family member during bowel cleansing. Such insight could have shed light on the role of the relatives in this context.

Conclusion

Different variables included in the decision to hospitalize patients for bowel preparation were identified. The lack of evidence-informed decision-making, the involvement of patients in decision-making, and the missing collaboration across healthcare sectors are possible essential factors to include in developing better care trajectories.

Acknowledgment

We wish to thank the patients, nurses, and physicians participating in this study for taking the time to talk to us.

Funding

This research did not receive any specific grant from funding agencies

References

  1. Kastenberg D, Bertiger G, Brogadir S (2018) Bowel preparation quality scales for colonoscopy. World J Gastroenterol 24: 2833-2843. [crossref]
  2. Kim SY, Kim HS, Park HJ (2019) Adverse events related to colonoscopy: Global trends and future challenges. World J Gastroenterol 25: 190-204. [crossref]
  3. Petersen MM, Ferm L, Kleif J, Piper TB, Rømer E, et al. (2020) Triage May Improve Selection to Colonoscopy and Reduce the Number of Unnecessary Colonoscopies. Cancers (Basel) 12. [crossref]
  4. Parra-Blanco A, Ruiz A, Alvarez-Lobos M, Amorós A, Gana JC, et al. (2014) Achieving the best bowel preparation for colonoscopy. World J Gastroenterol 20(47): 17709-26. [crossref]
  5. Alvarez-Gonzalez MA, Pantaleon MA, Flores-Le Roux JA, Zaffalon D, Amorós J, et al. (2019) Randomized Clinical Trial: A Normocaloric Low-Fiber Diet the Day Before Colonoscopy Is the Most Effective Approach to Bowel Preparation in Colorectal Cancer Screening Colonoscopy. Diseases of the Colon and Rectum 62: 491-497. [crossref]
  6. Shamim S, Andresen YLM, Vind Thaysen H, Hovdenak Jakobsen I, Nielsen J, et al. (2021) Experiences of Patients Undergoing Bowel Preparation and Colonoscopy: A Qualitative Longitudinal Study. Journal of Multidisciplinary Healthcare.14: 349-358. [crossref]
  7. Ryhlander J, Ringstrom G, Simrén M, Stotzer PO, Jakobsson S (2019) Undergoing repeated colonoscopies – experiences from patients with inflammatory bowel disease. Scandinavian Journal of Gastroenterology 54: 1467-1472.
  8. Hassan C, East J, Radaelli F, Spada C, Benamouzig R, et al. (2019) Bowel preparation for colonoscopy: European Society of Gastrointestinal Endoscopy (ESGE) Guideline – Update 2019. Endoscopy 51: 775-794. [crossref]
  9. Almadi MA, Alharbi O, Azzam N, Altayeb M, Thaniah S, et al. (2018) Bowel preparation quality between hospitalized patients and outpatient colonoscopies. Saudi Journal of Gastroenterology: Official Journal of the Saudi Gastroenterology Association 24: 93-99. [crossref]
  10. Currie DJ, Smith C, Jagals P (2018) The application of system dynamics modelling to environmental health decision-making and policy – a scoping review. BMC Public Health.18. [crossref]
  11. Collin C, Wade DT, Davies S, Horne V (1988) The Barthel ADL Index: A reliability study. International Disability Studies.10: 61-63. [crossref]
  12. Sundhedsministeriet (2017) Udvalg om det nære og sammenhængende sundhedsvæsen.
  13. Tontini GE, Prada A, Sferrazza S, Ciprandi G, Vecchi M (2021) The unmet needs for identifying the ideal bowel preparation. JGH Open: An Open Access Journal of Gastroenterology and Hepatology 5: 1135-1141. [crossref]
  14. Fuccio L, Frazzoni L, Spada C, Mussetto A, Fabbri C, et al. (2021) Factors That Affect Adequacy of Colon Cleansing for Colonoscopy in Hospitalized Patients. Clinical Gastroenterology and Hepatology: The Official Clinical Practice Journal of the American Gastroenterological Association 19. [crossref]
  15. Kim HG (2016) Is Elderly Age a Simple Predictive Factor for Inadequate Bowel Preparation before Colonoscopy? Gut and Liver 10: 489-490. [crossref]
  16. Neilson LJ, Thirugnanasothy S, Rees CJ (2018) Colonoscopy in the very elderly. British Medical Bulletin 127: 33-41. [crossref]
  17. Restall G, Walker JR, Waldman C, Zawaly K, Michaud V, et al. (2018) Perspectives of primary care providers and endoscopists about current practices, facilitators and barriers for preparation and follow-up of colonoscopy procedures: a qualitative study. BMC Health Services Research 18. [crossref]
  18. Rosvall A, Axelsson M, Toth E, Kumlien C, Annersten Gershater M (2021) Patients’ Experiences Before, During, and After a Colonoscopy Procedure: A Qualitative Study. Gastroenterology Nursing: The Official Journal of the Society of Gastroenterology Nurses and Associates 44: 392-402. [crossref]
  19. Pieterse AH, Finset A (2019) Shared decision making—Much studied, much still unknown. Patient Education and Counseling 102(11): 1946-1948. [crossref]
  20. Amir N, McCarthy HJ, Tong A (2021) A working partnership: A review of shared decision-making in nephrology. Nephrology (Carlton, Vic) 26: 851-857. [crossref]
  21. Hadjiliadis D, Khoruts A, Zauber AG, Hempstead SE, Maisonneuve P, Lowenfels AB (2018) Cystic Fibrosis Colorectal Cancer Screening Consensus Recommendations. Gastroenterology 154: 736-745. [crossref]
  22. Nee J, Chippendale RZ, Feuerstein JD (2020) Screening for Colon Cancer in Older Adults: Risks, Benefits, and When to Stop. Mayo Clinic Proceedings 95: 184-196. [crossref]
  23. Kumar A, Lin L, Bernheim O, Bagiella E, Jandorf L, et al. (2016) Effect of Functional Status on the Quality of Bowel Preparation in Elderly Patients Undergoing Screening and Surveillance Colonoscopy. Gut and Liver 10: 569-573. [crossref]
  24. Chambers K, Whiteman K, Stephens K, Goodloe L, Kirsteen H (2016) Improving Inpatient Colonoscopy Preparation in a University Hospital: An Evidence-Based Practice Project. Gastroenterology Nursing: The Official Journal of the Society of Gastroenterology Nurses and Associates 39: 86-94. [crossref]
  25. Lee YJ, Kim ES, Park KS, Cho KB, Jang BK, et al. (2015) Education for Ward Nurses Influences the Quality of Inpatient’s Bowel Preparation for Colonoscopy. Medicine 94. [crossref]
  26. Shah-Khan SM, Cumberledge J, Reynolds GJ (2017) Using the plan-do-study-act approach to improve inpatient colonoscopy preparation. BMJ Open Quality 6. [crossref]
  27. Gkolfakis P, Tziatzios G, Papanikolaou IS, Triantafyllou K (2019) Strategies to Improve Inpatients’ Quality of Bowel Preparation for Colonoscopy: A Systematic Review and Meta-Analysis. Gastroenterology Research and Practice 2.

What Ordinary People Want from Their ‘Regular’ Visits to the Doctor: A Mind Genomics Cartography

DOI: 10.31038/IMROJ.2023824

Abstract

Respondents evaluated systematically created vignettes, viz., combinations of elements (messages) about benefits to going to their doctor for a yearly check-up. The vignettes comprised 2-4 elements selected from the set of 16 elements, with the vignettes created by experimental design which ensured both that the elements did not mutually contradict each other, and that the elements were statistically independent of each other. Each of 101 US respondents evaluated a unique set of 24 vignettes, following the standard test protocol used in the emerging science of Mind Genomics. Respondents rated these vignettes on a two-sided scale of motivation and believability. Based upon the pattern of coefficients for equations relating elements to the rating of ‘motivates me’, three clearly different mind-sets emerged; respectively, those focusing on the visit to assess the growth of children, those focusing on obtaining their vital measures and advice about eating, and those focus on advice from the doctor about what to do to maintain an active lifestyle. In contrast, self-profiling classification of attitudes could not uncover these three clearly different and intuitively meaningful mind-sets. The paper finishes by introducing the PVI, personal viewpoint identifier, comprising six elements from the study, a two-point scale, the pattern of answers to which assigned a new person to one of the three mind-sets.

Background

The objective of this paper is the continuing effort of an emerging science, Mind Genomics, to understand how people perceive the world of the ordinary, how people make decisions, and perhaps most important, the existence of and nature of different ways that ordinary people look at topics of their everyday world. Rather than focusing on unusual situations to increase our understanding, Mind Genomics focuses on the daily, quotidian world, in which most people live.

The particular topic dealt with here is the understanding of what ordinary people look for when they think about what is important to the when they make their regular appointments to see their doctor. The notion of regular appointments may seem obvious, but if we were to probe more deeply into the topic, might we end up seeing deep differences which make sense, differences that we intuitively know, but differences which when recognized allow the visit to the doctor to be much more effective for both patient and doctor A simple Google Scholar® query about ‘attitudes regarding ‘attitudes about yearly check up visits to the doctor’ generated 90,400 hits as of October 16, 2023. Many more hits 384,000, emerged when the query was ‘what patients want from doctors during their annual visit’. For Google itself, there were upwards of 400,00 hits. Clearly this is an important topic to people.

The approach present here, Mind Genomics, provides the researcher with the opportunity to structure a situation of the ordinary life, so that situation can be explored with ordinary people, an exploration that can be done in a matter of hours and days, at an affordable price, in a structured, templated fashion anywhere in the world, and with powerful knowledge and tools emerging from the exercise [1,2]. The objective is to see whether or now the Mind Genomics science can produce new-to-the-world information in hours and days, teaching the profession new things, providing new tools for the world of health.

Doing the Study

The Mind Genomics approach works by creating vignettes, combinations of ideas pertaining to the topic, instructing the respondents to rate these vignettes on a scale, and then deconstructing the rating to estimate the contribution of each of the ideas or elements to the overall rating. The rationale for this ‘indirect’ approach is that the test stimuli more naturally approximate what the person might experience in everyday life. Rather than having the respondent evaluate ideas one by one, as is done in typical questionnaires, Mind Genomics reduces the intellectual burden by simply having the respondent respond with an immediate feeling to what is read.

The nature of the stimuli, these vignettes, deserves explication because of the power of the approach:

  1. The vignettes evaluated by the respondents are created by so-called experimental design. The experimental design prescribes the precise combination of elements to appear in each vignette. The use of experimental design to create the combinations means that each respondent’s data can be analyzed totally separately, for that respondent, OR incorporated into an analysis for a defined group of respondents. This is called a ‘within-subjects design,’ and constitutes a powerful features for analysis.
  2. Each respondent evaluates a totally different set of vignettes, the totally different sets created by a systematic permutation of the elements, with the statistical properties of the underlying experimental design maintained [3]. Thus, the researcher can do studies on topics without having had to plan for a long time in order to make sure that the testing is done on the ‘right’ vignettes. Mind Genomics encourages the researcher to ‘do the experiment’ rather than be subject to paralysis, to the overthinking captured by the popular adage ‘measure nine times and cut once.’ Mind Genomics encourages experimentation, not over-thinking, and as we will see below, prevents ’analysis paralysis.’
  3. The respondent is given 24 vignettes to evaluate, one vignette after the other. The underlying experimental design prescribes the combinations. The respondent need only read and react to the vignette. The vignette is created to be simple, comprising a set of phrases, the elements, one phrase on each line, without connecting words which end up cluttering. The structure enables the respondent to ‘graze’ through the information and assign a rating. The structure also ends up being less ‘taxing’ on the respondent because the physical format of the vignette, one line (approximately) per element, requires less effort. Figure 1 shows the distribution of responses times with response times of 9 seconds or longer truncated to 9 seconds. It is clear from Figure 1 that the respondents appeared to be able to assess and rate the vignette very easily. Most of the responses times are three seconds or shorter. Whether or not the data are ‘valid’, make sense, and teach us will be discussed below.
  4. The use of compound vignettes comprising different elements ensures that it is impossible to ‘game the system.’ In study after study, the desire to game the system emerges among academics and professionals, who feel stymied, complaining that they could not ascertain the ‘correct answer.’ It is the combinations of elements of different kinds which creates seeming a ‘blooming, buzzing confusion, ‘ in the words of Harvard’s eminent, late 19th Century psychologist, William James..

FIG 1

Figure 1: Distribution of response times across all vignettes evaluated in positions 2-24

The Mechanics of Creating the elqements and the Test Vignettes

The actual construction of the study by the researcher is straightforward. The researcher follows a set of templated steps, the first being a request for four questions which explore the topic, and the second being the request for four answers to each question. When first confronted with the task of choosing a topic and then asking four questions which ‘tell a story’ or at least ‘flesh out the topic’, the unpracticed researcher in Mind Genomics finds it easy to choose a topic but becomes flustered when requested to ask four questions which ‘tell a story.’ Simply put, the education that people receive all too often focuses on choosing the right answer, or even coming up with an answer to a question. The ‘thinking’ is structured, and not necessarily good. Memory and perhaps judgment are rewarded, but not the ability to create a new edifice to house knowledge. It is at this point, the request for the four questions, that many would-be researchers ‘freeze’, often abandoning the effort in anticipated frustration.

Figure 2 shows an example of the templated format for a typical study. Panel A at the top shows the screen shots for the four questions. This is the point at which the excitement may turn to dismay. Panel B shows the Idea Coach, with a box encouraging the researcher to write a short paragraph, a ‘squib’ in Mind Genomics language. The squib provides a chance for the researcher to describe the problem in detail, and specify the nature of the answers, both in terms of tonality (explanation vs list), and in terms of style (approximate number of words, reading level, etc.). Panel C shows the types of answers returned by the Idea Coach. The actual results, viz., questions, answers (elements), and results, will constitute the remaining topics of this paper.

FIG 2

Figure 2: A typical set-up template for questions showing where Idea Coach enters and can be invoked. The actual text for the Idea Coach query and the four questions returned by AI are specific to the study.

The AI-enhanced feature of the Mind Genomics platform in BimiLeap.com.com is called Idea Coach. With Idea Coach, the researcher simply types in a paragraph about the topic(called here ‘squib’) , requesting questions to be asked. The Idea Coach returns with 15 questions, and later with an AI-summarization of the themes and other features of those 15 questions. The researcher selects the questions which are of interest or can request a ‘re-run’ of the Idea Coach for another 15 questions. Furthermore, the researcher can modify the paragraph to change the direction of the underlying AI as that AI attempts to create the questions.

Table 1 present the first set of 15 questions, along with the subsequent AI based summarization of patterns in these 15 questions The 15 questions appear immediately, but the AI summarized appears later, after the researcher has completed the selection of questions and answers. When looking at Table 1, one can focus on the original paragraph, the questions, and then the different types of AI summarization. These questions, or more specifically the answer book of ‘logical pages,’ one page for each request for questions (and later for answers to the questions), provides an education in and of itself.

Table 1: Results from the first effort to create 15 questions

TAB 1(1)

TAB 1(2)

TAB 1(3)

The ingoing questions posed by the researcher are the following: Topic: We’re having a problem. We don’t know how to get patients to come back for yearly visits. How can we communicate with our patients to convince them that’s it’s important to come back? Make the questions more of explanations than just a list. Make the questions understandable to a 10-year-old. Make the questions 20 words or fewer.

When looking at the ‘top’, viz. query, it is important to keep in mind that the researcher guided the AI by giving the AI specifics. These specifics describe the topic (get patients to come back), the specific problem (how can we communicate that it’s important), how to shade the question (make the questions more of explanations than just a list), how to ensure the question is understandable (understandable to a 10-year-old), and readable (20 words or fewer). Table 1 shows the success of this effort as well as the aforementioned summarization by AI. It is important to note that the actual effort generated several of these pages, because the research was geared both to answering a question and to learning about the topic. Table 1 is meant just as an example; the final four questions were selected from different iterations of Idea Coach, each iteration taking about 15 seconds.

The final questions selected were then used as inputs to Idea Coach. Once again, each iteration focused on generating 15 answers to the specific question. The answers were obtained from Idea Coach, put into the study, and then edited manually to correct the grammar, and to make the answer simple. Table 2 show a set of answers to one question.

Table 2: Results from the first effort to create 15 answers to the first question

TAB 2(1)

TAB 2(2)

TAB 2(3)

It is important to keep in mind that that the Idea Coach, empowered by AI, becomes itself a tool to teach the researcher. Thus, what had started as a seeming insurmountable obstacle at the time Mind Genomics was born, the issue of thinking about questions and answers, ended up generating an additional and powerful benefit, viz., education at the early stage of thinking, even before the experiment is actually run with real people.

The final set of questions and answers appear in Table 3. Keep in mind that Table 2 presents the actual questions used to generate the different answers, as well as presenting the edited answers; the editing was done by the researcher before the study was run. This process ensures simple questions, simple answers, both short, and understandable to the respondent. In the actual experiment the respondent will only see combinations of answers, and never see the questions. The role of the question is only to generate the answers, either from AI or from the mind of the researcher. One final note is relevant here. Experience shows that this process ends up educating the researcher quickly on the topic, often resulting in the desire for the researcher to put in her or his own ideas rather than relying on the AI. That itself, the creation of confidence and excitement, becomes a strong reason for using the Idea Coach.

Table 3: The four questions and their four sets of answers used in the study

TAB 3

The Rating Scale

The main focus of this study is on the degree to which the messages motivate the respondent, at least within this format. We do not know what the respondent will actually do when giving the messages, although previous studies in the medical world have shown that the proper messages can double the number of colonoscopies [4] , as well as substantially reduce the number of within-30-day-readmissions to the hospital for patients who were suffering from CHF (congestive heart failure) [5].

The opportunity to investigate two aspects of messaging, e.g., motivation and believability, has emerged as a way of increasing the usefulness of the Mind Genomics experiment. To this end, the research used a two-sided five-point scale, a new approach in Mind Genomics. The points on the rating scale enable the respondent to rate both motivating (no/yes) and believable (no/yes). The scale below shows these two sides, and the frequency of their selection across the 2424 vignettes, evaluated by the 101 respondents.

Rating question: Think about going to the doctor. Here’s a paragraph about a visit. How do you feel personally when you read this paragraph Choose how you feel.

Scale Points

1=Does not motivate me…AND…I have no emotional response to it                                        11.7%

2=Does not motivate me…BUT…I get an emotional response when I read it                          10.8%

3=I can’t answer                                        18.8%

4=Motivates me…BUT…I have no emotional response to it                                                       28.2%

5=Motivates me…AND…I get an emotional response when I read it                                        30.4%

A separate part of the Mind Genomics experience required the completion of a self-profiling questionnaire, allowing the research to obtain information about the attitudes and behaviors. These questions and answers are shown in Table 4. The respondent was present with each question separately, in a ‘pull down menu’, showing the question and the different answers. The respondent was instructed to select one answer for each question.

Table 4: The self-profiling classification questions

TAB 4

Executing the Study

The actual study is executed in a straightforward manner. The Mind Genomics platform, BimiLeap, enables the researcher to select the respondents, their location, age, etc., through a built-in API linked to the panel provider, Luc.id, Inc., located in Louisiana. Luc.id is actually an aggregator, sourcing respondents from different online providers, located around the world. Thus, it is possible to work with defined respondents, viz., ‘survey takers’, from anywhere in the world. These respondents have already volunteered to participate, knowing that their data is entirely anonymized. The only information obtained about them is from their self-profiling, the questions shown in Table 4, along with age and gender.

Analysis

The data from each respondent is stored in the form of a vector or row of data, one row for each vignette. Thus, each respondent generates 24 rows of data. The first sets of columns are reserved for study identification and respondent identification. The information here includes the answers to the respondents self-profiling questions, this information repeated 24 times, once for each vignette. The second set of columns shows the specific composition of the vignette, starting with the order of testing (1-24), and then 16 columns, one for each of the 16 elements. The cell for each element is given the value ‘0’ when the element is absent from the vignette and the value ‘1’ when the element is present in the vignette. By design, each row will have shown a minimum of two ‘1’s’, and a maximum of four ‘1’s.’ The third set of columns show the rating, and the response time. The last set of columns show transformed rating data, defined and described in the next paragraph.

To prepare for an appropriate analysis, the rating scale data must be transformed to present the data appropriately for subsequent regression analysis using OLS, ordinary least squares regression [6]. The objective of Mind Genomics is to relate the presence/absence of the elements to the response. There are actually two responses here: motivating (vs not motivating), and believable (vs. not motivating). The research here focuses primarily on motivating vs not motivating, but it is also interesting to find out the messages which are believable vs not believable.

The strategy to decouple motivating from believable consists of creating a new set of binary variables through simple transformations:

R5=Motivates and believable. R5=100 when the rating is 5. Otherwise R5=0.
R54=Motivates. R54=100 when the rating is 5 or 4. Otherwise, R5=0.
R52=Believable. R52=100 when the rating is 5 or 2. Otherwise R52=0.
R3=Don’t know. R3=100 when the rating is 3. Otherwise, R3=0.
R41=Not believable. R41=100 when the rating is 4 or 1. Otherwise, R41=0.
R21=Does not motivate and not believable. R21=100 when the rating is 2 or 1. Otherwise R21=0.

RTSeconds=Response time in seconds. The BimiLeap program measures the elapsed time between the appearance of the vignette and the rating assigned by the respondent. The time is measured with a resolution of hundredths of seconds.

To each of the newly created binary variables, viz., those given a value of either 100 or 0, a vanishingly small random number is assigned, this number less than 10-5. OLS, ordinary least-squares regression, requires that the dependent variable have some minimal variable. In the case that the dependent variable has no variability, either for a given individual or for what will be the relevant subgroup, the OLS regression will ‘crash.’ For example, this might well happen when a respondent avoids the rating ‘3’. For that respondent, R3, Don’t Know, will always have the transformed value of 0. Any effort create a model or equation relating the ratings of that respondent to the presence/absence of the 16 elements will end up with the OLS regression program ‘crashing.’ To avoid that problem is simple; add this vanishingly small random number to every transformed rating, ensuring that all newly created binary values (e.g., R5 …. R21) ends up with some minimum variation. This prophylactic step ensures that all of the equations will run when OLS regression is used.

OLS Regression – Relating the Presence/Absence of the Elements to the Binary Variables and Response Time

The objective of Mind Genomics is to quantify the contribution of the individual ideas or elements as they drive a dependent variable. The key variable in this study is ‘motivates’, captured by the newly created binary variable, R54. Whenever the vignette is rated as motivating (rating 5 or 4), R54 becomes 100. Otherwise, R54 becomes 0. Given this information, can we determine the degree to which each of our 16 elements ‘drives’ that rating of ‘motivates’? The answer to the foregoing question is a simple YES, due to the effort made in the set-up of the vignettes according to experimental design. The permuted experimental design ensures that each of the 16 elements appears statistically independently of every other one of the 16 elements, that there are some ‘incomplete vignettes’, lacking an answer from question or an answer from two questions. These properties enable the OLS regression to estimate the absolute value of the driving power of the element.

The driving power of the element is the magnitude of the coefficient in the equation below:

DV (dependent variable)=k1A1 + k2A2 … K16D4

The additive model does not depend upon an interpretation of the data. Rather, the OLS regression simply uses the mathematical properties of the data to estimate the 16 coefficients. The additive constant is not calculated for the simple reason that it is important to be able to compare the coefficients from one study to another, in terms of their absolute values. The only way this comparison can be ensured is to force all of the information to be embedded in the coefficient. By having an additive constant, a baseline, the researcher has to first account for differences in baseline, and then account for differences in coefficients, considering the baseline. That effort is not productive when one is attempting to create a large-scale database across topics, across culture, and across time. It is more reasonable to estimate the coefficients without the complications caused by the additive constant. This change in the computation formula has been slowly emerging, prompted by the desire to understand the ‘stories’ embedded in different studies as they are revealed by the coefficients

Creating the Models or Equations for the Total Panel for the Different Dependent Variables

The Mind Genomics effort ‘comes alive’ when we look at the ‘meaning’ of the strong performing elements, if indeed we do have these elements. For Mind Genomics studies, the notion of ‘strong performing’ has been reserved for those elements of a positive nature with coefficients 21 or higher, and for those elements of a negative nature with coefficients of 15 or higher. Table 5 shows only one strong performing positive element, for motivating (D4: Lifestyle guidance: They can teach you to choose water over sugary drinks, which is better for your body), and only two strong performing negative elements, both for believable (D4: Lifestyle guidance: They can teach you to choose water over sugary drinks, which is better for your body, and C4. For children: They check if the child’s teeth are growing well).

Table 5: Coefficients for models (equations) relating the 16 elements to the newly created binary variables, and for response time (RT), The table is sorted by the values of coefficients for ‘motivate’ (R54).

TAB 5

The foregoing results are confusing. There is clear differentiation across elements in Table 5, both in terms of ‘motivating’ and in terms of ‘believable.’ Thus, the results are not due to the lack of differentiation across the elements, but perhaps to a deeper issue, e.g., the type of respondent. It may be that the 101 respondents comprise different groups of respondents with varying levels of interest and belief in what could be said and done in a routine doctor’s examination. If so, then the specific patterns might be elusive. The next analysis addresses this possibility by focusing on the way people describe themselves.

Responses of Key Subgroups in Terms of Motivate

The Mind Genomics process generates a great deal of data. The most practical way to deal with the plethora of information is to focus on one dependent variable, using that variable as the lens through which to examine the mind of the respondent as the respondent evaluates the vignettes. Once we focus more precisely, using one dependent variable, we will end up with many more strong performing elements, as we see in Table 6, where we focus on one variable (motivates, R54), and were we have divided people by what they say about some of their motivations and activities pertaining to health and lifestyle.

Table 6: Coefficients for the 16 elements for ‘motivates’ emerging from separate analyses of respondents self-defining themselves by their pattern of behavior and thinking (defined by the columns).

TAB 6

Table 6 is more gratifying because it shows many elements driving motivation, not just one element as we saw for the total panel in Table 5. Yet, in this increased number of strong performing elements it is difficult, indeed almost impossible, to synthesize a meaningful pattern. Knowing the way, a person answers questions about her or his attitudes and behaviors regarding the world of health and social interaction does not really allow the doctor to deeply understand the patient, at least in a formal, structured level. There may be some clues in the different classifications, but once again the lack of a clearly interpretable pattern emerges, this time with the plethora of strong performing elements, a plethora which seems to be incapable of simple definition. Face with this type of pattern, it is not surprising that many practitioners fail to understand their patients, at least in a structured way. The literature may be filled with data about specific medical conditions and their correlation with indices, but we fail to see tight connections.

Mind Sets

A hallmark of Mind Genomics is the focus on the search for basic groups in the population defined by the way they think about specific, granular topics. The ‘regular visit to the doctor’ is such a granular topic. The introduction to this paper talked about the general issue of what patients want from their doctors. The topic of a regular visit to the doctor puts the person’s thinking into a far more concrete realm. The material that the respondent may have to examine and evaluate need not be large scale issues, but may paint concrete ‘word pictures’, describing a very ordinary situation. Thus, as a research tool to understand the mind of the patient, or indeed of anyone, the Mind Genomics science provides a tool that can be honed and sharpened to a micro-focus on the minutia of a topic, minutia which might see irrelevant in the big picture, but might be exceptionally relevant to the topic.

The creation of mind-sets is a straightforward process. The researcher follows these steps, each transparent, each simple, using well-defined and statistically valid methods.

Step 1 – For each respondent create a model relating the presence/absence of the 16 elements to the binary transformed rating. The dependent variable here is ‘motivates’, R54. The model, estimated by OLS regression, is valid because the initial experimental design ensured that each respondent would evaluated a set of 24 vignettes, designed analysis by OLS regression [7].

Step 2 – Create the matrix of 101 rows (one row for each respondent) and 16 columns (one column for each element).

Step 3 – Use k-means clustering to divide the set of 101 respondents twice, first into two non-overlapping groups, and then into three non-overlapping groups [8]. The k-means clustering program used by Mind Genomics computes a ‘distance’ between pairs of respondents based upon the degree to which they are parallel, viz., the degree to which they trace out the same pattern. The measure of distance is the quantity ‘1-R’, where R is the Pearson correlation coefficient. R has a high value of +1 when the two sets of coefficients are perfectly parallel, and thus have ‘no dissimilarity’ or ‘no difference’ in their patterns. The value (1-R) is then 0. In contrast, when the two sets of coefficients move in opposite directions, then R has a value of -1, and the quantity (1-R) becomes 2.0. All pairs of respondents generate some number between 2 and 0.

Step 4 – The k-means clustering program assigns the respondents to the clusters so that the distances between pairs of respondents within a cluster are small, whereas the distances between pairs of centroids of the clusters are large.

The clustering is not exact, but rather a heuristic. The objective of the clustering is to discover presumably more meaningful groups of respondents. The clustering algorithm does not consider any meaning attached to the elements, but rather uses numerical magnitudes. That is, there is no effort to interpret the clusters.

Henceforth, this paper will use the phrase ‘mind-set’ instead of the term ‘cluster,’ in order to keep the spotlight on the effort to understand the way the person thinks about a topic.

Table 7 shows the coefficients estimated for Total Panel, for the three-mind-set solution, and for the two-mind-set solution, respectively, both emerging automatically from the BimiLeap program. The three-mind-set solution seems to be the more powerful solution, producing many more coefficients of high magnitudes (21+). The two-mind-set solution seems to be a bit weaker. Furthermore, the three mind-set solutions appear to be more interpretable, indeed quite easy to interpret:

Mind-Set 1 – Focus on visit to monitor the child
Mind-Set 2 – Focus on vitals and advice on eating
Mind-Set 3 – Focus on advice to lead a healthful lifestyle

Table 7: Performance of the elements by total panel, by three mind-sets, and by two-mind sets, respectively. The elements are sorted by the performance among the three emergent mind-sets.

TAB 7

The attraction of the mind-set solutions is undeniable because of its simplicity. Although the experience of participating in these Mind Genomics studies often exasperates professionals because they cannot ‘guess the right answer’, the reality is that ordinary people have no problem suspending their critical thinking, responding intuitively, and generating powerful results.

Identifying the Respondents by Attitude Versus by a ‘PVI’ (Personal Viewpoint Identifier)

A continuing finding in Mind Genomics is that who a person IS, or how the person says she or he thinks about a topic often does not co-vary with how the person responds when confronted with specific, granular issues relevant to the topic. This lack of correspondence between what a person ‘say’s and how the person actually responds can be seen from the pattern of percepts in Table 8. At the start of the Mind Genomics ‘experiment’, before evaluating the vignettes, the respondent completed a self-profiling classificaiton, comprising standard questions of gender and age, and then up to eight questions selected by the researcher, usually questions relevant to the topic.

Table 8: Distribution of answers to self-profiling questions by the total panel, and by the respondents in the three mind-sets.

TAB 8

Table 8 shows the self-profiling classification questions, and the percent of respondents selecting each answer. The clarity so evident in Table 7, based upon the response to the granular elements fails to emerge when the respondents separately profile themselves. Indeed, from Table 8 it would be difficult if not impossible to discern the presence of three radically different mind-sets

In recent years a new focus has been on the identification of individuals belonging to specific mind-sets, an effort which has ended up improving outcomes in the world of medicine. By knowing the mind-sets of patients discharged from the hospital after a bout with congestive heart failure, the results suggested a decrease in the within 30-day readmission from 17% down to 5% for the patients in the ward were ‘mind0typed’ after release and given the appropriate motivation material to put on their refrigerator [9]. The creation of the PVI, the personal viewpoint has been made available world-wide at the website www.pvi360.com. The program to create the PVI uses the output of the Mind Genomics study to create the PVI [10].

Figure 3 shows the first two parts of the PVI. Panel A comprises a set of questions about the respondent, with these questions ‘optional’. The rationale for these questions is primarily patient management, viz., the practical issue of picking up relevant patient data when the PVI data are included in a large-scale database. The PVI user can choose not to ask certain questions. Panel B comprises a set of six questions, coming directly from the results of the study, with the request for the person completing the PVI to choose one of two answers to each question. The six questions are randomized across the people who complete the PVI. The pattern of answers to the six questions map to the most likely of the three mind-sets, assigning the respondent to that mind-set. The important things to remember are that the language of the PVI questions is exactly the same language as that used to create the mind-sets, and that the PVI is an enhanced ‘guess’ about mind-set membership, but a guess based on actual response to relevant questions..

FIG 3

Figure 3: The first two parts of the PVI. Panel A shows the up-front questions about the respondent. Panel B shows the six questions and the two answer for each question.

The desire to know more about the patient and the medical experience has produced an additional feature of the PVI, so-called specialty or additional questions. These questions ‘tag along’ at the end of the actual PVI exercise. They enable the researcher to find out more information about a topic, and at the same time know the mind-set of the respondent who is answering the questions. The additional questions can be up to 20 in number, providing extensive additional information about the way mind-sets feel about other, related topics. These additional questions appear in Figure 4. The combination of additional questions with the PVI provides the researcher with a new tool to understand how to communicate with patients of different mind-sets, for a specific medical (or other) topic.

FIG 4

Figure 4: The third part of the PVI, the specialty or additional questions

How Good are the Data – The IDT (Index of Divergent Thought)

Up to now the focus has been on the use of Mind Genomics to understand how people think. During the years that Mind Genomics has been used, again and again it has become obvious that users of Mind Genomics go through a learning process. The researchers don’t really understand how to think creatively in the way Mind Genomics structures the process. At first the researchers grope around, often relying on Idea Coach to help them, but without a sense of what might be a strong question, and what might be cogent and meaningful answers. Creating a measure of ‘goodness of the study’ has become increasingly important as the use of Mind Genomics has evolved from consumer research professionals to young doctors, college students, and then high school and middle school students, and finally to grade school students.

The IDT (Index of Divergent Thought) is an attempt to quantify the ‘goodness’ of the study, through the summation of the weighted squares of the positive coefficients. Table 9 shows the computational formula. We already know the coefficient of each of the 16 elements for total panel, and for both the two mind-set solution and the three mind-set solution, respectively.

Table 9: The IDT (Index of Divergent Thought), measuring the performance of the study in terms of incorporating ideas which perform strongly.

TAB 9

The IDT is 74, very respectable for a study of this type. The IDT turns into a benchmark, as the researcher searches for elements which represent strong performers, especially for the total panel, or in the case of mind-sets, among at least one of the two mind-sets, and one of the three mind-sets, respectively. After all is said and done, in the end, the IDT can become a way for someone to measure progress in thinking.

AI Interpretation of the Three Mind-sets

At the start of the study, viz., when the elements were being created with the help of Idea Coach, one of the outputs of the process was the ‘Idea Book’, presenting the different sets of questions or answers, each set resulting from a query submitted to AI. After the BimiLeap platform used Idea Coach to develop the 15 questions or answers, these questions or answers were stored and ‘summarized’ set by set using a group of queries. The summarization generated a page of instructive output, shown in Tables 1 and 2, respectively.

The same approach was used for AI summarization of the results for each key subgroup of respondents. The summarization was done only for the elements with coefficients 21+ for positive variables (e.g., R54=motivates), and only for elements 15+ for negative variables (e.g., R21=does not motivate). When no element satisfied the threshold value the summarization was not done.

Table 10 presents the AI summarization for the strong performing elements for the three mind-sets, computed for the dependent variable R54. The AI summarization becomes a way for the researcher to better understand the results and perhaps the patterns emerging from the aspects and commonalities of winning elements.

Table 10: AI summarization for the strong performing elements for each of the three mind-sets emerging from the three-mind-set solution.

TAB 10(1)

TAB 10(2)

TAB 10(3)

TAB 10(4)

Discussion and Conclusions

Although one may often believe that years of experience with patients provides a strong sense of ‘what to say’ to each individual patient, the reality is that the proper communication with patients is necessary, but rarely well understood, and may require far more experience and guidance/coaching than might commonly be thought. Colloquially, some of this is encapsulated in what is colloquially called the ‘bedside manner’, but such a simple catch-all phrase can hardly do justice to the complexities presented in the visit of a patient with a doctor.. The literature about ‘what patients want from doctors’ recognizes the lack of deep information that is readily at the hands of the practitioner, can be sensed from some of these quotes from the public academic literature.

Although much has been written about what patients Then they contact their general practitioner (GP), there are no published data from large cohort studies of what patients expect…… most patients come to the consultation with a particular agenda. Failure to address this agenda is likely to adversely affect the outcome of many consultations [11].

The results showed that people ‘preferred’ the explanations based on what the participants in the earlier study wanted to know about their medicines, rather than those based on what the doctors thought they should be told. They also ‘preferred’ the explanations that did not convey negative information, rather than those that did convey some negative information. In addition, the inclusion of negative information affected ratings of likely compliance with the prescribed medication [12].

Most of the expectations in qualitative studies were related to the function “Fostering the relationship”. Similar expectations arose less often in quantitative studies. Conclusions Patients do have concrete expectations regarding each of the functions to be met in the medical encounters. The research approach tends to bias the results. Practice implications the collected expectations suggest how physicians may perform each of their tasks according to the patient perspective. Future research on patients’ communicative expectations needs to overcome the gap between qualitative and quantitative findings [13].

Patients want many things from their doctors, not all of which are possible. Below, however, is a list of things that patients seem to want from their doctor, and which should be possible. ….Eye contact… [14].

The study presented here is among the first to deal with the use of Mind Genomics to explore in detail the description of the interaction between the medical professional and the prospective patient. Mind Genomics provides the opportunity to describe the different facet of the doctor patient relationship in various conditions, with the descriptions emerging from the combination of AI (Idea Coach) and the doctor as co-generators of ideas, and the response of real people to these descriptions.

The ability to do these research projects with hours and days, from the generation of the topic to the creation of the study and finally to study execution and detailed analysis, promises to create a new corpus of knowledge about the world of everyday health and illness from the point of view of how a person perceives that world. The use of ordinary language, the ability of Mind Genomics to prevent guessing, the objectivity of the study was conducted on a computer, and finally the use of clustering to find mind-sets and typing tools to assign mind-sets, all promise a database of knowledge, at least interesting even if not eventually transformative.

References

  1. Moskowitz HR (2012) ‘Mind genomics’: The experimental, inductive science of the ordinary, and its application to aspects of food and feeding. Physiology & Behavior. [crossref]
  2. Moskowitz HR, Gofman A, Beckley J, Ashman H (2006) Founding a new science: Mind genomics. Journal of Sensory Studies 21: 266-307.
  3. Gofman A, Moskowitz H (2010) Isomorphic permuted experimental designs and their application in conjoint analysis. Journal of Sensory Studies 25: 127-145.
  4. Oyalowo A, Forde KA, Lamanna A, Kochman ML (2022) Effect of patient-directed messaging on colorectal cancer screening: A Randomized Clinical Trial. [crossref]
  5. Gabay G, d Moskowitz HR (2019) “Are we there yet?” Mind-Genomics and data-driven personalized health plans. The Cross-Disciplinary Perspectives of Management: Challenges and Opportunities, pp.7-28.
  6. Dismuke C, Lindrooth R (2006) Ordinary least squares. Methods and Designs for Outcomes Research 93: 93-104.
  7. Gofman A, Moskowitz H (2010) Isomorphic permuted experimental designs and their application in conjoint analysis. Journal of Sensory Studies 25: 127-145
  8. Ahmed M, Seraj R. and Islam SMS (2020) The k-means algorithm: A comprehensive survey and performance evaluation. Electronics 9(8): 1295.
  9. Gabay G &d Moskowitz HR (2019) “Are we there yet?” Mind-Genomics and data-driven personalized health plans. The Cross-Disciplinary Perspectives of Management: Challenges and Opportunities, pp.7-28.
  10. Davidov S, al Humaidan, M, Gere A, Cooper T, Moskowitz H (2021) Sequencing the ‘dairy mind’: Using Mind Genomics to create an “MRI of Consumer Decisions”. In: New Advances in the Dairy Industry. IntechOpen.
  11. McKinley RK, Middleton JF (1999) What do patients want from doctors? Content analysis of written patient agendas for the consultation. British Journal of General Practice. [crossref]
  12. Berry DC, Michas IC, Gillie T, Forster M (1997) What do patients want to know about their medicines, and what do doctors want to tell them? A comparative study. Psychology and Health 12: 467-480.
  13. Deledda G, Moretti F, Rimondini M, Zimmermann C (2013) How patients want their doctor to communicate. A literature review on primary care patients’ perspective. Patient Education and Counseling. [crossref]
  14. Stone M (2003) What patients want from their doctors. BMJ 326(7402): 12326doi: https://doi.org/10.1136/bmj.326.7402.1294 (Published 12 June 2003

The Significance of Sensory Disorders in Autism

DOI: 10.31038/PSYJ.2023572

Abstract

Background: Autism is said to be a Neurodevelopmental Disorder which has a whole range of different strands. One of the most overlooked and misunderstood is the sensory differences – often referred to as Sensory Processing Disorder (SPD) or Sensory Integration Disorder (SID).

Aim: The aim of this study is to improve the understanding of the sensory differences and their implications in autism.

Methodology: Qualitative methods that include observation, personal accounts and ongoing research.

Current situation: Today unusual responses to sensory stimuli are recognized by many individuals with autism, their families and many professionals working in the field of Occupational therapy who work with them, although their significance is often overlooked by professionals working in other disciplines.

Summary: This study will show that both the sensory differences and their significance has been known for centuries. It will also propose that they are of great significance in autism for they affect every aspect ofindividual’s daily life.

Keywords

Autism, Neurodevelopmental delay, Sensory differences, Sensory processing disorder (SPD), Sensory integration disorder (SID), Soft neurological signs, Aberrant reflexes, Visual differences, Auditory differences, Tactile differences

The significance of our senses in development has been known for centuries, as was summed up by the German philosopher Immanual Kant in the 18th century when he said, “All our knowledge begins with the senses, proceeds to understanding, and ends with reason.” During the 19th century great doctors like Drs. John Langdon Down and the French physician Édouard Séguin worked with a range of children with learning disabilities of various kinds, while some of their other contemporaries worked with children who were blind, deaf or deaf-blind. As a group they were all keenly observant as can be seem from their books and papers, all having a real understanding of the sensory differences and their implications. During the time that Dr J.L. Down ran the Earlswood Asylum he noted that some of the children there fitted into different groups, some having savant skills and others having the “mannerisms and behaviour” that we would connect with autism today.

In a paper written in 1907 Dr Séguin made a comment worth repeating and, although his terminology is unpleasant to our ears, its importance is undeniable. As he noted, “Deafness and blindness from birth have the same effects as paralysis on ungifted children, by depriving them of the cognizance of a whole series of phenomena. But it is a fact curious enough to be noted, that partial obliteration of one of these channels of knowledge will produce the symptoms of superficial idiocy surer than its complete destruction.” Moving into the 20th century we find that the importance of the sensory differences and their possible link to autism was highlighted by Bergman and Escalona in their [1] paper “Unusual Sensitivities in Very Young Children.” As they wrote “Colors, bright lights, noises, unusual sounds, qualities of material, experiences of equilibrium, of taste, of smell, of temperature, seemed to have an extraordinarily intensive impact upon these children at a very early age.”

In 1964 the seminal book Infantile Autism by Dr Bernard Rimland noted that many such children had unusual sensitivities in several, if not in all, their senses; an idea he supported by quoting from several studies that described peculiar reactions such as “ill focused eyes,” “functionally blind,” “blind while seeing, and deaf while hearing.”

Interest in this area has fluctuated over the decades. It gained attention in the 1960s and 1970s due to the work of several experts including the late Dr’s. Ornitz and Ritvo. In their 1968 paper they noted how common, and extremely important, those perceptual differences and their consequences were and postulating that the sensory differences could be the basis of autism [2-4].

In his book The Ultimate Stranger: The Autistic Child, Dr Carl Delcato detailed his research. While it was dismissed by many in the scientific community, his findings are importantbecause he found thatthere were three categories of sensory difference each with its own specific effects. Those three categories included children who were hypersensitive, others who were hyposensitive and a third category that he called White Noise in which those sensitivities were mixed. He also found that their mannerisms were directly linked to the sensory differences. He explained that “One or more of their intake channels (sight, sound, taste, smell, or feel) was deficient in some way. Their strange repetitive behavior was their attempt, through much repetitive stimulation, to normalize that channel or channels [5].

Delacato concluded that the sensory differences were “the most unique feature of autism.” Ornitz took that idea a stage further by suggesting that the seemingly unusual responses to sensory stimuli could be “used to identify autism in young children.”

In their book Deaf-Blind Children and Infants [6] Treffry and McInnes told us about the children they worked with, all of whom had a sensory impairment. The connection being that, as Treffry and McInnes told us, the result of those impairments was “… not a reflection of the child’s ability to process information and draw logical conclusions, but rather a measure of his ability to gather the information in the first place.”

By the late1970s personal accounts had begun to creep into the literature. One came from Jerry, a former patient of Leo Kanner who told Dr. Jules Bemporad about his childhood world which he said had consisted of confusion and terror and was “frightening” because it was full of “painful stimuli that could not be mastered.” Then there was Tony W. who recalled his childhood experiences telling us that “I was afraid of everything! I was terrified to go in the water swimming, [and of] loud noises; in the dark I had severe repetitive nightmares and occasionally hearing electronic noises with nightmares. I would wake up so terrified and disorientated” [7].

In “An Inside View of Autism” Temple Grandin noted that “My senses were oversensitive to loud noise and touch. Loud noise hurt my ears and I withdrew from touch to avoid over-whelming sensation.” She talked about her tactile problems saying that “When people hugged me, I stiffened and pulled away to avoid the all-engulfing tidal wave of stimulation. The stiffening up and flinching was like a wild animal pulling away.” She follows that by noting that “The nerve endings on my skin were supersensitive. Stimuli that were insignificant to most people were like Chinese water torture” [8,9].

Since the 1970’s some professionals (both inside and outside the world of autism) have been researching both neurodevelopment delay and the individual senses. That has led to a strong body of research that links neurodevelopment delay (and what are termed “soft neurological signs” which include aberrant reflexes) to the sensory differences. There is also a great deal of evidence that hearing can have a major impact on behavior from peoplelike Dr. G. Bérard, whose groundbreaking work continues to help many people worldwide, some with autism or other neurodevelopmental conditions [10].

Others work in the field of vision (an area in which the sensitivities are most complex). They include mild to severe Visual Impairment (VI) and what is often termed Visual Stress or Meares-Irlen syndrome. *Today research indicates that most children on the autism spectrum have severe visual stress which cause them to see the world around them as if everything is fragmented or distorted, with some even seeing faces as if they are totally blank. Since those early years there have been an increasing number of accounts (from individuals and families) about the sensory differences and the difficulties they cause. Many people are now taking those account seriously and today research is proving them to be true, as in “The pattern of sensory processing abnormalities in autism” by Janet Kern and her colleagues [11].

In 2007 the neuroscientists Henry and Kamila Markram came up with the Intense World Syndrome, based around hypersensitivity. Their initial interest in this topic was triggered by their son, who has autism. They and their colleague postulated that sensory overload interferes with social communication and language and that those obsessive and repetitive behaviors are the child’s attempt to bring order and predictability into a bewildering world. That led them to suggest that their hypothesis offers a unifying theory of autism. It is certainly a very positive theory and one that (in part) confirms previous research [12].

Comments

  • Research into NDD has shown that while the sensory differences and their effects are common among the neurodivergent community they are most severe in autism.
  • The Intense World Syndrome. The idea that sensory overload interferes with social communication and language and that those obsessive and repetitive behaviors are the child’s attempt to bring order and predictability into a bewildering world is certainly correct. The flaw being that it focusses solely on hypersensitivity whereas the sensory issues which are far more complex than that.

Conclusion

The link between sensory differences and autism is far clearer now that it has ever been. That is partially because of accounts by a range of different people from different countries across the world who are living with autism and because there is now a great body of evidence from reputable scholars working in a range of disciplines who confirm that neurodevelopmental delay can cause a range of sensory differences that have a major impact on people’s lives. In Lucy Blackman’s article “Reflections on Language” in [13-22] she asked “So, if one doesn’t have depth perception, what does that mean in terms of facial expression? If one hears the subtle sounds of speech out of order, which I do, how does one process language? If affection in the form of cuddles and kisses cause pain and discomfort in one’s infancy, how on earth does one develop interaction which might compensate for not interacting to speech and glance?” How indeed?

Conflict of Interest

The author has no conflict of interest to declare.

Funding

None

References

  1. Bergman P, Escalona SK (1947) Unusual Sensitivities in Very Young Children. The Psychoanalytic Study of the Child 3: 1
  2. Rimland B (1964) Infantile Autism. New York: Appleton-Century-Crofts.
  3. Ornitz EM, Ritvo ER (1968) Perceptual Inconstancy in Early Infantile Autism: The Syndrome of Early Infant Autism and Its Variants Including Certain Cases of Childhood Schizophrenia. Arch Gen Psychiatry 18: 76-98.
  4. Ornitz EM (1989) Autism at the interface between sensory and information processing. In G. Dawson (Ed.), Autism: Nature, diagnosis, and treatment .The Guilford Press.
  5. Delacato C (1974) The Ultimate Stranger. New York: Doubleday.
  6. McInnes JA, Treffry JM (1982) Deaf-Blind Infants and Children. Buckingham: Open University Press.
  7. Bemporad JR (1979) .Adult recollections of a formerly autistic child.Journal of Autism and Developmental Disorders 9: 179-198.
  8. Grandin T. An Inside View of Autism.
  9. Grandin T., Margaret M. Scariano (1986) Emergence: Labelled Autistic Arena Press.
  10. Berard G (1993) Hearing equals behaviour. New Canaan: Keats Publishing. (Original published 1982).
  11. Kern J. et al. The pattern of sensory processing abnormalities in autism.
  12. Markram K, Markram H (2010) The intense world theory–a unifying theory of the neurobiology of autism. Frontiers in Human Neuroscience 224.
  13. Blackman L (2005) Reflections on Language” pp: 146-167 in Autism and the Myth of the Person Alone ed. by Douglas Biklen. New York University Press.
  14. Mayoral M (2010) Neurological soft signs in juvenile patients with Asperger syndrome, early-onset psychosis, and healthy controls. Early Intervention in Psychiatry.
  15. Parmar KR. et al. Visual Sensory Experiences From the Viewpoint of Autistic Adults, Front Psychol. [crossref]
  16. Volkmar FR, Cohen DJ (1985) ‘The experience of infantile autism: A first person account by Tony W.’ Journal of Autism and Developmental Disorders 15: 45-54.
  17. American Psychiatric Association. Diagnostic and statistical manual of mental disorders. 5th ed. Arlington: American Psychiatric Publishing, 2013.
  18. https://www.disabilitymuseum.org/dhm/lib/detail.html?id=1531&page=11
  19. http://auditoryintegrationtraining.co.uk/auditory-integration-training-ait-for-hearing-autism-adhd-add-dyslexia-and-other-special-needs-2/clinical-studies-for-auditory-integration-training/
  20. https://blog.donnawilliams.net/2014/09/20/visual-perceptual-disorders-as-a-cause-of-autism/
  21. https://www.brainbalancecenters.com/blog/retained-primitive-reflexes-sign-brain-imbalance
  22. Neurodevelopmental delay – https://www.moveplaythrive.com/research/178-research-summaries-goddard

Pilot Results from the Ambulatory Electronic Health Record (EHR) Evaluation Tool: Lessons Learned

DOI: 10.31038/JCRM.2023633

Commentary

Most studies focused on electronic health record (EHR) safety, specifically the ability of these systems to detect and prevent adverse drug events (ADEs), has been performed in the inpatient setting. To address this gap, the Ambulatory EHR Evaluation Tool was developed and piloted with seven clinics in 2019. Each of these clinics used one of the leading outpatient EHR systems, as identified by the Office of the National Coordinator (ONC) [1]. The tool consists of a medication safety test and a medication reconciliation module. For the medication safety test, it simulates a physician prescribing medications to their patients. The testing methodology closely follows the inpatient version of the tool, which is administered by the Leapfrog Group. For the medication reconciliation module, clinics were asked to electronically reconcile two medication lists.

To take the medication safety test, clinics downloaded a set of test patients and associated medication test orders to enter into their operational EHR using Computerized Physician Order Entry (CPOE). Included with these test patients were basic demographic details (e.g., age and weight), allergies, and relevant laboratory values. While entering these test orders, licensed prescribers recorded any advice or information they received (if any). The tool assesses basic and advanced decision support features [2]. Once finished with the test, clinics received an overall percentage score of unsafe orders detected, as well as individual order category scores. The test also included two subcategories: nuisance orders and fatal orders. Nuisance orders are low-priority medication combinations (i.e., drug-drug interactions and therapeutic duplications) that should be delivered un-interruptively, as they can contribute to alert fatigue [3]. These orders were reverse scored, in that clinics which alerted on these test orders were scored as “incorrect”. For fatal orders, these were high-priority medication interactions that if prescribed, can lead to serious injury and even death. Lastly, for the medication reconciliation module, we provided clinics with a test patient that was recently discharged from the hospital and is returning to their outpatient clinic for a follow-up visit. Clinics were provided with two medication lists: one from the recent hospitalization, and the most recent ambulatory medication list. These medication lists had the following discrepancies: removal and addition of a medication, and a change in the dose of a medication.

The mean overall score for the medication safety test was 54.6% (Table 1). The range was 42.5%, the minimum score was 37.5%, and the maximum score was 80%. Generally, clinics performed well in areas of basic decision support such as drug allergy (100%), drug-drug interaction (89.3%), drug dose (daily) (78.6%), and drug pregnancy (75%). In contrary, clinics performed poorly in areas of advanced decision support areas like drug age (39.3%). Most alarmingly, none of the clinics in the study had drug laboratory or drug monitoring alerts implemented. In terms of fatal order performance, the mean score was 67.9%. Only one clinic alerted on all the fatal orders in their test. For the nuisance orders, the mean score was 64.3%.

Table 1: Mean percentage scores for each order category

TAB 1

For the medication reconciliation module, three clinics (43%) had an EHR-based medication reconciliation functionality. However, only one clinic (14%) could demonstrate it during the pilot. In addition, none of the clinics’ EHR systems provided CDS during this process. Instead of electronic processes for medication reconciliation, most clinics compared medication lists manually, which was usually performed by a nurse or medical assistant.

The results from the initial pilot of the Ambulatory EHR Evaluation Tool revealed that while basic CDS features like drug allergy and drug interaction checking were widely implemented, areas of more advanced decision support were not implemented. A major commonality between all the clinics was that certain types of alerts were turned off completely. This occurred mostly in advanced decision support areas like drug laboratory, drug monitoring, and drug age; all of which are critical areas for patient safety. In addition, the mean fatal order score was only 68%, which is considered low given the severity of these medication orders. We expected all clinics to score a 100% in this subcategory. In terms of the results of the medication reconciliation module, only one clinic could demonstrate this functionality even though all the clinics were certified through Meaningful Use. Moreover, although most of the clinics understood the importance of medication reconciliation, the electronic processes at their individual facilities were poorly understood and thus unused.

In a broader context, the results from this pilot reveal significant gaps in the implementation of advanced CDS features in the outpatient setting. This is further magnified by the fact that commercial outpatient pharmacies are no longer routinely checking prescriptions for common medication errors, thus leaving the only effective medication safety net at the ambulatory clinic level. This leaves an enormous medication safety gap in the outpatient setting, where most medications are prescribed in the healthcare system. Hopefully, as this tool becomes more widely used, outpatient clinics will use it as a quality improvement tool to assess and identify gaps in the implementation of their medication related CDS, which as of now, is the only critical safety net for outpatient medication use.

References

  1. Office of the National Coordinator for Health Information Technology. Office-based Physician Electronic Health Record Adoption. Published 2016. Accessed January 11, 2019. https://dashboard.healthit.gov/quickstats/pages/physician-ehr-adoption-trends.php
  2. Kuperman GJ, Bobb A, Payne TH, Avery AJ, Gandhi TK, et al. (2007) Medication-related Clinical Decision Support in Computerized Provider Order Entry Systems: A Review. J Am Med Informatics Assoc 14: 29-40. [crossref]
  3. Phansalkar S, van der Sijs H, Tucker AD, Desai AA, Bell DS, et al. (2013) Drug-drug interactions that should be non-interruptive in order to reduce alert fatigue in electronic health records. J Am Med Informatics Assoc 20: 489-493. [crossref]