Abstract
Respondents evaluated systematically created vignettes, viz., combinations of elements (messages) about benefits to going to their doctor for a yearly check-up. The vignettes comprised 2-4 elements selected from the set of 16 elements, with the vignettes created by experimental design which ensured both that the elements did not mutually contradict each other, and that the elements were statistically independent of each other. Each of 101 US respondents evaluated a unique set of 24 vignettes, following the standard test protocol used in the emerging science of Mind Genomics. Respondents rated these vignettes on a two-sided scale of motivation and believability. Based upon the pattern of coefficients for equations relating elements to the rating of ‘motivates me’, three clearly different mind-sets emerged; respectively, those focusing on the visit to assess the growth of children, those focusing on obtaining their vital measures and advice about eating, and those focus on advice from the doctor about what to do to maintain an active lifestyle. In contrast, self-profiling classification of attitudes could not uncover these three clearly different and intuitively meaningful mind-sets. The paper finishes by introducing the PVI, personal viewpoint identifier, comprising six elements from the study, a two-point scale, the pattern of answers to which assigned a new person to one of the three mind-sets.
Background
The objective of this paper is the continuing effort of an emerging science, Mind Genomics, to understand how people perceive the world of the ordinary, how people make decisions, and perhaps most important, the existence of and nature of different ways that ordinary people look at topics of their everyday world. Rather than focusing on unusual situations to increase our understanding, Mind Genomics focuses on the daily, quotidian world, in which most people live.
The particular topic dealt with here is the understanding of what ordinary people look for when they think about what is important to the when they make their regular appointments to see their doctor. The notion of regular appointments may seem obvious, but if we were to probe more deeply into the topic, might we end up seeing deep differences which make sense, differences that we intuitively know, but differences which when recognized allow the visit to the doctor to be much more effective for both patient and doctor A simple Google Scholar® query about ‘attitudes regarding ‘attitudes about yearly check up visits to the doctor’ generated 90,400 hits as of October 16, 2023. Many more hits 384,000, emerged when the query was ‘what patients want from doctors during their annual visit’. For Google itself, there were upwards of 400,00 hits. Clearly this is an important topic to people.
The approach present here, Mind Genomics, provides the researcher with the opportunity to structure a situation of the ordinary life, so that situation can be explored with ordinary people, an exploration that can be done in a matter of hours and days, at an affordable price, in a structured, templated fashion anywhere in the world, and with powerful knowledge and tools emerging from the exercise [1,2]. The objective is to see whether or now the Mind Genomics science can produce new-to-the-world information in hours and days, teaching the profession new things, providing new tools for the world of health.
Doing the Study
The Mind Genomics approach works by creating vignettes, combinations of ideas pertaining to the topic, instructing the respondents to rate these vignettes on a scale, and then deconstructing the rating to estimate the contribution of each of the ideas or elements to the overall rating. The rationale for this ‘indirect’ approach is that the test stimuli more naturally approximate what the person might experience in everyday life. Rather than having the respondent evaluate ideas one by one, as is done in typical questionnaires, Mind Genomics reduces the intellectual burden by simply having the respondent respond with an immediate feeling to what is read.
The nature of the stimuli, these vignettes, deserves explication because of the power of the approach:
- The vignettes evaluated by the respondents are created by so-called experimental design. The experimental design prescribes the precise combination of elements to appear in each vignette. The use of experimental design to create the combinations means that each respondent’s data can be analyzed totally separately, for that respondent, OR incorporated into an analysis for a defined group of respondents. This is called a ‘within-subjects design,’ and constitutes a powerful features for analysis.
- Each respondent evaluates a totally different set of vignettes, the totally different sets created by a systematic permutation of the elements, with the statistical properties of the underlying experimental design maintained [3]. Thus, the researcher can do studies on topics without having had to plan for a long time in order to make sure that the testing is done on the ‘right’ vignettes. Mind Genomics encourages the researcher to ‘do the experiment’ rather than be subject to paralysis, to the overthinking captured by the popular adage ‘measure nine times and cut once.’ Mind Genomics encourages experimentation, not over-thinking, and as we will see below, prevents ’analysis paralysis.’
- The respondent is given 24 vignettes to evaluate, one vignette after the other. The underlying experimental design prescribes the combinations. The respondent need only read and react to the vignette. The vignette is created to be simple, comprising a set of phrases, the elements, one phrase on each line, without connecting words which end up cluttering. The structure enables the respondent to ‘graze’ through the information and assign a rating. The structure also ends up being less ‘taxing’ on the respondent because the physical format of the vignette, one line (approximately) per element, requires less effort. Figure 1 shows the distribution of responses times with response times of 9 seconds or longer truncated to 9 seconds. It is clear from Figure 1 that the respondents appeared to be able to assess and rate the vignette very easily. Most of the responses times are three seconds or shorter. Whether or not the data are ‘valid’, make sense, and teach us will be discussed below.
- The use of compound vignettes comprising different elements ensures that it is impossible to ‘game the system.’ In study after study, the desire to game the system emerges among academics and professionals, who feel stymied, complaining that they could not ascertain the ‘correct answer.’ It is the combinations of elements of different kinds which creates seeming a ‘blooming, buzzing confusion, ‘ in the words of Harvard’s eminent, late 19th Century psychologist, William James..
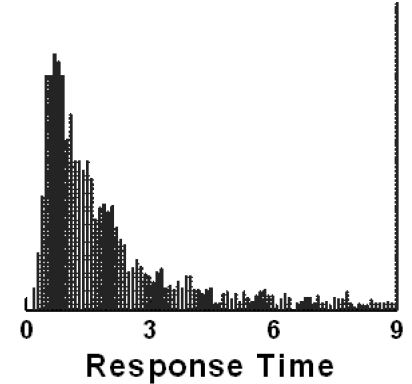
Figure 1: Distribution of response times across all vignettes evaluated in positions 2-24
The Mechanics of Creating the elqements and the Test Vignettes
The actual construction of the study by the researcher is straightforward. The researcher follows a set of templated steps, the first being a request for four questions which explore the topic, and the second being the request for four answers to each question. When first confronted with the task of choosing a topic and then asking four questions which ‘tell a story’ or at least ‘flesh out the topic’, the unpracticed researcher in Mind Genomics finds it easy to choose a topic but becomes flustered when requested to ask four questions which ‘tell a story.’ Simply put, the education that people receive all too often focuses on choosing the right answer, or even coming up with an answer to a question. The ‘thinking’ is structured, and not necessarily good. Memory and perhaps judgment are rewarded, but not the ability to create a new edifice to house knowledge. It is at this point, the request for the four questions, that many would-be researchers ‘freeze’, often abandoning the effort in anticipated frustration.
Figure 2 shows an example of the templated format for a typical study. Panel A at the top shows the screen shots for the four questions. This is the point at which the excitement may turn to dismay. Panel B shows the Idea Coach, with a box encouraging the researcher to write a short paragraph, a ‘squib’ in Mind Genomics language. The squib provides a chance for the researcher to describe the problem in detail, and specify the nature of the answers, both in terms of tonality (explanation vs list), and in terms of style (approximate number of words, reading level, etc.). Panel C shows the types of answers returned by the Idea Coach. The actual results, viz., questions, answers (elements), and results, will constitute the remaining topics of this paper.
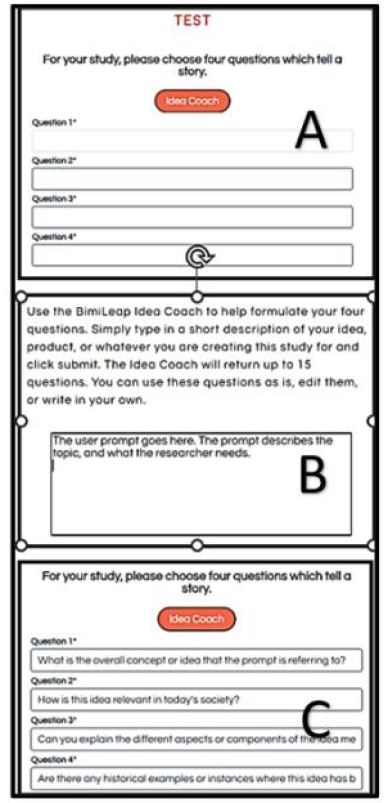
Figure 2: A typical set-up template for questions showing where Idea Coach enters and can be invoked. The actual text for the Idea Coach query and the four questions returned by AI are specific to the study.
The AI-enhanced feature of the Mind Genomics platform in BimiLeap.com.com is called Idea Coach. With Idea Coach, the researcher simply types in a paragraph about the topic(called here ‘squib’) , requesting questions to be asked. The Idea Coach returns with 15 questions, and later with an AI-summarization of the themes and other features of those 15 questions. The researcher selects the questions which are of interest or can request a ‘re-run’ of the Idea Coach for another 15 questions. Furthermore, the researcher can modify the paragraph to change the direction of the underlying AI as that AI attempts to create the questions.
Table 1 present the first set of 15 questions, along with the subsequent AI based summarization of patterns in these 15 questions The 15 questions appear immediately, but the AI summarized appears later, after the researcher has completed the selection of questions and answers. When looking at Table 1, one can focus on the original paragraph, the questions, and then the different types of AI summarization. These questions, or more specifically the answer book of ‘logical pages,’ one page for each request for questions (and later for answers to the questions), provides an education in and of itself.
Table 1: Results from the first effort to create 15 questions
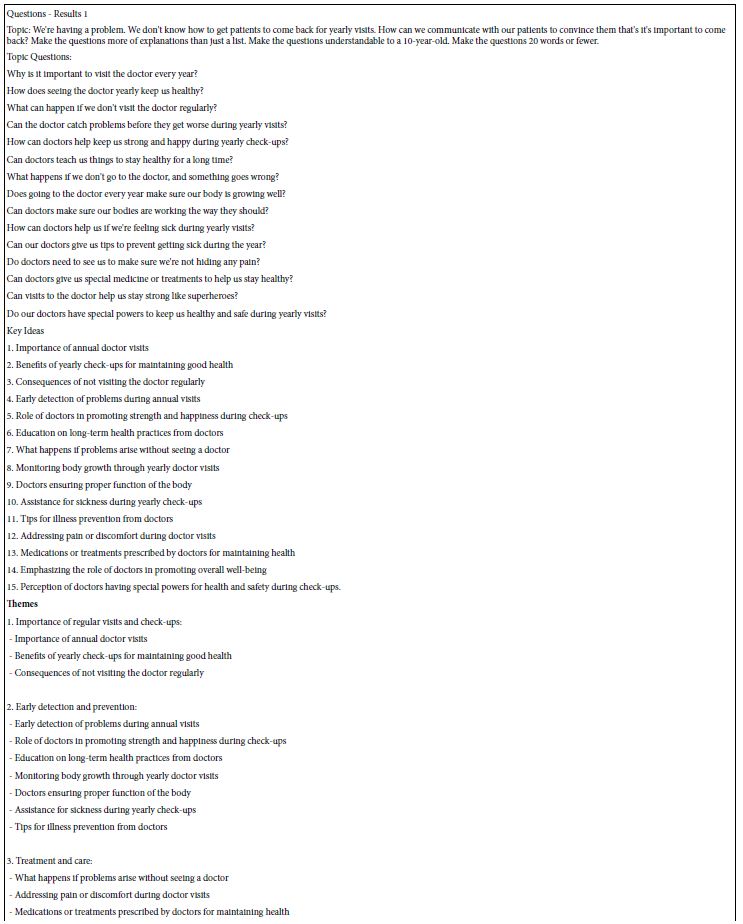
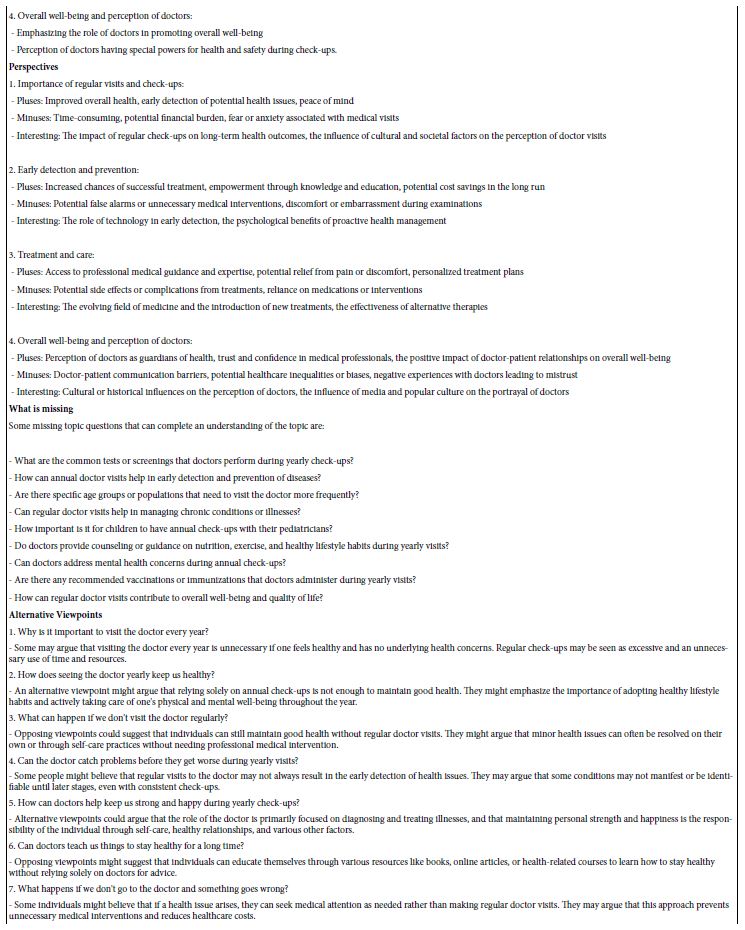
The ingoing questions posed by the researcher are the following: Topic: We’re having a problem. We don’t know how to get patients to come back for yearly visits. How can we communicate with our patients to convince them that’s it’s important to come back? Make the questions more of explanations than just a list. Make the questions understandable to a 10-year-old. Make the questions 20 words or fewer.
When looking at the ‘top’, viz. query, it is important to keep in mind that the researcher guided the AI by giving the AI specifics. These specifics describe the topic (get patients to come back), the specific problem (how can we communicate that it’s important), how to shade the question (make the questions more of explanations than just a list), how to ensure the question is understandable (understandable to a 10-year-old), and readable (20 words or fewer). Table 1 shows the success of this effort as well as the aforementioned summarization by AI. It is important to note that the actual effort generated several of these pages, because the research was geared both to answering a question and to learning about the topic. Table 1 is meant just as an example; the final four questions were selected from different iterations of Idea Coach, each iteration taking about 15 seconds.
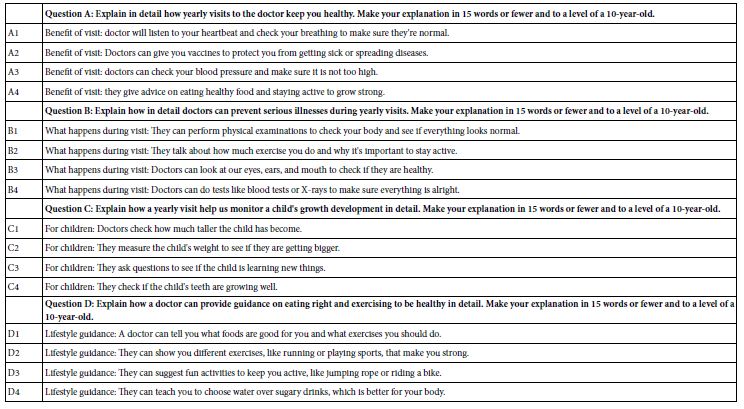
The final questions selected were then used as inputs to Idea Coach. Once again, each iteration focused on generating 15 answers to the specific question. The answers were obtained from Idea Coach, put into the study, and then edited manually to correct the grammar, and to make the answer simple. Table 2 show a set of answers to one question.
Table 2: Results from the first effort to create 15 answers to the first question
It is important to keep in mind that that the Idea Coach, empowered by AI, becomes itself a tool to teach the researcher. Thus, what had started as a seeming insurmountable obstacle at the time Mind Genomics was born, the issue of thinking about questions and answers, ended up generating an additional and powerful benefit, viz., education at the early stage of thinking, even before the experiment is actually run with real people.
The final set of questions and answers appear in Table 3. Keep in mind that Table 2 presents the actual questions used to generate the different answers, as well as presenting the edited answers; the editing was done by the researcher before the study was run. This process ensures simple questions, simple answers, both short, and understandable to the respondent. In the actual experiment the respondent will only see combinations of answers, and never see the questions. The role of the question is only to generate the answers, either from AI or from the mind of the researcher. One final note is relevant here. Experience shows that this process ends up educating the researcher quickly on the topic, often resulting in the desire for the researcher to put in her or his own ideas rather than relying on the AI. That itself, the creation of confidence and excitement, becomes a strong reason for using the Idea Coach.
Table 3: The four questions and their four sets of answers used in the study
The Rating Scale
The main focus of this study is on the degree to which the messages motivate the respondent, at least within this format. We do not know what the respondent will actually do when giving the messages, although previous studies in the medical world have shown that the proper messages can double the number of colonoscopies [4] , as well as substantially reduce the number of within-30-day-readmissions to the hospital for patients who were suffering from CHF (congestive heart failure) [5].
The opportunity to investigate two aspects of messaging, e.g., motivation and believability, has emerged as a way of increasing the usefulness of the Mind Genomics experiment. To this end, the research used a two-sided five-point scale, a new approach in Mind Genomics. The points on the rating scale enable the respondent to rate both motivating (no/yes) and believable (no/yes). The scale below shows these two sides, and the frequency of their selection across the 2424 vignettes, evaluated by the 101 respondents.
Rating question: Think about going to the doctor. Here’s a paragraph about a visit. How do you feel personally when you read this paragraph Choose how you feel.
Scale Points
1=Does not motivate me…AND…I have no emotional response to it 11.7%
2=Does not motivate me…BUT…I get an emotional response when I read it 10.8%
3=I can’t answer 18.8%
4=Motivates me…BUT…I have no emotional response to it 28.2%
5=Motivates me…AND…I get an emotional response when I read it 30.4%
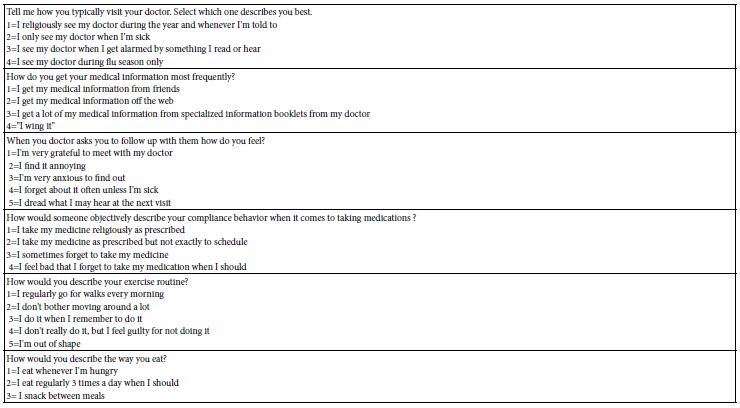
A separate part of the Mind Genomics experience required the completion of a self-profiling questionnaire, allowing the research to obtain information about the attitudes and behaviors. These questions and answers are shown in Table 4. The respondent was present with each question separately, in a ‘pull down menu’, showing the question and the different answers. The respondent was instructed to select one answer for each question.
Table 4: The self-profiling classification questions
Executing the Study
The actual study is executed in a straightforward manner. The Mind Genomics platform, BimiLeap, enables the researcher to select the respondents, their location, age, etc., through a built-in API linked to the panel provider, Luc.id, Inc., located in Louisiana. Luc.id is actually an aggregator, sourcing respondents from different online providers, located around the world. Thus, it is possible to work with defined respondents, viz., ‘survey takers’, from anywhere in the world. These respondents have already volunteered to participate, knowing that their data is entirely anonymized. The only information obtained about them is from their self-profiling, the questions shown in Table 4, along with age and gender.
Analysis
The data from each respondent is stored in the form of a vector or row of data, one row for each vignette. Thus, each respondent generates 24 rows of data. The first sets of columns are reserved for study identification and respondent identification. The information here includes the answers to the respondents self-profiling questions, this information repeated 24 times, once for each vignette. The second set of columns shows the specific composition of the vignette, starting with the order of testing (1-24), and then 16 columns, one for each of the 16 elements. The cell for each element is given the value ‘0’ when the element is absent from the vignette and the value ‘1’ when the element is present in the vignette. By design, each row will have shown a minimum of two ‘1’s’, and a maximum of four ‘1’s.’ The third set of columns show the rating, and the response time. The last set of columns show transformed rating data, defined and described in the next paragraph.
To prepare for an appropriate analysis, the rating scale data must be transformed to present the data appropriately for subsequent regression analysis using OLS, ordinary least squares regression [6]. The objective of Mind Genomics is to relate the presence/absence of the elements to the response. There are actually two responses here: motivating (vs not motivating), and believable (vs. not motivating). The research here focuses primarily on motivating vs not motivating, but it is also interesting to find out the messages which are believable vs not believable.
The strategy to decouple motivating from believable consists of creating a new set of binary variables through simple transformations:
R5=Motivates and believable. R5=100 when the rating is 5. Otherwise R5=0.
R54=Motivates. R54=100 when the rating is 5 or 4. Otherwise, R5=0.
R52=Believable. R52=100 when the rating is 5 or 2. Otherwise R52=0.
R3=Don’t know. R3=100 when the rating is 3. Otherwise, R3=0.
R41=Not believable. R41=100 when the rating is 4 or 1. Otherwise, R41=0.
R21=Does not motivate and not believable. R21=100 when the rating is 2 or 1. Otherwise R21=0.
RTSeconds=Response time in seconds. The BimiLeap program measures the elapsed time between the appearance of the vignette and the rating assigned by the respondent. The time is measured with a resolution of hundredths of seconds.
To each of the newly created binary variables, viz., those given a value of either 100 or 0, a vanishingly small random number is assigned, this number less than 10-5. OLS, ordinary least-squares regression, requires that the dependent variable have some minimal variable. In the case that the dependent variable has no variability, either for a given individual or for what will be the relevant subgroup, the OLS regression will ‘crash.’ For example, this might well happen when a respondent avoids the rating ‘3’. For that respondent, R3, Don’t Know, will always have the transformed value of 0. Any effort create a model or equation relating the ratings of that respondent to the presence/absence of the 16 elements will end up with the OLS regression program ‘crashing.’ To avoid that problem is simple; add this vanishingly small random number to every transformed rating, ensuring that all newly created binary values (e.g., R5 …. R21) ends up with some minimum variation. This prophylactic step ensures that all of the equations will run when OLS regression is used.
OLS Regression – Relating the Presence/Absence of the Elements to the Binary Variables and Response Time
The objective of Mind Genomics is to quantify the contribution of the individual ideas or elements as they drive a dependent variable. The key variable in this study is ‘motivates’, captured by the newly created binary variable, R54. Whenever the vignette is rated as motivating (rating 5 or 4), R54 becomes 100. Otherwise, R54 becomes 0. Given this information, can we determine the degree to which each of our 16 elements ‘drives’ that rating of ‘motivates’? The answer to the foregoing question is a simple YES, due to the effort made in the set-up of the vignettes according to experimental design. The permuted experimental design ensures that each of the 16 elements appears statistically independently of every other one of the 16 elements, that there are some ‘incomplete vignettes’, lacking an answer from question or an answer from two questions. These properties enable the OLS regression to estimate the absolute value of the driving power of the element.
The driving power of the element is the magnitude of the coefficient in the equation below:
DV (dependent variable)=k1A1 + k2A2 … K16D4
The additive model does not depend upon an interpretation of the data. Rather, the OLS regression simply uses the mathematical properties of the data to estimate the 16 coefficients. The additive constant is not calculated for the simple reason that it is important to be able to compare the coefficients from one study to another, in terms of their absolute values. The only way this comparison can be ensured is to force all of the information to be embedded in the coefficient. By having an additive constant, a baseline, the researcher has to first account for differences in baseline, and then account for differences in coefficients, considering the baseline. That effort is not productive when one is attempting to create a large-scale database across topics, across culture, and across time. It is more reasonable to estimate the coefficients without the complications caused by the additive constant. This change in the computation formula has been slowly emerging, prompted by the desire to understand the ‘stories’ embedded in different studies as they are revealed by the coefficients
Creating the Models or Equations for the Total Panel for the Different Dependent Variables
The Mind Genomics effort ‘comes alive’ when we look at the ‘meaning’ of the strong performing elements, if indeed we do have these elements. For Mind Genomics studies, the notion of ‘strong performing’ has been reserved for those elements of a positive nature with coefficients 21 or higher, and for those elements of a negative nature with coefficients of 15 or higher. Table 5 shows only one strong performing positive element, for motivating (D4: Lifestyle guidance: They can teach you to choose water over sugary drinks, which is better for your body), and only two strong performing negative elements, both for believable (D4: Lifestyle guidance: They can teach you to choose water over sugary drinks, which is better for your body, and C4. For children: They check if the child’s teeth are growing well).
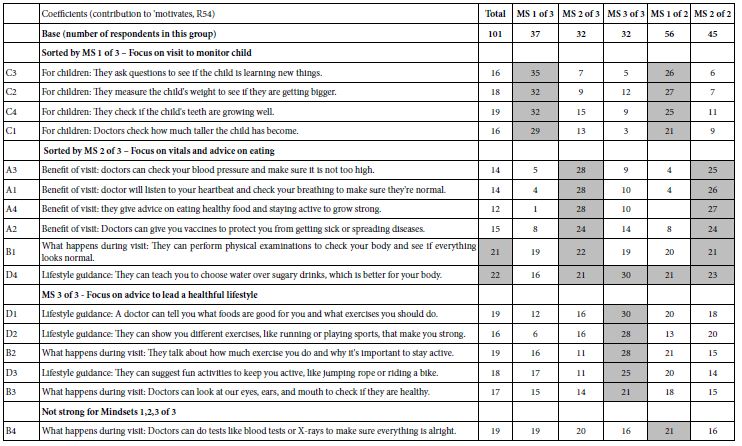
Table 5: Coefficients for models (equations) relating the 16 elements to the newly created binary variables, and for response time (RT), The table is sorted by the values of coefficients for ‘motivate’ (R54).
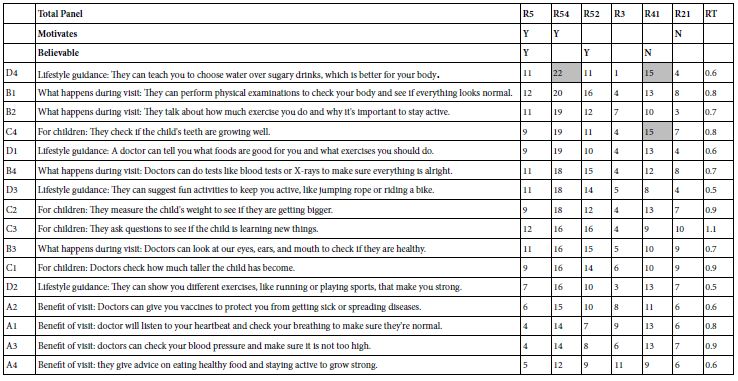
The foregoing results are confusing. There is clear differentiation across elements in Table 5, both in terms of ‘motivating’ and in terms of ‘believable.’ Thus, the results are not due to the lack of differentiation across the elements, but perhaps to a deeper issue, e.g., the type of respondent. It may be that the 101 respondents comprise different groups of respondents with varying levels of interest and belief in what could be said and done in a routine doctor’s examination. If so, then the specific patterns might be elusive. The next analysis addresses this possibility by focusing on the way people describe themselves.
Responses of Key Subgroups in Terms of Motivate
The Mind Genomics process generates a great deal of data. The most practical way to deal with the plethora of information is to focus on one dependent variable, using that variable as the lens through which to examine the mind of the respondent as the respondent evaluates the vignettes. Once we focus more precisely, using one dependent variable, we will end up with many more strong performing elements, as we see in Table 6, where we focus on one variable (motivates, R54), and were we have divided people by what they say about some of their motivations and activities pertaining to health and lifestyle.
Table 6: Coefficients for the 16 elements for ‘motivates’ emerging from separate analyses of respondents self-defining themselves by their pattern of behavior and thinking (defined by the columns).
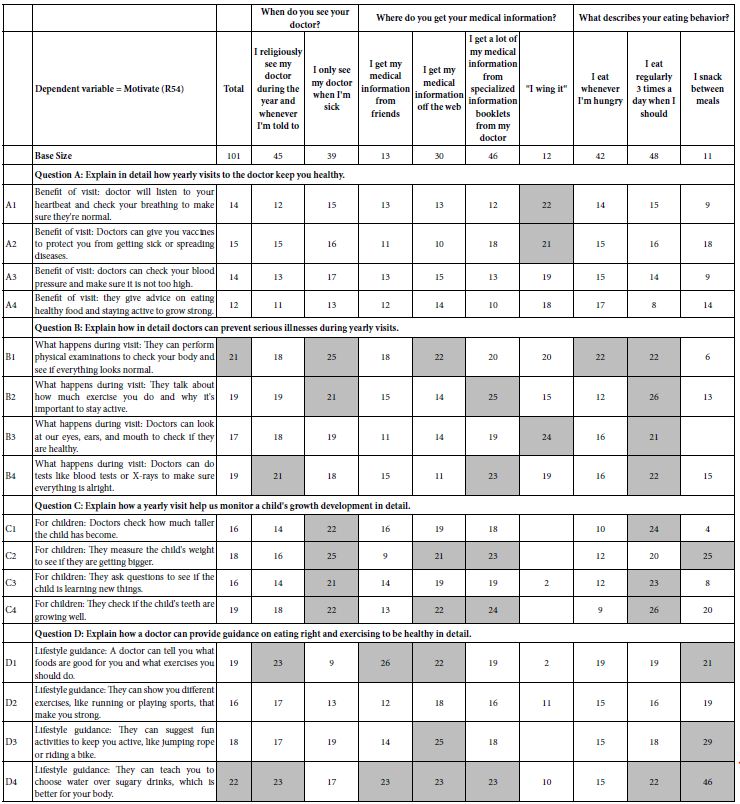
Table 6 is more gratifying because it shows many elements driving motivation, not just one element as we saw for the total panel in Table 5. Yet, in this increased number of strong performing elements it is difficult, indeed almost impossible, to synthesize a meaningful pattern. Knowing the way, a person answers questions about her or his attitudes and behaviors regarding the world of health and social interaction does not really allow the doctor to deeply understand the patient, at least in a formal, structured level. There may be some clues in the different classifications, but once again the lack of a clearly interpretable pattern emerges, this time with the plethora of strong performing elements, a plethora which seems to be incapable of simple definition. Face with this type of pattern, it is not surprising that many practitioners fail to understand their patients, at least in a structured way. The literature may be filled with data about specific medical conditions and their correlation with indices, but we fail to see tight connections.
Mind Sets
A hallmark of Mind Genomics is the focus on the search for basic groups in the population defined by the way they think about specific, granular topics. The ‘regular visit to the doctor’ is such a granular topic. The introduction to this paper talked about the general issue of what patients want from their doctors. The topic of a regular visit to the doctor puts the person’s thinking into a far more concrete realm. The material that the respondent may have to examine and evaluate need not be large scale issues, but may paint concrete ‘word pictures’, describing a very ordinary situation. Thus, as a research tool to understand the mind of the patient, or indeed of anyone, the Mind Genomics science provides a tool that can be honed and sharpened to a micro-focus on the minutia of a topic, minutia which might see irrelevant in the big picture, but might be exceptionally relevant to the topic.
The creation of mind-sets is a straightforward process. The researcher follows these steps, each transparent, each simple, using well-defined and statistically valid methods.
Step 1 – For each respondent create a model relating the presence/absence of the 16 elements to the binary transformed rating. The dependent variable here is ‘motivates’, R54. The model, estimated by OLS regression, is valid because the initial experimental design ensured that each respondent would evaluated a set of 24 vignettes, designed analysis by OLS regression [7].
Step 2 – Create the matrix of 101 rows (one row for each respondent) and 16 columns (one column for each element).
Step 3 – Use k-means clustering to divide the set of 101 respondents twice, first into two non-overlapping groups, and then into three non-overlapping groups [8]. The k-means clustering program used by Mind Genomics computes a ‘distance’ between pairs of respondents based upon the degree to which they are parallel, viz., the degree to which they trace out the same pattern. The measure of distance is the quantity ‘1-R’, where R is the Pearson correlation coefficient. R has a high value of +1 when the two sets of coefficients are perfectly parallel, and thus have ‘no dissimilarity’ or ‘no difference’ in their patterns. The value (1-R) is then 0. In contrast, when the two sets of coefficients move in opposite directions, then R has a value of -1, and the quantity (1-R) becomes 2.0. All pairs of respondents generate some number between 2 and 0.
Step 4 – The k-means clustering program assigns the respondents to the clusters so that the distances between pairs of respondents within a cluster are small, whereas the distances between pairs of centroids of the clusters are large.
The clustering is not exact, but rather a heuristic. The objective of the clustering is to discover presumably more meaningful groups of respondents. The clustering algorithm does not consider any meaning attached to the elements, but rather uses numerical magnitudes. That is, there is no effort to interpret the clusters.
Henceforth, this paper will use the phrase ‘mind-set’ instead of the term ‘cluster,’ in order to keep the spotlight on the effort to understand the way the person thinks about a topic.
Table 7 shows the coefficients estimated for Total Panel, for the three-mind-set solution, and for the two-mind-set solution, respectively, both emerging automatically from the BimiLeap program. The three-mind-set solution seems to be the more powerful solution, producing many more coefficients of high magnitudes (21+). The two-mind-set solution seems to be a bit weaker. Furthermore, the three mind-set solutions appear to be more interpretable, indeed quite easy to interpret:
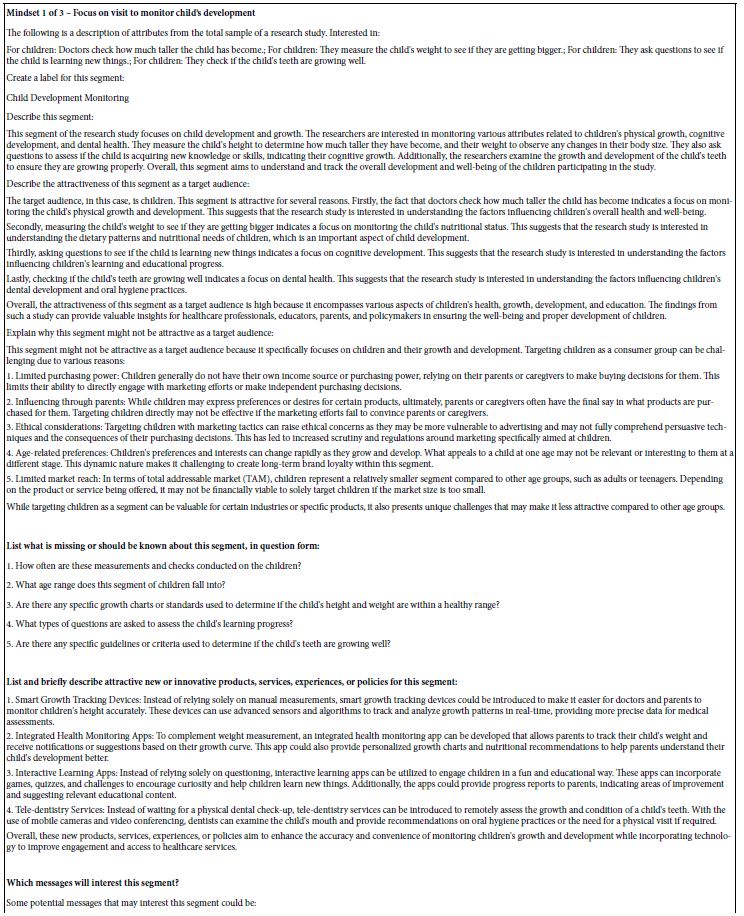
Mind-Set 1 – Focus on visit to monitor the child
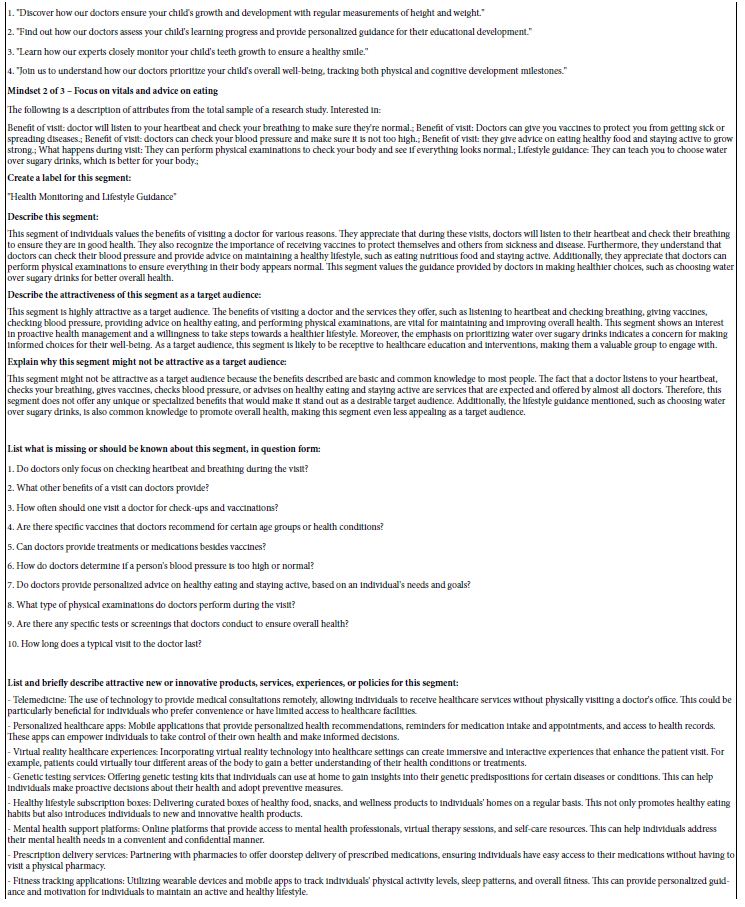
Mind-Set 2 – Focus on vitals and advice on eating
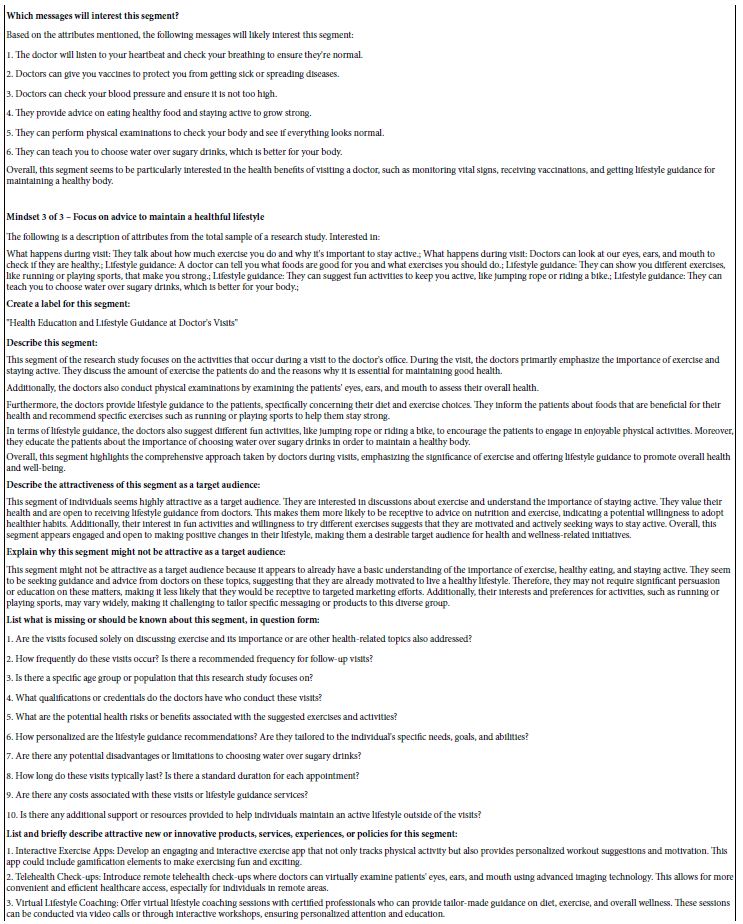
Mind-Set 3 – Focus on advice to lead a healthful lifestyle
Table 7: Performance of the elements by total panel, by three mind-sets, and by two-mind sets, respectively. The elements are sorted by the performance among the three emergent mind-sets.
The attraction of the mind-set solutions is undeniable because of its simplicity. Although the experience of participating in these Mind Genomics studies often exasperates professionals because they cannot ‘guess the right answer’, the reality is that ordinary people have no problem suspending their critical thinking, responding intuitively, and generating powerful results.
Identifying the Respondents by Attitude Versus by a ‘PVI’ (Personal Viewpoint Identifier)
A continuing finding in Mind Genomics is that who a person IS, or how the person says she or he thinks about a topic often does not co-vary with how the person responds when confronted with specific, granular issues relevant to the topic. This lack of correspondence between what a person ‘say’s and how the person actually responds can be seen from the pattern of percepts in Table 8. At the start of the Mind Genomics ‘experiment’, before evaluating the vignettes, the respondent completed a self-profiling classificaiton, comprising standard questions of gender and age, and then up to eight questions selected by the researcher, usually questions relevant to the topic.
Table 8: Distribution of answers to self-profiling questions by the total panel, and by the respondents in the three mind-sets.
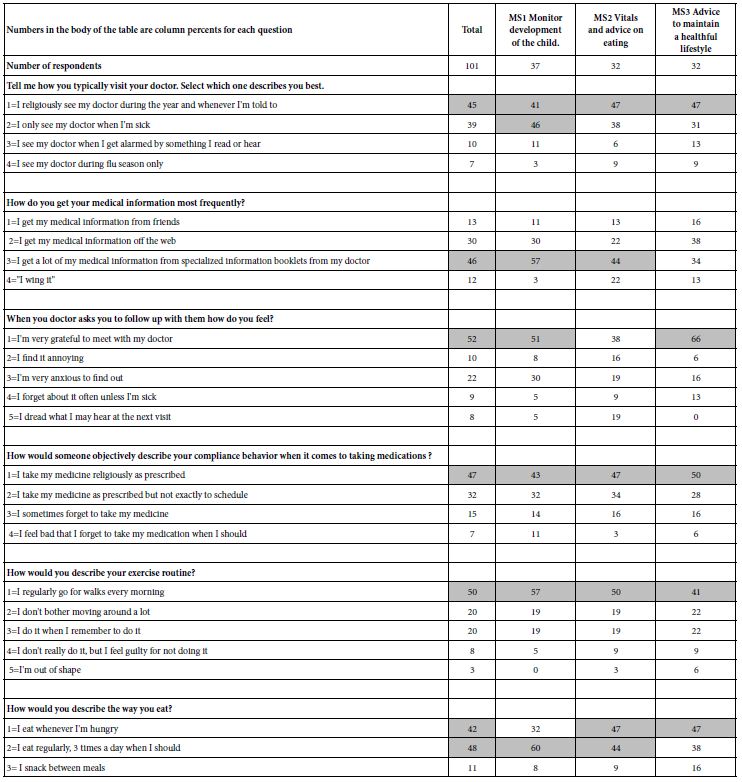
Table 8 shows the self-profiling classification questions, and the percent of respondents selecting each answer. The clarity so evident in Table 7, based upon the response to the granular elements fails to emerge when the respondents separately profile themselves. Indeed, from Table 8 it would be difficult if not impossible to discern the presence of three radically different mind-sets
In recent years a new focus has been on the identification of individuals belonging to specific mind-sets, an effort which has ended up improving outcomes in the world of medicine. By knowing the mind-sets of patients discharged from the hospital after a bout with congestive heart failure, the results suggested a decrease in the within 30-day readmission from 17% down to 5% for the patients in the ward were ‘mind0typed’ after release and given the appropriate motivation material to put on their refrigerator [9]. The creation of the PVI, the personal viewpoint has been made available world-wide at the website www.pvi360.com. The program to create the PVI uses the output of the Mind Genomics study to create the PVI [10].
Figure 3 shows the first two parts of the PVI. Panel A comprises a set of questions about the respondent, with these questions ‘optional’. The rationale for these questions is primarily patient management, viz., the practical issue of picking up relevant patient data when the PVI data are included in a large-scale database. The PVI user can choose not to ask certain questions. Panel B comprises a set of six questions, coming directly from the results of the study, with the request for the person completing the PVI to choose one of two answers to each question. The six questions are randomized across the people who complete the PVI. The pattern of answers to the six questions map to the most likely of the three mind-sets, assigning the respondent to that mind-set. The important things to remember are that the language of the PVI questions is exactly the same language as that used to create the mind-sets, and that the PVI is an enhanced ‘guess’ about mind-set membership, but a guess based on actual response to relevant questions..
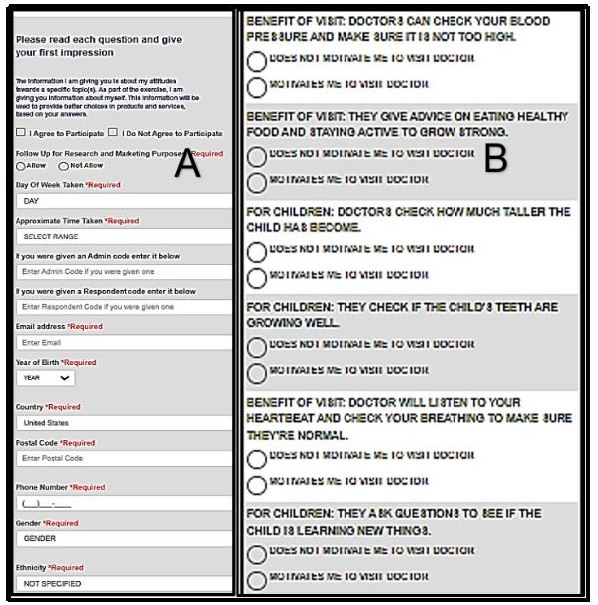
Figure 3: The first two parts of the PVI. Panel A shows the up-front questions about the respondent. Panel B shows the six questions and the two answer for each question.
The desire to know more about the patient and the medical experience has produced an additional feature of the PVI, so-called specialty or additional questions. These questions ‘tag along’ at the end of the actual PVI exercise. They enable the researcher to find out more information about a topic, and at the same time know the mind-set of the respondent who is answering the questions. The additional questions can be up to 20 in number, providing extensive additional information about the way mind-sets feel about other, related topics. These additional questions appear in Figure 4. The combination of additional questions with the PVI provides the researcher with a new tool to understand how to communicate with patients of different mind-sets, for a specific medical (or other) topic.
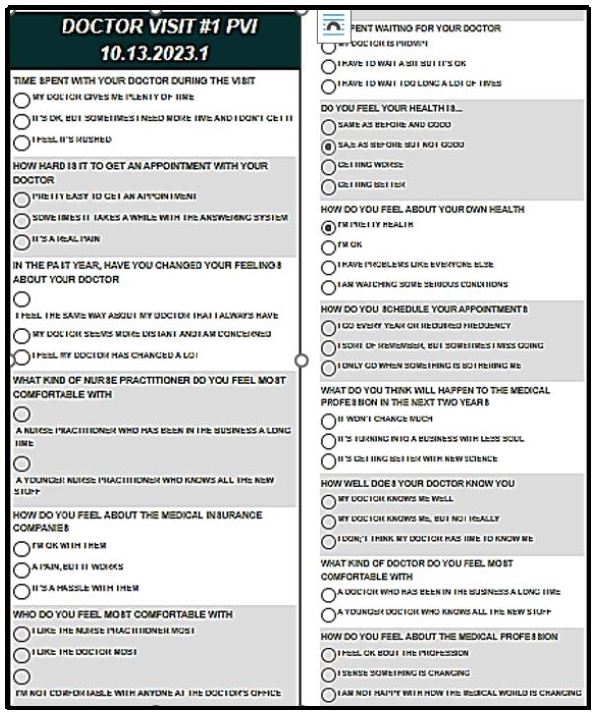
Figure 4: The third part of the PVI, the specialty or additional questions
How Good are the Data – The IDT (Index of Divergent Thought)
Up to now the focus has been on the use of Mind Genomics to understand how people think. During the years that Mind Genomics has been used, again and again it has become obvious that users of Mind Genomics go through a learning process. The researchers don’t really understand how to think creatively in the way Mind Genomics structures the process. At first the researchers grope around, often relying on Idea Coach to help them, but without a sense of what might be a strong question, and what might be cogent and meaningful answers. Creating a measure of ‘goodness of the study’ has become increasingly important as the use of Mind Genomics has evolved from consumer research professionals to young doctors, college students, and then high school and middle school students, and finally to grade school students.
The IDT (Index of Divergent Thought) is an attempt to quantify the ‘goodness’ of the study, through the summation of the weighted squares of the positive coefficients. Table 9 shows the computational formula. We already know the coefficient of each of the 16 elements for total panel, and for both the two mind-set solution and the three mind-set solution, respectively.
Table 9: The IDT (Index of Divergent Thought), measuring the performance of the study in terms of incorporating ideas which perform strongly.
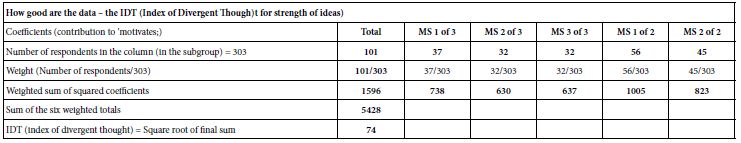
The IDT is 74, very respectable for a study of this type. The IDT turns into a benchmark, as the researcher searches for elements which represent strong performers, especially for the total panel, or in the case of mind-sets, among at least one of the two mind-sets, and one of the three mind-sets, respectively. After all is said and done, in the end, the IDT can become a way for someone to measure progress in thinking.
AI Interpretation of the Three Mind-sets
At the start of the study, viz., when the elements were being created with the help of Idea Coach, one of the outputs of the process was the ‘Idea Book’, presenting the different sets of questions or answers, each set resulting from a query submitted to AI. After the BimiLeap platform used Idea Coach to develop the 15 questions or answers, these questions or answers were stored and ‘summarized’ set by set using a group of queries. The summarization generated a page of instructive output, shown in Tables 1 and 2, respectively.
The same approach was used for AI summarization of the results for each key subgroup of respondents. The summarization was done only for the elements with coefficients 21+ for positive variables (e.g., R54=motivates), and only for elements 15+ for negative variables (e.g., R21=does not motivate). When no element satisfied the threshold value the summarization was not done.
Table 10 presents the AI summarization for the strong performing elements for the three mind-sets, computed for the dependent variable R54. The AI summarization becomes a way for the researcher to better understand the results and perhaps the patterns emerging from the aspects and commonalities of winning elements.
Table 10: AI summarization for the strong performing elements for each of the three mind-sets emerging from the three-mind-set solution.

Discussion and Conclusions
Although one may often believe that years of experience with patients provides a strong sense of ‘what to say’ to each individual patient, the reality is that the proper communication with patients is necessary, but rarely well understood, and may require far more experience and guidance/coaching than might commonly be thought. Colloquially, some of this is encapsulated in what is colloquially called the ‘bedside manner’, but such a simple catch-all phrase can hardly do justice to the complexities presented in the visit of a patient with a doctor.. The literature about ‘what patients want from doctors’ recognizes the lack of deep information that is readily at the hands of the practitioner, can be sensed from some of these quotes from the public academic literature.
Although much has been written about what patients Then they contact their general practitioner (GP), there are no published data from large cohort studies of what patients expect…… most patients come to the consultation with a particular agenda. Failure to address this agenda is likely to adversely affect the outcome of many consultations [11].
The results showed that people ‘preferred’ the explanations based on what the participants in the earlier study wanted to know about their medicines, rather than those based on what the doctors thought they should be told. They also ‘preferred’ the explanations that did not convey negative information, rather than those that did convey some negative information. In addition, the inclusion of negative information affected ratings of likely compliance with the prescribed medication [12].
Most of the expectations in qualitative studies were related to the function “Fostering the relationship”. Similar expectations arose less often in quantitative studies. Conclusions Patients do have concrete expectations regarding each of the functions to be met in the medical encounters. The research approach tends to bias the results. Practice implications the collected expectations suggest how physicians may perform each of their tasks according to the patient perspective. Future research on patients’ communicative expectations needs to overcome the gap between qualitative and quantitative findings [13].
Patients want many things from their doctors, not all of which are possible. Below, however, is a list of things that patients seem to want from their doctor, and which should be possible. ….Eye contact… [14].
The study presented here is among the first to deal with the use of Mind Genomics to explore in detail the description of the interaction between the medical professional and the prospective patient. Mind Genomics provides the opportunity to describe the different facet of the doctor patient relationship in various conditions, with the descriptions emerging from the combination of AI (Idea Coach) and the doctor as co-generators of ideas, and the response of real people to these descriptions.
The ability to do these research projects with hours and days, from the generation of the topic to the creation of the study and finally to study execution and detailed analysis, promises to create a new corpus of knowledge about the world of everyday health and illness from the point of view of how a person perceives that world. The use of ordinary language, the ability of Mind Genomics to prevent guessing, the objectivity of the study was conducted on a computer, and finally the use of clustering to find mind-sets and typing tools to assign mind-sets, all promise a database of knowledge, at least interesting even if not eventually transformative.
References
- Moskowitz HR (2012) ‘Mind genomics’: The experimental, inductive science of the ordinary, and its application to aspects of food and feeding. Physiology & Behavior. [crossref]
- Moskowitz HR, Gofman A, Beckley J, Ashman H (2006) Founding a new science: Mind genomics. Journal of Sensory Studies 21: 266-307.
- Gofman A, Moskowitz H (2010) Isomorphic permuted experimental designs and their application in conjoint analysis. Journal of Sensory Studies 25: 127-145.
- Oyalowo A, Forde KA, Lamanna A, Kochman ML (2022) Effect of patient-directed messaging on colorectal cancer screening: A Randomized Clinical Trial. [crossref]
- Gabay G, d Moskowitz HR (2019) “Are we there yet?” Mind-Genomics and data-driven personalized health plans. The Cross-Disciplinary Perspectives of Management: Challenges and Opportunities, pp.7-28.
- Dismuke C, Lindrooth R (2006) Ordinary least squares. Methods and Designs for Outcomes Research 93: 93-104.
- Gofman A, Moskowitz H (2010) Isomorphic permuted experimental designs and their application in conjoint analysis. Journal of Sensory Studies 25: 127-145
- Ahmed M, Seraj R. and Islam SMS (2020) The k-means algorithm: A comprehensive survey and performance evaluation. Electronics 9(8): 1295.
- Gabay G &d Moskowitz HR (2019) “Are we there yet?” Mind-Genomics and data-driven personalized health plans. The Cross-Disciplinary Perspectives of Management: Challenges and Opportunities, pp.7-28.
- Davidov S, al Humaidan, M, Gere A, Cooper T, Moskowitz H (2021) Sequencing the ‘dairy mind’: Using Mind Genomics to create an “MRI of Consumer Decisions”. In: New Advances in the Dairy Industry. IntechOpen.
- McKinley RK, Middleton JF (1999) What do patients want from doctors? Content analysis of written patient agendas for the consultation. British Journal of General Practice. [crossref]
- Berry DC, Michas IC, Gillie T, Forster M (1997) What do patients want to know about their medicines, and what do doctors want to tell them? A comparative study. Psychology and Health 12: 467-480.
- Deledda G, Moretti F, Rimondini M, Zimmermann C (2013) How patients want their doctor to communicate. A literature review on primary care patients’ perspective. Patient Education and Counseling. [crossref]
- Stone M (2003) What patients want from their doctors. BMJ 326(7402): 12326doi: https://doi.org/10.1136/bmj.326.7402.1294 (Published 12 June 2003