Author Archives: author

Development of Synthetic Cell Differentiation Agent Formulations for the Prevention and Therapy of Cancer via Targeting of Cancer Stem Cells

DOI: 10.31038/CST.2019412

Abstract

The association of methylation enzymes with telomerase constitutes a unique abnormality of cancer cells. This abnormality locks methylation enzymes in an exceptionally stable and active state so that hypomethylation of nucleic acids necessary for the cells to undergo Terminal Differentiation (TD) cannot take place. Human body produces metabolites that are able to eliminate telomerase from abnormal methylation enzymes of cancer cells to allow TD to proceed. Cell Differentiation Agent-2 (CDA-2) is a preparation of human metabolites from freshly collected urine, which has been approved for cancer therapy by the Chinese FDA. The effective components of CDA-2 are Differentiation Inducers (DIs) to target on the telomerase of abnormal methylation enzymes and Differentiation Helper Inducers (DHIs) which are the inhibitors of individual enzymes of ternary methylation enzymes. CDA-2 was very effective for the therapy of Myelodysplastic Syndrome (MDS), which is a disease attributable to Cancer Stem Cells (CSCs). We have previously carried out extensive studies on the DHIs of CDA-2.We are now focusing on the DIs of CDA-2 in order to formulate synthetic CDA for the prevention and therapy of cancer via targeting of CSCs.

DIs were purified from CDA-2 solution by procedures including differential solvent extraction, gel filtration, ion exchange chromatography, TLC, and HPLC. The mass of purified active preparation was determined by mass spectroscopy. DI activity was based on the Nitro Blue Tetrazolium (NBT) assay of HL-60 cells.

DIs of CDA-2 were found predominantly as acidic liposomal complexes extractable by dichloromethane. A good proportion of which became covalently linked to inactive carriers which were not soluble in dichloromethane, but soluble in alcohols. We have identified pregnenolone as a DHI of active liposomal complexes. After dissociation from pregnenolone, the active DIs of CDA-2 were not associated with UV absorption peaks of HPLC. We suspected that the active DIs might be acidic peptides derived from endogenous proteins, because we have previously found that acidic peptides of CDA-2 were active DIs. We, thus, randomly picked pentapeptides containing at least two acidic amino acid residues from the sequences of a- and b-hemoglobin for synthesis to test their DI activities. Indeed, acidic pentapeptides of hemoglobin were active as DIs, although the activities were not impressive. Retinoic Acid (RA) and 12-O-TetradecanoylPhorbol-13-Acetate (TPA) are well known DIs with much better activities.

In this study, we found Pyrvinium Pamoate (PP) as the best DHI, and triinosinate + tetrainosinate (I3 + I4) as an acceptable DHI.

With effective DIs and DHIs on hand, our deliberated CDA formulations were as followings: for the therapy of MDS, the CDA-MDS formulation was RA(ED25)-5P-1(ED25)-I3 + I4(RI0.5)-PP(RI0.5)-sodium pregnenolone sulfate(RI0.5); for the therapy of CSCs, the CDA-CSC formulation was RA(ED25)-TPA(ED25)-PP(RI0.5)-resveratrol(RI0.5)-curcumin(RI0.5); for the therapy of brain tumor, the CDA-BT formulation was TPA(2xED25)-PP(2xRI0.5)-sodium phenylbutyrate(RI0.5)-pyrogallol(RI0.5); and for the therapy of melanoma and pancreatic cancer, the CDA-M&P formulation was RA(ED25)-TPA(2xED25)-5P-1(ED25)-PP(2xRI0.5)-sodium tannate(RI0.5). The above CDA formulations all produced 100% NBT + on HL-60 cells.

Keywords

Cancer Prevention and Therapy, Abnormal Methylation Enzymes, Cancer Stem Cells, Synthetic CDA Formulations, Differentiation Inducers, Differentiation Helper Inducers.

Introduction

Methylation enzymes play a critical role on the regulation of cell replication and differentiation, because DNA methylation controls the expression of tissue specific genes 1] and pre-rRNA ribose methylation controls the production of ribosomes 2], which in turn dictate the commitment of cells to initiate replication 3]. If enhanced production of ribosomes is locked in place, it becomes a factor to drive carcinogenesis [4]. Biological methylation is mediated by a ternary enzyme complex consisting of Methionine AdenosylTransferase (MAT)-MethylTransferase (MT)-S-Adenosyl Homocysteine Hydrolase (SAHH) [5,6]. These enzymes must be in the ternary enzyme complex to become stable and functional. In the monomeric state, individual enzymes are quickly inactivated. SAHH is the most unstable enzyme, followed by MT, and then MAT. MTs in the monomeric state have a great tendency to be converted into nucleases to trigger apoptosis. SAHH requires a steroid factor to assume a configuration favorable for the formation of dimeric enzyme complex with MT, which is then in a position to form ternary enzyme complex with MAT. In steroid hormone target tissues such as prostate and breast, steroid hormones are the stabilizing factors of SAHH. Other tissues require similar steroid factors generated by the growth signals to stabilize SAHH [7]. In normal cells, steroid factors are the dominant factors to regulate methylation enzymes. In cancer cells and telomerase expressing primitive stem cells such as embryonic stem cells and progenitor stem cells, MAT is associated with telomerase [8], which becomes the dominant factor to regulate methylation enzymes. The association of MATL, the low Km normal isozyme of MAT, with telomerase changes the kinetic properties of MATL and the regulation of methylation enzymes. Km values of MATL and MATLT, the telomerase associated tumor isozyme, are 3 µM and 20 µM methionine, respectively, and those of SAHHL and SAHHLT are 0.3 µM and 2 µM adenosine, respectively [5, 6, 8]. The increased Km value of MATLT suggests that methylation enzymes of cancer cells have elevated levels of bound S-adenosylmethionine (AdoMet). According to Prudova et al. [9], the binding of AdoMet to a protein could protect that protein against protease digestion. It appears then that the increased pool size of AdoMet in cancer cells is very important for the stability, and therefore the activity of methylation enzymes to promote malignant growth. Chiba et al. [10] found that the pool sizes of AdoMet and S-adenosylhomocysteine (AdoHcy) shrunk greatly when cancer cells were induced to undergo TD. This finding strongly supports our arguments that the association of telomerase with methylation enzymes greatly increase the stability and the activity of methylation enzymes of cancer cells so that hypomethylation of nucleic acids required for the cell to undergo TD cannot take place [6,11]. Thus, it is very convincing that abnormal methylation enzymes play a critical role on the evolution and the progression of cancer.

Association of telomerase with methylation enzymes locks methylation enzymes in extremely stable and active state to block cell differentiation. Telomerase is actively expressed in embryonic stem cells and progenitor stem cells. Differentiation of telomerase expressing normal stem cells will be blocked like cancer cells. There is another way to achieve DNA demethylation bypassing the differentiation blockade created by abnormal methylation enzymes. Tet dioxygenases carry out oxidation of 5 mC to generate 5 hmC, 5 fC and 5 caC [12–15], and 5 caC is finally replaced with C by thymine DNA glycosylase [16,17]. 5 hmC is the stable intermediate in the oxidative demethylation of 5 mC [18]. So far three Tet dioxygenases have been identified. Tet 1 preferentially acts on the 5 mC located at the transcriptional start site, whereas Tet 2 preferentially acts on the 5 mC located in the gene body [19]. Tet 3 is expressed at very high levels in oocytes and zygotes, with rapidly declining at the two cell stage. Tet 3 is responsible for the erase of paternal 5 mC in fertilized oocytes [20]. Tet enzymes are very active in embryonic stem cells to direct extraembryonic lineage differentiation [21,22]. These enzymes are frequently mutated to become dysfunctional or silenced in cancer cells [23–26]. The expression and function of Tet enzymes marks the difference between normal primitive stem cells and cancer cells. Consequently, destabilization of abnormal methylation enzymes is the only option workable to induce TD of cancer cells.

Destabilization of abnormal methylation enzymes is a very effective strategy for cancer therapy. The therapy of acute promyelocytic leukemia (APL) with RA yielded a stunning complete remission around 90% [27]. The remission, however, was only transient. Most patients relapsed within a year, and became resistant to further treatment [28, 29]. A combination of RA and As2O3 produced a more satisfactory long lasting remission [29]. RA is a DI, and As2O3 is a DHI [7]. DI is the chemical capable of eliminating the association of telomerase from abnormal methylation enzymes, and DHI is the inhibitor of individual enzymes of ternary methylation enzymes. It appears then that a combination of DI and DHI is necessary to make a perfect drug for cancer therapy. DHI alone can be very effective for cancer therapy too. After all, human body is producing DIs, although cancer patients are unable to retain such valuable metabolites in the body. Excess DHI can salvage the loss of endogenous DIs. Imatinib mesylate is the standard care for chronic myeloid leukemia [30], which is another good example of effective cancer therapy by destabilization of abnormal methylation enzymes. Signal transduction inhibitors such as imatinib mesylate are excellent DHIs [7]. Phenylbutyrate was our creation of the first DHI which was only modestly active requiring mM concentrations to function,[31]. Nevertheless, it has demonstrated therapeutic efficacy on often untreatable brain tumors [32,33]. Brain compartment is protected by blood brain barrier. The loss of endogenous DIs is not as severe as other body compartments. Therefore, even modest DHIs can exercise good therapeutic effects. The therapeutic effect of phenylbutyrate was greatly enhanced when it was used in combination with signal transduction inhibitors [34,35], which were much better DHIs effective in µM concentrations [7]. DHIs, such as dietary polyphenols, are frequently suggested for chemoprevention of cancer [36–39].

In 1987, Liau et al. [40] brought up chemosurveillance as a natural defense mechanism against cancer. This hypothesis was based on the observation that healthy people could maintain a steady level of hydrophobic metabolites in their plasma, whereas cancer patients tended to show deficiency of such metabolites due to excessive urinary excretion [41]. Among such metabolites are chemicals capable of inducing cancer cells to undergo TD [42,43]. The evolution of cancer in the case of MDS strongly supports the validity of this hypothesis.

MDS often starts with a display of immunological disorders associated with inflammation [44], which prompts the production of inflammatory cytokines. Among such cytokines, TNF is a critical factor related to the development of MDS [45]. It causes excessive apoptosis of bone marrow stem cells, thus severely affects the ability of the patient to produce hematopoietic cells such as erythrocytes, platelets, and neutrophils. TNF is also named cachectin, because of its involvement in the symptom known as cachexia. Cachexia is a symptom commonly shared by inflammatory patients and cancer patients. A characteristic disorder of cachexia is the excessive urinary excretion of low molecular weight metabolites because of vascular hyperpermeability cause by TNF [46,47]. As a consequence, chemosurveillance normally operating in healthy people to keep a check on progenitor stem cells is disrupted under pathophysiological conditions created by TNF to allow progenitor stem cells to buildup in order to replenish unipotent stem cells wiped out by TNF. The high levels of telomerase in the peripheral and bone marrow leukocytes in MDS patients is an indication of the widespread multiplication of progenitor stem cells which express telomerase [48,49]. During the course of MDS progression, mutations on Tet2, DNMT3A, IDH1/2, ASXL1, EZH2, and RNA splicing enzymes are frequently observed [50–54], which may play a significant role on the evolution of progenitor stem cells to become CSCs [55]. As anemia symptom becomes worse, chromosomal abnormalities such as translocation and deletion characteristic of cancer cells set in to speed up replication eventually pushing MDS patients to become acute myeloid leukemia patients [56–59].

Vidaza and decitabine are the two hypomethylating agents approved for the therapy of MDS in the USA. CDA-2 is a hypomethylating agent approved by China for the therapy of cancer,[60]. Vidaza and decitabine achieve DNA hypomethylation by promoting covalent bond formation between DNA Methyltransferase (DNMT) and the azacytosine base incorporated into DNA to titrate out DNMT [61], whereas CDA-2 achieves DNA hypomethylation by converting abnormal methylation enzymes into normal enzymes [6,43]. An aborted clinical trial of CDA-2 on MDS was conducted on 117 patients in China. Based on two cycles of treatment protocols, CDA-2 yielded a slightly better therapeutic efficacy under cytological evaluation, and a marked better therapeutic efficacy under hematological improvement evaluation in comparison to vidaza and decitabine,[62, 63]. Apparently CDA-2 had a better therapeutic effect and devoid of serious adverse side effects, whereas decitabine was a proven carcinogen [64]. Since MDS is a disease attributable to CSCs [55], synthetic CDA formulations ought to do well on CSCs.

CSCs constitute only a small subpopulation within a tumor. These cells, nevertheless, are now thought to confer many of adverse characteristics that contribute to treatment failure,[65–69]. Many biological characteristics that enable cancer progression are attributable to CSCs, including angiogenesis, metastasis, recurrence, and drug resistance. Elimination of CSCs is, therefore, very critical to the success of cancer therapy. CSCs are both resistant to cytotoxic chemotherapy and radiotherapy, because these cells overexpress ATP binding cassette drug pumps, and are mostly in dormant state unresponsive to radiation [70–73]. CSCs are equivalent to progenitor stem cells of normal organs or tissues, which replicate only in response to developmental or pathological needs, e.g. growth or wound healing. Thus, CSCs are very responsive to induction of differentiation, which may be the most effective approach to target CSCs.

The objective of this study is to use CDA-2 as a model to develop synthetic CDA formulations for the prevention and therapy of cancer via targeting of CSCs. CDA-2 is a preparation of natural hydrophobic metabolites purified from freshly collected urine by reverse phase chromatograph [74]. We have carried out extensive studies on DHIs of CDA-2 [7,31,74–77]. We are now focusing on DIs of CDA-2, which are the most important active components of CDA-2. When DIs becomes available, we will be in a position to solve problems brought up by CSCs.

Methods and Materials

Chemicals and Reagents

Chemicals, chromatographic supplies, and cell culture supplies were purchased from Sigma, St. Louise, MO, unless otherwise indicated. 35×10 mm cell culture dishes were purchase from CytoOne, USA Scientific. Com. Sep-Pak C18 cartridges were purchased from Walters Associates, Milford, MA. Cosmocil C18 column was purchased from Nacalai Tesque, Kyoto, Japan. Acidic pentapeptides were purchased from GenicBio Company of Shanghai, China. 1.5 liter of CDA-2 solution, 304 mg/ml, was a gift of Mr. Zhanji Sun, the general manager of NT Pharmaceuticals, Jiangsu Co. Ltd, China.

Culture of HL-60 Cells

HL-60 cells were purchased from ATCC, Manassas, VI, which were initially maintained in ISCOVE’s modified medium, supplemented with 10% fetal bovine serum, 2 mM glutamine, 50 units/ml penicillin-50 µg/ml streptomycin for a few generations, and then transferred to RPMI 1640 medium to replace ISCOVE’s modified medium. Cells were subcultured every 3 to 4 days at an initial concentration of 5–10 × 104 cells/ml.

NBT assay

NBT assay was conducted as previously described [7]. Each 35×10 mm cell culture dish contained 2 ml of RPMI 1640 culture medium. HL-60 cells at an initial concentration of 5–10 × 104 cells were incubated with or without drugs for 3 days. Approximately 2.5×10⁵ cells were precipitated at 600xg for 5 min. The cell pellet was suspended in 3 drops from a Pasteur pipet of NBT reagent consisting 1 mg NBT and 5 µg TPA per ml Hank balanced salt solution (HBSS), and incubated at 37o C for 30 min. The reaction was terminated by the addition of a drop from a Pasteur pipet of 4% paraformaldehyde in HBSS. NBT + cells were counted under microscope using a hemacytometer.

Determination of potency of DHIs

The potency of DHIs was assessed by the reductive index as previously described [7]. Cell culture dishes were divided into several sets of 5 dishes containing RA of different concentrations to induce between 0 to 60% NBT + . One set had RA alone as control to yield Effective Dosage50 (ED50) of RA. Other sets had different concentrations of DHIs together with RA concentrations matching the control set. After incubation at 37o C for 72 h, cell numbers from each dish were counted, and an aliquot was withdrawn for NBT assay as above described. NBT + cells in the control dishes without any drug were always below 1%. In the presence of different DHIs alone, NBT + cells in general were below 10%. The respective control value was subtracted from each experimental value to yield the actual ED value. ED50 value, defined as the dosages that induced 50% NBT + cells, were estimated from plots of NBT + values versus concentrations of RA in the absence and presence of DHIs. The Reductive Index (RI) is defined as the ED50 in the presence of DHI divided by the ED50 value of RA alone. The value is inversely related the effectiveness of the DHI agent.

Bio-Gel P2 gel filtration

DIs preparation in less than 4 ml was put onto a Bio-Gel P2 column, 2.5×95 cm for gel filtration resolution. The elution was carried out by 25 mM phosphate buffer, pH 7.8, collecting 4.2 ml/tube/5 min. An aliquot from each tube was withdrawn to dilute with 1 ml of H2O for the determination of A280 absorption, and another aliquot was withdrawn from the filtrate of 0.2 µm membrane filter for the determination of NBT + .

TLC Chromatography

DIs of different Kav fractions from Bio-Gel P2 gel filtration were recovered by C18 cartridge. The fraction was acidified to pH 2.5 and passed the solution through a C18 cartridge. The cartridge was washed twice with 5 ml H2O, and then eluted with 3 ml of 80% methanol. The methanol eluant was evaporated to dryness in a rotary evaporator. The residue was dissolved in a small amount of methanol to apply to a plate of silica gel. The chromatography was developed by ascending chromatography with BuOH-HoAc-H2O (9:2:4) for 8 h to allow the solvent to travel for 17.5 cm from the origin. The silica plate was air dried in a hood overnight. UV images were marked by a pencil. The bands were scraped off the plate with a spatula to put into centrifuge tubes for the extraction with methanol. The methanol extract was evaporated to dryness in a rotary evaporator, and the residue was dissolved in a small amount of methanol for the determination of A280 and NBT + .

Sephadex LH20 Chromatography

A methanol solution of DI subfraction in less than 4 ml was put onto a Sephadex LH20 column, 2.5×36 cm, for chromatography. The elution was carried out by methanol, collecting 2.8 ml/tube/2 min. An aliquot from each tube was withdrawn to dilute with 1 ml of methanol for the determination of A280 absorption, and another aliquot was withdrawn for the determination of NBT + .

DEAE-Sephadex Chromatography

An aqueous solution of DI subfraction with NaCl concentration less than 25 mM and pH 7.8 was put onto a DEAE-Sephadex column, 1.4×27 cm, for chromatography. The column was initially washed with H2O until A280 absorption was no longer detectable. The column was then eluted with 160 ml of a linear gradient of NaCl from 0 to 2 M, collecting 4 ml/tube/4 min. An aliquot from each tube was withdrawn to dilute with l ml of H2O for the determination of A280 absorption, and another aliquot was withdrawn from the filtrate of 0.2 µm membrane filter for the determination of NBT + .

HPLC

A 50 µl of active DI preparation was injected into a Cosmosil (5C18-RA-II) column, 4.6×250 mm, for HPLC resolution using Hewlett Packard 1050 instrument. The flow rate was set at 0.5 ml/min. The elution during the initial 10 min was carried out by a linear gradient of solution A (5% HoAc) from 100% to 0%, and solution B (80% methanol) from 0% to 100%. Thereafter, the column was eluted with solution B until no more A280 absorption was detectable. HPLC fractions were evaporated to dryness in a rotary evaporator. The residue was redissolved in a small volume of methanol for the determination of NBT + .

Mass Spectroscopy

HPLC purified DHI from CDA-2 was injected into LC-MS instrument for the determination of mass.

Results

Purification of DIs from CDA-2 solution

Obviously active DIs and DHIs of CDA-2 are making a significant contribution to protect the vast majority of healthy people from becoming cancer patients. We ought to study these active metabolites which are doing a big favor to benefit human being.

When CDA-2 solution, 304mg/ml, pH 6.7, was acidified to pH 2 with 2N HCl, 32% of A280 absorption and almost 100% of DIs were found in the sediment collected by centrifugation at 1200xg for 30 min. The sediment was 50 ml of very dark colored viscous liquid from 1.5 liter of CDA-2 solution. The sediment was first extracted 3 times with 2 volumes of dichloromethane in a flask by shaking overnight each time in a shaker. Dichloromethane extract was the orange solution of the upper phase, which was poured off the flask. Dichloromethane extracted 16.1% of the A280 absorption and 37.6% of the DI activity from the pH 2 sediment of CDA-2 solution. Next, the remaining sediment was dissolved in 5 volumes of methanol, and insoluble materials were removed by centrifugation at 1200xg for 30 min. Methanol extracted 69.7% of the A280 absorption and 60% of the DI activity from the pH 2 sediment of CDA-2 solution. Methanol insoluble residue was dissolved in dilute NaOH solution, and pH adjusted to 7.8, which constituted 14.1% of the A280 absorption and 2.4% of the DI activity of the pH 2 sediment of CDA-2 solution. DIs soluble in dichloromethane are very hydrophobic metabolites and DIs soluble in methanol are less hydrophobic.

Gel filtration profiles of DIs on Bio-Gel P2 column chromatography

Organic solvents of DI extracts were removed by rotary evaporator at temperature below 60o C. The residues were dissolved in dilute NaOH solution and pH adjusted to 7.8. 4 ml aliquot from each preparation containing approximate 100,000 A280 absorption units was put on a column of Bio-Gel P2 column for gel filtration as described in Methods and Materials. Dichloromethane extractable DIs have two major peaks at Kav = 0.43 and 0.52, and a minor peak at Kav = 1.45 as shown in Fig. 1. Kav = 0.43 and 0.52 are quite large molecular weight complexes.
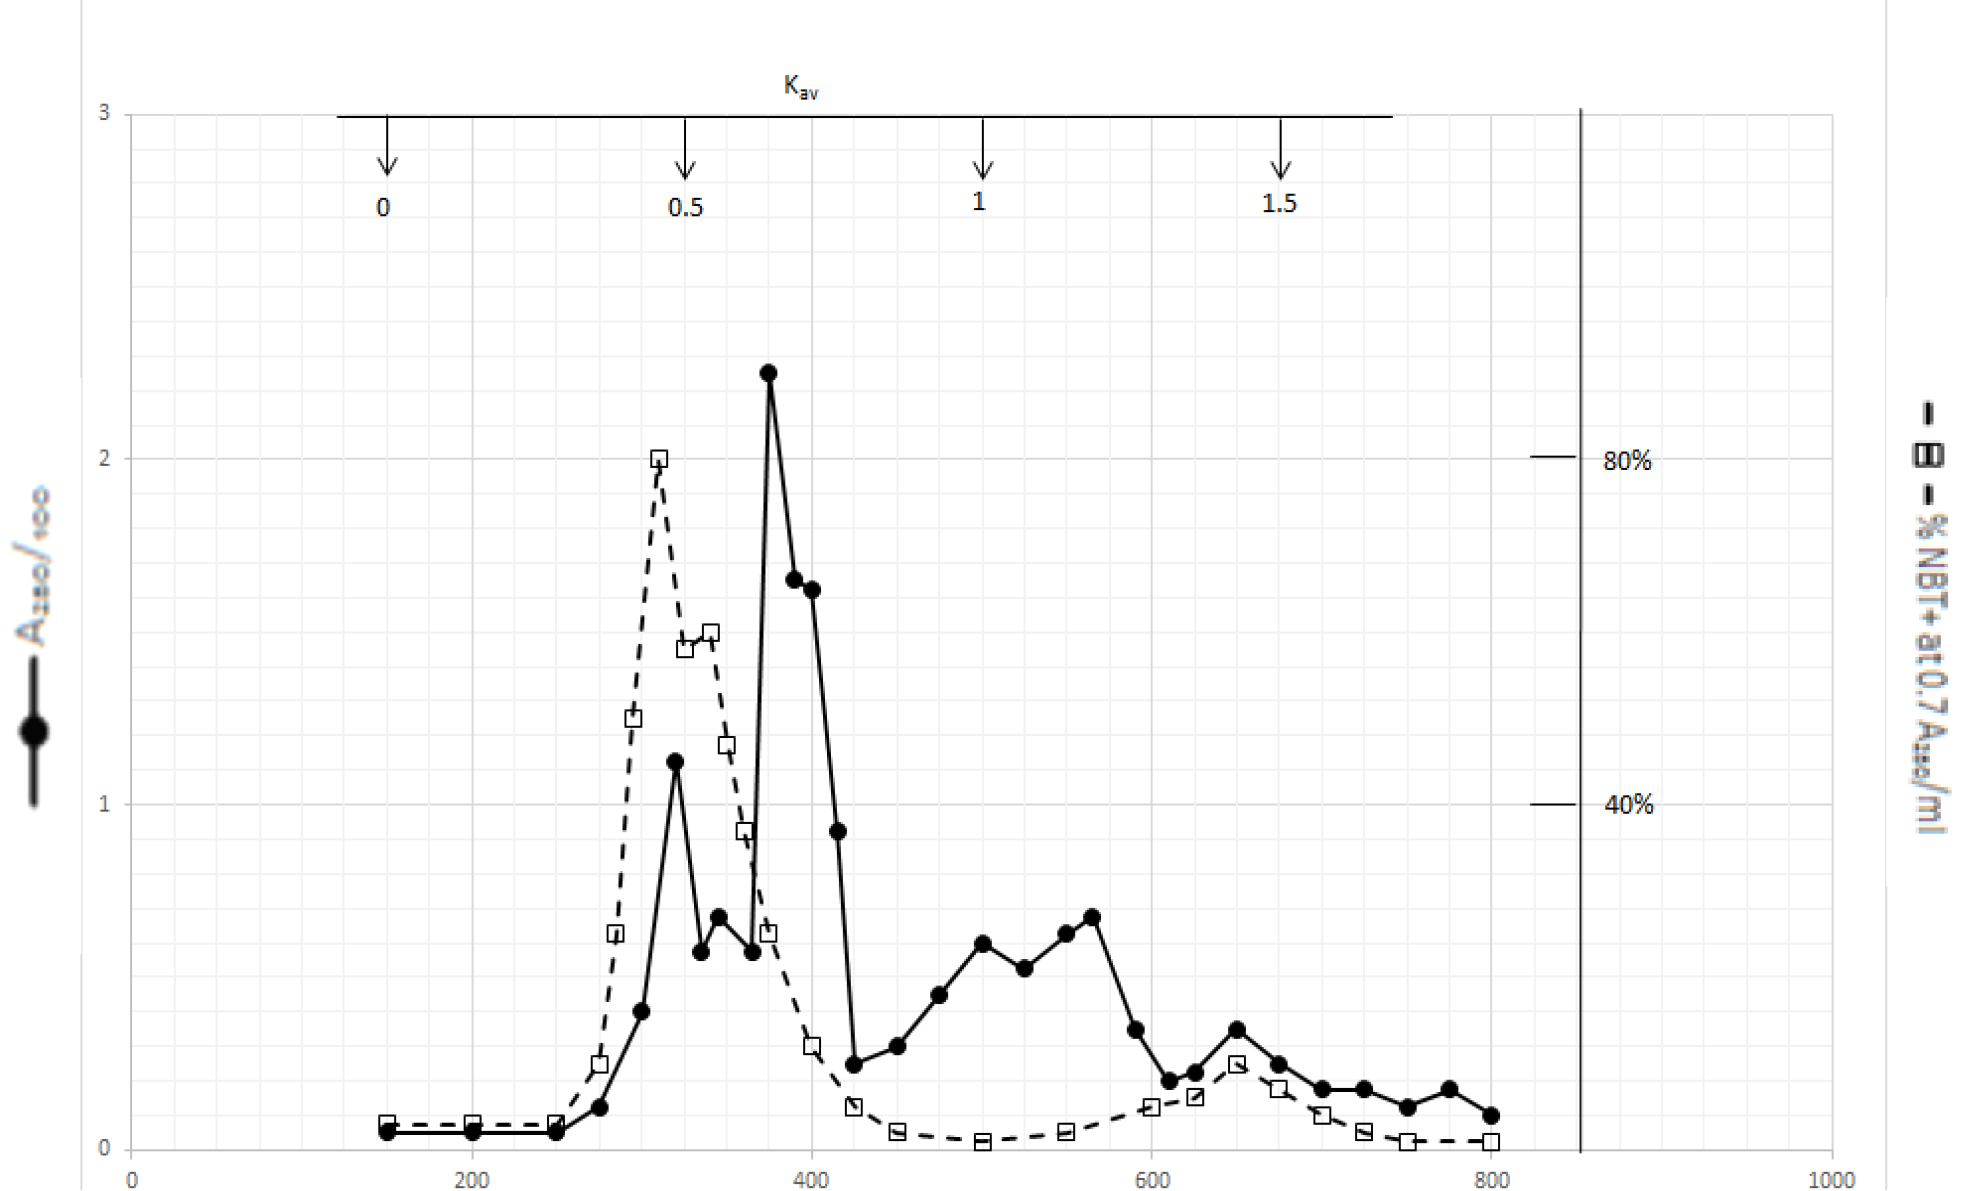
CST 2019-101 - Mingliau China_F1

Figure 1. Gel filtration profile of the dichloromethane extractable DIs of CDA-2

4 ml of dichloromethane extractable DIs of CDA-2 containing approximately 100,000 A280 absorption units were put onto a column of Bio-Gel P2 column for gel filtration as described in Methods and Materials.

Gel filtration profile of methanol extractable DIs is presented in Fig. 2. Methanol extractable DIs have a major peak at Kav = 0 and two minor peaks at Kav = 0.43 and 0.52 which are probably the major components of dichloromethane extractable DIs. DIs of Kav = 0 are even bigger than those of dichloromethane extractable DIs
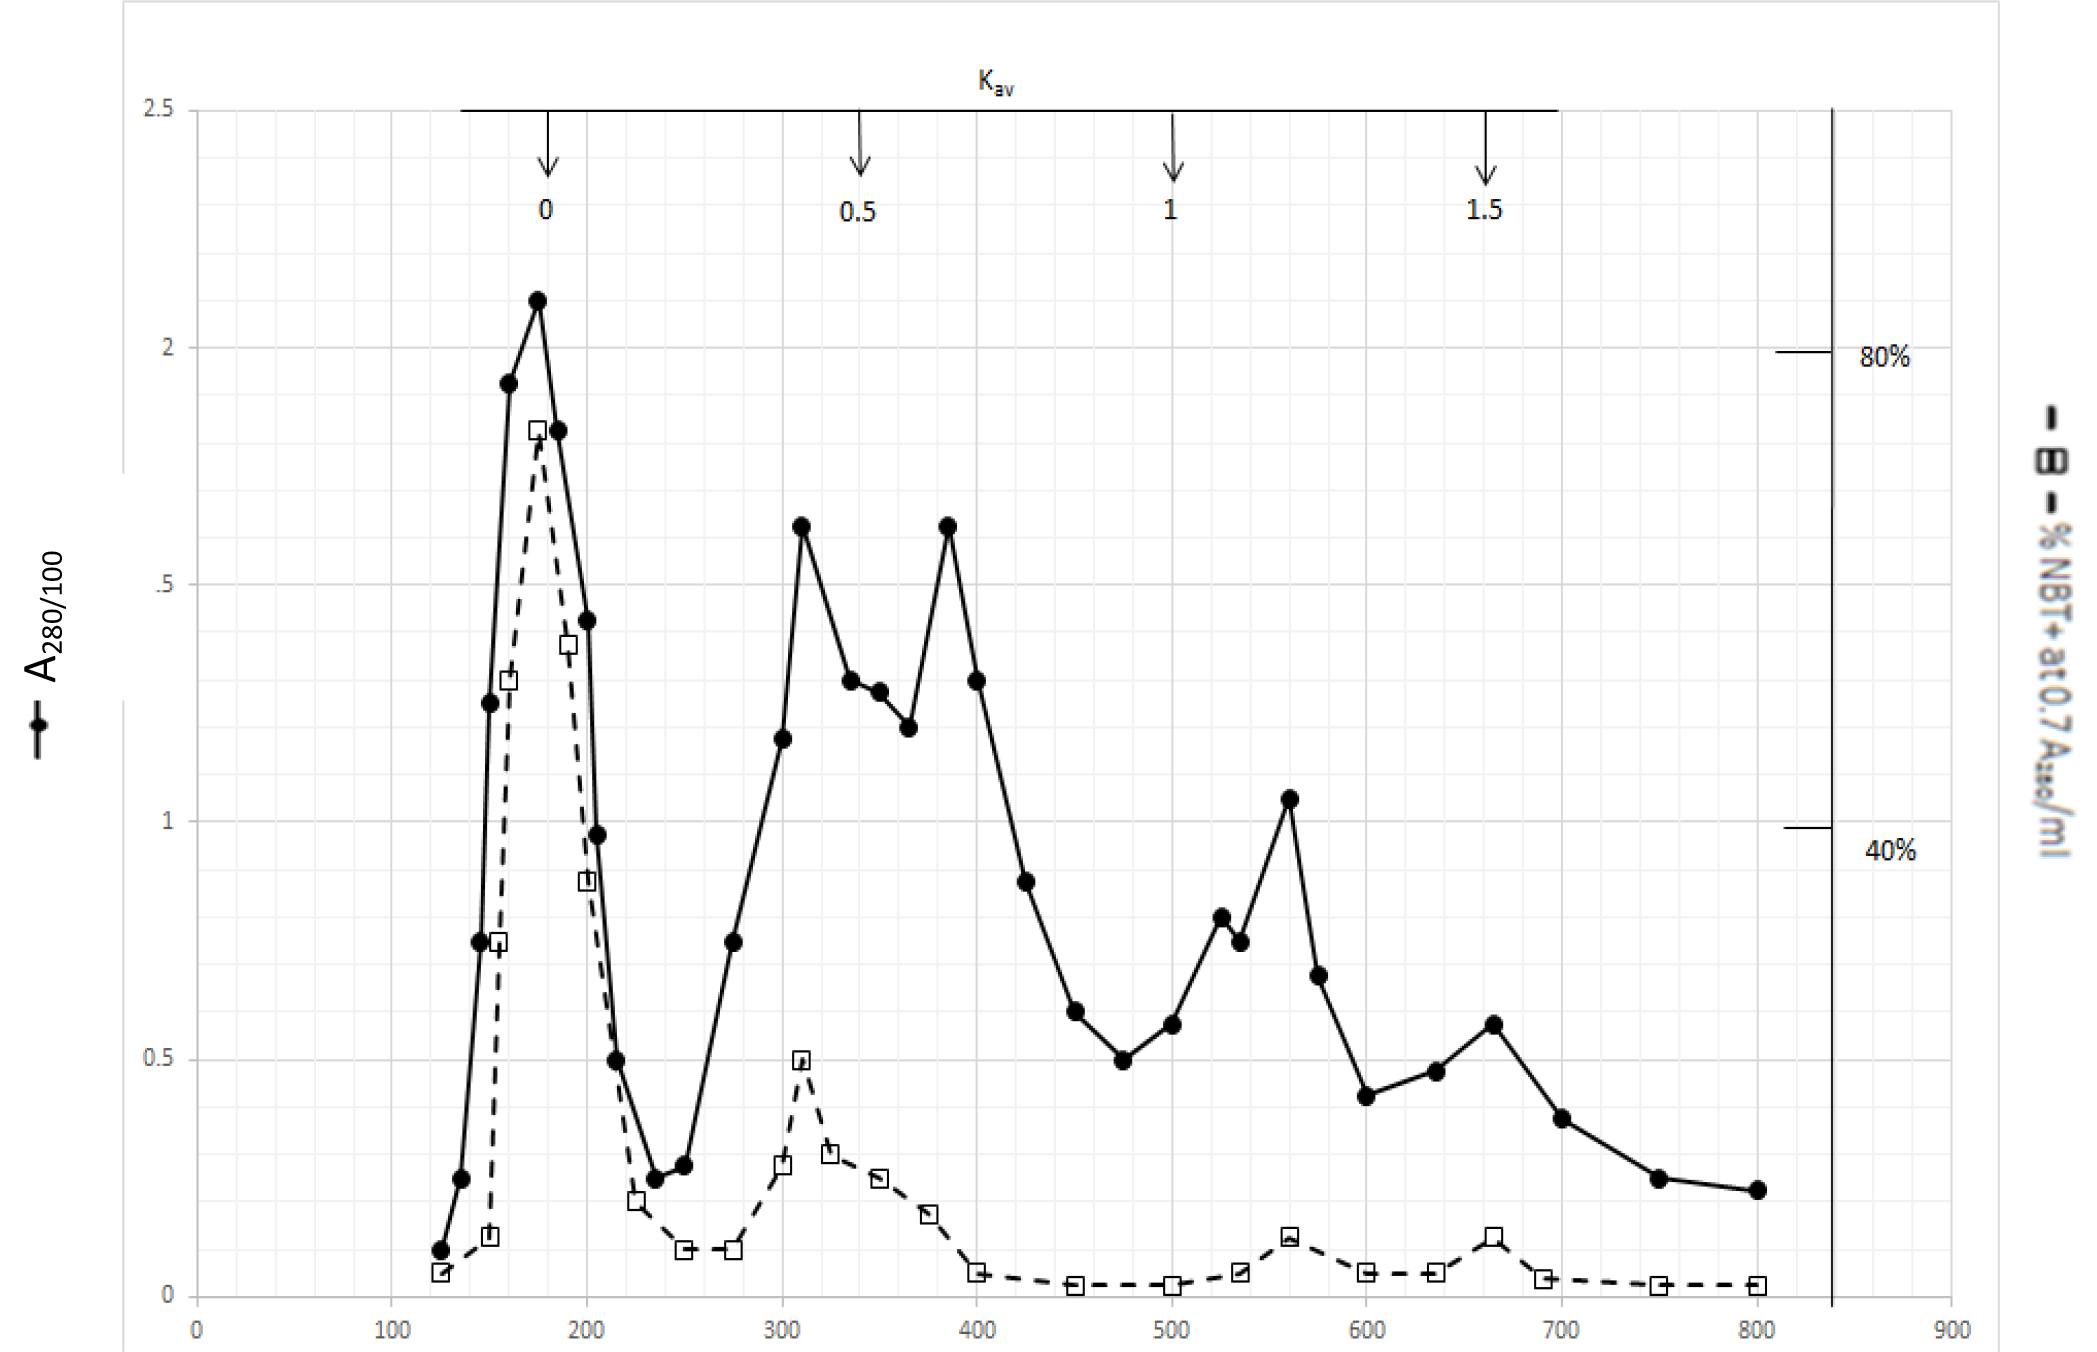
CST 2019-101 - Mingliau China_F2

Figure 2. Gel filtration profile of the methanol extractable DIs of CDA-2

4 ml of methanol extractable DIs of CDA-2 containing approximately 100,000 A280 absorption units were put onto a column of Bio-Gel P2 column for gel filtration as described in Methods and Materials.

The dark solution of the Kav = 0 of methanol extractable DIs produced scale-like dark precipitate and clear light color solution when the pH was acidified to 2 with 2N HCl. DI activities became dissociated from the dark inactive carrier when the precipitate was dissolved in 0.5N NaOH and incubated at 37o C as shown in Fig. 3.
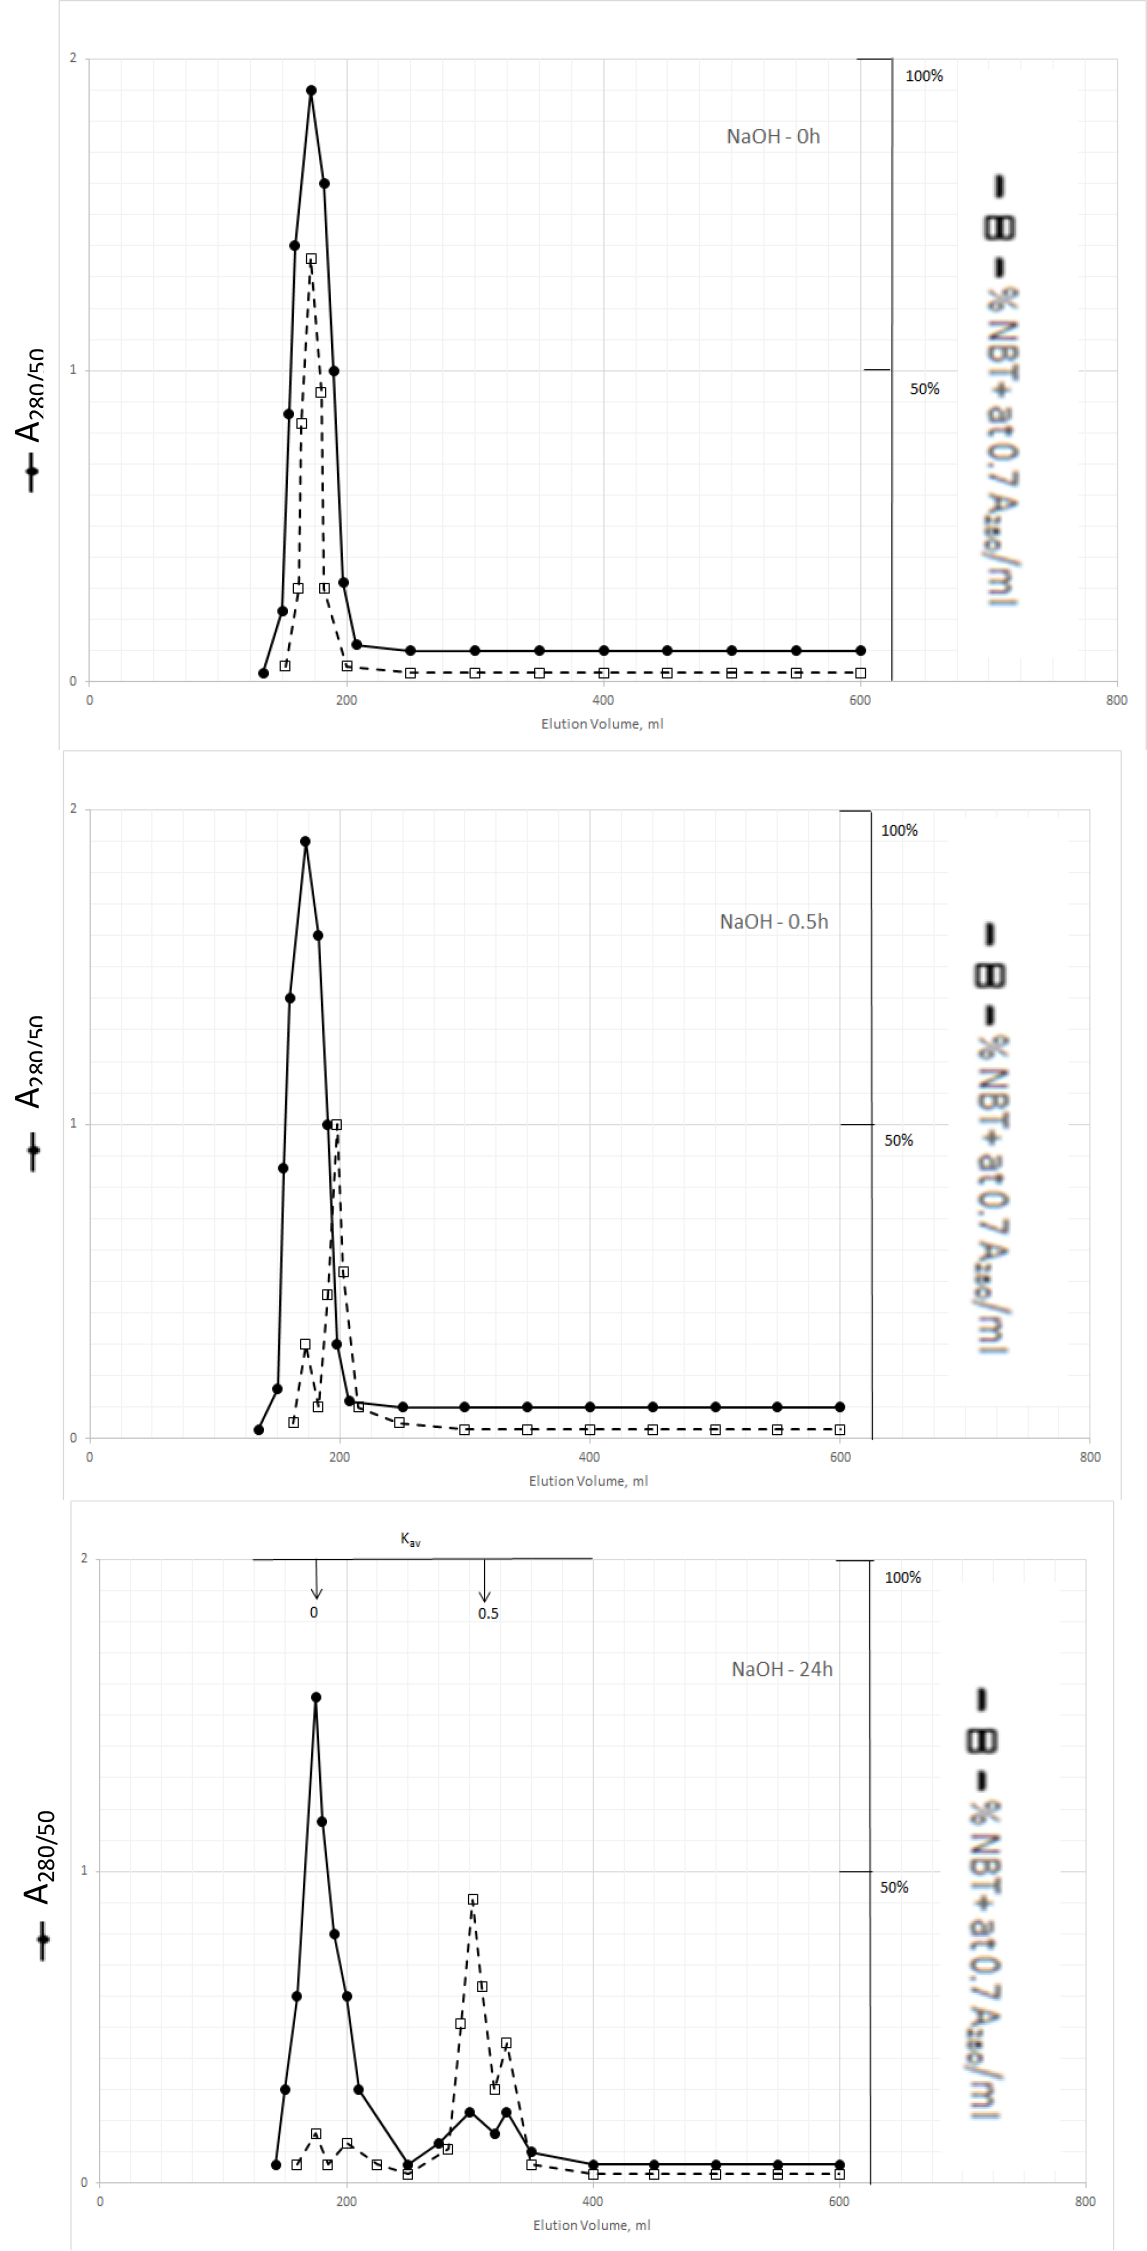
CST 2019-101 - Mingliau China_F3

Figure 3. Gel filtration profiles of the DIs of Kav = 0 of Fig. 2 upon incubation with 0.5N NaOH at 37o C

DIs of Kav = 0 were obtained from Fig. 2 by adjusting the active fractions to pH 2 with 2N HCl. The active DIs became scale like dark precipitate, which was collected by centrifugation at 1200xg for 30 min. The residue was dissolved in 6 ml of 0.5N NaOH, 2 ml aliquot containing a total of 1540 A280 absorption units was withdrawn to immediately adjusted to pH 7 for gel filtration as described in Fig. l. Another 2 ml aliquot was withdrawn after incubation at 37o C or 0.5 h to be neutralized for gel filtration. And the last 2 ml was neutralized for gel filtration after incubation at 37o C for 24 h.

The major DI peak shifted from Kav = 0 to Kav = 0,09 after incubation at 37oC for 0.5 h, and then to Kav = 0.43 and 0.52 after incubation for 24 h. The Kav = 0.43 and 0.52 DIs were extractable by dichloromethane when the solution was acidified to pH 2. It appears then that DIs of Kav = 0.43 and 0.52 are the major DIs of CDA-2. A good proportion of these DIs becomes covalently linked to the inactive carrier of Kav = 0 previously identified as pigment peptides,[43].

TLC chromatography of dichloromethane extractable DIs of CDA-2

Dichloromethane extractable DIs of CDA-2 from Fig. 1 were recovered by C18 cartridges and resolved by TLC as described in Methods and Materials. Result is presented in Table 1. Significant DI activities were widespread detectable from Rf = 0.15 to 0.92. Similar widespread activities were also found on DIs of Kav = 0.52. The only difference was the relative activity of different Rf bands. DIs of Kav = 0.43 had more DIs with higher Rf values. DIs of Kav = 1.45 were much simple. Rf = 0.57 band stood out as the only major active band. TLC data serve to indicate that DIs of Kav = 0.43 and 0.52 are complexes of multiple different DIs or a few limited DIs in association with multiple different DHIs or inactive materials.

Table 1. TLC chromatography of the Kav=0.43 DIs of Fig. 1

Rf

UV images

A280/ml

% Growth

% NBT +

0.95

Bright blue fluorescent

0.05

73

5.8

0.92

Gold fluorescent

0.16

59

22.8

0.86

Dark absorption

0.23

77

7.4

0.81

Gold fluorescent

0.21

54

15.8

0.74

Gold fluorescent

0.23

68

5.3

0.62

Gold fluorescent

0.19

90

11.6

0.57

Dark absorption

0.16

81

44.0

0.44

Bright blue fluorescent

0.15

47

17.5

0.34

Multiple narrow gold fluorescent

0.10

61

17.9

0.15

Weak gold fluorescent

0.05

73

11.5

0.08

Very weak gold fluorescent

0.05

85

4.3

Methanol solution of Kav=0.43 DIs of Fig. 1 was applied to a TLC plate for chromatography as described in Methods and Materials.

Sephadex LH20 Chromatography

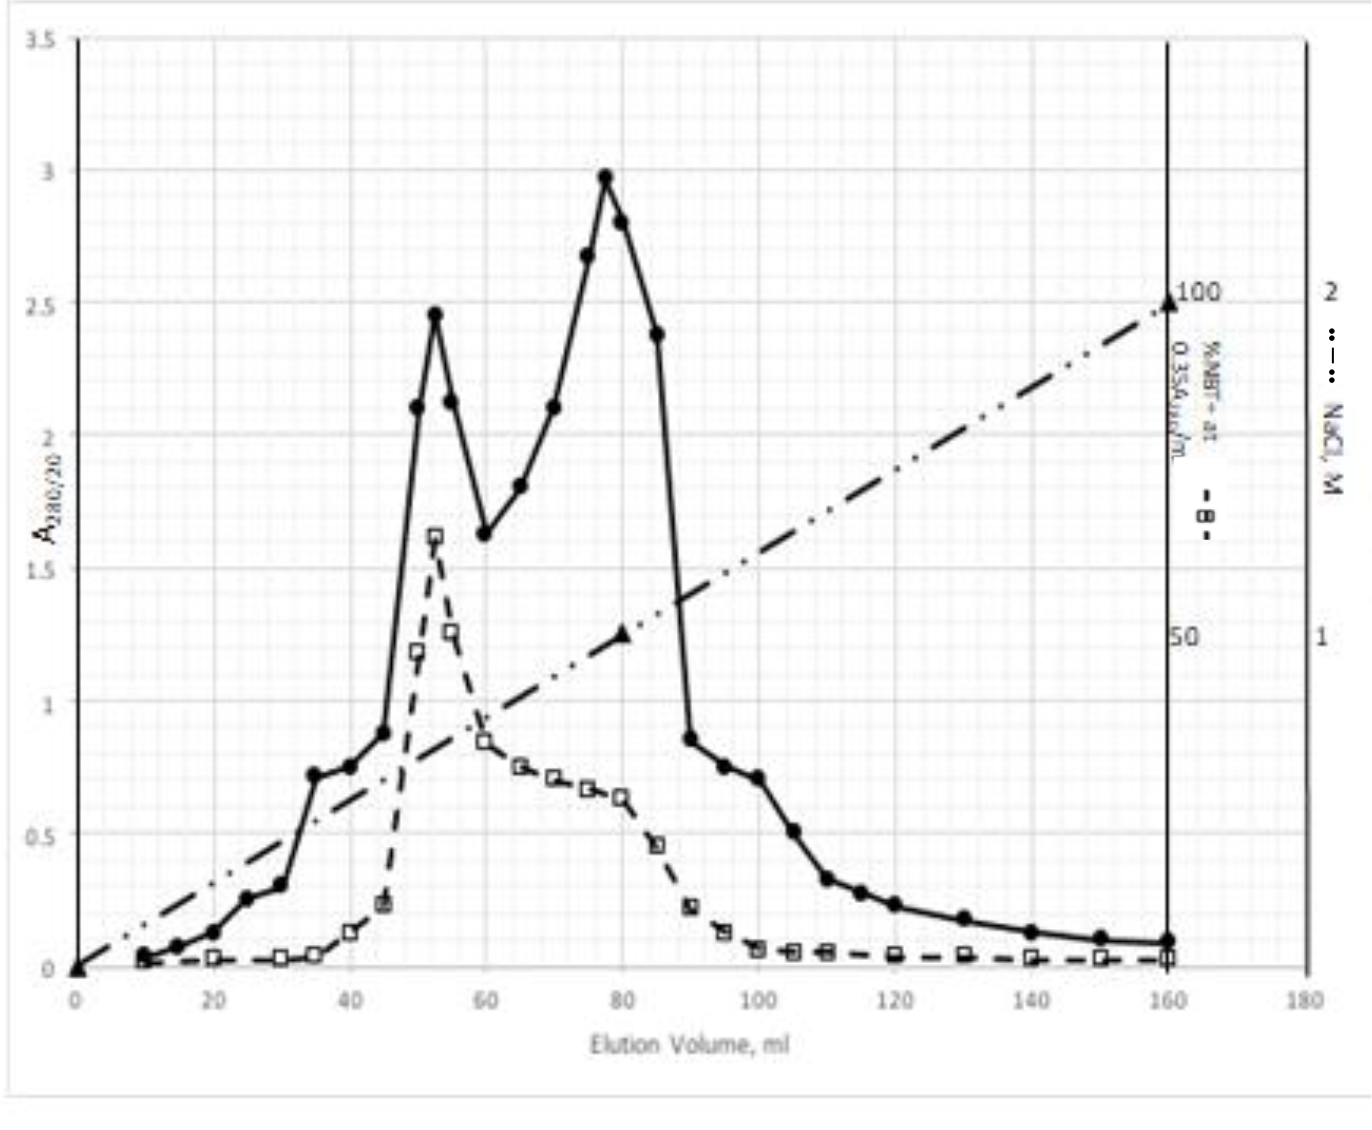
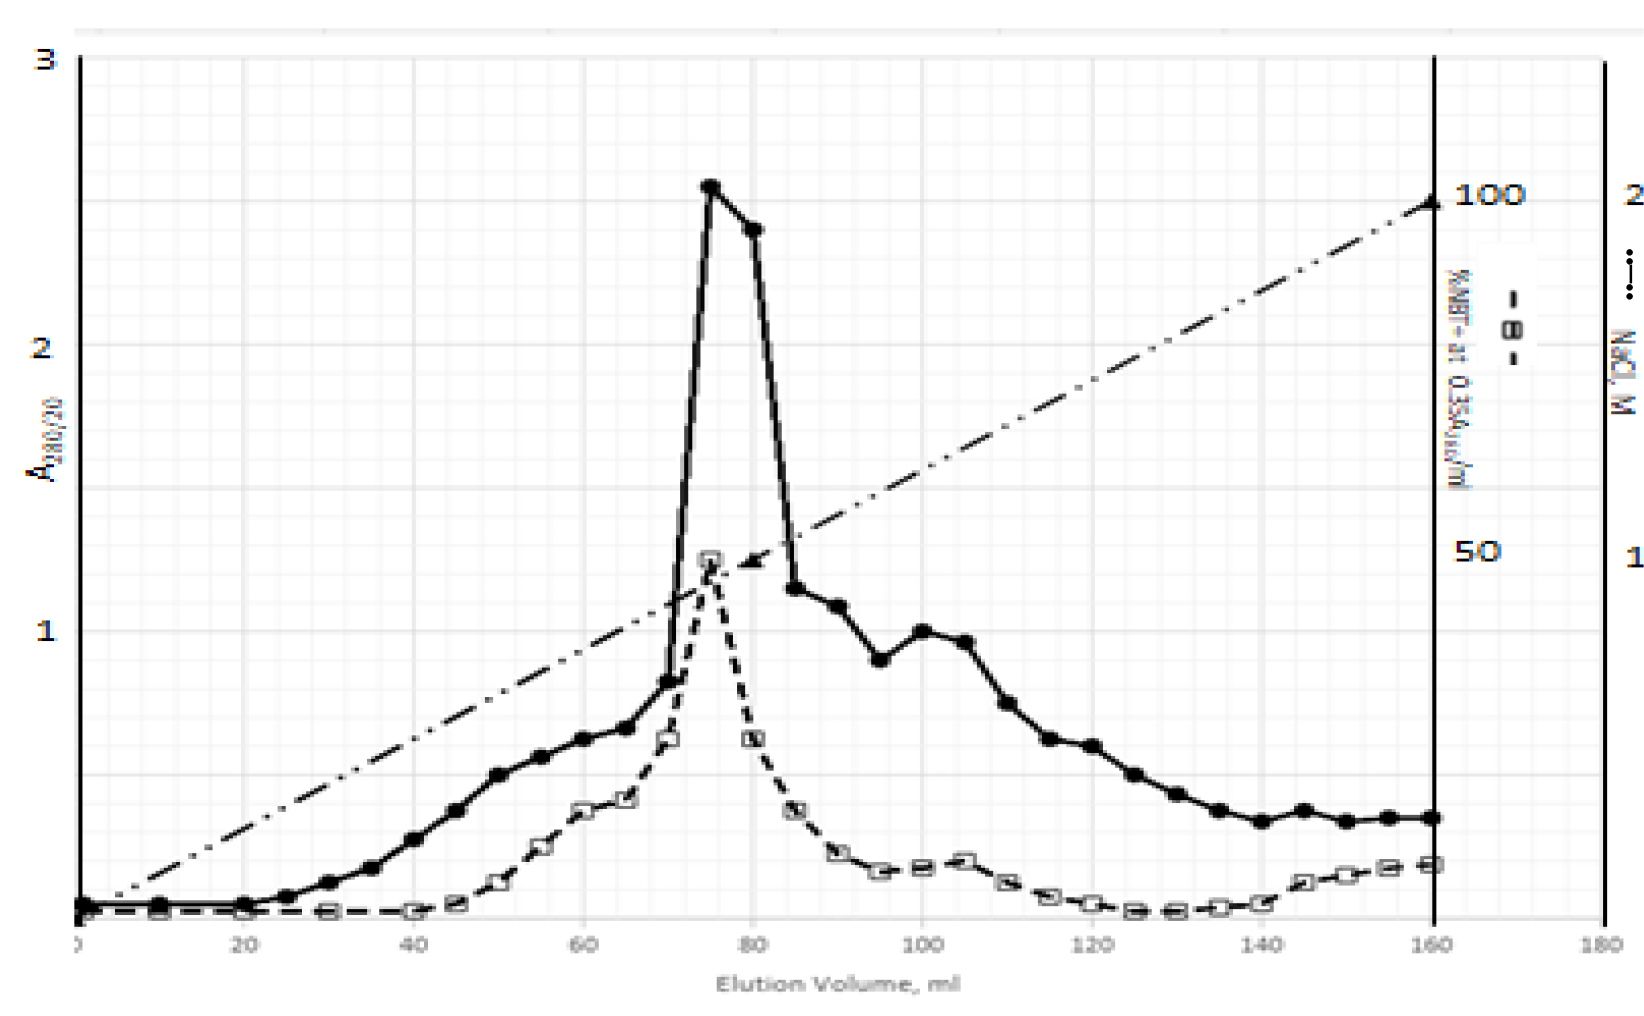
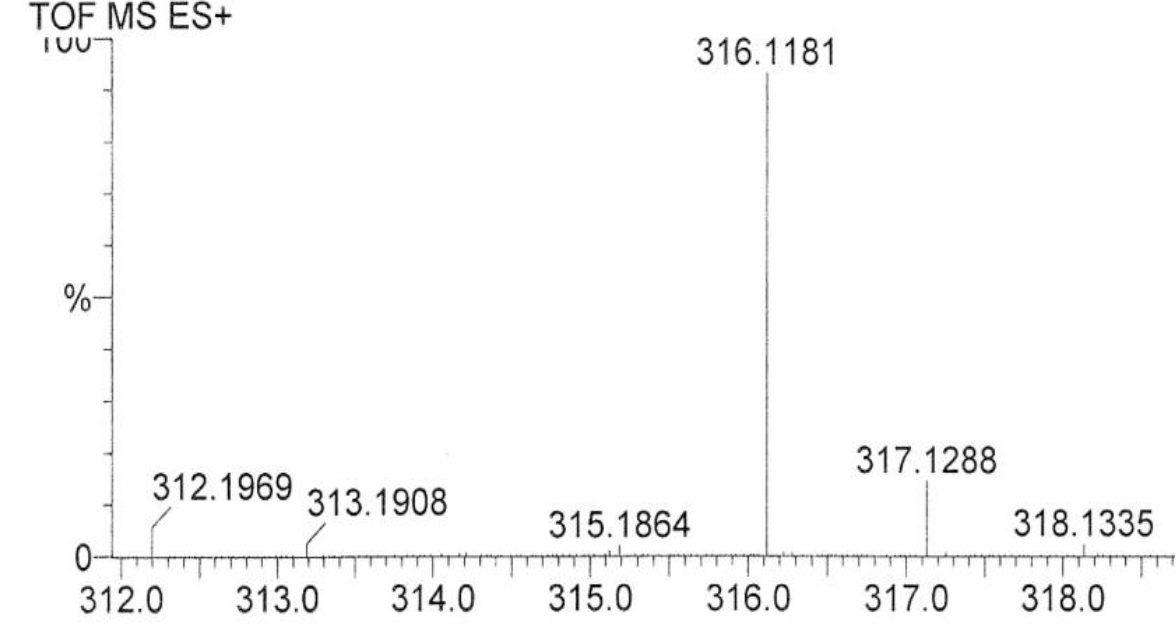
DIs of Kav = o.43 and 0.52 from Fig. 1 were recovered by C18 cartridges as above described. 4 ml of methanol solution containing approximately 25,000 A280 absorption units were put on a column of Sephadex LH20 column for chromatography as described in Methods and Materials. The chromatographic profile is shown in Fig. 4. Two active peaks similar to two Bio-Gel P2 peaks of Kav = 0.43 and 0.52 were found, one eluted between 150–180 ml, and the other between 180–210 ml. The separation of two peaks on Sephadex LH 20 chromatography appeared more clean cut than those on Bio-Gel P2 gel filtration. The active fractions of two peaks were pooled separately, and methanol was removed by rotary evaporator. The residue of each active fractions was suspended in 5 ml H2O, and 1N NaOH was added dropwise to bring pH up to 7.8 to dissolve the residue. NaOH soluble material gave rise to a total of 11, 500 A280 absorption units from 150–180 ml peak, and 5,500 A280 absorption units from 180–210 ml peak. These preparations were separately put on a column of DEAE-Sephadex for chromatography as described in Methods and Materials. DEAE-Sephadex chromatographic profiles are shown in Fig. 5 and 6. The 150–180 ml peak of Sephadex LH20 chromatography gave rise to two active fractions eluted between 0.55–0.75 M NaCl as a major peak and between 0.85–1.05 M NaCl as a minor shoulder peak. The 180–210 ml peak of Sephadex LH 20 chromatography produced a reverse profile: a minor shoulder peak between 0.55–0.75 M NaCl and a major peak between 0.85–1.05 M NaCl. When DEAE-Sephadex chromatographic fractions were stored at 4o C for more than 1 week, noticeable precipitate was found in active fractions from 0.55–1.05 M NaCl. The precipitate was inactive as DIs. The DI activity of the supernatant declined greatly to 22% of the original activity, which was restored to almost the original activity when enough precipitate redissolved in methanol was added back. Thus, the precipitate fits the description as DHI [31]. Upon purification by HPLC, the precipitate yielded a major UV peak at RT-19,1. The eluant of the RT-19.1 peak was evaporated to dryness by rotary evaporator, and redissolved in a small volume of methanol. Subsequent HPLC analysis showed a single RT-19.1 peak as shown in Fig. 7. The mass determination of the RT-19.l HPLC peak of Fig. 7 yielded a mass of 316.118 as shown in Fig. 8. This mass is very close to the mass of pregnenolone, which is 316.48.
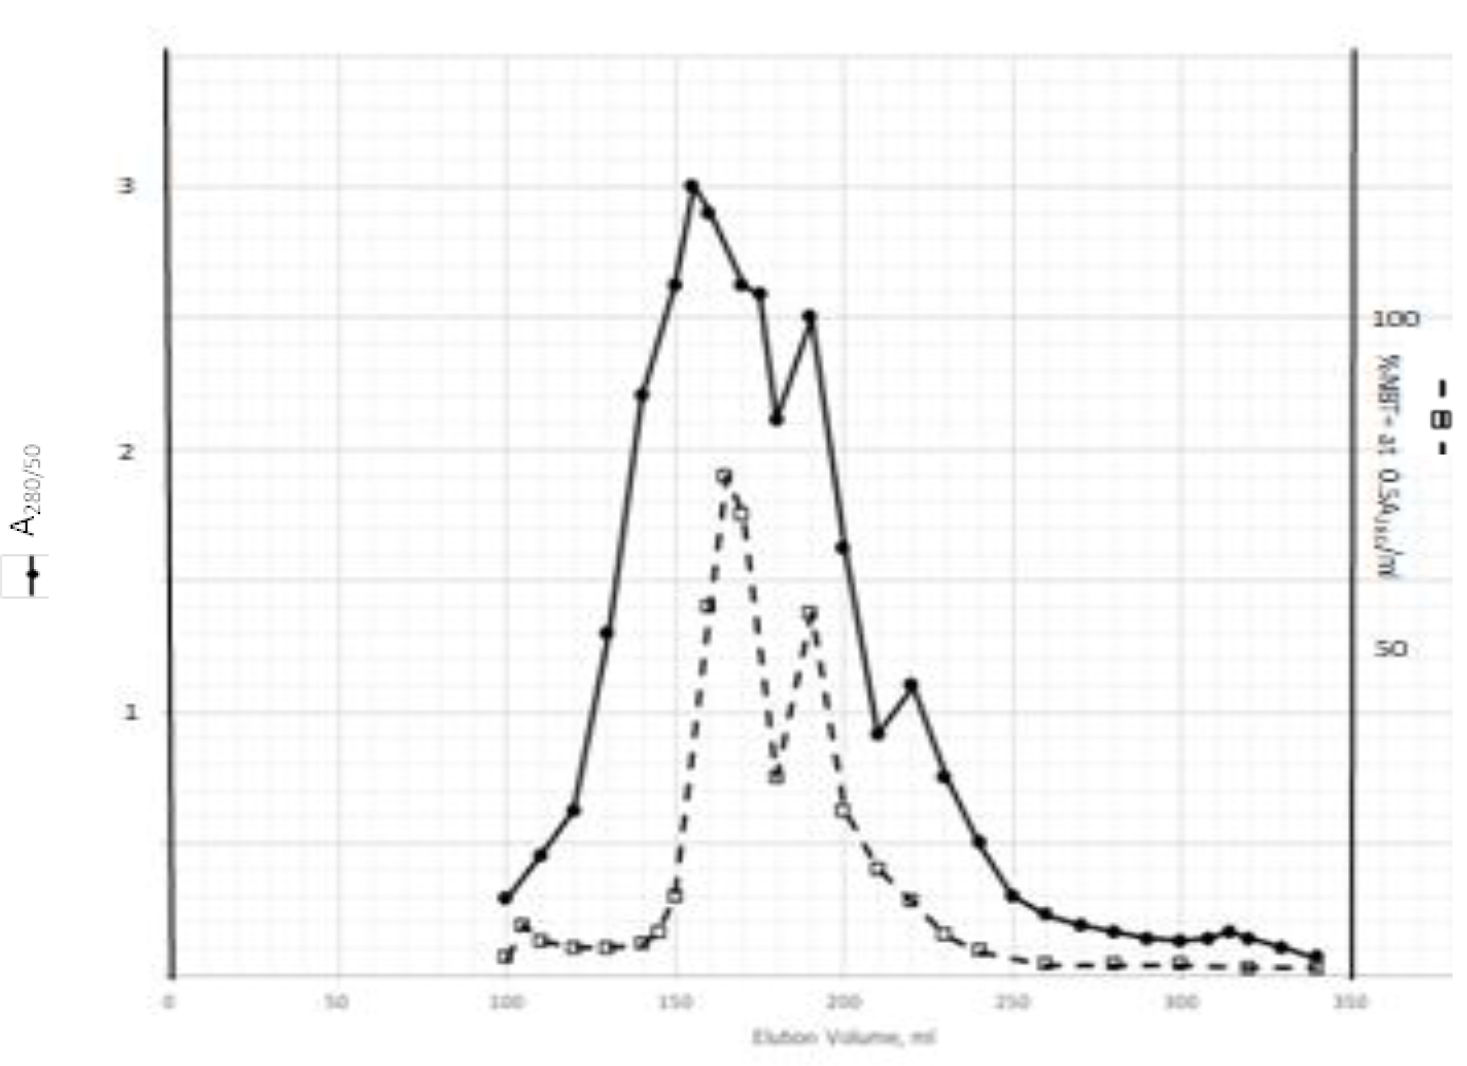
CST 2019-101 - Mingliau China_F4

Figure 4. Sephadex LH20 chromatography of Kav=0.43 + 0.52 pooled material of Fig. 1

Kav=0.43 + 0.52 of Fig. 1 were recovered by C18 cartridges as described in Methods and Materials. The residue was dissolved in methanol. 4 ml of methanol solution containing approximately 25,000 A280 absorption units were put on a column of Sephadex LH20 for chromatography as described In Methods and Materials. Two fractions eluted between 150–180 ml and 180–210 ml were separately pooled, and methanol was removed by rotary evaporation under vacuum.
CST 2019-101 - Mingliau China_F5

Figure 5. DEAE-Sephadex chromatography of the 150–180 ml peak of Sephadex LH20 chromatography

The residue of the 150–180 ml peak of Fig. 4 was dissolved in dilute NaOH, and pH adjusted to 7.8. 5 ml of this solution containing a total of 11,500 A280 absorption units were put onto a column of DEAE-Sephadex for chromatography as described in Methods and Materials. Active fractions eluted between 0.55–0.75 M NaCl and 0.85–1.05 M NaCl were separately pooled.
CST 2019-101 - Mingliau China_F6

Figure 6. DEAE-Sephadex chromatography of the 180–210 ml peak of Sephadex LH20 chromatography

The residue of the 180–210 ml peak of Fig. 4 was dissolved in dilute NaOH, and pH adjusted to 7.8. 5 ml of this solution containing a total of 5,500 A280 absorption units were put onto a column of DEAE-Sephadex for chromatography as described in Methods and Materials. Active fractions eluted between 0.55–0.75 M NaCl and 0.85–1.05 M NaCl were separately pooled.

CST 2019-101 - Mingliau China_F7

Figure 7. HPLC purification of the DHI dissociated from DI of CDA-2

The HPLC RT-19.1 peak was a major UV absorption peak of the precipitate from the eluant of 0.55–0.75 M NaCl of DEAE-Sephadex chromatography shown in Fig. 5. On final analysis, it yielded a single peak at RT-19.1. HPLC was carried out as described in Methods and Materials.
CST 2019-101 - Mingliau China_F8

Figure 8. Mass spectroscopy of the RT-19.1 peak of HPLC

An aliquot of the methanol solution of the material purified to a single HPLC peak shown in Fig. 7 was injected into LC/MS instrument for the mass determination as described in Methods and Materials.

Confirmation of the HPLC RT-19.1 peak of CDA-2 as pregnenolone

Pregnenolone obtained from Sigma was dissolved in methanol to make 1.5 mg/ml, namely 4.74 mM. The A280 absorption is very low, which is 0.054/mM. The solution gave a HPLC peak at RT-19.1. When RT-19.1 peak of CDA-2 was mixed with Sigma pregnenolone, the mixture gave a single peak at RT-19.1. The potency of the HPLC RT-19.1 of CDA-2 as DHI was exactly the same as that of Sigma pregnenolone as previously reported, [7], namely 7.16 µM. It is obvious that pregnenolone is a component of active liposomal DIs of CDA-2.

Acidic pentapeptides of hemoglobin as DIs

We have tried to capture DIs in the supernatant of DEAE-Sephadex active eluants. The significant A280 absorption peaks of HPLC were all inactive as DI. We thus concluded that DIs of CDA-2 might not have A280 absorption. We have previously found that acidic peptides of the urine were active Dis [42]. We had reason to believe that plasma and urinary peptides were primarily the degradative products of endogenous proteins, because peptide profiles among different persons were similar, and those profiles were most close to the peptide profile of the spleen extract [40,41]. It is well known that erythrocytes are constantly turning over, and spleen is the organ to degrade dead erythrocytes. We assumed that the active acidic peptide of CDA-2 might be the degradative products of hemoglobin. Taking cue from the discovery of an acidic pentapeptide to modulate hemopoiesis by Laerum and Paukovits [78], we randomly picked pentapeptides containing at least two acidic amino acid residues from the sequences of α- and β-hemoglobin for synthesis to test their activities as DIs. Indeed, acidic pentapeptides of hemoglobin were active as DIs as shown in Table 2, although the activities were only modest.

Table 2. DI activity of synthetic acidic pentapeptides

Designation

Sequence

ED25, µM

5P-1

Ala-Glu-Ala-Leu-Glu

122±32

5P-2

Val-Asp-Glu-Val-Gly

154±28

5P-3

Val-Asp-Asp-Met-Pro

174±55

5P-4

Asp-Pro-Glu-Asp-Phe

207±42

PA-5P-4

PA-Asp-Pro-Glu-Asp-Phe

161±33

5P-5

Pro-Glu-Glu-Lys-Ser

415±76

Synthetic acidic pentapeptides were dissolved in 80% methanol for the test of DI activity. The dosages were selected to give ED between 20 and 30% NBT + . ED25 was obtained from the plots, and expressed as mean±S. D. from at least two experiments.

The combination of RA and acidic pentapeptides produced additive effect, whereas the combination of RA and DHIs produced synergistic effect as previously reported [7,31,76,77].

RA is a well known DI, which requires retinoic acid receptor {RAR} to activate oligoisoadenylate synthetase [79], and the product of this enzyme, oligoisoadenylate, is the responsible DI to initiate differentiation induction [6]. Oligoisoadenylate has to be synthesized inside the cell to function, because 5’ terminal triphosphate prohibits it to be absorbed from outside. Therefore, RA is only effective on cells expressing RAR. RARs are expressed on developmental stages of embryonic cells [80], in pluripotent stem cells to regulate organ and limb development [81], in CSCs [82–84], and in certain cancers such as APL [27], acute myeloid leukemia [85], neuroblastoma [86], breast cancer [87], and melanoma [88].

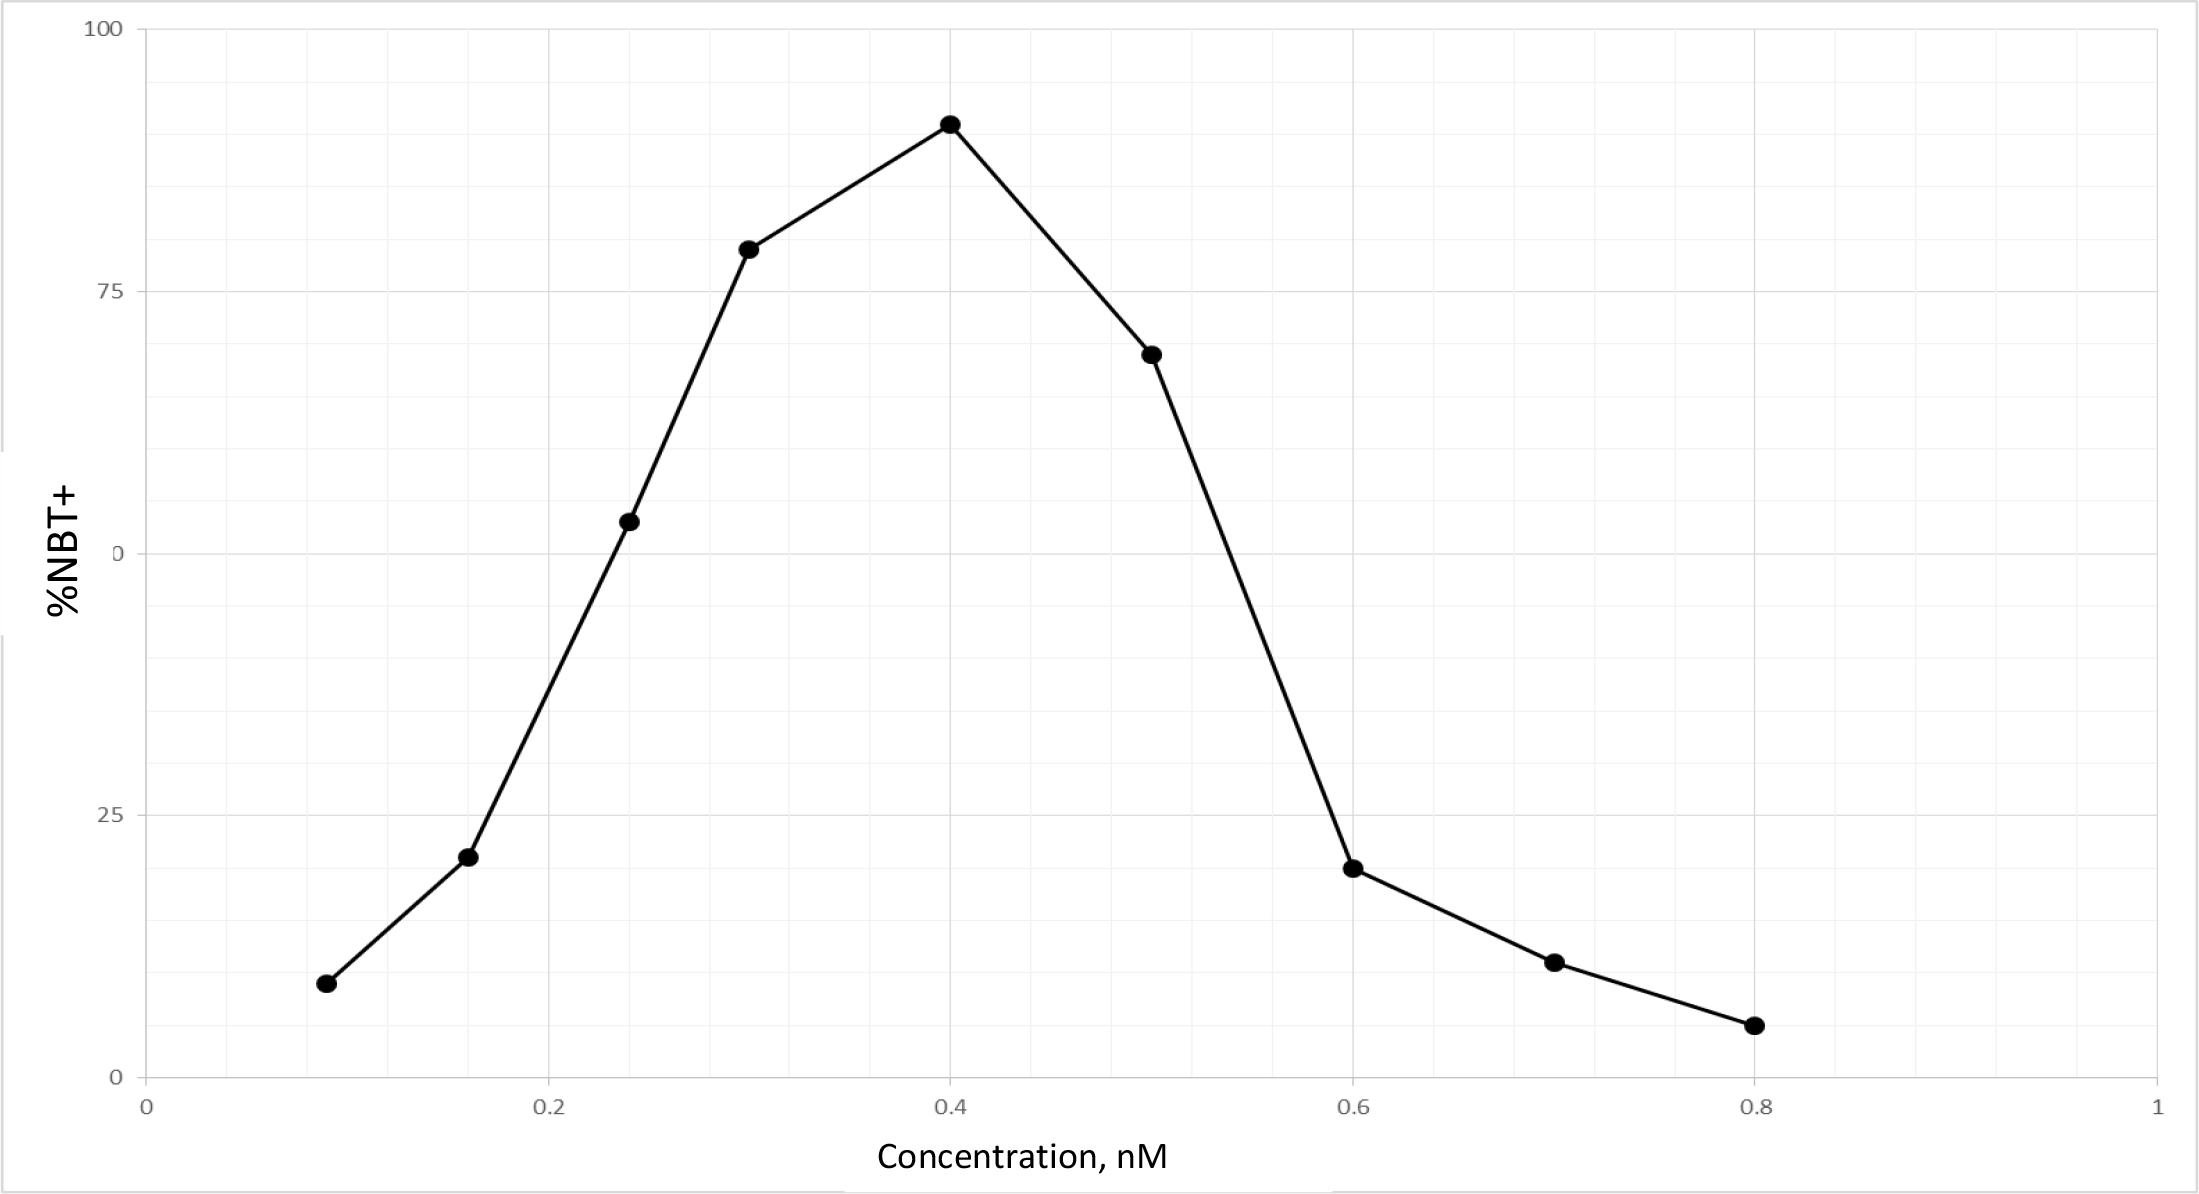
TPA is another well known DI, which acts as DI in some cells, but as differentiation inhibitor in other cells depending on which molecules are being affected, or as tumor promoter by increasing cell multiplication in initiated cells [89]. Biological effects of TPA are mediated through initial interaction with membrane [90]. Therefore, TPA affects almost all cancers. The tumor promotion activity of TPA can be effectively cancelled by DHIs [91]. Despite its adverse effects, TPA has been put through clinical trials for the evaluation as a cancer drug [92–94]. TPA had a very impressive DI activity on HL-60 cells as shown in Fig. 9. The maximum activity was at 0.4 nM to induce 92% NBT + . At this concentration 90% of cells were attached to the culture dish. Above this concentration, cell growth was greatly inhibited, and NBT + cells declined precipitously. ED25 of TPA was 0.17 ± 0.02 nM when tested on fast growing HL-60 cells. The growth rates measured by N3/N0 were between 13.7–15.4, almost 3 to 4 generations in 3 days. ED25 of RA was 1.17 ± 0.16 µM tested on HL-60 cells with growth rates same as those of TPA. We have previously found that HL-60 cells responded better to RA when grew slower at earlier passages. ED25 of RA was 0.78 µM when tested on HL-60 cells with N3/N0 between 6.3–7.5.
CST 2019-101 - Mingliau China_F9

Figure 9. DI activity of TPA

TPA was dissolved in methanol which was added to the culture in the amounts indicated. The volume of methanol was less than 2%. NBT assay was conducted as described in Methods and Materials.

Potential DHIs for synthetic CDA formulations

We have previously shown that RA alone could not push all HL-60 cells to complete TD [7]. 95% NBT + cells was the maximum extent achieved by RA. But in the presence of DHIs, the extent of NBT + cells could reach 100% [7]. 92% NBT + cells was the maximum extent reached by TPA in this study. Cells unable to undergo differentiation in the presence of DI alone are the cells damaged enough to prevent completion of two replication cycles needed for TD. The damaged cells if repaired become the roots for recurrence. Removal of the possible recurrent roots by DHIs is another important contribution of DHIs. The most serious damage that can be attributed to DIs are the promotion of the dissociation of methylation enzymes, and the conversion of the monomeric MTs into nucleases. MT inhibitors can effectively prevent such conversion. Uroerythrin was a good MT inhibitor to function as the most active DHI of CDA-2 [77]. This chemical is not commercially available. We need to find substitutes to prevent damages created by DIs alone. We have previously found that I3 and I4 from limited alkaline hydrolysis of poly I were potent inhibitors of nucleolar rRNA methyltransferase [2]. We, thus, prepared I3 + I4 and A3 + A4 as previously described [2] to test their DHI activities. Results shown in Table 3 indicate that I3 + I4 and A3 + A4 are active as DHIs. Included in Table 3 is PP as the most active DHI we have discovered so far. PP has been shown active as signal transduction inhibitor and inhibitor of androgen receptor,[95–98]. Both classes of inhibitors are excellent DHIs [7]. The superb activity of PP as DHI may be attributable to its dual activities to inhibit signal transduction and steroid receptor.

Table 3. Potential DHIs for synthetic CDA formulations

DHI

RI0.5

I3+I4

3.7±0.58 µM

A3+A4

4.8±1.12 µM

PP

12.2±2.2 nM

10 mg of poly I and poly A was dissolved in 1 ml of 0.3N KOH and incubated at 37o C for 0.5 h. The solution was neutralized with HCl, and put onto a column of DEAE-Sephadex for chromatography as previously described,[2]. I3 and I4 in the ratio of 1:0.9 were the major components, which were combined and recovered as previously described,[2] for the test of DHI activity. The preparations of oligonucleotides were dissolved in 80% methanol, and pp was dissolved in methanol for the determination of RI0.5 as previously described,[7]. HL-60 cells for these experiments had growth rates of N3/N0 between 7.5–9.8.

Development of synthetic CDA formulations for the prevention and therapy of cancer via targeting of CSCs

CDA-2 was effective to eliminate CSCs subpopulation [99,100], and had a very effective therapeutic efficacy on MDS [62, 63], a disease attributable to CSCs. Our immediate objective is to develop synthetic CDA formulations for the therapy of MDS, CSCs, and cancers in which CSCs play a dominant role on the pathological features and drug responses of the diseases. Cancers originated from progenitor stem cells such as MDS above described and acute myeloid leukemia resulting from MDS are enriched in CSCs. Evidence indicates that brain tumors are also originated from progenitor stem cells [101,102]. Melanoma and pancreatic cancer may not originate from progenitor stem cells, but these cancers express high levels of factors such as hypoxia inducible factors and NF-kB that can effectively drive EMT to display CSC phenotype [103 -106]. On MDS, protection of pathological cells is a necessity, because the therapy requires the differentiation of pathological cells to become functional erythrocytes. DIs and DHIs of low toxicity are preferred. On other CDA formulations, destruction of pathological cells is a preferred choice. On CSCs, toxicity is also a big concern, because CSCs naturally reject toxic chemicals. CSCs are situated in hypoxic microenvironment hard to reach by the blood, small molecules with penetration power are preferred. On brain tumor, blood brain barrier must be the major concern. Hydrophobic chemicals have better chance to cross that barrier. For melanoma and pancreatic cancer, potent DIs and DHIs are preferred. CDA formulations must consist of both DIs and DHIs to make perfect drugs. The following formulations are acceptable formulations: 3xED25 of DI + 1xRI0.5 of DHI; 2xED25 of DI + 2xRI0.5 of DHI; or 1xED25 of DI + 3xRI0.5 of DHI. 1xRI0.5 of DHI is equivalent to 1xED25 of DI [7]. The multiplicity of DI can be multiplicity of a single DI, or a combination of different DIs. Likewise, the multiplicity of DHI can be multiplicity of a single DHI, or a combination of different DHIs.

Our deliberated CDA formulations are listed in table 4. CDA-MDS, CDA-BT (brain tumor), and CDA-M&P (melanoma and pancreatic cancer) are parenteral preparations, and CDA-CSC is an oral preparation which is designed for long term application to prevent recurrence after active therapy. Thus, an oral preparation is a practical drug form. On active cancer therapy, CDA-CSC is best used in combination with drugs to inhibit growth factor receptors and signal transductions, or drugs for anti-steroid hormonal therapy. These drugs are actually good DHIs. It is also compatible with other therapeutic modalities to target on different entities, e.g. CDA-CSC to target on CSCs and cytotoxic drugs or radiation to target on non-CSCs. TPA and PP are not soluble in H2O. RA, resveratrol, and curcumin are not very soluble in H2O. Dispensing aids such as liposomal and nanoparticle technologies must be employed to increase bioavailability for clinical application. Phenylacetylglutasmine {PAG} is a major chemical constituent of CDA-2, which is also very useful to extend bioavailability of DIs and DHIs. We recommend to include 2 mM PAG in each CDA formulation for the purpose of extending bioavailability of DIs and DHIs and to cancel tumor promotion activity of TPA. We have previously shown that PAG, namely Antineoplaston A10, was effective to prevent the loss of low molecular weight metabolites including active DIs and DHIs [40]. By preventing the loss of endogenous DIs and DHIs, PAG was effective to prevent carcinogens-induced pulmonary neoplasia and hepatoma [107,108], and to achieve therapy of early stage cancer [40]. PAG is a very effective deterrent of tumor promoters. PAG is synthesized from phenylacetyl chloride and glutamine as previously described [76]. CDA formulations listed in Table 4 are plasma concentrations to achieve induction of TD of HL-60 cells above 100% on purpose to achieve maximum therapeutic effect. Multiplication of these amounts per liter of blood by a factor of 5, which is the normal blood volume of a person of 80 Kg body weight, is necessary to produce an effective dosage. Application of 3 effective dosages a day should give satisfactory therapy.

Table 4. Synthetic CDA formulations

Effect on HL-60 cells

Designation

Formulation

% Growth

%NBT+

CDA-MDS

RA(ED25)-5P-1(ED25)-I3+I4(RI0.5)-PP(RI0.5)-Na pregnenolone SO4(RI0.5)

77 ± 5.2

100

CDA-CSC

RA(ED25)-TPA(ED25)-PP(RI0.5)-resveratrol(RI0.5)-curcumin(RI0.5)

53 ± 3.6

100

CDA-BT

TPA(2xED25)-PP(2xRI0.5)-Na phenylbutyrate (RI0.5)-pyrogallol(RI0.5)

45 ± 3.9

100

CDA-M&P

TPA(2xED25)-5P-1(ED25)-PP(2xRI0.5)-Na tannate (RI0.5)

33±4.4

100

CDA-MDS is a parenteral preparation as a monotherapy of MDS. CDA-CSC is an oral preparation for use in combination with other drugs. CDA-BT is a parenteral preparation as a monotherapy of brain tumor. CDA-M&P is also a parenteral preparation as a monotherapy for melanoma and pancreatic cancer.

DIs and DHIs were methanol solution except 5P-1 which was in 80% methanol, and Na phenylbutyrate which was in H2O solution. Each component was added individually. RA(ED25) is 1.17 µM, 5P-1(ED25) is 122 µM, I3+I4(RI0.5) is 3.7 µM, PP(RI0.5) is 12.2 nM, TPA(ED25) is 0.17 nM, resveratrol (RI0.5) is 1.16 µM, curcumin(RI0.5) is 1.24 µM, Na phenylbutyrate(RI0.5) is 2 mM, and Na tannate(RI0.5) is 0.37 µM as previously reported,[7] or shown in this paper. NBT assay was carried out as described in Methods and Materials.

Discussion

Abnormal methylation enzymes are an important issue of cancer. Almost all human cancers display such an abnormality [8,109]. Abnormal methylation enzymes are the critical factor responsible for the blockade of differentiation of cancer cells [6]. The expression of telomerase fits the first hit of Knudson’s two hits theory [110]. Telomerase is also expressed in primitive stem cells such as embryonic stem cells and progenitor stem cells. Evidently blockade of differentiation is a normal biological process to build up cell mass for the development of fetus, or wound healing. The blockade of differentiation in these normal stem cells does not create problem, because Tet enzymes are functioning which can break through the blockade created by abnormal methylation enzymes to spearhead differentiation programs. The problem arises if Tet enzymes become dysfunction due to mutation or silencing such as the case of MDS [23–26]. The loss of Tet enzymes becomes the second hit of Knudson’s theory. Therefore, the evolution of cancer in the case of MDS is a perfect interpretation on the validity of the two hits theory of Knudson [110], and our chemosurveillance hypothesis [40].

Progenitor stem cells and CSCs are almost indistinguishable with only very minor differences, the functionality of Tet enzymes being a significant difference between them. Progenitor stem cells are very likely the origin of most human cancers, not just acute myeloid leukemia resulting from MDS or brain tumors. We have detected abnormal methylation enzymes to function actively in preneoplastic hyperplastic nodules induced by hepatocarcinogen [111]. Therefore, progenitor stem cells are just like time bombs, and natural DIs and DHIs are the safety devices to keep them from evolving into CSCs.

Chemicals extractable by dichloromethane are in general very hydrophobic. The detection of pregnenolone as a component of DIs of CDA-2 is a certain indication that active DIs of CDA-2 is liposomal complexes. The release of liposomal-like DIs from methanol extractable DIs by NaOH hydrolysis suggests that dichloromethane extractable DIs and methanol extractable DIs are basically the same liposomal complexes. A large proportion of these liposomal complexes become covalently linked to the inactive carrier previously identified as pigment peptides [40] either by enzymatic dehydration in the body or due to heat pyrolysis during evaporation of ethanol eluant in the process of CDA-2 preparation. The inactive pigment peptide carrier is very likely fragments of membrane. The liposomal DIs of Kav = 0.43 and 0.52 are stable in methanol, ethanol, and dichloromethane, but are not stable in butanol or high slat solution. DIs in free forms do not seem to have A280 absorption. Without A280 absorption as a probe, it is very difficult to capture DIs of CDA-2. The real DIs of CDA-2 are still up in the air.

We have identified pregnenolone as a DHI of CDA-2 in this study. Pregnenolone is the master substrate of all biologically active steroids, which is synthesized from cholesterol absorbed from diet or produced in the liver. The peak age of the production of pregnenolone is 20 years old, producing approximately 50 mg a day,[112]. The very young and the very old are the two age groups producing the least amount of pregnenolone. These are the two age groups most susceptible to cancer. Fortifying effective DHIs definitely is a good policy to amend natural insufficiency.

The therapy of APL with RA sets a classical example of the effectiveness of destabilization of abnormal methylation enzymes on cancer therapy [27]. RA alone is very effective, but imperfect. Recurrence ensues quickly [28]. This is because RA alone causes the dissociation of abnormal methylation enzymes too extensive to contribute to nuclease activity which creates damages to interrupt differentiation process. This phenomenon is analogous to the antiviral effect of interferon. Interferon is actually a DI like TPA to activate oligoisoadenylate synthetase through interaction with membrane. The product of oligoisoadenylate synthetase is a potent activator of latent nucleases to execute antiviral effect. The damage created by DI alone may affect only a small fraction of cells in the S phase when DNA is most susceptible to nuclease attack. The damages interrupt differentiation process, but when damaged cells are repaired later they become the roots for recurrence. Damages by DI alone can be prevented by DHIs. MT inhibitors can prevent protease modification to turn MT into nuclease. Steroids analogs are even better, which keep MT in dimeric complex with SAHH to protect the integrity of MT. The protection of MT from becoming nuclease is the cause that DHI is an essential partner of a perfect cancer drug.

The option for the eradication of cancer stem cells is very limited. The ideal therapeutic agents must be small molecules that are relatively non-toxic to bypass drug afflux pumps to reach adequate intracellular concentrations to trigger cancer stem cells to undergo differentiation. Synthetic CDA formulations are an attractive strategy to eradicate cancer stem cells. DIs is the most important components of CDA formulations. The choices of DIs are very limited; RA is only effective in cancers expressing RAR. TPA is universal, but is very toxic. 5Ps are universal, but are not very active. The requirement of DI is to initiate TD to reach a level above 15%, the rest can be accomplished by DHIs [7]. Therefore, even though 5Ps are not very active, they can be remedied by very active DHIs such as PP. We have developed many excellent DHIs to choose from. The mere application of effective DHIs can have excellent therapeutic effect on cancer as exemplified by imatinib mesylate. The brain compartment is a unique compartment protected by blood brain barrier, which also protect the loss of endogenous metabolites. Therefore, the deficiency of endogenous DIs and DHIs is not as severe as other body compartments. That is why DHIs have impressive therapeutic effect on brain tumor.

Destabilization of abnormal methylation enzymes is a good policy to implement at the earliest diagnosis of cancer to avoid aberrant DNA methylation no matter what cancer therapy is to follow. Aberrant DNA methylations are frequently detected in advanced cancer, which can turn ordinary responsive cancer to become very vicious cancer unresponsive to any treatment. Aberrant DNA methylations happen more readily when DNA synthesis is slowing down by cytotoxic drugs or radiation [113]. Another benefit to implement destabilization of abnormal methylation enzymes is to avoid expansion of CSC population induced by the destruction of the tumor caused by cytotoxic chemotherapy [114], or due to tumor progression [103–106]. Reconstruction of the tumor is a major mission of CSCs. Therefore, destabilization of abnormal methylation enzymes is a very good strategy to pursue for cancer therapy.

Acknowledgement

This study was supported in part by a contract awarded to CDA Therapeutics, Inc. by Xinhua Pharmaceutical Company of Zibo, Shandong China. We are indebted to the gift of CDA-2 solution from Mr. Zanji Sun of NTPharma of Tai Zhou, Jiangsu, China. We are very grateful to Christian Browder for the art work of figures.

Funding Information

The funder had no involvement in the study design; in the collection, analysis and interpretation of the data; in the writing of the report, and in the decision to submit the paper for publication. The funder had an active supervising role.

References

  1. Racanelli AC, Turner FB, Kie TY, Taylor SM (2008) A mouse gene that coordinates epigenetic controls and transcriptional interference to achieve tissue-specific expression. Mol Cell Biol 281: 836–848.
  2. Liau MC, Hunt ME, Hurlbert RB (1976) Role of ribosomal RNA methylases in the regulation of ribosome production in mammalian cells. Biochemistry 15: 3158–3164. [crossref]
  3. Bernstein KA, Bleichert F, Bean JM, Cross FR, Baserga SJ (2007) Ribosome biogenesis is sensed at the Start cell cycle checkpoint. Mol Biol Cell 18: 953–964. [crossref]
  4. Justilien V, Ali SA, Jamieson L, Yin N, Cox AD, et al. (2017) Ect2-Dependent rRNA Synthesis Is Required for KRAS-TRP53-Driven Lung Adenocarcinoma. Cancer Cell 31: 256–269. [crossref]
  5. Liau MC, Chang CF, Saunders GF, Tsai YH (1981) S-Adenosylhomocysteine hydrolases as the primary target enzymes in androgen regulation of methylation complexes. Arch Biochem Biophys 208: 261–272.
  6. Liau MC (2004) Abnormal methylation enzymes: a selective molecular target for differentiation therapy of cancer. Chin Pharm J 56: 57–67.
  7. Liau MC, Kim JH, Fruehauf JP (2019) Potentiation of ATRA activity in HL-60 cells by targeting methylation enzymes. Pharmacol Pharmaceut Pharmacovig 3: 9–17
  8. Liau MC, Zhuang P, Chiou GCP (2010) Identification of the tumor factor of abnormal methylation enzymes as the catalytic subunit of telomerase. Chin Oncol Cancer Res 7: 86–96.
  9. Prudova A, Bauman Z, Braun A, Vitvitsky V, Lu SC, et al. (2006) S-adenosylmethionine stabilizes cystathionine beta-synthase and modulates redox capacity. Proc Natl Acad Sci USA 103: 6489–6494. [crossref]
  10. Chiba P, Wallner L, Kaizer E (1988) S-Adenosylmethionine metabolism in HL-60 cells: effect of cell cycle and differentiation. Biochim Biophys Acta 971: 38–45.
  11. Liau MC, Lee SS, Burzynski SR (1989) Hypomethylation of nucleic acids: a key to the induction of terminal differentiation. Intl J Exp Clin Chemother 2: 187–199.
  12. Tahiliani M, Koh KP, Shen Y, Pastor WA, Bandukwala H, et al. (2009) Conversion of 5-methylcytosine to 5-hydroxymethylcytosine in mammalian DNA by MLL partner TET1. Science 324: 930–935. [crossref]
  13. Ito S, Shen L, Dai Q, Wu SC, Collins LB, et al. (2011) Tet proteins can convert 5-methylcytosine to 5-formylcytosine and 5-carboxylcytosine. Science 333: 1300–1303. [crossref]
  14. Shen L, Song CX, He C, Zhang Y (2014) Mechanism and function of oxidative reversal of DNA and RNA methylation. Annu Rev Biochem 83: 585–614. [crossref]
  15. Wu X (2017) TET-mediated active DNA demethylation: mechanism, function and beyond. Nat Rev Genet 18: 517–534. [crossref]
  16. He YF, Li BZ, Li Z, Liu P, Wang Y, et al. (2011) Tet-mediated formation of 5-carboxylcytosine and its excision by TDG in mammalian DNA. Science 333: 1303–1307. [crossref]
  17. Maiti A, Drahat AC (2011) Thymine DNA glycosylase can rapidly excise 5-formylcytosine and 5-carboxylcytosine: potential implication for active demethylation of CpG sites. J Biol Chem 286: 35334–35338.
  18. Hu L, Lu J, Cheng J, Rao Q (2015) Structural insight into substrate preference for TET-medicated oxidation. Nature 527: 118–122.
  19. Huang Y, Charez L, Chang X, Wang X (2014) Distinct role of the methylcytosine oxidases Tet 1 and Tel 2 in mouse embryonic stem cells. Proc Natl Acad Sci USA 111: 1361–1366.
  20. Iqbal K, Jin SG, Pfeifer GP, Szabó PE (2011) Reprogramming of the paternal genome upon fertilization involves genome-wide oxidation of 5-methylcytosine. Proc Natl Acad Sci U S A 108: 3642–3647. [crossref]
  21. Ficz G, Branco MR, Seisenberger S, Santos F (2011) Dynamic regulation of 5-hydroxymethylcytosine mouse ES cells and during differentiation. Nature 473: 398–403.
  22. Monfort A, Wutz A (2013) Breathing-in epigenetic change with vitamin C. EMBO Rep 14: 337–346. [crossref]
  23. Haffiner MC, Chaux A, Meeker AK, Esopi D (2011) Global 5-hydroxymethylcytosine content is significantly reduced in tissue stem/progenitor cell compartments and in human cancers. Oncotarget 2: 627–637.
  24. Kudo Y, Tateishi K, Yamamoto K, Yamamoto S (2012) Loss of 5-hydroxymethylcytosine is accompanied with malignant cellular transformation. Cancer Sci 103: 670–676.
  25. Ficz G, Gribben JG (2014) Loss of 5-hydroxymethylcytosine in cancer: cause or consequence? Genomics 104: 352–357. [crossref]
  26. Wang KC, Kang CH, Tsai CY, Chou NH (2018) Ten-eleven translocation 1 dysfunction reduces 5-hydroxylmethylcytosine expression levels in gastric cancer cells. Oncol Lett 15: 278–284.
  27. Huang M, Ye Y, Chen S, Chai JR (1988) Use of all-trans retinoic acid in the treatment of acute promyelocytic leukemia. Blood 72: 567–572.
  28. Warrell RP, Frankel SR, Miller MA, Scheinberg DA (1991) Differentiation therapy of acute promyelocytic leukemia with tretinoin (all-trans retinoic acid). N Engl J Med 304: 1385–1393.
  29. de Thé H, Pandolfi PP, Chen Z (2017) Acute Promyelocytic Leukemia: A Paradigm for Oncoprotein-Targeted Cure. Cancer Cell 32: 552–560. [crossref]
  30. Gambacorti-Passerini C, Antolini L, Mahon FX, Guilhot F, Deininger M, et al. (2011) Multicenter independent assessment of outcomes in chronic myeloid leukemia patients treated with imatinib. J Natl Cancer Inst 103: 553–561. [crossref]
  31. Liau MC, Liau CP, Burzynski SR (1992) Potentiation of induced terminal differentiation by phenylacetic acid and related chemicals. Intl J Exptl Clin Chemother 5: 9–17.
  32. Baker MJ, Brem S, Deniels S, Sherman B (2002) Complete response of a recurrent, multicentric malignant glioma in a patient treated with phenylbutyrate. J Neurooncol 59: 239–242.
  33. Burzynski SR, Nagy-Kubove E (2011) Treatment of esthesioneuroblastoma and non-small cell-lung cancer with phenylbutyrate. J Cancer Ther 2: 518–522.
  34. Burzynski SR, Tamicki TJ, Burzynski GS, Brookman S (2014) Preliminary findings on the use of targeted therapy with pazopanib and other agents in combination with sodium phenylbutyrate in the treatment of glioblastoma multiforme. J Cancer Ther 5: 1423–1437.
  35. Burzynski SR, Burzynski GS, Brookman S (2015) A case of sustained objective response of recurrent/progressive diffuse intrinsic pontine glioma with phenylbutyrate and targeted agents. J Cancer Ther 6: 40–44.
  36. Stoner GD, Wang LS, Zikri N, Chen T, Hecht SS, et al. (2007) Cancer prevention with freeze-dried berries and berry components. Semin Cancer Biol 17: 403–410. [crossref]
  37. Amin AR, Kucuk O, Khuri FR, Shin DM (2009) Perspectives for cancer prevention with natural compounds. J Clin Oncol 27: 2712–2725. [crossref]
  38. Wang LS, Hecht SS, Carmella SG, Yu N (2009) Anthocyannin in black raspberries prevent esophageal tumors in rats. Cancer Prev Res 2: 84–93.
  39. Allegra A, Innao V, Russo S, Gorace D (2017) Anticancer activity of curcumin and its analogues: preclinical and clinical studies. Cancer Invest 35: 1–22.
  40. Liau MC, Szopa M, Burzynski B, Burzinski SR (1987) Chemosurveillance: a novel concept of the natural defense mechanism against cancer. Drug Exptl Clin Res 13: 77–82.
  41.  Liau MC, Szopa M, Burzynski B, Burzinski SR (1987) Quantitative assay of plasma and urinary peptides as an aid for the evaluation of cancer patients undergoing Antineoplaston therapy. Drug Exptl Clin Res 13: 61–70.
  42. Liau MC, Lee SS, Burzynski SR. (1988) Differentiaiton inducing components of Antineoplaston A5. Adv Exptl Clin Chemother 6/88: 9–26.
  43. Liau MC, Lee SS, Burzynski SR (1990) Modulation of cancer methylation complex isozymes as a decisive factor in the induction of terminal differentiation mediated by Antineoplaston A5. Intl J Tiss React 12: 29–36.
  44. Williamson RJ, Kruger AR, Reynolds RJ (1994) Establishing the incidence of myelodysplastic syndromes. Br J Haemato 83: 743–748.
  45. Boula A, Voulgarelis M, Giannouli S, Katrinakis G (2006) Effect of CA2 antitumor necrosis factor-a antibody therapy on hematopoiesis of patients with myelodysplastic syndromes. Clin Cancer Res 12: 3099–3108.
  46. Itkin T, Rafii S (2017) Leukemic Cells “Gas Up” Leaky Bone Marrow Blood Vessels. Cancer Cell 32: 276–278. [crossref]
  47. Passaro D, Tullio AD, Abarrategi A, Rouault-Pierre K (2017) Increased vascular permeability in the bone marrow microenvironment contributes to disease progression and drug response in acute myeloid leukemia. Cancer Cell 32: 324–341.
  48. Counter CM, Mupta J, Harley CB (1995) Telomerase activity in normal leukocytes and hematological malignancies. Blood 85: 2315–2320.
  49. Fu C, Chen Z (2002) Telomerase activity in myelodysplastic syndrome. Chin Med J (Engl) 115: 1475–1478. [crossref]
  50. Delhommeau F, Dupont S, Della Valle V, James C, Trannoy S, et al. (2009) Mutation in TET2 in myeloid cancers. N Engl J Med 360: 2289–2301. [crossref]
  51. Lasson Cam Cote G, Quintas-Cardama A (2013) The changing mutational landscape of acute myeloid leukemia and myelodysplastic syndrome. Mol Cancer Res 11: 815–827.
  52. Papaemmanuil E, Gerstuug M, Malcovati L, Tauro S (2013) Clinical and Biological implication of driver mutations in myelodysplastic syndromes. Blood 122: 3616–3627.
  53. Bejar R, Lord R, Stovenson K, Bar-Natan M (2014) TET2 mutations predict response to hypomethylating agents in myelodysplstic syndrome patient. Blood 124: 2705–2712.
  54. Kennedy JA, Ebert BL (2017) Clinical implication of genetic mutations in myelodysplastic syndrome. J Clin Oncol 35: 968–974.
  55. Woll PS, Kjällquist U, Chowdhury O, Doolittle H, Wedge DC, et al. (2014) Myelodysplastic syndromes are propagated by rare and distinct human cancer stem cells in vivo. Cancer Cell 25: 794–808. [crossref]
  56. Maeck L, Haase D, Schoch C, Hiddemann W (2000) Genetic instability in myelodysplastic syndrome: detection of microsatellite instability and loss of heterozygosity in bone marrow sample with karyotype alteration. Br J Haemato 109: 842–846.
  57. Xie D, Hefmann KW, Mori N, Miller CW (2001) Allotype analysis of the myelodysplastic syndrome. Leukemia 14: 805–810.
  58. Kumamoto K, Ban S, Oda K, Tanaka H (2002) Chromosomal instability and radiosensitivity in myelodysplastic syndrome. Leukemia 16: 2253–2258.
  59. Takeda A, Goolsby C, Yaseen NR (2006) NUP98-HOXA9 induces long-term proliferation and blocks differentiation of primary human CD34+ hematopoietic cells. Cancer Res 66: 6628–6637. [crossref]
  60. Feng F, Li Q, Ling C, Zhang Y (2005) Phase III clinical trials of the cell differentiation agent-2 (CDA-2): therapeutic efficacy on breast cancer, non-small- cell lung cancer, and primary hepatoma. Chin J Clin Oncol 2: 706–716.
  61. Santi DV, Norment A, Garrett CE (1984) Covalent bond formation between a DNA-cytosine methyltransferase and DNA containing 5-azacytosine. Proc Natl Acad Sci U S A 81: 6993–6997. [crossref]
  62. Ma J (2007) Differentiation therapy of malignant tumor and leukemia. CSCO Treaties on the Education of Clinical Oncology 480–486.
  63. Liau MC, Fruehauf JP (2015) Destabilization of abnormal methylation enzymes as a critical mechanism for CDA-2 to reverse MDS progression. The First International Forum of Myelodysplastic Syndrome in Tai Zhou, Jiangsu, China: 31–35.
  64. Prasanna P, Shack S, Wilson VL, Samid D (1995) Phenylacetate in chemoprevention: in vitro and in vivo suppression of 5-aza-2’-deoxycytidine-induced carcinogenesis. Clin Cancer Res 1: 865–871. [crossref]
  65. Jordan CT, Guzman ML, Noble M (2006) Cancer stem cells. N Engl J Med 355: 1253–1261. [crossref]
  66. Vermeulen L, Sprick MR, Kemper K, Stassi G, Medema JP (2008) Cancer stem cells–old concepts, new insights. Cell Death Differ 15: 947–958. [crossref]
  67. Zabierowski SE, Herlyn M (2008) Melanoma stem cells: the dark seed of melanoma. J Clin Oncol 26: 2890–2894. [crossref]
  68. Hemmings C (2010) The elaboration of a critical framework for understanding cancer: the cancer stem cell hypothesis. Pathology 42: 105–112. [crossref]
  69. Magee JA, Piskounova E, Morrison SJ (2012) Cancer stem cells: impact, heterogeneity, and uncertainty. Cancer Cell 21: 283–296. [crossref]
  70. Zhou S, Schuetz JD, Bunting KD, Colapietro AM, Sampath J, et al. (2001) The ABC transporter Bcrp1/ABCG2 is expressed in a wide variety of stem cells and is a molecular determinant of the side-population phenotype. Nat Med 7: 1028–1034. [crossref]
  71. Zhou M, Atkinson KL, Rosen JM (2010) Selective targeting of radiation resistant tumor initiating cells. Proc Natl Acad Sci USA 107: 3522–7.
  72. Moitra K, Lou H, Dean M (2011) Multidrug efflux pumps and cancer stem cells : in sight into multidrug resistance and therapeutic development. Clin Pharmacol Ther 89: 491–502.
  73. Frame FM, Maitland NJ (2011) Cancer stem cells, models of study and implications of therapy resistance mechanisms. Adv Exp Med Biol 720: 105–118. [crossref]
  74. Liau MC (2007) Pharmaceutical composition inducing cancer cell differentiation and the use for treatment and prevention of cancer thereof. US Patent 7232578 B2, June 19.
  75. Liau MC, Ashraf AQ, Lee SS, Burzynski SR (1990) Riboflavin as a minor active anticancer component of Antineoplaston A2 and A5. Intl J Tiss React 12: 19–26.
  76. Liau MC, Huang LJ, Lee JH, Chen SC (1998) Development of differentiation helper inducers for the differentiation therapy of cancer. Chin Pharm J 50: 289–303.
  77. Liau MC, Liau CP (2002) Methyltransferase inhibitors as excellent differentiation helper inducers for differentiation therapy of cancer. Bull Chin Cancer 166–168.
  78. Laerum OD, Paukovits WR (1984) Modulation of murine hemopoiesis in vivo by a synthetic hemoregulatory pentapeptide (HP5b). Differertiation 27: 106–112.
  79. Bourgeade MF, Besançon F (1984) Induction of 2’,5’-oligoadenylate synthetase by retinoic acid in two transformed human cell lines. Cancer Res 44: 5355–5360. [crossref]
  80. Das BC, Thapa P, Karki R, Das S, Mahapatra S, et al. (2014) Retinoic acid signaling pathways in development and diseases. Bioorg Med Chem 22: 673–683. [crossref]
  81. Cunningham TJ, Duester G (2015) Mechanisms of retinoic acid signalling and its roles in organ and limb development. Nat Rev Mol Cell Biol 16: 110–123. [crossref]
  82. Gudas LJ, Wagner JA (2011) Retinoids regulate stem cell differentiation. J Cell Physiol 226: 322–330. [crossref]
  83. Stockhausen MT, Kristoffersen K, Stobbe L, Poulsen HS (2014) Differentiation of glioblastoma multiforme stem-like cells leads to down-regulation of EGFR and EGFRviii and decreased tumorigenic and stem-like cell potential. Cancer Biol Ther 15: 216–224.
  84. Sulaiman G, Cooke A, French B (2017) MyD88 is an essential component of retinoic acid-induced differentiation in human pluripotent embryonal carcinoma cells. Cell Death Diff 24: 1975–1986.
  85. El-Houjeiri L, Saad W, Hayar B, Aouad P (2017) Antitumor effect of the atypical retinoid ST1926 in acute myeloid leukemia and nanoparticle formation prolongs lifespan and reduce tumor burden of xenograft mice. Mol Cancer Ther 16: 2047–2057.
  86. Heynen GJ, Nevedomskaya E, Palit S, Jagalur Basheer N, Lieftink C, et al. (2016) Mastermind-Like 3 Controls Proliferation and Differentiation in Neuroblastoma. Mol Cancer Res 14: 411–422. [crossref]
  87. Yang Q, Sakurai T, Kakudo K (2002) Retinoid, retinoic acid receptor beta and breast cancer. Breast Cancer Res Treat 76: 167–173. [crossref]
  88. Zhao X, Graves C, Ames SJ, Fisher DE, Spanjaard RA (2009) Mechanism of regulation and suppression of melanoma invasiveness by novel retinoic acid receptor-gamma target gene carbohydrate sulfotransferase 10. Cancer Res 69: 5218–5225. [crossref]
  89. Lotem J, Sachs L (1979) Regulation of normal differentiation in mouse and human myeloid leukemia cells by phorbol esters and the mechanism of tumor promotion. Proc Natl Acad Sci USA 76: 5158–5162.
  90. Cooper RA, Braunwald AD, Kuo AL (1982) Phorbol ester induction of leukemic cell differentiation is a membrane-mediated process. Proc Natl Acad Sci U S A 79: 2865–2869. [crossref]
  91. Weeks CE, Slaga TJ, Hemmings H, Gleason GL (1979) Inhibition of phorbol ester-induced tumor promotion in mice by vitamin A analogs and anti-inflammatory steroid. J Natl Cancer Inst 63: 401–406.
  92. Han ZT, Zhu XX, Yang RY, Sun JZ (1998) Effect if intravenous infusion of 12-O-tetradecanoyl phorbol-13-acetate (TPA) in patients with monocytic leukemia: preliminary studies on therapeutic efficacy and toxicity. Proc Natl Acad Sci USA 95: 5357–5361.
  93. Schaar DG, Goodell L, Aisner J, Cui XX (2006) Phase I clinical trial of 12-O-tetradecanoylphorbol-13-acetate for patients with relapsed/refractory malignancies. Cancer Chemother Pharmacol 57: 789–795.
  94. Bond JA, Gescher A, Verschoyle RD, Lemoine NR (2007) Cytotoxic action of phorbol esters on human pancreatic cancer cells. Int J Cancer 121: 1445–1454.
  95. Xu L, Zhang L, Hu C, Liang S (2016) WNT pathway inhibitor pyrvinium pamoate inhibits the self-renewal and metastasis of breast cancer stem cells. Intl J Oncol 48: 1175–1186.
  96. Stoddart A, Wang J, Hu C, Fernald AA, Davis EM, et al. (2017) Inhibition of WNT signaling in the bone marrow niche prevents the development of MDS in the Apcdel/+ MDS mouse model. Blood 129: 2959–2970. [crossref]
  97. Momtazi-Borojeni AA, Abdollahi E, Ghasemi F, et al. (2018) The novel role of pyrvinium in cancer therapy. J Cell Physiol 233: 2871–2881. [crossref]
  98. Barbarino M, Cesari D, Intruglio R, Indovina P (2018) Possible repurposing of pyrvinium pamoate for the treatment of mesothelioma: a preclinical assessment. J Cell Physiol 233: 7391–7401.
  99. Yao CJ, Lai GM, Chen CF (2007) Elimination of cancer stem-like “side population” cells existed in MCF-7 breast cancer cells by human urine extract CDA-2. Literature documentation on CDA-2 issued by Everlife Pharmaceutical Co, Hefei, Anhui, China, 2007; 5–11.
  100. Ren J (2009) Cancer stem cell: the new target for fighting cancer from the latest transitional research. Biomed Pharmaco Therapy 63: 626–630.
  101.  Mougeri-Sacca M, Dimarino S, De Maria R (2013) Biological and clinical implication of cancer stem cells in primary brain tumors. Front Oncol 3: 6.
  102. Lathia JD, Venere M, Rao MS, Rich JN (2011) Seeing is believing: are cancer stem cells the Loch Ness monster of tumor biology? Stem Cell Rev 7: 227–237. [crossref]
  103. Fruehauf JP, Liau MC (2011) Therapeutic targeting of HIF to reverse the cancer stem cell phenotype and epithelial-mesenchymal transition. Therapy 8: 737–740.
  104. Caramels J, Papadogeorgakis E, Hill L, Browne GJ, Richard G, et al. (2013) A switch in the expression of embryonic EMT-inducers drives the development of malignant melanoma. Cancer Cell 24: 466–480. [crossref]
  105. Smigiel JM, Parameswaran N, Jackson MW (2017) Potent EMT and CSC Phenotypes Are Induced By Oncostatin-M in Pancreatic Cancer. Mol Cancer Res 15: 478–488. [crossref]
  106. Nomura A, Gupta VK, Daner P, Sharma NS (2018) NFkB-mediated invasiveness in CD133+ pancreatic TICs is regulated by autocrine and paracrine activation of IL1 signaling. Mol Cancer Res 16: 162–72.
  107. Kampalath BN, Liau MC, Burzynski B, Burzynski SR (1987) Chemoprevention by antineoplaston A10 of benzo(a)pyrene-induced pulmonary neoplasia. Drugs Exp Clin Res 1: 51–55. [crossref]
  108. Kampalath BN, Liau MC, Burzynski B, Burzynski SR (1990) Protective effect of Antineoplaston A10 in hepatocarcinogenesis induced by aflatoxin B1. Intl J Tiss React 12: 43–50.
  109. Liau MC, Chang CF, Giovanella BC (1980) Demonstration of an altered S-adenosylmethionine synthetase in human malignant tumors xenografted into athymic nude mice. J Natl Cancer Inst 64: 1071–1075.
  110. Knudson AG Jr (1971) Mutation and cancer: statistical study of retinoblastoma. Proc Natl Acad Sci U S A 68: 820–823. [crossref]
  111. Liau MC, Chang CF, Becker FF (1979) Alteration of S-adenosylmethionine synthetase during chemical hepatocsarcinogensis and in resulting carcinoma. Cancer Res 39: 2103–2109.
  112. Morley JE (2001) Hormone, aging, and endocrines in the elderly. In: Felig P, Frohman LA, “endocrinology and Metabolism, 4th (edn), McGrow-Hill, Inc., Medical Publishing Division, New York, Pg No: 1455–1482.
  113. Liau MC, Leong Y, Liau CP, Burzynski SR (1992) Prevention of Drug-induced DNA hypermethylation by antineoplaston components. Intl J Exptl Clin Chemother 5: 19–27.
  114. Bagheri V, Memar B, Behzadi R, Aliakbarian M (2018) Isolation and identification of chemotherapy-enriched sphere forming cells from a patient with gastric cancer. J Cell Physiol 233: 7036–7046.
Mithramycin-A Induced Toxicity in HepG2 Cells is mediated by Disruption of Calcium Homeostasis

DOI: 10.31038/JPPR.2019211

Abstract

Mithramycin A is a potent inhibitor of EWS-FLI1, a transcription factor implicated in Ewings sarcoma. However, a clinical trial initiated to evaluate its efficacy revealed hepatotoxicity at doses well below those required for inhibition of EWS-FLI1 activity. In the present study, we used a chemogenomic screen against gene deletion mutants of the yeast Saccharomyces cerevisiae to generate hypothesis on its cellular mechanism of hepatotoxicity. Our findings show that it disrupts calcium homeostasis in S. cerevisiae.  Studies in HepG2 cells grown in monolayer and as spheroids confirmed that it not only induced sustained elevated cytosolic Ca2+ levels but also induced endoplasmic reticulum stress. Cells exposed to the compound were ultimately found to undergo calpain mediated apoptosis. These data suggest that mithramycin A is a direct toxin to liver cells and its toxicity is mediated, at least in part, by disruption of Ca2+ homeostasis.

Keywords

Mithramycin A; Hepatotoxicity; HepG2 cells; Calcium homeostasis

Introduction

Mithramycin A (MTA) is a microbial product first isolated from fermentation of Streptomyces plicatus [1]. In a previous work employing high throughput screening aimed at the discovery of small molecule inhibitors of the transcription factor EWS-FLI1, a therapeutic target in Ewings sarcoma, we reported the identification of MTA as the highest scoring inhibitor. EWS-FLI1, an aberrant transcription factor arising from a reciprocal chromosomal translocation mutation, is only found in Ewings sarcoma tumor cells and, as such, represents an attractive therapeutic target. As with most cancer related transcription factors, however, it has been difficult to target because of lack of surface involutions suitable for high affinity binding of small molecules. Based on results from studies in xenografts and reports of clinical activity in the early seventies [2,3], a combined phase I/II clinical trial was initiated. However, MTA was found to induce liver toxicity in patients at a plasma concentration substantially below that required to suppress EWS-FLI1 activity [4]. The discovery of MTA as a potent inhibitor of EWS-FLI1 activity has made targeting this transcription factor tractable while also opening avenues for the development of MTA analogs with improved liver toxicity profiles. We recently tested several biosynthetic analogs of MTA and identified two analogs with improved targeting of EWS-FLI1 [5]. Though its mechanism of liver toxicity is not well understood, reports of hepatotoxicity in humans along with those observed in animal models suggest that MTA may be a direct hepatotoxin [6]. A better understanding of the mechanism of liver toxicity of MTA and analogs currently under preclinical testing is needed to identify suitable analogs for further development.

Materials and Methods

Reagents, Cells and Culture Conditions

MTA (Cayman Chemical, Cat. #11434), calcium orange (ThermoFisher, Cat. #C3015), HepG2 (ATCC, Cat. #HB-8065), ionomycin (Sigma, Cat. #407953) were all commercially obtained. Caspase3/7 spheroid staining reagent was obtained from Nexcelom (Cat. #CS1-V0002-1) while luciferase reporter constructs for ATF6 (Cat. #E3661), NFAT (Cat. #E8481), and CRE (Cat. #E8471) were all obtained from Promega.

MTA Yeast Chemogenomic Screen

MTA Minimum Inhibitory Concentration (MIC) in the wild type yeast BY4743 (MATa/α his3Δ1/his3Δ1 leu2Δ0/leu2Δ0 LYS2/lys2Δ0 met15Δ0/MET15 ura3Δ0/ura3Δ0) was determined using the broth microdilution assay [7]. A range of sub-inhibitory concentrations (2.4 – 3mM) were first tested to determine a dose that causes 10–20% growth inhibition. This concentration was used for a genome-wide screening of Saccharomyces cerevisiae pooled deletion collection, composed of essential heterozygous (~1150 strains) and homozygous (~4800 strains) diploid gene deletion mutants. These were separately diluted to an OD600 of 0.06 in 900µL of YPD medium containing either 2.7mM MTA or DMSO and were grown in 48-well plates for 10 and 20 generations at 30 °C, respectively. The heterozygous and homozygous samples were then combined and 3 OD600 unit of cells for each sample were collected for genomic DNA extraction, PCR amplification of molecular barcodes, microarray hybridization and scanning as previously described [8,9]. Two independent biological replicates were performed for each sample. Intensity values for the barcodes on the TAG4 arrays are extracted by the GeneChip operating software (Affymetrix) and log2 ratio of the median normalized intensity values of each barcode in drug treated vs. DMSO control was calculated using GeneSpring software (ver. 13.0). This data has been deposited at NCBI’s Gene Expression Omnibus inder accession number GSE122458. Gene ontology (GO) enrichment analysis with BiNGO (ver. 3.0.3), a Cytoscape (ver. 3.3.0) plug-in [10], was used for functional profiling of susceptible mutants in our large-scale experiment. Significantly enriched biological processes and cellular components were evaluated using a hypergeometric test corrected for multiple hypothesis testing (P < 0.0001) using a Benjamini-Hochberg false discovery rate (FDR) correction and then visualized using the Enrichment Map (ver. 2.0.1) plug-in [11] developed for Cytoscape. Nodes in maps represent enriched biological processes or cellular components (hypergeometric test FDR < 0.0001) with edges indicating gene overlap between enriched processes/cellular components. Line width in maps is proportional to degree of overlap and edges are not shown where the overlap coefficient is less than 0.5.  GO biological processes and cellular components that were too specific (containing less than five genes) or too general (contain greater than 300 genes) were excluded from the maps.

Confirmation of MTA-sensitive Strains

Selected strains identified as MTA-sensitive in the primary screen were subsequently confirmed by growing individual isolates along with the parental strain BY4743 in 100 µL of YPD with or without 2.7mM MTA in 96-well plates for 20 hours at 30 °C and 200 rpm on a shaking incubator. The OD600 for treated and untreated samples was obtained using a BMG OmegaStar plate reader and the relative growth rate determined as the growth ratio of drug treated to untreated controls.

Generating and Imaging HepG2 Spheroids

HepG2 cells being grown in T225 flasks were harvested via trypsinization and pelleted via centrifugation. After removal of the supernatant, the cells were resuspended at 1.75×10⁴ cells per milliliter in EMEM medium containing 10% FBS. 40 µL of this cell suspension was seeded into black-walled clear bottomed ultralow-attachment 384-well plates (Corning, #3830). Cells were incubated for 52–58 hours or until well-defined spheroids were formed. Control and MTA treated spheroids were stained with commercial Hoechst and caspase 3/7 reagents (Nexcelom, #CSK-V0003-1) following the manufacturer’s protocol. Data on spheroid size, shape, fluorescence and bright field images were all acquired on a BioTek Cytation 3 imager using a 10X objective.

JC1, ATP, and Luciferase Reporter Assays

For ATP and luciferase reporter microplate reader-based assays, HepG2 cells were seeded into 384-well plates at a density of 5000 cells per well in 27 µL of phenolred-free growth media. After incubation overnight, cells in these plates were treated with either 10 µM MTA (final concentration), 1 µM ionomycin (final concentration) or DMSO control for 24 hours prior to the addition of ATP reagent as described previously [12]. Eight replicates per condition and two independent experiments were performed. Setup of the reporter assay has been described previously [5]. But briefly, the transcription factor luciferase reporter or minimal-promoter luciferase reporter (negative control), or constitutively active (CMV) luciferase reporter (positive control) were transfected into HepG2 cells (5,000 cells/well) along with a constitutively active renilla luciferase construct in a white 96-well plate. After incubation for 24 hours, medium in each well was replaced 10 µM MTA or DMSO in either standard medium or Ca2+-free MEM spinner medium (Quality Biological, Cat. #112-021-101). After incubation for an additional 24 hours, firefly and renilla luciferase signals were read using Dual-Glo reagent (Promega, Cat. #E2920). Minimal promoter (minP) and constitutively active promoter (CMV) luciferase activity were used as controls to assess background reporter activity and general transcriptional activity, respectively. For the JC1 flow cytometry measurement of changes in mitochondrial membrane potential, HepG2 cells treated with MTA, ionomycin or DMSO for 24 hours were harvested and washed with Hank’s Balanced Salt Solution (HBSS). Pelleted cells were then stained by resuspending in 20 µM JC-1 in HBSS and incubating for 10 minutes at 37 °C. After pelleting, removal of the loading solution, and washing with HBSS, cells were finally resuspended in HBSS buffer. Samples were analyzed on an Accuri C6 flow cytometer. The data acquired were analyzed using FCS Express 4 software.  Four individual samples for each condition were tested and results are reporter as averages from two independent experiments.

Caspase-3/7 and Calpain Activation Assays

HepG2 cells were seeded at 3000 and 8000 cells per well for caspase3/7 and calpain assays, respectively, in 27 µL medium in white 384-well plates and incubated overnight. For caspase assays 3µL of 10X of MTA and controls were added and plates were incubated for 24 hours. After equilibrating to room temperature, caspase activation assay was run following the manufacturer’s protocol (Promega, #G8091) by adding 30 µL of caspase assay reagent, incubating for 30 minutes and reading luminescence using a plate reader. Six replicate wells per treatment were used. For calpain activation assay, after seeding and incubating cells overnight, cells were treated with 1 µL of BAPTA-AM (5 µM final concentration) and incubated for 30 minutes. Following this, calpain activation was measured using an assay kit (Promega, #G8501) with the following modifications in the recommended protocol. 1 µL of the synthetic calpain substrate Suc-LLVY-amino luciferin in Calpain-Glo buffer (20 µM final concentration) was first added

Western Blotting

HepG2 cells were seeded into T75 ultralow attachments Flasks (Corning, Cat. #3814) and allowed to form spheroids by placing in an incubator for 72 hours. MTA or DMSO control was added to these and flasks were allowed to incubate for an additional 48 hours. Spheroids were harvested as pellets via centrifugation. Pellets were then lysed using NP-40 lysis buffer (Thermo, # FNN0021) supplemented with PMSF (1 mM final concentration) and protease inhibitor cocktail (Thermo, #78430). Prepared Lysates were cleared by centrifugation and 20 mg of protein was loaded onto gels. Gels were blotted onto nitrocellulose membranes. These membranes were probed with GRP78 (SantaCruz, #sc-13539) antibody. Blots were then probed with secondary antibodies tagged with IRDye 680 and IRDye 800 prior to scanning with an Odyssey infra-red scanner.

Statistical Analysis

All data reported is shown as the sample mean ± the Standard Deviation (SD). Pairwise comparisons between means of controls and treatment were performed using a Student t-test (two tailed, unpaired, unpaired) where, for each couple of normally distributed populations, the null hypothesis that the means are equal were verified. Difference between control and treatment data was considered statistically significant if the Student t-test gives a significance level P (P value) less than 0.05.

Results

MTA Impacts Cation Homeostasis in S. cerevisiae

The complete pool of barcoded nnon-essential homozygous and essential heterozygous diploid deletion strains of S. cerevisiae was used to identify gene deletions that confer sensitivity to MTA. However, prior to screening this collection, a sub-inhibitory concentration of MTA that resulted in 10–20% (IC10–20) growth of the BY4743 parental strain, 2.7 mM MTA (Figure 1A), was determined under the same condition used for screening the pooled collection. Screening the pooled collection at this concentration and at a log2 ratio cut-off of 2, we found 48 homozygous gene deletion mutants whose growth rates were significantly inhibited in the presence of MTA compared to control treatment. None of the essential heterozygous deletion strains in our screen showed sensitivity to MTA suggesting lack of a specific protein target through which it exerts its inhibitory action in yeast. Hypersensitivity of non-essential homozygous deletion mutants that are involved in the cellular cation homeostasis pathway, however, pointed to the importance of cation homeostasis in resistance to the compound. An analysis of supersensitive mutants indicated a statistically significant enrichment for Gene Ontology (GO) biological process terms relevant to cation homeostasis (Table 1, Figure 1B). Hypersensitivity of deletion mutants in this major functional group to sub-inhibitory concentration of MTA was confirmed by retesting cherry-picked representative individual deletion mutants as shown in Figure 1C. Classification of MTA-sensitive mutants based on GO cellular component revealed significant enrichment for the vacuolar proton-transporting V-type ATPase complex (P-value = 6.92E-07) (Table 2, Figure 1D). Cytosolic Ca2+ homeostasis is a known constitutive function of yeast V-ATPase [13]. Taken together, the MTA chemical-genetic profile presented herein, demonstrates the compound’s impact on cation homeostasis pathway in yeast in general and Ca2+ homeostasis in particular.

Table 1. GO biological process term enrichment in Mithramycin A sensitive strains.

GO Biological Process

P-Value

Systematic Name/Standard Name

Cellular monovalent inorganic cation homeostasis

4.35E-09

YCL005W-A/VMA9, YJL129C/TRK1, YBR127C/VMA2, YEL051W/VMA8, YKL119C7VPH2, YEL027W/VMA3, YGL095C/VPS45, YLR447C/VMA6

Monovalent inorganic cation homeostasis

4.35E-09

Cellular cation homeostasis

8.52E-07

YGL167C/PMR1, YCL005W-A/VMA9, YJL129C/TRK1, YCR044C/PER1, YBR127C/VMA2, YFL051W/VMA8, YKL119C/VPH2, YEL027W/VMA3, YGL095C/VPS45, YLR447C/VMA6

Cellular Ion homeostasis

1.78E-06

Cation homeostasis

1.78E-06

Ion homeostasis

3.80E-06

Cellular chemical homeostasis

3.80E-06

Cellular homeostasis

1.56E-05

Chemical homeostasis

1.55E-05

Monovalent inorganic cation transport

1.12E-05

YCL005W-A/VMA9, YJL129C/TRK1, YBR127C/VMA2, YEL051W/VMA8, YEL027W/VMA3, YLR447C/VMA6

Intracellular pH reduction

4.35E-09

YCL005W-A/VMA9, YBR127C/VMA2, YEL051W/VMA8, YKL119C/VPH2, YEL027W/VMA3, YGL095C/VPS45, YLR447C/VMA6

pH reduction

4.35E-09

vacuolar acidification

4.35E-09

Regulation of intracellular pH

1.44E-08

Regulation of cellular pH

1.44E-08

Regulation of pH

2.00E-08

Energy coupled proton transport, against electrochemical gradient

2.60E-05

YCL005W-A/VMA9, YBR127C/VMA2, YEL027W/VMA3, YLR447C/VMA6

ATP hydrolysis coupled proton transport

2.60E-05

Proton transport

4.81E-05

YCL005W-A/VMA9, YBR127C/VMA2, YEL051W/VMA8, YEL027W/VMA3, YLR447C/VMA6

Hydrogen transport

5.02E-05

Endocytosis

3.77E-05

YNL297C/MON2, YGR167W/CLC1, YBR164C/ARL1, YEL027W/VMA3, YCR028C/FEN2, YLR240W/VPS34, YLR337C/VRP1

Vacuolar transport

5.02E-05

YLR261C/VPS63, YNL297C/MON2, YML071C/COG8, YBR164C/ARL1, YEL027W/VMA3, YGL095C/VPS45, YLR447C/VMA6, YLR372W/EL03

Table 2. GO cellular component term enrichment in MTA sensitive strains.

GO cellular component

P-Value

Systematic Name/Standard Name

vacuolar proton-transporting V-type ATPase complex

6.92E-07

YCL005W-A/VMA9, YBR127C/VMA2, YEL051W/VMA8, YEL027W/VMA3, YLR447C/VMA6

proton-transporting V-type ATPase complex

6.92E-07

proton-transporting two-sector ATPase complex

2.90E-05

vacuolar membrane

3.06E-05

YCL005W-A/VMA9, YCR044C/PER1, YBR127C/VMA2, YEL051W/VMA8, YJL154C/VPS35, YEL027W/VMA3, YCR028C/FEN2, YGL095C/VPS45, YLR240W/VPS34, YLR447C/VMA6

JPPR - 106_Girma Woldemichael_F1

Figure 1. A) An IC10–20 of 2.7mM was determined after prescreening parental (wild-type) yeast against MTA. This concentration was selected for genome-wide screening. B) Map of GO biological process enriched in the MTA chemogenomic profile. C) Confirmation of hypersensitivity of selected strains to MTA. Htb1 deletion mutant was used as negative control. Results represent Mean ± standard deviation of quadruplicates. D) MTA GO cellular component enrichment map.

MTA Induces Persistent Elevation of Cytosolic Calcium Levels in HepG2 Cells

Many proteins involved in acquiring, utilizing, storing, and regulating levels of inorganic ions are functionally conserved from yeast to man [14]. We, therefore, asked whether MTA also had an impact on Ca2+ homeostasis in mammalian liver cells. To determine effect on Ca2+ homeostasis, we used HepG2 cells grown both in monolayer and as spheroids, which are well-suited to studying direct toxicity to liver cells by small molecules [15]. We found that MTA showed a dose dependent reduction in spheroid size and cell viability in HepG2 cells grown in monolayer (Figure 2A). We also found that treatment with MTA resulted in immediate and sustained elevation of cytosolic calcium levels in HepG2 cells cultured in monolayer (Figure 2B). NFAT is known to be expressed in HepG2 cells and contributes to cell proliferation as part of the Ca2+/calcineurin/NFAT signaling pathway [16]. Therefore, a luciferase reporter for NFAT activity was also used to gauge MTA’s impact on Ca2+ levels. This was done in both Ca2+-free and Ca2+-containing medium. The results showed that while MTA treatment significantly increased NFAT reporter activity in HepG2 cells in Ca2+-containing medium, it induced an even greater reporter response in Ca2+-free medium (Figure 2C). Pretreatment with EGTA to chelate extracellular Ca2+ or treatment in Ca2+-free media only partially reversed MTA’s effect on HepG2 spheroid size and shape (Figure 2D). Because of this observation, we next examined any potential effects on the Endoplasmic Reticulum (ER), the largest intracellular Ca2+ store. Increased ATF6 expression has been shown to be a marker of ER stress in HepG2 cells [17]. An ATF6 luciferase reporter construct used to assess changes in ATF6 activity in response to MTA treatment in HepG2 cells being grown in Ca2+-containing and Ca2+-free medium showed a 4.8- and 6.9-fold increase in reporter activity, respectively, on MTA treatment relative to vehicle (Figure 2E). Changes in levels of the ER stress marker protein GRP78 were also readily apparent in lysates from MTA-treated spheroids as shown in Figure 2F [17,18]. These findings appear to implicate increase in cytosolic Ca2+ levels owing to both influx of Ca2+ from the extracellular environment and intracellular stores. Together, these findings also suggest that, similar to observations in yeast, MTA causes disruption of Ca2+ homeostasis in HepG2 cells.

JPPR - 106_Girma Woldemichael_F2

Figure 2. MTA induces rise in cytosolic Ca2+ levels in HepG2 cells. (A) MTA showed dose dependent inhibitory effect on growth of HepG2 spheroids (3D) and cells grown in monolayer (2D). Representative fluorescence imaging of control (DMSO) and MTA treated cells (B) grown as monolayer and loaded with the calcium binding dye calcium Orange AM show increased fluorescence intensity over time in MTA treated cells indicating increase in cytosolic calcium levels.  MTA treatment (10 mM) for 24 hours also resulted in increased luciferase reporter activity in HepG2 cells transiently transfected with a reporter construct for either NFAT (C) or ATF-6 (E) in both Ca2+-containing and Ca2+-free medium relative to control treatment.  (D) Representative images of spheroids of control and MTA (10 mM, 48h) treated HepG2 cells in either Ca2+-free medium or in medium pretreated with 1.8 mM EGTA to chelate extracellular Ca2+ showed partial reversal of MTA’s effect on spheroid size and shape. Western blot of lysates from spheroid treatment with MTA in both Ca2+-containing and Ca2+-free medium showed upregulation of markers of ER stress (F).

MTA Induces Cell Injury in HepG2 Cells

Dysregulation of Ca2+ homeostasis has been implicated in the induction of apoptosis via involvement in onset of the Mitochondrial Permeability Transition (MPT) [19]. As a result, we also looked at whether MTA induced MPT using JC1 to assess changes in the mitochondrial membrane potential. Treatment of HepG2 cells with MTA, however, resulted in an increase in JC1 aggregate signal (Figure 3A) suggesting hyperpolarization of the mitochondrial membrane. We sought corroboration for this finding by quantifying changes in cellular ATP content since ATP production requires the existence of mitochondrial membrane potential. Treated HepG2 cells grown either as monolayer (Figure 3B) or as spheroids (Figure 3C) were both found to have increased total ATP content consistent with findings of increased mitochondrial membrane potential.

JPPR - 106_Girma Woldemichael_F3

Figure 3. MTA increases Mitochondrial potential. A) HepG2 cells treated with 10µM MTA for 24h were stained with JC-1. 1µM of the calcium ionophore ionomycin was used as a positive control. Shown are representative plots of experiments.  Total ATP content in HepG2 cells grown as monolayer (B) and spheroids (C) was measured using ATP fueled luciferase activity 24h after treatment with 10 µM MTA.

Increased mitochondrial membrane potential has been shown to be an early event in the induction of apoptosis in response to treatment by compounds in HepG2 cells [20]. Spheroid imaging and size measurements in many of the experiments conducted also revealed a decrease in size and change in shape upon MTA treatment suggesting impact on cell proliferation and survival. As a result, we first looked at whether MTA induced apoptosis. Imaging of MTA treated HepG2 spheroids stained with caspase 3/7 reagent measuring caspase 3/7 activity revealed that treated cells were positively stained (Figure  4A). Caspase 3/7 activity in MTA treated HepG2 cells grown as a monolayer were also found to be induced 3-fold 48 hours after treatment (Figure 4B). No increase in the activity of caspases 8 or 9 was observed in MTA treated cells. Since induction of apoptosis via activation of caspase 7 by calpain has been implicated in response to increase in cytosolic Ca2+ concentrations [21], calpain activation in HepG2 cells was assessed. It was found that MTA induced a 3-fold increase in calpain activity. Calpain activation by MTA was reversed by pretreatment with the cell permeable calcium chelator BAPTA-AM (Figure 4C).  Pretreatment with BAPTA-AM was also found to inhibit caspase 3/7 (Figure 4D) activation suggesting that this activation is dependent on elevation of free cytosolic Ca2+ levels.  Together, the data on disruption of mitochondrial membrane potential and induction of apoptosis by MTA in HepG2 cells point to MTA being a direct toxin.

JPPR - 106_Girma Woldemichael_F4

Figure 4. MTA induces apoptosis in HepG2 cells.  A) Control, 10 µM MTA and 20 nM staurosporine (positive control) treated HepG2 spheroids were stained with both Hoechst 33342 DNA stain (purple) and caspase 3/7 stain (green) and imaged. Shown are representative images acquired 48h after treatment.   B) Relative caspase 3/7/8/9 activity 48h after treatment with 10 µM MTA.   C) Calpain activation was detected in response to MTA treatment in HepG2 cells using a luminescence detection kit. MTA induced activation was reversed by pretreatment of cells with the intracellular calcium chelator BAPTA-AM.   D) Pretreatment of HepG2 cells with 5 µM BAPTA-AM significantly reduced caspase-3/7 activation by in HepG2 cells treated with 10 µM MTA for 48h.

Discussion

In a previous effort to find novel agents targeting EWS-FLI1 in Ewings sarcoma, we identified MTA as the highest scoring lead compound. However, liver toxicity during clinical trials at subinhibitory concentrations halted development of MTA. A better understanding of the mechanism of its liver toxicity is needed for further development of more recent analogs with improved activity profile. To the best of our knowledge, this is the first study to describe a potential cellular mechanism for its hepatotoxicity.

In the present study, we performed a chemical genomics screen of non-essential homozygous and essential heterozygous gene deletion mutants of S. cerevisiae to gain insight into the MTA’s mode of action. Screening of this “disruptome” against bioactive compounds has been shown to provide valuable insight into target genes and gene involved in resistance to these compounds [22]. Through gene ontology analysis of sensitive strains, we showed that MTA’s chemogenomic profile revealed its involvement in dysregulation of calcium homeostasis through impact on V-ATPases, which are critical for generation of a pH gradient that drives secondary transporters to maintain cellular ion homeostasis. Comparison of MTA’s chemogenomic profile with that of Amiodarone’s shows close similarity [23,24]. Amiodarone’s antifungal activity is mediated by perturbation of calcium homeostasis with hypersensitivity of vma mutants in its chemogenomic profile ascribed to defects in ion homeostasis. Hypersensitivity of multiple vma deletion mutants encoding subunits of the vacuolar membrane H+-ATPase in the MTA chemogenomic profile (i.e., vma9Δ, vma2Δ, vma8Δ, vma3Δ and vma6Δ) not only indicates disruption of the cation homeostasis pathway by MTA but also underscores the critical role of V-ATPases in resistance to MTA’s inhibitory action [25].

There are many reports that link drug-induced liver toxicity to perturbation of calcium homeostasis. Elevation in cytosolic Ca2+ concentration is implicated in toxic liver injury associated with a number of compounds including diclofenac [26], senecionine and trans-4-OH-2-hexenal [27], halothane [28,29], and antivirals efavirenz and ritonavir [30]. In HepG2 cells, we found that MTA induced a sustained increase in cytosolic calcium levels through mobilization from the extra cellular medium and intracellular stores resulting in inhibition of cell proliferation. However, unlike several reports in different cell lines where such elevation causes mitochondrial depolarization and mitochondria mediated apoptosis, we found no alterations in the levels of or activation of mitochondria and apoptosis related proteins including Bcl-2 and BAX ruling out immediate involvement in induction of apoptosis by mitochondria. On the other hand, studies have shown that calpains are activated by sustained elevation of cytosolic calcium in HepG2 cells [31]. Our findings of calpain activation and partial reversal of the apoptosis in MTA treated cells with a calpain inhibitor are consistent with this observation and further underscore the critical role of impaired calcium homeostasis pathway in drug-induced direct hepatotoxicity.

Although its exact cellular mechanism of action has not been elucidated in mammalian cells, studies have shown that MTA forms complexes with GC-rich regions of DNA [32]. Formation of this complex is, however, dependent on the presence of divalent cations [33]. This DNA binding ability is thought to be responsible for its anticancer effects where carcinogenesis and disease progression is driven by transcription factors that preferentially bind GC-rich regions. Comparison of MTA’s haploinsufficiency and homozygous deletion profiles in yeast deletion mutants with those of well-characterized DNA binding compounds such as doxorubicin and actinomycin D [34], however, did not reveal enrichments in genes involved in DNA synthesis and repair. Western blotting analysis of lysates from MTA treated monolayer or spheroid HepG2 cultures also did not show activation of proteins such as ATM and ATR involved in DNA repair. These suggest that, its effect in HepG2 cells is primarily mediated through its impact on calcium homeostasis.

In summary, we propose that MTA acts as a direct hepatotoxin and that this activity ensues subsequent to dysregulation of calcium homeostasis and induction of ER stress resulting in apoptosis. This discovery will allow for a better characterization of hepatotoxicity much earlier in the discovery phase of synthetic and biosynthetic analogs currently being generated for targeting EWS-FLI1 in Ewings sarcoma.

Acknowledgement

This work has been funded in part with Federal funds from the Frederick National Laboratory for Cancer Research, National Institutes of Health, under contract HHSN261200800001E and in part by the Intramural Research Program of NIH, Frederick National Lab, and Center for Cancer Research. The content of this publication does not necessarily reflect the views or policies of the Department of Health and Human Services, nor does the mention of trade names, commercial products, or organizations imply endorsement by the U.S. Government.

References

  1. Haskell T, Ryder A, P. Frohardt R, A. Fusari S, L. Jakubowski Z, et al. (1958) The Isolation and Characterization of Three Crystalline Antibiotics from Streptomyces plicatus. J Am Chem Soc 80: 743–747.
  2. Grohar P, Woldemichael G, Griffin L, Mendoza A, Chen Q-R, et al. (2011) Identification of an Inhibitor of the EWS-FLI1 Oncogenic Transcription Factor by High-Throughput Screening. Journal of the National Cancer Institute 103: 962–978.
  3. Kofman S, Perlia CP, Economou SG (1973) Mithramycin in the treatment of metastatic Ewing’s sarcoma. Cancer 31: 889–893. [crossref]
  4. Grohar PJ, Glod J, Peer CJ, Sissung TM, et al. (2017) A phase I/II trial and pharmacokinetic study of mithramycin in children and adults with refractory Ewing sarcoma and EWS-FLI1 fusion transcript. Cancer Chemother Pharmacol 80: 645–652. [crossref]
  5. Osgood CL, Maloney N, Kidd CG, Kitchen-Goosen SM, Segars LE, et al. (2016) Identification of mithramycin analogs with improved targeting of the EWS-FLI1 transcription factor. Clinical Cancer Research 22: 4105–4118. [crossref]
  6. King PD, Perry MC (2001) Hepatotoxicity of chemotherapy. Oncologist 6: 162–176. [crossref]
  7. CLSI (2008) Reference method for broth dilution antifungal susceptibility testing of yeasts. approved standard M27- A3, 3rd edn, Clinical and Laboratory Standards Institute, Wayne, PA ,USA.
  8. Ericson E, Hoon S, Onge RPS, Giaever G, Nislow C (2010) Exploring gene function and drug action using chemogenomic dosage assays. Methods enzymol 470: 233–255 [crossref]
  9. Pierce SE, Davis RW, Nislow C, Giaever G (2007) Genome-wide analysis of barcoded Saccharomyces cerevisiae gene-deletion mutants in pooled cultures. Nat protoc 2: 2958–2974. [crossref]
  10. Maere S, Heymans K, Kuiper M (2005) BiNGO: a Cytoscape plugin to assess overrepresentation of gene ontology categories in biological networks. Bioinformatics 21: 3448–3449. [crossref]
  11. Merico D, Isserlin R, Stueker O, Emili A, Bader GD (2010) Enrichment map: a network-based method for gene-set enrichment visualization and interpretation. PLoS One 5: e13984. [crossref]
  12. Caropreso V, Darvishi E1, Turbyville TJ2, Ratnayake R1, Grohar PJ3, et al. (2016) Englerin A Inhibits EWS-FLI1 DNA Binding in Ewing Sarcoma Cells. J Biol Chem 291: 10058–10066. [crossref]
  13. Förster C, Kane PM (2000) Cytosolic Ca2+ Homeostasis Is a Constitutive Function of the V-ATPase in Saccharomyces cerevisiae. Journal of Biological Chemistry 275: 38245–38253. [crossref]
  14. Cyert MS, Philpott CC (2013) Regulation of cation balance in Saccharomyces cerevisiae. Genetics 193: 677–713. [crossref]
  15. Ramaiahgari SC, den Braver MW, Herpers B, Terpstra V, Commandeur JNM, et al. (2014) A 3D in vitro model of differentiated HepG2 cell spheroids with improved liver-like properties for repeated dose high-throughput toxicity studies. Archives of Toxicology 88: 1083–1095. [crossref]
  16. Wang S, Kang X, Cao S, Cheng H, Wang D, et al. (2012) Calcineurin/NFATc1 Pathway Contributes to Cell Proliferation in Hepatocellular Carcinoma. Digestive Diseases and Sciences 57: 3184–3188. [crossref]
  17. Bosquet A, Guaita-Esteruelas S, Saavedra P, Rodríguez-Calvo R, Heras M, Girona J, et al. (2016) Exogenous FABP4 induces endoplasmic reticulum stress in HepG2 liver cells. Atherosclerosis 249: 191–199. [crossref]
  18. Woldemichael GM, Turbyville TJ, Vasselli JR, Linehan WM, McMahon JB (2012) Lack of a Functional VHL Gene Product Sensitizes Renal Cell Carcinoma Cells to the Apoptotic Effects of the Protein Synthesis Inhibitor Verrucarin A. Neoplasia 14: 771-IN728. [crossref]
  19. Schanne FA, Kane AB, Young EE, Farber JL (1979) Calcium dependence of toxic cell death: a final common pathway. Science 206: 700–702. [crossref]
  20. Cao J, Liu Y, Jia L, Zhou H-M, Kong Y, Yang G, et al. (2007) Curcumin induces apoptosis through mitochondrial hyperpolarization and mtDNA damage in human hepatoma G2 cells. Free Radical Biology and Medicine 43: 968–975. [crossref]
  21. Gafni J, Cong X, Chen SF, Gibson BW, Ellerby LM (2009) Calpain-1 cleaves and activates caspase-7. J Biol Chem 284: 25441–25449. [crossref]
  22. Giaever G1, Nislow C (2014) The yeast deletion collection: a decade of functional genomics. Genetics 197: 451–465. [crossref]
  23. Gupta SS, Ton VK, Beaudry V, Rulli S, Cunningham K, et al. (2003) Antifungal activity of amiodarone is mediated by disruption of calcium homeostasis. The Journal of biological chemistry 278: 28831–28839. [crossref]
  24. Muend S, Rao R (2008) Fungicidal activity of amiodarone is tightly coupled to calcium influx. FEMS Yeast Res 8: 425–431. [crossref]
  25. Forster C, Kane PM (2000) Cytosolic Ca2+ homeostasis is a constitutive function of the V-ATPase in Saccharomyces cerevisiae. J Biol Chem 275: 38245–38253. [crossref]
  26. Lim MS, Lim PL, Gupta R, Boelsterli UA (2006) Critical role of free cytosolic calcium, but not uncoupling, in mitochondrial permeability transition and cell death induced by diclofenac oxidative metabolites in immortalized human hepatocytes. Toxicology and applied pharmacology 217: 322–331. [crossref]
  27. Griffin DS, Segall HJ (1987) Role of cellular calcium homeostasis in toxic liver injury induced by the pyrrolizidine alkaloid senecionine and the alkenal trans-4-OH-2-hexenal. Journal of biochemical toxicology 2: 155–167. [crossref]
  28. Farrell GC, Mahoney J, Bilous M, Frost L (1988) Altered hepatic calcium homeostasis in guinea pigs with halothane-induced hepatotoxicity. J Pharmacol Exp Ther 247: 751–756. [crossref]
  29. Yu WF, Yang LQ, Zhou MT, Liu ZQ, Li Q (2005) Ca2+ cytochemical changes of hepatotoxicity caused by halothane and sevoflurane in enzyme-induced hypoxic rats. World J Gastroenterol 11: 5025–5028. [crossref]
  30. Kao E, Shinohara M, Feng M, Lau MY, Ji C (2012) Human immunodeficiency virus protease inhibitors modulate Ca2+ homeostasis and potentiate alcoholic stress and injury in mice and primary mouse and human hepatocytes. Hepatology (Baltimore, Md) 56: 594–604. [crossref]
  31. Caro AA, Cederbaum AI (2002) Role of calcium and calcium-activated proteases in CYP2E1-dependent toxicity in HEPG2 cells. J Biol Chem 277: 104–113. [crossref]
  32. Albertini V, Jain A, Vignati S, Napoli S, Rinaldi A, et al. (2006) Novel GC-rich DNA-binding compound produced by a genetically engineered mutant of the mithramycin producer Streptomyces argillaceus exhibits improved transcriptional repressor activity: implications for cancer therapy. Nucleic acids research 34: 1721–1734. [crossref]
  33. Cons BM1, Fox KR (1989) Interaction of mithramycin with metal ions and DNA. Biochem Biophys Res Commun 160: 517–524. [crossref]
  34. Hoepfner D, Helliwell SB, Sadlish H, Schuierer S, Filipuzzi I, et al. (2014) High-resolution chemical dissection of a model eukaryote reveals targets, pathways and gene functions. Microbiological Research 169: 107–120. [crossref]

Might Actinomycin be Used to Cure All Cancer?

DOI: 10.31038/CST.2019411

In addition to curing Wilm’s tumor and choriocarcinoma, I propose actinomycin to be more widely used to cure ALL cancer – i.e., curing lung, colon, breast, ovarian and other cancers – for the reasons described in this communication.

The discovery that actinomycin is a powerful anticancer agent against Wilm’s tumor and choriocarcinoma was made by Sidney Farber in the early 1950’s. This miraculous discovery is known to dramatically cure patients suffering from these embryonic tumors — and still remains the treatment of choice to this day!

Although it is not known whether actinomycin can be used to treat ALL cancers – the purpose of this letter is to call attention to the possibility that trace amounts of actinomycin given over an extended period of time could prove to be a powerful anticancer chemotherapeutic regimen. It is important that the medical community realize this, and to understand how actinomycin acts to defeat cancer.

Background Information

Actinomycin D is a naturally occurring cyclic-polypeptide containing antibiotic known to bind to DNA and inhibit RNA synthesis (see Figure 1) 1–4]. It does this by interfering with the elongation of growing RNA chains by the RNA polymerase enzyme 5]. Nucleolar 5S ribosomal RNA-synthesis is known to be particularly sensitive to the presence of actinomycin, and this accounts for its pharmacological activity as well as its extreme toxicity to mammalian cells [6, 7].

CST-2019-101_F1

Figure 1. Chemical structure of actinomycin D. (L meval: L methyl valine; sar: sarcosine; L pro: L proline; D val: D valine; L thr: L threonine)

Stereochemistry of Actinomycin-DNA Binding

Several years ago, we determined the three-dimensional structure of an actinomycin-deoxyguanosine complex by x-ray crystallography [8–11]. The stereochemical information obtained from this study suggested a model to understand the general features of how actinomycin binds to DNA. According to this model, the phenoxazone ring system on actinomycin intercalates between adjacent guanine-cytosine base-pairs, while pentapeptide chains lie in the narrow groove of the B- helix to form hydrogen bonds with guanine residues on opposite chains. Implicit in this model was the assumption that actinomycin binds to B-DNA, or a distorted B-DNA form. The possibility that actinomycin might bind to some other discretely different DNA conformational-state was not envisioned at that time.

A modification to this actinomycin-DNA binding model was subsequently proposed, which allows one to understand its mechanism of action (see Figure 2). This model is similar to the previous one; however, it predicts that actinomycin to bind to (what we have called) beta-DNA (i.e., not to B-DNA), this being a metastable and hyperflexible premelted form inferred from our wider crystallographic studies of planar drug molecules intercalated into a series of DNA-like and RNA-like self-complementary dinucleoside-monophosphates [12–14].

CST-2019-101_F2

Figure 2. Actinomycin: beta-DNA binding model.

Figure 3 shows this same (extended) beta-DNA structure “pinned” by ethidium. The complex is an organized right-handed double helical structure in which the beta-structural element plus the intercalator form the asymmetric unit of the helix. This maximally elongated and unwound DNA duplex-structure, pinned by ethidium at saturating concentrations, readily explains the well-known observation of neighbor-exclusion intercalative drug-binding [15–17].

CST-2019-101_F3

Figure 3. Ethidium: beta-DNA binding model

Mechanism of Action of Actinomycin D

I have next proposed beta-DNA to be an obligatory intermediate (i.e., a transition-state intermediate) in DNA-melting. This concept readily leads to understanding the mechanism of action of actinomycin D.

Figure 4 (a) shows an electron-micrograph of nucleolar 5-S ribosomal-RNA genes undergoing very active transcription in malignant Hela cells [18] and my interpretation of this process (b) — which indicates the mechanism of action of actinomycin D [19, 20].

CST-2019-101_F4

Figure 4. (a) Electron-micrograph of nucleolar 5-S ribosomal-RNA genes undergoing very active transcription within dividing amphibian oocytes [18]. (b) Interpretation of this photomicrograph showing how actinomycin might act to inhibit this process. Actinomycin binds to beta-DNA, a conformational intermediate that exists within the boundaries connecting double-stranded B-DNA with single-stranded DNA in the transcription complex. This immobilizes (i.e., “pins”) the complex, interfering with the elongation of growing RNA chains.

Actinomycin intercalates into beta-DNA found within the boundaries connecting double-stranded B-DNA with single-stranded DNA in the transcription-complex. This immobilizes (i.e., “pins”) the complex, interfering with the elongation of growing RNA-chains. In extremely active genes such as these, RNA polymerases lie in a close-packed arrangement along DNA. Interference with the movement of one polymerase by actinomycin is expected to inhibit the movement of other polymerases. This predicts nucleolar 5-S ribosomal RNS synthesis to be extremely sensitive to the presence of actinomycin [21–25].

Might actinomycin be expected to preferentially kill malignant cells?

Nucleoli within each nucleus in malignant cells (such as Hela-cells) are expected to contain large numbers of tandem repeats of 5-S ribosomal genes undergoing transcription. Since rapidly dividing malignant cells require increased numbers of ribosomes to carry out protein synthesis, they need many more tandem repeats of 5-S ribosomal genes per nucleoli than normal cells (or alternatively, it is possible that each nucleus within a malignant cell contains many more nucleoli than normal cells, the number of tandem repeats of 5-S ribosomal genes in each nucleolus remaining the same).

The presence of an effect such as this could allow actinomycin to preferentially kill malignant cells. For this reason, trace amounts of actinomycin given over extended periods of time can be expected to be a powerful anticancer chemotherapeutic regimen. Of course, it is first necessary to carry out the appropriate experiments in mice or in other related mammals before attempting clinical use.

References

  1. KIRK JM (1960) The mode of action of actinomycin D. Biochim Biophys Acta 42: 167–169.
  2. GOLDBERG IH, RABINOWITZ M (1962) Actionmycin D inhibition of deoxyribonucleic acid-dependent synthesis of ribonucleic acid. Science 136: 315–316.
  3. GOLDBERG IH, RABINOWITZ M, REICH E (1962) Basis of actinomycin action. I. DNA binding and inhibition of RNA-polymerase synthetic reactions by actinomycin. Proc Natl Acad Sci USA 48: 2094–2101.
  4. Reich E, Goldberg IH (1964) Actinomycin and nucleic acid function. Prog Nucleic Acid Res Mol Biol 3: 183–234.
  5. Sentenac A, Simon EJ, Fromageot P (1968) Initiation of chains by RNA polymerase and the effects of inhibitors studied by a direct filtration technique. Biochim Biophys Acta 161: 299–308.
  6. Perry RP (1963) Selective effects of actinomycin D on the intracellular distribution of RNA synthesis in tissue culture cells.  Exp Cell Res 29: 400–406
  7. Goldberg, IH (1975) Handb Exp Pharmacol. 38: 582–592
  8. Sobell HM, Jain SC, Sakore TD, Nordman CE (1971) Stereochemistry of actinomycin–DNA binding. Nat New Biol 231: 200–205.
  9. Jain, SC, Sobell, HM (1972) Stereochemistry of actinomycin binding to DNA. I. Refinement and further structural details of the actinomycin-deoxyguanosine crystalline complex. J Mol Biol 68: 1–20
  10. Sobell HM, Jain SC (1972) Stereochemistry of actinomycin binding to DNA. II. Detailed molecular model of actinomycin-DNA complex and its implications. J Mol Biol 68: 21–34.
  11. Sobell HM (1974) How actinomycin binds to DNA. Sci Am 231: 82–91.
  12. Sobell HM (1985) Actinomycin and DNA transcription. Proc Natl Acad Sci USA 82: 5328–5331.
  13. Sobell, HM (2009) Premeltons in DNA, Explanatory Publications, Lake Luzerne, NY ISBN 978-0-615-33828-6
  14. Sobell, HM (2013) Organization of DNA in Chromatin, Explanatory Publications, Lake Luzerne, NY ISBN 978-0-692-01974-0
  15. Crothers, DM (1968) Calculation of binding isotherms for heterogeous polymers. Biopolymers 6: 575–583
  16. Wells RD, Larson JE (1970) Studies on the binding of actinomycin D to DNA and DNA model polymers. J Mol Biol 49: 319–342.
  17. Bond PJ, Langridge R, Jennette KW, Lippard SJ (1975) X-ray fiber diffraction evidence for neighbor exclusion binding of a platinum metallointercalation reagent to DNA. Proc Natl Acad Sci USA 72: 4825–4829.
  18. Miller OL Jr, Beatty BR (1969) Visualization of nucleolar genes. Science 164: 955–957.
  19. Sobell HM1 (2016) Premeltons in DNA. J Struct Funct Genomics 17: 17–31.
  20. Sobell, HM (2016) How actinomycin binds to DNA and exerts its mechanism of action. J Struct Funct Genomics
  21. Sobell, HM (2017) World Journal of Pharmaceutical Research 6: 78–84
  22. Sobell, HM (2018) International Journal of Biopharmaceutical Sciences Boffin Access UK  Premeltons in DNA (in press)
  23. Sobell, HM (2018) International Journal of Biopharmaceutical Sciences Boffin Access UK ` Organization of DNA in Chromatin (in press)
  24. Leroy Liu and James Wang have provided a key insight into the nature of DNA supercoiling accompanying transcription that has shed additional light on this question. They have theorized that – in the presence of significant resistance to the rotational motion of the RNA polymerase and its nascent RNA chain around DNA during transcription – the advancing polymerase generates positive superhelicity in the DNA template ahead of it, and negative superhelicity behind it. In nucleolar genes, where there may as many as 200 RNA polymerases moving down the DNA template while synthesizing growing ribosomal RNA-chains, positive and negative superhelical DNA regions between them annihilate one-another, causing adjacent chains to bond-together to form “trains” of transcription complexes, these now moving synchronously along DNA. If this were the case, then the binding by one actinomycin molecule is sufficient to stop the entire “transcription-train” from moving along DNA.
  25. Liu LF1, Wang JC (1987) Supercoiling of the DNA template during transcription. Proc Natl Acad Sci USA 84: 7024–7027.

Osteomyelitis in Children, What to do?

DOI: 10.31038/IJOT.2019211

Introduction

Osteomyelitis is defined as inflammation of the bone with subsequent bone destruction [1]. Osteomyelitis in children has been a diagnostic challenge for decades. Hematogenous osteomyelitis presents clinically versatile, depending on age and causative organism. Historically osteomyelitis has been classified by pathogenesis and duration. Osteomyelitis in children is primary of haematogenous origin [2–5] and was thought to originate from the metaphysis of long bones due to low blood flow in end capillaries [6]. Metaphyseal vessels are open ended towards the physis (growth plate) in long bones. Therefore Stephen RF. et al. [7] suggested the junctions between epiphysis and metaphysis to be the origin of infection in acute osteomyelitis. Time between onset of symptoms and confirmed diagnosis defines acute (within 14 days), subacute (within 3 months) and chronic osteomyelitis (more than 3 months) [8, 9].

Osteomyelitis in children most often originates from long bones, the lower extremities being the most common site, distributed as femur (23–29%), tibia (19–26%) and fibula (4–10%) [5, 9].

Fractures and bony malignancies as Ewing’s sarcoma are important differential diagnoses to rule out during initial assesment. Complications of untreated osteomyelitis in children are septic arthritis, growth retardation due to damage to the physis, bone deformation, angular deformity, septicemia, organ failure and death [5, 10, 11].

Diagnostics

The diagnostic process is multimodal. Both biochemistry and image modalities are required to support the diagnosis sufficiently. Especially imaging modalities has evolved over recent years enabling detailed information on infection status. [3]

A systematic review on acute heamatogenous osteomyelitis [8] showed elevated C-reactive protein (CRP) in 80.5% of children on admission on presentation, 91% had raised Erythrocyte Sedimentation Rate (ESR) and 35.9% had leukocytosis. Pääkönen M. et al evaluated inflammatory markers in 265 children with septic arthritis, osteomyelitis or both. They found sensitivity of ESR and CRP to be 94% and 95% respectively. Raised CRP and ESR simultaneously have a sensitivity of 98% for osteoarticular infection [12]. CRP has short half-life and is inexpensive which makes it useful for monitoring treatment [8, 9].

Subacute osteomyelitis presents with mild symptoms and often no positive laboratory findings [13]. Several studies [13, 14] have presented case series of subacute osteomyelitis in children, with low sensitivities of CRP, ESR and leukocytes.

Standard radiographs have differential diagnostic value, whereas early diagnosis of infection is dependent on more dynamic image modalities. Visible infection on plain radiographs is seen two to three weeks after onset of symptoms [9].

Magnetic resonance imaging (MRI) is the preferred modality for detecting primary focus of infection and it can be helpful in planning surgery. Several studies have documented sensitivity of 82–100% and specificity of 75–99% [10, 15]

Ultra Sonography can reveal subperiosteal changes, evaluate soft tissue and joint effusion and hence have a role in supporting the diagnosis [5].

Bone scans can be useful in multifocal disease and when no clear origin of infection has been found. In neonates specificity is lower due to higher rate of false negative scans [5, 8]. In a recent study, white blood cell scintigraphy was found convincing in detecting post traumatic osteomyelitis [16] Another study reported sensitivity of 79% and a specificity of 97% in detecting fracture related bony infection in peripheral bones [17].

Microbiology and Antibiotics

Staphylococcus Aureus, streptococcus and gram-negative organisms are primary causative organisms in young children [8]. In recent years the facultative anaerobic Gram-negative bacillus Kingella Kingae has been recognized as among the most common pathogen in children between six months and four years of age with haematogenous osteomyelitis [4, 6]. Several published case series includes patients, in which no bacteriological causative organism is identified by microbiological tests on blood, pus or bone biopsy [11, 18].

Antibiotic treatment regimes of acute osteomyelitis in children have historically been 4–6 weeks in total [3, 5]. Two systematic reviews find short intravenous course (3–4 days) followed by 3 weeks of oral therapy as effective as longer intravenous treatment regimes, in uncomplicated cases of acute osteomyelitis.[8, 19] A recent open review concludes that definite guidelines for treatment length and route of administration are yet to be established [4].

Initial empirical treatment, if prevalence of Methicillin Sensitive Staphylococcus Aureus (MSSA) >90%, is in several studies recommended as short course intravenous antistaphylococcal penicillin. Benzylpenicillin/cephalosporin is added if patient is not immunized against Haemophilus Influenzae. When clinical improvement and lowered inflammatory markers treatment is finished by oral regime 3–4 weeks [3–5, 8]. In Methicillin Resistant Staphylococcus Aureus (MRSA) endemic areas, prevalence >10% in community Clindamycin or Vancomycin are recommended [3, 9].

Case Presentation

A nine year old boy was referred to our outpatient clinic from the general practitioner, with plain radiographic findings suspicious of bony malignancy in left proximal fibula (Figure 1). The patient was otherwise healthy and had followed standard Danish children vaccine program.

IJOT - 106_Rikke Thorninger_F1

Figure 1. Primary plain x-­ray when patient was admitted to our department showing isolated process in left proximal fibula.

The boy had 4 weeks lasting constant pain in proximal fibula of the left leg. There had been a minor contusion to the left knee prior to onset of pain. There had been no fewer, swelling or redness of the left leg at any time during period of pain.

Physical examination revealed slim inconspicuously looking legs with no difference between sides. Inspection showed no difference between healthy and affected leg. Palpation of the proximal fibula was painful.

Left leg movement was free and painless, and the neurovascular status was normal. X-ray and subsequently magnetic resonance scanning and computed tomography scan showed large sequester in the left proximal fibula (Figure 3), arising suspicion of sub-acute osteomyelitis. Blood sample inflammatory makers was all within normal range and there were no systemic signs of infection.

The sequester in left fibula was surgically removed with additional decortication above affected bone and clearing of the bone marrow canal. A Gentamicin implant was placed in the bone defect. The pathologic bone was microscopically evaluated and cultured. Cultures were all negative, microscopy showed no signs of acute or chronic inflammation. Morphology was found suspicious of osteofibrous dysplasia. Subsequent multidisciplinary team conference, at Aarhus University Hospital concluded that radiographic material and history suggested subacute osteomyelitis. Osteofibrous dysplasia and malignancy were excluded.

The patient underwent 14 days intravenous treatment postoperatively, with benzylpenicillin and dicloxacillin. After discharge treatment was completed with 4 weeks of per oral dicloxacillin. Amoxycillin/ Clauvulanic acid was primary per oral choice, but was stopped due to allergic skin reaction presenting within five days. Throughout the treatment period all blood tests were within normal range.

At three month follow up, the patient had recovered and had complete remission of pain. Radiographs showed healing in the defect area (Figure 2).

IJOT - 106_Rikke Thorninger_F2

Figure 2. Plain radiographs three months after surgery showed healing around bony defect in proximal fibula.

IJOT - 106_Rikke Thorninger_F3

Figure 3. Magnetic resonance image prior to sugery, showing sequestra in left proximal fibula.

Discussion

In the presented case, a multidisciplinary team discussed paraclinical findings and sustained subacute osteomyelitis as tentative diagnosis, although blood samples had been normal and there were no sign of inflammation in sequestral bone biopsies. In a retrospective study with 121 children diagnosed with acute haematogenous osteomyelitis, sensitivity of blood culture was 32.4% and sensitivity of biopsy culture was 46.6%. In this study 16.5% of patients included underwent surgery [11] Several studies suggest that surgery is reserved for those not responding to standard treatment, but may provide early microbiological diagnose and accelerate patient recovery [3–5]

The patient of this case was offered surgery and subsequently antibiotic therapy. The clinical follow up showed full recovery and remission of symptoms. Inflammatory markers, CRP, leukocytes and ESR was unchanged and within normal range. As pointed out in several studies [3, 4, 8, 20] there are no definite guidelines or clear consensus for assessment and treatment strategy for acute or especially subacute osteomyelitis in children. In this case treatment for suspected osteomyelitis was effectuated without final radiographic or microbiological diagnosis. Total remission of symptoms was seen within the first week after surgery, and there were no clinical sign of infection local or systemic.

The results of this treatment strategy were early recovery and minimal delay due to further diagnostic processes.

Bone abscess representing subacute osteomyelitis can clinically and radiographically mimic bony malignant tumors, being and important differential diagnosis [21]. Dhanoa A. et al. [20] presented six cases, including one child and three adolescents, with initial suspicion of bony malignancy. All cases where diagnosed with subacute osteomyelitis, confirmed by histopathological exam of needle biopsies and microbiological test. The diagnostic process represents a potential delay in relevant treatment of subacute osteomyelitis, and has been described as a clinical and diagnostic challenge [13, 20].

Our patient underwent surgical removal and in total 6 weeks of antibiotic treatment, although no microbiological diagnosis was obtained and biopsy showed no clear sign of osteomyelitis. For subacute osteomyelitis we recommend short antibiotic therapy, initial intravenously and shift to oral therapy guided primarily on clinical remission rather than laboratory testing. In cases with radiographically well defined abscesses, surgically debridement and cleansing of affected bone might support faster recovery and shorter antibiotic treatment regimes.

Further studies are needed to define and test diagnostic algorithms to support clinical decision making and minimize diagnostic delay.

References

  1. de Graaf  H, Sukhtankar P, Arch B, et al (2017) Duration of intravenous antibiotic therapy for children with acute osteomyelitis or septic arthritis: a feasibility study. Health Technol Assess 21: 1–164. [crossref]
  2. Schmitt SK (2017) Osteomyelitis. Infect Dis Clin North Am 31: 325–338. [crossref]
  3. Harik NS, MS Smeltzer (2010) Management of acute hematogenous osteomyelitis in children. Expert Rev Anti Infect Ther 8: 175- 181.
  4. Iliadis AD, Ramachandran M (2017) Paediatric bone and joint infection. EFORT Open Rev 2: 7–12. [crossref]
  5. Yeo A, Ramachandran M (2014) Acute haematogenous osteomyelitis in children. BMJ 348: 66. [crossref]
  6. Jaramillo D, et al (2017) Hematogenous Osteomyelitis in Infants and Children: Imaging of a Changing Disease. Radiology  283: 629–643.
  7. Stephen RF, MK Benson, S Nade (2012) Misconceptions about childhood acute osteomyelitis. J Child Orthop 6: 353–356.
  8. Dartnell J, M Ramachandran, M Katchburian (2012) Haematogenous acute and subacute paediatric osteomyelitis: a systematic review of the literature. J Bone Joint Surg Br 94: 584–595.
  9. Peltola H, Pääkkönen M (2014) Acute osteomyelitis in children. N Engl J Med 370: 352–360. [crossref]
  10. van Schuppen J, MM van Doorn, RR van Rijn (2012) Childhood osteomyelitis: imaging characteristics. Insights Imaging 3: 519–533.
  11. Chiappini E, et al (2017) Epidemiology and Management of Acute Haematogenous Osteomyelitis in a Tertiary Paediatric Center. Int J Environ Res Public Health 14(5).
  12. Paakkonen M, et al (2010) Sensitivity of erythrocyte sedimentation rate and C– reactive protein in childhood bone and joint infections. Clin Orthop Relat Res 468: 861–866.
  13. Spyropoulou V, et al (2016) Primary subacute hematogenous osteomyelitis in children: a clearer bacteriological etiology. J Child Orthop 10: 241–246.
  14. Foster CE, et al (2018) Brodie’s Abscess in Children: A Ten–Year Single Institution Retrospective Review. Pediatr Infect Dis J 2018.
  15. Thevenin–Lemoine C, et al (2016) MRI of acute osteomyelitis in long bones of children: Pathophysiology study. Orthop Traumatol Surg Res 102:  831–837.
  16. Govaert GA, IJpma FF, McNally M, McNally E, et al (2017) Accuracy of diagnostic imaging modalities for peripheral post-traumatic osteomyelitis – a systematic review of the recent literature. Eur J Nucl Med Mol Imaging 44: 1393–1407. [crossref]
  17. Govaert, GAM, et al (2018) High diagnostic accuracy of white blood cell scintigraphy for fracture related infections: Results of a large retrospective single–center study. Injury 49: 1085–1090.
  18. Floyed, RL, RW Steele (2003) Culture negative osteomyelitis. Pediatr Infect Dis J  22: 731–736.
  19. Howard–Jones, AR, D Isaacs (2013) Systematic review of duration and choice of systemic antibiotic therapy for acute haematogenous bacterial osteomyelitis in children. J Paediatr Child Health 49: 760–768.
  20. Dhanoa A, VA Singh (2010) Subacute osteomyelitis masquerading as primary bone sarcoma: report of six cases. Surg Infect (Larchmt) 11: 475–478.
  21. McCarville MB (2009) The child with bone pain: malignancies and mimickers. Cancer Imaging 9: 115–121. [crossref]

Predicting Voice Mutation by Larynx and Voice Modifications

DOI: 10.31038/SRR.2019212

Abstract

Objective: To determine whether the vocal folds length, along with the acoustic voice parameters measurements, can predict the moment of upcoming voice mutation and assess the process of a child’s maturation.

Study design: A cohort study started with examination of children at a premutation age, and a follow up 2.5 and 5 years later.

Setting: Referral center (Claros Otorhinolaryngology Clinic)

Subjects and methods: Children at a premutation age were examined, with a follow up at a mutation and postmutation age. During each visit a CT examination was performed to determine vocal folds length, followed by an examination of the acoustic voice parameters and a videolaryngoscopy and videostroboscopy. Obtained values were analyzed statistically to find the correlations between them and the reported age of mutation.

Results: 50 children (25 males aged 11.5, and 25 females aged 9.5, with a follow up 2.5 and 5 years later) were examined. A study started with 73 children, but 23 of them failed to attend the first or second follow up. Statistical significance was reported for a correlation between the age of mutation and loudness in boys aged 14 (r = 0.48, b = 0.31), vocal folds length in boys aged 14 (b = – 2.18), and loudness in boys aged 11.5 (b = -0.15); and for girls for a correlation between the age of mutation and decrease of fundamental frequency between ages 9.5 and 12 (r = 0.5, b = 0.01).

Conclusion: The parameters mentioned above have a correlation with the moment of mutation and might in future become an additional way of evaluating a child’s development.

Keywords

Voice mutation, Voice break, Vocal fold length, Voice acoustic parameters, Child’s development

Introduction

Proper development in a child can determine his/her educational, professional and emotional future. We watch carefully during child’s growth if this process is not disturbed. However, it is not easy to evaluate; especially during puberty, which is unique to every child and is determined by such an unpredictable and complex factor as the game of hormones [1]. Many authors agree that, while assessing the moment of puberty in girls is easy because of the presence of menarche and breast growth, it is more difficult in boys because of a lack of these concrete breaking moments and its extended character [2, 3]. It is well known that, in contrast, the situation is opposite with respect to mutation; i.e. it happens in a much more subtle way for girls, whilst for boys mutation happens suddenly, more dramatically, and more noticeably [2, 4, 5]. The interesting phenomenon of voice break during puberty has tempted many authors to evaluate the development of a child by assessing the age of voice break as a clean sign of puberty.1, 6, 7 Although exploring the subject of mutation by evaluating the acoustic parameters of the voice has received a reasonable amount of attention in the literature [6, 8–11], the other ways of predicting the time of mutation, especially by examining the length of vocal folds based on CT scans, are to the best of our knowledge underexplored. We conducted our research to address this gap.

Our Clinic is a widely known consultancy for professional opera singers of the Gran Teatro del Liceo in Barcelona, specializing in the issue of voice since 1970, and also providing medical support for a large number of Spanish children. The medical data presented in this article is the result of our work over the past five years. The objective of our research was to establish correlations between the change of vocal folds length and acoustic parameters and signs of voice break described by children and their parents, and therefore to determine which combination of parameters would be the best to evaluate a child’s development.

Changes in the vocal box over the growth of a child are the consequence of complex coordination between the respiratory, digestive and nervous systems [12], as well as anatomical, histological and neurological modifications [13]. In comparison to the adult larynx, the pediatric larynx has disadvantages in voice production on an anatomical level [4], insofar as the ratio of the membranous vocal fold length to the total vocal fold length is lower, the cartilaginous framework is less rigid, and the incidence and degree of posterior glottic chink is increased [14]. Histologically, the pediatric larynx also varies a lot compared to the adult one, which manifests mainly in increased cellularity and decreased cellular differentiation and organization [15], as well as in the lamina propria which begins as a monolayer [16, 17], and changes into a bilayer around the age of 10 and into a trilayer after puberty [18]. Some authors argue that the triple structure of lamina propria occurs already at the age of 7 [4, 19], however, it is widely accepted that the distribution and composition of the collagen and elastic fibers do not mimick those of adults until puberty [15, 16, 18, 20]. Other differences in the pediatric larynx include elevated overall subglottic pressure and recruitment of a greater percentage of pulmonary capacity [4, 21], which changes during mutation.

The reason for these changes lies mainly in the histological structure of the vocal fold – female and male vocal folds alike express androgen receptors in the cytoplasm of the laryngeal gland, progesterone receptors in the nuclei of the same cells, and estrogen receptors in the epithelial cells of the larynx [4, 22, 23], leading to muscle thickening, final development of the trilayered lamina propria, changes in elastin and collagen deposition between the layers, variable lubrication and vocal fold elongation [24]. The expression of the receptors is similar for boys and girls, however differences in the level of hormones between genders causes differences in vocal fold development. In contrast, the other histological features vary: there is more elastin in the cover than in the ligament of male vocal folds, while the elastin in the female lamina propria is more compact [20, 25]. These differences lead to enormous distinctions in the male and female mutations. Apart from the difference in its dynamics, for girls, voice break happens earlier [26–28], starting from the age of 10 and finishing about the age of 14 years, whilst for boys it happens around the age of 12–16 years [29], with some period of voice instability [30, 31]. For both genders it results in the enlargement of arytenoids, expansion of the laryngeal muscles and ligaments [32, 33], completing of the glottal closure, lengthening of the framework of the larynx, and lengthening and rounding of the vocal folds, 4 which is highly related to changes of the acoustic parameters. It is important to note that nowadays mutation occurs much earlier than in the past [2, 34]. This was widely described by Daw, who recorded the age of voice break in members of J. S. Bach’s choirs in Leipzig in 17271749 as being 18 years old [35].

Materials and Methods

The study protocol was acknowledged, reviewed and approved by the internal ethics committee of our medical center, Claros Otorhinolaryngology Clinic Institutional Review Board. All of the parents and children were informed about the examination technique and provided written informed consent. We examined children of a premutation age, with a follow up 2.5 and 5 years later (at the mutation and postmutation age). Exclusion criteria were: vocal fold pathologies, history of neck trauma, previous intubations or laryngeal, head and neck or torso surgeries that have caused changes in vocal folds structure. For the power of a test equal to 0.9 (90%), the smallest sample size was calculated for each checked independent variable, and for statistically significant variables it varied from 10 to 41.

As advised by the pediatric voice assessment guidelines and European Laryngological Society (ELS), subjective and instrumental acoustic evaluations of the voice and aerodynamic performance, as well as visual evaluation of the larynx, were performed [36–38]. During each of the three appointments that the child attended, the voice parameters were measured by a speech- language pathologist. We chose these specific parameters based on advice from the literature: fundamental frequency as the basic, classical objective parameter of the voice [13], vocal range as quite a broad parameter, and because of that a strong sign of a voice disorder if pathological, shimmer and jitter as described as non-invasive, relatively easily applicable and objective [13, 39–41], and, furthermore, highly related to voice problems and dysphonia, [36, 42–44] loudness because it is believed to be a necessary parameter to objectify the result of checked jitter and shimmer [39, 45, 46], and maximum phonation time because it is believed to be the simplest, most easily measured aerodynamic parameter of phonation [47]. To perform the examinations we used sustained vowels taking examples from the approved authors [13, 39, 48, 49]. The vocal recording was performed in accordance with the Union of European Phoniatricians recommendations, with the child in a standing position, in a silent room, with noise level no higher than 40 dB, and with a microphone placed in front of the mouth at a 30 cm distance [50]. We used a microphone from Bruel & Kjaer Rhino-larynx Stroboscope—Type 4914 (Bruel & Kjaer Sound & Vibration, Denmark). All children were examined and recorded in the same conditions. Based on approved literature we defined the norms of all checked parameters [47, 51–59], and we compared them to obtained values. Finally, an ENT consultant examined the vocal folds during every visit to exclude any pathologies, performing a videolaryngoscopy with a rigid endoscope followed by a videostroboscopy (Hopkins II telescope 70 degrees, Karl Storz, Germany).

On every single visit, every 2.5 years, after parents and children provided written informed consent again, CT scanning was performed the way confirmed to be accurate before in our different study [60], using Philips Brilliance ICT 256 (Medical Systems, Netherlands), in the supine position, from the level of the frontal to the level of the aortic arch. Acquisition parameters consisted of a tube current—250 mA, 120 kV, 128×0.625 detector collimation, 0.75-second rotation time, pitch 0.993, scan field of view of250, standard resolution, raw slice thickness – 1 mm. For laryngeal evaluation we added a set of axial reconstruction 2×2 angled through C4 C6 disc spaces. The reconstruction interval was 0.5 mm and the slice thickness was 1 mm. Using standard CT software, a radiologist measured the precise length of the vocal folds in the axial view of the glottis, the longitudinal size of the glottis was estimated in a midsagittal plane (from anterior to a posterior boundary), and in the axial plane, and the length of vocal folds was measured between the anterior commissure and the most posterior part of vocal folds.

Finally, after the third examination (five years after the initial one), the children and their parents answered a survey. The first questions included gender, current age and presumed age of mutation. The following parts of the survey included questions about signs of mutation and voice problems during voice break. The next set of questions related to the age of menarche and breast growth for girls and the age of the first signs of puberty for boys. Lastly, they were asked to complete with the speech-language pathologist the GRBAS scale, which gives scores from 0 to 3 for hoarseness, roughness, breathiness, asthenia, and vocal strain [61].

Data was then implemented into Statistica 13.1 (StatSoft Poland, Cracow) software. Statistical significance was reported at the alpha level of 0.05. P value below 0.05 was considered significant. While analyzing the data we performed the Pearson correlation coefficient test, as well as an analysis of multiple regression and simple linear regression. Correlation coefficients were interpreted to determine whether the effect size was low (correlation coefficient-O.lO), medium (correlation coefficient~0.30) or high (correlation coefficient~0.50). Hypothesis tests were designed as two-tailed. A hypothesis null was formulated as HO: there is no correlation between the change of vocal folds length or acoustic parameters and the moment of voice break (r = 0, b = 0), against the alternative hypothesis H1: there is a correlation (r≠0, b≠0). We created graphs and classification trees to present our findings. The power of the test was determined, and the confidence intervals (Cl) were established for the obtained values.

Results

50 children of a premutation age were our final study group (25 males and 25 females) with a follow up 2.5 and 5 years later (in the mutation and postmutation age). Exactly half of them were males examined at age 11.5, age 14 and age 16.5, and the other half were females examined at age 9.5, 12 and 14.5.

While analyzing the correlations between all the obtained variables and the age of mutation with the Pearson correlation coefficient test, we reported statistical significance in the correlation between the age of mutation and loudness in boys aged 14 (positive correlation coefficient r = 0.48, 0.48, 95%, CI:0, 10–0.73, P = .015, power of the test = .7). Multiple regression analysis showed statistical significance in the correlation between the age of mutation and vocal fold length in boys aged 14 (negative coefficient b = -2.18, P = .044), as well as loudness in boys aged 11.5 (negative coefficient b = -0.15, P = .047), loudness in boys aged 14 (positive coefficient b = 0.31 , P = .022), and loudness in boys aged 16.5 (negative coefficient b = -0.31, P = .040\ however, loudness in boys aged 16.5 cannot be treated as a predictor of mutation, which presumably had occurred earlier). The effect size for these coefficients was R2 = 0.88 (0.88, 95%, CI: 0.72–0.93) and the Cohen’s coefficient was f2 = 7.33. Deeper analysis of these calculations is shown in the classification trees (Figures 1 and 2).

OTO-181055.pdf

Figure 1. Classification tree for loudness in boys aged 11, 5, loudness in boys aged 14, loudness in boys aged 16.5, and vocal folds length in boys aged 14.

Loudness in boys aged 14. and subsequently vocal folds length in boys aged 14, differentiate cases the best. Combined, they are a good prediction of the age of mutation.

SRR Pedro Carlos - 2018-102_F2

Figure 2. Classification tree for all the values obtained in boys aged 11.5 and 14. In these age groups vocal folds length in boys aged 11.5 was the best parameter differentiating cases

In the same calculations for girls, we reported statistical significance in the correlation between the age of mutation and the age of first menstruation (positive coefficient r = 0.84, 0, 84, 95%, CI:0, 66–0, 92, P<.001. power of the test = 1) and increase of fundamental frequency between the age of 9.5 and 12 years old (negative coefficient r = -0.5, 0, 5, 95%, CI:0.13–0.74, P = , 011, power of the test = .75). Since the correlation coefficient between the age of the mutation and the age of the first menstruation was high, we could perform an analysis of simple linear regression, results of which are shown in Figure 3. Multiple regression analysis also showed a statistically significant correlation between the age of mutation and the age of the first menstruation (positive coefficient b = 0.7, P<.001). and increase of fundamental frequency (negative coefficient b = -0.01, P = , 039), which is in agreement with previous calculations. The effect size for these coefficients was R2 = 0.76 (0.88, 95%, CI:0.54–0.86) and the Cohen’s coefficient was f2 = 3.1. Further analysis is shown in the classification trees (Figures 4 and 5).

SRR Pedro Carlos - 2018-102_F3

Figure 3. Scatterplot showing analysis of simple regression and a prediction zone of 95% for the mutation age. We can see that, e.g., for the menstrual age of 12 (axis x), with 95% of probability the mutation will occur between the age of 11.8 and 13.2 (axis y).

SRR Pedro Carlos - 2018-102_F4

Figure 4. Classification tree for the values obtained in girls aged 9.5, 12 and 14.5. Age of the first menstruation was the best parameter differentiating cases in respect of the mutation age.

SRR Pedro Carlos - 2018-102_F5

Figure 5. Classification tree for the increases of the values obtained in girls between ages 9.5 and 12. Age of the first menstruation was the best parameter differentiating cases.

Discussion

The main aim of our study was to find the parameter which correlates the best with the age of mutation, and therefore could possibly serve to predict the age of mutation and evaluate development of the child. We took under further considerations only the values with confirmed statistical significance.

With respect to boys, our calculations showed a statistically significant correlation between the age of mutation and loudness in boys aged 14. vocal fold length in boys aged 14, and loudness in hoys aged 11.5. For loudness in hoys aged 14 the correlation coefficient was positive, which tells us that the louder a child sings at the age of 14, the later he has the mutation. For loudness in boys aged 11.5 and vocal fold length in boys aged 14 the correlation coefficient was negative, which tells us that the louder boy sings at the age of 11.5, the lower the age of mutation, and – most importantly – the longer vocal folds are at the age of 14, the sooner the mutation will start. This is especially interesting in the case of boys, because despite of the obvious vocal folds lengthening with age, male mutation is well accepted to be a sudden and steep change, [2, 4, 5] with periods of higher voice interrupted by periods of lower voice, [30,31] and is dependent on numerous systematic changes described above, therefore it is not simply related to the change of vocal folds length.

It is worth emphasizing, that the correlation between the age of mutation and loudness in hoys aged 14 was confirmed to be statistically significant by all the statistical tests that we performed, and also was the best value differentiating the cases in respect of the age of mutation in the classification tree (Figure 1), therefore it is a variable worth special attention.

Our study also revealed interesting findings in girls. The calculations showed a statistically significant negative correlation between the age of mutation and increase of fundamental frequency between the age of 9.5 and 12. Which means that the more fundamental frequency drops between the age of 9.5 and 12 years old, the later mutation occurs. We have also confirmed a statistically significant positive correlation between the age of mutation and age of the first menstruation. Which means that the sooner the first menstruation appears, the sooner the voice break starts. This is not a surprising result; however, it gave us the opportunity to deepen our statistical analysis. Figure 3 illustrates an analysis of simple regression and the prediction zone of 95% for the mutation age, which means it allows us to predict with 95% of probability the age of voice break knowing the age of menstruation. This way of illustrating the correlation has the potential to be extremely useful in everyday medical and choral practice. The effect size of our results measured by the correlation coefficients was high.

It is important to point out that we have to consider the possible lack of precision in radiological measurements, however it is worth noting that our CT examinations had especially high resolution parameters, and that the CT scans were analyzed multiple times, in different views and planes. A further limitation of our study might be uncertainty about the proper understanding of our instructions during the acoustic examinations (which uncertainty accompanies scientists in every study involving children [62]), however, the age of children involved in our study was not so low as to make this a major concern.

Although several studies have investigated the subject of mutation and ways of predicting it, there is still room to explore it further. Decoster et al. investigated changes in acoustic parameters in girls, however boys were not the subject of the study [2]. Hacki and Heitmiiller, as well as Boltezar et al., did address the subject of mutation, yet in relation to acoustic voice parameters, not vocal folds length [6, 31]. Similarly, numerous studies examined acoustic voice parameters in pediatric population, though other examinations, such as vocal folds length measurements, were beyond the scope of the research [8–11]. Rogers et al. evaluated vocal fold growth as a function of age in a large group of patients [7], however using measuring sticks in total anaesthesia, and emphasized that it might have lengthened the vocal folds [63]. There are several other studies investigating vocal folds length in relation to age, however measurements were performed post mortem, and therefore did not reflect the actual conditions of the living human being’s body [18, 64–67]. Hollien, similarly as in our study, has used radiological imaging; however he has used X-ray images, which are less precise than the CT scans used in our research [68]. Thus, we are tempted to claim that our research is original, and to the best of our knowledge explores aspects not addressed before, adding an important contribution to still not exhausted research about a child’s development and the subject of mutation.

Conclusion

In the academic pursuit of knowledge, evaluating the proper maturation of a child has a special place of a particular concern. This is unsurprising, given that childhood can determine the future of a young human being. However, as we are all different, it is also difficult to determine whether development is proper, and, at the same time, so easy to miss the red flags. Undoubtedly, the period of puberty is the most challenging, both for the human body, which goes through multiple changes, and for scientists, who try to establish reference points to make the evaluation of maturing easier. We believe this hunt is never finished. In the future, one way to asses this might be a routine examination of vocal folds length and acoustic voice parameters. Our study attempted to make our contribution in bringing this future closer.

Acknowledgement

The authors report no conflicts of interest. The authors report no financial and material support for the research and the work reported in the manuscript.

References

  1. Fenichel P (2012) Delayed puberty. Endocr Dev 22: 138–159. [crossref]
  2. Decoster W, Ghesquiere S, Van Steenberge S. Great talent (2008) excellent voices-no problem for pubertal girls? Logoped Phoniatr Vocol 33: 104–112.
  3. Mumm R, Hermanussen M, Scheffler C (2016) New reference centiles for boys’ height, weight and body mass index used voice break as the marker of biological age. Acta Paediatr 105: e459–463. [crossref]
  4. Kerschner JE, Merati AL (2008) Science of Voice Production from Infancy Through Adolescence. In: Hartnick CJ, Boseley ME. Pediatric Voice Disorders. 1st edn. San Diego, California: Plural Publishing Inc; Pg No: 23–29.
  5. McAllister A, Sjölander P (2013) Children’s voice and voice disorders. Semin Speech Lang 34: 71–79. [crossref]
  6. Hacki T, Heitmiiller S (1999) Development of the child’s voice: premutation, mutation. Int J Pediatr Otorhinolaryngol 49: 141–144.
  7. Rogers DJ, Setlur J, Raol N, Maurer R, Hartnick CJ (2014) Evaluation of true vocal fold growth as a function of age. Otolaryngol Head Neck Surg 151: 681–686. [crossref]
  8. Böhme G, Stuchlik G (1995) Voice profiles and standard voice profile of untrained children. J Voice 9: 304–307. [crossref]
  9. McAllister A, Sederholm E, Sundberg J, Gramming P (1994) Relations between voice range profiles and physiological and perceptual voice characteristics in ten-year-old children. J Voice 8: 230–239.
  10. Sorenson DN (1989) A fundamental frequency investigation of children ages 6–10 years old. J Commun Disord 22: 115–123. [crossref]
  11. Pedersen MF, Moller S, Krabbe S, Bennett P, Svenstrup B (1990) Fundamental voice frequency in female puberty measured with electroglottography during continuous speech as secondary sex characteristic. Int J Pediatr Otorhinolaryngol 20: 17–24.
  12. Baken RJ, Orlikoff RF (1997) Voice measurement: is more better. Logop Phoniatr Vocol 22: 147–151.
  13. Nicollas R, Garrel R, Ouaknine M, Giovanni A, Nazarian B, et al. (2008) Normal voice in children between 6 and 12 years of age: database and nonlinear analysis. J Voice 22: 671–675. [crossref]
  14. Pabon JPH, McAllister A, Sederholm E, Sundberg J (2000) Dynamics and voice quality information in the computer phonetograms of children’s voices. In: Wide P, (ed). Child voice Stockholm: KTH Voice Research Centre Pg No: 85–100.
  15. Hartnick CJ, Rehbar R, Prasad V (2005) Development and maturation of the pediatric human vocal fold lamina propria. Laryngoscope 115: 4–15. [crossref]
  16. Hirano M, Sato K (1993) Histological color atlas of the human larynx. San Diego, California: Singular Publishing Group, USA.
  17. Hartnick CJ, Rehbar R, Prasad V (2005) Development and maturation of the pediatric human vocal fold lamina propria. Laryngoscope 115: 4–15. [crossref]
  18. Hirano M, Kurita S, Nakashima T (1983) Growth, development, and aging of human vocal folds. In: Bless DM, Abbs JH, ed. Vocal fold physiology. San Diego, California: College-Hill.
  19. Boseley ME, Hartnick CJ (2006) Development of the human true vocal fold: depth of cell layers and quantifying cell types within the lamina propria. Ann Otol Rhinol Laryngol 115: 784–788. [crossref]
  20. Chan RW, Fu M, Young L, Tirunagari N (2007) Relative contributions of collagen and elastin to elasticity of the vocal fold under tension. Ann Biomed Eng 35: 1471–1483. [crossref]
  21. Stathopoulos ET, Sapienza CM (1997) Developmental changes in laryngeal and respiratory function with variations in sound pressure level. J Speech Lang Hear Res 40: 595–614. [crossref]
  22. Newman SR, Butler J, Hammond EH, Gray SD (2000) Preliminary report on hormone receptors in the human vocal fold. J Voice 14: 72–81. [crossref]
  23. Brunings JW, Schepens JJ, Peutz-Kootstra CJ, Kross KW (2013) The expression of estrogen and progesterone receptors in the human larynx. J Voice 27: 376–380. [crossref]
  24. Kuhn MA (2014) Histological changes in vocal fold growth and aging. Curr Opin Otolaryngol Head Neck Surg 22: 460–465. [crossref]
  25. Kahane JC (1988) Histologic structure and properties of the human vocal folds. Ear Nose Throat J 67: 322, 324–325, 329–30. [crossref]
  26. Marshall WA, Tanner JM. Puberty. In: Falkner F, Tanner JM (1986) Human Growth-A Comprehensive Treatise 2: Postnatal Growth Neurobiology. 2nd ed. Plenum, New York: Springer, Pg No: 171–210.
  27. Tanner JM (1981) Growth and maturation during adolescence. Nutr Rev 39: 43–55. [crossref]
  28. Bogin B (1999) Patterns of human growth. (2nd edn) Cambridge University Press, London.
  29. Balasubramaniam RK, NN (2017) Voice Mutation During Adolescence in Mangalore, India: Implications for the Assessment and Management of Mutational Voice Disorders. J Voice 31: 511.e29–511.e33.
  30. Fuchs M, Fröehlich M, Hentschel B, Stuermer IW, Kruse E, et al. (2007) Predicting mutational change in the speaking voice of boys. J Voice 21: 169–178. [crossref]
  31. Boltezar IH, Burger ZR, Zargi M (1997) Instability of voice in adolescence: pathologic condition or normal developmental variation? J Pediatr 130: 185–190. [crossref]
  32. Fitch WT, Giedd J (1999) Morphology and development of the human vocal tract: a study using magnetic resonance imaging. J Acoust Soc Am 106: 1511–1522. [crossref]
  33. Ferlito A (2000) In: Ferlito A., ed. Diseases of the Larynx. London: Oxford; New York: Arnold. Oxford Univeristy Press.
  34. Gackle L (2000) Understanding voice transformation in female adolescents. In: Welch G, ed. Bodymind and Voice. Minnesota, USA: The Voice Care Network; Pg No: 739–744.
  35. Daw SF (1970) Age of boys’ puberty in Leipzig, 1727–49, as indicated by voice breaking in J.S. Bach’s choir members. Hum Biol 42: 87–89. [crossref]
  36. Cohen W, Wynne DM, KubbaH, McCartney E (2012) Development of a minimum protocol for assessment in the paediatric voice clinic. Part 1: Evaluating vocal function. Logoped Phoniatr Vocol 37: 33–38.
  37. Kelchner LN, Brehm SB, de Alarcon A, Weinrich B (2012) Update on pediatric voice and airway disorders: assessment and care. Curr Opin Otolaryngol Head Neck Surg 20: 160–164. [crossref]
  38. Hartnick C, Boseley M (2008) Pediatric Voice Disorders: Diagnosis and Treatment. San Diego, CA: Plural Publishing.
  39. Brockmann-Bauser M, Beyer D, Bohlender JE (2014) Clinical relevance of speaking voice intensity effects on acoustic jitter and shimmer in children between 5;0 and 9; 11 years. Int J Pediatr. Otorhinolaryngol 78: 2121–2126.
  40. Oates J, Kirkby R (1980) An acoustical investigation of voice quality disorders in children with vocal nodules. Australian J HumanCommDis 8: 28–39.
  41. Meal lister A, Sundberg J, Hibi SR (1998) Acoustic measurements and perceptual evaluation of hoarseness in children’s voices. Logoped Phoniatr Vocol 23: 27–38.
  42. Lopes LW, Barbosa Lima IL, Alves Almeida LN, Cavalcante DP, de Almeida AA (2012) Severity of voice disorders in children: correlations between perceptual and acoustic data. J Voice 26: 819.e7–819.el2.
  43. Shah RK, Engel SH, Choi SS (2008) Relationship between voice quality and vocal nodule size. Otolaryngol Head Neck Surg 139: 723–726. [crossref]
  44. Valadez V, Ysunza A, Ocharan-Hernandez E, Garrido-Bustamante N, Sanchez-Valerio A, et al, (2012) Voice parameters and videonasolaryngoscopy in children with vocal nodules: a longitudinal study, before and after voice therapy. Int J Pediatr Otorhinolaryngol 76: 1361–1365.
  45. Brockmann-Bauser M (2012) Improving Jitter and Shimmer Measurements in Normal Voices. Schulz-Kirchner Verlag GmbH Idstein 205.
  46. Brockmann-Bauser M, Drinnan MJ (2011) Routine acoustic voice analysis: time to think again? Curr Opin Otolaryngol Head Neck Surg 19: 165–170. [crossref]
  47. Pribuisiene R, Uloza V, Kardisiene V (2011) Voice characteristics of children aged between 6 and 13 years: Impact of age, gender, and vocal training. Logopedics Phoniatrics Vocology 36: 150–155.
  48. Glaze L, Bless D, Milenkovic P, Susser R (1988) Acoustic characteristics of children’s voice. J Voice 2: 312–319.
  49. Cohen SR, Perelman N, Nimni ME, Mahnovski V, Cheung DT (1993) Whole organ evaluation of collagen in the developing human larynx structures and adjoining anatomic structures (hyoid and trachea). Ann Otol Rhinol Laryngol 102: 655–659.
  50. Shutte HK, Seidner W (1983) Recommendations by the Union of European Phoniatricians (UEP): Standardizing voice area measurement/phonetography. Folia Phoniatr 35: 286–288.
  51. Bennett S (1983) A 3-year longitudinal study of school-aged children’s fundamental frequencies. J Speech Hear Res 26: 137–141. [crossref]
  52. Stathopoulos ET, Sapienza C (1993) Respiratory and laryngeal measures of children during vocal intensity variation. J Acoust Soc Am 94: 2531–2543. [crossref]
  53. Finnegan DE (1985) Maximum phonation time for children with normal voices. Folia Phoniatr (Basel) 37: 209–215. [crossref]
  54. Horii Y (1983) Automatic analysis of voice fundamental frequency and intensity using a VisiPitch. J Speech Hear Res 25: 467–471.
  55. Banik A, Arya S, Kant A (2015) Vocal Parameters in Children between 4 To 12 Years of Age: An Attempt to Establish a Prototype Database. International Journal of Scientific and Research Publications 11: 446–453.
  56. Ting HN, Chia SY, Manap HH, Ho AH, Tiu KY, Abdul Hamid B (2012) Fundamental Frequency and Perturbation Measures of Sustained Vowels in Malaysian Malay Children Between 7 and 12 Years Old. J Voice. 26: 425–30.
  57. Bonet M, Casan P (1994) Evaluation of dysphonia in a children’s choir. Folia Phoniatr Logop 46: 27–34. [crossref]
  58. Williamson G (2006) Human communication: A linguistic introduction. 2nd ed. Billingham, UK: Speech Language Services.
  59. Maturo S, Hill C, Bunting G, Ballif C, Maurer R, et al. (2012) Establishment of a normative pediatric acoustic database. Arch Otolaryngol Head Neck Surg 138: 956–961. [crossref]
  60. Claros P, Sobolewska AZ, Domenech-Claros A, Claros-Pujol A, Pujol C, et al. (2018) CT-based Morphometric Analysis of Professional Opera Singers’ Vocal Folds. J Voice 21: 30614–30618.
  61. Sundberg J (2000) Emotive transforms. Phonetica 57: 95–112. [crossref]
  62. Brockmann-Bauser M, Beyer D, Bohlender JE (2014) Clinical relevance of speaking voice intensity effects on acoustic jitter and shimmer in children between 5;0 and 9; 11 years. Int J Pediatr Otorhinolaryngol 78: 2121–2126.
  63. Su MC, Yeh TH, Tan CT, Lin CD, Linne OC, et al. (2002) Measurement of adult vocal fold length. J Laryngol Otol 116: 447–449. [[crossref]
  64. Eckel HE, Sprinzl GM, Sittel C, Koebke J, Damm M, et al. (2000) Anatomy of the glottis and subglottis in the pediatric larynx]. HNO 48: 501–507. [crossref]
  65. Eckel HE, Sittel C (1995) Morphometry of the larynx in horizontal sections. Am J Otolaryngol 16: 40–48. [[crossref]
  66. Friedrich G, Kainz J (1988) Morphometry of the larynx in horizontal sections: normal data for the quantitative evaluation of current imaging technics in German], Laryngol Rhinol Otol (Stuttg) 67: 269–274.
  67. Kahane JC (1978) A morphological study of the human prepubertal and pubertal larynx. Am J Anat 151: 11–19. [crossref]
  68. HOLLIEN H (1960) Some laryngeal correlates of vocal pitch. J Speech Hear Res 3: 52–58. [crossref]

Prevalence, Symptoms and Treatment of Vocal Fatigue in Professional Opera Singers: Clinician’s Experiences

DOI: 10.31038/SRR.2019211

Summary

Purpose and study design: The research aims to estimate the prevalence and characteristic symptoms of vocal fatigue in professional opera singers. Also, the paper is summary of many years of clinical experience with management of singers with vocal fatigue in Clarós Clinic. The research was designed as a retrospective observational study.

Material and method: In the group of 250 professional opera singers who were examined in Clarós Clinic in 10 years period, fifty-five cases of vocal fatigue were reported and evaluated. Among subjects were 21 men and 34 women. Mean age of participants was 46,78y (range 19–72 years old, standard deviation: 12.18 year). Representation of classical voice types was: 14 tenors, 5 baritones, 2 basses, 22 sopranos, 10 mezzos, 2 contralti.

Results: Prevalence of vocal fatigue in 10 years period in the study group was 22%. The three most frequent symptoms observed in the study group were: muscle pain (87.27%), muscle fatigue (76.36%) and diffuse sharp pain in the neck (70.37%). Statistical analysis showed significance only for the relationship between female opera singers and incidence of symptoms such as tremulous voice and muscle pain. All other symptoms were not statistically related to gender. Contradictory to expectations, application of anti-inflammatory drugs was statistically associated with the longer duration of the symptoms.

Conclusions: Vocal fatigue may be underestimated but is one of the most frequent problems encountered in the ENT practice that provides care for professional voice users. In the presented research, administration of anti-inflammatory drugs has not been associated with faster recovery from vocal fatigue.

Keywords

vocal fatigue, opera singers, treatment of vocal fatigue, retrospective observational study, the prevalence of vocal fatigue.

Introduction

Professional opera singers are considered to be the highest class artists among singers. In fact, they should be perceived as Olympian athletes when comes to quality and ability of their vocal folds. Exceptional singing is achieved by years of training and vocal regime. Unfortunately, the requirements set for the opera singers’ voice entail the unique susceptibility to vocal fatigue. The research reported fatigue to be a common complaint among professional voice users [1].

Vocal fatigue presents a challenge to research and clinical practice. Despite the amount data gathered on that matter, precise definition and guidelines are still not well established.

Unlike in case of muscle fatigue, the creation of the conditions that allow the investigation be far more difficult because of complicated mechanism of voice production. Many studies which attempted to induce vocal fatigue yielded a different and inconsistent result. In case of singing, the task is especially challenging because repertoire can vary significantly. Furthermore, aspect like frequency of the performance can play a role in the development of vocal fatigue. Some types of voice are particularly vulnerable, like a soprano. However, the data provided on the subject is anecdotal, obtained from clinicians’ experience instead of large case-control studies.

Mechanisms which underlay vocal fatigue are multifaceted. Titze listed some potential physiological and biomechanical factors that may contribute: fatigue of respiratory and laryngeal muscles, fatigue of non-muscular tissues of the larynx, and changes in vocal folds’ viscosity [2]. As one of the others, the neuromuscular fatigue express inability of muscles to sustain the tension under repeated stimulation [3].

The exceptional ability of the larynx to produce sound is possible because of vocal folds which are covered with non-muscular, pliable tissue that generates multiple and rapid vibrations [4]. Furthermore, viscous properties of vocal folds epithelium allow lubrication and shock absorption [5]. Research showed that prolonged, high-pitched phonation could increase: frictional energy loss, heat dissipation and tissue viscosity. All these factors can lead to tissue fatigue [4]. The influence of tissue biomechanics on phonation makes the study about vocal fatigue more complicated than the research of fatigue involving other skeletal muscles.

The expression vocal fatigue has been applied and arbitrarily understood. For presented research, vocal fatigue definition was employed from Solomon as the self- report of an increased sense of effort with prolonged phonation, whether or not there are observable or measurable decrements in phonation function [5]. The aspect of self-reporting is particularly crucial amid opera singers who are the harshest judges of their vocal abilities.

Moreover, vocal fatigue has been described clinically by several authors. Common symptoms enlisted in literature were: husky vocal quality, breathy vocal quality, loss of voice, pitch breaks, inability to maintain regular pitch, reduce pitch range, lack of vocal carrying power, reduce loudness range, need to use greater vocal effort [1].

Opera singers are interesting subjects to study vocal fatigue because in comparison to other professional types of vocalists their vocal abilities are challenged at the highest level. Furthermore, years of vocal regime provide them with high self-awareness of the vocal capabilities which helps to notice any vocal problems at first onset.

Clarós Clinic provides medical support for a large number of professional opera singers of Liceu Opera theatre in Barcelona, Music Conservatory students and other singers since 1970’. Authors decided to analyse reports of vocal fatigue from last ten years among opera singers and describe common symptoms, frequency and interventions that were applied.

The research aims to determine the prevalence of vocal fatigue, symptoms and factors which may underlay the occurrence of that problem.

Paper is summary of our experience with treatment and management of vocal fatigue among professional opera singers.

Overall, vocal fatigue is still an intriguing and persistent problem when presented in clinical practice and is the challenge in the face of consequences which may cause for the professional singer with a tight schedule. Furthermore, the struggle with finding a substitute for a famous singer who suffers from vocal fatigue provides additional pressure for the clinician who has to offer effective treatment.

Materials and Methods

Study design

The research was designed as a retrospective observational study. Evaluation of vocal fatigue cases presented in Clarós Clinic during ten years period was conducted to obtain prevalence, symptoms and to analyse the treatment.

The research protocol was approved by ethics committee of Clarós Clinic medical centre.

Participants

In the group of 250 professional opera singers who were treated in Clarós Clinic in 10 years, fifty-five cases of vocal fatigue were reported and evaluated for this research. Among subjects were 21 men and 34 women. Mean age of participants was 46,78y (range 19–72 years old, standard deviation: 12.18 year). Representation of voice types was: 14 tenors, 5 baritones, 2 basses, 22 sopranos, 10 mezzos, 2 contralti.

Medical evidence

Eleven most common symptoms and six risk factors of vocal fatigue identified in the study group were gathered in Table 1.

Table 1. Common symptoms of vocal fatigue and risk factors with definitions.

Symptoms

Description

Hoarseness

Patient complains of hoarse voice

Breathy voice

Breathy vocal quality, running out of breath while talking

Whispery voice

Patient is only able to whisper

Tremulous voice

Unsteady voice, voice affected by trembling or tremors

Neck muscle pain

Patient complains of muscular pain in the neck

Sharp pain localised on the neck: diffused or localised

Patient complains of sharp pain in the neck during speaking or singing

Neck muscle fatigue

Muscular fatigue present on the neck

Tissue fatigue

Increased viscosity of vocal folds’ mucosa and tissue stiffness

Neck strain

Increased tension in the neck

Stiffness of the vocal folds

Increased tension of vocal folds

Changes in vibrato

Inability to maintain proper vibrato

Risk factors

Muscle overstrained

Excessive effort during performance

Overuse of voice

Inadequate vocal rest regime

Incorrect technique

Insufficient training

Singing warm-up

Inappropriate singing warm-up

Shouting

High-pitched, forced phonation in short period

Inadequate repertoire

Prolonged singing beyond the appropriate tessitura (most acceptable and comfortable vocal range for the given singer [28])

Medical records were evaluated to search for possible causes and factor which may contribute to the development of vocal fatigue. Patients reported: overuse of voice, stress, incorrect technique, vocal warm-up, improper repertoire and shouting. Interventions which were used: voice rest regime, medications (anti-inflammatory drugs, steroids: hydrocortisone). Also, duration of the symptoms was measured. In some cases, the repetitive character of vocal fatigue was noticed.

 All cases of professional opera singers were presented to the same, senior, most experienced ENT consultant. He was responsible for the patient examination and evaluation. All medical records of patients with vocal fatigue were created by the senior consultant who followed the similar protocol in every case. Table 1 gathers the common symptoms and risk factors assessed in the study with the description of researcher interpretation.

In every case, the standard medical interview was gathered. Moreover, patients underwent ENT examination consisted of endoscopic evaluation and neck palpation.

A senior most experienced ENT consultant performed video laryngoscopy with conventional equipment to examine the vocal folds (Karl Storz® 70 degrees rigid endoscope and HD camera).

The table below shows typical symptoms and risk factors which were assessed in medical records. Description represents how researcher stated or understood given symptom or risk factor. Definitions were based on literature and authors experienced [3,6].

Statistical Analysis

Data was collected in Excel sheet and implemented to Statistica 13.1 (Statsoft) software for statistical analysis. Statistical significance was accepted at the alpha level of 0.05. A p-value below 0.05 was considered significant.

Contingency tables were used to analyse quality variable obtained from patients’ medical history. Percentage values for every symptom and risk factor were calculated for men, women and the complete group. The Chi2 test was used to assess statistical dependence between gender and incidence of given symptom and risk factor.

Contingency tables were also implemented to analyse the possible influence of anti-inflammatory medication on the duration of symptoms.

Due to the qualitative nature of the data obtained from medical history more complicated analyses were not possible.

It needs to be to highlight that some types of voice are very infrequent which influence the precision of statistical analysis. In this study, the contralti, basses and countertenors occurred in the minority.

Results

The results section is divided into two parts: descriptive data (tables and chart) and the statistical analysis. The precise characteristic of descriptive data obtained from medical history is presented in table 2, 3 and 4. Percentage values of symptoms incidence are illustrated in Chart 1.

SRR-2019-101-Pedro Carlos_F1

Chart 1. Bar chart. Percentage value of symptoms’ incidence.

Table 2.
Common symptoms of vocal fatigue in the study group.

Whispery voice

Tremulous voice

Hoarseness

Muscle pain

Sharp pain

Muscle fatigue

Tissue fatigue

Vocal folds stiffness

Vibrato changes

Pitch changes

Diffuse

Localised

Men

18.18%

5.45%

21.82%

38.18%

23.63%

7.41%

32.73%

12.73%

23.64%

9.09%

9.09%

Women

45.45%

25.45%

40.00%

49.09%

40.74%

22.22%

43.64%

20.00%

27.27%

43.64%

12.73%

General

63.64%

30.91%

61.82%

87.27%

70.37%

29.63%

76.36%

32.73%

50.91%

52.73%

21.82%

Chi2*

p = 0.052

p = 0.037

p = 0.574

p = 0.026

p = 0.23

p = 0.19

p = 0.93

p = 0.19

p = 0.779

p = 0.000

*The Chi2 for Independence test. Significant values (p≤0.05). NOTE: VF- vocal fatigue.

The table shows the percentage of VF occurrence and percentage of cases in which medications were applied in the groups. The results of the Chi2 test for independence between enlisted factor and gender are also given. Significance was reported at p-level below 0.05. None of given factors had gender predilection in the presented group.

Table 3. Risk factors of vocal fatigue analysed in the study group.

Muscle overstrain

Overuse of voice

Incorrect technique

Singing warm-up

Shouting

Inadequate repertoire

Reoccurrence VF

Medication

Men

32.73%

30.91%

3.64%

18.18%

20.00%

10.91%

7.27%

10.91%

Women

49.09%

49.09%

10.91%

21.82%

29.09%

18.18%

23.65%

14.55%

General

81.82%

80.00%

14.55%

40%

49.09%

29.09%

30.91%

25.24%

Chi2*

p = 0.55

p = 0.889

p = 0.406

p = 0.34

p = 0.7

p = 0.946

p = 0.13

p = 0.676

*The Chi2 for Independence test. Significant values (p ≤ 0.05). NOTE: VF- vocal fatigue.

The table shows the percentage value of risk factors incidence in the groups and results of the Chi2 test for independence between enlisted factor and gender. Significance was reported at p-level below 0.05. None of given risk factors had gender predilection in the presented group.

Table 4. Percentage value of vocal fatigue reoccurrence.  Percentage of cases in which anti-inflammatory medication was applied.

Reoccurrence VF

Medication

Men

7.27%

10.91%

Women

23.65%

14.55%

General

30.91%

25.24%

Chi2*

p=0.13

p=0.676

*The Chi2 for Independence test. Significant values (p≤0.05). NOTE: VF- vocal fatigue.

The Chi2 for Independence test was used to assess the relationship between gender and vocal fatigue symptoms. Results of the Chi2 test are also given in tables 2, 3.

Table 5 presents the percentage values of vocal fatigue recurrence among different types of classical voices.

Table 5. Recurrence of vocal fatigue among different voice types (tessitura- defined as most acceptable and comfortable vocal range for the given singer [28]).

Recurrence of vocal fatigue in different voice types

Yes

No

General

Soprano

12.73%

27.27%

40.00%

Mezzosoprano

10.91%

7.27%

18.18%

Contralto

0,00%

3.64%

3.64%

Tenor

5.45%

20.00%

25.45%

Baritone

1.82%

7.27%

9.09%

Bass

0.00%

3.64%

3.64%

General

30.91%

69.09%

100.00%

The table shows the percentage value of risk factors incidence in the groups and results of the Chi2 test for independence between enlisted factor and gender. Significance was reported at p-level below 0.05. None of given risk factors had gender predilection in the presented group.

The table presents the percentage of vocal fatigue reoccurrence among different voice types. In presented data sopranos and tenors were most frequently affected by the reoccurrence of VF. Examined contralti and basses had not experienced vocal fatigue more than one time at the moment of evaluation.

The chart shows the percentage value of symptoms which occurred in the whole group (general), men and women groups. Bars help to illustrate which symptoms were most common and compared them between groups. Therefore, three most frequent symptoms were muscle fatigue, diffuse sharp pain and muscle pain. Most common symptom among women as well as in men was muscle pain.

Results – Summary

The Clarós Clinic provided medical support for 250 professional opera singers during the time that the data was gathered. Symptoms of vocal fatigue were reported in 55 operatic vocalists, and these cases were enlisted to the research.

Prevalence of vocal fatigue in 10 years period among opera singers examined in the Clinic was 22%.

The three most frequent symptoms observed in the study group were: muscle pain (87.27%), muscle fatigue (76.36%) and diffuse sharp pain (70.37%). Most frequent complaints were pain-related, especially in female singers group.

Most common vocal complaints were: whispery voice (63.64%) and hoarseness (61.82%). More than a half of opera singers (52.73%) had difficulties with maintaining the vocal pitch during singing and quarter (21.82%) noticed changes in vibrato

The Chi2 test showed statistical significance only for the relationship between female opera singers and incidence of symptoms such as tremulous voice and muscle pain (test Chi2: p = 0.037, p = 0.026). All other symptoms were not statistically related to gender.

Most common risk factors were: muscle overstain and overuse of voice which were present in over 80% of cases. Much less frequently, singers reported incorrect technique and inadequate repertoire as contributors to vocal fatigue (table 3).

Recurrence of vocal fatigue was noted in one-third of the singers and was more distinctive for female singers, especially sopranos and mezzo-sopranos (table 4).

Mean duration of the symptoms was 3.8day (standard deviation: +/- 1.9day). The median value was 3 day.

Contingency tables were also used to estimate the relationship between duration of the symptoms and application of anti-inflammatory medications. Results of the Chi2 test showed that shorter length of the symptoms was related to lack of administration medication (test Chi2: p = 0.009).

Discussion

Vocal fatigue is an interesting and often debilitating condition, affecting many professional voice users. It gained much attention in the field of research, yet mechanisms which underlie the onset of this condition and its pathophysiology are still not fully understood. The amounts of vocal effort and specific elements which can trigger vocal fatigue are part of the ongoing debate. More research has to be done to develop reliable guidelines for management and treatment of vocal fatigue.

Every group of professional voice users have its characteristic which helps to study individual exposure factors. Opera singers have the individual susceptibility to fatigue which may interfere with social and occupational functioning.

The purpose of this study on vocal fatigue in opera singers was to state prevalence, characterise symptoms of this condition and review management.

Prevalence of vocal fatigue in studied group was 22%, which suggests that it might concern every fifth singer. As previous research showed among other types of professional singers, VF can cause voice impairment even more often. In a study conducted on the large group of various kinds of singers (opera singers- 49.8%), Phyland reported that participants experienced vocal fatigue in the previous year in 69% of cases [7]. In the research, fatigue was the second most frequent problem reported by singers after hoarseness [7].

Among most common symptoms reported by opera singers in the study group: two were pain related. Over 87% of singers pointed out the muscle pain as a single most common symptom of vocal fatigue. Female opera singers tended to suffer more from muscle pain than male singers, which was also confirmed statistically significant. Muscle pain was usually localised in throat, jaw and neck, but also in chest and back. These findings were consistent with previous reports which stated that most common pain present in singers were a sore throat (66%), pain during speaking (41%) and neck pain (35%). However, the study mentioned above pointed out the tendency for a sore throat among male vocalists, other types of body pains had no difference according to gender [8]. The presence of pain can severely compromise singer’s performance and negatively influence the quality of life. An important factor which helps to prevent the muscle pain is the concern for proper technique and vocal rest regimen.

Neuromuscular fatigue has been widely investigated in the literature. It can be presumed that muscle of the respiratory and phonatory system can fatigue and contribute to the deterioration of phonation or the perception of increased vocal effort, especially during prolonged high-pitched phonation. Undoubtedly, the research showed that respiratory muscles are highly unlikely to experienced fatigue. More recent findings presented evidence from whole body exercise suggesting that respiratory muscle fatigue occurs only following constant high-intensity training [9]. This situation cannot occur during regular physical activity, even as challenging as prolonged singing.

The distinction between fatigue of skeletal muscle and phonation muscles is relevant, because of the different histological structure. The capability of a muscle to maintain contraction over an extended period is related to a distribution of different motor units within the muscle body. In case of the larynx, the vast majority of intrinsic laryngeal muscle have fatigue-resistant muscle fibres (type I and IIa) rather than fatigable (type IIb) [10]. More recent studies provide interesting data showing the even more complicated histological structure of human intrinsic laryngeal muscles than presented in animal models [10]. These facts help to explain why singers usually complain about fatigue of muscle and experience discomfort in areas primarily localised in throat, jaw, and neck.

One of the unique aspects is non-muscular tissue fatigue which represents mechanical exhaustion. Mechanical deterioration represents the amount of strain that material can tolerate before breaking down. The fatigue represents progressive structural damage that results from mechanical stress (force per unit) imposed by strain on the material. Titze reported in one of his research that non-muscular tissue fatigue could cause damage to the laryngeal mucosa, but the quantity and duration of the physical stress were uncertain [11]. The author also described tensile stress which is required for high pitch phonation as a most significant mechanical stress in vocal folds vibration [11]

 Tissue viscosity plays a role in response to mechanical stress because that feature refers to individual properties of vocal folds’ mucosa responsible for lubrication and shock absorption. Research demonstrated that viscosity highly depends on the systemic and superficial hydration of mucosa. Singers in a situation of reduced systemic hydration may be particularly prone to experience the vocal fatigue [12]. Factor as prolonged, high-pitched phonation without proper hydration can lead to stress and strain which placed on the tissue can provoke fatigue. Furthermore, the viscosity of vocal folds mucosa can be affected by the decreased humidity of environment as in case of oral breathing [13].

The more recent study confirmed positive influence of systemic hydration on perceptual parameters of voice quality in singers. The improvement was seen in higher fundamental frequency, less cycle to cycle variation in pitch, or longer phonation time, depending on the individual. Hydrated vocal folds allow for optimal vibration, increase ease of phonation and prevent structural damage to vocal to vocal folds mucosa [14,15,16].

Non-muscular tissue biomechanical properties which include mucosal viscosity plays a significant role in the development of fatigue. In presented study 1/3 of singers have suffered from problems related to tissue fatigue.

Further, changes in vibrato were observed in over 52% singers. These changes represent acoustic differences related to vocal fatigue and can seriously interfere with performance. In previous research, Titze noted that muscle fatigue results in decreased ability to maintain stable tension in vocal folds [2]. In another interesting study, Boucher attempted to isolate acoustic signs of fatigue in laryngeal muscles. The study showed that 12 conventional acoustic parameters that were measured neither demonstrated consistent linear relationships with the fatigue estimates. Though, average values demonstrated the consistent peaks in vocal tremor and appeared near the points of critical shifts in muscle fatigue. In sum, rises in tremor corresponding to shifts in muscle fatigue appear robust in the face of fluctuations in modal pitch [17].

A more recent study helped to differentiate the acoustic changes related to vocal fatigue. The research was the first to demonstrate a link between tremor and observed muscle fatigue that is specifically attributable to voice effort and not only to fatigue linked with waking hours. Also, the results do not support applications of F0 or other conventional acoustic parameters as manifestations of fatigue in laryngeal structures. Even though many research showed significant rises in F0 as a result of vocal effort with reference to group averages, the recent reports showed that individual or cross-subject changes in F0, as in other conventional acoustic parameters do not consistently indicate fatigue in laryngeal structures [18].

Despite years of research, no consensus has emerged that could support the elaboration of guidelines for vocal fatigue. In the most basic approach, investigations on vocal fatigue have concentrated on identifying changes in voice in tests where fatigue was provoked by tasks of various “vocal load”. The assignments varied across different research; participants were asked to read or sing at varying pitch or intensities for a variable period extending from few minutes to several hours [19]. Those arguments make cross-study comparison useless with results on suggested vocal symptoms inconsistent and sometimes contradictory.

In our study as the first line of treatment, the vocal rest regime was applied in every case. Importance of vocal rest was underlined in many research and is usually required as first line intervention when vocal fatigue is experienced by singer [20]. Stress and anxiety management is also crucial for maintaining the good psychological condition of a singer. The aim of physical and mental approach to prevention of vocal fatigue is optimisation of the performance efficacy [21]. This translate to minimising muscular activation, achievable by improving posture and relaxing muscles [22].

Professional opera singers often follow the vocal routine which usually begins under the influence of their singing teacher and speech-language pathologist. Vocal hygiene practices contain moderation in amount and type of voice use, reduction of stress, avoidance of phonotraumatic behaviours like shouting, talking over crowds, aspects like systemic hydration and humidification to improve performance and ensure voice longevity [23]. Effects of systemic hydration and vocal rest were proved to have a significant influence on the decrease of vocal fatigue and maintaining good vocal quality in general [16,24].

In literature, researchers postulated to set safety limits of vibration dose (phonatory time) for professional voice users to protect people in several occupations (singers, teachers). For instance, proper recovery time has been worked out for professional athletes who abuse their body in different ways. Importantly, Titze divided recovery for short- and long-term. The first one takes place immediately when phonation is stopped [25]. The primary benefit from short recovery is for the muscles whose chemicals get reset before next contractions. On the contrary, traumatised epithelial cells need more prolonged healing. Some of them after being heavily bombarded during vocal folds contraction can degenerate and be shed off. New cells will grow underneath, but that requires time. Furthermore, some destruction of the structural matrix of the lamina propria may be present after prolonged phonation. Fibroblasts activity is necessary for the repairing to continue constantly. The recovery process may range from several hours to 72h to complete [25]. As was presented in the study, the actual phonation for opera singers in 2–3h opera was of the series 20–30min for leading role, and their schedule performance was on the order of 3 per week [25]. Overall, these facts put opera singers in the favourable position for proper vocal recovery. Nevertheless, the type and loudness of phonation were not considered in research calculation, but they can play a tremendous role. Given this points, more research is needed to create appropriate guidelines to prevent singers from vocal fatigue.

Singers appear to be at particular risk of developing voice problems. Formal assessments of singers experiencing a voice problem at any given moment in a time range from about 20 to 50% [26]. Moreover, the impact of voice problems on quality of life was widely investigated in the literature. Many studies proved that decrease in voice quality and other voice impairments affects severely quality of life. Of course, in case of professional singers, this problem grows to the crucial role because directly concerns the source of income.

Attempts at analysing vocal fatigue in patients who already experienced this condition are difficult because of subject heterogeneity and burden with problems of data interpretation. Even individuals selected for having only symptoms of vocal fatigue usually present variable baseline and outcome data.

Professional opera singers have high stakes in sustaining excellent vocal condition but also experienced unique vocal demands, making them important population to study.

Useful tools to adapt to everyday practice are scales which help to evaluate singers’ perceptions of physical aspects of singing status. A good example is EASE scale (Evaluation of the Ability to Sing Easily) which is clinical outcome test for symptomatic aspects of compromised vocal health but was not designed as the primarily disease-specific instrument [27]. This test serves as the measure of potential changes in the singing voice which may indicate effects of vocal effort and may help to detect singers with the increased risk of possible development of voice disorders. The EASE was designed to help singers in assessing vocal load threshold, recovery time to assist performance scheduling, help to predict the development of vocal problems, evaluate therapeutic outcome in management for specific needs of the singer’s voice, lastly to provide supportive data for determining performance fitness [27].

Conclusion

Vocal fatigue may be underestimated but is one of the most frequent problems encountered in the ENT practice which provides care for professional voice users. The most frequent symptoms were muscle fatigue, diffuse sharp pain and muscle pain. In the study group, administration of anti-inflammatory drugs has not been associated with faster recovery from vocal fatigue.

References

  1. Kitch JA, Oates J (1994) The perceptual features of vocal fatigue as self-reported by a group of actors and singers. J Voice 8: 207–214.
  2. Titze I.R. (1984) Vocal fatigue: some biomechanical considerations. In: Lawrence VL (ed). (Transcripts of the Twelfth Symposium: Care of the professional voice Part One:Scientific Papers. New York: The Voice. Foundation;) Pg No: 97–104.
  3. Welham NV, Maclagan MA (2003) Vocal fatigue: current knowledge and future directions. J Voice 17: 21–30. [crossref]
  4. Cooper DS, Titze IR (1985) Generation and dissipation of heat in vocal fold tissue. J Speech Hear Res 28: 207–215. [crossref]
  5. Solomon NP (2008) Vocal fatigue and its relation to vocal hyperfunction . Int J Speech Lang Pathol 10: 254–266. [crossref]
  6. Sataloff RT () Professional Voice: The Science and Art of Clinical Care, 3-Volume Set, Fourth Edition. https://books.google.es/books?id=ImVGDwAAQBAJ&pg=PA547&dq =the+performance+voice+benninger&hl=pl&sa=X&ved= 0ahUKEwiUhqbJlLPZAhWDWxQKHRS7ARIQ6AEIcTAJ#v = onepage&q&f = false. Accessed February 20, 2018.
  7. Phyland DJ, Oates J, Greenwood KM (1999) Self reported voice problems among three groups of professional singers. 13: 602–611.
  8. Rocha C1, Moraes M, Behlau M (2012) Pain in popular singers. J Soc Bras Fonoaudiol 24: 374–380. [crossref]
  9. Faghy MA, Brown PI (2014) Thoracic load carriage-induced respiratory muscle fatigue. Eur J Appl Physiol 114: 1085–1093. [crossref]
  10. Wu YZ, Crumley RL, Armstrong WB, Caiozzo VJ (2000) New perspectives about human laryngeal muscle: single-fiber analyses and interspecies comparisons. Arch Otolaryngol Head Neck Surg 126: 857.
  11. Titze IR (1994) Mechanical stress in phonation. J Voice. 8: 99–105.
  12. Pearl Solomon N, Stemmle DiMattia M (2000) Effects of a vocally fatiguing task and systemic hydration on phonation threshold pressure. J Voice 14: 341–362
  13. Sivasankar M, Fisher KV (2002) Oral breathing increases Pth and vocal effort by superficial drying of vocal fold mucosa. J Voice 16: 172–181. [crossref]
  14. van Wyk L, Cloete M, Hattingh D, van der Linde J, Geertsema S (2017) The Effect of Hydration on the Voice Quality of Future Professional Vocal Performers. J Voice 31: 111. [crossref]
  15. Verdolini K, Min Y, Titze IR, Lemke J, Brown K, et al. (2002) Biological mechanisms underlying voice changes due to dehydration. J Speech Lang Hear Res 45: 268–281. [crossref]
  16. Leydon C, Wroblewski M, Eichorn N, Sivasankar M (2010) A meta-analysis of outcomes of hydration intervention on phonation threshold pressure. J Voice 24: 637–643.
  17. Boucher VJ (2008) Acoustic Correlates of Fatigue in Laryngeal Muscles: Findings for a Criterion-Based Prevention of Acquired Voice Pathologies. J Speech Lang Hear Res 51: 1161.
  18. Boucher VJ, Ayad T (2010) Physiological Attributes of Vocal Fatigue and Their Acoustic Effects: A Synthesis of Findings for a Criterion-Based Prevention of Acquired Voice Disorders. J Voice 24: 324–336.
  19. Caraty MJ, Montacié C (2014) Vocal fatigue induced by prolonged oral reading: Analysis and detection. Comput Speech Lang 28: 453–466.
  20. Behlau M, Oliveira G (2009) Vocal hygiene for the voice professional. Curr Opin Otolaryngol Head Neck Surg 17: 149–154. [crossref]
  21. Boucher VJ, Ahmarani C, Ayad T (2006) Physiologic features of vocal fatigue: Electromyographic spectral-compression in laryngeal muscles. Laryngoscope. 116: 959–965.
  22. Angsuwarangsee T, Morrison M (2002) Extrinsic laryngeal muscular tension in patients with voice disorders. J Voice 16: 333–343. [crossref]
  23. Timmermans B1, Vanderwegen J, De Bodt MS (2005) Outcome of vocal hygiene in singers. Curr Opin Otolaryngol Head Neck Surg 13: 138–142. [crossref]
  24. Yiu EM, Chan RM (2003) Effect of hydration and vocal rest on the vocal fatigue in amateur karaoke singers. J Voice 17: 216–227. [crossref]
  25. Titze IR (1999) Toward occupational safety criteria for vocalization. Logop Phoniatr Vocology 24: 49–54.
  26. Verdolini K, Ramig LO (2001) Review: occupational risks for voice problems. Logoped Phoniatr Vocol 26: 37–46. [crossref]
  27. Phyland DJ, Pallant JF, Benninger MS, et al. (2013) Development and preliminary validation of the EASE: A tool to measure perceived singing voice function. J Voice 27: 454–462.
  28. Smith B (2013) Choral Pedagogy. In: Brenda J, Sataloff RT (eds). (3rdedn). Plural Publishing, North America: 344.

Intervention Breathing Exercises and Their Effect on Breathing Stereotype and Vital Lung Capacity

DOI: 10.31038/AWHC.2019211

Abstract

Objective: Breathing difficulties are abundant throughout the whole population spectrum. Breathing pattern dysfunctions are frequent despite the fact that correct breathing is a necessary prerequisite for optimal functioning of the musculoskeletal apparatus, correct body posture and mental well-being. Furthermore, good breathing ventilation is immensely important in endurance sports. The quality of breathing stereotype also influences vital lung capacity. Incorrect breathing can be caused by blocked ribs and vertebra, dysfunction of breathing and stabilisation muscles, allergies, lung diseases, heart failure and above all excessive stress. When stimuli causing unsuitable breathing stereotype prevail too long, the dysfunction becomes fixated and must be eliminated and consciously corrected (using compensation exercises).

Methods: In this research, muscle dynamometer MD03 was utilised for examination of the breathing stereotype, followed by Spirometric measurements of forced exhalation of the vital capacity and exhalation volume values for 1 second. Two months intervention of targeted breathing exercises was applied on a group of adolescent athletes (19 individuals contributing to the intervention and 18 used as a control group) aged on average 17.26 ± 1.80.

Results: Factual as well as statistically significant influence on the involvement and strengthening of breathing muscles activated during diaphragmatic breathing at rest, as well as during deep breathing was shown. Improved values of FVC (forced expiratory vital capacity) by 6 % from 4.51 ± 1.13 L to 4.78 ± 1.12 L were obtained together with improved FEV1 (the forced expiratory volume in 1 second) by 6.1 % from 3.54 ± 0.71 L.s-1 to 3.76 ± 0.66 L.s-1. Both changes are both factually and statistically significant although the factual change displays only a slight effect. Only minimal change could be sees for the control group where FVC increased by 0.45 % and FEV1 by 0.86 %. The test group also showed significant increase in breathing volumes.

Conclusion: This study has confirmed that a two-month intervention of targeted breathing exercises has both factually and statistically significant influence on the activation and strengthening of breathing muscles.

Keywords

breathing pattern, breathing exercises, posture, spirometry, vital capacity

Introduction

Dysfunctions of the breathing pattern can be first indicators of a problem within the human body, be it of mechanical, physiological or mental kind [1]. Incorrect breathing can be caused by blocked ribs or vertebra, dysfunction of breathing and stabilising muscles, allergies, lung diseases, heart failures and above all excessive stress. Major role also belongs to a change in posture control [2] or changed dynamic spine stabilisation [3]. The breathing process is perfectly coordinated and controlled by the brainstem and medulla oblongata [4]. Breathing movements happen automatically, induced by the autonomous nerves, although the depth and rhythm of the breathing can be consciously regulated. This otherwise spontaneous activity can thus be influenced by will [5, 6]. Breathing and breathing movements maintain not only the fundamental metabolic processes connected to gas exchange but they also strongly influence body posture [7]. This implies that breathing influences posture stability while at the same time the quality of postural stability influences breathing. According to Kolář et al. [8] postural stability is defined as the ability to maintain upright body posture and at the same time have the ability to react on changed external and internal forces so as to prevent an unintentional or uncontrolled fall. Dylevský, Druda and Mrázková [9] describe postural stability as a balanced and coordinated posture of the body as a unit and as a highly specialised process of maintaining body balance and position of the body and its parts in a constantly changing environment. It is a musculoskeletal regulatory body mechanism that precedes every movement and afterwards seeks to maintain the reached position. It is therefore not a simple taking of a position but a continuous maintaining of its stability [8]. Furthermore, breathing movements are influenced not only by internal and external environment but also by the state of mind. While happiness undermines extensive body posture and increases breathing movements, sadness and depression are exhibited by flexed body posture and hindrance of breathing movements [10].

Breathing movements are divided into three areas, namely abdominal, lower thoracic or diaphragmal and upper thoracic or subclavian. The thoracic breathing movements differ by the distinctive activation of the ribs in the given areas. Breathing movements go through rhythmical interchanging activity of the breathing muscles in dependence on the physical activity and the stress condition of the organism, with simultaneous activation of the axial organ muscles. Breathing muscles are further divided according to their anatomic function into primary and accessory inhalation and primary and accessory exhalation muscles with the most important breathing muscle being m. diafragma (the diaphragm) [8, 10]. During inhalation both the diaphragm and mm. intercostales externi compress. Muscle fascicles of the diaphragm are concentrically contracted causing pressure on the content of the abdominal cavity from above. This pressure is further transferred to the pelvic area, and in order to avoid prolapse of the abdominal organs the muscles of the pelvic area start contracting concentrically together with the diaphragm. These two muscle units then work as a sort of pistons working against each other from below and above forcing the content of abdominal cavity toward the remaining directions – forward and to the sides, respectively backwards. The relatively large area of the diaphragm induces an increase of the internal abdominal pressure while at the same time the lumbar spine area is heavily compressed using the function of the transverse abdominal muscle that is eccentrically activated and thus hinders the content of the abdominal cavity to move forward and to the sides causing the circumference of the waist to enlarge. On the other hand, the tendency of the abdominal cavity to move backwards during inhalation is for the majority of postural situations minimal [8, 11].

Simultaneously, the diaphragm is an important muscle for the postural function [4], with up to 75% of the volume change of the intrathoracic space during quiet breathing being caused by diaphragm function while its function alone is sufficient for 2/3 of the lung vital capacity [8]. The range of diaphragm movement is 1–2 cm during quiet breathing and up to 10 cm during heavy breathing which activates even the external intercostal muscles. Furthermore, during extreme breathing also the auxiliary respiratory muscles get activated which help to lift the first and second ribs together with sternum [12].

Clifton-Smith and Rowley [1] define dysfunction of the breathing stereotype as disproportionate breathing which is sufficient for the utterance of given symptoms even with no organic causes. Without such structural causes the dysfunction stems from muscular dysbalances, functional disorders of the muscular-skeletal system, that lead to ineffective breathing. This in its turn then induces muscular adaptational mechanisms towards the outside influences. Muscular dysbalance usually evolves due to a disturbed muscular synergy when one antagonistic muscle gains dominance over its counterpart. The cause of muscular imbalance can be even a remote dysfunction, such as reflexive change in a muscle that causes pain or influence other connected muscles which in its turn causes the organism toward an antalgic body posture not ideal for movement stereotypes [10, 11]. Therefore when trying to influence breathing functions it must be taken into consideration that the breathing and muscular-skeletal systems must be approached as interconnected [8].

In order to assess breathing stereotype, several methods can be used such as palpation examination, whole-body plethysmography, chest skiagram, spirometry or usage of different instruments that are able to detect movement of individual segments of the respiratory system [13–15]. Involvement of the individual muscle segments can be determined for instance through a 3D system [16]. Kaneko and Horie [16] conducted such measurements using thirteen probes in different positions, during quiet and deep breathing and found connections between breathing movements and age, body posture and gender. Monitoring of breathing movements is enabled by measurements of chest circumference over meso-sternale and xipho-sternale junctions, evaluating and registering the difference between in- and exhalation [13]. Bockenhauer et al. [17] measured chest broadening using a measuring tape at two different levels (heights). The upper measurement of chest expansion was conducted at the level of the spinous process of the fifth thoracic vertebra and third intercostal space in the middle of the clavicle, while the lower measurement proceeded at the level of the spinous process of the tenth thoracic vertebra and the baseplate tip. Three different people measured maximal inhalation and maximal exhalation circumference at both levels and obtained thus a value of the chest expansion. This study confirmed the objectivity of examination chest movements in the middle and upper sectors of the rib cage using a tape measure [17]. Moll and Wright [18] used two separate techniques to measure the expansibility of the chest, using the calliper and using the tape measure at the fourth intercostal space with the arms of the patient raised above the head. They then concluded that circumference measurements alone should suffice. Burgos-Vargas et al. [19] also measured the expansiveness of the chest with a tape measure at the fourth intercostal space (arms raised). The activity of the breathing muscles during breathing cycle can also be investigated through polyelectromyography examination [14]. In order to learn about the strength of the breathing muscles even non-invasive methods of examination of maximum inhalation and exhalation mouth pressures can be used [20, 21]. The performance of breathing movements is denoted as the breathing wave. It begins with inhalation, proceeds from the lower over the medium to the upper sector. The exhalation wave on the other hand starts with lowering of the abdominal wall and simultaneous caudal lowering of the chest. Further, the sternum constricts and exhalation process is finished by activated abdominal muscles [10]. The importance of measurements of the chest expansion was confirmed by Bockenhauer et al. [17], and also Fisher, Cawley and Holgate [22].Their studies all showed the important connection between the chest expansion and vital capacity of the lungs. Effectivity of highly trained long distance runners is often limited by their breathing system. Spirometric examination of the static and dynamic ventilation parameters belong to basic methods for diagnosis of the respiratory system [23].

Change in the breathing stereotype is possible through active training of deep breathing, as agreed by Thomas and McIntosh [24] in their work. During such training it is necessary to monitor the breathing pattern of the examined individual and make him aware of its possible insufficiencies [4]. In order for the consequences of the training to start showing, the training must proceed for a certain time with a minimum of ten breathing exercises which evoke an important regular rhythm in the body. One such technique is isolated breathing, where three different types of breathing are practiced, namely diaphragmal, chest and subclavian breathing. The aim of diaphragm breathing is above all to realise its activity and learn to use it. The focus of chest breathing is then to gain increased flexibility of the rib cage, while subclavian breathing is meant to loosen the area of the neck and teach about the accessibility of the upper lobes of the lungs [6].Training exercise of at least six to eight weeks is necessary in order to be able to influence intermuscular coordination and improve intermuscular cooperation. Adaptational changes in the form of hypertrophy then appear after longer time, within months or years [25].

In both clinical and sporting practice vital capacity of the lungs is most often measured using the FVC test (basic forced volume vital capacity), where also the velocity of exhalation is determined, for instance for the time period of one second (FEV1), which also points to the strength of the exhalation muscles, an important and surveyed factors in endurance sports. Higher values of vital capacity (VC) can be reached through endurance training, although the values are also influenced by body constitution and size of the rib cage [26]. During long-term submaximal training inhalation muscles experience fatigue which is a limiting factor in endurance training. However, breathing exercises can enhance the efficiency of the breathing muscles. Endurance athletes usually have higher values of vital capacity, although their performance needs not be directly dependent on those. Highest values of VC have been determined for swimmers (up to 8 litres) which results from their breathing into the water and therefore against resistance. Adapted breathing is exhibited by a lower breathing work during same load in comparison to the unadapted. A certain amount of oxygen then remains for other purposes. As a consequence of endurance training the respiratory tract increases its ability to transport oxygen, which will also show during load. On the other hand, the maximum static and dynamic values remain basically unchanged. The aim of this work was to determine the influence of the intervention breathing exercises on the breathing stereotype and values of the forced volume vital capacity of the lungs [26].

Methodology

This study was conducted in the Laboratory of stress diagnosis, at the Department of Physical Education and Sports, Pedagogical faculty of the South Bohemian University. 37 individuals aged 17.26 ± 1.80 participated in this study, where each does endurance sport training six times a week; they are mostly mid-distance and long-distance runners. 19 individuals were involved in the intervention (ten females and nine males), while eighteen individuals functioned as a control group (nine females and nine males). The age of the females at the time of the study was 17.40 ± 2.01 years of age, with average weight 59.07 ± 6.70 kg and height 169.47 ± 4.04 cm. The age of the male group at the time of the research was 17.11 ± 1.52 years of age, average weight 60.47 ± 14.32 kg and height 176.40 ± 9.49 cm. Targeted selection was conducted based on the fact that endurance athletes are expected to have above-average breathing functions with strong connection to their performance. The aim of this research was to prove the influence of breathing exercises on the values of vital capacity of the lungs (VC) and on the quality of the breathing pattern. It was presumed that there will be a transfer of increased values of VC to values of breathing volume under load, which in its turn will influence endurance performance, which consecutive research will prove.

Vital capacity was measured using basic forced volume vital capacity test (FVC) as well as exhalation values under 1s (FEV1). Thereafter, the test group got instructions to conduct breathing exercises for two months, minimum five times a week for at least ten minutes. At the same time, once a week a common exercise session was organised at the end of running training session, where the execution of the exercises was checked and corrected. The tested individuals would each day take notes of the time of the exercises into a prepared table that they continuously checked in. After two months a re-test was conducted of all followed variables. Same measurements were simultaneously conducted for the control group. Test methodology was conducted according to the instrument instructions: after quiet inhalation and exhalation follows maximal inhalation and forced maximal exhalation. This procedure is repeated three times and the best result is registered. The instrument registers if sufficient force and necessary length of exhalation were used. If the parameters of the test were insufficient, the experiment was not registered and experiment needed to be repeated. The FVC test was conducted in upright position with Spirometer Otthon instrument, while the evaluation was conducted using ThorSoft program. Figure 1 shows the development of the breathing curve as registered by the spirometer instrumentation.

Muscle dynamometer was used for the examination of breathing stereotype [27–30]. Due to the ability of the muscle dynamometer to register movement dynamics, it is possible to use it to monitor the dynamics of the breathing function. Breathing analysis is based on the concept of three sectors (parts) of the chest and therefore three measuring sensors were also used. The exact positions for placing the sensors were chosen based on the kinematics of the mentioned chest sectors [9].The lower chest sector (abdominal) is found below apertura thoracis inferior. Anatomically the abdominal muscles and their initiations on the cartilaginous parts of the false ribs and the breast bone participate in the build-up of this part of the chest. The correct spot for the first sensor is then on the ventral side at level of L4–5. For the central sector of the chest the correct placement is on the thoracic spine limited by the area between Th6-Th12 and the fifth to twelfth rib. The sensor for this sector was placed on the level of 8–9 rib on the ventral side just below the sternum. The upper chest sector (apical) spreads from C4 to Th3–4 to the upper aperture and the fifth rib. The third sensor was placed on the level of 3 to 4 rib on the ventral side in the area of the sternum. Movements of the thoracic spine sector influence the dynamics of breathing, while breathing will influence dynamics of the spine [8].The test of breathing dynamometry is conducted in the upright body position as this position is physiological for breathing [4]. The dynamometer instrument can register activation of the breathing muscles, as it measures immediate values of force activity of the muscles as a function of time. Both the strength and dynamics of the muscle force can be evaluated. Through the sensors the lifting of individual segments during quiet breathing for one minute and during deep breathing for one minute was monitored. During data analysis ten inhalations and exhalations was averaged. The test group trained the breathing exercises for eight weeks. The intervention program was focused on isolated breathing in different positions, training for the breathing wave, full breathing and rhythmical breathing. Full breathing was also trained in accordance with movements during short dynamical sets of exercises [31–33]. After input measurements, the test group was introduced to breathing exercises and their training was conducted under expert supervision. The test group was asked to conduct the given exercises at home at least five times a week for at least ten minutes. Once a week a mutual training session was organised, after running training session, where the exercises were checked and corrected by expert supervisor. An output examination similar to the input one was conducted. The control group did not do any breathing exercises. For evaluation of the collected data these tests were used: the determination of the effective significance Cohen’s d test for determination of practical significance and Student‘s paired t-test for dependent samples. The level of significance was determined based on α = 0.05. Data analysis was conducted using Microsoft Excel 2016 and Statistica 12.

Results

The test group athletes did breathing exercises for two months for 13.2 ± 3.87 minutes a day on average. The FVC results before the intervention exercises (Figure 1) were calculated to 4.51 ± 1.13 L and those after the intervention time equalled 4.78 ± 1.12 L (see Figures 2 and 3). For the control group the results amounted to 4.39 ± 1.21 L before the intervention and 4.41 ± 1.23 L thereafter. For the test group the improvement of the breathing volume during FVC was 6.0 % while for the control group 0.45 %. Therefore for the test group the factually significant improvement of the FVC (Cohen’s d = 0.24, small effect), is therefore statistically significant (Figure 2, 3). No significant differences between male and female individuals were found.

AWHC-18-116 - Renata Malátová_Czech Republic_F1

Figure 1. Breathing curve during FVC test.

AWHC-18-116 - Renata Malátová_Czech Republic_F2

Figure 2. FVC value for tested individuals before the intervention of breathing exercises and after.

AWHC-18-116 - Renata Malátová_Czech Republic_F3

Figure 3. The distribution of values of FVC in tested individuals before interventions breathing exercises and after.

During the analysis of the breathing movements (Figure 4) in the individual sectors of the chest after the intervention program, an improvement particularly for the abdominal breathing was found, for both the quiet breathing, increase by 46.5 % (Cohen’s d=0.56, medium effect), and deep breathing with increase by 61.5 % (Cohen’s d = 0.82, large effect). For subclavian breathing both factually and statistically significant increase by 19.2 % of its contribution to deep breathing was found (Cohen’s d = 0.42, small effect). An increase for quiet subclavian breathing by 6.9 % was observed, although the change is neither factually or statistically significant (Cohen’s d = 0.11). For chest breathing a decrease in values by 20.5 % during quiet breathing was found, a change that is factually (Cohen’s d = 29.4, small effect) although not statistically significant. For deep chest breathing the activity of breathing muscles decreased by 21.8 %, a change that is factually (Cohen’s d = 35.9, small effect) and statistically significant. For the control group no factually or statistically significant change was observed, with change not larger than 1.5 % for any breathing muscle segment was found.

AWHC-18-116 - Renata Malátová_Czech Republic_F4

Figure 4. Involvement of the different segments of the thorax during quiet breathing and deep breathing before the intervention and after (breathing: BK – abdominal quiet, BH – abdominal deep, HK – chest quiet, HH – chest deep, PK – subclavian quiet, PH – subclavian deep).

Discussion

In order to be able to strengthen the necessary breathing muscles during the intervention, the three sections of deep breathing must be consciously acknowledged, trained separately and then reunited. The first most important section of breathing is the diaphragmal or abdominal breathing that is responsible for 60% of the full breathing efficiency. Chest breathing corresponds to 30% and subclavian to 10% of efficient breathing. The given percentage ratio applies to most of everyday activities. During physical exercise or some (pathological) changes in the organism this ratio is significantly changed [34]. As Kolář et al. [8] state the fact remains that the diaphragm is responsible for 2/3 of the gas exchange in the lungs.

The aim of the intervention program was to achieve controlled optimal stabilisation interplay of the breathing muscles and make the correct breathing stereotype automated. The emergence and development of overload on the musculoskeletal system can thus be prevented. However, success of the therapy is highly dependent on active participation of the test group. The output examination concluded improvement of both quiet and deep abdominal, as well as deep subclavian breathing. At the same time the chest breathing was shown to decrease for both the quiet and deep breathing types. Breathing movements that led to improved diaphragm breathing and simultaneous decrease of activity of chest breathing represents a positive change towards optimal activation of breathing muscles [8].The reality that needs to be respected is the fact that postural functions, positioning of the body in certain position or during a movement and the breathing functions are strongly interconnected and the keystone of this connection is the diaphragm, the major breathing muscle. A positive influence on the breathing pattern will also improve the stabilisation function of the diaphragm. Véle [10] states that quite frequently we meet patients with inspiratory positioning of the thorax (horizontal progression of the ribs) with activated accessory muscles (auxiliary inhalation muscles) during quiet breathing. These muscles have multiple connections onto the spine and for long-term inspirational positioning these muscles become central for the positioning of individual segments of the spine. This is the primary objective necessary to alter and teach the patient how to relax these muscles and at the same time activate the muscles of the lower respiratory sector so that the dysfunction of the breathing mechanism can be eliminated and as a feedback the postural functions can be influenced. This aim has been achieved by the application of the intervention program and the diaphragmal breathing was improved.

The chest and diaphragm breathing complement and compensate each other, which is why their function must be optimised. If the chest expansion is malfunctioning and the chest is rigid, the participation from the diaphragm increases and starts to dominate and vice versa. Provided that the extension of the chest is desired, the abdominal wall muscles need first to become relaxed in order for the diaphragm to be able to get as low as possible. During exhale, the abdominal muscles must contract to cause the compressed bowels to push the diaphragm up in the cranial direction. This causes a decrease of the chest volume and the exhale deepens. During influence of the external forces abdominal muscles are gradually activated, fixating the lower section of the chest. At the same time the spine is stabilised and hinders inspirational positioning of the chest [8]. Success of the therapy presumes an active participation of the test group. This was not always the case and for some tested individuals the improvement was minor, for some even negative. Once a week the exercises were conducted under supervision and their correct performance checked and if necessary corrected. The rest of the week, though, the exercises were conducted in home environment outside supervisor control where the effect of the exercises could be influenced by the quality of their performance. The results of the FVC tests are therefore not uniform, with half of the test group showing improvement by more than 0.3 L, while two individual did not show any improvement. After the two-month intervention exercises an improvement in FVC values was achieved for 95 % of the followed individuals. This change is furthermore both factually and statistically significant. No factually significant differences were observed between male and female individuals. For the FEV1 values an improvement was observed for 78 % of the tested individuals, for half of them by more than 0.3 Ls-1. One quarter of the individuals exhibited worsened, if by minimum, FEV1 values.

Conclusion

This study has confirmed that a two-month intervention of targeted breathing exercises has both factually and statistically significant influence on the activation and strengthening of breathing muscles through diaphragm breathing during both quiet and deep breathing and has at the same time factually and statistically significant influence on elevation of FVC and FEV1 values.

Acknowledgement

This research was supported by Grant agency of the University of South Bohemia within Team research project no. 034/2015/S.

References

  1. Clifton-Smith T, Rowley J (2011) Breathing pattern disorders and physiotherapy: inspiration for our profession. Physical Therapy Reviews 16: 75–86.
  2. Baltich J, von Tscharner V, Nigg BM (2015) Degradation of postural control with aging. Proc Inst Mech Eng H 229: 638–644. [crossref]
  3. Karakoyun DO, Özkaya M, Okutan VC, Dalgıç A, Belen D, et al. (2015) Biomechanical comparison of unilateral semi-rigid and dynamic stabilization on ovine vertebrae. Proc Inst Mech Eng H 229: 778–785. [crossref]
  4. Smolíková L, Mácek M (2010) Respiratory Physiotherapy and Pulmonary Rehabilitation. Brno: National center of nursing and non-medical health care.
  5. Mourek J (2005) Physiology: textbooks for medical students. Prague: Grada.
  6. Votava J (1988) Yoga by the doctor‘s eye. Prague: Avicenum.
  7. Véle F (2006) Kinesiology: a review of clinical kinesiology and pathogenesis for the diagnosis and therapy of musculoskeletal disorders. Prague: Triton.
  8. Kolár P, Bitnar P, Dyrhonová O, Horáček O, Kríž J, Adámková M … Zumrová I (2009) Rehabilitation in Clinical Practice. Prague: Galén.
  9. Dylevsky I, Druda R, Mrázková O (2000) Functional anatomy of man. Prague: Grada.
  10. Véle F (2012) Investigation of motor functions from a neurophysiological point of view: a guide for therapists working in neurorehabilitation. Prague: Triton.
  11. Malátová R (2015) Breath stereotype disorders. In Brodáni, Movement and Quality of Life 2015. Nitra: KTVŠ PF UKF Nitra.
  12. Rokyta R (2000) Physiology: for Bachelor Studies in Medicine, Natural Sciences and Physical Education. Prague: ISV.
  13. Cahalin LP (2004) Pulmonary evaluation. In: DeTurkW. E. & Cahalin L. P. (eds.). Cardiovascular and pulmonary physical therapy. McGraw-Hill, New York, USA.
  14. Kandus J, Satinská J (2001) A brief guide to the treatment of lung function. Brno: Institute for Further Education of Worker in Health Care.
  15. Lewit K (2003) Manipulative treatment in myoskeletal medicine. Prague: Saving Technology.
  16. Kaneko H, Horie J (2012) Breathing movements of the chest and abdominal wall in healthy subjects. Respir Care 57: 1442–1451. [crossref]
  17. Bockenhauer SE, Chen H, Julliard KN, Weedon J (2007) Measuring thoracic excursion: reliability of the cloth tape measure technique. J Am Osteopath Assoc 107: 191–196. [crossref]
  18. Moll JM, Wright V (1972) An objective clinical study of chest expansion. Ann Rheum Dis 31: 1–8. [crossref]
  19. Burgos-Vargas R, Castelazo-Duarte G, Orozco JA, Garduño-Espinosa J, Clark P, et al. (1993) Chest expansion in healthy adolescents and patients with the seronegative enthesopathy and arthropathy syndrome or juvenile ankylosing spondylitis. J Rheumatol 20: 1957–1960. [crossref]
  20. Harik-Khan RI, Wise RA, Fozard JL (1998) Determinants of maximal inspiratory pressure, The Baltimore Longitudinal Study of Aging. Am J Respir Crit Care Med 158: 1459–1464.
  21. Rochester CL (2003) Exercise training in chronic obstructive pulmonary disease. J Rehabil Res Dev 40: 59–80. [crossref]
  22. Fisher LR, Cawley MI, Holgate ST (1990) Relation between chest expansion, pulmonary function, and exercise tolerance in patients with ankylosing spondylitis. Ann Rheum Dis 49: 921–925.
  23. Kenney WL, Wilmore J, Costill D (2015) Physiology of Sport and Exercise 6th Edition. Human kinetics.
  24. Thomas JA, McIntosh JM (1994) Are incentive spirometry, intermittent positive pressure breathing, and deep breathing exercises effective in the prevention of postoperative pulmonary complications after upper abdominal surgery? A systematic overview and meta-analysis. Physical Therapy 74: 3–10.
  25. Dovalil J, Choutka M, Svoboda B, Hošek V, Peric T, et al. (2005) Výkon a trénink ve sportu. Praha: Olympia.
  26. Bartunková S, Heller J, Kohlíková E, Petr M, Smitka K, et al. (2013) Fyziologie pohybové záteže. Praha: FTVS UK.
  27. Malátová R, Pucelík J, Rokytová J, Kolár P (2007) The objectification of therapeutical methods used for improvement of the deep stabilizing spinal system. Neuro Endocrinol Lett 3: 315–320.
  28. Malátová R, Pucelík J, Rokytová J, Kolár P (2008) Technical means for objectification of medical treatments in the area of the deep stabilisation spinal system. Neuro Endocrinol Lett 1: 125–130.
  29. Malátová R, Drevikovská P (2009) Testing procedures for abdominal muscles using the muscle dynamometer SD02. Proc Inst Mech Eng H 223: 1041–1048. [crossref]
  30. Malátová R, Rokytová J, Stumbauer J (2013) The use of muscle dynamometer for correction of muscle imbalances in the area of deep stabilising spine system. Proc Inst Mech Eng H 227: 896–903. [crossref]
  31. Polášek M (1990) Joga eight stages of training. Bratislava: Sport.
  32. Kombercová J, Svobodová M (2000) Autorehabilitační sestava. Prague: Fountain.
  33. Bursová M (2005) Compensation exercises. Prague: Grada.
  34. Sponar, D. (2003). The basics of breathing. http://www.cvicime.cz/pdf/prace_s_dechem.pdf.

Surface Roughness Evaluation of Different Polishing Techniques on Dental Porcelains By Atomic Force Microscopy

DOI: 10.31038/JDMR.2018124

Abstract

Introduction: This study was conducted to find out different polishing techniques’ effects on different porcelain materials by using atomic force microscopy (AFM).

Material and Methods: Samples were made from four different porcelain materials (VMK 95, Ceramco III, Matchmaker, Vitablocs Mark II). Nine groups (n = 5) were randomly formed from the samples of each ceramic and nine different polishing methods were applied on them. AFM was used to evaluate the external topography and roughness of dental porcelains. To analyze the results of the study ANOVA and Tukey test were used statistically ( = 0.05).

Results: Within the porcelain groups Ceramco and Matchmaker had higher Ra values, however VMK 95 and Mark II had lower Ra values. However when the different polishing techniques were compared, Gl (.1110) and SlPg (.2295) were found to have the lowest Ra values and no statistical differences were found between these two techniques (p > .05). In addition, no differences were found between glazed samples (Gl) and after polishing with Sof-lex and Prisma Gloss (Sl-Pg). On the other hand polishing with Sl and Pg together (Sl-Pg) significantly decreases the surface area.

Conclusions:There were statistically significance between the glazed and the other specimens. Different polishing methods influenced the surface topography of different porcelains significantly ( p < .001).

Key words

AFM, surface roughness, polishing, dental porcelain

Introduction

The key factor of an esthetic fixed restorations is dental porcelains. Transparency, conveyance of light, and biocompatibility supply dental ceramics with exceptionally advantageous esthetic properties [1]. A smooth surface is important for the function, esthetic and biocompatibility of dental porcelains [2] and also it’s preferable to decrease bacterial holding and to obtain a clear appearance [3]. The dental porcelain surface finishing procedure is achieved by glazing since their surfaces are smooth. In the delivery of porcelain fixed prosthesis, external alterations are crucial to improve occlusal obstructions and poor contours, to finalize the boundary of porcelains, and to enhance final look of restorations [4]. Generally, a smooth surface is essential because surface modifications of the porcelain damage glazing, thus creating rough, unpolished, nutrient-enhancing surfaces.

In this situation to refinish the porcelain surfaces intraorally with different polishing methods are mandatory to restablish surface smoothnes [4, 5]. To create the surface smoothness of dental porcelains there are many different mechanical polishing methods using rotary instruments such as diamond bars and drills, different pastes, stones, rubber discs or different polishing kits.

Atomic force microscopy (AFM) is an important tool for qualitative and quantitative evaluation of surfaces which is presented in 1986 by Binning et al [6] . With the help of mechanical scanning, AFM directly inspects the exterior of the sample without using any lens or photon. With a sharp tip on, it scans over a surface, and measures the deflection, it is possible to get a topographic photograph of the surface. The deflection sensor may help to measure with enough sensitivity in disclose profiles with nanometer scale resolution [7]. With the contact, noncontact and tapping modes it’s possible to have three different measurement records from different samples. AFM topographs give quantitive and structural (3D) information about surface of a material nanometrically which allows a high accuracy in finding out the external roughness. AFM can analyze the external roughness of dental porcelains [5, 8–11]. The null hypothesis in this research was that there are no differences between surface roughness of dental porcelains after different polishing methods by means of AFM evaluation.

Material and Methods

Four different commonly used dental porcelains (Vita VMK 95, Ceramco, Vitablocks Mark II and Matchmaker) and six different polishing systems glaze, finishing and polishing with polishing discs (Sof-Lex), polishing kit (Dialite II), polishing pastes (Sparkle, Zircate, Prisma Gloss) and combinations of them were investigated in this study (Table 1). One researcher prepared cylindrical samples (15x2mm) of four different dental porcelains by means of using polyvinylsiloxane mold to encapsulate the ceramics. All of the samples were mixed with a standart quantity of ceramic and liquid which were placed in the mold and condensed by using a plastic aparatus. A tissue (Selpak; Eczacıbaşı Holding, Sakarya, Turkey) was used to absorb excess moisture (Programat P80; Ivoclar Vivadent, Liechtenstein). The samples were taken away and putt into the oven in line with the producer’s instructions (roughly 920–960ºC ). The rectangular ceramic samples which were 12, 14, 18 mm in size were sliced into pieces of 2, 14, 18 mm in size with a Buehler Isomet Low Speed cutting machine (Lake Bluff,  Illinois,  60044–1699,  USA). For a period of ten seconds, 600 grit silicon carbide paper was used by using a 300-rpm grinding MetaServ polishing (MetaServ, Buehler, England) to wet-ground ceramic discs. The samples were grouped in nine subgroups (n = 5) and the following procedures were applied (Table 2):

Table 1. Materials used in the study.

Material

Manufacturer

Material

VMK 95

Vita Zahnfabrik, Germany

Feldspathic porcelain

Ceramco III

Degudent GmbH,USA

Feldspathic porcelain

Matchmaker MC

Schottlander,UK

Low fusing porcelain

Vitablocks Mark II

Vita Zahnfabrik, Germany

Machinable feldspathic porcelain

Sof-Lex

3M ESPE,USA

Finishing and polishing dics

NTI Cera Glaze

NTI-Kahla GmbH,Germany

Porcelain polishing kit

Dialite II

Brasseler,USA

Porcelain polishing kit

Sparkle

Pulpdent,USA

Diamond polishing paste

Zircate

Dentsply,USA

Zirconium silicate cleaning-prophy paste

Prisma Gloss

Dentsply,USA

Aluminium oxide polishing paste

Table 2. Different polishing groups.

Study Groups

Polishing Techniques

Group- Gl

Glaze

Group- Sl

Sof- lex discs

Group- Di

Dialite II polishing kit

Group- Sp

Sparkle diamond polishing paste

Group- Zr

Zircate polishing paste

Group- Pg

Prisma Gloss polishing paste

Group- SlSp

Sof- lex + Sparkle

Group- SlZr

Sof- lex + Zircate

Group- SlPg

Sof- lex + Prisma Gloss

Group Gl: with a predetermined glaze material, the samples were glazed.

Group Sl: the samples were polished with polishing discs of 12.7 mm diameter (Sof-Lex; 3M/ESPE, St. Paul, MN, USA) for ten seconds for fine and superfine discs at 30, 000 rpm and for ten seconds for coarse and medium discs at 10, 000 rpm by using an electric handpiece set by following the producer’s directions.

Group Di: Dialite II ceramic polishing kit which had pre, fine and high-shine wheels was used to polish the samples for ten seconds at 10, 000 rpm.

Groups Sp: Sparkle diamond polishing paste was applied for ten seconds to the samples with a prophylaxis rubber cup (Kenda Polishers, Kenda AG, Liechtenstein) mounted on an electric handpiece at 15, 000 rpm.

Groups Zr: Zircate zirconium silicate cleaning-prophy paste was applied as in the same method of Groups Sp above.

Groups Pg: Prisma Gloss aluminum oxide polishing paste was applied as in the same method of Groups Sp above.

Group SlSp: The samples were polished first by following the procedure in Group Sl and then by following the procedure in Group Sp.

Group SlZr: First by following the procedure in Group Sl, the samples were polished and then by following the procedure in Group Zr, zirconium silicate cleaning-prophy paste was applied.

Group SlPg: First polishing was done by following the procedure in Group Sl and then by following the procedure in group Pg aluminum oxide polishing paste was applied on the samples.

The same investigator performed all polishing procedures. Lastly, the specimens were cleaned ultrasonically for 10 min (Eurosonic Energy, Euronda, Italy) by using deionized water and then they were dried. Porcelain specimens were evaluated under an AFM (AFM, PSIA XE-100E, PSIA Inc, CA, USA) to obtain a quantitive and qualitative evaluation [5]. With a scan length of 20µm x 20µm and a scan rate of 0.5Hz [12]. AFM images were photographed (Figure 1a-4b). Following different external procedures, the average surface roughness (Ra) of the ceramic substrate was examined by a single operator and analyzed after different surface treatments. Three measurements were performed from three different areas all located in the centre of the specimens [13, 14]. Means and standart deviations of surface roughness measurements were determined. Two-way ANOVA was used to evaluate surface roughness data and SPSS (12.0.1; SPSS Inc, Chicago, IL, USA) was used for statistical analyses. Tukey was used to compare the mean values (p < 0.05).

Results

The null hypothesis of the study was rejected. Statistically significant differences occured due to the various polishing methods on the external topography of different porcelains (p < .001). In the figures (1a-4b) respectively three dimensional AFM images of different porcelain specimens subjected to different surface treatments are shown. There were statistically significance between the glazed and the other specimens (p < .05). On the other hand polishing with sof-lex and aluminum oxide polishing paste together (Sl-Pg) significantly decreases the surface area.

When the porcelain specimens are compared Mark II and VMK 95 were statistically different from Ceramco III and Matchmaker, and both of them presented similar result within as seen in (Table 3). When the polishing techniques are compared, group of Gl (.1110) and SlPg (.2295) were found to have the lowest Ra values and there were no statistically significant differences between the two groups (Table 4) (p > .05). The highest Ra value was obtained in the group of Sp (.8511) (p = .05).

Table 3. Mean surface roughness and differences between the groups of porcelains.

Porcelains

Ra

Difference*

VMK 95

,3895

A

Mark II

,3456

A

Ceramco

,4907

B

Matchmaker

,4967

B

* Mean Ra values for groups in non homogeneous subsets are displayed with different letters p= .05

Table 4.Mean surface roughness and differences between the groups of surface treatments.

Surface Treatment

Ra

Difference*

Gl

,1110

A

SIPg

,2295

Ab

SIZr

,3507

Bc

Zr

,4359

Cd

Pg

,4384

Cd

Di

,4609

Cd

SISp

,4727

Cd

SI

,5255

D

Sp

,8511

E

* Mean Ra values for groups in non homogeneous subsets are displayed with different letters p= .05

When all the porcelains’ surfaces were evaluated, the highest Ra value was in the group of Mark II Sp (1.147) (Figure 1a) and the lowest value was in Mark II Gl (0.0860) (Figure 1b) (Table 5). When the Ra value of VMK 95 porcelain evaluated the highest Ra was in the SlSp (Figure 2a) and the lowest was in Gl group (Figure 2b). There weren’t statistically significant differences between groups SlZr, Pg, SlPg, Zr, Sp and SlSp for VMK 95 porcelain (Table 6). When the Ra value of Mark II porcelain evaluated the highest Ra was in the Sp (Figure 1a) and the lowest was in Gl group (Figure 1b). There weren’t statistically significant differences between groups SlZr, Di, Pg, and Zr for Mark II porcelain (Table 5). When the Ra value of Matchmaker porcelain evaluated the highest Ra was in the Sl (Figure 3a) and the lowest was in Gl group (Figure 3b). No statistically significant differences were found between groups Gl, SlPg, SlZr and also the groups of Di, Pg, Zr, Pg, Sl ve Sp for Matchmaker porcelain (Table 7). When the Ra value of Ceramco porcelain evaluated the highest Ra was in the Sp (Figure 4a) and the lowest was in SlPg group (Figure 4b). No statistically significant differences were found between groups SlZr, Di, Pg, Zr, Pg, SlSp, Sl for Ceramco porcelain (Table 8).

JDMR-18-107-Goknil Ergun_Turkey_F1a

Figure 1a. Atomic force microscope image of Mark II Sp.

JDMR-18-107-Goknil Ergun_Turkey_F1b

Figure 1b. Atomic force microscope image of Mark II Glaze.

Table 5. Mean surface roughness and differences for the Mark II porcelain subjected to different surface treatments.

Surface Treatment

Ra

Difference *

Gl

,0860

A

SIPg

,2473

Ab

SIZr

,3660

Bc

Zr

,4293

Bcd

Pg

,4510

Bcd

Di

,4593

Cd

SISp

,5973

Bcd

SI

,6333

D

Sp

1,147

E

* Mean Ra values for groups in non homogeneous subsets are displayed with different letters p= .05

JDMR-18-107-Goknil Ergun_Turkey_F2a

Figure 2a. Atomic force microscope image of VMK SlSp.

JDMR-18-107-Goknil Ergun_Turkey_F2b

Figure 2b. Atomic force microscope image of VMK Glaze.

Table 6. Mean surface roughness and differences for the VMK 95 porcelain subjected to different surface treatments.

Surface Treatment

Ra

Difference *

Gl

,1163

A

SIPg

,2960

Ab

SIZr

,3303

Bc

Zr

,3680

Cd

Pg

,3703

Cd

Di

,3830

Cd

SISp

,4720

Cd

SI

,4837

D

Sp

,6860

E

* Mean Ra values for groups in non homogeneous subsets are displayed with different letters p= .05

JDMR-18-107-Goknil Ergun_Turkey_F3a

Figure 3a. Atomic force microscope image of Matchmaker Sl.

JDMR-18-107-Goknil Ergun_Turkey_F3b

Figure 3b. Atomic force microscope image of Matchmaker Glaze.

Table 7. Mean surface roughness and differences for the Matchmaker MC porcelain subjected to different surface treatments.

Surface Treatment

Ra

Difference*

Gl

,1353

A

SIPg

,1840

Ab

SIZr

,3817

Abc

Zr

,6187

Cde

Pg

,5360

Cde

Di

,6980

De

SISp

,4540

Bcd

SI

,7887

E

Sp

,6740

Cde

* Mean Ra values for groups in non homogeneous subsets are displayed with different letters p= .05

JDMR-18-107-Goknil Ergun_Turkey_F4a

Figure 4a. Atomic force microscope image of Ceramco Sp.

JDMR-18-107-Goknil Ergun_Turkey_F4b

Figure 4b. Atomic force microscope image of Ceramco SlPg.

Table 8. Mean surface roughness and differences for the Ceramco porcelain subjected to different surface treatments.

Surface Treatment

Ra

Difference *

Gl

,1063

a

SIPg

,1037

a

SIZr

,2870

ab

Zr

,2020

ab

Pg

,4180

b

Di

,2523

ab

SISp

,2913

ab

SI

,3497

ab

Sp

1,100

c

* Mean Ra values for groups in non homogeneous subsets are displayed with different letters p= .05

Discussion

The present study used AFM to examine the effect of various polishing techniques on four different conventional porcelain systems. Feldspathic VMK 95 and Mark II porcelain surfaces demonstrated significant lower Ra value than the other two porcelain systems after different polishing systems. The null hypothesis of the study was not accepted. There are several studies that report the effectiveness of porcelain polishing systems. Some authors report that there is no differences between the glaze and the polishing systems while others say that different polishing methods are not able to make a smooth surface as good as glazed [5, 15–24 ].

In the present study easy, useful and effective polishing systems were chosen. Sof-Lex is generally useful for the polishing of composites, and the manufacturer offers to use this system on the polishing of porcelains [16, 25]. NTI, CeraGlaze and Dialite II are two different polishing kits which are cheaper than diamond pastes. They are easy to use intraorally. Sparkle is a diamond paste which is indicated to use on porcelains, composites, gold and other alloys.

Zircate, is a zirconium silicate polishing paste which is indicated for tooth polishing [17, 26]. After periodontal threaphy polishing paste must not give damage to the restorative materials which are in the oral cavity. In this study we intend to observe the effect of zircate on porcelains. Prisma Gloss is an aluminium oxide polishing paste which is often used on composites [18, 27]. It’s also used in this study to observe its effectiveness on porcelains.

Flexural strength is affected by the material’surface roughness. Due to the decrease of the roughness of porcelain specimen surfaces, its flexural strength increases [19, 28 ].

The amount and the size of the abrasive fillers, and the shape of the polishing materials are the crictical issues for selection of the abrasive type for different contents of dental ceramics [18, 23]. It was observed that the surfaces of the ceramics were very rough and varied significantly for different polishing techniques and ceramic types. Vitablocs Mark II, which includes a glass matrix with nearly 30 vol% irregularly-shaped crystalline particles, is a modified feldspathic porcelain which is crystalline reinforced. It was stated by Yin et al [19] that surface finishing of Mark II which consisted of uniform and fine mica crystals was not succesful in decreasing surface roughness values. After mica crystals were cut with sharp Al2O3 abrasive particles, high peaks were left by Sof-lex disc. Leucite content of the dental ceramic seems to play an important role in surface roughness. Leucite porcelain involves fine leucite crystals which diffuse in glass matrix. Hence, when compared with porcelains with higher leucite content, lower leucite content were likely to show lower roughness after they were polished with rubber or disc followed by diamond pastes [18, 29]. In this study, lowest surface roughness was found in Glaze followed by Sof-Lex+Sparkle and Sof-Lex+ Prisma Gloss. However Sparkle polishing paste presented the highest Ra value with a mean of 1.147.

Different methods can be used to assess external roughness. In research on external roughness in dental materials, while qualitative methods such as SEM have been employed, quantitative methods such as surface profile analysis like profilometry and AFM have been employed. SEM has disadvantages in illustrating external topography, images allow only a two-dimensional view. In terms of both micron and nanometre scales, AFM has turned out to be a useful tool in examining material structure [20, 30]. To obtain the three-dimensional view and to evaluate the surface topography of various ceramics at nanometre scale, the surfaces were surveyed using AFM. SEM analysis confirmed the results obtained with profilometer in several studies [5, 15, 18, 22, 24].

In this study, polished ceramic types’ usual three diameter surfaces which were atained by AFM imaging (Figure 1b – 4b) showed a rougher surface for unglazed sample which included higher crystallites with pointed peaks coming out of the surface perpendicularly. In addition, when compared with glazed ceramics, this type was found to have deeper cracks. Glaze seals are known to crack and pore within the ceramic material. Three digital imaging of the glazed sample (Figure 1a) shows that glaze has smoothed the sharp edges. RMS values, Ra values and Z range were shown to be significantly (p < 0.01) higher in the unglazed samples as a result of statistical analysis.

In the study of Kakaboura et al [31], the surface characteristics of resin composites were illustrated through quantitative assessment of two-dimensional and three-dimensional profilometry and qualitative measurements by AFM and SEM. It was concluded that in distinguishing external roughness, AFM method was better when compared with two-dimensional profilometry and when compared with SEM, it defined external texture in more detail. Before this study Sarikaya and Guler [29] were evaluated surface roughness of the same materials subjected to the same polishing methods by profilometry. When we compared the results of the two study it’s obviously seen that AFM apperared to offer a powerful tool to directly evaluate the roughness of porcelain specimens. The differences between the two study may be due to the method of the surface roughness evaluation. In the results of their study it was seen that feldspathic ceramics (Mark II) had lower Ra values when compared with the others. In this study Mark II has lower Ra value (0, 3456) than feldspathic porcelain (VMK95) (0, 3895) but there wasn’t statistically differences between two materials. Also there were significantly differences among the polishing techniques for the Ra values of Mark II porcelain. Why the differences between the results of two study may be the effect of evaluation method of surface roughness measurements (profilometry and AFM).

Some authors have even recommended such polishing techniques as alternatives to glazing [15–24, 29, 32–34] but they concluded that it will be the object of further study. Also further studies are need with different composition of the particles and matrix substance, shape of the particles of abrasive ceramic polishing discs and wheels.

Conclusion

  1. The surface roughness of the glazed ceramic material was lower than of the other polishing treatments.
  2. The crystallites of the unglazed ceramic surfaces has higher and the pores were deeper compared to the glazed samples.
  3. Sof-Lex+Sparkle and Sof-Lex+ Prisma Gloss polishing techniques may be alternatives to glazing.
  4. AFM is a powerfull tool for the evaluation of surface roughness.

Conflicts of Interest: The authors declare that there is no potential conflicts of interest with respect to the authorship or publication of this article.

Funding Statement: This work is supported in part by Ondokuz Mayis University, PYO.DIS.1901.09.003

References

  1. Shillingburg HT, Hobo S, Whitsett LD, Jacobi R, Brackett SE (1997) Fundamentals of Fixed Prosthodontics. (3rdedn). Quintessence Publishing Co, Inc, Canada Pg No: 433–436.
  2. Yilmaz K, Ozkan P (2010) The methods for the generation of smoothness in dental ceramics. Compend Contin Educ Dent 31: 30–32, 34, 36–8 passim. [crossref]
  3. Craig RG, Powers JM, Wataha JC (2004) Properties and Manipulation. (8th edn). Mosby; Dent. Mat, China Pg No: 113.
  4. al-Wahadni A, Martin DM (1998) Glazing and finishing dental porcelain: a literature review. J Can Dent Assoc 64: 580–583. [crossref]
  5. Tholt de Vasconcellos B, Miranda-Júnior WG, Prioli R, Thompson J, Oda M (2006) Surface roughness in ceramics with different finishing techniques using atomic force microscope and profilometer. Oper Dent 31: 442–449. [crossref]
  6. Binnig G, Quate CF, Gerber C (1986) Atomic force microscope. Phys Rev Lett 56: 930–933. [crossref]
  7. Miller JD, Veeramasuneni S, Drelich J, Yalamanchili MR, Yamauchi G (1996) Effect of roughness as determined by atomic force microscopy on the wetting properties of PTFE thin films. Poly Eng Sci 36: 1849–1855.
  8. Botta AC, Duarte S Jr, Paulin Filho PI, Gheno SM (2008) Effect of dental finishing instruments on the surface roughness of composite resins as elucidated by atomic force microscopy. Microsc Microanal 14: 380–386. [crossref]
  9. Casucci A, Osorio E, Osorio R, Monticelli F, Toledano M, et al. (2009) Influence of different surface treatments on surface zirconia frameworks. J Dent 37: 891–897. [crossref]
  10. de Oyagüe RC, Monticelli F, Toledano M, Osorio E, Ferrari M, et al. (2009) Influence of surface treatments and resin cement selection on bonding to densely-sintered zirconium-oxide ceramic. Dent Mater 25: 172–179. [crossref]
  11. Clelland NL, Agarwala V, Knobloch LA, Seghi RR (2001) Wear of enamel opposing low-fusing and conventional ceramic restorative materials. J Prosthodont 10: 8–15. [crossref]
  12. Casucci A, Mazzitelli C, Monticelli F, Toledano M, Osorio R, et al. (2010) Morphological analysis of three zirconium oxide ceramics: Effect of surface treatments. Dent Mater 26: 751–760. [crossref]
  13. Fuzzi M, Zaccheroni Z, Vallania G (1996) Scanning electron microscopy and profilometer evaluation of glazed and polished dental porcelain. Int J Prosthodont 9: 452–458. [crossref]
  14. Martínez-Gomis J, Bizar J, Anglada JM, Samsó J, Peraire M (2003) Comparative evaluation of four finishing systems on one ceramic surface. Int J Prosthodont 16: 74–77. [crossref]
  15. Goldstein GR, Barnhard BR, Penugonda B (1991) Profilometer, SEM, and visual assessment of porcelain polishing methods. J Prosthet Dent 65: 627–634. [crossref]
  16. Wright MD, Masri R, Driscoll CF, Romberg E, Thompson GA, et al. (2004) Comparison of three systems for the polishing of an ultra-low fusing dental porcelain. J Prosthet Dent 92: 486–490. [crossref]
  17. Sarac D, Sarac YS, Yuzbasioglu E, Bal S (2006) The effects of porcelain polishing systems on the color and the surface texture of feldspathic porcelain. J Prosthet Dent 96: 122–128. [crossref]
  18. Sasahara RM, Ribeiro Fda C, Cesar PF, Yoshimura HN (2006) Influence of the finishing technique on surface roughness of dental porcelains of different microstructures. Oper Dent 31: 577–583. [crossref]
  19. Ling Yin, Song XF, Song YL, Huang T, Li J (2006) An overview of in-vitro abrasive finishing & CAD/CAM of bioceramics in restorative dentistry. Int J Machine Tools Manu 46: 1013–1026.
  20. Karan S, Toroglu MS (2008) Porcelain refinishing with two different polishing systems after orthodontic debonding. Angle Orthod 78: 947–953. [crossref]
  21. Flury S, Lussi A, Zimmerli B (2010) Performance of different polishing techniques for direct CAD/CAM ceramic restorations. Oper Dent 35: 470–481. [crossref]
  22. Anmol C, Soni S (2014) Effect of two different finishing systems on surface roughness of feldspathic and flourapatite porcelains in ceramo-metal restorations: Comparative in vitro study. J Int Soc Prevent Communit Dent 4: 22–28. [crossref]
  23. Han GJ, Kim JH, Lee MA, Chae SY, Lee YH, et al. (2014) Performance of a novel polishing rubber wheel in improving surface roughness of feldspathic porcelain. Dent Mater J 33: 739–748. [crossref]
  24. Manjuran NG, Sreelal T (2014) An in-vitro study to identify a ceramic polishing protocol effecting smoothness superior to glazed surface. J Indian Prosthodont Soc 4: 219–227. [crossref]
  25. 3M ESPE Dental Products Instructions for Use (2004) 3M ESPE AG, Germany.
  26. Zircate Material Safety Data Sheet (2003) Dentsply Int. Inc., USA.
  27. Roulet JF, Roulet-Mehrens TK (1982) The surface roughness of restorative materials and dental tissues after polishing with prophylaxis and polishing pastes. J Periodontol 53: 257–266. [crossref]
  28. Terry DA, Geller W, Tric O, Anderson MJ, Tourville M, et al. (2002) Anatomical form defines color: Function, form and aesthetics. Pract Proced Aesthet Dent 14: 59–67. [crossref]
  29. Sarikaya I, Güler AU (2010) Effects of different polishing techniques on the surface roughness of dental porcelains. J Appl Oral Sci 18: 10–16. [crossref]
  30. Jagger DC, Harrison A (1994) An in vitro investigation into the wear effects of unglazed, glazed, and polished porcelain on human enamel. J Prosthet Dent 72: 320–323. [crossref]
  31. Kakaboura A, Fragouli M, Rahiotis C, Silikas N (2007) Evaluation of surface characteristics of dental composites using profilometry, scanning electron, atomic force microscopy and gloss-meter. J Mater Sci Mater Med 18: 155–163. [crossref]
  32. Camacho GB, Vinha D, Panzeri H, Nonaka T, Gonçalves M (2006) Surface roughness of a dental ceramic after polishing with different vehicles and diamond pastes. Braz Dent J 17: 191–194. [crossref]
  33. Yuzugullu B, Celik C, Erkut S, Ozcelik TB (2009)The effects of extraoral porcelain polishing sequences on surface roughness and color of feldspathic porcelain. Int J Prosthodont 22: 472–475. [crossref]
  34. Mehulić K, Svetlicić V, Segota S, Vojvodić D, Kovacić I, et al. (2010) A study of the surface topography and roughness of glazed and unglazed feldspathic ceramics. Coll Antropol 34: 235–238. [crossref]

Gender Dentistry A Systematic Review of Literature on Caries And Periodontitis

DOI: 10.31038/JDMR.2018123

Abstract

Already in the 1980s, the World Health Organization (WHO) has postulated to analyze in all medical fields differences between the sexes. But until now there is a disturbing lack of scientifically based and meaningful data over the whole area of gender dentistry – for prevention as well as for treatment. The aim of this study was to evaluate the actual situation described as an IS-analysis of literature review on the topic of gender dentistry with the sub-themes periodontal disease and tooth decay in the leading medical databases (Medline, Embase, BIOSIS Previews, Your Journals@Ovid, The Cochrane Library). We discuss these on the basis of an evidence-based guideline. For periodontal diseases we found no clear trend. Some studies showed no gender difference, others showed a higher prevalence for women or a higher prevalence for men. At the juvenile periodontitis and the occurring bacteria of periodontitis there were conflicting results as well. No simple statement can be made with respect to tooth decay, too. Respective studies merely show age as an important item. Totally it has to be noted that the scientific validity of some studies is not without any doubt as they are conducted with a too low number of clinical trials. Several studies are more than 15 years old, therefor providing a serious gender specific treatment in dentistry, future studies must increasingly incorporate and intensively discuss gender specific aspects.

Keywords

Caries, Dentistry, Gender, Men, Periodontitis, Women

Introduction

Already in the 1980s the World Health Organization (WHO) has postulated to analyze differences between sexes in all areas of medicine [1]. In the Vienna Declaration on investment in health of the WHO in 1992 was strongly admonished: “Maximum attention and urgency must be given to women’s health” [2]. Ten years later, in 2002, the WHO gender policy was written. The main objective of this policy is to enable a better health for women and men through modern health research, contributing programs and policies and to give due attention to the gender aspect [3]. And in the action plan 2000, “Gender Mainstreaming was mandatory prescribed in the medicine for all EU countries and decided in consequence” by the Austrian Federal Government as Univ.‐Prof. Dr. Margarethe Hochleitner [4]. The term “Gender Mainstrea-ming” was discussed for the first time in Nairobi already in 1985 on the 3rd UN World Conference of women and ten years later in 1995 the term has been further developed on the 4th UN World Conference of Women [5]. “Gender Mainstreaming” implies according to the BMFSFJ (German Federal Ministry for Family, Senior Citizens, Women and Youth): „… to take into account from the outset and periodically the different life situations and interests of women and men at all social projects, since there is no gender-neutral reality” (Bundesministerium für Familie, Senioren, Frauen und Jugend (Federal Ministry for Family Affairs, Senior Citizens, Women and Youth) 2012). And in the Basic Law was even expressly postulated: “To the actual enforcement of the equality between women and men the Government is expressly obliged by article 3, paragraph 2, sentence 2 Basic Law, it is an integral part of the political action of the Federal Government in all policy areas” [6]. The importance of a differentiated analysis with respect to gender-specific aspects is therefore obvious. Gender-specific considerations are nowadays no longer indispensable from dentistry. However the level of knowledge on this subject is until now surprisingly low. There is a disturbing lack of scientifically founded and reliable data in gender dentistry. “So far only little attention was paid to this topic in the German-speaking world, unlike in other countries. While gender research has found long ago entrance into scientific projects and teaching in medicine, the gender-specific dental, oral and maxillofacial surgery moves only slowly in the awareness of researchers and the practitioners, ladies and gentlemen. This topic is interesting and up to date, because just in dentistry in addition to biological differences, gender plays an important role“, so Priv.-Doz. Dr. Christiane Gleissner, 2011 [7]. To ensure a better dental care for male and female patients in the future, the present study delivers a systematic literature review on the topic of “Gender Dentistry”. The aim of this work is to offer a guideline-oriented, quality-based literature review, based on disease patterns, relevant for “Gender Dentistry”. Additionally all relevant studies have been analyzed, whether they meet the criteria and requirements of the WHO-Guidelines.

Material and Methodology

In the following we describe the preparation, the implementation of the literature review, the selected medicine database and search items as well as the handling of the results. The methodical approach is based on a guideline creation according to recommendation Rec(2001)13 of the Council of Europe (47 European States comprehending European international organizations), the AWMF (Work Community Association of scientific medical companies) [8] and the ZZQ Berlin (Center for dental quality) [9]. The main literature database was chosen to identify the current state of research regarding “gender” dentistry for evidence-based results. The selection was done on five databases: Embase, Your Journals@Ovid, The Cochrane Library, Medline, BIOSIS Previews. Access to these databases was given by the network of the University of Ulm. The search was as follows: for each clinical picture a search item has been set:

  • Periodontitis: gender periodontitis
  • caries susceptibility: gender caries

Then the specified keyword was given into the database and search started. The number of results was recorded. To narrow this large amount of results step by step, the ability of the program was used to divide the results by relevance. High relevance: 5 stars, low till no relevance: 4 till 0 stars. Then the option “five stars only” was made to observe only items with the highest relevance. The amount of search results, which now appeared, was also recorded. Depending on the number of results, the year of publication was still restricted. This and the new amount of search results were also recorded. Then the search results were read and the relevant publications were saved on RefWorks, a reference management software. The corresponding references, which are identified as possible matches, were downloaded as full text or ordered via interlibrary loan to check their contents in detail. The received information was translated, summarized and explained under results. Sequence and classification in reference 1, 2, are ordered alphabetically by the author’s name. So there is no ranking. To ensure the relevance of the results of the literature review, a further update was carried out in September 2013. Here, all five medicine databases were searched again in the period August 2012 – September 2013, as described above. The newly found references were saved and added to the already existing and edited.

Periodontitis

Keyword: gender periodontitis (Table 1)

Table 1:

Table 1. Gender Periodontitis. Results of the literature review in the five databases BIOSIS Previews, The Cochrane Library, Embase, Your Journals@Ovid und Medline from August 2012 and September 2013 and the total amount of stored references

Results, references = articles

Medical database

Basic Search

Restriction to five stars

Stored references August 2012

Stored references September 2013

Total references

BIOSIS Previews

8 491 results

335 results

16 references

1 result

17 references

The Cochrane Library

5 496 results

26 results

1 references

0 results

1 reference

Embase

10 882 results

824 results
(Restriction 2000 – today):

611 results

14 references

6 results

20 references

Your Journals @Ovid

16 955 results

17 results

2 references

0 results

2 references

Medline

10 164 results

673 results
(Restriction 2000 – today): 357 results

7 references

6 results

13 references

Caries

Keyword: gender caries (Table 2)

Table 2. Gender caries. Results of the literature review in the five databases BIOSIS Previews, The Cochrane Library, Embase, Your Journals@Ovid und Medline from August 2012 and September 2013 and the total amount of stored references

Results, references = articles

Medical database

Basic Search

Restriction to five stars

Stored references August 2012

Stored references September 2013

Total references

BIOSIS Previews

9001 results

541 results
(Restriction 2000 – today): 227 results

14 references

4 results

18 references

The Cochrane Library

5513 results

73 results

4 references

0 results

4 references

Embase

16 371 results

1179 results
(Restriction 2000– today):
773 results

6 references

3 results

14 references

Your Journals @Ovid

17 004 results

14 results

0 references

0 results

0 references

Medline

16 716 results

1125 results
(Restriction 2000 –  today);
500 results

4 references

11 results

15 references

Results

Periodontitis (Table 3, 4 & Figure 1)

Table 3. Results of the literature review on the topic of periodontitis. The total identified studies and the ultimately evaluated.

Amount of articles total

53

Amount of evaluated articles

21

Table 4. Results for the articles about periodontal diseases, which appeared before and right/after the year 2000, as well as a subject number higher or equal or lower 500 subjects or any information on the number of the person being tested.

Year of publication before 2000

5

Year of publication after/right 2000

16

Number of subjects higher/equal than 500

4

Number of subjects lower than 500

7

No information about the number of subjects

10

JDMR-18-108 -Jana Schwarz_Germany_F1

Figure 1. Gender Periodontitis. Gender-specific distribution of the edited articles about periodontal disease.

Caries

(Table 5, 6 & Figure 2)

Table 5. Results of the literature review on the topic of caries. The total identified studies and the ultimately evaluated.

Amount of articles total

51

Amount of evaluated articles

29

Table 6. Results for the articles about caries, which appeared before and right/after the year 2000, as well as a subject number higher or equal or lower 500 subjects or any information on the number of the person being tested.

Year of publication before 2000

4

Year of publication after/right 2000

25

Number of subjects higher/equal than 500

14

Number of subjects lower than 500

9

No information about the number of subjects

5

JDMR-18-108 -Jana Schwarz_Germany_F2

Figure 2. Gender Caries. Gender distribution of the edited articles about caries.

Discussion

Methodology

The current state of research in gender dentistry was collected with the help of a literature review, based on the creation of evidence-based guidelines. These guidelines summarize current knowledge, expert opinions and results of various working groups. Known and respected medical database were analyzed within the period of 10th – 20th of August 2012, and with another search from 12th -14th of September 2013.

Discussion related to the analyzed diseases

We have to notice that no clear result could be found and no simple conclusion for practice and teaching can be drawn. There are still too few studies, which offer enough reliability on gender-specific aspects. Some papers offer inconsistent results lacking of possible general evaluations. Further research seems to be indicated.

Periodontitis

The available results of our investigation of the present studies on periodontal disease are not satisfying. There are eleven studies that have proven that men suffer more frequently from periodontitis than women [10–20] However, there are five studies showing no gender aspect at all [21–24].

There are four further studies that show that women would more often suffer from periodontal diseases than men [13, 23, 25–27] The latest studies show a higher incidence for men. Aggressive periodontitis is more common in women and chronic periodontal disease occurs more often in men [13]. The loss of attachment points towards men [12]. One study indicates juvenile periodontitis more often in women [25], but a different study suggests that the distribution of men and women is equal [21]. Furthermore there shown, that there were differences between men and women related to periodontal disease bacteria [16], another study, however, show no difference [26]. The majority of results indicates a higher incidence in men regarding periodontal disease.

When evaluating the aspect of periodontal disease, many other factors, such as age and hormone levels of women do play an important role, because the periodontal disease is known to be a multifactorial disease. All factors should be detected and examined. These aspects should be included in further studies, observed, presented and evaluated in order to get scientific based information, providing additional value for dental treatment. The evaluated studies are lacking to draw conclusions due to limited numbers of subjects and mixed timelines.

Caries

The examination of the studies on caries does not give a uniform result. There are six studies which show no gender-specific differences [28–33]. In contrary studies have proven that women have a greater rate of caries than men [33, 34–43].

The following studies however showed higher rates of tooth decay in men. Only one of these studies was performed in adults [44]. The other five studies have been conducted on children [37, 38, 45–51]. Therefore, there seems to be a tendency for higher caries rates in women. However, depending on the age of the subjects. There are studies demonstrating that boys have higher levels of tooth decay, but the tendency is expanding in adulthood towards women [37, 38].

Studies that examine a multicausal illness such as caries must include all ages and have to be divided into gender, age, eating habits, socioeconomic background, etc. to obtain useful information. Especially in countries with huge emphasis on prophylaxis and caries prevention, e.g. Germany, this study design is essential. On the subject of dental caries the actuality of the studies is satisfactory, the number of clinical trials however mediocre.

The authors declare that they have no competing interests.

References

  1. Kautzky-Willer A, Tschachler E (2012) Gesundheit: Eine Frage des Geschlechts. Orac/Verlag Kremayr & Scheriau KG, Wien.
  2. WHO (1992) (06.12.13) http://www.euro.who.int/__data/assets/pdf_file/0019/ 114238/E93952G.pdf.
  3. WHO (2002) (06.12.13): http://www.who.int/gender/documents/engpolicy.pdf,
  4. Hochleitner Margarethe (2013) (6.12.13) http://fgz.imed.ac.at/kongresse/pdf_kongr/saalfelden2013.pdf.
  5. Meuser Michael, Neusüß Claudia, (2002) Gender Mainstreaming – eine Einführung. In: dies. (Hrsg.): Gender Mainstreaming. Konzepte – Handlungsfelder – Instrumente. Bundeszentrale für politische Bildung S9–22.
  6. BMFSFJ 2012 (06.12.13): http://www.bmfsfj.de/BMFSFJ/gleichstellung,did= 192702.html.
  7. Gleissner Christiane (07.12.13) http://gendermed.info/Gerade-in-der-Zahnmedizin-spielt-der.79.0.2.html.
  8. AWMF (26.10.13) http://www.awmf.org/.
  9. ZZQ (23.08.2013) http://www.zzq-berlin.de/leit.htm.
  10. Bain JL, Lester SR, Henry WD, Bishop CM, Turnage AA, et al. (2009) Comparative gender differences in local and systemic concentrations of pro-inflammatory cytokines in rats with experimental periodontitis. J Periodont Res 44: 133–140.
  11. Desvarieux M, Schwahn C, Volzke H, Demmer RT, Ludemann J, et al. (2004) Gender Differences in the Relationship Between Periodontal Disease, Tooth Loss, and Atherosclerosis. Stroke 35: 2029–2035.
  12. Persson GR, Persson RE, Hollender LG, Kiyak HA (2004) The impact of ethnicity, gender, and marital status on periodontal and systemic health of older subjects in the trials to enhance elders‘ teeth and oral health (teeth). J Periodontol 75: 817–823.
  13. Reichert S, Stein J, Gautsch A, Schaller H, Machulla HKG (2002) Gender differences in HLA phenotype frequencies found in German patients with generalized aggressive periodontitis and chronic periodontitis. Oral Microbiology & Immunology 17: 360–368.
  14. Shiau HJ, Reynolds MA (2010) Sex differences in destructive periodontal disease: a systematic review. J Periodontol 81: 1379–1389. [crossref]
  15. Candore G, Balistreri CR, Colonna-Romano G, Lio D, Listi F, et al. (2010) Gender-related immune-inflammatory factors, age-related diseases, and longevity. Rejuvenation Research 2010: 13.
  16. Renk CM, Wilson J (2005) Comparison of age and gender differences in the prevalence of oral pathogens in subjects with periodontitis.
  17. Wasterlain SN (2012) Sex differences in periodontal disease and caries in a Portuguese identified skeletal sample from the late nineteenth and early twentieth centuries. Am J Phys Anthropol 147: 297–298.
  18. Borell LN, Talih M (2012) Examining periodontal disease disparities among U.S. adults 20 years of age and older: NHANES III (1988–1994) and NHANES 1999–2004. Public Health Rep 127: 497–506.
  19. Buchwald S, Kocher T, Biffar R, Harb A, Holtfreter B, et al. (2013) Tooth loss and periodontitis by socio-economic status and inflammation in a longitudinal population-based study. J Clin Periodontol 40: 203–211.
  20. Rivas-Tumanyan S, Campos M, Zevallos JC, Joshipura KJ (2013) Periodontal disease, hypertension, and blood pressure among older adults in puerto rico. J Periodontol 84: 203–211.
  21. Hart TC, Marazita ML, Lake KS, Diehl SR, Schenkein HA (1991) Sex Ratio among Individuals with Juvenile Periodontitis Jp S: 555.
  22. Sewón LA, Parvinen TH, Sinisalo TV, Larmas MA, Alanen PJ (1988) Dental status of adults with and without periodontitis. J Periodontol 59: 595–598. [crossref]
  23. Melvin WL, Sandifer JB, Gray JL (1991) The prevalence and sex ratio of juvenile periodontitis in a young racially mixed population. J Periodontol 62: 330–334.
  24. Haisman-Welsh RJ, Thomson WM (2012) Changes in periodontitis prevalence over two decades in New Zealand: evidence from the 1988 and 2009 national surveys. N Z Dent J 108: 134–138. [crossref]
  25. Hørmand J, Frandsen A (1979) Juvenile periodontitis. Localization of bone loss in relation to age, sex, and teeth. J Clin Periodontol 6: 407–416. [crossref]
  26. Slots J, Feik D, Rams TE (1990) Age and sex relationships of superinfecting microorganisms in periodontitis patients. Oral Microbiology & Immunology 5: 305–308.
  27. Mattson JS, Cerutis DR, Parrish LC (2002) Osteoporosis: a review and its dental implications. Compendium of continuing education in dentistry (Jamesburg, N.J.: 1995) 23: 1001–1004.
  28. Zerfowski M, Koch MJ, Niekusch U, Staehle HJ (1997) Caries prevalence and treatment needs of 7- to 10-year-old schoolchildren in southwestern Germany. Community Dentistry & Oral Epidemiology 25: 348–351.
  29. Lundegren N1, Axtelius B, Akerman S (2012) Oral health in the adult population of Skåne, Sweden: a clinical study. Acta Odontol Scand 70: 511–519. [crossref]
  30. Wang X, Willing M C, Marazita M L, Wendell S, Warren J J, Broffitt B, et al. Genetic and Environmental Factors Associated with Dental Caries in Children: The Iowa Fluoride Study. Caries Res.2012; 46: 177–184.
  31. Fisher E, Divaris K, Shugars D, White R (2012) Risk factors for third molar occlusal caries: A longitudinal clinical investigation. Journal of Oral and Maxillofacial Surgery.Conference: 94th Annual Meeting Scientific Sessions and Exhibition of the American Association of Oral and Maxillofacial Surgeons, AAOMS 2012 San Diego, CA United States.Conference Start: 20120910 Confer(truncated).,70: e-38.
  32. Dawkins E, Michimi A, Ellis-Griffith G, Peterson T, Carter D, et al. (2013) Dental caries among children visiting a mobile dental clinic in South Central Kentucky: a pooled cross-sectional study. BMC Oral Health 13: 19.
  33. Wang JD, Chen X, Frencken J, Du MQ, Chen Z (2012) Dental caries and first permanent molar pit and fissure morphology in 7- to 8-year-old children in Wuhan, China. International Journal of Oral Science 4: 157–160.
  34. Arantes R, Santos RV, Frazao P, Coimbra CE Jr (2009) Caries, gender and socio-economic change in the Xavante Indians from Central Brazil. Ann Hum Biol 36: 162–175. [crossref]
  35. Haugejorden O (1996) Using the DMF gender difference to assess the „major“ role of fluoride toothpastes in the caries decline in industrialized countries: A meta-analysis. Community Dentistry & Oral Epidemiology 24: 369–375.
  36. Heyduck C, Meller C, Schwahn C, Splieth CH (2006) Effectiveness of sealants in adolescents with high and low caries experience. Caries Res 40: 375–381. [crossref]
  37. Lukacs JR (2011) Gender differences in oral health in South Asia: Metadata imply multifactorial biological and cultural causes. Am J Hum Biol 23: 398–411.
  38. Lukacs JR (2012) Meta-analyses reveal direction and timing of sex and gender differences in oral health. American Journal of Physical Anthropology.Conference: 81st Annual Meeting of the American Association of Physical Anthropologists Portland, OR United States.Conference Start: 20120411 Conference End: 20120414.Conference Publication: (var.pagings). 2012; 147: 197.
  39. Lukacs JR (2010) Sex differences in dental caries experience: clinical evidence and complex etiology. Clinical Oral Investig 15: 649–656.
  40. Mantonanaki M, Koletsi-Kounari H, Mamai-Homata E, Papaioannou W (2013) Prevalence of dental caries in 5-year-old Greek children and the use of dental services: evaluation of socioeconomic, behavioural factors and living conditions. Int Dent J 63: 72–79.
  41. Pechenkina E, Fan W, Ma X (2012) Male-female oral health differences in early Chinese communities. Am J Phys Anthropol 147: 235.
  42. Pereira C, Veiga N, Chaves C, Nelas P, Amaral O, et al. (2013) Dental caries and oral health behaviours in a portuguese sample of adolescents. Am J Epidemiol 177: 37.
  43. Lee HY, Choi YH, Park HW, Lee SG (2012) Changing patterns in the association between regional socio-economic context and dental caries experience according to gender and age: a multilevel study in Korean adults. International Journal of Health Geographics [Electronic Resource] 11: 30.
  44. Unell L, Soderfeldt B, Halling A, Birkhed D (1999) Explanatory models for clinically determined and symptom-reported caries indicators in an adult population. Acta Odontol Scand 57: 132–138.
  45. Witt-Pawlowski K (2002) [Oral care indices (API, SBI) in young participants of a caries prophylaxis program.]. Roczniki Pomorskiej Akademii Medycznej w Szczecinie 48: 381–393.
  46. Wyne AH, Al-Ghannam NA, Al-Shammery AR, Khan NB (2002) Caries prevalence, severity and pattern in pre-school children. Saudi Me.J 23: 580–584.
  47. Ferracane J, Hilton T, Korpak A, Gillette J, McIntyre PS, et al, (2011) Northwest P R E C E D E N T. Use of caries prevention services in the Northwest PRECEDENT dental network. Community Dent Oral Epidemiol 39: 69–78.
  48. Masood M, Yusof N, Hassan MI, Jaafar N (2012) Assessment of dental caries predictors in 6-year-old school children – results from 5-year retrospective cohort study. BMC Public Health 12: 989.
  49. Matulaitiene ZK, Zemaitiene M, Zemgulyte S, Milciuviene S (2012) Changes in dental caries and oral hygiene among 7–8 year-old schoolchildren in different regions of Lithuania 1983–2009. Stomatologija / issued by public institution “Odontologijos studija” …[et al.] 14: 53–59.
  50. Khare V, Koshy A, Rani P, Srilatha S, Kapse SC, et al. (2012) Prevalence of dental caries and treatment needs among the orphan children and adolescents of Udaipur district, Rajasthan, India. Journal of Contemporary Dental Practice [Electronic Resource] 13: 182–187.
  51. Stephenson J (2012) A model for the analysis of caries occurrence in primary molar tooth surfaces. Caries Res 46: 452–459. [crossref]

Prevalence of Nonreactive Non-Stress Test in Low Versus High Risk Pregnancy

DOI: 10.31038/IGOJ.2019211

Abstract

Objective: To determine the prevalence of nonreactive nonstress test (NST) in low risk and high risk pregnant women.

Materials and Methods: This prospective cohort study enrolled pregnant women with gestational age of 32 weeks or more who had been offered NST by their obstetricians at the antenatal clinic, King Chulalongkorn Memorial Hospital. High risk group were defined as having any maternal, fetal or placental risk factors. The NST result was interpreted by at least two obstetricians. All participants were followed until delivery and perinatal outcomes were recorded.

Results: A total number of 1,168 participants with 1,261 NST tests were included. 782 tests (62%) were offered to low risk and 479 tests (38%) to high risk group. Decrease in weight and maternal diabetes mellitus was the most common indication for low risk and high risk group, respectively. Overall prevalence of nonreactive NST was 0.32% (0.38% in low risk and 0.21% in high risk group). Only one newborn with non-reactive NST in high risk group was admitted in the NICU due to meconium aspiration syndrome. However, there was no significant association between nonreactive NST and obstetric risks or adverse perinatal outcomes.

Conclusion: The prevalence of nonreactive NST in this study was only 0.32%. NST is not routinely recommended in low risk pregnant women due to no association between non-reactive NST and perinatal morbidity.

Keywords

Antepartum Fetal Monitoring, Nonstress test, Pregnancy

Introduction

Various non-invasive antepartum fetal surveillance techniques are available including fetal movement assessment, non-stress test (NST), biophysical profile (BPP), contraction stress test (CST), and maternal uterine artery and fetal umbilical artery Doppler velocimetry [1,2]. The aim of antepartum fetal surveillance is to confirm the well-being of the fetus and detect early neonatal injury [3]. NST is currently and widely used in antenatal clinics as a continuous measurement of fetal heart rate (FHR) because it is simple and does not harm pregnant women or their fetuses.

Early detection in the abnormal change of FHR is useful to prevent neonatal injury [4]. NST aims to confirm whether the brain of the fetus is sufficiently oxygenated. [2] Non-reactive NST is significantly associated with fetal distress and low Apgar scores [5]. Testing is recommended for pregnant women who are at risk of fetal hypoxic injury or fetal death. Indications for NST can be divided into three groups as follows: (1) Maternal indications such as diabetes, hypertension, cardiovascular diseases, anemia, kidney disease; (2) Fetal indications such as decrease fetal movement, abnormal fetal growth, post-term pregnancy, abnormal amniotic fluid; and (3) Placental indications such as abnormal placentation, chronic abruption [6].

Due to the uncomplicated nature of the test, obstetricians in general practice often perform NST to pregnant women with minimal obstetric risks such as mothers with poor weight gain, decreased/static weight, or passed date [7]. No clear evidence exists to support the benefit of NST in this group. Even though NST is not an invasive testing method, it is not free of charge and the patient is required to spend at least 20 minutes in the examination room. Moreover, NST results can influence the decisions of the obstetricians. Based on a previous study, non-reactive NST results increased the incidence of labor induction by 90% and doubled the rate of cesarean delivery [8]; therefore, patients may be subjected to unnecessary obstetrics procedures.This study was conducted to determine the prevalence of non-reactive NST for each indication and also identify the necessity for the test in low risk group. We anticipate that this knowledge will be useful in making decisions whether to offer NST to pregnant women.

Materials and Methods

This prospective observational study was conducted at the antenatal clinic, King Chulalongkorn Memorial Hospital. Pregnant women with gestation age of 32 weeks or more who had been offered NST by their obstetricians were invited to participate. We excluded pregnancies with antepartum diagnosed fetal congenital anomalies and those who have had multiple pregnancies. After the participants gave their informed consent, the participants were interviewed. This study was approved by the Institutional Review Board, Faculty of Medicine, Chulalongkorn University (IRB351/55). The high risk group was defined as participants at risk for fetal hypoxia or fetal death according to the antepartum surveillance bulletin of the American College of Obstetricians and Gynaecologists as described previously [6]. While the low risk group was defined as participants who did not show any maternal, fetal or placental risks. Demographic data and indications of NST were recorded in well-designed individual case records.

NST examination requires at least 20 minutes. Participants were placed in a supine position and a fetal heart rate monitor was attached to an abdominal belt. The participants were asked to record any fetal movements by clicking a button. In cases where there was suspicion that the baby was asleep, vibroacoustic stimulation was performed. Results were interpreted by at least two obstetricians. Results are classified as reactive or non-reactive. Reactive NST is diagnosed if there are at least two times of FHR acceleration in 20 minutes, with each acceleration 15 beats per minute (bpm) or more above baseline and lasting for at least 15 seconds. The baseline FHR should be between 110–160 bpm with moderate variability of 6–25 bpm. If the FHR is elevated less than 15 bmp within a 20–40 minute period, the interpretation is non-reactive. [9] Two obstetricians were required to agree with the interpretation of each result. If their analyses differed, a third obstetrician was consulted. If the final results showed a non-reactive then further investigations including biophysical profile, CST or ultrasonography were immediately performed. If the participants were offered NST more than once, the worst pattern was analyzed and included in the research results. All participants were monitored until delivery, with data and perinatal outcome collected and recorded in detail. Participants who did not deliver their babies at the King Chulalongkorn Memorial Hospital or lost their medical data were excluded from the study. Statistical analysis was performed using the Statistical Package for the Social Sciences (SPSS) for Windows, version 22. Descriptive data were analyzed using frequency and percentage, while significant associations between the categorical data were assessed by Fisher’s exact test or Chi-square test. When the p-value was < 0.05, this was considered statistically significant.

Results

A total of 1,536 pregnant women were offered NST. After obtaining informed consent, 1,297 women participated in this study. A total of 129 were not included because their medical records after follow-up was incomplete or unavailable. The remaining participants in final analysis were 1,168 participants. Mean age was 29.7 ± 6.3 years with mean gestational age on the testing day was 36.6 ± 3.0 weeks. Basic clinical characteristics of the participants are shown in (Table 1).

Table 1. Demographic data.

Demographic data

Number of cases
(N= 1,168)

Mean age, years (SD)

29.7 (6.3)

Mean gestational age on the testing day, weeks (SD)

36.6 (3.0)

Primigravida

573 (49.1%)

Mean BMI, kg/m2 (SD)

22.8 (4.8)

Concomitant medical diseases

412 (35.3%)

History of previous surgery

278 (23.8%)

Smoking

12 (1.0%)

Illicit drug use

4 (0.3%)

Alcohol consumption

16 (1.4%)

Ninety-three participants were offered NST twice; therefore, a total of 1,261 tests were analyzed in our study. A total of 782 NSTs were offered to low risk participants and 479 tests were offered to high risk pregnant women. For women in the low risk group, decrease in weight was the most common reason for requesting NST (275 cases). Maternal indications, especially diabetes mellitus were the most common indication for high risk participants (Table 2).

Table 2. Indications for NST.

Indications

Number
(Total number = 1,261)

Low risk group

   Static weight gain

   Decrease in weight

   Poor weight gain

   Passed date (GA 40+1–41+6 weeks)

   Other

782 (62.0%)

193 (15.3%)

275 (21.8%)

84 (6.7%)

98 (7.8%)

132 (10.5%)

High risk group

   Maternal indications

   Fetal indications

   Placental indications

   Maternal and fetal indications

479 (38.0%)

346 (27.4%)

119 (9.4%)

8 (0.6%)

6 (0.5%)

Obstetrics and perinatal outcomes were shown in (Table 3). Mean gestational age at delivery was 38.7 ± 1.3 weeks. The rate of spontaneous vaginal delivery was 53.5% and cesarean delivery rate was 43.5%. Neonatal morbidity occurred in 11.9% of infants with 5.7% of them required admission. Four participants had non-reactive NST with overall prevalence at 0.32%; three out of 782 (0.38%) from the low risk group and one out of 479 (0.21%) from the high risk group had non-reactive NST. Only one new born with non-reactive NST in high risk group was admitted in the Neonatal Intensive Care Unit (NICU) for 5 days due to meconium aspiration syndrome. This newborn had complete recovery and discharged with mother. The other three non-reactive NST in low risk group, intrauterine resuscitation was given, and repeated tests became reactive. These three newborns had no perinatal morbidity (Table 4). Fisher’s exact test showed there was no association between NST result and pregnancy risk (P = 1.00). There were no associations between NST results and adverse perinatal outcomes such as Apgar scores, neonatal morbidity, NICU admission, perinatal ventilator requirement and fetal anomalies (Table 5).

Table 3. Obstetrics and perinatal outcomes.

Delivery data

Number of delivery (N=1,168)

Mean gestational age at delivery, weeks (SD)

38.7 (1.3)

Mean birth weight, grams (SD)

3,142.5 (455.5)

Delivery route

 Spontaneous vaginal delivery

 Cesarean delivery

 Forceps extraction

 Vacuum extraction

625 (53.5%)

507 (43.5%)

30 (2.6%)

6 (0.5%)

Sex of fetus

 Male

 Female

621 (53.2%)

547 (46.8%)

Fetal anomalies

 No

 Yes

1,127 (96.5%)

41 (3.5%)

Neonatal morbidity

 No

 Yes

1,029 (88.1%)

139 (11.9%)

NICU admission

 No

 Yes

1,120 (94.3%)

66 (5.7%)

Ventilator required

 No

 Yes

1,149 (98.4%)

19 (1.6%)

Table 4. Clinical characteristics of non-reactive NST cases.

Gravida

G4P1

G1P0

G2P1

G1P0

GA at testing day (weeks)

39

37

40

39

Indication for NST

Gestation diabetes

(High risk)

Decrease in weight

(Low risk )

Decrease in weight

(Low risk)

 Unspecified

(Low risk)

Delivery route

Emergency cesarean section

Cesarean section due to breech presentation

Vaginal delivery

Cesarean section due to CPD

Neonatal outcomes

Male fetus 3,325 grams

Male fetus 2,935 grams

Male fetus

2,800 grams

Male fetus

3,220 grams

APGAR scores

at 1 and 5 mins

9,9

9,10

9,10

9,10

Perinatal morbidity

Maconium aspiration syndrome

5 days of NICU admission

No

No

No

GA = Gestational age

Table 5. Association between NST results and perinatal outcomes including Apgar score, neonatal morbidity, NICU admission, perinatal ventilator requirement and fetal anomalies.

NST

P value

Perinatal outcomes

Reactive

Non-reactive

Apgar score at 1 min*

<7

25

0

1.00

7–10

1,138

4

Apgar score at 5 min*

<7

3

0

1.00

7–10

1,160

4

Neonatal morbidity

Yes

138

1

0.40

No

1,026

3

NICU admission

Yes

65

1

0.21

No

1,099

3

Perinatal ventilator need

Yes

19

0

1.00

No

1,145

4

Fetal anomalies

Yes

41

0

1.00

No

1,123

4

* one missing data

Discussion

This study showed the rate of non-reactive NSTs was low only 0.32%. Most NSTs (62.5%) were conducted in low risk participants. Prevalence of non-reactive testing was 0.38% and 0.21% in the low and high risk pregnant women, respectively. Overall prevalence of non-reactive NSTs in our study was very low compared to previous studies. Rayburn et al. conducted a prospective study of 315 pregnancies and determined 12% of NSTs had non-reactive patterns [10], while Abitbol et al. reported 10.9% of patients had non-reactive NSTs [11]. The results from these two studies were different compared to our study. These 2 studies were conducted before 1990, most patients had risk factors and different terminologies of abnormal NST result might be plausible explanation. The use of vibroacoustic stimulators in these two previous studies might be another possibility. There is clear evidence that vibroacoustic stimulation can reduce testing time but can contribute to higher rates of false non-reactive results [12].

Data from our study confirmed that offering NST to low risk pregnant women was pointless, waste of time and resources. Although, NST is simple and widespread use, there is poor evidence that it can reduce perinatal morbidity or mortality. One major drawback is high frequency of false positive rates. Pregnant women usually placed on supine position during the test. Compression of abdominal aorta results in reduction of uterine blood flow and associated with fetal heart rate change. [11] Repeated test in lateral decubitus position usually returns into normal results. Our study confirmed that non-reactive NST in low risk participants did not associated with perinatal morbidity. However, it may not conclude in high risk participants due to very low percentage of non-reactive results. Only 1 patients with maternal risk factors (gestational diabetes) showed non-reactive NST and meconium aspiration syndrome was diagnosed in this newborn. Despite low specificity to predict perinatal morbidity, antepartum NST is still recommended to use only in pregnant women with risk factors for adverse perinatal outcome [13].

To the best of our knowledge, this is the first and large study that looked at the results of NST in low risk pregnant women. The results indicated that NST is unnecessary for low risk pregnant women. However, there were some limitations in our study. Firstly, the prevalence of non-reactive NST was very low in both low and high risk pregnant women. As this result, it may not have enough power to significantly confirm our findings. Secondly, about 10% of the pregnant women who were lost to follow-up were excluded from the final analysis.

Conclusions

Overall, non-reactive NST was 0.32% (0.38% in low risk and 0.21% in high risk groups). NST is unnecessary for low risk pregnant women. There was no association between NST results and adverse perinatal outcomes including Apgar score, neonatal morbidity, NICU admission, perinatal ventilator requirements and fetal anomalies.

Declaration of interests: The authors declared no conflicts of interest.

Acknowledgement: This study was supported by Ratchadapiseksompoch Fund (RA55/69), Faculty of Medicine, Chulalongkorn University, Bangkok, Thailand.

References

  1. Williams KP, Farquharson DF, Bebbington M, Dansereau J, Galerneau F, et al (2003) Screening for fetal well-being in a high-risk pregnant population comparing the nonstress test with umbilical artery Doppler velocimetry: a randomized controlled clinical trial. Am J Obstet Gynecol 188: 1366–1371.
  2. Liston R, Sawchuck D, Young D (2018) No. 197a-Fetal Health Surveillance: Antepartum Consensus Guideline. J Obstet Gynaecol Can 40: 251–271.
  3. Esin S (2014) Factors that increase reactivity during fetal nonstress testing. Curr Opin Obstet Gynecol 26: 61–66.
  4. Gobillot S, Fontecave-Jallon J, Equy V, Rivet B, Gumery PY, et al. (2018) Non-invasive fetal monitoring using electrocardiography and phonocardiography: A preliminary study. J Gynecol Obstet Hum Reprod 47: 455–459. [crossref]
  5. Flynn AM, Kelly J (1977) Evaluation of fetal wellbeing by antepartum fetal heart monitoring. Br Med J 1: 936–939. [crossref]
  6. [No authors listed] (2000) ACOG practice bulletin. Antepartum fetal surveillance. Number 9, October 1999 (replaces Technical Bulletin Number 188, January 1994). Clinical management guidelines for obstetrician-gynecologists. Int J Gynaecol Obstet 68: 175–185. [crossref]
  7. Mancuso A, De Vivo A, Fanara G, Denaro A, Lagana D, et al. (2008) Effects of antepartum electronic fetal monitoring on maternal emotional state. Acta Obstet Gynecol Scand 87: 184–189.
  8. Evertson LR, Gauthier RJ, Schifrin BS, Paul RH (1979) Antepartum fetal heart rate testing. I. Evolution of the nonstress test. Am J Obstet Gynecol 133: 29–33. [crossref]
  9. Preboth M (2000) ACOG guidelines on antepartum fetal surveillance. American College of Obstetricians and Gynecologists. Am Fam Physician 62: 1184, 1187–1188. [crossref]
  10. Rayburn WF, Motley ME, Zuspan FP (1982) Conditions affecting nonstress test results. Obstet Gynecol 59: 490–493. [crossref]
  11. Abitbol MM, Monheit AG, Poje J, Baker MA (1986) Nonstress test and maternal position. Obstet Gynecol 68: 310–316. [crossref]
  12. Smith CV, Phelan JP, Platt LD, Broussard P, Paul RH (1986) Fetal acoustic stimulation testing. II. A randomized clinical comparison with the nonstress test. Am J Obstet Gynecol 155: 131–134.
  13. Freeman RK, Anderson G, Dorchester W (1982) A prospective multi-institutional study of antepartum fetal heart rate monitoring. II. Contraction stress test versus nonstress test for primary surveillance. Am J Obstet Gynecol 143: 778–781.