Author Archives: author

Admission Potassium / Sodium Ratio Linearly Predicts Mortality Outcome Following an Emergency Medical Admission

DOI: 10.31038/IMROJ.2019411

Abstract

Background: Disturbance of sodium and potassium chemistry is commonly present during an emergency medical admission; we analyse the interaction of these ions and relate K+/ Na+ Ratios to hospital mortality outcomes.

Methods: All emergency medical admissions between 2002 and 2017 were studied. We log transformed sodium and potassium values and calculated their respective ratios as a predictor of 30-day mortality outcomes using a multivariable logistic model.

Results: There were 106,586 admissions in 54,928 patients. Patients with higher K+/ Na+ ratios at admission were older at 66.5 years (IQR 47.0–79.3) compared with 59.0 years (IQR 39.9–75.5) and more likely to be female (51.9% vs. 45.5%). They had a higher 30-day hospital mortality rate – 5.4% vs 3.5% (p<0.001). Across consecutive deciles of K+, rising admission levels linearly predicted outcomes unlike Na+ where falling levels linearly predicted an increased mortality. Disturbed K+/ Na+ balance (log ratio) was prognostic – 30-day mortality OR 1.12 (95%CI 1.11–1.13). Increasing age predicted an increased likelihood of an abnormal K+/ Na+ balance.

Conclusion: Disturbed K+/ Na+ is linearly predictive of 30-day hospital mortality and is strongly age associated; possibly it is a consequence of Na+ leaving the extracellular space (ECF) and K+ transit to the ECF due to impaired cellular membrane homeostatic function.

Keywords

Emergency Medical Admission, Potassium Sodium Balance

Introduction

An emergency hospital admission with an urgent clinical condition requiring immediate or specialist management 1] is a high risk period but has shown improved outcomes over time 2,3] particularly since the establishment of Acute Medical Admission Units [4,5]. Risk management of critical admissions requires reliable predictors and there has been debate regarding disturbance of sodium [6–10] and potassium homeostasis [11,12] in this regard.

In terms of sodium levels, abnormalities in the laboratory range are said to occur in about 15% of hospitalized patients [7]; a U-shaped curve is described with major morbidity and mortality at the extremes of the sodium distribution in many patient groups including general internal medicine patients (13–15). Hyponatraemia in particular is prognostic for specific groups of patients with cardiovascular disease, such as congestive heart failure [16,17] but also for patients with pulmonary hypertension [18]. In terms of potassium levels, a U-shaped curve for mortality is also described with lowest all-cause mortality for potassium values between 4.0 and <5.0 mEq/L. [19]; in a geographically diverse population (n = 911,698) 27.6% had a potassium <4.0 mEq/L, and 5.7% had a value ≥ 5.0 mEq/L. A further commentary on two large studies, of the relationship between cardiovascular outcomes and potassium levels, noted that there were not a significant association between hypokalaemia and mortality in the fully adjusted Cox model, but there was a trend toward higher mortality at lower serum potassium [20].

The problem with such analyses is that the conclusions drawn will not be identical if based on a unit versus a frequency based analysis. The unit based analysis (by K+ / Na+ interval) is unintentionally biased as some intervals may contain small numbers who are actually outliers in the distributions; the results in generalisation from the specific to the general population. However, a decile based analysis for sodium, indicated that, for emergency medical admissions, the highest quantile (decile) had the lowest mortality risk and that mortality progressively increased over every other decile [21]. As a generality, the same applies to potassium except that rising deciles determine worse outcomes. The exception, dictating bad outcomes for a few, should not confuse an overall understanding of the mortality relationship to the admission levels of sodium and potassium. We have previously shown that mortality is far more influenced by other factors such as the Acuity Illness Severity Score (AISS) [22,23], sepsis status [24] and the overall burden of disease as reflected by summative comorbidities – Charlson Comorbidity Index [25] or Chronic Disabling Disease Score [26]. In this paper we consider the relevance of the balance between potassium and sodium, at time of an emergency medical admission, in determining 30-day mortality in over 100,000 emergency medical admissions and draw inferences from these findings.

Methods

Background

St James’s Hospital, Dublin serves as a secondary care centre for emergency admissions in a catchment area with a population of 270,000 adults. All emergency medical admissions were admitted from the Emergency Department to an AMAU, the operation and outcome of which have been described elsewhere [2,3,27,28]. As a city centre hospital St James’s admits persons resident elsewhere but working in the capital in addition to visitors to Dublin who became acutely ill. The number of emergency medical admissions resident in the catchment area was 74.5%; this compares with a figure of 59% for ED presentations where the social influences on emergency department visitations on two London hospitals have been examined [29].

Data Collection

During any emergency hospital admission information on the clinical episode is entered into the Patient Administration System (PAS), admission metrics are determined and entered into the emergency room database and following admission data is recorded on the patient electronic record, different laboratory systems; abstracted data is subsequently processed by dedicated staff for downloading to the National Hospital In-Patient Enquiry (HIPE) scheme. HIPE is a national database of coded discharge summaries from acute public hospitals in Ireland [30,31]. International Classification of Diseases, Ninth Revision, Clinical Modification (ICD-9-CM) has been used for both diagnosis and procedure coding from 1990 to 2005 with ICD-10-CM used since then. Data included parameters such as the unique hospital number, admitting consultant, date of birth, gender, area of residence, principal and up to nine additional secondary diagnoses, principal and up to nine additional secondary procedures, and admission and discharge dates. We in 2002 designed programs to extract the HIPE data and admission biochemistry and haematological variables (linked via the Medical Record Number) to monitor the performance of the Acute Medical Admission Unit. These data were then anonymized using an ID sequence and the MRN to link the data that is held on our system in multiple separate files. These files are assembled into memory at time of statistical analysis (using Stata coding). The data does not exist as a discrete database; it is updated annually and is a closed system accessible only by the Principal Investigators. GDPR does not apply to anonymous datasets.

Acute Illness Severity Score

Derangement of biochemical parameters may be utilised to predict clinical outcome. We derived an AISS based on laboratory data – this is an age adjusted 30-day in-hospital mortality risk estimator, representing an aggregrate laboratory score based on the admission serum sodium, serum potassium, serum urea, red cell distribution width, white blood cell count, serum albumin and troponin values at admission (23, 32); the score predicts 30-day in-hospital mortality from the biochemical parameters recorded in the Emergency Department (33). The AISS can be enhanced with data from the ICD9/10 discharge codes to compute Co-Morbidity (as per the Charlson Index (25)) or Disability (26) status. This Risk Score is exponentially related to the 30-day mortality outcome with a range of mortality outcomes from 0.5% (0.40%–0.53%) to 39% (37.8%-40.2%). We have demonstrated using a nomogram that this laboratory model derives most of its predictive power from the admission values of albumin, urea and haemoglobin (34).

Comorbidity Instrument

Hospital HIPE codes [30,31] were interrogated to construct a measure of multi-morbidity. To devise the score, we searched ICD9 hospital episode discharge codes (back-mapping ICD10 codes to ICD9 as appropriate) based on the definition proposed by the US Department of Health and Human Services for chronic physical or mental health disorders, that limit people ‘in activities that they generally would be expected to be able to perform’. These ICD codes were similar to those proposed by the Canadian group for multi-morbidity (35) and the work of Quan [36,37]; they were grouped by system into the following ten groups: (i) cardiovascular, (ii) respiratory, (iii) neurological, (iv) gastrointestinal, (v) diabetes, (vi) renal, (vii) neoplastic disease, (viii) others (including rheumatological disabilities), (ix) ventilatory assistance required and (x) transfusion requirement. We have previously detailed the ICD9 codes for chronic physical or mental health disorders utilized as a supplementary Table [38]. In addition, we searched other hospital databases for evidence of diabetes (Diamond database), respiratory insufficiency (FEV1 < 2 L data pulmonary function laboratory), troponin status (high sensitivity troponin > 25 ng/L) [33], low albumin (<35 G/dL) and anaemia (haemoglobulin levels < 10 G/dL) or chronic renal insufficiency – MDRD < 60 mL/min*1.73 m2 [39]. The ‘morbidity score’ for each individual’s clinical episode during the study, was weighted by its relative important against the 30-day mortality outcome in the multivariable regression analysis.

Statistical Methods

Descriptive statistics were calculated for background demographic data, including means/standard deviations (SD), medians/interquartile ranges (IQR), or percentages. Comparisons between categorical variables and mortality were made using chi-square tests.

We employed a logistic model with robust estimate to allow for repeated admissions; the correlation matrix thereby reflected the average dependence among the specified correlated observations [23]. Logistic regression analysis identified potential mortality predictors and then tested those that proved to be significant univariate predictors (p<0.01 by Wald test). Mortality results have been presented either by admission (all admissions counted) or by patient (only one admission considered – last admission if > one). In an extended time series (16 yr.), 48.7% of patients were readmitted at least once, 9.3% > 5 times and 20 patients > 50 times each; whether per admission or per patient mortality analysis is optimal is uncertain. We used the margins command in Stata to estimate and interpret adjusted predictions for sub-groups, while controlling for other variables such as time, using computations of average marginal effects. Margins are statistics calculated from predictions of a previously fitted model at fixed values of some covariates and averaging or otherwise over the remaining covariates. In the multivariable model (logistic), we adjusted univariate estimates of effect, using the previously described outcome predictor variables. The model parameters were stored; post-estimation intra-model and cross-model hypotheses could thereby be tested.

Adjusted odds ratios (OR) and 95% Confidence Intervals (CI) were calculated for those predictors that significantly entered the model (p<0.10). Statistical significance at P<0.05 was assumed throughout. Stata v.15 (Stata Corporation, College Station, Texas) statistical software was used for analysis. This study had no interventional component, used anonymised routinely collected data, complied with data protection legislation and was undertaken as part of the Hospital Quality Improvement Programme to assess the overall impact of the Acute Medical Admission Initiative.

Results

Patient Demographics

During the 16-year study period (2002–2017), there were a total of 106,586 admissions in 54,928 unique patients. This represented all emergency medical admissions, including patients admitted directly into the Intensive Care Unit or High Dependency Unit. The proportion of males was 48.5%. The median (IQR) Length Of Stay (LOS) was 4.3 days (1.7–8.9). The median (IQR) age was 58.9 years (38.2–76.3) with the upper 10% boundary at 85.0 years.

The demographic characteristics (Table 1) are outlined with a cut at the midpoint of the calculated admission K+ / Na+ ratio. The K+ and Na+ data was log (natural) transformed prior to the analysis mainly to equalize the data spread of the two elements despite their numerical difference – anticipated to make the data easier to handle and interpret. Above and below that midpoint, the patient group characteristics are tabulated by Acute Illness Severity [23,32], Charlson Index [25], Co-Morbidity and Sepsis status [24]. Patient in the upper half of the K+ / Na+ ratio distribution were older 66.5 years (IQR 47.0–79.3) compared with 59.0 years (IQR 39.9–75.5) but had equivalent hospital LOS – 4.9 days (IQR 1.9–9.7) versus 5.1 days (IQR 2.3–9.7). Admissions with a K+ / Na+ ratio distribution above the median were more likely to be female (51.9% vs. 45.5%) and had a higher 30-day hospital mortality rate – 5.4% vs 3.5% (p<0.001). Those with a K+ / Na+ ratio distribution above the median had a higher Acute Illness Severity Score (top two groups 66.1% vs. 53.4%) and higher Charlson Comorbidity Index (top two groups 39.6% vs. 33.0%).

Mortality related to admission K+ / Na+ levels

The 30-day per patient mortality declined between 2002 and 2017 from 12.4% to 4.8%. This represented a relative risk reduction (RRR) of 61.3% with a number needed to treat (NNT) of 13.1. Lower admission sodium levels were associated with a linear increase in patient mortality rate across all deciles (OR 0.89 (95% CI 0.88–0.90); from decile 1 (lowest sodium) – 16.9% (95% CI 16.0%-17.8%) to decile 5 – 11.4% (95% CI 11.0%-11.8%) and decile 10 – 6.7% (95% CI 6.2%-7.2%). Higher admission potassium level predicted mortality – OR 1.07 (95%CI: 1.06, 1.09) and there was a progressive increase in 30-day in-hospital mortality across all deciles from decile 1 (lowest) – 8.9% (95%CI: 8.3%, 9.4%) to decile 5 – 11.0% (95%CI: 10.6%, 11.3%) and decile 10 – 14.2% (95%CI: 13.5%, 14.8%). This is a different interpretation to the conventional wisdom of a U shaped curve for both K+ and Na+ and mortality outcomes. However, an analysis by decile lacks numerical bias where very difference frequencies fall within discrete ranges. For Na+ for example, and taking decile 10 with the lowest overall mortality risk, the lower boundary is 142 mEq/l, with the median, 75% and 95% points at 144, 145 and 150 mEq/l. For K+ for example, and taking decile 1 with the lowest overall mortality risk, the upper boundary is 3.4 mEq/l, with the median, 75% and 95% points at 3.2, 3.0 and 2.6 mEq/l. Therefore the correct distribution mortality relationship is that 30-day mortality outcome, as determined by K+ and Na+ admission values, is that mortality increases with each decile of K+ decile, from lowest to highest with the opposite being true for admission Na+ levels.

Table 1. Characteristics of Emergency Admissions by Median K+ / Na+ Ratio.

Lower
(N= 45,135)

Upper
(N= 50, 726)

p-Value

Age (yr.)

 Mean (SD)

57.4 (20.78)

62.5 (20.29)

<0.001

 Median (Q1, Q3)

59.0 (39.9, 75.5)

66.5 (47.0, 79.3)

Length Stay (day)

 Mean (SD)

7.2 (6.45)

7.0 (6.51)

<0.001

 Median (Q1, Q3)

5.1 (2.3, 9.7)

4.9 (1.9, 9.7)

Gender

 Male

20530 (45.5%)

26321 (51.9%)

<0.001

 Female

24605 (54.5%)

24405 (48.1%)

30-day Hospital Mortality

 Alive

43542 (96.5%)

48000 (94.6%)

<0.001

 Dead

1593 (3.5%)

2726 (5.4%)

Acute Illness Severity

 1

1835 (4.3%)

1094 (2.5%)

<0.001

 2

3916 (9.2%)

2595 (5.8%)

 3

6234 (14.7%)

4630 (10.4%)

 4

7768 (18.3%)

6773 (15.2%)

 5

8638 (20.3%)

8329 (18.7%)

 6

14072 (33.1%)

21064 (47.4%)

Co-Morbidity Score

 < 6

11387 (38.3%)

11247 (32.4%)

<0.001

 >=6 < 8

8547 (28.7%)

9744 (28.0%)

 >=8 < 12

8181 (27.5%)

11098 (31.9%)

 >=12 < 20

1643 (5.5%)

2674 (7.7%)

Charlson Index

8638 (20.3%)

8330 (18.7%)

 0

22226 (49.3%)

21771 (43.0%)

<0.001

 1

12063 (26.8%)

13830 (27.3%)

 2

10768 (23.9%)

15042 (29.7%)

Sepsis Group

 1

33695 (74.7%)

39653 (78.2%)

<0.001

 2

9828 (21.8%)

9426 (18.6%)

 3

1612 (3.6%)

1647 (3.2%)

*LOS: length of stay, MDC: Major Disease Category, IQR: Inter-Quartile Range

Mortality related to admission K+ / Na+ Ratio (Figs 1 / 2)

The admission K+ / Na+ Ratio was predictive of episode 30-day hospital mortality – OR 1.12 (95% CI 1.11–1.13). This compared with the predictive capacity of the Acute Illness Severity Score of OR 3.28 (95% CI 3.03–3.56) , the Charlson Comorbidity Index of OR 1.20 (95% CI 1.18–1.23) and sepsis status OR 1.61 (95% CI 1.51–1.71). The admission K+ / Na+ Ratio was a linear predictor (Fig 1) of 30-day hospital mortality over the range of deciles from the lowest D1 with predicted mortality of 5.6% (95% CI: 5.2%, 5.9%), to D5 6.2% (95% CI: 6.0%, 6.4%) and D10 7.2% (95% CI: 6.9%, 7.5%), After adjustment for the above predictors, the predictive value of K+ / Na+ Ratio was reduced to 1.03 (95% CI 1.02–1.04).

IMROJ_2019-101-Bernard Silke_F1

Figure 1. The relationship between the admission K+ / Na+ ratio and 30-day in-hospital mortality. For each decile of the ratio, the 30-day in-hospital mortality rate was derived from the logistic regression model and adjusted for the Charlson Co-Morbidity, Co-Morbidity and Sepsis Scores.

IMROJ_2019-101-Bernard Silke_F2

Figure 2. The relationship between the admission K+ / Na+ ratio and patient age. The Decile of the Ratio, at time of admission, was regressed against the age group (Zero Poisson truncated) and adjusted for the Acute Illness Severity and Co-Morbidity and Sepsis Status. The Decile of K+ / Na+ ratio at time of admission was a linear function of age.

We also examined the likelihood that the admitted K+ / Na+ Ratio was age related – over the admitted age range by relating the likelihood that older admissions would fall into higher K+ / Na+ Decile Ratios. We regressed the age groups < 40, 40 + – 60, 60+ – 75, 75+ – 85 and >85 against counts of K+ / Na+ Ratio (zero truncated Poisson regression) by patient and adjusted for the Acute Illness Severity (22, 23), Charlson Comorbidty Index (25) and Sepsis Status (24). There was a linear relationship between the underlying age and the likelihood of being in a higher K+ / Na+ Decile Ratio.

Discussion

Our data shows that over a period of 16 years potassium and sodium levels at the time of an emergency medical admission were predictive of 30-day mortality outcomes. Although the mortality outcomes have improved over time, the predictive value consistent irrespective of such quality improvements. Falling deciles of sodium were associated with increasing mortality outcomes; the 30-day patient mortality comparing the highest and lowest decile was 6.7% vs 16.9%. For potassium the opposite was true; rising deciles were associated with increasing mortality from lowest decile rate of 8.9% to highest rate of 14.2%. Therefore in overall terms neither hypokalaemia nor hypernatraemia were prognostic risk factors of a 30-day hospital death. That is not to argue that specific patients with very disturbed admission hypokalaemia or hypernatraemia were not at risk. However, for high sodium levels (top decile > 142 mEq/l) only 25% of that decile were > 145 mEq/l. and 5% > 150 mEq/l. For the lowest potassium decile (<3.4 mEq/l), only 25% of that decile were < 3.0 mEq/l. and only 5% < 2.6 mEq/l. Thus taking what might occur in a small minority of any population distribution, and seeking to make statements regarding the overall population risk is an approach that may result in a misconceived view of the risk reality in the mind of the clinician.

If increasing potassium or decreasing admission levels are linearly prognostic, as our model relating deciles of each to 30-day mortality outcome, then a reasonable presumption might be that the disturbance in both would be linked. Sodium being the principal extracellular ion and potassium being intracellular might leak from their respective domains as the system aged; disorder of the pair might be thought of as reflecting impaired membrane function and the energetic process involved in maintaining the transmembrane electro-chemical gradient. The likelihood of being in a higher risk decile certain was strongly age dependent in our analysis. We wondered if the relationship of the two ions, as reflected in the K+ / Na+ Ratio, might be a better prognostic indicator that their individual ability to predict mortality outcome. The univariate prediction of the K+ / Na+ Ratio was considerably attenuated when other independent outcome predictors such as Acute Illness Severity Score, Charlson Comorbidity Index and sepsis status were accounted for in the multivariable model. This would suggest that in overall terms, disorders of these ions, whilst of clinical relevance in certain specific patient subsets, in general are part of more complex disorder of homeostasis, driven by illness severity and the overall burden of disease [40,41]. As linking the analysis to the combined behaviour, with the K+ / Na+ Ratio, did not improve the prognostic prediction over that from independent analysis of each, one cannot assume that the behaviour of the K+ and Na+ is linked in emergency medical admissions on average.

Of course, the practicing physician is rightly focused on clinical outcomes at the extremes of distribution due to the high mortality rates [42] and the need for urgent interventions to correct the disorder and mitigate the consequences [43]. Generally speaking disturbed biochemistry has been recognised to predict hospital mortality outcomes and been incorporated into laboratory score systems [44–46]. We must however distinguish a population based interpretation of the risk relating a predictor variable that is disturbed to mortality outcomes in general from that at the extremes of population or in certain specific high-risk subgroups, and as to whether patients die with or as a consequence of hyponatraemia [47] or if most deaths are caused by underlying diseases [42]. The widely quoted work of Gheorghiade et al. demonstrated a marked correlation between serum sodium < 135 mEq/l and both hospital LOS and mortality and an apparent “U shaped’ curve with increased mortality if serum sodium was greater than 140 mEq/l [16]. However, a recent large meta-analysis on dysnatraemia concluded that hyponatremia (HR 1.34; 95% CI: 1.15–1.57) but not hypernatremia (HR 1.12; 95%: CI 0.93–1.34), was independently associated with increased risk of all-cause mortality, when compared than the normonatremia category [48].

In respect of potassium levels and mortality outcomes, in 6515 patients prior to randomization in the MERLIN-TIMI trial, the lowest risk of cardiovascular death was observed in patients with admission potassium levels between 3.5 and 4.5 mEq/L. Both lower and higher levels of potassium were associated with tachyarrhythmias and bradyarrhythmias, suggesting a potential mechanistic explanation for the increased risk of cardiovascular death at the extremes of potassium homeostasis [49]. Krogager et al. [50] reported, in a cohort of nearly 2600 patients post myocardial infarction, a U-shaped relationship between serum potassium concentration on hospitalization and 90-day mortality; these observations of increased mortality also applied to low and high normal serum potassium levels. Hughes-Austin et al. [51]  found that high serum potassium concentration is significantly associated with a higher risk for all-cause mortality independent of kidney function or other cardiovascular disease risk factors; no significant association between hypokalaemia and mortality was found in the fully adjusted Cox model. We found that from lower to higher deciles of potassium a progressively rising risk of an adverse mortality outcome. Similarly, Loprinzi and Hall [12] investigated the potassium-mortality relationship in the general population of the United States, using data from the 1999–2006 National Health and Nutrition Examination Survey were employed, with follow-up through 2011. In a Cox proportional hazards model, after adjusting for confounding variables found that a 1-mmol/L increase in potassium was associated with a 40% increased risk of mortality (adjusted hazard ratio 1.40; 95% CI, 1.15–1.70).

Broadly speaking then we would conclude, that in an unselected population admitted with medical emergencies over 16 years that although disturbances of potassium or sodium were predictive of 30-day mortality outcomes in general, the lowest decile of admission potassium or the highest decile of sodium conferred the lowest risk, when adjusted for other major independent outcome predictors. Over all deciles of admitted potassium, rising levels were positive associated with increased mortality; the contrary applied to sodium where the greatest risk was for the lowest admitted levels, and all higher deciles demonstrated a falling mortality trend. Furthermore, although both rising potassium levels and falling sodium levels were independently predictive, in the full model with adjustment as described, the influence of each of the combined ratio was attenuated This implies that disorders of potassium and sodium and their ratio is a secondary phenomenon, reflecting system disorder and a ‘sick cell’ or unbalanced homeostasis due to major illness associated with comorbidity.

Our study utilises comprehensive data gathered over a prolonged period of time, however this information is in essence extracted from the medical record through coding and other standard procedures; therefore the robustness of our data is entirely dependent on the accuracy of the original recordings. The external validity of our results will need to be established by complementary studies in other institutions and settings. We do not collect information on the specific treatment of individual patients, therefore we were not able to analyse any potential effects of interventions in those with abnormalities of potassium or sodium. Finally, the design of our study by its nature assesses for associations rather than causation, while we adjust for multiple variables in our analyses we cannot comment on any potential causative role for electrolyte imbalance on mortality.

In conclusion this study demonstrates that the ratio of admission serum potassium to sodium is both strongly associated with age and linearly predictive of 30-day hospital mortality. The interpretation of sodium and potassium homeostasis as an interdependent ratio did not add significant material value to analysing the cations independently.

References

  1. Langlands A, Dowdle R, Elliott A, Gaddie J, Graham A, Johnson G, et al. (2009) RCPE UK Consensus Statement on Acute Medicine, November 2008. British journal of hospital medicine 70: 6–7.
  2. Rooney T, Moloney ED, Bennett K, O’Riordan D, Silke B (2008) Impact of an acute medical admission unit on hospital mortality: a 5-year prospective study. Qjm 101: 457–65.
  3. Conway R, O’Riordan D, Silke B (2014) Long-term outcome of an AMAU–a decade’s experience. QJM 107: 43–49. [crossref]
  4. Byrne D, Silke B (2011) Acute medical units: review of evidence. Eur J Intern Med 22: 344–347. [crossref]
  5. Scott I, Vaughan L, Bell D (2009) Effectiveness of acute medical units in hospitals: a systematic review. Int J Qual Health Care 21: 397–407. [crossref]
  6. Whelan B, Bennett K, O’Riordan D, Silke B (2009) Serum sodium as a risk factor for in-hospital mortality in acute unselected general medical patients. QJM 102: 175–82.
  7. Asadollahi K, Beeching N, Gill G (2006) Hyponatraemia as a risk factor for hospital mortality. QJM 99: 877–880. [crossref]
  8. Stachon A, Segbers E, Hering S, Kempf R, Holland-Letz T, et al. (2008) A laboratory-based risk score for medical intensive care patients. Clin Chem Lab Med 46: 855–862. [crossref]
  9. Waikar SS, Mount DB, Curhan GC (2009) Mortality after hospitalization with mild, moderate, and severe hyponatremia. Am J Med 122: 857–865. [crossref]
  10. Conway R, Byrne D, O’Riordan D, Silke B (2014) Hyponatraemia in Emergency Medical Admissions-Outcomes and Costs. Journal of clinical medicine 3: 1220–1233.
  11. Conway R, Creagh D, Byrne DG, O’Riordan D, Silke B (2015) Serum potassium levels as an outcome determinant in acute medical admissions. Clinical medicine (London, England) 15: 239–243.
  12. Loprinzi PD, Hall ME (2017) Effect of Serum Potassium on All-Cause Mortality in the General US Population. Mayo Clin Proc 92: 320. [crossref]
  13. Nardi R, Fiorino S, Borioni D, Agostini D, D’Anastasio C, et al. (2007) Comprehensive complexity assessment as a key tool for the prediction of in-hospital mortality in heart failure of aged patients admitted to internal medicine wards. Arch Gerontol Geriatr 44 Suppl 1: 279–288.
  14. Wartenberg KE, Schmidt JM, Claassen J, Temes RE, Frontera JA, et al. (2006) Impact of medical complications on outcome after subarachnoid hemorrhage. Crit Care Med 34: 617–623.
  15. Kraft MD, Btaiche IF, Sacks GS, Kudsk KA (2005) Treatment of electrolyte disorders in adult patients in the intensive care unit. Am J Health Syst Pharm 62: 1663–1682. [crossref]
  16. Gheorghiade M, Abraham WT, Albert NM, Gattis Stough W, Greenberg BH, et al. (2007) Relationship between admission serum sodium concentration and clinical outcomes in patients hospitalized for heart failure: an analysis from the OPTIMIZE-HF registry. Eur Heart J 28: 980–988.
  17. Mohammed AA, Kimmenade RRJv, Richards M, Bayes-Genis A, Pinto Y, et al. (2010) Hyponatremia, natriuretic peptides, and outcomes in acutely decompensated heart failure: results from the International Collaborative of NT-proBNP Study. Circ Heart Fail 3: 354–3561.
  18. Forfia PR, Mathai SC, Fisher MR, Housten-Harris T, Hemnes AR, et al. (2008) Hyponatremia Predicts Right Heart Failure and Poor Survival in Pulmonary Arterial Hypertension. Am J Respir Crit Care Med 177: 1364–1369.
  19. Collins AJ, Pitt B Fau-Reaven N, Reaven N Fau-Funk S, Funk S Fau-McGaughey K, McGaughey K Fau – Wilson D, et al. (2017) Association of Serum Potassium with All-Cause Mortality in Patients with and without Heart Failure, Chronic Kidney Disease, and/or Diabetes. Am J Nephrol 46: 213–221
  20. Toto RD (2017) Serum Potassium and Cardiovascular Outcomes: The Highs and the Lows. CJASN 12: 220–221.
  21. McCarthy K, Conway R, Byrne D, Cournane S, Deirdre OR, et al. (2018) Hyponatraemia during an emergency medical admission as a marker of illness severity & case complexity. Eur J Intern Med (in press).
  22. Royston P, Reitz M, Atzpodien J (2006) An approach to estimating prognosis using fractional polynomials in metastatic renal carcinoma. Br J Cancer 94: 1785–1788.
  23. Silke B, Kellett J, Rooney T, Bennett K, O’Riordan D (2010) An improved medical admissions risk system using multivariable fractional polynomial logistic regression modelling. Quarterly Journal of Medicine 103: 23–32.
  24. Chotirmall SH, Callaly E, Lyons J, O’Connell B, Kelleher M, et al. (2014) Blood cultures in emergency medical admissions: a key patient cohort. Eur J Emerg Med
  25. Charlson ME, Pompei P, Ales KL, MacKenzie CR (1987) A new method of classifying prognostic comorbidity in longitudinal studies: development and validation. J Chronic Dis 40: 373–383. [crossref]
  26. Chotirmall SH, Picardo S, Lyons J, D’Alton M, O’Riordan D, et al. (2014) Disabling disease codes predict worse outcomes for acute medical admissions. Intern Med J 44: 546–553.
  27. Coary R, Byrne D, O’Riordan D, Conway R, Cournane S, Silke B (2014) Does admission via an acute medical unit influence hospital mortality? 12 years’ experience in a large Dublin hospital. Acute medicine 13: 152–158.
  28. Conway R, Byrne D, Cournane S, O’Riordan D, Silke B (2018) Fifteen-year outcomes of an acute medical admission unit. Ir J Med Sci 187: 1097–1105. [crossref]
  29. Beeknoo N, Jones R (2016) Factors Influencing A & E Attendance, Admissions and Waiting Times at Two London Hospitals. British Journal of Medicine & Medical Research 17: 1–29.
  30. O’Loughlin R, Allwright S, Barry J, Kelly A, Teljeur C (2005) Using HIPE data as a research and planning tool: limitations and opportunities. Ir J Med Sci 174: 40–45. [crossref]
  31. O’Callaghan A, Colgan MP, McGuigan C, Smyth F, Haider N, et al. (2012) A critical evaluation of HIPE data. Ir Med J 105: 21–23. [crossref]
  32. O’Sullivan E, Callely E, O’Riordan D, Bennett K, Silke B (2012) Predicting outcomes in emergency medical admissions – role of laboratory data and co-morbidity. Acute medicine 2: 59–65.
  33. Courtney D, Conway R, Kavanagh J, O’Riordan D, Silke B (2014) High-sensitivity troponin as an outcome predictor in acute medical admissions. Postgrad Med J 2014: 1–7.
  34. Cournane S, Conway R, Byrne D, O&apos;Riordan D, Silke B (2017) Predicting Outcomes in Emergency Medical Admissions Using a Laboratory Only Nomogram. Computational and Mathematical Methods in Medicine 2017: 1–8.
  35. Tonelli M, Wiebe N, Fortin M, Guthrie B, Hemmelgarn BR, et al. (2015) Methods for identifying 30 chronic conditions: application to administrative data. BMC Med Inform Decis Mak 15: 31. [crossref]
  36. Quan H, Li B Fau-Saunders LD, Saunders Ld Fau-Parsons GA, Parsons Ga Fau-Nilsson CI, Nilsson Ci Fau -Alibhai A, et al. (2008) Assessing validity of ICD-9-CM and ICD-10 administrative data in recording clinical conditions in a unique dually coded database. Health Serv Res 43: 1424–1441.
  37. Quan H, Sundararajan V, Halfon P, Fong A, Burnand B, et al. (2005) Coding algorithms for defining comorbidities in ICD-9-CM and ICD-10 administrative data. Med Care 43: 1130–1139. [crossref]
  38. Ronald J. Ozminkowski PD MWS, Rosanna M. Coffey, Tami L. Mark, Cheryl A. Neslusan, John Drabek (2000) Private Payers Serving Individuals with Disabilities and Chronic Conditions 2000.
  39. Stevens PE, Levin A (2013) Evaluation and management of chronic kidney disease: synopsis of the kidney disease: improving global outcomes 2012 clinical practice guideline Ann Intern Med 158: 825–30.
  40. Byrne D, Conway R, Cournane S, O’Riordan D, Silke B (2018) Relationship of the clinical acuity & complexity to the outcome of an emergency medical admission. Acute medicine 17: 18–25.
  41. Conway R, Byrne D, O’Riordan D, Silke B (2015) Patient risk profiling in acute medicine: the way forward? QJM 108: 689–696. [crossref]
  42. Sterns RH (1987) Severe symptomatic hyponatremia: Treatment and outcome: a study of 64 cases. Annals of Internal Medicine 107: 656–664.
  43. Sonnenblick M, Friedlander Y, Rosin AJ (1993) Diuretic-induced severe hyponatremia. Review and analysis of 129 reported patients. Chest 103: 601–606. [crossref]
  44. Prytherch DR, Sirl JS, Schmidt P, Featherstone PI, Weaver PC, et al (2005) The use of routine laboratory data to predict in-hospital death in medical admissions. Resuscitation 6: 203–207.
  45. Froom P, Shimoni Z (2006) Prediction of hospital mortality rates by admission laboratory tests. Clin Chem 52: 325–328.
  46. Hucker TR, Mitchell GP, Blake LD, Cheek E, Bewick V, Grocutt M, et al (2005) Identifying the sick: can biochemical measurements be used to aid decision making on presentation to the accident and emergency department. Br J Anaesth 94: 735–741.
  47. Chawla A, Sterns RH, Nigwekar SU, Cappuccio JD (2011) Mortality and serum sodium: do patients die from or with hyponatremia? Clin J Am Soc Nephrol 6: 960–965. [crossref]
  48. Sun L, Hou Y, Xiao Q, Du Y (2017) Association of serum sodium and risk of all-cause mortality in patients with chronic kidney disease: A meta-analysis and sysematic review. Scientific reports 7: 15949-.
  49. Patel RB, Tannenbaum S, Viana-Tejedor A, Guo J, Im K, Morrow DA, et al (2017) Serum potassium levels, cardiac arrhythmias, and mortality following non-ST-elevation myocardial infarction or unstable angina: insights from MERLIN-TIMI 36. European heart journal Acute cardiovascular care 6: 18–25.
  50. Korgaonkar S, Tilea A, Gillespie BW, Kiser M, Eisele G, Finkelstein F, et al (2010) Serum potassium and outcomes in CKD: insights from the RRI-CKD cohort study. Clinical journal of the American Society of Nephrology : CJASN 5: 762–769.
  51. Hughes-Austin JM, Rifkin DE, Beben T, Katz R, Sarnak MJ, Deo R, et al (2017) The Relation of Serum Potassium Concentration with Cardiovascular Events and Mortality in Community-Living Individuals. Clin J Am Soc Nephrol 12: 245–252.

Endothelial Cell Growth Promoting Activity in Graves’ Disease Sera is Neutralized by Anti-Basic Fibroblast Growth Factor Antibodies in Patients with Fat Expansive but Not Infiltrative Orbitopathy

DOI: 10.31038/EDMJ.2019313

Abstract

Purpose: To report a case of orbital fat expansion leading to globe prolapse in a Graves’ disease patient undergoing high-dose glucocorticoid therapy. To evaluate the growth factor receptor specificities of plasma autoantibodies in Graves’ disease patients who exhibited contrasting subtypes of thyroid-associated ophthalmopathy, i.e. orbital fat expansion-type vs. infiltrative.

Methods: Sera from Graves’ orbitopathy and control patients with or without Graves’ disease were subjected to protein-A affinity chromatography to obtain immunoglobulin G. A (1/50th to 1/1600th) range in dilutions of the protein-A eluate fraction was incubated for four days at 37 degrees C with bovine pulmonary artery endothelial cells to test for endothelial cell inhibition or stimulation. Growth stimulatory autoantibodies were co-incubated with specific neutralizing anti-insulin like growth factor 1 receptor antibodies or anti-basic fibroblast growth factor antibodies to assess autoantibody specificity in contrasting Graves’ orbitopathy subtypes.

Results: We observed increased mean endothelial cell growth promoting activity in the protein-A eluates of serum from eighteen patients with active Graves’ disease (117 ± 28%, n = 18) compared to mean endothelial cell activity (89 ± 10%, n = 13, P = 0.003) in thirteen adults without Graves’ disease. The protein-A eluate fraction in acute infiltrative-type Graves’ orbitopathy contained a high titer (> 1: 1000) of endothelial cell stimulatory activity which was significantly neutralized by specific monoclonal anti-human insulin-like growth factor 1 receptor antibodies. The protein-A eluate fraction in fat expansion-type Graves’ orbitopathy contained endothelial cell inhibitory activity (at low titers) and stimulatory activity (at high titers), and the latter stimulatory activity was completely neutralized by specific anti-basic fibroblast growth factor antibodies.

Conclusion: Graves’ disease suffering globe prolapse secondary to marked orbital fat-expansion had coexisting plasma fibroblast growth factor-inhibitory and -stimulatory autoantibodies. The latter was completely neutralized by anti-basic fibroblast growth factor antibodies.

Keywords

Graves’ disease, thyroid associated ophthalmopathy, autoantibodies, fibroblast growth factor

Introduction

Thyroid-associated ophthalmopathy (TAO) is a vision-threatening complication of Graves’ disease (GD) which can cause significant morbidity and impaired quality of life [1]. Extraocular muscle hypertrophy and local inflammation contribute to a severe infiltrative form of the disease whose underlying pathophysiology has been the focus of recent investigations [2]. Evidence suggests that increased local orbital glycosaminoglycan production (a hallmark in infiltrative- type Graves’ orbitopathy) results (in part) from circulating agonist insulin- like growth factor 1 receptor autoantibodies [2] and increased expression of insulin-like growth factor 1 receptor (IGF- 1R) in orbital fibroblasts [3] and in T and B lymphocytes [4].

Orbital fat expansion can accompany Graves’ extraocular muscle hypertrophy, but its underlying pathophysiology is less clearly defined. We report increased mean endothelial cell growth promoting activity in the protein-A eluates of serum from active Graves’ disease compared to adult controls without GD. We also report a patient with type 2 diabetes mellitus, active Graves’ disease, and focal segmental glomerulosclerosis (FSGS) who experienced acute globe prolapse secondary to severe orbital fat expansion in the setting of high-dose glucocorticoid therapy. The patient’s orbitopathy was characterized by a lack of extra-ocular muscle enlargement and his plasma contained novel growth stimulatory endothelial cell plasma autoantibodies whose activity (in vitro) was completely neutralized by specific anti-bovine basic fibroblast growth factor (FGF) antibodies. These data suggest a possible role for circulating fibroblast growth factor-like autoantibodies in rare cases of Grave’s orbitopathy characterized by pure orbital fat expansion.

Participants and Methods

Participants

Graves’ disease (GD) Pt 1: A 45-year-old man with hyperthyroidism who presented with infiltrative-type orbitopathy, diplopia and a triiodothyronine (T3) level of 663 ng/dL (59- 174). He was treated with radioactive iodine (RAI) ablation, methylprednisolone and underwent orbital decompression surgery. Thyroid stimulating immunoglobulin was elevated at 194% (0–130) and anti-microsomal antibody was 4128 IU/mL (0–34).

Graves’ disease (GD) Pt 2: A 53-year-old man with chronic Graves’ disease (treated with tapazole), type 2 diabetes mellitus, macular edema, nephropathy, fat expansion-type orbitopathy and idiopathic focal segmental glomerulosclerosis (FSGS) for which the patient was treated with high- dose glucocorticoids. Thyroid stimulating immunoglobulin was elevated at 199% (0–130) and anti-microsomal antibody was 2367 IU/mL (0–34). During steroid taper, the patient experienced prolapse of the right globe while driving his car. Magnetic resonance imaging of the orbits revealed markedly increased retrobulbar fat bilaterally with resulting proptosis. The extraocular muscles and optic nerves were normal. Doppler ultrasound of the thyroid revealed a‘thyroid inferno pattern’ suggestive of intrathyroidal angiogenesis. The patient progressed to end-stage-renal disease requiring dialysis and died suddenly of unknown causes six years later. Patient 3: A 72-year-old man with Graves’ disease treated with methimazole. He experienced progression in orbitopathy (over a three-year period) characterized by marked enlargement in extra-ocular muscles and moderate increase in retrobulbar fat.

Patient 4: A 64-year-old man with type 2 diabetes, macular edema, and nephropathy who experienced bilateral supero-temporal orbital fat prolapse (left> right) within 9 months of receiving high-dose oral prednisone followed by intra-tympanic injection of solumedrol to treat autoimmune sensorineural hearing loss.

Methods

Blood drawing/Protein-A Chromatography

Informed consent for the local Institutional Review Board-approved study was obtained from each participant prior to blood drawing which was performed in the morning. Protein-A affinity chromatography of serum was carried out as previously reported [5].

Cell culture

Bovine pulmonary artery (BPA) endothelial cells (EC) (Clonetics, Inc. San Diego, CA, USA) were maintained at 37°C in 5% CO2/95% air in Medium 199 (M199) plus 10% fetal calf serum (FCS). BPA endothelial cells were passaged continuously and used between passages 4 and 7. Bovine pulmonary artery endothelial cells are exquisitely sensitive to low concentrations of basic fibroblast growth factor and are an optimal test system for the detection of fibroblast growth factor-like inhibitory and -stimulatory substances [5].

Endothelial cell proliferation assays

Endothelial cell number assays were carried out as previously reported [5]. Confluent cells were trypsinized and plated at 1 to 10 × 103 cells/well in Medium 199 plus 10% fetal calf serum in 96- well plates. After 1 or 2 days incubation for cells to reach 60–80% confluency, test fractions (30 μg/mL of the protein- A eluates of serum) were added to wells in quadruplicate. After 4 days’ incubation in the presence of test fractions, cells were washed with phosphate- buffered saline and colorimetric estimation of cell number was determined as previously described [5]. Each point represents the mean of quadruplicate determinations.

Antibodies

Purified mouse monoclonal anti-human insulin-like growth factor-1 receptor antibodies were obtained from BD Biosciences (San Jose, CA). Polyclonal rabbit, anti-bovine basic fibroblast growth factor antibodies were obtained from R & D Systems, Inc. (Minneapolis, MN).

Protein determinations

Protein concentrations were determined by a bicinchoninic acid protein assay kit (Pierce Chemical Co., Rockford, IL, USA).

Results

Graves’ disease autoantibodies induce endothelial cell proliferation

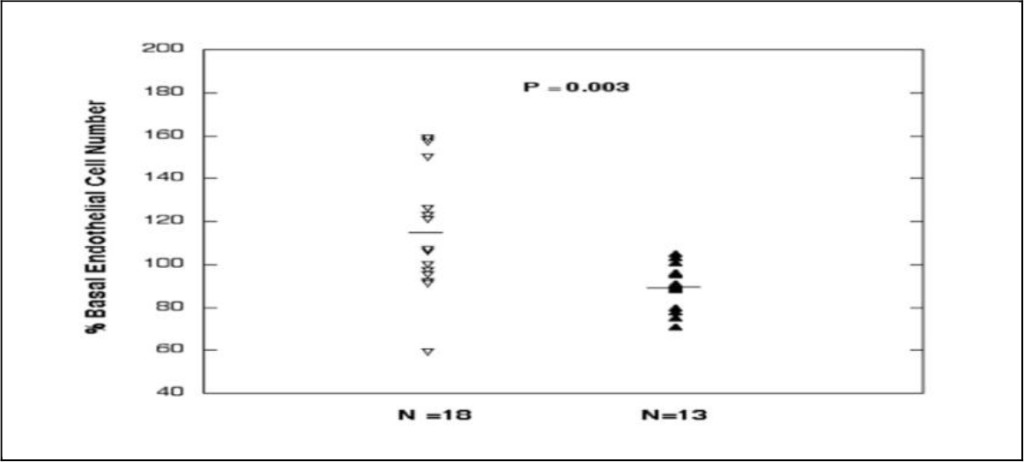
We observed increased mean endothelial cell growth promoting activity in the protein-A eluates of serum from eighteen patients with active Graves’ disease (117 ± 28%, n = 18) compared to mean endothelial cell activity (89 ± 10%, n = 13, P = 0.003) in an identical 30 µg/mL concentration of the protein-A eluate in thirteen adults without Graves’ disease (including six normal participants, three patients with rheumatoid arthritis, and one patient each with polycystic ovarian syndrome, systemic lupus erythematosus, sarcoidosis or Sjogrens’ syndrome) (Fig 1). Graves’ disease patients did not differ significantly in their mean age, or male: female ratio from the control group of 13 participants (Table 1). Mean endothelial cell activity (30 µg/mL concentration of the protein-A eluate) did not differ significantly in Graves orbitopathy (124 ± 23%, N = 9) compared to Graves without orbitopathy (115 ± 32%, N = 9, P = 0.53). The mean thyroid stimulating hormone, thyroid stimulating immunoglobulin, anti-thyroid peroxidase antibody, or anti-thyroglobulin antibody levels did not differ significantly in active Graves’ disease patients affected (GO+, N = 9) or not affected by orbitopathy (GO-, N = 9) (Table 1).

EDMJ - Mark B Zimering-F1

Figure 1. Endothelial cell growth-promoting activity in a one-fiftieth dilution (30 µg/mL) of the protein-A eluate fraction of serum from active Graves’ disease (inverted, open diamonds) and control patients without Graves or thyroid disease (closed diamonds). Mean endothelial cell growth promoting activity in GD sera significantly exceeded activity in control sera. Bovine endothelial cells were incubated for four days in the presence of test fractions and % of basal activity was determined as described in Methods.

Table 1. Baseline characteristics in Graves’ disease patients and control participants.

Risk factor

Graves’ disease (N=18)

Systemic autoimmunity and normals (N=13)

P-value*

Age

46.4(13.0)

40.9(11.2)

0.25

Gender (M/F)

7/11

5/8

1.0**

GO+(N=9) GO- (N=9)

TSH (μIU/mL)

2.28(3.19) 0.12(0.10)

NT

0.09

TSI AB (%)

216 (91) 241(110)

NT

0.65

Anti-TPO AB (IU/mL)

1374(1449) 726(778)

NT

0.32

Anti-TG AB (IU/mL)

42(50) 97(111)

NT

0.35

Results are mean (SD); GO Graves orbitopathy, + present, -absent; M-male; F-female

TSH- thyroid stimulating hormone; TSI- thyroid stimulating immunoglobulin; TPO- thyroid peroxidase; TG- thyroglobulin; AB-antibody.

^ N = 6 normal participants, 3 rheumatoid arthritis, 1 systemic lupus erythematosus, 1 sarcoidosis, 1 polycystic ovarian syndrome, 1 Sjogren’s syndrome patient.

*T-test; ** Fischer’s exact test

Lack of association between EC activity in GD protein-A eluates and thyroid autoantibodies

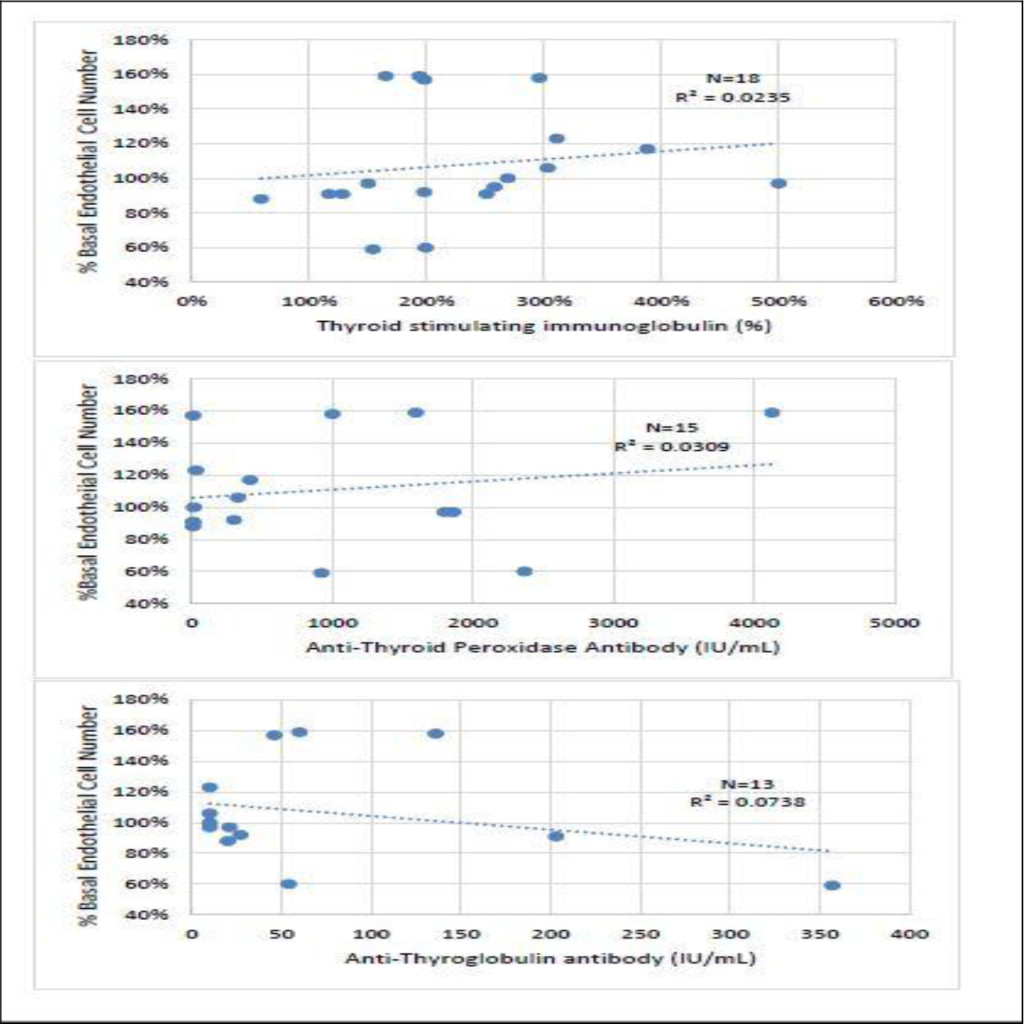
There was no significant correlation between thyroid stimulating immunoglobulin (TSI) level and endothelial cell growth activity in the protein-A eluates of all eighteen active GD sera (Fig 2A). There was no significant correlation between endothelial cell growth activity in the protein-A eluates of GD sera and either anti-thyroglobulin antibody (n = 13) or anti-thyroid peroxidase antibody (n = 15) level (Fig 2B, 2C). We next sought to characterize the endothelial cell growth stimulatory activity in the protein-A eluates of a subset of Graves’ disease orbitopathy patients presenting with contrasting subtypes of ophthalmopathy, i.e. infiltrative vs. fat- expansion type.

EDMJ - Mark B Zimering-F2

Figure 2. Correlation between endothelial cell growth promoting activity in the protein-A eluate of Graves’ disease serum and level of A) thyroid stimulating immunoglobulin, B) anti-thyroid peroxidase antibody or C) anti-thyroglobulin antibody. R2= [correlation coefficient].2

Endothelial cell activity in protein-A eluates of Graves’ disease having infiltrative vs. fat- expansion type orbitopathy

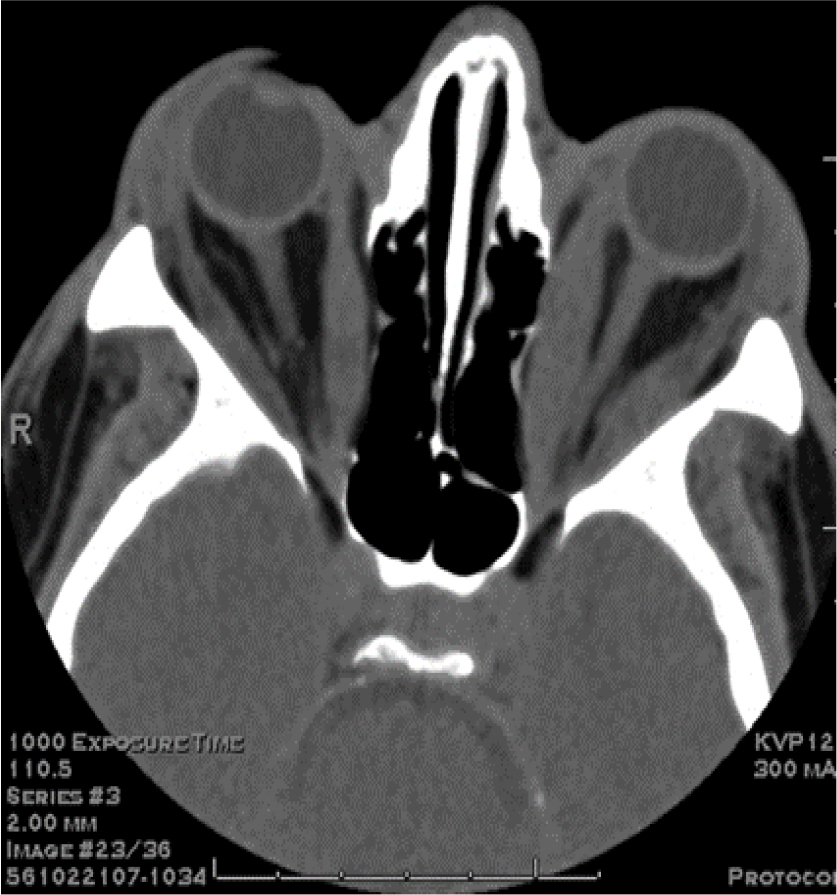
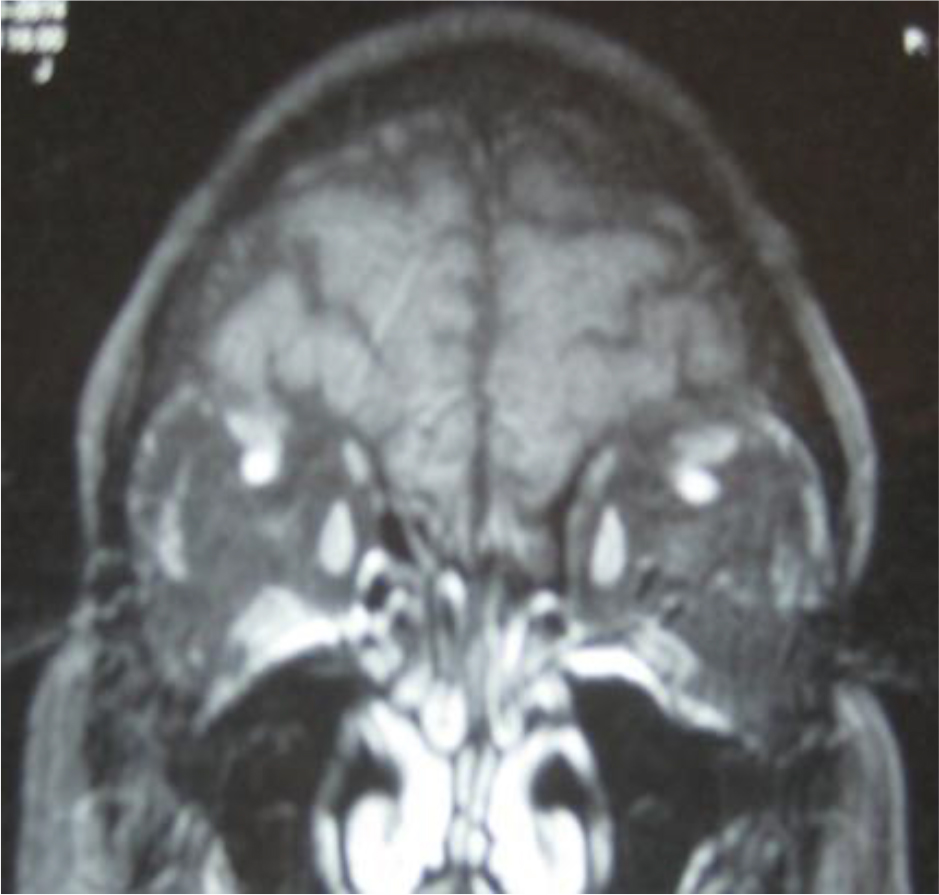
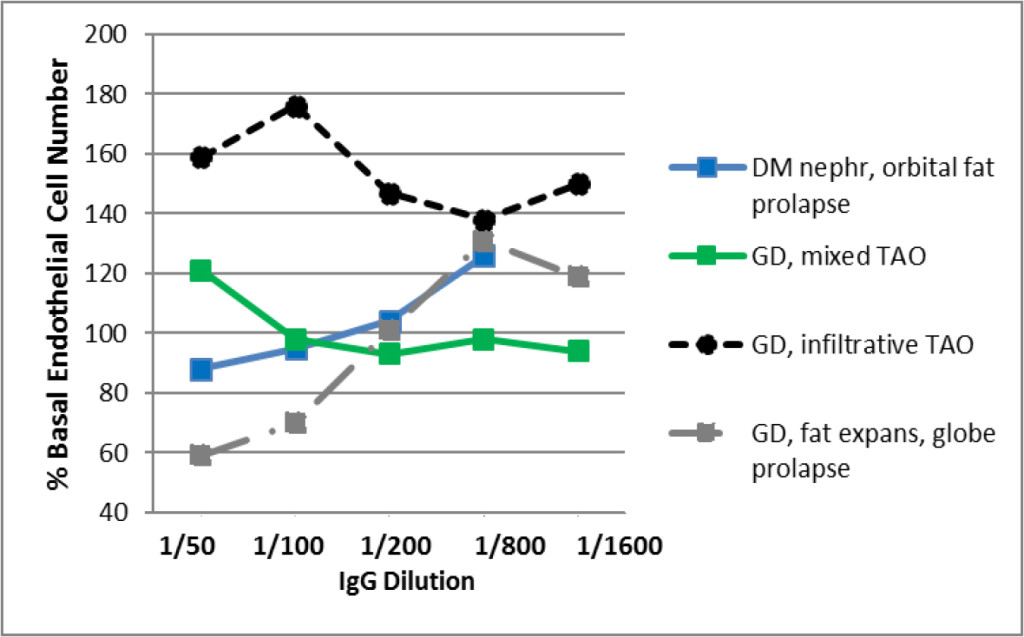
Active Graves’ disease manifesting with moderately-severe acute infiltrative TAO, i.e. GD1, was characterized by extraocular muscle enlargement with subtle fatty degeneration in the lateral rectus muscle (Fig 3A). The GD1 protein-A eluate fraction contained a high titer of endothelial cell stimulatory activity (dashed black line, Fig 3C). Active Graves’ disease presenting with globe prolapse, i.e. GD2, was characterized by severe orbital fat expansion (Fig 3B). The GD2 protein- A eluate contained a low-titer of endothelial cell inhibitory activity together with higher titer endothelial cell stimulatory IgG activity (GD Pt 2, dashed gray line, Fig 3C).

Patients who had experienced either long-standing infiltrative-type TAO (Pt 3) or orbital fat prolapse after receiving high-dose glucocorticoid therapy (Pt 4) were included as controls for the results in GD1 and GD2. The Pt 3, infiltrative-type TAO GD protein- A eluate contained a monophasic low titer of endothelial cell growth stimulatory activity (solid green line, Fig 3C), similar to GD1. The Pt 4, diabetic, orbital fat prolapse, protein- A eluate elicited biphasic endothelial cell- inhibitory and -stimulatory responses at low and higher titers, respectively (solid blue line, Fig 3C), similar to GD2.

A

EDMJ - Mark B Zimering-F3a

B

EDMJ - Mark B Zimering-F3b

C

EDMJ - Mark B Zimering-F3c

Figure 3. Contrasting infiltrative (A) and fat expansion (B) subtypes of thyroid associated ophthalmopathy and (C) corresponding dose-endothelial cell proliferation curves in protein-A eluates from patients having predominantly muscular hypertrophy or orbital fat expansion.

A) Computed tomography scan of the orbits (GD, Patient 1) showed bilateral proptosis, enlargement of the extraocular muscles sparing the tendons associated with fatty
degen­eration consistent with the clinical diagnosis of Graves ophthalmopathy. Optic nerves are within normal limits. B) Magnetic resonance imaging of the orbits (GD, Patient 2) revealed markedly increased retrobulbar fat bilaterally with resulting proptosis. The extraocular muscles and optic nerves were normal. Fat expansion caused complete loss of normal architecture of the orbit which together with shallow orbits predisposed to globe prolapse. C) Dose-endothelial cell proliferation curves of protein-A eluates in representative patients with Graves’ disease having infiltrative-type orbitopathy (GD 1), retrobulbar fat expansion-type (GD2), or mixed infiltrative and fat expansion type orbitopathy (Pt 3); and in a diabetic nephropathy patient who experienced bilateral retrobulbar fat enlargement and orbital fat prolapse (Pt 4). Each point represents the mean of quadruplicate determinations which varied by 5–15%. DM-diabetes mellitus, GD- Graves disease, TAO-thyroid associated ophthalmopathy, expans(ion).

Neutralization of EC bioactivity in GD with acute infiltrative TAO sera by anti-IGF1 receptor antibodies

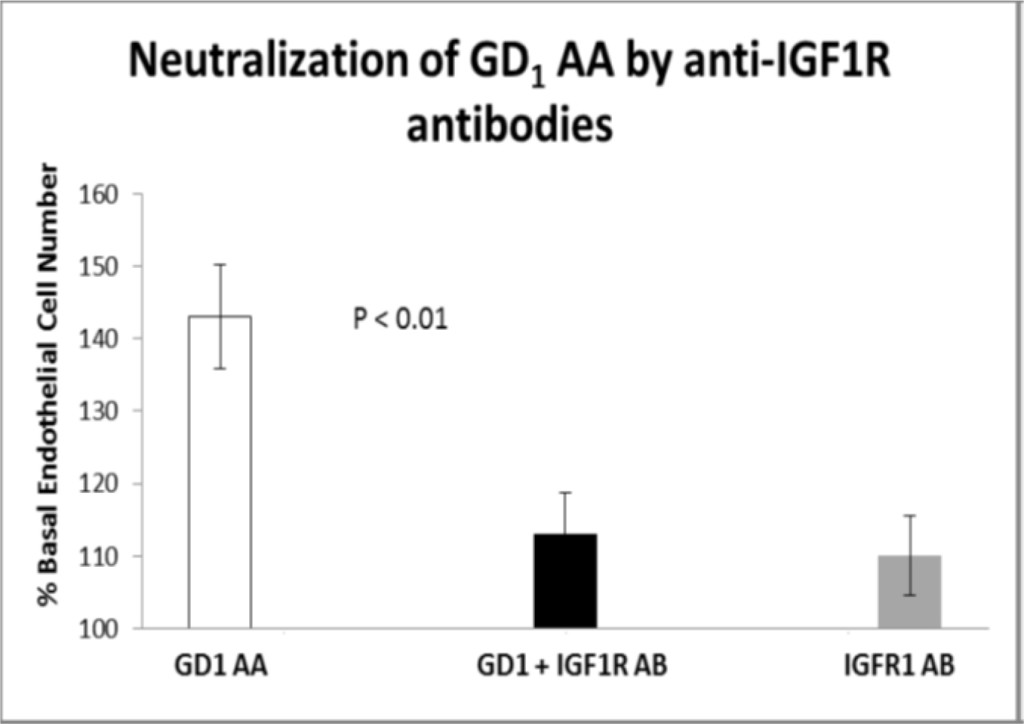
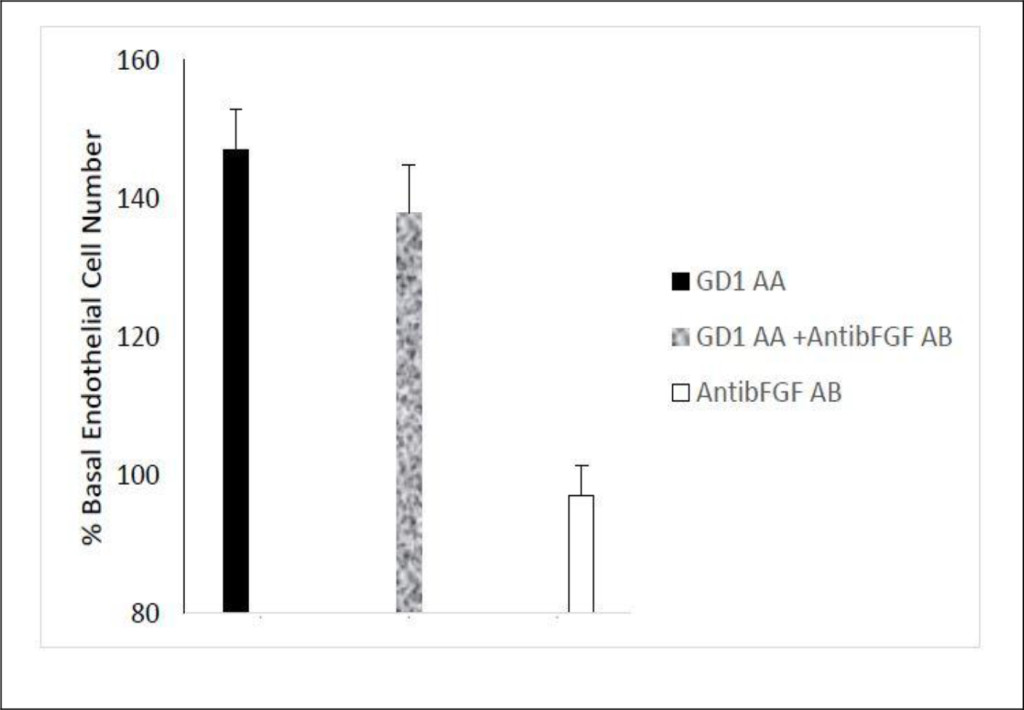
Peak endothelial cell stimulatory activity in the protein-A eluate from GD1 infiltrative-type TAO patient was significantly neutralized (P< 0.01)) (~67%) by co-incubation endothelial cells with a 5 µg/mL concentration of monoclonal anti-human insulin-like growth factor 1 receptor (IGF1R) antibodies (e.g. Pt 1; Fig 4A). Seventy to one-hundred percent neutralization of endothelial cell activity (mean 123%) was observed in the protein -A eluates in two additional GD patients (one each having mild GD orbitopathy or no orbitopathy) following co-incubation with (5 µg/mL) monoclonal anti- human IGF1R antibodies (data not shown in Fig 4). The anti-IGF1R antibodies alone had no significant effect on EC proliferation (Fig 4A). Endothelial cell stimulatory activity in the protein- A eluate of GD1 was not significantly affected by co-incubation with a 5 µg/mL concentration of specific anti-bovine basic fibroblast growth factor (bFGF) antibodies (Fig 4B).

A

EDMJ - Mark B Zimering-F4a

B

EDMJ - Mark B Zimering-F4b

Figure 4. Neutralization of GD1 infiltrative-type ophthalmopathy autoantibodies by specific insulin-like growth factor 1 receptor antibodies.

Neutralization of endothelial cell proliferative activity in A) GD1 protein-A eluate fraction by specific anti-insulin like growth factor 1 receptor antibodies. Similar results were observed in three Graves’ disease patients tested. B) Lack of effect of specific anti-bFGF antibodies on endothelial cell growth promotion by Graves’ disease protein-A eluate autoantibodies. A, B) Ten micrograms/mL concentrations of the protein-A eluate from Pt 1, Graves’ disease serum was incubated in the presence (black bar) or absence (open bar) of 5 µg/mL concentrations of anti- IGF1R antibodies (A) or 5 µg/mL concentrations of anti-bFGF antibodies (B). Each point represents the mean (+ SD) of quadruplicate determinations as described in Methods. AA-autoantibodies, IGF1R-insulin-like growth factor 1 receptor, GD1- Graves’ disease patient 1, AB-antibodies, AntibFGF AB- anti-basic fibroblast growth factor antibodies.

Neutralization of EC bioactivity in GD with retrobulbar fat expansion TAO sera by specific anti- bFGF antibodies

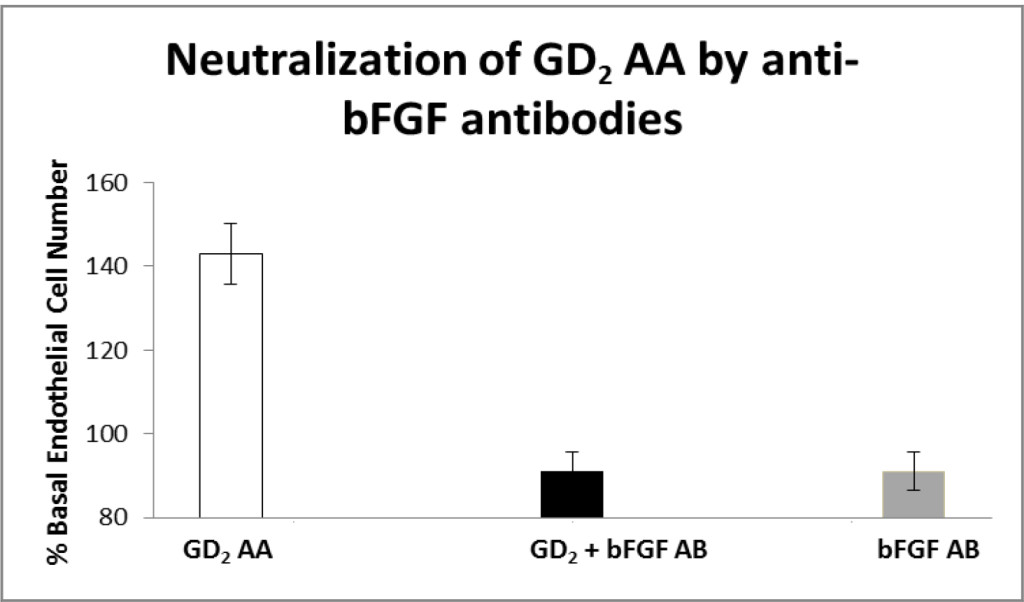
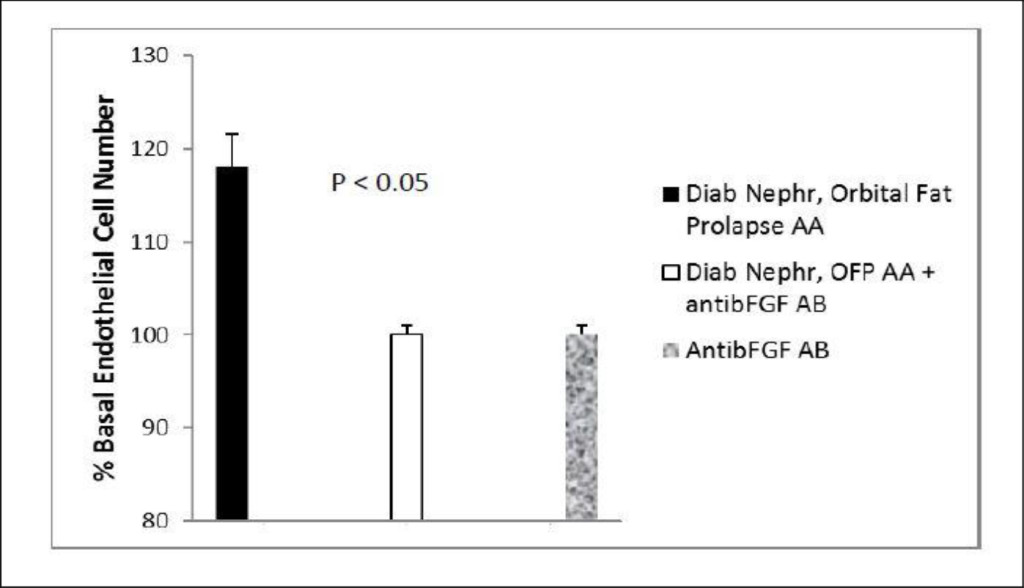
Peak EC stimulatory activity in the protein-A eluate from GD Patient 2 suffering globe prolapse was completely neutralized by co-incubation with 5 µg/mL anti-bovine basic fibroblast growth factor antibodies (Fig 5A). The anti-bFGF antibodies alone had no significant effect on endothelial cell proliferation (Fig 5A). Co-incubation with a 5 µg/mL concentration of monoclonal anti-human insulin-like growth factor 1 receptor antibodies had no significant effect on endothelial stimulatory activity in the GD Patient 2 protein-A eluate fraction (data not shown in Fig 5). Peak EC stimulatory activity in the protein- A eluate fraction in Pt 4 suffering orbital fat prolapse was completely neutralized following co-incubation with 5 µg/mL specific anti- bFGF antibodies (Fig 5B).

A

EDMJ - Mark B Zimering-F5a

B

EDMJ - Mark B Zimering-F5b

Figure 5. Neutralization of fat-expansion type ophthalmopathy autoantibodies by anti-basic fibroblast growth factor antibodies.

Neutralization of endothelial cell proliferative activity in A) GD2 protein- A eluate fraction or B) Pt 4 diabetic nephropathy, orbital fat prolapse patient’s protein- A eluate fraction by specific anti-bFGF antibodies. B) Two micrograms/mL concentrations of the protein-A eluate from GD, Pt 2 or Pt 4 serum was incubated in the presence (black bar) or absence (open bar) of 5 µg/mL concentrations of specific anti-bovine bFGF antibodies as described in Methods. Complete neutralization of endothelial cell growth stimulatory activity was observed in the protein-A eluates from GD2 and Pt 4 diabetic nephropathy patient suffering with idiopathic retrobulbar fat expansion and fat prolapse. Each point represents the mean (±SD) of quadruplicate determinations. GD2-Graves’ disease, Patient 2, Diab Neph(ropathy), OFP AA- orbital fat prolapse autoantibodies.

Discussion

The present data are the first to suggest increased circulating endothelial cell stimulatory autoantibodies in active Graves’ disease. Angiogenesis is a characteristic feature of the thyroid gland in Graves’ disease as evidenced by a characteristic “thyroid inferno” color Doppler flow sonography pattern [6] in Graves’ disease patient 2 in the present study. Goiter formation in the rat was accompanied by increased basic fibroblast growth factor expression in the thyroid follicular cells, stroma and endothelial cells as well as neovascularization [7]. Basic fibroblast growth factor (basic FGF) is a highly potent autocrine endothelial cell mitogen which lacks an amino terminal signal sequence needed for efficient secretion from cells [8]. Basic fibroblast growth factor does not normally circulate in healthy, nonpregnant adults [9, 10], however, plasma basic fibroblast growth factor immunoreactivity was increased in certain pituitary tumors, e.g. sporadic acromegaly [9] and in micro- or albuminuric diabetic nephropathy [11]. The occurrence of fibroblast growth factor-like autoantibodies in subsets of sporadic acromegaly [12] and in diabetic nephropathy [13] suggested a role for elevated insulin-like growth factor 1 [14] or chronic inflammation in enhanced autoantibody production [14] to circulating basic fibroblast growth factor or its receptors. The present data are the first to suggest that fibroblast growth factor-like autoantibodies in diabetic nephropathy suffering with co-morbid Graves’ disease or a different systemic autoimmune disease may be a driver of orbital fat expansion-type orbitopathy.

Prior reports suggested a possible local role for angiogenic factors such as basic fibroblast growth in promoting Graves’ orbitopathy. For example, basic fibroblast growth factor expression was increased in the orbital fibroblasts and adipocytes of patients suffering with severe Graves’ orbitopathy [15]. In addition, basic FGF acted synergistically with platelet derived growth factor in promoting orbital fibroblast production of hyaluronan and interleukin-6 [16]. Macrophages present in chronically- inflamed Graves’ orbital tissues [15] express a number of different angiogenic factors including basic FGF and insulin-like growth factor 1 [17]. Increased expression of insulin-like growth factor 1 receptor on T and B lymphocytes reported in Graves’ disease [4] may provide a mechanism for enhanced systemic autoimmunity to locally- or systemically-elaborated basic FGF via activation of the insulin-like growth factor 1 receptor on immune cells by subsets of circulating Graves’ disease immunoglobulins [18]. Although endothelial cell stimulatory autoantibody activity was not preferentially increased in a subset of Graves’ orbitopathy vs. Graves’ without orbitopathy in the present study, the sample sizes were small precluding a definitive conclusion.

In acute severe infiltrative Graves’ orbitopathy (GD patient 1), autoantibody-mediated endothelial cell stimulatory activity was neutralized (~67%) by specific anti-insulin-like growth factor 1 receptor antibodies, but was unaffected by specific anti-basic fibroblast growth factor antibodies. The autoantibody-mediated endothelial cell stimulatory activity in two of two additional newly-diagnosed Graves’ disease sera tested was also substantially or completely blocked by specific anti-insulin-like growth factor antibodies suggesting that fibroblast growth factor-like autoantibodies are not likely to play a significant role in early, active Graves’ disease patients lacking co-morbid diabetic nephropathy. Endothelial cell inhibitory autoantibody activity was largely absent in the protein-A eluates in seventeen of eighteen active Graves’ disease patients (Fig 1) consistent with a prior report of a low prevalence of anti-endothelial cell autoantibodies in thyroid autoimmunity patients having suppressed TSH [19]. Anti-endothelial cell autoantibodies were reported to occur at a (four-fold) significantly higher prevalence in thyroid autoimmunity patients having elevated TSH [19]. This may explain in part an increased occurrence of low-titer anti-endothelial cell autoantibodies in previously-treated, chronic Graves’ disease patients compared to newly-diagnosed Graves’ disease. In subsets of diabetic macular edema [20] and/or diabetic nephropathy [13] anti-endothelial cell autoantibodies targeted heparan sulfate proteoglycan, the low affinity FGF receptor, which is required for FGF-mediated endothelial cell survival and proliferation [21].

A possible dual role for endothelial cell inhibitory and fibroblast growth factor like stimulatory autoantibodies in promoting orbital fat expansion (in the setting of high-dose glucocorticoid therapy) is suggested by several observations. First, abrogation of basic fibroblast growth factor signaling (via knockout of the FGF2 gene in mice), promoted differentiation of bone marrow stromal cells into adipocytes [22]. Second, dexamethasone is known to promote adipocyte differentiation in pluripotent mesenchymal stem cells which have the potential to develop into osteoblasts or fat cells [23]. Third, basic fibroblast growth factor is a mitogen abundantly expressed in osteoblasts [24] and in preadipocytes [25], and in the latter cell type, basic fibroblast growth factor prevented adipocyte differentiation [25]. Taken together, fibroblast growth factor-like autoantibodies might drive expansion in a pool of precursor cells which later differentiate into fat cells under the dual influences of high-dose glucocorticoids and FGF- inhibitory autoantibodies. This proposed mechanism requires spatially- and temporally- independent actions by FGF-inhibitory and -stimulatory autoantibodies. Since FGF-like stimulatory, but not inhibitory autoantibodies displayed uniquely high affinity for hydroxyapatite which is a normal constituent of bone matrix [5] stimulatory autoantibodies might localize to a different region in the orbital- retro-orbital connective tissue space than soluble FGF-inhibitory autoantibodies.

The etiology of muscle enlargement in thyroid-associated ophthalmopathy is still a subject of debate with evidence supporting involvement of either TSH receptor autoantibodies and/or insulin-like growth factor 1 receptor autoantibodies [18]. A ten nanomolar concentration of insulin-like growth factor 1 was reported to cause an 80% increase in basal DNA synthesis in microvascular endothelial cells [26] and phosphorylation of the insulin-like growth factor 1 receptor in macrovascular endothelial cells [27]. Thus a subset of Graves’ disease IgG autoantibodies having specificity for the insulin-like growth factor 1 receptor may have accounted (in part) for the significant endothelial cell proliferation we observed here in a subset of newly-diagnosed Graves’ disease patients with infiltrative-type orbitopathy.

In summary, these data are the first to suggest a possible association between fibroblast growth factor-like stimulatory autoantibodies and subsets of orbital fat-expansion/fat prolapse in patients with Graves’ disease, diabetes and focal segmental glomerulosclerosis or in diabetes having a different systemic autoimmune co-morbid condition which also required treatment with high-dose glucocorticoids. More study is needed to determine whether coexisting endothelial cell inhibitory and stimulatory autoantibodies in Graves’ disease serum may be a useful biomarker for an increased risk of fat expansion- type orbitopathy following high-dose glucocorticoid therapy.

Acknowledgement

Presented in part at the 92nd Annual Meeting of the Endocrine Society, Boston, MA. June 4, 2011. We thank Terry J. Smith, MD for his valuable contributions to an earlier draft of the manuscript.

The authors report no multiplicity of interest affecting the objectivity of the presented findings. Supported in part by a grant from the Veterans Biomedical Research Institute, East Orange, New Jersey, USA to MBZ.

Abbreviations

BPA – Bovine Pulmonary Artery

EC – Endothelial Cells

FCS – Fetal Calf Serum

FGF2 – Fibroblast Growth Factor 2

bFGF – basic Fibroblast Growth Factor

FSGS – Focal Segmental Glomerulosclerosis

GD – Graves’ Disease

IGF1 – Insulin–Like Growth Factor 1

IGF1R – Insulin–Like Growth Factor 1 Receptor

M199 – Medium 199

TAO – Thyroid Associated Ophthalmopathy

T3 – Triiodothyronine IgG-Immunoglobulin G

References

  1. Hiromatsu Y, Eguchi H, Tani J, Kasaoka M, Teshima Y (2014) Graves’ ophthalmopathy: epidemiology and natural history. Intern Med 53: 353–360. [crossref]
  2. Tsui S, Naik V, Hoa N (2008) Evidence for an association between thyroid-stimulating hormone and insulin-like growth factor 1 receptors: a tale of two antigens implicated in Graves’ disease. J Immunol 181: 4397–4405.
  3. Smith TJ, Hegedüs L, Douglas RS (2012) Role of insulin-like growth factor-1 (IGF-1) pathway in the pathogenesis of Graves’ orbitopathy. Best Pract Res Clin Endocrinol Metab 26: 291–302. [crossref]
  4. Douglas RS, Naik V, Hwang (2008) CJ B cells from patients with Graves’ disease aberrantly express the IGF-1 receptor: implications for disease pathogenesis. J Immunol 181: 5768–5774.
  5. Zimering MB, Thakker-Varia S (2002) Increased fibroblast growth factor-like autoantibodies in serum from a subset of patients with cancer-associated hypercalcemia. Life Sci 71: 2939–2959.
  6. Ralls PW, Mayekawa DS, Lee KP, Colletti PM, Radin DR, et al. (1988) Color-flow Doppler sonography in Graves disease: “thyroid inferno”. AJR Am J Roentgenol 150: 781–784. [crossref]
  7. Patel VA, Hill DJ, Eggo MC, Sheppard MC, Becks GP, et al. (1996) Changes in the immunohistochemical localisation of fibroblast growth factor-2, transforming growth factor-beta 1 and thrombospondin-1 are associated with early angiogenic events in the hyperplastic rat thyroid. J Endocrinol 148: 485–499. [crossref]
  8. Abraham JA, Mergia A, Whang JL (1986) Nucleotide sequence of a bovine clone encoding the angiogenic protein, basic fibroblast growth factor. Science 233: 545–548.
  9. Zimering MB, Katsumata N, Sato Y, Brandi ML, Aurbach GD, et al. (1993) Increased basic fibroblast growth factor in plasma from multiple endocrine neoplasia type 1: relation to pituitary tumor. J Clin Endocrinol Metab. 76: 1182–1187.
  10. Hill DJ, Tevaarwerk GJ, Caddell C, Arany E, Kilkenny D, et al. (1995) Fibroblast growth factor 2 is elevated in term maternal and cord serum and amniotic fluid in pregnancies complicated by diabetes: relationship to fetal and placental size. J Clin Endocrinol Metab 80: 2626–2632. [crossref]
  11. Zimering MB, Eng J (1996) Increased basic fibroblast growth factor-like substance in plasma from a subset of middle-aged or elderly male diabetic patients with microalbuminuria or proteinuria. J Clin Endocrinol Metab 81: 4446–4452. [crossref]
  12. Zimering MB, Katsumata N, Friesen HG (1997) Fibroblast growth factor-like autoantibodies in plasma from patients with multiple endocrine neoplasia type 1 and prolactinoma. In, B Lymphocytes and Autoimmunity Ann NY Acad of Sciences 815: 520–524.
  13. Zimering MB, Zhang JH, Guarino PD, Emanuele N, McCullough PA, et al. (2014) Investigators for the VA NEPHRON-D. Endothelial cell autoantibodies in predicting declining renal function, end-stage renal disease, or death in adult type 2 diabetic nephropathy. Front Endocrinol (Lausanne) 5: 128.
  14. Robbins K, McCabe S, Scheiner T, Strasser J, Clark R, et al. (1994) Immunological effects of insulin-like growth factor-I–enhancement of immunoglobulin synthesis. Clin Exp Immunol 95: 337–342. [crossref]
  15. Pawlowski P, Reszec J, Eckstein A (2014) Markers of inflammation and fibrosis in the orbital fat/connective tissue of patients with Graves’ orbitopathy: clinical implications. Mediators Inflamm 412158.
  16. Virakul S, Heutz JW, Dalm VA (2016) Basic FGF and PDGF-BB synergistically stimulate hyaluronan and IL-6 production by orbital fibroblasts. Mol Cell Endocrinol 433: 94–104.
  17. Sunderkötter C, Goebeler M, Schulze-Osthoff K, Bhardwaj R, Sorg C (1991) Macrophage-derived angiogenesis factors. Pharmacol Ther 51: 195–216.
  18. Smith TJ (2003) The putative role of fibroblasts in the pathogenesis of Graves’ disease: evidence for the involvement of the insulin-like growth factor-1 receptor in fibroblast activation. Autoimmunity 36: 409–415.
  19. Wangel AG, Kontiainen S, Melamies L, Weber T (1993) Hypothyroidism and anti-endothelial cell antibodies. APMIS 101: 91–94. [crossref]
  20. Zimering MB, Anderson RJ, Moritz TE, Ge L (2009) Investigators for the VADT. Endothelial cell inhibitory autoantibodies are associated with laser photocoagulation in adults from the Veterans Affairs Diabetes Trial. Metabolism 58: 882–887.
  21. Zimering MB, Pan Z (2009) Autoantibodies in type 2 diabetes induce stress fiber formation and apoptosis in endothelial cells. J Clin Endocrinol Metab 94: 2171–2177.
  22. Xiao L, Sobue T, Esliger A, Kronenberg MS, Coffin JD, et al. (2010) Disruption of the Fgf2 gene activates the adipogenic and suppresses the osteogenic program in mesenchymal marrow stromal stem cells. Bone 47: 360–370. 360–370. [crossref]
  23. Q Chen, P Shou, C Zheng, M Jiang, G Cao, et al. (2016) Fate decision of mesenchymal stem cells: adipocytes or osteoblasts? Cell Death Differ 23: 1128–1139.
  24. Marie PJ (2012) Fibroblast growth factor signaling controlling bone formation: an update. Gene 498: 1–4. [crossref]
  25. Teichert-Kuliszewska K, Hamilton BS, Deitel M, Roncari DA (1994) Decreasing expression of a gene encoding a protein related to basic fibroblast growth factor during differentiation of human preadipocytes. Biochem Cell Biol 72: 54–57.
  26. Bäck K, Islam R, Johansson GS, Chisalita SI, Arnqvist HJ (2012) Insulin and IGF1 receptors in human cardiac microvascular endothelial cells: metabolic, mitogenic and anti-inflammatory effects. J Endocrinol 215: 89–96.
  27. Chisalita SI, Arnqvist HJ (2004) Insulin-like growth factor I receptors are more abundant than insulin receptors in human micro- and macrovascular endothelial cells. Am J Physiol Endocrinol Metab 286: 896–901.

Best and Effective Practices of Wound Care and Healing Among Patients with Diabetes Mellitus

DOI: 10.31038/EDMJ.2019312

Abstract

Aim: With the continuing trend in the incidence of diabetic ulcer, current researches from evidence-based practice augment best and effective practices on wound care and healing among patients suffering from diabetes mellitus.

Methods: This study utilized a systematic review of literatures in light of wound care through Pub Med database with the key words “Diabetes Mellitus,” “wound practices,” “wound healing,” and “systematic review.” The searched literatures were of case reports, interventional studies, and review papers whose main texts were in English.

Results: There were 7,988 published articles yielded from the keywords used and 16 were included in this study. The practiced management and techniques in these literatures focused on comfortable and cost efficient means of wound care and healing with the involvement of group participation than individual plan of care.

Conclusions: There are meager evidences for vigorous wound and healing options that needs further studies in resolving wound issues among patients with Diabetes Mellitus. This systematic review establishes the insufficiency of high level of evidence based studies on wound healing in DM patients and brings a track for continuity of rigid studies concerning this topic.

Implications for Nursing Practice and/or Health Policy: Understanding innovative wound care is the chance for nursing professionals to associate evidence, expert opinion and patients’ preference for a best and effective practices of wound care and healing and thus eventually make them a step above their skills. The evolution of different treatment regimens like hyperbaric O2 therapy, TCOT device, natural latex associated with the LED circuit, low-level laser therapy, PRP treatment, salt-based spray, Telemedicine follow up, cord platelet gel application, Human Reticular Acellular Dermal Matrix, and acellular reticular allogenic human dermis will not only aid in the management of wound care and healing but also in strengthening the comprehensive and practical skills among nurses.

Keywords

Diabetes Mellitus, Systematic Review, Wound Care and Practices, Wound Healing

Introduction

Wounds are commonly categorized as chronic or acute and could rise from any traumatic damage or through a collapse of an unharmed skin [1]. Healthy people have strong skin integrity with a significant ability for healing but can be exposed to outer and inner harm brought about by older age and changed in physiology [2]. This can be intrinsic or extrinsic in nature. In people suffering from diabetes, healing of lesions is slow but progresses faster. It is therefore essential to understand diabetes and appropriate wound care along with the complexities of wound management and understanding for a better life and longevity. The incidence of diabetes is escalating faster in the countries of middle and low revenues and in 2014; a global data of 8.5% came from people aging 18 years old and above [3]. But the occurrence of diabetic foot ulcers is within 4% and 10% with 1:4 threat of having diabetic foot ulcer in their life [4].

Although minor injuries like burns, abrasions and lesions are normal accidents; these can bring severe medical concerns to people with diabetes [5]. Local infection can extend fast to the internal parts of the body and can be fatal. Studies suggests that curing of wounds is affected by: weakening in producing hormones related with development and therapy, decreasing in producing and repairing of new blood vessels, weakening of skin protection, and decreasing in the production of collagen [5]. There are recent studies that can help in bringing effective management of wound care among patients with diabetes. These are helpful practices that can save limbs for amputation.

This review is an investigation on the efficacy of different practices of healthcare professionals in the conduct of wound care and healing among patients suffering from diabetes. It has unveiled comfortable management of diabetic wounds as well as hopes to patients with DM to salvage their limbs. It is with the same reason why the author conducted this review. Results stated different practices and effects and there is a solid reason for more evidence-based studies that will heighten the rate of wound healing and introduce patients with DM easy to carry out wound care and practices. This study commenced to explore the different practices in wound care for patients with diabetes using systematic review of published evidence-based studies on wound management in diabetes.

Methods

The research composition of this systematic review to unveil different practices on wound care and healing among patients with diabetes mellitus. Pub Med database was searched for relevant literatures through keywords “Diabetes Mellitus,” “wound practices,” “wound healing,” and “systematic review.” It was piloted on November 1, 2018 and focused the search on case reports, interventional studies, and review papers written in English language. The focus of the search is practices and wound care that would lead to wound healing. Yielded published articles were systematically evaluated based on the country of the author, year the article is published, site of the study, method and design of the study, management team, and the results. Prior synthesis, data is extracted via two reviewers and reviewed for accuracy by another reviewer. Inconsistencies are being identified for illegibility and consensus while recognizing ineligibles based on the criteria.

Results

With the use of keywords yielded 7,988 published articles on wound management among patients with DM but only 16 fulfilled the criteria set in this study for review. Relevant data is summarized in (Table 1).

Table 1.Physiognomies of Selected Studies: Best and Effective Practices of Wound Care and Healing Among Diabetic Patients.

Author; year published; title of the study

Sample; wound type

Study design

Team composition

Intervention and period of coverage

Primary Outcome

Major results

Chang (2018)

274, Diabetic foot

Single-center retrospective study

Surgeon

Patient evaluation, wound preparation, improving vascularity, surgery and dressing, and rehabilitation

2005–20017

Infection and arterial occlusion

Improved vascularity

Chen et al. (2017)

38, Chronic diabetic foot ulcer

Randomized controlled trial

Doctor, nurse

Intervention group receives standard care and HBOT while control group receives standard care only.

20 days

Wound closure

Improved wound healing

Crews & Candela (2018)

25, Diabetic foot ulcer

Randomized controlled trial

Doctor, PT

Patients at risk for DFU’s with removable cast walkers in 20 mins walking trials using 5 footwear conditions

Bilateral shoes brought better comfort

Ankle-high removable cast walker combined with contralateral limb lift increases offloading and improve healing

Driver (2017)

130, Foot ulcer

A prospective, randomized, blinded, multicenter, parallel study

Not mentioned

TCOT device given to intervention groups following assessment and standard care while the control group received the sham device following standard care.

12 weeks treatment

Good wound results in both groups

Beneficial to older population

Eraydin & Avsar (2018)

65, Diabetic foot ulcer

Randomized control trial

Nurses

Intervention group given standard wound care and foot exercises for 12 weeks while the control group had standard wound care with no exercise

12 weeks

Difference in the ulcer areas in the two groups

Significant decrease of ulcer area in the intervention group.

Health Quality Ontario (2017)

8; Ulcer

7 randomized controlled trials, 1 nonrandomized controlled trial

Experts, end users, and applicants

Review and assessment of studies concerning efficacy and cost effectiveness of HBOT utilizing the standpoint of the Ministry of Health and Long-Term Care and assessed the clinical evidence with the use of GRADE.

Mixed results on standard of care in rates of amputation while there is impact on standard care and HBOT and no difference on the adverse events on both.

Satisfaction on patients using HBOT and positive perceptions on healing

Lopez-Delis (2018)

15, Lower limb ulcer

Randomized controlled trial

Nurses, patients

Group 1: recipients of dressing system adhesive of the natural latex associated with the LED circuit.

Group 2: recipients of dressing at home with calcium alginate or silver foam

Group 3: recipients of dressing at home with adhesive derived from the natural latex associated with the LED circuit.

1 month

Significant decrease in ROS formation

Latex and phototherapy brought better debridement and healing process

Mathur et al. (2017)

30, Grade 1 foot ulcer

Randomized clinical trial

Doctors, Nurses

Intervention group received low-level laser therapy with conventional therapy while control group only received conventional therapy

6 weeks

absolute and relative wound size reduction at 2 weeks compared to the baseline parameter.

results suggest that LLLT is beneficial as an adjunct to conventional therapy in the treatment of diabetic foot ulcers.

Mohammadi,et al. (2017)

100 Diabetic foot ulcer

A single-arm clinical trial

Doctor,

nurses

Weekly PRP treatment following primary wound care

Significant decrease of the area of wound

Platelet-rich plasma gel as treatment for non-healing DFU

Park et al. (2018)

167 Diabetic foot ulcer

A phase III multicenter, double-blind, randomized, placebo-controlled trial

nurses

Routine wound care and topical or spray of saline with 0.005% rhEGF (n=82) or (n=85) twice a day

12 weeks

Comparable results between placebo groups and the rhGF groups

Faster healing velocity and higher complete healing rate regardless of HbA1c levels.

Pougatsch (2017)

10, Diabetic foot ulcer

Prospective, case-cohort study,

Pilot study

Not mentioned

Used acceptable methods of cleansing and the use of salt-based spray then gauze sponges soaked with the spray is used to dress the ulcer and then covered with dry foam or gauze and wrap with ACE.

12 weeks

Wound closure

Viable natural wound care therapy

Santema et al. (2018)

120 Ischemic wound

DAMO2CLES multicenter randomized clinical trial

Not specified

40 sessions of HBOT was used for five days weekly or till complete wound healing was reached

One month

Limb salvage and

wound healing

Freedom from any amputation

Smith-Strøm et al. (2018)

165, Diabetic foot ulcer

cluster-randomized controlled non-inferiority trial

Doctors,

Healthcare personnel,

Community nurses

Intervention group utilized TM follow-up care in the community while the control group received SOC.

2012–2016

Faster Healing time

Technology as relevant alternative to wound care

Volpe et al. (2017)

20 Diabetic wound

Non-blinded, consecutive series, randomized clinical trial

Nurses

Surgeons

Group A is managed with standard wound care while Group B is managed with topical application of CBPG consisted of platelet gel application 2 times a week in 4 weeks and then once a week for an additional 4 weeks.

2 months

Ulcer reduction

Rapid healing than standard technique

Zelen et al. (2017)

20, Diabetic foot

A retrospective crossover study

Not mentioned

Indolent DFUs are given acellular matrices

12 weeks

12 out of 20 were eligible for crossover treatment

Complete healing achieved

Zelen et al. (2017)

40, Chronic diabetic ulcer

A prospective, randomized, controlled, multi-centre

clinical study

Doctor

Nurse

SOC group receives dressing change daily combined with collagen alginate while

HR-ADM group received grafts.

12 weeks

Healing proportion of wounds in 6 weeks.

Clinical superiority of HR-ADM and considered cost effective

Country and Year of Publication

The selected studies were authored by researchers from Finland (2), Netherlands (2), Korea (2), USA (2), Italy (1), Norway (1), Iran (1), India (1), Brazil (1), Canada (1), Turkey (1), and Taiwan (1). These are written in English and were published from 2017–2018. Therefore, the papers used for review were recent and current as these are being published in a year time.

Sample

Only four of the 16 studies are of small sample (8, 10, 15, 20, and 20 cases). Most of the selected studies were of large sample (25, 30, 38, 40, 65, 100, 120, 130, 165, 167, and 274 cases correspondingly) resulting to a mean of 105 cases (SD: 77 cases). The kinds of wounds were specified in all cases and the leading type was diabetic foot ulcer.

Study Design

Five (5) studies used randomized control trials (RCTs). Others were combination of designs like: two (2) utilized retrospective study where one is a single centered while the other one is a cross-over; three (3) are prospective studies where one is randomized, blinded, multicenter, and parallel study, the second is prospective, case-cohort study, and a Pilot study, and the third is prospective, randomized, controlled, multi-center clinical study. One (1) study used 7 randomized controlled trials and 1 nonrandomized controlled trial. Others studies are: one (1) single-arm clinical trial; one (1) phase III multicenter, double-blind, randomized, placebo-controlled trial; one (1) DAMO2CLES multicenter randomized clinical trial; one (1) cluster-randomized controlled non-inferiority trial; and one (1) Non-blinded, consecutive series, randomized clinical trial.

Management Team

Included studies were mostly composed of nurses and doctors. One had collaboration with experts, end users, and applicants. Two of the studies did not identify the composition of the healthcare team while another two studies included surgeons. There is no mention of inclusion of podiatry and orthotic studies

Intervention

Selected studies utilized both intervention and control groups where the control groups are given standard wound care following evaluation and rigid assessment. Some studies incorporate exercises while other studies add follow up care. The intervention groups are also given standard wound care and additional management that includes like hyperbaric O2 therapy (HBOT), transdermal continuous oxygen therapy (TCOT) device, natural latex associated with the LED circuit, low-level laser therapy, PRP treatment, salt-based spray, Telemedicine follow up, cord platelet gel application, Human Reticular Acellular Dermal Matrix, and acellular reticular allogenic human dermis. The identified interventions are of usual units of weeks.

Primary Outcome

Primary outcomes are of diverse occurrence. There is infection and arterial occlusion in improving vascularity, surgery, and rehabilitation as resulted in the single-center retrospective study of Chang [6]. In the use of HBOT, there is wound closure in the RCT of Chen et al., [7] utilizing HBOT while satisfaction and positive insights on healing is the result of 7 randomized controlled trials, 1 nonrandomized controlled trial by Health Quality Ontario [8] with primary outcomes of mixed results on standard of care in rates of amputation whereas there is impact on standard care and HBOT and no difference on the adverse events on both. The use of 5 footwear conditions as brought about by RCT of Crews and Candela [9] resulted to comfort from bilateral shoes. Santema et al. [10] used 40 sessions of HBOT five days a week or until complete wound healing was reached for limb salvage and wound healing.

TCOT on the other hand is used in intervention group in the prospective, randomized, blinded, multicenter, parallel study of Driver [11] brought no difference with the controlled group utilizing standard care. But in the RCT of Eraydin & Avsar [12] in the RCT, there is difference in the ulcer areas in the two groups where the intervention group is given standard wound care and foot exercises for 12 weeks while the control group had standard wound care with no exercise. The first elicited better wound area. The RTC of Lopez-Delis [13] used three groups for dressing. Group 1 is with natural latex related with LED circuit, group 2 is with calcium alginate or silver foam, and group 3 is with adhesive derived from the natural latex associated with the LED circuit. The primary outcome is significant decrease in reactive oxygen species (ROS) formation. Regarding laser therapy, RTC of Mathur et al. [14] brought out absolute and relative wound size reduction at 2 weeks compared to the baseline parameter where the intervention group had low-level laser therapy along with conventional therapy while control group only had conventional therapy. Another literature used Platelet-rich plasma (PRP) gel in the management of diabetic foot ulcer and Mohammadi, et al. [15] used a single-arm trial through weekly treatment after primary wound care and resulted primarily with significant decrease of the area of wound.

Comparable results between placebo groups and the recombinant human epidermal growth factor (rhGF) groups in the phase III multicenter, double-blind, randomized, placebo-controlled trial of Park et al [16] where routine wound care and topical or spray of saline with 0.005% rhEGF is used two times a day. This means a faster healing velocity. Pougatsch [17] made a pilot study using acceptable methods of cleansing combined with salt-based spray then gauze sponges soaked with the spray to dress the ulcer and then covered with dry foam or gauze and wrap with ACE to bring a wound closure. Volpe et al. [18] used three groups for a non-blinded, consecutive series, randomized clinical trial where Group A is managed with standard wound care while Group B is managed with topical application of CBPG consisted of platelet gel application 2 times a week in 4 weeks and then once a week for an additional 4 weeks. The primary outcome resulted to ulcer area reduction. There is a faster healing time in the cluster-randomized controlled non-inferiority trial of Smith-Strøm et al. [19] using TM follow-up care in the community while control group received SOC. Zelen et al. [20, 21] made 2 studies. First is a retrospective crossover study where Indolent DFUs are given acellular matrices and 12 out of 20 were eligible for crossover treatment and a prospective, randomized, controlled, multi-centre clinical study using daily dressing change that is combined with collagen alginate while HR-ADM group received grafts for healing proportion of wounds. All these are suggestive of wound healing and limb improvement with regards to appearance and function.

Discussion

With the aim of the study to bring out evidence based practice on wound care and healing, systematic review was undertaken. The key words “Diabetes Mellitus,” “wound practices,” “wound healing,” and “systematic review” yielded articles focused on the comfort and efficiency of patients with the identified and utilized practices on wound care and healing. The researchers explored case reports, interventional studies, and review papers written in the English language. Extracted data includes name and country of the author, year the article is published, site of the study, method and design of the study, management team, and the results. The studies were reviewed by two reviewers and the third reviewer checked and identified inconsistencies based on the set criteria. Therefore, the search was carried out systematically well.

The studies were reviewed by two reviewers and the third reviewer checked and identified inconsistencies based on the set criteria. Therefore, the search was carried out systematically well. The setting of the studies selected for review is of diverse origin. Two studies came from Finland, Netherlands, Korea, and USA respectively while one study came from the countries; Italy, Norway, Iran, India, India, Brazil, Canada, Turkey, and Taiwan. These are published from 2017–2018. With the evolution of research in the medical arena today, evolution of treatment will come next. As diabetes is the medical condition, wound healing becomes a problem. Wound types among the selected literatures are of diabetic ulcer. The study consists of large sample with a mean of 105 cases (SD: 77). This suggests validity and reliability. There are 5 studies of randomized control trials while other studies mixed their designs.

There are 3 prospective studies; first, a randomized, blinded, multicenter, and parallel study, the second is prospective, case-cohort study, and a Pilot study, and the third is prospective, randomized, controlled, multi-center clinical study. One of the selected study utilized 7 randomized controlled trials and 1 nonrandomized controlled trial. Other methods and designs used: single-arm clinical trial; phase III multicenter, double-blind, randomized, placebo-controlled trial; DAMO2CLES multicenter randomized clinical trial; cluster-randomized controlled non-inferiority trial; and non-blinded, consecutive series, randomized clinical trial. The dates of publication considered for inclusion are from studies published from 2017–2018. This means that the current and newest practices on wound care and healing are collated for review and these were based from the past practices that gained the reputation of healing and care. Most of the studies are published in journals.

In the study, the compositions of the teams who carried out the intervention are mostly doctors and nurses. One study collaborated with experts, end users, and applicants while two of the studies did not pinpoint the composition of the team while another two studies included surgeons. Regarding identified management, there is an intervention group and the control group where the former use additional treatment regime after the standard wound assessment and care while the later receives the conventional or traditional standard care and assessment alone.

In the study, the compositions of the teams who carried out the intervention are mostly doctors and nurses. One study collaborated with experts, end users, and applicants while two of the studies did not pinpoint the composition of the team while another two studies included surgeons. Regarding identified management, there is an intervention group and the control group where the former use additional treatment regime after the standard wound assessment and care while the later receives the conventional or traditional standard care and assessment alone.

The said intervention group received HBOT, TCOT device, natural latex associated with the LED circuit, low-level laser therapy, PRP treatment, salt-based spray, Telemedicine follow up, cord platelet gel application, Human Reticular Acellular Dermal Matrix, and acellular reticular allogenic human dermis simultaneously. This brought relative results to wound healing. It also heightened healthcare practice to a more evolved and acceptable treatment level of comfort and healing. Also, the identified regimen is of faster time treatment with the usual unit, weeks. Although the identified practices are of varieties, these are of the same results. It brought comfort and it brought healing faster than the traditional care and assessment alone. The data suggests the same dilemma of patients in different places with regards to wound/ulcer healing. One researcher is as engaged as the other to promote skin integrity and wound healing. And since the studies are of recent evidences and breakthroughs, wound healing is empowered to bring patients with diabetes better physicality and grip of hope against diabetic ulcer. Therefore, as per data suggests there is relative reduction of wound size.

Implications for Nursing and Health Policy

Understanding innovative wound care is the chance for nursing professionals to associate evidence, expert opinion and patients’ preference for a best and effective practices of wound care and healing and thus eventually give them a step above their skills. The evolution of nurses’ role in wound care contributed to bridge the need for specialist wound care guidance and globally, this role evolved to bring varieties of labels [22]. With the continuum of evidence-based studies empowered with technologies and other breakthroughs, nurses can improve their skills and hasten their knowledge for effective diabetic wound care. The influence of evidence-based practice and technology resonated through nursing practice, learning, and teachings patients’ self-care.

 Duttob, Chiarella & Curtis [22] discussed that there are claims directing to nurses contributory services resulting to improvement of patient care although it was hard to produce data concerning their impact on wound care but some researches direct to that bearing. Being part of the multidisciplinary team, nurses gain better skills and efficacy. Wounds International [23] in the article entitled, “International Best Practice Guidelines: Wound Management in Diabetic Foot Ulcers appraised the recommendations of the International Diabetes Foundation concerning the expert foot care group in including physicians having distinct attention in diabetes, individuals with informative skills, and individuals having recognized preparation in foot care. Comprehensively, this will be augmented by other specialists in the medical arena and soon, there will be improvement in the nursing practice along with the policies that strengthen it.

Acknowledgment

Engaging inspiration from those who helped in this review and the great minds in the medical research that never stop to give light on better management…

References

  1. Armstrong D, Meyr A (2018) Up To Date. [online] Uptodate.com. Available at: https: //www.uptodate.com/contents/basic-principles-of-wound-healing [Accessed 23 Nov. 2018].
  2. Moncrieff G, Van Onselen J, and Young T (2015) The role of emollients in maintaining skin integrity. Wounds UK 11: 68–74.
  3. World Health Organization (2018) Diabetes. [online] Available at: http: //www.who.int/news-room/fact-sheets/detail/diabetes [Accessed 23 Nov. 2018].
  4. World Union of Wound Healing Societies, Florence Congress, Position Document. Management of Biofilm. Wounds International 2016.
  5. Villines Z (2018) Diabetes and wound healing: What to know [Internet]. Medical News Today. MediLexicon International; 2018 [cited 2018Nov17]. Available from: https: //www.medicalnewstoday.com/articles/320739.php
  6. Chang JW, Heo W, Choi MSS, Lee JH (2018) The appropriate management algorithm for diabetic foot: A single-center retrospective study over 12 years. Medicine (Baltimore) 97: 11454. [crossref]
  7. Chen CY (2017) Adjunctive Hyperbaric Oxygen Therapy for Healing of Chronic Diabetic Foot Ulcers: A Randomized Controlled Trial. J Wound Ostomy Continence Nurs 44: 536–554.
  8. Health Quality Ontario (2017) Hyperbaric oxygen therapy for the treatment of diabetic foot ulcers: a health technology assessment. Ont Health Technol Assess Ser 17: 1–142.
  9. Crews RT, Candela J (2018) Decreasing an Offloading Device’s Size and Offsetting Its Imposed Limb-Length Discrepancy Lead to Improved Comfort and Gait. Diabetes Care 41: 1400–1405. [crossref]
  10. Santema K (2018) Hyperbaric oxygen therapy in the treatment of ischemic lower-extremity ulcers in patients with diabetes: results of the DAMO2CLES Multicenter Randomized Clinical Trial. Diabetes Care 41: 112–119.
  11. Driver V (2017) A prospective, randomized, blinded, controlled trial comparing transdermal continuous oxygen delivery to moist wound therapy for the treatment of diabetic ulcers. Osteotomy Wound Management 63: 12–28.
  12. Eraydin S, Avsar G (2018) The effect of foot exercises on wound healing in type 2 diabetic patients with a foot ulcer: A randomized control study. J Wound Ostomy Continence Nurs 45: 123–130.
  13. Lopez-Delis A (2018) Characterization of the cicatrization process in diabetic foot ulcers based on the production of reactive oxygen species. J Diabetes Res 2018: 4641364.
  14. Mathur RK, Sahu K, Saraf S, Patheja P, Khan F, et al. (2017) Low-level laser therapy as an adjunct to conventional therapy in the treatment of diabetic foot ulcers. Lasers Med Sci 32: 275–282. [crossref]
  15. Mohammadi MH (2017) Evaluation of wound healing in diabetic foot ulcer using platelet-rich plasma gel: A single-arm clinical trial. Transfus Apher 56: 160–164.
  16. Park, KH (2018) Topical epidermal growth factor spray for the treatment of chronic diabetic foot ulcers: A phase III multicenter, double-blind, randomized, placebo-controlled trial. Diabetes Res Clin Prac 142: 335–344.
  17. Pougatsch DA, Rader A, Rogers LC (2017) The Use of a Sea Salt-based Spray for Diabetic Foot Ulcers: A Novel Concept. Wounds 29: E5–5E9. [crossref]
  18. Volpe P, Marcuccio D, Stilo G, Alberti A, Foti G, et al. (2017) Efficacy of cord blood platelet gel application for enhancing diabetic foot ulcer healing after lower limb revascularization. Semin Vasc Surg 30: 106–112. [crossref]
  19. Smith-Strøm H (2018) The effect of telemedicine follow-up care on diabetes-related foot ulcers: a cluster-randomized controlled noninferiority trial. Diabetes Care 41: 96–103.
  20. Zelen C (2017) Human Reticular Acellular Dermal Matrix in the Healing of Chronic Diabetic Foot Ulcerations that Failed Standard Conservative Treatment: A Retrospective Crossover Study. Wounds 29: 39–45.
  21. Zelen CM (2017) A prospective, randomised, controlled, multicentre clinical trial examining healing rates, safety and cost to closure of an acellular reticular allogenic human dermis versus standard of care in the treatment of chronic diabetic foot ulcers. Int Wound J 14: 307–315.
  22. Dutton M, Chiarella M, Curtis K (2014) The role of the wound care nurse: an integrative review. Br J Community Nurs Suppl 39–40, S42–47. [crossref]
  23. International Best Practice Guidelines: Wound Management in Diabetic Foot Ulcers. Wounds International, 2013. Available from: www.woundsinternational.com

Factors Associated with Black & Latina Women Meeting the US Federal Physical Activity Guidelines: Secondary Analysis of NHIS Data

DOI: 10.31038/AWHC.2018135

Abstract

Background: Not meeting physical activity guidelines is a major public health concern. Studies show that Black and Latina women have general lower levels of physical activity (PA) than White women and are therefore at higher risk for chronic diseases including cardiovascular disease, diabetes, and obesity. The purpose of this study is to analyze National Health Interview Survey (NHIS) data to determine what factors, if any may contribute to Black and Latina women between the ages of 18 and 47, adhering to the federal PA guidelines. Identifying these factors will help in the development of PA promotion programs aimed at increasing adherence to the federal PA guidelines among minority women.

Method: Secondary analysis of data from the National Health Interview Survey 2008–2014 was analyzed to determine factors which may be associated with PA adherence among Black (N = 23,162) and Latina (N = 37,103) women.

Results: Logit modeling examined mean differences between groups and related variables. Blacks are more likely to meet muscle-strength guidelines with increased education and increased income. Latinas are more likely to meet muscle-strength as education and US acculturation increases.

Conclusion: These findings highlight the importance of understanding and considering racial/ethnic differences when developing strategies for promotion of PA among minority women. Identifying strategies and factors for increasing PA is a major step toward reducing risk factors associated with inadequate PA. Practitioners should be aware of these results and trends when discussing PA recommendations with their patients.

Introduction

Not engaging in adequate physical activity is a major public health problem associated with increased morbidity and mortality, accounting for 3.2 million deaths each year [1]. The numbers of individuals not meeting recommended physical activity levels have risen significantly over the last decade, contributing to increased prevalence of heart disease, diabetes, colon cancer, and high blood pressure [2]. Engaging in regular physical activity as per physical activity guidelines has shown to be essential and beneficial in reducing risk factors for many of these diseases (cardiovascular diseases, type 2 diabetes, breast & colon cancers) thereby reducing premature all-cause mortality [3]. Minority women, such as Black and Latino, are more likely to be less physically active in comparison to White women [4].

In 2008, the federal government adopted physical activity guidelines for all Americans [5]; the second edition of these guidelines was recently released in the fall of 2018 [6]. These guidelines serves as the primary, authoritative voice of the federal government for evidence-based guidance on physical activity, fitness, and health for Americans that describe the amount, types, and intensity of physical activity needed to achieve many health benefits for Americans across the life span [6]. These guidelines are further broken down into aerobic and Muscle Strengthening (MS) activities aimed at improving one’s health. The minimal recommendations for adults living in the United States are:

  1. 2 hours and 30 minutes (150 minutes) of aerobic activity of moderate intensity, such as, brisk walking every week, along with 2 or more days a week of muscle-strengthening activity that work all major muscle groups (legs, hips, back, abdomen, chest, shoulders, and arms (p.56, 2018).

Unfortunately, the overwhelming majority of Black and Latina women in the United States are not consistently meeting these guidelines. The prevalence of meeting aerobic physical activity guidelines for Black women in the US is 35% and 41% for Latina women, in comparison to White women at 51% [4]. The lower level of physical activity noted in minority women may account for the significant health disparities noted between White women and Black. (Table 1) shows the significant differences noted between White and Black women regarding diseases and risk factors.

Table 1. Prevalence of Diseases & Risk Factors in Women by Race/Ethnicity (%)

Diseases & Risk Factors

White

Black

Hispanic or Latina

Physician-diagnosed DM

7.4

13.6

12.7

High Blood Pressure

32.3

46.3

30.7

Overweight (BMI ≥ 25kg/m2)

63.7

82.2

77.1

*Met Federal Physical Activity guidelines for Adults (2015); DM = Diabetes mellitus.
Source: Table created by W. Williams from data from Heart Disease and Stroke Statistics – Prevalence 2011–2014 (Benjamin et al., 2018)

Physical activity is defined as bodily movement that increases energy expenditure above the basal level [7]. Leisure-time physical activity is defined as physical activities performed during free time, other than work or school, such as recreation and/or exercise [8]. Healthy People 2020 have defined health disparity as “a particular type of health difference that is closely linked with social, economic, and/or environmental disadvantage that adversely affects specific population groups [9].” Common themes noted in the literature that may help to explain these differences are cultural attitudes (body image, hair maintenance, society norms) and family responsibilities. Therefore, the purpose of this study is to analyze National Health Interview Survey (NHIS) data to determine what factors, if any may contribute to Black and Latina women between the ages of 18 and 47 adhering to the federal physical activity guidelines. Identifying these factors will help in the development of physical activity programs aimed at promoting adherence to the federal physical activity guidelines among minority women. Improving adherence to physical activity guidelines can lead to health promotion and disease prevent of various chronic diseases (hypertension, heart disease, obesity, diabetes, and some form of cancers) among minority women.

The Literature Regarding Racial/Ethical Differences

Black Women

A person’s experiences and perceptions play a major role in determining her participation in regular physical activity. A person’s attitude is shaped by her experiences, beliefs, and cultural influences [10, 11]. Evidence suggests that racial/ethnic differences exist regarding Black women’s attitudes toward physical activity.[11, 12] These attitudes toward physical activity may help explain the significant decline noted in Black women in comparison to White women. In the Black community, women are less concerned with body size and are more accepting of fuller, curvaceous figures [12–16]. Therefore, Black women who are satisfied with their body size may perceive being physically active as a waste of time since they have no desire to lose weight. Also, Black women are more accepting of individuality and tend not to conform to society’s views of beauty. [17] Although having a positive image of one’s self is a generally a good thing, such an attitude may help contribute to some Black women being less interested in engaging in adequate physical activity.

One aim of a systematic review of qualitative studies conducted by Siddiqi, Tiro, and Shuval [18] was directed at understanding barriers to physical activity among Black adults. This review indicated that among Black women, hair maintenance, family responsibilities, and environmental condition were some of the barriers the women gave for not being physically active. Hair maintenance is a major concern among Black women due to the cost and time-consuming process involved. Hair maintenance among Black women tends to be a major deterrent for engaging in PA [19–22].

Another barrier is family responsibilities [20, 23]. In 2011, 67.8% of Black births in the United States were to single Black or African American women, which is a significant rise in the last decade [24]. Being a single mother juggling multiple responsibilities related to work and caring for children does not leave sufficient time to be physically active for many women. Research shows that women with children are more likely to have decreased physical activity [25, 26]. Such a significant rise in single Black mothers may be one explanation why physical activity levels are significant lower in Black women than in White women [19, 24].

Latina Women

Similar to Black women, Latinas regard fuller figures as more desirable [27]. Latinas and Blacks have reported more of a positive body self-image at higher BMIs than White women, suggesting that they have higher thresholds for what is considered healthy [27]. Personal hygiene issues such as desire not to sweat are also barriers to Latinas engaging in physical activity similar to the desire not to redo their hair for Black women [12, 17].

Latinas’ cultural emphasis on family and familial unity or familismo highlights their sense of family duties and responsibilities [28]. Latinas also tend to be the homemaker and caregiver, which might influence how they engage in physical activity because their energy and time is put into household duties instead of Leisure Time Physical Activity (LTPA) [29]. Marianismo and acculturation are also influencing factors on Latinas participation in PA [28]. Marianismo, or prioritization of family responsibilities over self-care, has been shown to affect physical activity among Latina women. D’Alonzo (2012) found that Latina women who immigrated to the United States were less likely to participate in LTPA due to family priorities and working outside the home. Many Latina women feel that family is a priority and taking time to go to the gym or engage in physical activity takes away time that could be spent with children, spouses, or other family members [28].

Immigration to the United States and subsequent acculturation also plays a role in leisure time physical activity among Latina women. D’Alonzo (2012) showed that decrease leisured time physical activity among Latina women who had recently immigrated to the United States due to “role overload” was associated with lifestyle changes and acculturation (p. 138). These changes include working outside the home, increased number of hours worked in a day, socioeconomic pressures, decreased social support, learning English, and transitioning from a collective culture to an individualistic one [28].

Latinas also have a higher fertility rate than White women, and which several researchers [29–31] have found the increasing number of children to be negatively associated with reported physical activity levels. Having more children would presumably increase the duties and therefore hours associated with childcare and household tasks, thus reducing the number of hours available to engage in physical activity participation for Latinas as their family commitments would be more time consuming [32].

Methods and Materials

Design

Secondary analysis of data from the National Health Interview Survey (NHIS) 2008–2014 was analyzed to explore factors which may be associated with physical activity adherence among Black and Latina women. The NHIS is an annual in-person household survey conducted by the Centers for Disease Control and Prevention (CDC), National Center for Health Statistics (NCHS) and administered by the US Census Bureau [33]. The data is publicly accessible with no identifiable information of the participants. Adults aged 18 years or older are randomly selected through a complex stratified clustered process that oversamples Hispanics and non-Hispanic Blacks from the noninstitutionalized civilian population [33]. Oversampling of minorities allows for more precise estimation of health characteristics in these segments of the populations. The conditional response rate for this time frame was approximately 80% [33].

To be included in this study, NHIS responders for the years 2008–2014 had to be female, between the ages of 18 and 47, and identify race as Black or Latino. Sample size consisted of N=23,162 Blacks and N=37,103 Latinas women aged 18 to 47 years. This is 4.1% of the total population of respondents regardless of sex, age, or race.

Measures

Co-habitation status (partner present vs. no partner), education [less than high school (LHS); High School/General Education Diploma (HS/GED); some college, Associates Degree (AD), Bachelor’s, greater than Bachelor’s)] and family income which was categorized as multiples of the federal poverty level (FPL) [not poverty, below poverty limit, 150% above FPL, 200% above FPL, 250% above FPL, 300% above FPL, 400% FPL and above] were the primary variables that were explored to identify association to physical activity adherence related to the federal physical activity guidelines. Also, an acculturation measure was created, combining language spoken most often (Spanish or English) and place of birth (US born or foreign born). These categories are (a) English/US born, (b) English/ foreign born, (c) English and Spanish/ US born, (d) English and Spanish/ foreign born, (e) Spanish/ US born, and (f) Spanish/foreign born. Based on the federal physical activity guidelines recommendations and the available data, 2008–2014 IHIS participants were grouped as follows: one variable capturing adherence to only moderate aerobic activity recommendations was dichotomized into “meets recommendations” or “does not meet recommendations;” a second variable capturing adherence to only vigorous aerobic activity recommendations was dichotomized into “meets recommendations” or “does not meet recommendations;” and a third variable capturing adherence to muscle-strengthening activities was dichotomized into “meets recommendations” or “does not meet recommendations.”

Data Analysis

The analysis was conducted with the Statistical Package for the Social Sciences (SPSS) [34]. The primary outcome for this analysis was identification of factors associated with adherence to meeting the federal physical activity guidelines among Black and Latina women.

Bivariate analysis of the independent variables partner presence, educational level and income were performed to determine impact on meeting moderate aerobic, vigorous aerobic, and muscle-strengthening activities as outlined above. Logistic regression models were used to identify a relationship with the variables associated with higher odds of engaging in moderate or vigorous aerobic activity and adherence to muscle-strengthening recommendations. Results are reported using odds ratios adjusted for all listed associated variables, significant effects (SEs), and p values.

Results

Due to the difference between Black and Latina women, the results will be reported based on race. Results are reported using adjusted odds ratios for all listed variables, significant effects (SEs), and p values. For Black women, none of the associated variables were significant for meeting moderate or vigorous aerobic activity guidelines. However, bivariate analysis revealed partner presence, educational level and income significantly impacted adherence to muscle-strengthening (MS) guidelines (p<0.05) and engaging in MS are a significant part of the federal physical activity guidelines. Multivariable logistic regression was then performed to ascertain the effects the independent variables of partner presence, educational level and income had on the likelihood that Black women age 18 to 47 met the recommended muscle-strengthening guidelines. These independent variables were chosen based on their p value (p < 0.05) from the bivariate analysis. For Black females, the logistic regression model including combined effects of partner status (cohabitating or non-cohabitating), education and income level was statistically significant, χ2(30) = 77.70, p < .05. Results are reported using adjusted odds ratios for all listed variables, significant effects (SEs), and p values.

The multivariable logistic regression showed income and education to significantly impact the likelihood of meeting recommended muscle-strengthening guidelines for cohabitating Black women aged 18 to 47. Results were not significant for women who were non-cohabitating. Income significantly impacted those with a high school diploma or General Education Degree (GED), while education significantly impacted women who identified as having an income below the federal poverty level (FPL). The comparison group was Black women age 18 to 47 with less than a high school diploma, no partner present, and identified as “not poverty”.

(Table 2) shows Black women age 18 to 47 with a high school diploma or GED are significantly less likely to meet muscle-strengthening guidelines as income increases from Federal Poverty Level (FPL) to above FPL. Specifically, women with a family income identified as below the Federal Poverty Level (FPL) were 0.51 times less likely to meet muscle-strengthening act (p<0.01), while those with an income of 150% above the FPL were 0.67 times less likely to meet muscle-strengthening guidelines (p<0.01). However, there was an increase in likelihood of meeting muscle-strengthening guidelines as income rose from 150% above FPL. While still less likely to meet muscle-strengthening guidelines than women with an income below the FPL, those who made 200% and 300% above FPL were only 0.55 (p<0.05) and 0.59 (p<0.05) times less likely to meet muscle-strengthening guidelines.

Table 2. Effects of Income in Cohabitating Black Women Age 18–47 with a High School Diploma or General Education Degree on Meeting Muscle Strengthening Guidelines.

Meets MS Guidelines

Confidence Interval (CI)

O.R.

S.E.

P value

Lower CI

Upper CI

Reference Category: Not Poverty, less than high school diploma, non-cohabitating

Below FPL

0.49

0.24

0.004**

0.31

0.79

150% above

0.33

0.38

0.004**

0.16

0.70

200% above

0.45

0.36

0.026*

0.22

0.91

250% above

0.60

0.29

0.072

0.34

1.05

300% above

0.416

0.36

0.013*

0.20

0.82

400% + above

0.74

0.33

0.360

0.39

1.41

*P < .05.  ** P < .01
O. R = Adjusted Odd Ratio; S.E. = Significant effects; FPL = Federal Poverty Level; MS = muscle strengthening
Source: Table created by MacLean.

Among cohabitating Black women age 18 to 47 who identified a family income of below FPL, education appears to increase the likelihood of meeting muscle-strengthening guidelines (see Table 3). Women with a high school diploma or GED were 0.51 times less likely to meet muscle-strengthening guidelines (p<0.01), while those with some college were only 0.48 times less likely (p<0.05). However, women who had a partner present, identified family income of FPL, and had an associate degree were 0.74 times less likely to meet muscle-strengthening guidelines (p<0.05).

Table 3. Effects of Education in Cohabitating Black Women Age 18–47 with a Family Income of Below Federal Poverty Level on Meeting Muscle Strengthening.

Meets MS Guidelines

Confidence Interval (CI)

O.R.

S.E.

P value

Lower CI

Upper CI

Reference Category: Not Poverty, less than high school diploma, non-cohabitating

HS/GED

0.49

0.24

0.004**

0.31

0.80

Some college

0.52

0.30

0.029*

0.29

0.94

AD

0.26

0.59

0.023*

0.08

0.83

Bachelor’s

0.15

1.01

0.061

0.02

1.09

>Bachelor’s

1.31

0.75

0.718

0.30

5.74

*P < .05.  ** P < .01
All variables were included in the model to obtain the adjusted odds ratios.
OR=Adjusted Odd Ratio; S.E.=Significant effects; HS=High School; GED=Graduate Equivalency Degree; AD=Associates Degree; > Bachelor’s =greater than a Bachelor’s degree; MS=muscle strengthening
Source: Table created by MacLean

For Latina women, none of the associated variables were significant for Latinas in meeting moderate aerobic activity guidelines. However, trends in the data showed that Latinas were more likely to meet moderate aerobic activity guidelines as education and acculturation increased. They were less likely to meet moderate aerobic activity guidelines with increasing income. These trends are displayed in (Table 4) None of the associated variables were significant for vigorous aerobic activity for Latinas, nor were any trends present in the data.

Table 4. Latina Women Age 18–47 Moderate Aerobic Activity Guidelines.

Meets Moderate Aerobic Guidelines

O.R.

S.E.

P value

Reference Category: Less than HS

HS/GED

1.95

0.5

0.18

Some college

1.10

0.61

0.87

AD

2.36

0.59

0.15

Bachelor’s

2.87

0.62

0.09**

Greater than Bachelor’s

2.70

0.91

0.27

Reference Category: FPL

Below FPL

6.57

1.04

0.07

150% above

7.96

1.08

0.06

200% above

3.28

1.24

0.34

250% above

8.50

1.10

0.05

300% above

4.00

1.15

0.23

400% + above

2.86

1.20

0.38

Reference Category: English/US born

English/FB

0.91

0.40

0.80

S+E/US

0

5304.70

1.00

S+E/FB

0.63

0.62

0.46

S/US

0

6458.79

1.00

S/FB

0.39

0.62

0.13

*P < .05.  ** P < .01
AD (Associates Degree); HS (High School)/GED (General Education Diploma); FPL (Federal Poverty Level); FB (Foreign Born): S+E (Spanish and English); US (United States Born); S (Spanish)

However, just like with Black women, many of the associated variables for meeting muscle-strengthening guidelines were significant (p <.05) for Latinas as evidenced in (Table 5) As education increased, odds of meeting muscle-strengthening guidelines also increased in Latinas who had a bachelor’s degree; they were 87.9% [OR=1.88, CI=1.18–2.99, p=.008] more likely to meet muscle-strengthening guidelines than were Latinas with no high school degree. Data also showed that as income increased, Latinas were more likely to meet muscle-strengthening guidelines. Latinas who earn 400% or more above FPL were 215% [OR=2.15, CI=1.26–3.65, p=.005] more likely to meet muscle-strengthening guidelines that Latinas who earned income equivalent to the FPL. Latinas were 89.3% [OR=.11, CI=0.03–0.44, p=.002] less likely to meet muscle-strengthening guidelines if they were currently pregnant. Also, data showed that the odds of meeting muscle-strengthening guidelines increased as acculturation increased. Latinas born outside of the U.S. who predominantly spoke English were 22.5% more likely to meet muscle-strengthening guidelines than those who predominantly spoke Spanish [Eng/FB (OR=.68, CI=.50-.93, p=.014); Sp/FB (OR=.46, CI=.3-.70, p=.000)]. Trends in the data also showed that as BMI increased, the likelihood of a Latina meeting muscle-strengthening guidelines decreased. Latinas in the Obese III category were 68.6% [OR=.31, CI=.17-.58, p=.000] less likely to meet muscle-strengthening guidelines than a Latina of normal BMI.

Table 5. Latina Women Age 18–47 Muscle-Strengthening Guidelines.

Meets MS Guidelines

O.R.

S.E.

P Value

Reference Category: Less than HS

HS/GED

0.97

0.13

0.80

Some college

1.57

0.12

0**

AD

1.45

0.14

0.01**

Bachelor’s

2.01

0.13

0**

Greater than Bachelor’s

1.92

0.15

0**

Reference Category: FPL

Below FPL

0.84

0.11

0.09

150% above

1.17

0.13

0.25

200% above

1.33

0.14

0.04*

250% above

1.37

0.13

0.02*

300% above

1.57

0.12

0**

400% + above

1.88

0.12

0**

Reference Category: Not pregnant

Pregnant

0.48

0.18

0**

Reference Category: English/US born

English/FB

0.71

0.11

0.002**

S+E/US

0.71

0.45

0.44

S+E/FB

0.44

0.25

0.001**

S/US

0.68

0.50

0.43

S/FB

0.45

0.2

0.001**

Reference Category: Normal BMI

Underweight

0.72

0.15

0.03*

Overweight

0.78

0.07

0**

Obese I

0.48

0.1

0**

Obese II

0.50

0.15

0**

Obese III

0.32

0.14

0**

*P < .05.  ** P < .01
AD (Associated Degree); HS (High School)/GED (General Education Diploma); FPL (Federal Poverty Level); FB (Foreign Born); S+E (Spanish and English); US (United States Born); S (Spanish); muscle-strengthening (MS)

Limitations

The data utilized in this study was obtained from secondary analysis of NHIS data, which should be considered a limitation due to the inability to consider other variables that may be associated with physical activity. NHIS represents a cross-sectional research design that obtained household interviews of a sample clusters of addresses from each state. Therefore, because participants were not randomized the sample may not be representative of the population, contributing to selection bias. In addition, cause and effect cannot be determined with a cross-sectional design and the data may only capture what is occurring at that particular time and moment, which may not be transferable to other times or situations. NHIS relies on self-reported data, therefore, recall bias is a major issue and can potentially increases the risk of participants’ bias. Participants may also over or under report certain information to look good or to please the interviewer (socially acceptable bias). These findings may not be generalizable to other populations that are not women of Black or Latina descent.

Discussion

The findings and trends presented here are significant to understanding and developing effective strategies that could improve physical activity among Black and Latina women. Strategies to address physical activity participation in minority women must occur at multiple levels that consider cultural differences.

Although, no variables were found to be significant for meeting moderate or vigorous aerobic activity guidelines in either Black or Latina women. Adherences to muscle-strengthening activities were found to be associated with a few variables in both groups. Although, muscle-strengthening activities are only a partial requirement of the federal physical activity guidelines, it still represents some level of activity in these women. And current studies support that some activities are better than none [6].

For Black women, partner presence was associated with Black women maintaining muscle-strengthening activities, which stands to reason that Black women with a partner present, that is supportive may show higher levels of commitment due to encouragement and interest in them being active. A qualitative study by Mama et al. (2015) revealed that Black women did view support of a spouse or friend as important factor in engaging in regular physical activity [35]. The support can be in the form of working-out together, prompting, to offering to pay for a gym membership.

Higher educational attainment was associated with muscle-strengthening activities in both groups, which is consistent with other studies indicating that higher educational attainment is associated with being more physically active [36]. A study by Ainsworth et al. (2003) that looked at African-American women in South Carolina showed that educational attainment had a strong relationship for Black women to be physically active, with college educated women revealing a two-times higher likelihood of being physically active over high school educated Black women [37].

Also, income was associated with muscle-strengthening activities; these findings of income are consistent with other studies that have shown that women from lower socioeconomic status tend to be less physically active. [38, 39] In the Black community there is a higher prevalence of single family homes, headed by women, where they are the sole source of income for their families [24]. Therefore, being the head-of-the household may place financial burdens on single Black mothers that prevent them from being physically active (i.e., no money for gym fees, or a babysitter that would allow her to go out to a gym). Black women from a lower socioeconomic background may also have greater difficulty being physically active compared to their higher income counterparts due to environmental barriers as well (no local gym or nearby park, unsafe neighborhood and heavy traffic patterns) [40]. More research is needed that considers the economic context of physical activity among low-income Black women. A study by Harley et al. (2013) emphasizes the need for better understanding of how significant, if any, income is regarding being physically active. A recent study by Sun and colleagues (2016) revealed that higher socioeconomic status was positively associated with young Black women being physically active [36].

For Latina women, factors associated with lower levels of engagement in sufficient physical activity levels include lower income, lower education levels, and greater number of children [29–31]. This study found that Latinas were less likely to meet moderate aerobic activity guidelines with increasing income. The difference could be explained by different definition of physical activity or the use of leisure time physical activity versus total physical activity.

With the increase of reported education beyond high school and income, the odds of Latinas meeting muscle-strengthening guidelines increased. This study’s findings were consistent with the literature regarding the negative association of pregnancy and likelihood of meeting muscle-strengthening guidelines with Latinas who reported being currently pregnant were less likely to meet muscle-strengthening guidelines [41]. Similarly, as acculturation to the US increases, odds of meeting muscle-strengthening guidelines increased for Latinas. This is consistent with literature reporting on total leisure time physical activity associated with meeting physical activity guidelines [41]. Our data demonstrated similar trends regarding the association with increasing BMI and decreasing likelihood of meeting muscle-strengthening guidelines [41]. This study found racial/ethnic differences among Black and Latina women as pertains to their level of physical activity; these differences must be taken into consideration if we hope to reduce the growing trend of insufficient physical activity among minority women. Working together, providers, patients, and policy makers can reduce health care disparities associated with diseases related to engaging in insufficient physical activity.

Acknowledgment: Brian Rathmell for his review and assistance with the statistical analysis.

Funding: This work was supported by the Dean’s Summer Research Fund, School of Nursing, Camden, New Jersey, USA.

References

  1. World Health Organization (2014) Physical inactivity: A global public health problem. World Health Organization, Geneva, Switzerland.
  2. Lee IM, Shiroma EJ, Lobelo F, Puska P, Blair SN, et al (2012) Effect of physical inactivity on major non-communicable diseases worldwide: an analysis of burden of disease and life expectancy. Lancet 380: 219–229. [crossref]
  3. Warburton, DER, Nicol CW, Bredin SSD (2006) Health benefits of physical activity: The evidence. Canadian Medical Association Journal 174: 801–809. [crossref]
  4. Benjamin EJ, Virani SS, Callaway CW, Chamberlain AM, Chang AR, et al (2018) Heart Disease and Stroke Statistics-2018 Update: A Report From the American Heart Association. Circulation 137: 67–492. [[crossref]
  5. U.S. Department of Health and Human Services (2008) Physical Activity Guidelines for Americans. Health.gov].
  6. US Department of Health and Human Services (2018) Physical Activity Guidelines for Americans, 2nd Edition, O.o.D.P.a.H. Promotion, Editor. 2018, Office of Disease Prevention and Health Promotion, Washington, DC, USA.
  7. Centers for Disease Control and Prevention (2011) Physical activity for everyone: Glossary of terms.
  8. Moore SC, et al (2012) Leisure time physical activity of moderate to vigorous intensity and mortality: A large pooled cohort analysis. PLOS Medicine 9: 1–14.
  9. U.S. Department of Health and Human Services (2014) Healthy People 2020: Disparities.
  10. Ajzen I, Albarracin D, Hornik R. (eds.). (2007) Prediction and change of health behavior: Applying the reasoned action approach. Mahwah, NJ, US: Lawrence Erlbaum Associates Publishers.
  11. Thind H, Goldsby TU, Dulin-Keita A, Baskin ML (2015) Cultural beliefs and physical activity among African-American adolescents. Am J Health Behav 39: 285–294. [crossref]
  12. Im EO, Ko Y, Hwang H, Chee W, Stuifbergen A, Walker L, et al. (2013) Racial/ethnic differences in midlife women’s attitudes toward physical activity. Journal of Midwifery & Women’s Health 58: 440–450. [crossref]
  13. Komar-Samardzija M, Braun LT, Keithley JK, Quinn LT (2012) Factors associated with physical activity levels in African-American women with type 2 diabetes. Journal of the American Academy of Nurse Practitioners 24: 209–217. [crossref]
  14. Baptiste-Roberts K, Gary TL, Bone LR, Hill MN, Brancati FL (2006) Perceived body image among African Americans with type 2 diabetes. Patient Education and Counseling 60: 194–200. [crossref]
  15. Eyler AA, Baker E, Cromer L, King AC, Brownson RC, et al (1998) Physical activity and minority women: A qualitative study. Health Education and Behavior 25: 640–652. [crossref]
  16. Alleyne SI, V. LaPoint (2004) Obesity among Black Adolescent Girls: Genetic, Psychosocial, and Cultural Influences. Journal of Black Psychology 30: 344–365.
  17. Versey HS (2014) Centering perspectives on black women, hair politics, and physical activity. American Journal of Public Health 104: 810–815. [crossref]
  18. Siddiqi Z, Tiro JA, Shuval K (2011) Understanding impediments and enablers to physical activity among African American adults: a systematic review of qualitative studies. Health Educ Res 26: 1010–1024. [crossref]
  19. Im EO, Ko Y, Hwang H, Yoo KH, Chee W, Stuifbergen A, et al. (2012) “Physical activity as a luxury”: African American women’s attitudes toward physical activity. Western Journal of Nursing Research 34: 317–339. [crossref]
  20. Im EO, Chee W, Lim HJ, Liu Y, Kim HK (2008) Midlife women’s attitudes toward physical activity. J Obstet Gynecol Neonatal Nurs 37: 203–213. [crossref]
  21. Hall A (2004) Women on the Move!, Southern University Agricultural Research & Extension Center, Editor: Baton Rouge, LA.
  22. Dietz W (2001) Focus group data pertinent to the prevention of obesity in African Americans. Am J Med Sci 322: 275–278. [crossref]
  23. Siddiqi Z, Tiro JA, Shuval K (2011) Shuval, Understanding impediments and enablers to physical activity among African American adults: a systematic review of qualitative studies. Health Educ Res 26: 1010–1024. [crossref]
  24. Shattuck RM, RM Kreider (2013) Social and economic characteristics of currently unmarried women with a recent birth: 2011. American community survey reports.
  25. Brown WJ, Trost SG (2003) Life transitions and changing physical activity patterns in young women. Am J Prev Med 25: 140–143. [crossref]
  26. Dlugonski D, Motl RW (2013) Marital status and motherhood: implications for physical activity. Women Health 53: 203–215. [crossref]
  27. Fitzgibbon ML, Blackman LR, Avellone ME (2000) The relationship between body image discrepancy and body mass index across ethnic groups. Obes Res 8: 582–589. [crossref]
  28. D’Alonzo KT, Fischetti N (2008) Cultural Beliefs and Attitudes of Black and Hispanic College-Age Women Toward Exercise. J Transcult Nurs 19: 175–183. [crossref]
  29. Slattery ML, Sweeney C, Edwards S, Herrick J, Murtaugh M, et al. (2006) Physical activity patterns and obesity in Hispanic and non-Hispanic white women. Med Sci Sports Exerc 38: 33–41. [crossref]
  30. Crespo CJ, Smit E, Carter-Pokras O, Andersen R (2001) Acculturation and Leisure-Time Physical Inactivity in Mexican American Adults: Results From NHANES III, 1988–1994. Am J Public Health 91: 1254–1257. [crossref]
  31. Neighbors CJ, Marquez DX, Marcus BH (2008) Leisure-time physical activity disparities among Hispanic subgroups in the United States. Am J Public Health 98: 1460–1464. [crossref]
  32. Berg JA, Cromwell SL, Arnett M (2002) Physical activity: Perspectives of Mexican American and Angelo American midlife women. Health Care for Women Int 23: 894–904. [crossref]
  33. Blackwell DL, Lucas JW, Clarke TC (2014) Summary Health Statistics for U.S. Adults: National Health Interview Survey, 2012, N.C.F.H. Statistics, Editor, U.S. Department of Health and Human Services: Hyattsville, Maryland.
  34. SPSS. SPSS software: Predictive analytics software and solutions. 2012; Available from: http://www-01.ibm.com/software/analytics/spss/.
  35. Mama SK, McCurdy SA, Evans AE, Thompson DI, Diamond PM, et al. (2015) Using Community Insight to Understand Physical Activity Adoption in Overweight and Obese African American and Hispanic Women: A Qualitative Study. Health Educ Behav 42: 321–328. [crossref]
  36. Sun H, Vamos CA, Flory SSB, DeBate R, Thompson EL, et al. (2017) Correlates of long-term physical activity adherence in women. J Sport Health Sci 6: 434–442. [crossref]
  37. Ainsworth BE, Wilcox S, Thompson WW, Richter DL, Henderson KA (2003) Personal, social, and physical environmental correlates of physical activity in African-American women in South Carolina. Am J Prev Med 25: 23–29. [crossref]
  38. Cohen SS, Matthews CE, Signorello LB, Schlundt DG, Blot WJ, et al. (2013) Sedentary and physically active behavior patterns among low-income African-American and white adults living in the southeastern United States. PLoS ONE 8: 1–12. [crossref]
  39. Harley AE, Rice J, Walker R, Strath SJ, Quintiliani LM, et al. (2013) Physically active, low-Income African American women: An exploration of activity maintenance in the context of sociodemographic factors associated with inactivity. Women Health 53: 354–372. [crossref]
  40. Jilcott Pitts SB, Keyserling TC, Johnston LF, Smith TW, McGuirt JT, et al. (2015) Associations between neighborhood-level factors related to a healthful lifestyle and dietary Intake, physical activity, and support for obesity prevention polices among rural adults. Journal of Community Health 40: 276–284. [crossref]
  41. Vermeesch AL, Stommel M (2014) Physical Activity and Acculturation Among U.S. Latinas of Childbearing Age. Western Journal of Nursing Research 36: 495–511. [crossref]

Endoscopic Removal of Eroded Gastric Bands Using Lithotripsy Devices: A Case Series

DOI: 10.31038/IMCI.2018114

Abstract

Bariatric surgical procedures are being performed at an exponential rate. Gastric banding is a commonly performed Bariatric surgical procedure with band erosion being a known complication. Until recently eroded Gastric Bands have undergone surgical removal. Recent reports have described endoscopic removal using a biliary guide-wire and biliary mechanical lithotripter.

Aim: To determine the safety and feasibility of endoscopic removal of eroded gastric bands using lithotripsy devices following Bariatric surgery.

Methods: Thirteen patients (9w, 3m), age 33–59 (mean 45) presented with a diagnosis of eroded gastric band. These include 9 adjustable lap bands. Presenting symptoms included pain 10/13, N/V 7/13, fever/port infection 1/13. All patients had confirmation of gastric band erosion with endoscopy and CT scan 13/13.

Results: All patients with non-adjustable gastric bands were removed successfully, endoscopically. Of the patients with Adjustable Lap Bands, endoscopic removal was successful in 8/9 patients. The failed attempt was in a patient whose Band had significant fibrotic component and non-visualization of the buckle. This patient required laparoscopic removal. All patients underwent post-op contrast upper GI imaging to exclude gastric leak.

Conclusion: Patients with Gastric Band erosion present most often with abdominal pain, followed by nausea and vomiting. Diagnosis is established by endoscopy and CT imaging. Endoscopic removal is highly but not universally successful and requires coordination with a Bariatric Surgeon for the removal of the adjustable port and removal of the band in the setting of endoscopic failure. The endoscopist needs to familiarize him with Bariatric Surgical procedures and their inherent complications and eventually assist in their care when called upon.

Introduction

Obesity is defined as abnormal or excessive fat accumulation that presents as a risk to health [1]. Despite obesity being a well identified and acknowledged problem, it continues to grow as a global epidemic [2]. Obesity has emerged as a major problem, the primary reason being an imbalance between the consumption and expenditure of calories. Since 1975, the number of obese people has increased by three times across the globe. According to the 2016 World Health Organization statistics, 650 million people (13%) 18 years and above have been identified as obese [3]. 36.5% of the total population of United States is Obese [4]. Obese people can have a significantly negative impact on the quality of their lives in terms of an increased risk of having diabetes mellitus type 2, infertility, cardiovascular diseases, respiratory disorders, malignancies, as well as social and functional limitations [5].

Bariatric care has expanded over the period to be identified as a growing field for consideration as a treatment option for obesity [6,7]. Bariatric procedures cause weight loss by limiting the amount of food the stomach can hold or malabsorption of nutrients or a combination of both. The commonly performed bariatric procedures include Roux-en-Y Gastric Bypass, Sleeve Gastrectomy, Adjustable Gastric Band, and Biliopancreatic Diversion with Duodenal Switch [8].

In the United States, trends have been shifting towards Laparoscopic Gastric bands as means of attaining weight loss [9]. Where lap bands have proven as an effective alternative to the conventional weight loss methods, they come with a cost of complications ranging from mild to serious [10].

The pathophysiology of gastric band erosion has yet to be understood [11]. The established understanding of gastric band erosion reveals that acute and chronic tissue damage could be a potential trigger to initiate band erosion [12]. Undiagnosed gastric perforations that may occur during band placements and early infections can serve as the possible causes of early erosions. Late erosions are caused by gastric band induced high pressure leading to chronic ischemia [13,14]. This prolonged ischemia gives way to band erosion through the mucosal layer and hence a perception of pain.

Gastric band erosion has been identified as a common complication with its incidence varying from 0.23% to 32.65% [15]. Symptoms of gastric band erosion include abdominal pain, excessive vomiting, weight loss cessation or unexplained weight regain and the inability to regulate the stoma [16]. Endoscopic removal of eroded gastric bands has been identified as a potent and safe technique to address this complication [17].

We report a unique approach towards the removal of eroded gastric bands using a biliary guided wire and biliary mechanical lithotripter. This method was applied in 19 patients with eroded gastric bands and represents one of the largest case series in this respect. Literature review reveals that our technique is one of its kinds and can potentially contribute to determining the safety and feasibility of endoscopic removal of eroded gastric bands following Bariatric Surgery.

Materials and Methods

Thirteen patients (9w, 3m), age 33–59 (mean 45) presented to the University of Texas, and Memorial Hermann Hospital with symptoms leading to a diagnosis of eroded gastric lap band. This included 4 non-adjustable and 9 adjustable (attached injection port) lap bands. Presenting symptoms included; pain 10/13, nausea/vomiting 7/13, fever/port infection 1/13. Patients presented 5–24 weeks from start of symptoms (mean 16 weeks). All patients had confirmation of gastric band erosion with upper endoscopy and CT scan imaging.

Procedure technique; a flexible biliary hydrophilic guide-wire with flexible tip (0.025 in x 450cm) is advanced through the band while the endoscope is withdrawn (Figure 1). The endoscope is re-advanced alongside the wire and the distal tip is captured with forceps and withdrawn through the mouth (Figure 2). With the two ends of the wire now outside the patient’s mouth a flexible lithotripter cable, the Emergency Lithotripter System BML-110A-1 (Olympus America) (Figure 3) is advanced over the two ends of the wire until the tip rests against the gastric band (Figure 4). The lithotripter handle is then attached to the cable and progressively ratcheted down until the wire cuts across the band (Figure 5). The surgeon detaches and removes the port in those with adjustable bands while the endoscopist removes the cut band with a stiff, braided snare (Figure 6).

IRCI 18 - 104_F1

Figure 1. Guide-wire across the eroded lap band.

IRCI 18 - 104_F2

Figure 2. Guide-wire across the eroded lap band and both ends outside the mouth.

IRCI 18 - 104_F3

Figure 3. Emergency Lithotripter System.

IRCI 18 - 104_F4

Figure 4. Lithotripter advanced through the guide-wire now rests against the eroded lap band.

IRCI 18 - 104_F5

Figure 5.Wire cutting across the band.

IRCI 18 - 104_F6

Figure 6. Removed eroded lap band.

Results

All patients with non-adjustable gastric bands were removed successfully, endoscopically using the above technique. Of the patients with Adjustable Lap Bands, endoscopic removal was successful in 8/9 patients. The failed attempt was in a patient whose Band had significant fibrotic component and non-visualization of the buckle. This patient required laparoscopic removal at the same time as port removal. Procedure time recorded ranged from 18 minutes to 32 minutes (mean 24 minutes). All patients underwent post-op contrast upper GI imaging using dilute barium to exclude gastric leak within 12 hours of band removal. No leaks or perforations were identified. Minor bleeding occurred in one patient which resolved spontaneously. Patients were discharged 1–4 days post-op (mean 1.4 days). One patient with port infection required prolonged hospitalization for IV antibiotics and fever resolution.

Discussion

Obesity has been recognized as an important contributive factor towards premature deaths [18]. Laparoscopic gastric banding has evolved as an effective strategy for weight loss that has been proven to decrease total body weight by up to 20% [19]. Where gastric bands are now recognized widely as an effective tool for weight loss and significant contributions towards comorbidities of obesity, its complications like port or tubing malfunction, band slippage, and obstruction of the stoma, band erosion, pouch dilation, and infection cannot be ignored [20].

Where a definite cause of gastric band erosion has yet to be established, it is imperative to apply certain techniques at the time of insertion of gastric band to minimize the risk of gastric band erosion [12,21]. External as well as internal pressure applied to the gastric wall has been hypothesized as a key etiologic factor of band erosion [22]. External pressure may be induced by band over-filling, band rapid filling or band infection [23,24]. Binge eating after the band placement surgery is a contributive factor towards internal pressure [25,20]. One of the important pathophysiologic causes of band erosion stems from the recognition of gastric band as a foreign body by the immune system [26–28]. This results in the formation of an encapsulating fibrotic shell around the eroded lap band that leads to tissue contraction. This shrinked tissue protects the integrity of the fistulous tract [29]. As lap band erosion through the stomach wall occurs over a period of several years, gastric perforation is a rare occurrence [30]. This pathophysiology reflects that active perforation is absent in eroded lap bands. Endoscopic removal of lap bands is therefore a safe yet effective procedure for the removal of eroded lap bands [31–36].

While patients with gastric band erosions can be completely asymptomatic, symptoms if present include repeated port infections, bowel obstruction, abdominal pain and rarely as serious as sepsis with peritonitis [37]. These being mentioned, band erosions can also lead to serious consequences like massive GI hemorrhage and circulatory collapse [38,39], pyelophlebitis of the portal vein [40] and intra-abdominal abscess [41]. Therefore, it is crucial to remove the eroded gastric band [8].

Various techniques have evolved over the course of time for the removal of eroded gastric bands. Unfortunately, literature review is lacking with respect to the comparison of different techniques used for the retrieval of eroded gastric bands [42]. However, the efficacy and design specific model of each technique varies from case to case. For instance, the hybrid technique considers the simultaneous use of laparoscopic and endoscopic methods to complement and facilitate each other [3]. Where some studies advocate the safety of removal of eroded gastric bands using a Single Incision Laparoscopic Surgery (SILS) [43], others urge on the use of standard endoscopy equipment for the removal of eroded gastric bands [44]. A study by Kohn GP explains the superiority of laparoscopic removal in terms of time duration from band erosion to band removal [45]. Nevertheless, physicians have yet to establish certain set guidelines identifying the superiority of one technique over the other in different situations. Due to the limitations of endoscopic and laparoscopic procedures in this regard, the role of a Bariatric surgeon becomes crucial. In certain cases, laparoscopic and endoscopic techniques may both fail in removing the gastric band in which case the role of bariatric surgeon emerges as one of utmost importance [46–48].

In our series band removal was successfully performed using our technique in 12/13 patients. CT scan and endoscopy was performed to confirm the diagnosis. We had 4 patients with adjustable gastric bands and 9 patients with non-adjustable gastric bands. Contrast upper Gastrointestinal imaging was performed in all patients after the procedure to exclude gastric leaks. Success rate with our technique was 92%. We had a failed attempt in a single patient. In this case the band had undergone significant fibrosis obscuring the buckle. In this patient laparoscopic removal was performed.

Conclusion

Abdominal pains followed by nausea and vomiting are the most common symptoms of gastric band erosion. CAT scan and endoscopy are used as the primary tools for establishment of a diagnosis. Bariatric surgeons and endoscopists should work in a closely coordinated team to address the complications of gastric band removal. Lithotripsy devices can be effectively and safely used in the retrieval of eroded gastric bands.

References

  1. World Health Organization, Health Topics. Obesity: Commission on Ending Childhood Obesity, WHO, Geneva, Switzerland.
  2. Nia Mitchell, Vicki Catenacci, Holly R. Wyatt, James O. Hill (2012) Obesity: Overview of An Epidemic. Psychiatr Clin North Am 34: 717–732.
  3. World Health Organization, News/Fact sheets/Detail/Obesity and overweight, WHO, Geneva, Switzerland.
  4. Centers for Disease Control and Prevention, Overweight & Obesity, Data & Statistics, U.S. Department of Health & Human Services, USA.
  5. Pozza C, Isidori AM (2018) What’s Behind the Obesity Epidemic. In: Laghi A, Rengo M (eds.). Imaging in Bariatric Surgery. Springer International Publishing AG, Cham, Switzerland.
  6. Roslin MS, Cripps C, Peristeri A (2015) Bariatric and metabolic surgery: current trends and what’s to follow. Curr Opin Gastroenterol 31: 513–518. [Crossref]
  7. David E Arterburn, Anita P Courcoulas (2014) Bariatric surgery for obesity and metabolic conditions in adults. BMJ 349: 3961.
  8. American Society for Metabolic & Bariatric Surgery, Bariatric Surgery Procedures. ASMBS, Gainesville, Florida, USA.
  9. Favretti F, Ashton D, Busetto L, Segato G, De Luca M (2009) The gastric band: first-choice procedure for obesity surgery. World J Surg 33: 2039–2048. [Crossref]
  10. Sven Gustavsson, Agneta Westling (2002) Laparoscopic Adjustable Gastric Banding: Complications and Side Effects Responsible for the Poor Long-Term Outcome. Surgical Innovation 9: 2
  11. Manatakis DK, Ioannis Terzis, Kyriazanos ID, Dontas ID, Stoidis CN, et al (2014) Simultaneous Gastric and Duodenal Erosions due to Adjustable Gastric Banding for Morbid Obesity. Case Reports in Surgery 146980: 4
  12. Chang Ik Yoon, Kyung Ho Pak, Seong Min Kim (2012) Early experience with diagnosis and management of eroded gastric bands. J Korean Surg Soc 82: 18–27. [Crossref]
  13. Gee Young Yun, Woo Sub Kim, Hye Jin Kim, Sun Hyung Kang, Hee Seok Moon, et al (2016) Asymptomatic Gastric Band Erosion Detected during Routine Gastroduodenoscopy. Clin Endosc 49(3): 294–297. [Crossref]
  14. Bernard Hainaux, Emmanuel Agneessens, Erika Rubesova, Vinciane Muls, Quentin Gaudissart, et al (2005) Intragastric Band Erosion After Laparoscopic Adjustable Gastric Banding for Morbid Obesity: Imaging Characteristics of an Underreported Complication. American Journal of Roentgenology184: 109–112.
  15. Mario Rodarte-Shade, Gustavo Torres Barrera, Jose H. Flores Arredondo, Roberto Rumbaut Diaz (2013) Hybrid Technique for Removal of Eroded Adjustable Gastric Band. JSLS 17: 338–341. [Crossref]
  16. H Joseph Naim, Piotr J Gorecki, Leslie Wise (2005) Early Lap-Band Erosion Associated With Colonic Inflammation: A Case Report and Literature Review. JSLS 9: 102–104. [Crossref]
  17. Spann MD, Aher CV, English WJ, Williams DB (2017) Endoscopic management of erosion after banded bariatric procedures. Surg Obes Relat Dis13: 1875–1879. [Crossref]
  18. Iyad Eid, Daniel W. Birch, Arya M. Sharma, Vadim Sherman, Shahzeer Karmali (2011) Complications associated with adjustable gastric banding for morbid obesity: a surgeon’s guide. Can J Surg 54: 61–66. [Crossref]
  19. Chieh Jack Chiu, Daniel W. Birch, XinZhe Shi, Shahzeer Karmali (2013) Outcomes of the adjustable gastric band in a publicly funded obesity program. Can J Surg 56:  233–236. [Crossref]
  20. Charles Kodner, Daniel R. Hartman (2014) Complications of Adjustable Gastric Banding Surgery for Obesity. Complications of Adjustable Gastric Banding Surgery for Obesity. Am Fam Physician 89: 813–818.
  21. Abdulzahra A. Hussain, Jacqueline Nicholls, Shamsi S. El-Hasani (2014) Laparoscopic Adjustable Gastric Band: How to Reduce the Early Morbidity. JSLS 18: 2014.00241[Crossref]
  22. Doğan ÜB, Akova A, Solmaz S, Aydin M (2010) Gastroscopic removal of a migrated adjustable gastric band: a case report. Turk J Gastroenterol 21: 297–301. [Crossref]
  23. Mittermair RP, Weiss H, Nehoda H, Aigner F (2002) Uncommon intragastric migration of the Swedish adjustable gastric band. Obes Surg 12: 372–375.[Crossref]
  24. Neto MP, Ramos AC, Campos JM, Murakami AH, Falcão M, et al (2010) Endoscopic removal of eroded adjustable gastric band: lessons learned after 5 years and 78 cases. Surg Obes Relat Dis 6: 423–427 [Crossref]
  25. Pawel Rogalski, Hady HR, Andrzej Baniukiewicz, Andrzej Dąbrowski, Fabian Kaminski, et al (2012) Gastric band migration following Laparoscopic Adjustable Gastric Banding (LAGB): two cases of endoscopic management using a gastric band cutter. Wideochir Inne Tech Maloinwazyjne 7: 114–117. [Crossref]
  26. Partha Hota, Dina Caroline, Sonia Gupta, Omar Agosto (2018) Laparoscopic adjustable gastric band erosion with intragastric band migration: A rare but serious complication. Radiology Case Reports 13: 76–80
  27. David Collado-Pacheco, Luis Ramon Rábago-Torre, Maria Arias-Rivera, Alejandro Ortega-Carbonel, Ana Olivares-Valles, et al (2016) Endoscopic extraction of adjustable gastric bands after intragastric migration as a complication of bariatric surgery: technique and advice. Endosc Int Open 4: 673–677. [Crossref]
  28. Giovanni D De Palma, Antonio Formato, Vincenzo Pilone, Maria Rega, Maria Elena Giuliano, et al (2006) Endoscopic management of intragastric penetrated adjustable gastric band for morbid obesity. World J Gastroenterol 12:  4098–4100. [Crossref]
  29. Edo Oscar Aarts, Bas van Wageningen, Frits Berends, Ignace Janssen, Peter Wahab, et al (2015) Intragastric band erosion: Experiences with gastrointestinal endoscopic removal. World J Gastroenterol 21: 1567–1572. [Crossref]
  30. SJW Monkhouse, JDT Morgan, SA Norton (2009) Complications of Bariatric Surgery: Presentation and Emergency Management – a Review. Ann R Coll Surg Engl 91: 280–286. [Crossref]
  31. Neto MP, Ramos AC, Campos JM, Murakami AH, Falcão M, et al (2010) Endoscopic removal of eroded adjustable gastric band: lessons learned after 5 years and 78 cases. Surg Obes Relat Dis 6: 423–427. [Crossref]
  32. Peter M. Bertin, Marc L. Costa (2012) Endoscopic Removal of Eroded Gastric Band Using Standard Endoscopy Equipment. Bariatric Times 9: 20–22
  33. Shehab H, Gawdat K (2017) Endoscopic Management of Eroded Bands Following Banded-Gastric Bypass (with Video). Obes Surg 27: 1804–1808. [Crossref]
  34. Dogan ÜB, Akin MS, Yalaki S, Akova A, Yilmaz C (2014) Endoscopic management of gastric band erosions: a 7-year series of 14 patients. Can J Surg 57: 106–111.[Crossref]
  35. Dogan UB, Dal MB (2015) An 8-Year Experience With Endoscopic Management of Eroded Gastric Bands. Surg Laparosc Endosc Percutan Tech 25: 140–144 [Crossref]
  36. Lattuada E, Zappa MA, Mozzi E, Fichera G, Granelli P, et al (2007) Band erosion following gastric banding: how to treat it. Obes Surg 17: 329–333. [Crossref]
  37. Gee Young Yun, Woo Sub Kim, Hye Jin Kim, Sun Hyung Kang, Hee Seok Moon, et al (2016) Asymptomatic Gastric Band Erosion Detected during Routine Gastroduodenoscopy. Clin Endosc 49: 294–297. [Crossref]
  38. Rao AD, Ramalingam G (2006) Exsanguinating hemorrhage following gastric erosion after laparoscopic adjustable gastric banding. Obes Surg 16: 1675–1678. [Crossref]
  39. Campos J, Ramos A, Galvão Neto M, Siqueira L, Evangelista LF, et al (2007) Hypovolemic shock due to intragastric migration of an adjustable gastric band. Obes Surg 17: 562–564. [Crossref]
  40. De Roover A, Detry O, Coimbra C, Hamoir E, Honoré P, Meurisse M. (2006) Pylephlebitis of the portal vein complicating intragastric migration of an adjustable gastric band. Obes Surg 16: 369–71. [Crossref]
  41. Wylezol M, Sitkiewicz T, Gluck M, Zubik R, Pardela M (2006) Intra-abdominal abscess in the course of intragastric migration of an adjustable gastric band: a potentially life-threatening complication. Obes Surg 16: 102–104. [Crossref]
  42. Ümit Bilge Dogan, Mustafa Salih Akin, SerkanYalaki, Atilla Akova, CengizYilmaz (2014) Endoscopic management of gastric band erosions: a 7-year series of 14 patients. Can J Surg 57: 2
  43. Spitali, K. De Vogelaere, G. Delvaux (2013) Removal of Eroded Gastric Bands Using a Transgastric SILS Device. Case Reports in Surgery 2013: 852747.
  44. Peter M. Bertin and Marc L. Costa (2012) Endoscopic Removal of Eroded Gastric Band Using Standard Endoscopy Equipment Bariatric Times 9: 20–22
  45. Kohn GP, Hansen CA, Gilhome RW, McHenry RC, Spilias DC, Hensman C (2012) Laparoscopic management of gastric band erosions: a 10-year series of 49 cases. Surg Endosc 26: 541–545. [Crossref]
  46. Basa NR, Dutson E, Lewis C, Derezin M, Han S, Mehran A (2008) Laparoscopic transgastric removal of eroded adjustable band: a novel approach. Surg Obes Relat Dis 4: 194–197 [Crossref]
  47. Denis JoséEchaverry-Navarrete, Angélica Maldonado-Vázquez, PabloCortes-Romano, RicardoCabrera-Jardines, Erwin EduardoMondragón-Pinzón, et al (2015) Gastric band erosion: Alternative management. Cirugía y Cirujanos 83: 418–423
  48. Ashvini Abeysekera, Jerry Lee, Simon Ghosh, Craig Hacking (2017) Migration of eroded laparoscopic adjustable gastric band causing small bowel obstruction and perforation. BMJ 2017: 2017–219954.

Chorionic Villi Expression of Two Vascular Endothelial Growth Factor Proteins in Normal Human Pregnancy

DOI: 10.31038/IGOJ.2018132

Abstract

Introduction: Alternate splicing of vascular endothelial growth factor (VEGF)-A gene yields a number of proteins of varying amino acid lengths ranging from 121 to 206 amino acids. Recently, other isoforms of VEGF have been recognized that form from alternate splicing of the C-terminal region of exon 8 of VEGF gene. These sister isoforms are known as VEGFxxxb, where xxx denotes the number of amino acids present in the protein. During human pregnancy, VEGF165 and its receptors are recognized as master regulator of placental angiogenesis; and both VEGF165 and VEGF165b proteins are secreted by cytotrophoblasts. The present study compares the temporal expression of both isoforms of VEGF in chorionic villi tissues, throughout gestation, in normal human pregnancy.

Methods: Placentas were obtained from elective termination of pregnancy or term delivery. Tissues collected were dissected in saline to identify chorionic villi without associated decidua. VEGF protein expressions were determined by ELISA using monoclonal antibody to human VEGF165 and VEGF165b proteins as capture antibody, DY293B and DY3045, respectively (R&D Systems, Minneapolis, MN). Non-parametric test considered p<0.05 as significant.

Results: Both isoforms of VEGF were detected in 166 chorionic villi samples analyzed. The expression patterns of the two proteins differed markedly throughout gestation. While VEGF165 showed a minor dip in the second trimester, VEGF165b showed a peak during that time. The two isoforms were positively and significantly correlated in second and third trimesters of pregnancy.

Conclusions: The data reveal that both isoforms of VEGF play key roles in regulating the angiogenic balance throughout gestation in normal human pregnancy. We hypothesize that VEGF165b protein expression in placental tissues could be a physiological phenomenon to restrain overexpression of VEGF165 during placental development, which if left unchecked, could lead to pregnancy-related complications as pregnancy advanced.

Keywords

ELISA, Throughout Gestation, Uncomplicated Human Pregnancy, VEGF165, VEGF165b

Introduction

Placental angiogenesis plays a pivotal role in instituting a fetomaternal circulation and in establishing the placental villous tree that contributes to the development of the placenta throughout human pregnancy. Of the many angiogenic factors that were investigated e.g., five members of VEGF family, four members of the angiopoitin family, and one member of large ephrin family; vascular endothelial growth factor (VEGF) was recognized as the one specific for blood vessel formation [1–3]. Gene knockout studies have provided convincing evidence for a central role of VEGF in fetal and placental angiogenesis. Targeted homozygous null mutations of VEGF receptors in mice demonstrated failure in hematopoiesis, formation of blood islands and blood vessels, resulting in embryonic death by day 8 of pregnancy [4]. Carmeliet et al. further demonstrated that loss of a single VEGF allele in a mouse model led to gross developmental deformities in vessel formation that resulted in embryonic death between day 11 and 12 of mouse pregnancy. The authors concluded that not only fetal and placental angiogenesis were dependent on VEGF, but a threshold level of VEGF had to be achieved for normal vascular development to occur [5].

The VEGF A gene has eight exons. Alternate splicing of VEGF mRNA accounts for five isoforms of VEGF proteins: VEGF121, VEGF145, VEGF165, VEGF189 and VEGF206, of which VEGF165 isoform is most abundant in vivo [6]. In the past decade, the complexity of VEGF165 biology further intensified when it was found that alternate splicing of exon 8 at the C-terminal region of VEGF gene could yield yet other isoforms of VEGF. While the number of amino acids in the sister isoforms remained the same, there were however alternate open reading frames of six amino acids at the C-terminal region of the sister isoforms. The sister isoforms were identified as VEGFxxxb, xxx referring to the number of amino acids present in the protein [7]. The splicing event modifies the C-terminal region of the VEGF protein from CDKPRR (VEGFxxx) to SLTRKD (VEGFXXXb). The replacement of the six amino acids alters the tertiary structure of the newly formed protein, as the disulfide bond that was previously formed between cysteine 160 at the C-terminal region with cysteine 146 of exon 7, could no longer be formed. The terminal two arginine molecules (RR) being replaced with lysine and aspartic acid (KD) further modifies the overall charge of the protein; and replacement of proline (P) residue with arginine (R) additionally transforms the structure of the C-terminal domain [7].

In a previous study, placental expressions of VEGF165 and VEGF165b were examined in which the comparison was made between uncomplicated and complicated pregnancies at term [8]. In an earlier study, we have examined placental expression of VEGF165b throughout gestation in normal human pregnancy [9]. The two growth factors of VEGF are secreted by cytotrophoblasts; and are implicated in placental angiogenesis in human pregnancy. We, therefore, undertook the present study to simultaneously investigate the expressions of both VEGF165 and VEGF165b in placental tissues, throughout gestation, in women with uncomplicated pregnancy. Understanding the simultaneous temporal changes in these two growth factors of VEGF as placenta develops, we consider, would be extremely valuable.

Materials and Methods

The investigative protocol for the study was approved by the Human Subject Ethics Committee of the BronxCare Health System, New York, protocol # 10101304. Discarded placental tissue samples were collected within approximately 30 minutes of the procedures from normal pregnant women who underwent elective termination of pregnancy at 6 weeks to 23 weeks and 6 days; and from normal women who delivered uncomplicated singleton pregnancies at term. Placentas from missed abortion or from pregnancies complicated with diabetes, hypertension, chronic renal disease, and chronic peripheral vascular disease or with major fetal anomalies were excluded. The approved protocol allowed the collection of the following clinical information regarding the women from whom placental tissues were obtained. These included: maternal age, parity, race/ethnicity (self-reported), gestational age (as determined by ultrasound or by initial date of the last menstrual period), reason for pregnancy termination (whether elective, for maternal medical reasons or for fetal indications), and medicine(s) administered to induce termination of pregnancy. Placentas from pregnancies 7- 23 weeks and 6 days were collected from the elective termination group, and those from 37 to 42 weeks of gestation were collected from term delivery group. Placentas delivered below 37 weeks of gestation were not included because these placentas are considered as preterm.

Soon after collection, the placental tissues were processed to obtain chorionic villi samples by a method described earlier [10]. Briefly, portions of each placenta were first thoroughly washed in cold saline to remove maternal blood and were then dissected in saline to collect free floating chorionic villi that were not anchored to the basal plate nor were emerging from the chorionic plate surface vessels. Pieces of these chorionic villi samples were placed in separate tubes, each tube bearing the same ID# designated for that placenta. Tissues and clinical information were de-identified before exiting the delivery suites. The sample collection tubes were then transported to the laboratory on ice and stored at -800C until assay.

Chorionic villi VEGF165 and VEGF165b protein expressions were simultaneously determined by enzyme-linked immunoassay (ELISA) methods. The capture antibodies for the ELISA kits were monoclonal antibodies to human proteins VEGF165 (DY293B) and VEGF165b (DY3045), respectively (R&D Systems, Minneapolis, MN). Chorionic villi samples were homogenized in Reagent Diluent 2 (R&D Systems, Minneapolis, MN), and supernatants following centrifugation of the homogenate at 13000 rpm for 2 minutes were used to determine the free forms of the isoforms based on the manufacturer’s protocols. Simultaneous analysis of both VEGF isoforms meant that we carried out both VEGF165 and VEGF165b proteins assays using chorionic villi tissues samples isolated from the same placentas, the assays were not carried out using the same aliquots. A Tecan infinite 200 Pro microplate reader (Tecan Systems Inc., San Jose, CA) set at 450 nm with wavelength correction set at 540 nm was used to measure absorbance. The sensitivity of VEGF165 ELISA was 31.3 pg/ml and that of VEGF165b ELISA was 62.5 pg/ml. Intra-assay and inter-assay variations for both assay kits were between 7–10%.

Statistical Analyses

The statistical software package SPSS, version 25 (IBM Corporation, Armonk, NY) was used for statistical analyses. First, the normality of the data was statistically analyzed which showed that the data was not normally distributed. Hence, non-parametric statistics were applied. The data was grouped by trimesters and the following non-parametric tests were performed: 1) Kruskal Wallis test (an alternative test to One-Way-ANOVA) was used to explore the differences in VEGF isoform expressions among the trimester groups. (It is important to note that KW test does not provide post–hoc data the way one-way-ANOVA does). 2) The non-parametric Mann Whitney U test was applied to compare two trimester groups at a time against each other. 3) Spearman Rank correlation coefficient test was applied to summarize the strength and direction of a relationship between the variables as well as between the variables and gestational age in days. A p<0.05 was considered statistically significant.

Results

The demographic characteristics of women from whom placental samples were obtained showed comparable maternal age among the three trimester groups (28.2 ± 6.5, 28.2 ± 6.1 and 30.0 ± 6.8 years, for first, second and third trimester groups, respectively). Race/ethnicity was self-reported, and the distribution pattern was 30% Black, 60% Hispanic, 2% Caucasian and 8% of other ethnic origin. When 166 placentas were grouped by trimester the data showed that 71 placentas collected from elective termination of pregnancy were in the first trimester, with an average gestational age of 8 weeks; 33 placentas collected also from elective termination of pregnancy were in the second trimester, with an average gestational age of 16 weeks; and 62 placentas collected from term delivery were from third trimester, with an average gestational age of 39 weeks and 2 days.

In this study, non-parametric statistics were applied because the data were skewed. Kruskal Wallis test results revealed that VEGF165 protein expression was not statistically different among the three trimester groups, the expression of VEGF165b protein, however, was significantly different (p=0.0001). In (Table 1) the 25th, 50th and 75th percentile values of the two VEGF isoforms are shown. The expression patterns of the two proteins are shown graphically in (Figure 1), which depicts two entirely different expression patterns for the two isoforms of VEGF throughout gestation in normal human pregnancy. While VEGF165 protein showed a minor dip in the second trimester of pregnancy, the expression patterns of VEGF165b showed a significant peak during that time. Pairwise comparison of trimester groups using Mann Whitney U test further revealed that the expression pattern of VEGF165 was not significantly different, but VEGF165b protein expression in each trimester was significantly different from the other (p=0.0001).

Table 1. Chorionic villi VEGF Protein Expressions throughout Gestation in Normal Pregnancy

Groups

N

VEGF165 (pg/ 100 mg tissue)

VEGF165b (pg/100 mg tissue)

25th Percentile

50th Percentile

75th Percentile

25th Percentile

50th Percentile

75th Percentile

1st Trimester

71

68.00

87.45

147.30

122.06

166.51

240.00

2nd Trimester

33

50.80

68.40

148.10

297.42

428.97

529.66

3rd Trimester

62

77.25

110.95

212.80

175.09

256.52

344.98

VEGF165 : Vascular Endothelial Growth Factor165 ; VEGF165b: Vascular Endothelial Growth Factor165b;   GA: gestational age in days. The first trimester placental chorionic villi samples were from 70/7–120/7 weeks gestation, the average GA was 81/7 weeks; second trimester were from 121/7 to 236/7 weeks, the average GA was 160/7 weeks; and the third trimester term were from 370/7 to 414/7 weeks of gestation, the average GA 392/7 weeks.  Homogenized human placental chorionic villi samples were analyzed using assay kit from R&D Systems, Minneapolis, MN; to determine VEGF165 and VEGF165b protein expressions.  Data were not normally distributed hence non-parametric statistics were used and 25th, 50th and 75th percentile values of VEGF165 and VEGF165b are shown.

IGOJ 2018-113 - Jayasri Basu USA_F1

Figure 1. GA: gestational age.

The first trimester placental chorionic villi samples were from 70/7-120/7 weeks gestation, the average GA was 81/7 weeks; second trimester were from 121/7 to 236/7 weeks, the average GA was 160/7 weeks; and the third trimester term were from 370/7 to 414/7 weeks of gestation, the average GA 392/7 weeks.

Correlation between the two proteins of VEGF as well as between the isoforms of VEGF and gestational age were examined in this study. Spearman’s correlation test results revealed that expression of VEGF165b protein was significantly and positively correlated with gestational age in days in the first trimester of normal pregnancy (r= +0.299, p=0.011, (Table 2). The table also depicts the test results of Spearman’s correlation between the two isoforms. The data reveal a significant positive correlation in the second (r = +0.376, p=0.031) and third trimester (r=+0.271, p=0.033), of normal pregnancy.

Table 2. Correlation between VEGF165, VEGF165b and Gestational Age in Days throughout gestation

VEGF165

VEGF165b

First Trimester
(N=71)

VEGF165

Correlation
Coefficient
Sig. (2-tailed)

1.000

0.070
0.564

GA

Correlation
Coefficient
Sig. (2-tailed)

0.029
0.159

0.299*
0.011

SecondTrimester
(N=33)

VEGF165

Correlation
Coefficient
Sig. (2-tailed)

1.000

0.376*
0.031

GA

Correlation
Coefficient
Sig. (2-tailed)

-0.149
0.409

0.013
0.944

Third Trimester
(N=62)

VEGF165

Correlation
Coefficient
Sig. (2-tailed)

1.000
0.916

0.271*
0.033

GA

Correlation
Coefficient
Sig. (2-tailed)

-0.027
0.833

-0.112
0.385

VEGF165 : Vascular Endothelial Growth Factor165 ; VEGF165b: Vascular Endothelial Growth Factor165b; GA: gestational age in days. Data were not normally distributed hence Spearman’s correlation was applied. Significant positive correlation was seen between VEGF165b and GA in the first trimester of pregnancy.  The two VEGF proteins were significantly and positively correlated in the second and third trimester of normal pregnancy.

Conclusion

In this study, chorionic villi samples were isolated from each placenta, and VEGF165 and VEGF165b protein expressions were determined by ELISA that used monoclonal antibody to human VEGF165 or VEGF165b protein as the capture antibody in each case. VEGF protein expression and that of its receptors are closely regulated to times of vasculogenesis and angiogenesis [11]. In this study, both isoforms of VEGF proteins were identified in all 166 chorionic villi samples that were analyzed suggesting that both proteins of VEGF may exert regulatory roles in pregnancy-linked angiogenesis in normal human pregnancy.

The angiogenic potential of VEGF165 has been confirmed by several bioassays that measured VEGF receptor expression during embryogenesis and tissue repair [11], capillary growth in vivo in developing chick chorioallantonic membrane [12], and a temporal and spatial correlation between VEGF and ocular angiogenesis in a primate model [13]. These studies affirmed VEGF signaling pathways to be the master regulator of angiogenesis [11–14]. The pro-angiogenic potential of VEGF165 results from six amino acids at its C-terminus e.g., CDKPRR [7, 15]. Involvement of VEGF165 in human pregnancy, particularly in placental development has also been recognized. Reports on the placental expressions of VEGF165 protein state that the protein increases in first 10 weeks of normal pregnancy, but as pregnancy advances, VEGF and its receptor VEGFR-2 concentrations decline. In these reports, VEGF was suggested to increase vascular permeability, vasodilation and angiogenesis [16–18]. It is also suggested to be involved in the formation and maintenance of the trophoblastic plugs that block the spiral arteries in the first trimester of normal pregnancy [19]. Figure 1 depicts that VEGF165 protein expression is somewhat lower in the second trimester of normal pregnancy. This data is consistent with the finding of an immunohistochemical study that reported VEGF165 antigen staining to be weaker in mid-gestational placental tissues, compared to the intensity of staining for the protein in the first or third trimester placental samples [20].

The isoform VEGF165b has not been investigated in as much detail as VEGF165. VEGF165b protein is expressed in normal tissues of lung, pancreas, colon, skin and brain [7, 21, 22]. Reports reveal that VEGF165b constitute 50% or more of total VEGF expressed in most non-angiogenic tissue [23]. Investigators have alleged that VEGF165b is not pro-angiogenic in vivo [23] and it actively inhibits VEGF165 mediated endothelial cell proliferation and migration in vitro [4, 7, 21–23]. VEGF165b is further reported to inhibit physiological angiogenesis in developing mammary tissue, in transgenic animals, overexpressing VEGF165b [24]. Moreover, VEGF165b is reported to inhibit angiogenesis in vivo in six other different tumor models [21–25]. The results of the present study on chorionic villi VEGF165b protein expression throughout gestation in normal human pregnancy are similar to the results we have reported earlier [9]. Our studies underscore the importance of VEGF165b antigen in normal human pregnancy. Identification of VEGF165b protein in this study, in all 166 chorionic villi samples that were collected throughout all trimesters of human pregnancy validates this notion. This temporal variation in VEGF165b protein in human pregnancy perhaps reflects that VEGF165b protein expression is more stringently controlled at each phase of human gestation, and that the isoform may play a more active role in placental development. The spatial activation of VEGF165b protein at various phases of human gestation as seen in the study emphasizes that placental angiogenesis could be more dependent on VEGF165b isoform.

VEGFR-2 is the predominant signaling receptor for VEGF-mediated angiogenesis [26]. Phosphorylation of VEGFR-2 on tyrosine residue at 1052 position of the molecule generates a highly dynamic and complex signaling system that triggers angiogenic response [4, 21, 26]. The binding affinities of VEGFR-2 are identical between VEGF165 and VEGF165b isoforms. However, VEGF165b is less efficient than VEGF165 in inducing phosphorylation on Y1052 residue [27]. The lower ability of VEGF165b to induce VEGFR2 phosphorylation on Y1052 is due to its incapacity to induce optimal rotation of the intracellular domain of the receptor molecule that is required for phosphorylation to occur [27]. Reduced Y1052 phosphorylation induces rapid inactivation of the kinase domains of the receptors resulting in weak activation of the signaling pathways [23]. Recent studies have shown that VEGF165b can stimulate VEGFR-2, ERK1/2 and Akt phosphorylation in endothelial cells, however, the induced phosphorylation is weaker than that promoted by VEGF165 [21, 28]. VEGF165b is currently not considered as anti-angiogenic but as a weakly angiogenic form of VEGF [28].

Establishment of functional fetal and placental circulations is some of the earliest strategic events during embryonic/placental development [29, 30]. The significant positive correlation seen between chorionic villi VEGF165b protein expression and gestational age in first trimester of pregnancy in this study (Table 2) suggests that VEGF165b may contribute to the development of villous vascular network in early pregnancy. An increase in expression of plasma VEGF165b protein in first trimester of normal pregnancy has been reported by other investigators, and the authors suggest that failure in the upregulation of VEGF165b protein in the plasma in the first trimester of pregnancy was a predictive marker of preeclampsia [31]. Simultaneous increase of both isoforms of VEGF in human placental tissues in the third trimester of pregnancy has also been reported by other investigators [8]. The large increase in transplacental exchange which supports the exponential increase in fetal growth and uterine blood flow during the last half of gestation is suggested to depend primarily on the dramatic growth of placental vascular beds [32]. Vascular density of the placental cotyledons remains relatively constant throughout mid-gestation and increases dramatically during the last third of gestation in association with dramatic fetal growth [32, 33]. In third trimester of normal pregnancy, both fetal development and demands are at its peak; and our data show a positive correlation between VEGF165 and VEGF165b during this time. Hence, it may be suggested that angiogenic modification of placental vasculature that allows maximum blood to flow through may depend on the synergistic action of both isoforms of VEGF.

Our present findings suggest a notable difference between tumor and placental angiogenesis. It is widely reported that in human tumors, up-regulation of VEGF165 protein occurs with a proportional drop in VEGF165b levels; indicating that in tumor angiogenesis the balance between the two isoforms of VEGF is lost [34]. However, the findings of the present study suggest that gestational age-specific expression of both VEGF isoforms is necessary for optimal placental angiogenesis and growth to results in a successful viable outcome.

That hypoxic environment favors VEGF165-induced angiogenesis and tumorigenic growth is well known [35]. In an earlier study we have demonstrated that placental environment switches from a hypoxic to a normoxic environment beyond the first trimester of normal human pregnancy [36]. We hypothesize that perhaps during this transitional period from first to second trimester of normal pregnancy, placental oxidative environment per se regulate the alternate splicing of exon 8 of the VEGF gene. In hypoxic condition proximal splicing of exon 8 may be favored, which up-regulates the expression of VEGF165 protein. In a normoxic state, distal splicing of exon 8 may be favored, whereby the expression of VEGF165b protein gets up-regulated. That switch in the partial pressure of oxygen at the end of first trimester of normal pregnancy can modify the expression pattern of two proteins has been reported earlier, between placental derived growth factor and VEGF [37]. It is feasible that this switch in the spliceosome at the end of the first trimester may be the contributing factor that may have resulted in the peak VEGF165b protein expression seen in the second trimester of this study. It is likely that this dependence of placental growth on VEGF165b beyond the first trimester could be a physiological phenomenon to restrain any overexpression of VEGF165 which if left un-checked, could perhaps lead to pregnancy-related complications as pregnancy advanced.

The limitation of our study is that we have not confirmed our data by western blot, polymerase chain reaction or by immunohistochemical methods. We acknowledge that cells respond to extracellular stimuli through a series of signaling cascades. When a receptor is activated, varieties of proteins are recruited to interact with each other to generate a cascade of sequential steps that result in a biological effect [38]. Signaling molecules are common to several pathways and often form a complex intracellular network [38]. Yet, in this study we have not examined other isoforms of VEGF, their receptors or other factors that may have also been involved in placental angiogenesis. We believe that addition of all these factors would have made the study more complex and any conclusions drawn from the study would have been extremely difficult to interpret. The strength of our study is our relatively larger sample size in each of the trimester groups. Simultaneous expressions of these two important VEGF proteins in human chorionic villi tissue throughout gestation in normal human pregnancy have not been reported before. In this study, stringent ELISA methods using monoclonal antibodies to human VEGF165 and VEGF165b human proteins were used as capture antibodies. The manufacturer claims that DY293B capture antibody that was used does not cross react with placental growth factor (PIGF), VEGF-B167, VEGF-B186, VEGF-C, VEGF-D, recombinant (rh) human VEGF R1(Flt-1)/Fc Chimera or with rhVEGF R2(KDR)/Fc Chimeras. Similarly, the monoclonal capture antibody DY3045 does not cross react with rhhuman VEGF121, VEGF162, VEGF165, rhVEGF R3/Fc, VEGF R1/Fc or VEGF R-2/Fc Chimeras. Furthermore, the detection methods used were sensitive, allowing the detection of VEGF165 as low as 31.2 and VEGF165b as low as 62.5 pg/ml, respectively. The study underscores the importance of VEGF165b in placental angiogenesis in normal human pregnancy. We speculate that placental oxidative environment might influence the C-terminal VEGF angiogenic switch, whereby different VEGF variants could be formed from a single VEGF gene; that play key roles in regulating angiogenic balance during normal human pregnancy. It may be suggested that gestational age-specific expression of both VEGF165 and VEGF165b isoforms may be necessary for a successful viable outcome.

Acknowledgement

The authors would like to thank Dr. CM Salafia for her guidance for the study, and the staff members of the Department of Obstetrics & Gynecology at BronxCare Health System for their support. For this research, outside grants were not sought. The study was funded by the Residency Program of the BronxCare Health System.

Declaration of Interest: The authors declare no conflicts of interest with respect to the research, authorship and/or publication of this article.

References

  1. Ferrara N (1999) Vascular endothelial growth factor: molecular and biological aspects. Curr Top Microbiol Immunol 237: 1–30.
  2. Dvorak HE, Nagy JA, Feng D, Brown LF, Dvorak AM (1999) Vascular permeability factor/vascular endothelial growth factor and the significance of microvascular hyperpermeability in angiogenesis. Curr Top Microbiol Immunol 237: 97–132.
  3. Eriksson U, Alitalo K (1999) Structure, expression and receptor-binding properties of novel vascular endothelial growth factors. Curr Top Microbiol Immunol 237: 41–57.
  4. Mustonen T, Alitalo K (1995) Endothelial receptor tyrosine kinases involved in angiogenesis. J Cell Biol 129: 895–898.
  5. Carmeliet P, Ferreira V, Breier G, Pollefeyt S, Kieckens L, et al. (1996) Abnormal blood vessel development and lethality in embryos lacking a single VEGF allele. Nature 380: 435–439.
  6. Tischer E, Mitchell R, Hartman T, Silva M, Gospodarowicz D, et al. (1991) The human gene for vascular endothelial growth factor. Multiple protein forms are encoded through alternative exon splicing. J Biol Chem 266: 11947–11954.
  7. Bates DO, Cui TG, Doughty JM, Winkler M, Sugiono M, et al. (2002) VEGF165b, an inhibitory splice variant of vascular endothelial growth factor, is down-regulated in renal cell carcinoma. Cancer Res 62: 4123–4131.
  8. Bates DO, MacMillan PP, Manjaly JG, Qiu Y, Hudson SJ, et al. (2006) The endogenous anti-angiogenic family of splice variants of VEGF, VEGFxxxb, are down-regulated in pre-eclamptic placentae at term. Clin Sci (Lond) 110: 575–585.
  9. Basu J, Seeraj V, Gonzalez S, Salafia CM, Mishra A, et al. (2017) Vascular endothelial growth factor165b protein expression in the placenta of women with uncomplicated pregnancy. J Clin Obstet Gynecol Infertility 1: 1–6.
  10. Basu J, Agamasu E, Bendek B, Salafia CM, Mishra A, et al. (2018) Correlation between placental matrix metalloproteinase-9 and tumor necrosis factor-α protein expression throughout gestation in normal human pregnancy. Reprod Sci. 25: 621–627.
  11. Peters KG, DeVries C, Williams LT (1993) Vascular endothelial growth factor receptor expression during embryogenesis and tissue repair suggests a role in endothelial differentiation and blood vessel growth. Proc Natl Acad Sci 90: 8915–8919.
  12. Ausprunk DH, Knighton DR, Folkman J (1974) Differentiation of vascular endothelium in the chick chorioallantois: a structural and autoradiographic study. Dev Biol 38: 237–248.
  13. Miller JW, Adamis AP, Shima DT, D’Amore PA, Moulton RS, et al. (1994) Vascular endothelial growth factor/ vascular permeability factor is temporally and spatially correlated with ocular angiogenesis in a primate model. Am J Path 145: 574–584.
  14. Ribatti D, Crivellato E (2012) “Sprouting angiogenesis”, a reappraisal. Dev Biol 372: 157–165.
  15. Keyt BA, Berleau LT, Nguyen HV, Chen H, Heinsohn H, et al. (1996) The carboxyl-terminal domain (111–165) of vascular endothelial growth factor is critical for its mitogenic potency. J Biol Chem 271: 7788–7795.
  16. Vuckovic M, Ponting J, Terman BI, Niketic V, Seif MW, et al. (1996) Expression of vascular endothelial growth factor receptor, KDR, in human placenta. J Anat 188: 361–366.
  17. Cooper JC, Sharkey AM, Charnock-Jones DS, Palmer CR, Smith SK (1996) VEGF mRNA levels in placentae from pregnancies complicated by pre-eclampsia. Br J Obstet Gynaecol 103: 1191–1196.
  18. Shiraishi S, Nakagawa K, Kinukawa N, Nakano H, Sueishi K (1996) Immunohistochemical localization of vascular endothelial growth factor in the human placenta. Placenta 17: 111–121.
  19. Alfaidy N, Hoffmann P, Boufettal H, Samouh N, Aboussaouira T, et al. (2014)The multiple roles of EG-VEGF/Prok1 in normal and pathological placental angiogenesis. BioMed Res Int 2014, Article ID 451906.
  20. Jackson MR, Carney EW, Lye SJ, Ritchie JW (1994) Localization of two angiogenic growth factors (PDECGF and VEGF) in human placenta throughout gestation. Placenta 15: 341–353.
  21. Qiu Y, Hoareau-Aveilla C, Oltean S, Harper SJ, Bates DO (2009) The anti-angiogenic isoforms of VEGF in health and disease. Biochem Soc Trans 37: 1207–1213.
  22. Bates DO, Harper SJ (2005) Therapeutic potential of inhibitory VEGF splice variants. Future Oncol 1: 467–473.
  23. Woolard J, Wang WY, Bevan HS, Qiu Y, Morbidelli L, et al. (2004) VEGF165b, an inhibitory vascular endothelial growth factor splice variant: mechanism of action, in vivo effect on angiogenesis and endogenous protein expression. Cancer Res 64: 7822–7835.
  24. Qiu Y, Bevan HS, Weeraperuma S, Wratting D, Murphy D, et al. (2008) Mammary alveolar development during lactation is inhibited by the endogenous anti-angiogenic growth factor isoform VEGF165b. The FASEB J 22: 1104–1112.
  25. Varey AH, Rennel ES, Qiu Y, Bevan HS, Perrin RM, et al. (2008) VEGF165b, an antiangiogenic VEGF-A isoform, binds and inhibits bevacizumab treatment in experimental colorectal carcinoma: balance of pro-and antiangiogenic VEGF-A isoforms has implications for therapy. Br J Cancer 98: 1366–1379.
  26. Rahimi N, Costello CE (2015) Emerging roles of post-translational modifications in signal transduction and angiogenesis. Proteomics 15: 300–309.
  27. Kawamura H, Li X, Harper SJ, Bates DO, Claesson-Welsh L (2008) Vascular endothelial growth factor receptor (VEGF)-A165b is a weak in vitro agonist for VEGF receptor-2 due to lack of coreceptor binding and deficient regulation of kinase activity. Cancer Res 68: 4683–4692.
  28. Catena R, Larzabal L, Larrayoz M, Molina E, Hermida J, et al. (2010) VEGF121b and VEGF165b are weakly angiogenic isoforms of VEGF-A. Mol Cancer 9: 320.
  29. Ramsey EM (1982) The placenta, human and animal. New York: Praeger.
  30. Patten BM (1964) Foundations of embryology, 2nd (edn). New York: McGraw-Hills.
  31. Bills VL, Varet J, Millar A, Harper SJ, Soothill PW, Bates DO (2009) Failure to up-regulate VEGF165b in maternal plasma is a first trimester predictive marker for pre-eclampsia. Clin Sci 116: 265–272.
  32. Reynolds LP, Redmer DA (1995) Utero-placental vascular development and placental functions. J Anim Sci 73: 1839–1851.
  33. Kaufmann P, Mayhew TM, Charnock-Jones DS (2004) Aspects of human fetoplacental vasculogenesis and angiogenesis. II. Changes during normal pregnancy. Placenta 25: 114–126.
  34. Peiris-Pagès M (2012) The role of VEGF165b in pathophysiology. Cell Adh Migr 6: 561–568.
  35. Cao Y, Linden P, Shima D, Browne F, Folkman J (1996) In vivo angiogenic activity and hypoxia induction of heterodimers of placenta growth factor/vascular endothelial growth factor. J Clin Invest 98: 2507–2511.
  36. Basu J, Bendek B, Agamasu E, Salafia CM, Mishra A, et al. (2015) Placental oxidative status throughout normal gestation in women with uncomplicated pregnancies. Obstet Gynecol Int  276095: 1–6.
  37. Ahmed A, Dunk C, Ahmad A, Khaliq A (2000) Regulation of placental vascular endothelial growth factor (VEGF) and placenta growth factor (PLGF) and soluble Flt-1 by oxygen—A review. Placenta 21: 16-S24.
  38. Ferretti C, Bruni L, Dangles-Marie V, Pecking AP, Bellet D (2007) Molecular circuits shared by placental and cancer cells, and their implications in the proliferative, invasive and migratory capacities of trophoblasts. Human Reprod Update 13: 121–141.

The Morphological Features of a Cervical Cancer Cells Membrane under Reflected Light Microscope

DOI: 10.31038/AWHC.2018134


A technique for revealing surface morphology of human cervical cancer cells has been developed to facilitate early diagnostics of a pre-cancer and cancer cells under reflected light microscopy. The offered method was borrowed from optical microscopy of a solid state surface where the Metallographic Inverted Microscopy (MIM) are usually used. Unlike common accepted transmitted light microscopy for biological applications MIM technique allows to reveal a morphology and topology of a biological cells surface without any treatment by chemicals (fixing, staining, drying, freezing et al). The MIM method was demonstrated by analyzing fresh native smears from epithelium of uterine neck. MIM micrographs of 167 patients with diagnosis cervical cancer allow visualizing on the cancer cells surface numerous of the Light Reflective Formations (LRF). It is supposed that LRF are connected with exocytosis on the cell membrane. For smears of cervix epithelium throughout the field of view of a microscope numerous ballooning-outs , which have a mean size from 0.1-0.5 to 1.2 -1.3 mkm, are seen located on the cell surface. It is accepted that in result of a cancer cell metabolism a granules or vesicles originate inside of cell and move towards cell surface to release its contents. Visualization of such morphological formations has however been limited, partly due to the difficulties with imaging native living or structurally intact cells because convenient transmitted light microscopy technique do not reveal surface cell features which are usually removed after fixing, drying and other treatments of smears. We suppose that offered method to visualize cell topography in air without fixation and dehydration may be alternative and complementary to Pap-test.

Keywords

Cervical Cancer, Reflected Light Microscopy, Cell Membrane, Smears.

Introduction

Cervical cancer is the second most common cancer in women worldwide. More than 80% of cervical cancers occur in the developing world where the least resources exist for management. Most cases of cervical cancer can be prevented by screening measures which detects precancerous lesions and subsequent treatment. Indeed in many countries where screening programs have been established, the morbidity and mortality of cervical cancer have been sharply reduced. Unfortunately many developing countries have not necessary resources and infrastructure for screening program so the annual cases of cervical cancer accounts 493 000 and deaths about 273,500 [1].

Currently, optical microscopy techniques are the primary method for cell visualization, with microscopic characteristics of cells traditionally used for diagnosis and classification of cancers [1]. However, because the differences in characteristics can be subtle, accurate detection can be challenging and ambiguous [2,3]. Particularly at present time the key accepted technique in the world to detect cervical cancer cells is Papanicolau (Pap) test [1]. To realize Pap-test need to visualize pathological peculiarities of nuclear, cytoplasm and cell shape. For this purpose need to fix smears, and next many step treatments by chemicals (staining by dyes, washing, dehydration etc). This procedures lead to destruction of alive cells, removing very important diagnostic signs and artifacts emergence. Besides there is another problem with analyzing Pap smears, connected with drying changes in cells due to delays in applying the fixing procedure. It is very difficult to evaluate smears that have dried in air and still distinguish abnormal cells. Sample handling and its evaluation of Pap-test is a time consuming procedure and demands a sophisticated testing infrastructure and highly trained professionals to evaluate the cytological test as a result, the vast majority of women in the developing world do not have access to life-saving screening programs [4]. To reach the main goal of cervical cancer screening we need to find an accessible, simple, low cost, highly sensitive and fast complementary or substitutive method to detect cervical cancer cells instead of the Pap-test.

One of lacks of modern clinical cytology is use basically transmitted light optical microscopes. But clinical cytology almost does not pay attention to such important element of a cellular structure as features of membrane topography. The last can be result of infringement of a metabolism of all whole cell or only components of the membrane [4]. Structural changes of an external membrane can arise due to external physical and chemical factors, or thank to internal response to immune stresses. Meanwhile in the standard clinical microscopy techniques the surface of cells in smears is not investigated. According to the accepted rules smears of a patient undergo many step chemical processing. In so way rather valuable probably diagnostic signs of pathological cells will removed. Quite probably that as a result of processing occurrence in structure of objects of the various artifacts distorting the analysis [5].

For partial elimination of above mentioned shortcomings it is offered to use the optical microscopes working in reflected light. Besides it is possible to notice that received pictures of a cellular structure in an offered method of the analysis sometimes with such features which can be received only using a raster electronic microscope. At slanting illumination of a surface of analyzed cells, fine pattern of their structure get volume perception that facilitates decoding of results of the analysis.

Another high resolution tools such as the atomic force (AFM) or scanning electron microscopes (SEM) let us to see cell membrane and organelle more in detail but they operate in environments too harsh for living cells that leads to its damage. Typically, cells have to be treated with chemicals for fixation, dehydration and drying, and in the case of the SEM, coated with metal. Recently proposed Bioimprint method [6] is a soft lithography replication technique used to create a time-shot replica of biological cells in a polymer during curing. Cells at near-native states can be imprinted into a photo-curable polymer, and the imprint analyzed without imaging directly impacting on cell viability. A technique for permanently capturing a replica impression of biological cells has been developed to facilitate analysis using nanometer resolution imaging tools, namely AFM. The transfer of nanometer scale biological information is presented as an alternative imaging technique at a resolution beyond that of optical microscopy.

James K. Gimzewski, Jianyu Rao (Nat. Nanotechnol. DOI: 10.1038/nnano.2007.388) find that AFM can be used to distinguish metastatic cancer cells from normal cells on the basis of stiffness rather than shape. The cancer cells are significantly squishier than the normal cells, and the method promises to improve cancer diagnostics. The researchers find that metastatic cancer cells are nearly four times softer than normal cells.

This paper presents an alternative method for studying biological cells using a optical metallographic inverted microscope (MIM) technique, to enable imaging of the surface topography of human cervical cancer cells. Here we present a new optical-probe technique based on light-scattering microscopy that is able to detect precancerous and early cancerous changes in cell-rich epithelia.

Methods

Smears from uterine neck were collected for patients with diagnosis cervical cancer. Smears were collected by Ayre’s spatula after exposing the cervix by a Cusco’s speculum. Samples collected were transferred to glass slides. Glass slides were preliminarily cleaned thoroughly in a 2 vol.% detergent followed by repeated washing in pure deionized water. Two set of slides were prepared for each patient and fixed by 95% ethanol. Relevant information was obtained from the patient and recorded on a specially designed proforma. The first sets of marked slides were then sent to cytology laboratory to view at high magnification with MIM without fixing and any treatment by dyes. This native smears has been observed under optical reflected microscope “Neophot-2”. For each smear under investigation from 4 to 10-13 field of view was captured. In this case we watched a morphology and topology of cell membrane and captured these images on digital photocamera. This measurement has been performed in Institute of Electronics Uzbek Academy of Science. Both practitioner and patient can then see smears image in color. The results are then used as a basis for prescribing supplements.

The second set of smears was prepared on glass and fixed by 95% ethanol and stained with Papanicolaou dyes and were then sent to Pathology Institute and each slide was then carefully examined by a cytopathologist to distinguish normal cells from leased one. Relevant information was recorded on a specially designed proforma on PC and was marked on the slides. It was clearly specified whether smear was satisfactory or not. Slides showing some abnormal changes in the cellular pattern were further scrutinized by a cytopathologist. Images has been observed on optical microscope “JENAMED-2” and captured by digital high Resolution Microscopy Camera AxioCam MRc Rev. 3 FireWire.

Results and Discussion

Cervical normal and cancer cells was evaluated both traditional Pap-test and new MIM technique. On the figure 1 we can see image of normal cell (control smears) surface captured by MIM technique. with pronounced nuclear. Three kinds of multilayer epithelial cells were observed in control smears (Figure 1 b). Epithelial cells of upper layer had polygonal shape with smoothed cell surface and size about 30-60 mkm with small (about 6 mkm ) nuclear. Cells of more deep layers had smaller size. Parabasal cells of cervix epithelial layer had round shape with size 12-17 mkm and coarse nuclear enclosed by cytoplasm. Minor auto flora around cells was observed. Fine granularity was observed in cell cytoplasm of upper and deeper epithelial layers.

AWHC-18-115-Adkham Paiziev_ Uzbekistan_F1

Figure 1. Control cervical smears with normal epithelial cells. a-separate cells, b-parabasal cells of many layer pavement cervix epithelium.

In the case of traditional Pap-test cervical smears was fixed and stained by dyes (Figure 2). Here we can basically see content of cells (nuclear, nucleolus, cytoplasm, vacuole etc) and their shape. Hyperchromic pronounced enlarged nuclear rounded shape, anomalous ratio between nuclear and cytoplasm usually is main diagnostic peculiarity of Pap-test to distinguish cancer and normal cells. But Pap-test do not permit to see cancer cell membrane destruction due to removing any diagnostic signs on cell membrane. Offered here MIM technique deals with native smears and let us to see just membrane morphology in reflected light. Indeed for cervical cancer cells we observed ballooning–out of cell membrane with specific distribution around nuclear (Figure 2). This ballooning-out formations have high light reflectivity due to its content and smooth shape and named by us Light Reflecting Formations (LRF) (Figure 2.). They have rather small diameter (0.3-0.5 microns) and consequently were accurately observed only at big optical magnifications (800-1000×).

AWHC-18-115-Adkham Paiziev_ Uzbekistan_F2

Figure 2. Typical view of cervical cells after staining by dyes (Pap-smears).

For cervical epithelial cells two rinds of LRF arrangement on cell membrane are possible. The first variant is connected with presence of LRF only on polygonal cells from the top layer of multicellular epithelium (Figure 1). Thus LRF can settle down on a surface of cell membranes as by the piece (them it is possible even to count (Figure 3 a,b), and in the form of high density LRF associations (Figure 4а, b).

AWHC-18-115-Adkham Paiziev_ Uzbekistan_F3

Figure 3. Cervical cells of upper epidermal layer of patients with diagnosis Cr. coli uteri

AWHC-18-115-Adkham Paiziev_ Uzbekistan_F4

Figure 4. Assosiations of  LRF on  cervical cells of upper epidermal layer of patients  with diagnosis  а-Cr. coli uteri  and   b-Cr. corporis  uteri T1N0M0

The second really observable variant of LRF in cervical smears is connected with cells of intermediate and parabasal layers (Figure 5а). In intermediate roundish cells besides LRF it is sometimes shown clumpy granularity of cytoplasm and excentricly located nuclear (Figure 5а). In parabasal cells of the bottom epidermal layers from cervix LRF in size 12-15 microns basically settle down separately (Figure 5b). Thus, experimental data indicate that for cervical cancer cells LRF are observed on polygonal top layer epidermal cells or only on bottom layer cells. In the first case for some patients the surface of epithelial cells contained isolated LRF which was possible even to count them by the piece (Figure 3). But for other women similar cells have been entirely was choked up LRF (Figure 5а). It is not clear yet what is reason so difference in LRF arrangement on a cervical cancer cell surface, and density its distribution along membrane. The nature of LRF occurrence and a its chemical compound is not clear yet too The analysis of the literature let us to assume that observed structural phenomenon in cervical smears may be connected with strengthened vacuolisation of cytoplasms and intensive aerobic glycolysis (fermentation) in cancer cells [7].

AWHC-18-115-Adkham Paiziev_ Uzbekistan_F5

Figure 5. Neoplastic  intermediate (а) and parabasal (b) cells of many layer epithelium  of cervix.

AWHC-18-115-Adkham Paiziev_ Uzbekistan_F6

Figure 6. Ballooning–out of cervical cancer cells membrane.

Really, in the course of experiment we accurately observed intensive process of a cell membrane reorganization of cervical cancer cells. The location of the LRF on the cell membrane is shown in Fig. 4 too for patients with late stage of disease, where they are seen predominantly concentrated at areas around the nucleus. The diameter of non-dysplastic cell nuclei is typically 5 mkm, whereas dysplastic nuclei can be as large as 10 mkm and more.

The nature and mechanism formation these features of cancer cells are not understood up to now but they are potentially associated with exocytosis. It is accepted that in result of a cancer cell metabolism a granules or vesicles originate inside of cell and move towards cell surface to release its contents. Visualization of such morphological formations has however been limited, partly due to the difficulties with imaging native living or structurally intact cells because convenient transmitted light microscopy techniques do not reveal surface cell features which are usually removed after fixing, drying and other treatments of smears.

Much is yet to be known about the nature of cervical cancer cells and until now there has not been a reliable, simple method for cervical cell testing. We suppose that offered MIM method to visualize cell topography in air without fixation and dehydration may be alternative and complementary to Pap-test. Being able to directly view membrane structures regulated by exocytosis will enable researchers to analyze the secretory nature and response of cells, yielding insights into drug responses and effects [6]. Considerable variability in the sizes of LRF, as well as dynamic formation and grouping of these structures around the nucleus, illustrates that cells have diverse morphologies.

Conclusion

A technique for revealing surface morphology of human cervical cancer cells has been developed to facilitate early diagnostics of a pre-cancer and cancer cells under reflected light microscopy. The offered method was borrowed from optical microscopy of a solid state surface where the Metallographic Inverted Microscopy (MIM) is usually used. Unlike common accepted transmitted light microscopy for biological applications MIM technique allows to reveal a morphology and topology of a biological cells surface without any treatment by chemicals (fixing, staining, drying, freezing et al). The MIM method was demonstrated by analyzing fresh native smears from epithelium of uterine neck. MIM micrographs of 167 patients with diagnosis cervical cancer allow visualizing on the cancer cells surface numerous of the Light Reflective Formations (LRF). It is supposed that LRF are connected with exocytosis on the cell membrane. For smears of cervix epithelium throughout the field of view of a microscope numerous ballooning-outs, which have a mean size from 0.1-0.5 to 1.2 -1.3 mkm, are seen located on the cell surface. It is accepted that in result of a cancer cell metabolism a granules or vesicles originate inside of cell and move towards cell surface to release its contents. Visualization of such morphological formations has however been limited, partly due to the difficulties with imaging native living or structurally intact cells because convenient transmitted light microscopy techniques do not reveal surface cell features which are usually removed after fixing, drying and other treatments of smears. We suppose that offered method to visualize cell topography in air without fixation and dehydration may be alternative and complementary to Pap-test.

Acknowledgement

This work has been supported by Grant № X11-001 of Coordination Center for Science and Technology Republic of Uzbekistan.

References

  1. Koss LG (1989) The Papanicolaou test for cervical cancer detection. A triumph and a tragedy. JAMA 261: 737–743. [crossref]
  2. Hamby L (2002) Gene expression patterns and breast cancer. Cancer Genetics News, Spring 4: 1
  3. Palaoro LA, Blanco AM, Gamboni M, Rocher AE, Rotenberg RG (2007) Usefulness of ploidy, AgNOR and immunocytochemistry for differentiating benign and malignant cells in serous effusions. Cytopathology 18: 33–39.
  4. Goldie SJ, Gaffikin L, Goldhaber-Fiebert JD, Gordillo-Tobar A, Levin C, et al. (2005) Cost-effectiveness of cervical-cancer screening in five developing countries. N Engl J Med 353: 2158-2168. [crossref]
  5. DaCosta RS, Wilson BC, Marcon NE (2007) Fluorescence and spectral imaging. ScientificWorldJournal 7: 2046–2071. [crossref]
  6. Muys JJ, Alkaisi MM, Melville DOS, Nagase J, Sykes P, et al. (2006) Cellular transfer and AFM imaging of cancer cells using Bioimprint. Journal of Nanobiotechnology 4: 1–10.
  7. Mirabal YN, Chang SK, Atkinson EN, Malpica A, Follen M, et al. (2002) Reflectance spectroscopy for in vivo detection of cervical precancer. J Biomed Opt 7: 587–594. [crossref]

Social Determinants of Ideal Body Image: Comparing the Impact for Men and Women

DOI: 10.31038/AWHC.2018133

Abstract

Background: Traditional Ghanaian culture has held that the ideal body image for women favors a larger size as symbolic of wealth and status.

Objectives: This investigation evaluated the complex relationship between social and cultural variables and the body image perspectives of women and men residents of Cape Coast, Ghana in an attempt to provide a framework for assessing the diverse factors that influence body image.

Methods: An oral survey was administered by the investigators to 400 outpatients at the Regional Central Hospital. The survey included questions on body image; weight changes; media exposure; social and cultural influences on ideal image; food security; and select SF-36 questions.

Results: Both women and men selected an Ideal Body Image (IBI) figural silhouette that represented a size greater than a normal body mass index. Television was the most frequently identified source of media exposure and had the greatest influence on IBI. Some 21.1% of participants reported that their IBI was highly influenced by television, without a statistically significant difference between men and women. Women were significantly more likely to report being highly influenced by newspapers and magazines than men (18.3% versus 10.7%, p = 0.046). Women and men who were highly or moderately influenced by family opinions were significantly more likely to be dissatisfied with current body image than those not influenced by family (80.5% versus 64.8%, p = 0.017), (75.4% versus 48.0%, p = 0.001), respectively.

Conclusion: Social media exposure is common for the inhabitants of Cape Coast. Television was the most influential form of media on the body image. Social relationships were also an important determinant of body image dissatisfaction.

Keywords

Body Mass Index, Cultural Determinants, Current Body Image, Ghana, Ideal Body Image, Social Media

Financial Support: Scholars in Medicine Program, Harvard Medical School

Introduction

The influences on body image can be multifaceted and include social, cultural, media and relationship determinants. An understanding of such influences on women’s and men’s body image can assist health care providers to address the risks for noncommunicable illnesses such as hypertension and diabetes that are linked to an increased body mass index (BMI) as well as to introduce preventive measures or medical treatments 1,2].

One of the most broadly accepted theories of the determinants that influence body image is the sociocultural model, which suggests that standards of attractiveness set by Western society are unattainable for the vast majority of individuals, leading to a disparity between ideal and reality 3–8]. In a previous study assessing the ideal body image of women residing in Accra, Ghana and testing the hypothesis that the ‘traditional build’ is the ideal, the investigators instead found that the majority of women selected the IBI as one that represented a normal body mass index, and the least healthy image was that figure that represented morbidly obesity 2]. A direct relationship exists between media exposure and thin body size for women and body image dissatisfaction, with most finding a small-to-medium effect from media 9–12]. Studies focused exclusively on men have demonstrated a relationship between body image dissatisfaction and exposure to images of idealized bodies, many with a particular focus on the idea that exposure to images of enhanced male muscularity can modify male ideal body image [13–16]. Because body image and dissatisfaction appear to be highly specific to the cultural context in which they are developed, conclusions drawn in Westernized countries should not be applied directly to other countries or even across ethnic and racial lines [17, 18]. Studies in both developing and developed countries have documented body image dissatisfaction in various degrees across cultures and have confirmed the association of exposure to media images of so-called western ideals of attractiveness with such dissatisfaction [19]. This investigation evaluated the complex relationship between social and cultural variables and the body image perspectives of residents of Cape Coast, Ghana, a medium sized regional capital city [20].

Material and Methods

Study setting and population

The study was conducted at the Central Regional Hospital (now Cape Coast Teaching Hospital) in Cape Coast, Ghana, the capital of the Central Region of Ghana. The metropolis covers an area of about 122 square kilometers with a population of approximately 170.000. The Central Regional Hospital in Cape Coast serves as the main referral center for both primary and secondary healthcare facilities within the Central Region. The 400-bed hospital serves the residents within the Cape Coast municipality [21]. The study population included participants attending the Out-Patient Department (OPD) between June and July 2012. English-speaking Ghanaian men and women 18 years or older were approached as they entered the waiting area of the OPD. English is the official language of Ghana, and many regional languages exist in spoken form. Exclusion criteria included age less than 18 years, pregnancy or lactation status, residence outside the metropolis and inability to communicate sufficiently in English to complete the survey. Few patients approached ( < 5%) declined the survey or were consider ineligible because of language restrictions.

Survey

Participants were asked to complete survey administered by the investigators comprised of the following components: demographic information; exposure and impact of media and cultural influences including television, radio, print materials, billboards, Internet cell phones, family, spouse, friends and religion; food access and select questions from the Medical Outcome Short Study Form-36 [22–25]. Each participant was provided with a card indicating their personal measurements, their BMI and waist/hip ratio, and an explanation of each measurement (underweight, normal, overweight, obese) as a token of appreciation of their participation.

Figural Stimuli

Culturally appropriate figural stimuli for men and women were created based upon the mean height and weights obtained from the Women’s Health Study of Accra from 2003 [1]. Twenty-five individual silhouettes were created ranging from a representation of underweight figures to morbidly obese figures, uniformly changing in size by 10% increments (Figure 1, 2). Silhouette 8 represents the middle of the normal body mass index range. Participants were presented with two printed posters depicting images of men and women and asked to identify, by number, the figure that most closely matched their current body image (CBI), that of their spouse/partner, as well as an ideal body image (IBI) for self, spouse/partner, and Ghanaian men and women in general.
AWHC-18-114 - Rosemary B Duda_ USA_F1

Figure 1. Figural stimuli silhouettes – Women (Figure 8 represents the mid-range of a normal body mass index).
AWHC-18-114 - Rosemary B Duda_ USA_F2

Figure 2. Figural stimuli silhouettes – Men (Figure 8 represents the mid-range of a normal body mass index).

Anthropomorphic Measures

Anthropometric measurements were taken with participants wearing light street clothes without shoes [2]. Height and weight were obtained and recorded to the nearest 0.1 centimeters and 0.1 kilograms, respectively, with a standing measuring stick and a calibrated, portable scale. Waist and hip measurements were collected to the nearest 0.5 centimeters with a flexible tape measure designed for body measurements. WHO STEPS protocols were followed, with the tape measure fitted snuggly, and with waist defined as the midpoint between the lower margin of the last palpable rib and the top of the iliac crest and hip defined as the widest portion of the buttocks [26].

Statistical Analysis

BMI was calculated for each participant and categorized according to WHO standards, with underweight ≤ 18.5, normal weight 18.6–24.9, overweight ≥ 25.0 and obese ≥ 30.0. A body image dissatisfaction score (DS) was calculated by subtracting the figure selected as the IBI for self from that selected as the CBI (DS = CBI – IBIself). Statistical analysis was performed using SPSS version 16.0 for Windows and included descriptive statistics for frequency and mean values Fisher’s Exact Test (FET) 1-sided, student T-test, chi-square test, Pearson correlation, binary logistic regression analysis and multinomial regression analysis.

Institutional Review Board Approval

The investigation was approved by the Institutional Review Boards at Harvard Medical School, Boston, MA, USA and the University of Cape Coast School of Medical Sciences, Cape Coast, Ghana. Verbal consent was considered sufficient for participation in the survey and an informed consent signature waiver obtained.

Results

Participant characteristics

A total of 400 patients agreed to participate in this study. There was an equivalent number of male and female participants (49% versus 51%) and no statistically significant difference between gender and mean age, highest level of education attained, marital status, religion, and environment of birth and current residence
(Table 1). Women, however, were two times more likely to be unemployed compared with men (14.2% versus 7.7%, p = 0.026 FET), univariate analysis Odds Ratio (OR) = 2.0, 95 CI % (1.03–3.90), p = 0.039. Responses to the Medical Outcome Short Study Form-36 revealed that most of the participants (81.7%) reported they were in good to excellent health, were in much or somewhat better health compared to last year (53.0%) and were somewhat to very happy at the time of survey (85.1%).

Table 1. Participant Characteristics.

Men

n (%)

Women

n (%)

p-value

Participants

196 (49)

204 (51)

NS

Mean Age

33.8

32.5

NS

Highest Education level

NS

No Formal Education

2 (1.0)

7 (3.4)

Primary

5 (2.6)

8 (3.9)

Junior High (JSS)

26 (13.3)

25 (12.2)

Senior High (SSS)

81 (41.3)

84 (41.0)

Tertiary

73 (37.2)

75 (36.6)

Graduate

8 (4.1)

6 (2.9)

Relationship Status

NS

None

62 (31.6)

41 (19.8)

Unmarried Relationship

43 (21.9)

71 (34.3)

Married

84 (42.9)

70 (33.8)

Divorced

5 (2.6)

13 (6.3)

Widowed

0 (0)

12 (5.8)

Employment Status

0.026

Employed

181 (92.3)

175 (85.8)

Not Employed

15 (7.7)

29 (14.2)

Children

NS

None

101 (51.5)

109 (52.7)

Religion

NS

Christian

177 (90.3)

189 (92.6)

Muslim

17 (8.7)

12 (5.9)

None/Other

2 (1.0)

3 (1.5)

Environment, birth

NS

Urban

98 (50.3)

114 (56.2)

Semiurban

26 (13.3)

22 (10.8)

Rural

71 (36.4)

67 (33.0)

Environment, current

NS

Urban

59 (30.1)

68 (33.3)

Semiurban

117 (59.7)

120 (58.8)

Rural

19 (9.7)

14 (6.9)

NS = Not Significant

Body Mass Index

Height and weight measurements were available for all 400 participants. The distribution of BMI and gender are shown (Table 2). Obesity was identified significantly more often in women compared with men (20.1% versus 6.1%, p < 0.001), OR 1.6, 95% CI (1.25–1.96), p < 0.001.

Table 2. Body Mass Index by Gender.

Body Mass Index

Men

n (%)

Women

n (%)

Overall

n (%)

Underweight

10 (5.1)

10 (4.9)

20 (5.0)

Normal Weight

132 (67.3)

92 (45.1)

224 (56.0)

Overweight

42 (21.4)

61 (29.9)

103 (25.8)

Obese

12 (6.1)

41( 20.1)

53 (13.2)

Mean

23.3

25.9

24.6

Range

16.9 – 38.1

14.7 – 45.6

14.7 – 45.6

Current Body Image

The most frequently selected CBI for women were figures 11, 13, and 14 (9.3% each), larger than the silhouette representing the middle range of a normal BMI. The mean ± standard deviation current body image (CBI) silhouette selected by women was figure 14.5 ± 4.5 (range 1 to 25). Only 8 women (3.9%) selected figure 8 (mid-range of normal BMI) as their CBI. There was a significant correlation (r = 0.727, p < 0.001) between BMI and CBI silhouette for women.

The most frequently selected CBI for men were figures 10, 12, 13, and 14 (9.2, 12.8, 14.8 and 11.2%, respectively), as found with the women, larger than the silhouette representing the middle range of BMI. Only 5 men (2.6%) selected figure 8 (mid-range of normal BMI) as their CBI. The mean ± standard deviation current body image (CBI) silhouette selected by men was figure 13 ± 3.7 (range 2 to 24). There was also a significant correlation between increasing CBI silhouette selected and increasing BMI for men (r = 0.603, p < 0.001).

Ideal Body Image for Women and Men

Both women and men selected a figure that represented a size larger than Silhouette 8, the middle of the normal body mass index range. The most frequently selected silhouette for women to represent their ideal body image (IBI) for themselves was figure number 14 (mean figure 13.6 + 3.6, range 1 – 25). The most frequently selected silhouette for IBI by men for themselves was figure number 13 (mean figure 13.8 + 3.6, range 2 – 25). There was also a significant correlation between BMI and IBI for both women and men. The Pearson correlation between BMI and IBI for women was (r = 0.260, p < 0.001) and between CBI and IBI for women was (r = 0.551, p < 0.001). The Pearson correlation between BMI and IBI was (r = 0.141, p = 0.049) and between CBI and IBI for men was (r = 0.596, p < 0.001).

Women and men most frequently selected figure 13 as the IBI for a spouse/significant (15.6% and 17.1%, respectively). The most frequently selected IBI for a Ghanaian woman in general by women was figure 14 (15.5%, range 7–25, r = 0.480, p < 0.001). Figure 15 (13.5%, range 2–23) was most commonly selected by men as the IBI for a Ghanaian woman. In comparison, women and men both selected figure 15 as the IBI for men (range 7 – 25 and 4 to 25, respectively). There was a significant correlation between a man’s IBI for himself and for a man in general (r = 0.553, p < 0.001).

Dissatisfaction Score

The dissatisfaction score (DS) was calculated by subtracting the IBI from the CBI for women and men. Less than one-third (32.6%) of participants had a DS = 0, indicating the CBI = IBI. There was no significant difference between women and men with a DS = 0 (29.4% versus 35.9%, OR 1.34, 95% CI (0.88, 2.0), p = 0.168) (Table 3). However, women were significantly more likely to select an IBI smaller than the CBI compared with men (42.2% versus 28.4%, OR 1.51, 95% CI 1.18–1.94, p = 0.001). On a multivariate analysis, the variables significantly associated with a DS = 0 included: children (any versus none), stable weight for the past year, anticipating a stable weight in the next year, being less likely to have been told as an adult to gain or lose weight, and being less likely to be influenced by spouse/partner (Table 4). In addition, 64.6% of participants with a DS = 0 had a normal BMI; however, for each BMI category, most participants were dissatisfied with CBI (p < 0.001) (Table 5).

Table 3. Dissatisfaction score = Current Body Image – Ideal Body Image by Gender.

Dissatisfaction

Women (%)

Men (%)

Total (%)

p-value

CBI = IBI

29.4

35.9

32.6

NS

CBI < IBI

28.4

42.1

35.1

NS

CBI > IBI

42.2

22.1

32.2

0.001

NS = Not Significant

Table 4. Variables significantly associated with Dissatisfaction Score (DS) = 0 on multivariate analysis.

Variable

DS = 0 (%)

DS = Any (%)

OR

95% CI

p-value

Children, any

40.1

25.6

2.6

1.5, 4.1

< 0.001

Stable weight past year

34.1

24.1

1.6

1.2, 2.3

 0.003

Anticipate stable weight next year

56.1

27.1

1.9

1.4, 2.5

< 0.001

Told to gain weight as an adult

27.2

35.9

1.8

1.1, 3.0

0.028

Told to lose weight as an adult

20.4

39.1

1.9

1.1, 3.4

0.027

Influenced by spouse

20.9

46.2

2.5

1.5, 4.1

< 0.001

Table 5. Body Mass Index and Dissatisfaction Score.

Body Mass Index

DS = 0

DS = Any

p-value

%

%

Underweight

10.5

89.5

<0.001

Normal weight

37.5

62.5

<0.001

Overweight

35.0

65.0

<0.001

Obese

15.1

84.9

<0.001

Total

32.6

67.4

DS = Dissatisfaction Score

On multivariate analysis, a smaller IBI (DS = CBI > IBI) versus a larger IBI (DS = CBI < IBI) was statistically associated with: attempt to lose weight by caloric restriction, attempt to lose weight by exercise, told as an adult to lose weight, expect weight to decrease over the next year, and agree that weight has a very large effect on health, report no television viewing. Variables associated with a larger versus a smaller IBI included: unmarried status, attempt to increase weight with food (51.1% versus 18.6%), and told as an adult to gain weight (Table 6). Pertinent variables not associated with DS include environment of birth, environment of current residence, and media (television, radio, billboards, and internet usage), family, friends, religion, and food security.

Table 6. Multivariate analysis for variables that influence a positive or negative Dissociation Score.

Variable

CBI > IBI (%)

CBI < IBI  (%)

OR

95% CI

p value

Decrease weight by restricting caloric intake

67.4

12.1

5.2

2.2, 12.3

<0.001

Advise to lose weight as an adult

75.0

9.3

14.5

6.0, 35.2

<0.001

Decrease weight with exercise

71.3

19.3

10.4

5.9, 18.4

<0.001

Effect of weight on health  is very large effect

47.3

34.3

1.6

1.1, 2.3

0.007

Expected weight to decrease next year

64.3

7.9

2.7

1.9, 3.9

<0.001

No television viewing

76.0

49.6

1.9

1.2, 8.3

0.016

Unmarried status

57.4

72.1

1.5

1.1, 2.4

0.045

Increased weight by increasing caloric consumption

18.6

51.1

3.0

1.3, 6.8

0.010

Told as an adult to increase weight

17.1

61.2

3.7

1.7, 8.1

0.001

CBI = Current Body Image; IBI = Ideal Body Image; OR = Odds Ratio; CI = Confidence Interval

Media Influence and Ideal Body Image

A majority of participants reported exposure or access to each form of media assessed (Table 7). There was a significant difference in exposure to radio and newspaper/print between women and men. Men were significantly more likely to listen to the radio (OR = 2.51, 95% CI 1.13, 5.59) and read the newspaper (OR = 1.10, 95% CI 1.02, 1.16, p = 0.004) compared with women. A radio and television was present in 92.3% and 92.5% of all households, respectively. In addition, 97% of all participants had access to a cell phone and 60.2 percent had access to the Internet, with no statistical significant difference between women and men (97.1% versus 96.9%, p = 0.587 and 58.3% versus 62.2%, p = 0.243, respectively).

Table 7. Media Exposure and Influence on Ideal Body Image for Self by Gender.

Variable

Radio

Television

Newspaper/Print

Access overall (%)

92.2

90.8

64.7

     Women

89.2

88.7

57.8

     Men

95.4

92.9

71.8

     p value

0.016

0.105

0.002

Exposed 7 days per week (%)

71.8

75.2

14.0

     Women

69.1

76.5

8.8

     Men

74.5

74.0

19.5

     p value

0.140

0.322

0.002

Highly Influenced (%)

18.0

21.1

14.6

     Women

16.2

24.0

18.3

     Men

20.0

17.9

10.7

     p value

0.363

0.142

0.046

Not Influenced (%)

41.4

36.8

51.8

     Women

45.1

38.2

50.0

     Men

37.4

35.4

53.6

     p value

0.128

0.536

0.425

p -value represents difference between women and men for each variable.
NA = Not Applicable. Access to billboards not asked as they are ubiquitous in the region.
Analysis performed by Fisher’s Exact test, (2-sided).

Television was the most frequently identified source of media exposure and had the largest influence on IBI. Television was viewed daily by 75.2% of participants and 21.1% of participants reported that their IBI was highly influenced by television, without a statistically significant difference between men and women. Television was significantly associated with dissatisfaction, with those watching television seven days a week having significantly higher dissatisfaction score compared with those not watching television (–0.70 v. 0.48, p < 0.001). Although they read less print media overall, women were significantly more likely to report being highly influenced by newspapers and magazines than men (18.3% versus 10.7%, p = 0.046). Women who were highly or moderately influenced by friend or family opinions were significantly more likely to be dissatisfied (any versus none) with CBI compared with women not influenced at all (77.8% versus 60.0%, p = 0.011, and 80.5% versus 64.8%, p = 0.017, respectively, FET 2 sided). Women’s dissatisfaction score was not significantly associated with influence of television, radio, print media, billboards, spouse, or religion. However, men who were highly or moderately influenced by spouse or friend opinions were significantly more likely to be dissatisfied with CBI compared with men not influenced at all (63.3% versus 44.4%, p = 0.049, FET, 1-sided, and 75.4% versus 48.0%, p = 0.001, FET 2 sided, respectively). Men’s dissatisfaction score was not significantly associated with influence of television, radio, print media, billboards, family, or religion.

Social Influences and Ideal Body Image

Cultural, social and family determinants also had modest influence on IBI for self (Table 8). A spouse/partner had the overall influence on IBI (29.2%), although there was no statistical difference based upon participant gender. Women were significantly more likely to be influenced by friends compared with men (OR = 1.07, 95% CI 1.02, 1.14, p = 0.013).

Table 8. Cultural, Social and Family Influences on Ideal Body Image for Self by Sex.

Variable

Family

Spouse*

Friends

Religion

Highly Influenced (%)

19.3

29.2

18.8

12.8

     Women

22.1

26.6

23.5

9.8

     Men

16.4

32.0

13.9

16.1

     p value

0.164

0.529

0.015

0.074

Not Influenced (%)

45.4

31.8

39.2

73.6

     Women

43.1

35.3

39.2

74.5

     Men

47.7

28.1

39.2

72.5

     p value

0.422

0.180

1.000

0.501

* Included only if married.
Analysis performed by Fisher’s Exact test, (2-sided).

Social and family influences on gaining/losing weight were assessed for childhood and adulthood. During childhood, most participants were not encouraged to lose weight (91.7%), but almost one-third were told to gain weight (34.5%). Women were significantly more likely to have been told to gain weight as a child compared with men (OR = 1.68, 95% CI 1.10, 2.55, p = 0.015). In contrast, adult women were more likely to be told to lose weight compared with adult men (OR = 2.52, 95% CI 1.64, 3.88). Women were much more likely to have attempted weight loss compared with men. Women were significantly more likely to attempt to lose weight by dieting, (47.1% versus 18.4%, OR = 3.9, p < 0.001, CI = 2.0–7.9), exercising (48.5% versus 31.1%, OR 2.1, p = 0.001, CI = 1.4–3.1) and diet pills (10.8% versus 5.6%, p = 0.045, FET 1-sided).

Additional Health Related Determinants Influence on IBI

An open-ended question inquired about other possible factors that may influence IBI. Most respondents provided no additional types of influence (72%). However, of the 113 (64 men and 71 women) who did provide an open ended response, 53.1% of men and 33.8% of women stated improved health-related reasons as an important influence on their body image, while 23.9% of men and 17.0% of women mentioned a desire to appear more attractive. Only 3.1% of men and 5.6% of women noted social pressures as an external influence on IBI.

Discussion

Ghana provides a particularly unique environment to study body image. First, traditional Ghanaian culture has favored a larger image as ideal that for women, symbolic of wealth and higher status [27–30]. Second, there exists interplay between traditional and modern cultures resulting from rapid economic development, urbanization, modernization and social changes such as shifts in gender roles and exposure to western cultural practices and norms [20]. Further, rural-urban migration continues to occur at a rapid pace, with the rural proportion of Ghana’s total population dropping each year since 1960 and recently dropping below 50% [31]. The implication is that more and more traditional Ghanaian values are being brought along with such migrants to the city, even as recent migrants are exposed to new cultural values in the urban environment. Finally, the growing prevalence of overweight and obesity coupled with increasing longevity mean a rapidly increasing burden of chronic disease for Ghana, a problem that is pervasive in much of the developing world [32, 33]. Because of its position as a key parameter in understanding overweight and obesity and in shaping emotional health, body image is an important public health concern [34, 35].

The choice of 25 figures with standard variation ordered by increasing size was based on the example of the BIAS-BD figural drawing scale, the original version of which depicted 17 human figures [36]. Subsequent research on effective use of figural stimuli has shown that figural stimuli products using a discrete number of images (rather than a size range) and with images arranged in ascending/descending size order [as opposed to random) are the most accurate and effective as research tools [37]. While static figures obviously limit the creativity with which participants can express their ideal body image perspectives, we did test for and confirm that they were accurate in representing a participant’s current body image in regards to BMI, and we limited our investigation of body image to size rather than including other considerations such as shape or build.

We investigated determinants in combination with body image perspectives to better understand the factors that shape Ghanaians’ weight and their ideas about weight. Our study found a notable disparity between men and women in terms of proportion overweight and obesity, with 50.0% of women categorized as overweight or obese compared with 27.5% of men. These numbers are consistent with previous findings in Cape Coast [38]. We found only a few correlates for overweight or obesity, none of which provided a satisfying explanation for this gender disparity. As expected, age correlated with weight for both genders, as did number of children. Men were significantly more likely than women to be employed, and work of all types has been found to contribute to a less sedentary lifestyle [39] and lower rates of overweight/obesity; however, employment status was not correlated with BMI for men or women in our study. Further study might delve deeper into the relationship between employment type and body weight. We also found no relationship between education level and BMI, although such a relationship has been found in previous research in the region [28, 40].

We found no correlation between location of residence and BMI, although this has also been shown to be an important correlate of BMI [41]. This may be accounted for by the fact that participants are relatively mobile as – approximately 28.5% had lived in at least four places in their lives—and that a large number (37.5%) had lived in one or both of the two largest cities in Ghana (Accra or Kumasi) at some point, suggesting that even semi-urban and rural residents may have significant exposure to urban environments. Studies on body image have shown that both men and women are influenced by the figures they see in the media and in particular television, and that media exposure often creates unrealistic expectations for body image, leading to increased body dissatisfaction [4,13, 42]. One of the most notable findings in our research was the high level of media exposure reported by participants. These high levels of media exposure suggest that Ghanaians are susceptible to media influences that may influence their body image perceptions. One limitation to this assumption is that we did not examine amounts of daily media exposure, nor did we attempt to document the type of content participants were exposed to, both of which might have helped us better understand our participants and the influences on them.

We observed a significant relationship between high levels of television viewership and body image dissatisfaction within our sample population, suggesting the plausible presence of media content that may influence people’s body image ideals. Interestingly, unmarried men who watched television were significantly more likely to choose an IBI larger than their CBI, indicating a desire to be larger than their current size. Other studies have reported similar findings, and have suggested that men may be under increasing pressure to develop greater degrees of muscularity [4]. Indeed, formal and informal comments from men during the course of the survey confirmed that many were interested in being larger and more muscular.

Social interactions and body dissatisfaction relationships with friends and family were shown to be influential determinants in the establishment of body image, and in determining how an individual is affected by their body image [43]. Research in the United States has shown the influence of social relationships and support organizations on body image can be incredibly powerful in both positive and negative ways [44, 45]. We found that both spouse/partner and friends had a negative rather than positive influence on female body image, with women who identified strong influences from these determinants having greater body image dissatisfaction scores. However, family influence was not correlated with dissatisfaction, which may suggest either that adults are less influenced by the opinions of their families, or that family members are more likely to be supportive, making them less apparent as a source of influence.

Although our question about self-reported influence did not reveal as strong a relationship between social forces and dissatisfaction as we found for television, our secondary social influences questions, which assessed whether participants had ever been told to change their weight, were incredibly telling. Among a wide variety of factors, being told to change weight as an adult was the most strongly associated with body image dissatisfaction, and what participants had been told was tied to the type of dissatisfaction they experienced, with those who had been told to gain weight favoring a smaller ideal, and those who had been told to lose weight favoring a smaller one. This supports the idea that negative messages about weight from social networks are very powerful.

The concept of influence from media and relationships seemed to be an idea that some participants were familiar, while others appeared to have a much more difficult time contextualizing the way in which images, ideas or other people could affect their personal body image concept. This may have led to some participants providing arbitrary or inaccurate answers to our influences questions. Further study into body image in this context is warranted. In particular, drawing out more detailed information about the types of influences present in Ghanaian media, adding qualitative inquiry methods to our work and perhaps determining novel ways to inquire about the concept of influence would all be helpful in revealing more about body image attitudes in Ghana.

References

  1. Duda RB, Jumah NA, Hill AG, Seffah J, Biritwum (2006) Interest in healthy living outweighs presumed cultural norms for obesity for Ghanaian women. Health and Quality of Life Outcomes 4: PMC 1544332.
  2. Duda RB, Jumah NA, Hill AG, Seffah J, Biritwum R (2007) Assessment of the ideal body image of women in Accra, Ghana. Trop Doct 37: 241–244. [crossref]
  3. Thompson J, Heinberg M, Altabe M, Tantleff-Dunn S (1999) Exacting Beauty: Theory, assessment and treatment of body image disturbance. American Psychological Association, Washington DC. USA.
  4. Thompson JK, Heinberg LJ (1999) The Media’s Influence on Body Image Disturbance and Eating Disorders: We’ve Reviled Them, Now Can We Rehabilitate Them? Journal of Social Issues 55: 339–353.
  5. Cash TF, Smolak L (2011) Understanding body image: historical and contemporary perspectives. In: Cash TF, Smolak L (eds.). Body image: a handbook of science, practice, and prevention. Guilford Press, New York, USA Pg No: 3–11.
  6. Cash TF (2012) Cognitive-behavioral perspectives on body image. In: Cash TF (ed.). Encyclopedia of body image and human appearance. Oxford, Elsevier Pg No: 334–342.
  7. Laus MF, Kakeshita IS, Costa TM, Ferreira ME, Fortes Lde S, et al. (2014) Body image in Brazil: recent advances in the state of knowledge and methodological issues. Rev Saude Publica 48: 331–346. [crossref]
  8. Holland G, Tiggemann MA (2016) systematic review of the impact of the use of social networking sites on body image and disordered eating outcomes. Body Image 17: 100–110.
  9. Grabe S, Ward LM, Hyde JS (2008) The role of the media in body image concerns among women: a meta-analysis of experimental and correlational studies. Psychol Bull 134: 460–476. [crossref]
  10. Want SC (2009) Meta-analytic moderators of experimental exposure to media portrayals of women on female appearance satisfaction: Social comparisons as automatic processes. Body Image 6: 257–269.
  11. Fernandez S, Pritchard M (2012) Relationships between self-esteem, media influence and drive for thinness. Eat Behav 13: 321–325. [crossref]
  12. Cafri G, Yamamiya Y, Brannick M, Thompson JK (2005) The Influence of Sociocultural Factors on Body Image: A Meta-Analysis. Clinical Psychology: Science and Practice 12: 421–433.
  13. Blond A (2008) Impacts of exposure to images of ideal bodies on male body dissatisfaction: a review. Body Image 5: 244–250. [crossref]
  14. Leit RA, Gray JJ, Pope HG (2002) The media’s representation of the ideal male body: A cause for muscle dysmorphia? International Journal of Eating Disorders 31: 334–338.
  15. Daniel S, Bridges SK (2010) The drive for muscularity in men: media influences and objectification theory. Body Image 7: 32–38. [crossref]
  16. Agliata D, Tantleff-Dunn S (2004) The impact of media exposure on males’ body image. Journal of Social and Clinical Psychology 23: 7–22.
  17. Kronenfeld LW, Reba-Harrelson L, Von Holle A, Reyes ML, Bulik CM (2010) Ethnic and racial differences in body size perception and satisfaction. Body Image 7: 131–136. [crossref]
  18. Yates A, Edman J, Aruguete M (2004) Ethnic differences in BMI and body/self-dissatisfaction among Whites, Asian subgroups, Pacific Islanders, and African-Americans. J Adolesc Health United States 34: 300–307.
  19. Swami V, Frederick DA, Aavik T, Alcalay L, Allik J, et al. (2010) The Attractive Female Body Weight and Female Body Dissatisfaction in 26 Countries Across 10 World Regions: Results of the International Body Project I. Personality and Social Psychology Bulletin 36: 309–325.
  20. Agyei-Mensah S, de-Graft Aikins A (2010) Epidemiological transition and the double burden of disease in Accra, Ghana. J Urban Health 87: 879–897. [crossref]
  21. Central Regional Hospital (2008) Central Regional Hospital, Cape Coast: 2008 Annual Report. Cape Coast Central Regional Hospital, interberton road, Cape Coast, Ghana.
  22. Ware JE Jr (2008) Improvements in short-form measures of health status: introduction to a series. J Clin Epidemiol 61: 1–5. [crossref]
  23. Ware JE Jr (2003) Conceptualization and measurement of health-related quality of life: comments on an evolving field. Arch Phys Med Rehabil 84: 43–51. [crossref]
  24. Ware JE, Kosinski M (2001) Interpreting SF-36 summary health measures: a response. Qual Life Res 10: 405–413. [crossref]
  25. Stewart A, Ware J (1992) Measuring Function and Well-Being: The Medical Outcomes Study Approach. 1st  (edn). Duke University Press Books, Durham, USA.
  26. WHO (2011) Waist circumference and waist-hip ratio: report of a WHO expert consultation, Geneva, 8–11 December 2008. WHO Press, Geneva.
  27. Smith AD (2009) Girls being force-fed for marriage as fattening farms revived. The Observer.
  28. Addo J, Smeeth L, Leon DA (2009) Obesity in urban civil servants in Ghana: association with pre-adult wealth and adult socio-economic status. Public Health 123: 365–370. [crossref]
  29. Cogan JC, Bhalla SK, Sefa-Dedeh A, Rothblum ED (1996) A Comparison Study of United States and African Students on Perceptions of Obesity and Thinness. Journal of Cross-Cultural Psychology 27: 98–113.
  30. Cassidy CM (1991) The good body: when big is better. Med Anthropol 13: 181–213. [crossref]
  31. Bank W (2013) World dataBank: World Development Indicators. Washington DC, USA.
  32. Amuna P, Zotor FB (2008) Epidemiological and nutrition transition in developing countries: impact on human health and development. Proc Nutr Soc 67: 82–90. [crossref]
  33. Caballero B (2001) Introduction. Symposium: Obesity in developing countries: biological and ecological factors. J Nutr 131: 866–870.
  34. Krentz AJ (2006) Self-image in obesity: clinical and public health implications. J R Soc Med 99: 215–217. [crossref]
  35. Muennig P, Jia H, Lee R, Lubetkin E (2008) I think therefore I am: perceived ideal weight as a determinant of health. Am J Public Health 98: 501–506. [crossref]
  36. Gardner RM, Jappe LM, Gardner L (2009) Development and validation of a new figural drawing scale for body-image assessment: the BIAS-BD. J Clin Psychol 65: 113–122. [crossref]
  37. Gardner RM, Brown DL (2011) Method of presentation and sex differences when using a revised figural drawing scale to measure body size estimation and dissatisfaction. Percept Mot Skills 113: 739–750. [crossref]
  38. Amegah A, Lumor S, Vidogo F (2011) Prevalence and Determinants of Overweight and Obesity in Adult Residents of Cape Coast, Ghana: A Hospital-Based Study. African Journal of Food, Agriculture, Nutrition and Development 11: 4828–4846.
  39. Van Domelen DR, Koster A, Caserotti P, Brychta RJ, Chen KY, et al. (2011) Employment and physical activity in the U.S. Am J Prev Med 41: 136–145. [crossref]
  40. Dake FA, Tawiah EO, Badasu DM (2011) Sociodemographic correlates of obesity among Ghanaian women. Public Health Nutr 1285–1291.
  41. Ziraba AK, Fotso JC, Ochako R (2009) Overweight and obesity in urban Africa: A problem of the rich or the poor? BMC Public Health 9: 465. [crossref]
  42. Derenne JL, Beresin EV (2006) Body image, media, and eating disorders. Acad Psychiatry 30: 257–261. [crossref]
  43. Field AE, Austin SB, Camargo CA, Taylor CB, Striegel-Moore RH, et al. (2005) Exposure to the Mass Media, Body Shape Concerns, and Use of Supplements to Improve Weight and Shape Among Male and Female Adolescents. Pediatrics 116: 214–220.
  44. Pole M, Crowther JH, Schell J (2004) Body dissatisfaction in married women: the role of spousal influence and marital communication patterns. Body Image. Netherlands 267–278.
  45. Eisenberg ME, Berge JM, Fulkerson JA, Neumark-Sztainer D (2010) Weight comments by family and significant others in young adulthood. Body Image. Elsevier Ltd Netherlands 2011: 12–19.
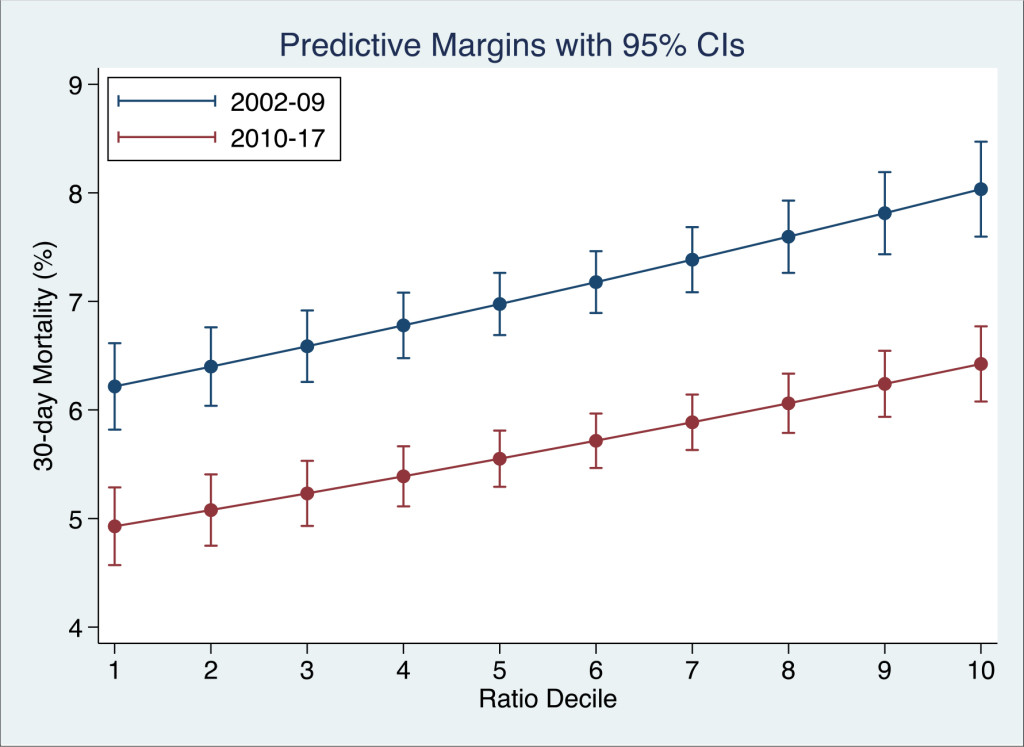
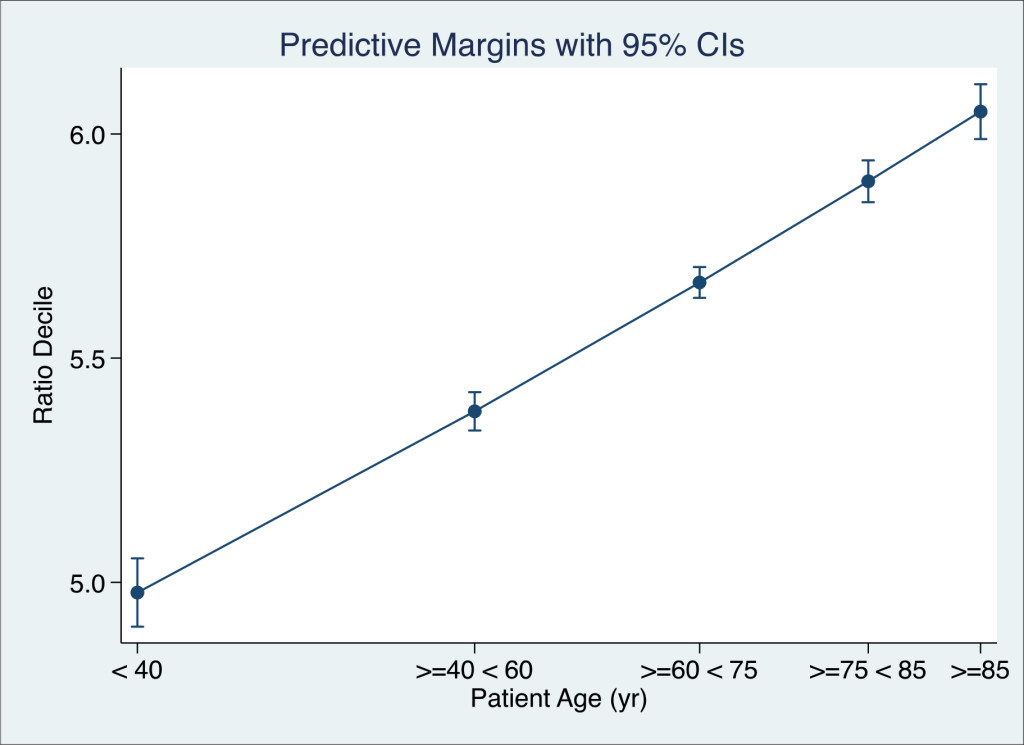
Dental Injuries Following Segmented Le Fort I Osteotomy – A Retrospective Radiographic Study of 101 Patients

DOI: 10.31038/JDMR.2018122

Abstract

Segmented Le Fort I osteotomy is a surgical procedure which allows the posterior segments to be repositioned more coronally to close an open bite, as well as correcting transverse discrepancies. The aim of this retrospective study was to assess the prevalence of injuries to teeth and surrounding hard tissues in patients who had undergone the Le Fort I osteotomy procedure with maxillary segmentation. In total, 101 patients were included according to predetermined criteria. Radiographs from the 6-month postoperative follow-up were reviewed in all patients. Complications such as root fractures, root resorptions, periodontal defects, sclerotic and osteolytic processes were noted. Intraoral periapical radiographs were primarily reviewed and where unavailable, panoramic radiographs were instead used. In addition, preoperative and postoperative radiographs up to 30 months were reviewed in patients with found radiographic changes at 6 months. In cases with root fracture, the medical record was reviewed in search of any additional treatment. Seven root fractures were noted in total. Only one tooth required replacement, in this case with a dental implant. Clinically significant complications to teeth adjacent to vertical osteotomies from the Le Fort I osteotomy with maxillary segmentation were uncommon.

Keywords

Complications; Interdental Osteotomy; Le Fort I Osteotomy; Maxillary Segmentation; Orthognathic Surgery

Introduction

Transverse discrepancies and anterior open bite can be successfully treated with a combination of fixed orthodontic appliances and maxillary segmentation [1, 2]. If an open bite exists on a level occlusal plane, it can be surgically corrected in one piece by reducing the height of the maxilla, mostly in the posterior portion, after a one piece Le Fort I osteotomy. A step in the occlusal plane, however, necessitates segmentation of the maxilla for proper correction of the discrepancy [3]. The segmented Le Fort I osteotomy is a surgical procedure which allows the surgeon to reposition each segment into the desired positions so that a narrow maxilla can be widened or to close an open bite. In such operations, vertical interdental osteotomies are performed in order to segment the maxilla. There are to our knowledge relatively few studies reporting on complications to teeth and surrounding bone tissue in conjunction with vertical interdental osteotomies. Kahnberg and colleagues reported a low incidence of hard tissue complications and iatrogenic damage to teeth [4] while another study by Schultes et al. indicaes that interdental osteotomies may result in severe periodontal tissue breakdown and segmental loss of teeth [5]. Schou et al. and Morgan and Fridrich did not find that interdental osteotomies lead to significant marginal bone destruction [6, 7] which was later confirmed in two studies published more recently [8, 9]. The aim of this retrospective study was to assess the prevalence of injuries to teeth and surrounding hard tissues following the segmented Le Fort I osteotomy.

Materials and Methods

Patients subjected to segmented Le Fort I osteotomy between January 2005 and December 2015 at the Department of Oral and Maxillofacial Surgery, The Sahlgrenska Academy, University of Gothenburg were included in the study according to following inclusion and exclusion criteria:

Inclusion criteria

  • Undergone segmented Le Fort I osteotomy with or without simultaneous mandibular surgery between January 2005 and December 2015.
  • Combined orthodontic and surgical treatment.
  • Available intra-oral and/or panoramic radiographs 6 months postoperatively.

Exclusion criteria

  • Undergone segmented Le Fort I osteotomy without preoperative orthodontic treatment.
  • No available intra-oral or panoramic radiographs 6 months postoperatively.
  • Undergone the operation more than once.

A total of 101 patients (mean age 22.8 years, median age 21 years, range 17–61 years, SD = ±7.56) were included (Table 1). The most common diagnosis necessitating maxillary segmentation was an anterior open bite, which meant the maxilla was typically segmented into four pieces. Radiographs were analysed under dimmed lighting on computer monitors (HP Elite Display E222, 1920×1080) by two authors (G.M and J.M.W). When agreement between authors was not reached, the radiographs in question were presented to an oral and maxillofacial radiologist (H.L) for decision. Primarily, intraoral periapical radiographs were examined and secondarily panoramic radiographs. Radiographs for all 101 patients were analysed at 6 months after surgery with respect to teeth and surrounding tissues adjacent to the interdental osteotomies. The following radiographic changes were noted: osteolytic processes (i.e. widened periodontal ligament spaces (WPLs) and periapical osteolyses), sclerotic processes, marginal bone loss, angular bony defects, root resorptions and root fractures. The preoperative and all follow up radiographs up to 30 months postoperatively were analysed in cases with found radiographic changes at radiographs taken at the 6-month recall.

Table 1. Collected data at the 6-month recall.

Sex

Male

60

Female

41

Radiographs

Intra-oral and panoramic

42

Panoramic only

59

Interdental osteotomies

Unilateral

10

Bilateral

91

Surgical procedure

The surgical procedure was carried out as follows [1, 10]: Incisions were made in the buccal sulcus, extending from the second premolar to the inferior aspect of the nasal spine. The periosteum was then elevated at the superior aspect of the incision, extending posteriorly to expose the lateral wall of the maxillary sinus. Nasal mucosa was then elevated from the piriform aperture and osteotomies were then carried out, beginning with a cut extending from the piriform rim to the zygomatic buttress and posteriorly through the lateral wall of the maxillary sinus. After sectioning the lateral nasal wall, the maxilla was then disengaged from the pterygoid bone using an osteotome inferior to the pterygomaxillary cleft. The lateral wall of the sinus was then separated using an osteotome in a posterior direction. At this point in the operation, maxillary segmentation was carried out. This was done by elevating the periosteum in the region of the inter dental osteotomy, most commonly between the canine and the first premolar bilaterally. The buccal cortical bone was cut with a bur and the osteotomy was then completed with an osteotome. The maxilla was at this stage down fractured with inferior pressure on the anterior teeth. Complete mobilization of the maxilla was obtained with an osteotome applying force in an anterior direction from the maxillary tuberosity. The maxillary segmentation was completed proceeding from the superior aspect of the maxilla. Stainless steel wires were used to fixate the maxilla to the mandible, with a surgical splint for guidance. The maxillomandibular complex was then fixated with titanium plates and screws in the desired position. Soft tissue was closed beginning with appropriate positioning of the facial muscles, concluding with closure of the mucosa.

Statistical analysis

The Two-Proportion Z-Test (SPSS Inc., Chicago, Illinois, USA) was utilised in order to assess the correlation of the proportion of the radiographic changes with the type of radiograph analysed and also comparing unilateral with bilateral osteotomies. p < 0.05 was considered statistically significant.

Results

The results are summarised in (Table 2). Ninety-one patients underwent bilateral interdental osteotomies and 11 patients unilateral. 384 teeth were therefore examined at the 6-month follow-up. All 35 patients with radiographic changes at 6 months had preoperative radiographs available, one of which underwent the unilateral osteotomy, meaning 138 teeth were examined at this point. At the 18-month recall, radiographs for 25 patients were available and 98 teeth were included. At 30 months, only one patient had radiographs available, meaning the inclusion of 4 teeth. Overall, 35% of patients were found to have some form of radiographic changes at the 6-month recall. Male and female patients had an equal likelihood of having radiographic changes at 6 months. Fifty percent of patients with intraoral radiographs were found to have radiographic changes and 24% in the group with only panoramic radiographs available. This difference was statistically significant (z = 2.7, p < 0.01). Ten percent of patients with unilateral osteotomies and 37% of patients with bilateral osteotomies exhibited radiographic changes, but this difference was not statistically significant (z = 1.7, p > 0.05).

Table 2. Summary of radiographic changes.

Preop.

+6 months

+18 months

+30 months

(n = 138)

(n = 384)

(n = 98)

(n = 4)

WPL

7

4

1

0

Periapical osteolysis

3

5

2

0

Sclerotic process

2

5

1

0

Marginal bone loss

1

3

2

0

Angular bony defect

0

7

4

0

Root resorption

20

29

21

0

Root fracture

0

7

2

1

Total defects

33

60

33

1

WPL: widened periodontal ligament space

Osteolytic processes

The osteolytic processes registered were periapical radiolucencies and widened periodontal ligament spaces (WPLs). At the initial 6-month follow-up, 4 of teeth adjacent to the osteotomies were found to have WPLs, two of which were seen on the preoperative radiographs. The remaining two teeth had no visible WPLs at 18 months. However, an additional WPL was found on a different tooth at this point. Five teeth were found exhibiting periapical osteolytic processes at the 6-month mark, one of which was present preoperatively. At the 18-month follow-up, only two of the patients (two of the teeth) had available radiographs, where one tooth exhibited a remaining periapical radiolucency. Another of the patients, with an affected tooth, who lacked 18-month radiographs did have a 30-month follow-up, however, where the periapical radiolucency was no longer visible.

Sclerotic processes

Five teeth were found to have sclerotic processes at 6 months, two of which were visible preoperatively. At the 18-month recall, one of the teeth with postoperative sclerosis lacked radiographs and in the remaining two, the scleroses were no longer visible.

Marginal bone loss and angular bony defects

Three osteotomy sites were found to have a marginal bone level located ≥ 3 mm from the CEJ 6 months postoperatively, two of these sites had a reduced marginal bone level compared with radio- graphs taken preoperatively. At 6 months, the marginal bone level at these two sites was measured at 7 mm and 4.5 mm respectively, compared to 1.5 mm and 2 mm at radiographs taken before surgery. Two of these patients were examined with panoramic radiographs at 18 months and no further bone loss could be detected. The third patient, with marginal bone loss of 2.5 mm, did not have available radiographs at 18 months. Seven interproximal tooth surfaces were found exhibiting adjacent angular bony defects at 6 months, none of which were visible on the preoperative radiographs. At the 18-month followup, one of the bony defects lacked radiographs, and of the remaining 6, two were no longer present.

Root resorptions

Twenty-nine teeth were found with root resorptions at 6 months, 20 of which were present preoperatively, indicating that 9 had arisen after surgery. Two of these teeth lacked radiographs at 18 months, and an additional 6 teeth were registered as having root resorptions that were not noted in earlier radiographs.

Root fractures

Seven teeth (5 premolars and 2 canines) were found with root fractures at 6 months, none of which were present preoperatively (Figure 1). At 18 months, three of these teeth lacked radiographs and in one other case the intraoral radiograph did not capture the area with the root fracture. Of the three remaining teeth examined at 18 months, one was still visible and had healed into the bone, one was examined only with panoramic imaging and was no longer discernible. The third tooth was eventually extracted and replaced with an implant. There was a 30-month follow-up for one of the fractures not examined at 18 months, where it could still be seen to be healed into the bone.

Discussion

The aim of this study was to assess the prevalence of injuries to teeth and surrounding hard tissues adjacent to vertical interdental osteotomies in patients who had undergone the Le Fort I osteotomy with maxillary segmentation. The main drawback of this study was the relatively small proportion of intraoral radiographs covering the interdental osteotomy area. A majority of the patients had only panoramic radiographs available, hindering the detection of the subtle radiographic changes which were the subject of this study. There was significantly fewer radiographic changes found on panoramic radiographs (z = 2.7, p < 0.01). Intraoral radiographs are more appropriate in the detection of these radiographic changes due to their higher resolution [11]. We suggest therefore that intraoral radiographs are taken in cases where interdental osteotomies have been performed, as a complement to extraoral imaging techniques. Panoramic radiographs are taken routinely during the follow up of patients undergoing orthognathic surgery for evaluation of healing of bone segments and fixation material. Overlapping in the upper premolar region and superimposition of osteosynthesis plates was not uncommon in some of the panoramic radiographs included in this study, making it difficult to distinguish radiographic changes in these cases. According to Lofthag Hansen and co-workers, periapical lesions not detected on intraoral radiographs may be visible when using CBCT [12]. Routine use of three-dimensional imaging techniques in the follow-up of patients undergoing orthognathic surgery is however not justified, due to the relatively high radiation exposure.

JDMR-18-109-Lars Rasmusson_ Sweden_F1

Figure 1. Periapical radiograph of a patient presenting with root fracture of 24.

To this study’s advantage is the relatively large patient sample included, increasing the generalisability of the results. No differences were found between the sexes with regards to the proportion of radiographic changes found. Ten percent of patients that underwent a unilateral interdental osteotomy exhibited radiographic changes at 6 months compared to 37% in the group with bilateral osteotomies. This difference was not found to be statistically significant, perhaps owing to the small population in this study that underwent the unilateral variant. A higher prevalence in the bilateral group would be expected in that a patient is more likely to receive dental injury when two interdental osteotomies are performed compared to one.

Four teeth in this study were found to have periapical osteolytic processes not present on preoperative radiographs, three of these teeth had additional follow-up radiographs, where two of the periapical osteolyses were no longer visible, indicating that healing had occurred in these cases. It is possible that the presence of periapical osteolyses is due to the teeth being devitalised by the operation. A study by Bell showed that horizontal osteotomy cuts within 5 mm of the apices of adjacent teeth could disturb pulpal blood circulation and thus risk devitalising the teeth [13]. In the present study however, the horizontal osteotomies were seen radiographically to be of adequate distance from the apices. Another possibility is that vertical osteotomies in close proximity to the apex of the adjacent teeth have disturbed the blood circulation in a similar manner. Nevertheless, none of the affected teeth underwent endodontic treatment within the confines of this study. Kahnberg et al. proposed that endodontic treatment should be considered in cases where the tooth is symptomatic. They also recommend regular clinical follow-up in cases where a periapical osteolysis is radiographically visible [4].

In this patient material, two percent (7 of 384) of the teeth were damaged during the vertical interdental osteotomy procedure, resulting in root fractures, one of which was subsequently replaced by an implant. The root fracture that was replaced with an implant was due to the fracture line reaching the level of the marginal bone, thwarting healing into the bone. Horizontal root fractures located within the coronal third of the root are associated with poor prognosis [14]. Orthodontic tipping of the roots of adjacent teeth away from the planned vertical osteotomy site is important to reduce the risk of iatrogenic root fracture [10] and could perhaps also serve to reduce the risk of compromised pulpal blood flow. Our results regarding postoperative loss of teeth are in line with what was reported by Kahnberg et al., Ho et al. and Rodrigues et al. [4, 8, 9]. Schultes et al. reported a higher incidence of postoperative tooth loss, likely due to the high prevalence of periodontal injury in that study [5]. Root resorption was seen in 29 teeth at the 6 month follow up, 20 of which were visible preoperatively. These findings imply that the vast majority of root resorptions in this study were due to the orthodontic pretreatment [15, 16]. In a study utilising CBCT, it has been shown that root resorptions can be detected in varying degrees in almost all teeth following treatment with fixed orthodontic appliances [17]. Root resorptions that were detected postoperatively may be influenced by surgical trauma and/or orthodontic treatment. Marginal bone loss was detected in two osteotomy sites which is comparable to what is reported by Schou et al. and Kahnberg et al. [4, 6]. Small, subclinical alterations in marginal bone level were however not registered in this study. One limitation of intraoral and panoramic radiographs in assessing the marginal bone level is that measurements can only be performed at the interproximal sites. Orthodontic forces have been shown to lead to a significant reduction of the crestal height at the buccal, lingual and palatal aspects of teeth. [18].

Radiographic changes present on preoperative radiographs indicate a non-surgical etiology. When taking this into account, the proportion of patients with radiographic changes falls from 35% to 28%. On the level of individual teeth adjacent to the osteotomy sites, the corresponding risk for a tooth adjacent to the osteotomy site would be 9% in this study, as 34 teeth exhibited radiographic changes at the 6-month follow-up which were not present preoperatively. However, had patients with only panoramic radiographs available at 6 months been excluded from this study, due to the aforementioned lower resolution of panoramic radiographs, the risk of incurring radiographic changes to an individual tooth adjacent to the vertical osteotomy could be said to be 15% (excluding findings present preoperatively).

Conclusion

Overall it can be concluded from this study that the risk posed to teeth adjacent to vertical osteotomies in conjunction with Le Fort I osteotomies is low, with 1 in 384 teeth included in this study requiring extraction and replacement.

Conflict of interest: We have no conflicts of interest to disclose.

Ethical approval: Ethical approval was not required.

References

  1. Kahnberg KE (2007) Transverse expansion of the maxilla using a multisegmentation technique. Scand J Plast Reconstr Surg Hand Surg 41: 103–108.
  2. Silva I, Suska F, Cardemil C, Rasmusson L (2013) Stability after maxillary segmentation for correction of anterior open bite: a cohort study of 33 cases. J Craniomaxillofac Surg 41: e154–158. [crossref]
  3. Hupp JR, Ellis E, Tucker MR (2014) Contemporary Oral and Maxillofacial Surgery. St Louis MO: Elsevier Pg No: 520–539.
  4. Kahnberg KE, Vannas-Löfqvist L, Zellin G (2005) Complications Associated with Segmentation Of The Maxilla: A Retrospective Radiographic Follow Up Of 82 Patients. International Journal of Oral and Maxillofacial Surgery 34: 840–845.
  5. Schultes G, Gaggl A, Kärcher H (1998) Periodontal disease associated with interdental osteotomies after orthognathic surgery. J Oral Maxillofac Surg 56: 414–417. [crossref]
  6. Schou S, Vedtofte P, Nattestad A, Stoltze K (1997) Marginal bone level after LeFort I osteotomy. British Journal of Oral and Maxillofacial Surgery 35: 153–156.
  7. Morgan TA, Fridrich KL (2001) Effects of the multiple-piece maxillary osteotomy on the periodontium. Int J Adult Orthodon Orthognath Surg 16: 255.
  8. Ho MW, Boyle MA, Cooper JC, Dodd MD, Richardson D (2011) Surgical complications of segmental Le Fort I osteotomy. Br J Oral Maxillofac Surg 49: 562–566. [crossref]
  9. Rodrigues DB, Campos PSF, Wolford LM, Ignácio J, Gonçalves JR (2018) Maxillary Interdental Osteotomies Have Low Morbidity for Alveolar Crestal Bone and Adjacent Teeth: A Cone Beam Computed Tomography-Based Study. J Oral Maxillofac Surg S0278–2391: 30111–30113.
  10. Andersson L, Kahnberg KE, Pogrel MA (2010) Oral and Maxillofacial Surgery 2010; Chichester: John Wiley & Sons Ltd Pg No: 1009–1012.
  11. White S, Pharoah M (2014) Oral radiology 2014; St. Louis, Missouri: Elsevier Pg No: 177.
  12. Lofthag-Hansen S, Huumonen S, Gröndahl K, Gröndahl HG (2007) Limited cone-beam CT and intraoral radiography for the diagnosis of periapical pathology. Oral Surg Oral Med Oral Pathol Oral Radiol Endod 103: 114–119. [crossref]
  13. Bell WH (1969) Revascularization and bone healing after anterior maxillary osteotomy. A study using adult rhesus monkeys. Journal of Oral Surgery 27: 249.
  14. Cvek M, Andreasen JO, Borum MK (2001) Healing of 208 intra-alveolar root fractures in patients aged 7–17 years. Dent Traumatol 17: 53–62. [crossref]
  15. Goldson L, Henrikson CO (1975) Root resorption during Begg treatment; a longitudinal roentgenologic study. Am J Orthod 68: 55–66. [crossref]
  16. Linge L, Linge B (1991) Patient characteristics and treatment variables associated with apical root resorption during orthodontic treatment. American Journal of Orthodontics and Dentofacial Orthopedics 99: 35–43.
  17. Lund H, Gröndahl K, Gröndahl HG (2012) Cone beam computed tomography evaluations of marginal alveolar bone before and after orthodontic treatment combined with premolar extractions. Eur J Oral Sci 120: 201–211. [crossref]
  18. Lund H, Gröndahl K, Hansen K, Gröndahl HG (2012) Apical root resorption during orthodontic treatment. A prospective study using cone beam CT. Angle Orthod 82: 480–487. [crossref]

Endocrine Disruptors-caused Faulty Hormonal Imprinting: Focus on Women

DOI: 10.31038/AWHC.2018132

Abstract

Hormonal imprinting is a physiological process, when hormone receptors and the target hormone meet in the first occasion, perinatally. This process is needed for the normal function of the receptor-hormone complex and valid for life. However, hormone-like molecules also can bind to the developing receptor causing faulty imprinting and its consequences: altered binding of hormones, inclination to diseases, manifestation of diseases, disturbing the physiological hormonal regulation. The faulty imprinting also has a lifelong effect. Industrial, communal, nutritional and medical endocrine disruptors are faulty imprinters and their variables as well, as amounts are enormously growing in the human environment. The faulty imprinting influences also the microsomal enzyme system. Numerous diseases, manifested at adult age can be deduced to perinatal faulty hormonal imprinting and the higher sensitivity of women to drugs (more adverse reactions) could be explained by perinatal events. The extremely growing variants and amount of endocrine disruptors could rearrange the whole endocrine system, which could be disastrous or useful alike in the future.

Keywords

Bisphenol A, DOHaD, Endocrine Regulation, Steroid Hormones, Perinatal Period, Functional Teratogens

Introduction

During fertilization the genom of the women’s egg contain the maternal informations and the paternal informations are brought by the sperm. After the fusion of two germ cells the zygote is existing, which is able to develop further to the complete organism (individuum), controlled by the fused genome (ontogeny). The zygote is totipotent which means that it is able for developing to any organs (cells) of the organism however, during the ontogenetic development there is a continuous loss of potencies, to pluripotent (multipotent) and at last to unipotent cells, which are able to produce cells (by cell division) similar to the mother-cell, or are unable to divide (e.g. nerve cells) at all. This means that during the ontogenetic development a continuous narrowing of potencies happens which is resulted in diffent types of cells, with different structure and function. Therefore, in different cell types of the organism different genes are manifested (are working, giving information for function), while others are closed by methylation of the cytosin nucleotids of DNA. The organization of these different units is the duty of the neuroendocríne system in which the direct transmitter humoral components are the hormones. However, the neuroendocrine system can regulate only such functions, which are permitted by the genes, which are open for giving information to the given functions.

The Physiological and Faulty Hormonal Imprinting

The hormones are present in the blood circulation, where any cells of the organism can meet them. However, only such cells can decipher the message contained by the hormone, which have cell membrane or nuclear receptors for the given hormone, which can bind the hormone and after that can transmit the coded information into the cytoplasm or into the nucleus. These receptors are specific for a given hormone, nevertheless this specificity also develops gradually during the ontogenetic development. During the embryonal and early fetal period of human life maternal hormones (passed across the placenta) are dominating however, at the end of the fetal and during the perinatal period (prenatally, at birth and early postnatally) the „homegrown” hormones appear and hormonal imprinting is taking place, conforming the receptors for themselves. This imprinting is necessary, without it the fitting of receptor-hormone system is not working well [1]. The setting is valid for life and inherits to cell to cell inside the cell line as well as to the progenies of the individuum, as it is an epigenetic process, which alters the methylation pattern of a given gene (the expression of the gene), without disturbing the nucleotid sequences [2]. However in this critical perinatal period the receptors’ specificity is weak, what means that other members of a hormone family or synthetic hormones, hormone-like molecules also can be bound by them and the amount of imprinter is also very important. In this case a faulty hormonal imprinting can develop, which is also have a lifelong validity and causes disturbed functions, with abnormal binding of hormones in adult age [3]. Consequently, disturbed functions appear in behavior [4–6], sexuality [6–8], body composition [9], in bone development [10]; the neurotransmitter production of brain is also altered and immune functions are changed (e.g. autoimmunity develops). One single encounter with very low doses of hormone-like molecules in the critical perinatal period is enough for the provocation of faulty imprinting and for the manifestation of their consequences in adult age. The hormonal imprinting which was observed, described and experimentally justified by us (at first in 1980) [11] was the first in the series of new theories which lead to metabolic imprinting [12], immunological imprinting [13] and to the developmental origin of health and disease (DOHaD) [14]. As hormonal imprinting is an epigenetic process, the alterations happened in the perinatal period can be manifested at any time of life and also can be manifested in the progenies and by this, epigenetic alterations of the future generations are settled on the already changed genetic arrangements. This is important as the response of a faulty imprinted cell or organism would be different from which is observed in the present time.

The Endocrine Disruptors

Endocrine disruptors are molecules similar to (first of all, steroid) hormones, which are present in our environment and can enter into our organism by air, water, food, drug consumption and can be bound by hormone receptors influencing cell functions, stimulating or hindering them. Endocrine disruptors has been always present during the evolution of men in our environment as e.g. aromatic hydrocarbons produced by volcanic eruptions, food components (phytoestrogens, present in soy and other vegetables), smoke etc. However, they were not named to „endocrine disruptors” as their such effects were not known and their amount was insignificant. At present, in our modern (industrial) age their variety is high, their amount is large and both are enormously growing. They causes a crisis in the endocrine system as well in the systems, which are seriously influenced by the distorted endocrine system.

Endocrine disruptor exposures are believed harmful in adult age and this is demonstrated by many research data and statistics. However, they are more harmful in the critical periods of development, mainly in the time of hormonal imprinting. In this case they are causing faulty hormonal imprinting with lifelong consequences. In animal experiments single treatment with aromatic hydrocarbons (benzpyrene or dioxin) are decreasing the binding capacity of glucocorticoid receptor as well as estrogen receptor. Vitamin D3 (which is not a vitamin in reality, but a steroid-like hormone having receptors in the cytoplasmic-nuclear steroid receptor family [15], lifelong decreases the sexual activity (libido) of female and male rats, similar to industrial or communal endocrine disruptors [16].

Faulty Hormonal Imprinting and Functional Teratogenicity of Endocrine Disruptors

Teratogen materials, which evoke morphological alterations which are visible at birth are known from immemorial time and these are most effective during the embryonal period and their effects gradually decreases whith the time passed and vanishes after birth. Faulty hormonal imprinting does not provoke morphologically observable important alterations, but changes in functions of cells organs or systems which are manifested in diseases. They are not diagnosed at birth however, manifested later, mostly in adults. This is a functional teratogenity, without organic changes. An other difference to the morphological (real) teratogens that the possibility for exposure is longer: the perinatal period is the late phase of intrauterine development for morphological teratogens however, faulty imprinting can be provoked at any time e.g. also postnatally, few days or weeks after birth and other critical periods of life. The absolute need for taking place is the multiplication and differentiation of the touched cells.

Faulty hormonal imprinting inclines to diseases, alters behaviors, influences cell-responses to attacks, etc. In the scientific literature there are extreme amount of experimental data and also human observations can be found however, in the frame of a short review paper only a selection of them can be shown. Nevertheless they are represantatively demonstrate the importance and amount of the problems caused by it in the present modern age.

Sexual and Behavioral Problems Caused by Faulty Hormonal Imprinting

Perinnatal exposure to TCDD (2,3,7,8-tetrachlorodibenzo-p-dioxin) an environmental contaminant (originated from volcanic eruptions as well as from exhaust gas of cars) and industrial or agricultural imprinters (bisphenol A, vinclozolin) pushes the boy-adventageous sex-ratio (more boys are delivered than girls) for the adventage of girls after paternal exposure (in human [16] and also to maternal exposure [17]) (in rats and mice). Bisphenol A (the well known plasticizer and representative of endogen disruptors) by prenatal and lactational exposure, changes the behavior of adults. Prenatal bisphenol A exposure provokes externalizing behavior in 2 years old children, especially in females [18] and abolishes the differences between male and female sexual behavior [19] and also modifies sexual behavior in female mice. It also alters sex difference in affective disorders. There is such opinion which calls attention to the future problems with school age. Some experiments and observations point to the possible association between early bisphenol A exposures (perinatal imprinting) and autism spectrum disorders)[19,20]. Pubertal bisphenol A exposures caused long term alterations in microglia of the prefrontal cortex when this was lower in males and higher in females [21]. There were also alterations in body weight and composition. Perinatal treatment and adolescent reexposure exacerbated adverse effects in females and reduce differences in males. Symptoms of sex dependent anxíety/depression appeared in 7–9 years girls without expression in boys after gestational bisphenol A exposures [22]. Altered sociosexual and mood disorders were observed in animal models and children after developmental exposure by bisphenol A [23].

Other Problems Caused by Faulty Hormonal Imprinting

Reproductive organs and puberty

First in the US and later in Europe an alteration in the timing of puberty (decline) was observed and also the growing number of obesity for which environmental factors, mainly endocrine disruptors was believed as responsible, by influencing genetic factors [24] These problems were observed after imprinting with polychlorinated biphenyls, polibrominated biphenyls, DDT and phtalate esters [25]. Both puberty age and menarche age were influenced [26, 27]. The perinatal endocrine exposures can provoke central precocious puberty or isolated breast development in 2 months to 4 year old girls [28].

Growing number of human (male and femele) infertility and decreased fertility were observed [29]. In the case of perinatal exposure by bisphenol A decreased methylation of DNA and increased histone H3 acetylation were observed in the cerebral cortex and hippocampus, affecting the liver, gut, adipose tissue endocrine pancreas, mammary gland and reproductive tract functions [30]. Maternal programming was also altered [31]. Neonatal exposure to diethylstilbestrol (DES) caused early or delayed puberty, depending on the dose [32] by affecting hypothalamus and hippocampus. This is supported by rodent and human data [33]. Exposure in people is a result of contamination of foods or inhalation (e.g.house or occupational dust). Endocrine disruptors (bisphenol A and phtalates) negatively influence the function of the immune system, altering T cell subsets, B cell functions, dendritic cell and macrophage biology, and provoking autoimmune diseases [34,35]. They have a controversial role in influencing longevity [36]. The developing immune system, the cells of which have steroid (estrogen) hormone receptors is very sensitive to the presence of endocrine disruptors [35]. Faulty imprinting by endocrine disruptors could be responsible for pathological development of bones as well, as for changes in bone mineralization and osteoporotic fractures or other bone problems [37–41].

Gender differences in adverse drug reactions between men and women

It is very difficult to compare data of gender differences in the past-time adverse reaction to drugs, with relatively fresh (which were won in the time of endocrine disruptors) data as earlier always mens’data were studied and dosages of drugs were also prescribed exclusively for men [42–44]. However, new data show that women have 1.5 to 1.7-fold greater risk for adverse drug reactions than men [43]. For example, anti-bacterial and anti-inflammatory drugs cause more adverse reactions in females, as compared to males [42]. Cardiovascular diseases are the first case in mortality and disability of women [44]. There is a similar situation in case of addictions: considering alcohol intoxication compared to men, women metabolize alcohol less than men, it become intoxicated drinking half as much, develop cirrhosis more rapidly and have a greater risk of dying from alcohol-related accidents [45]. Drug abuse and dependence are not identical in males and females and females are less successful in quitting of alcoholism and nicotinism.

Conclusion

As most of the known endocrine disruptors are steroid hormone-like molecules, the functions [46], which are regulated by physiological steroid hormones are disturbed by them. The palette of these functions is broad, from sexuality to immunity and the period in which their effects are manifested is also very broad. They already disturb the sexual (male-female) ratio at birth, pushing it to the adventage of females, cause malformations of sexual organs (micropenis, cryptorchidism and hypospadias), provoke, as functional teratogens, faulty hormonal imprinting. However there are other critical periods of life (development) at weaning, during adolescence and for continuously dividing cells, during the whole life. In these cases endocrine disruptors are also able to provoke hormonal imprinting, which can modify the perinatal setting however, the effect of them less serious, than the perinatal one.

The difference between males and females in adverse drug reactions can be explained by sex differences in pharmacokinetics and pharmacodynamics, in which the liver microsomal enzyme system has an important role. The hormonal imprinting touches not only the hormonal system but also the (microsomal) enzyme system [47,48] and this interferes into the different adverse drug reactions by males and females. There is a gender-dependent metabolism which is influenced by microsomal enzymes which are different in the two sexes [49]. This influences pharmacokinetics and consequently toxicity. As was mentioned, this factor can give some explanation to the differences in adverse reactions by males and females, and faulty hormonal imprinting can disturb this process. This means that in contrast to the real (morphological ) teratogens faulty hormonal imprinting does not causes morphological alterations, which are visible to the naked eye, however alterations in the hormonal or receptorial system as well, as in the enzyme system, durably changing the function of the cells, which are regulated by hormones. This renders likely (though the animal and human data are modest) that women (females) are more sensitive to faulty imprinters and some of their adverse reactions (and the overweight of women in adverse reactions) can be wrote to the expense of faulty perinatal hormonal imprinting.

It was mentioned that a single low dose of an endocrine disruptor seems to be enough for the provocation of faulty hormonal imprinting if it arrives in the optimal time for doing it (e.g.perinatal critical period). It is not surprizing if somebody consider that during the differentiation of the brain, when the direction of sexual development is determined, a part per billion of testosterone and about twenty parts per trillion of estradiol (endogeneous estrogen) actually predict entirely different brain structures, behavioral traits, enzyme levels and receptor levels in tissues [50]. It must be consider that the brain is basically female and it must be exposed to testosterone and related hormones for transforming to male . This means, that the receptorial system is ready to accept the imprinters, the developmental window is open for setting by single minimal doses of hormone-like materials (endocrine disruptors) and this is „exploited” by them (faulty imprinters). The gender differences in sensitivity and its epidemiological importance should be considered.

The late manifestation of alterations after the faulty hormonal imprinting makes more difficult to recognize the participation of faulty imprinting in the manifestation of a disease, or in the changes of behavior. It is supposed, that prenatal exposure to bisphenol A may be related to increased behavioral problems in school age boys, but not girls. However, although serious problems are expectable very difficult to forecast their quality and quantity. At any rate, thorough observations would be needed, for avoiding the problems. However, it seems to be difficult really to avoid, as the variants and amount of different endocrine disruptors are enormously growing because of the claims of the industry, which wants to earn a lot of money, and the people, who want to live more comfortable. In additon, when a new molecule justifies its usefulness in the industry or as a medicament, it is not known (however sometimes could be guessed, but the expected pleasant effects suppresses anxiety), that it will be an endocrine disruptor. Fortunately, it is known that during pregnancy new exogeneous molecules must be avoided however, it is not known by lay medical practitioners and laywomen, that this regulation -in the light of faulty imprinting- must be extended to the whole period of pregnancy and also postnatally.

The task of medicine is to help people in the avoidance of illnesses or to heal ill people. This is done by giving advices or after diagnosing a disease, giving therapy for healing, which is mostly done by prescribing drugs. However, some drugs are endocrine disruptors themselves, for example anticoncipients and some vitamins. Anticoncipients are used for avoiding pregnacy, consequently they do not cause faulty imprinting in the person (women), who intakes it. However, the wast products of metabolized anticoncipients are present in the urine and contaminates drinking water, which is drinked by other, (pregnant) women. If we know, that minute amounts of an endocrine disruptor is able to provoke faulty imprinting, this could be done by the communal water. This is obvious, however can not be declared without exact measurements. Other medicaments are not tested for imprintership before running to circulation and can also contaminate the waters, or influence the endocrine system of developing fetus, directly. Drugs entering into breastmilk also can be faulty imprinters [51] and it is also known that most of baby foods are soy-based, consequently contain phytoestrogens (coumestrol, genistein and daidzein), which are known faulty imprinters [52–54]. Lipid soluble vitamins are prescribed by doctors and can be bought in pharmacies however, also can be purchased without prescription in self-service shops [55]. This shows that mankind is not prepared for the invasion and effects of faulty imprinters.

Afterwords

Pessimistically grasping, the growing of disruptor-inventar and the amount of disruptors, the future of mankind seems to be dangerous and threatening, as -endocrine disruptors -by faulty hormonal imprinting- can attack the whole endocrine system and the desorganization of the gene-level determined well- functioning system could cause hitherto unknown diseases or proliferation of known malignancies. In addition, the alterations are inherited to the progenies, epigenetically. However, there is -optimistically- an other version [55]: some of the endocrine disruptors internalized into the present endocrine system and new (better) functions will be manifested, which will be better suited to the continuously transformed world. Some examples had been observed to such transformation in the past, e.g. the infiltration of lipid soluble vitamins (e.g.vitamin A and D -hormones) and their prominent function in animal (human) life [56] . As can not be known what scenario will be the winner, the protection of women (as mothers) from endocrine disruptor effects is a very important mission of the present day mankind.

References

  1. Csaba G, Nagy SU (1985) Influence of the neonatal suppression of TSH productiion (neonatal hyperthyroidism) on response of TSH production in adulthood. J Endocrinol Invest 8: 557–559. [crossref]
  2. Csaba G (2011) The biological basis and clinical significance of hormonal imprinting, an epigenetic process. Clin Epigenetics 2: 187–196. [crossref]
  3. Csaba G (1984) The present state in the phylogeny and ontogeny of hormone receptors. Horm Metab Res 16: 329–335. [crossref]
  4. Nakamura K, Itoh K, Dai H, Han L, Wang X, et al. (2012) Prenatal and lactational exposure to low-doses of bisphenol A alters adult mice behavior. Brain Dev 34: 57–63. [crossref]
  5. Wolstenholme JT, Taylor JA, Shetty SR, Edwards M, Connelly JJ, et al. (2011) Gestational exposure to low dose bisphenol A alters social behavior in juvenile mice. PLoS One 6: e25448. [crossref]
  6. Chen F, Zhou L, Bai Y, Zhou R, Chen L (2014) Sex differences in the adult HPA axis and affective behaviors are altered by perinatal exposure to a low dose of bisphenol A. Brain Res 1571: 12–24. [crossref]
  7. Evans SE, Kobrosly RW, Barrett ES, Thurston SW, Calafat AM, et al. (2014) Prenatal bisphenol A exposure, maternally reported behavior in boys and girls. Neurotoxicology 45, 91–99.
  8. Csaba G (2017) The Present and Future of Human Sexuality: Impact of Faulty Perinatal Hormonal Imprinting. Sex Med Rev 5: 163–169. [crossref]
  9. Rubin BS, Paranjpe M, DaFonte T, Schaeberle C, Soto AM, et al. (2017) Perinatal BPA exposure alters body weight and composition in a dose specific and sex specific manner: The addition of peripubertal exposure exacerbates adverse effects in female mice. Reprod Toxicol 68: 130–144.
  10. Csaba G (2018) Bone manifestation of faulty perinatal hormonal imprinting: a review. Curr Pediatr Rev 25. [crossref]
  11. Csaba G (1980) Phylogeny and ontogeny of hormone receptors: the selection theory of receptor development and hormonal imprinting. Biol Rev Camb Philos Soc 55: 47–63.
  12. Hanley B, Dijane J, Fewtrell M, Grynberg A, Hummel S, et al. (2010) Metabolic imprinting, programming and epigenetics – a review of present priorities and future opportunities. Br J Nutr 104: 1–25.
  13. Lemke H, Tanasa RI, Trad A, Lange H (2009) Benefits and burden of the maternally-mediated immunological imprinting. Autoimmun Rev 8: 394–399.
  14. Barker DJ (2007) The origins of the developmental origins theory. J Intern Med 261: 412–417. [crossref]
  15. Lorenzen M, Boisen IM, Mortensen LJ, Lanske B, Juul A, et al. (2017) Reproductive endocrinology of vitamin D. Mol Cell Endocrinol 453: 103–112. [crossref]
  16. Ishihara K, Warita K, Tanida T, Sugawara T, Kitagawa H, et al. (2007) Does paternal exposure to 2,3,7,8-tetrachlorodibenzo-p-dioxin (TCDD) affect the sex ratio of offspring? J Vet Med Sci 69: 347–352. [crossref]
  17. Yonemoto J, Ichiki T, Takei T, Tohyama C (2005) Maternal exposure to 2,3,7,8-tetrachlorodibenzo-p-dioxin and the body burden in offspring of long-evans rats. Environ Health Prev Med 10: 21–32. [crossref]
  18. Kubo K, Arai O, Omura M, Watanabe R, Ogata R, et al. (2003) Low dose effects of bisphenol A on sexual differentiation of the brain and behavior in rats. Neurosci Res 45: 345–356. [crossref]
  19. Hashemi F, Tekes K, Laufer R, Szegi P, Tóthfalusi L, et al. (2013) Effect of a single neonatal oxytocin treatment (hormonal imprinting) on the biogenic amine level of the adult rat brain: could oxytocin-induced labor cause pervasive developmental diseases? Reprod Sci 20: 1255–1263.
  20. Stein TP, Schluter MD, Steer RA, Guo L (2015) Bisphenol A Exposure in Children With Autism Spectrum Disorders. Autism Res 8: 272–283. [crossref]
  21. Wise, LM, Sadowski RM, Kim T, Willing J, Juraska JM (2016) Long-term effects of adolescent exposure to bisphenol A on neuron and and glia number in the rat prefrontal cortex: Differences between the sexes and cell type. Neurotoxicology 53: 186–192.
  22. Perera F, Nolte ELR, Wang Y, Margolis AE, Calafat AM, et al. (2016) Bisphenol A exposure and symptoms of anxiety and depression among inner city children at 10–12 years of age. Environ Res 151: 195–202. [crossref]
  23. Hicks HD, Sullivan AV, Cao J, Sluzas E, Rebuli M, et al. (2016) Interaction of bisphenol A (BPA) and soy phytoestrogens on sexually dimorphic sociosexual behaviors in male and female rats. Horm Behav 84: 121–126.
  24. Parent AS, Franssen D, Fudvoye J, Pinson A, Bourgignon JP (2016) Current changes in pubertal timing: Revised vision in relation with environmental factors including endocine disruptors. Endocr Dev 29: 174–184.
  25. Den Hond E, Schoeters G (2006) Endocrine disrupters and human puberty. Int J Androl 29: 264–271. [crossref]
  26. Massart F, Parrino R, Seppia P, Federico G, Saggese G (2006) How do environmental estrogen disruptors induce precocious puberty? Minerva Pediatr 58: 247–254.
  27. Schoeters G, Den Hond E, Dhoge W, van Larebeke N, Leijs M (2008) Endocrine disruptors and abnormalities of pubertal development. Basic Clin Pharmacol Toxicol 102: 168–175.
  28. Leonardi A, Cofini M, Rigante D, Lucchetti L, Cipolla C, et al. (2017) The effect of bisphenol A on puberty: a critical review of the medical literature. Int J Environ Res Public Health 14.
  29. Tomza-Marciniak A, StÄ™pkowska P, Kuba J, Pilarczyk B (2018) Effect of bisphenol A on reproductive processes: A review of in vitro, in vivo and epidemiological studies. J Appl Toxicol 38: 51–80. [crossref]
  30. Kumar D, Thakur MK (2017) Effect of perinatal exposure to Bisphenol-A on DNA methylation and histone acetylation in cerebral cortex and hippocampus of postnatal male mice. J Toxicol Sci 42: 281–289. [crossref]
  31. Schneider, JE, Brozek JM, Keen-Rhinehart E (2014) Our stolen figures: the interface of sexual differentiation, endocrine disruptors, maternal programming, and energy balance. Horm Behav 66: 104–119.
  32. Bourguignon JP, Franssen D, Gerard A, Jannsen S, Pinson A, et al. (2103) Early neuroendocrine disruption in hypothalamus and hippocampus: developmental effects including female sexual maturation and implications for endocrine disrupting chemical screening. J Neuroendocrinol 25: 1079–1087.
  33. Rasier G, Toppari J, Parent AS, Bourgignon JP (2006) Female sexual maturation and reproduction after prepubertal exposure to estrogens and endocrine disrupting chemicals: a review of rodent and human data. Mol Cell Endocrinol 25: 254–255.
  34. Rogers JA, Metz L, Yong VW (2013) Review: Endocrine disrupting chemicals and immune responses: a focus on bisphenol A and its potential mechanisms. Mol Immunol  53: 421–430.
  35. Csaba G (2014) Immunoendocrinology: faulty hormonal imprinting in the immune system. Acta Microbiol Immunol Hung 61: 89–106. [crossref]
  36. Csaba G (2018) Immunity and longevity. Acta Microbiol Immunol Hung 65: 1–17.
  37. Karabélyos C, Horváth C, Holló I, Csaba G (1999) Effect of perinatal synthetic steroid hormone (allylestrenol, diethylstilbestrol) treatment (hormonal imprinting) on the bone mineralization of the adult male and female rat. Life Sci 64: 105–110.
  38. Karabélyos C, Horváth C, Holló I, Csaba G (1998) Effect of neonatal glucocorticoid treatment on bone mineralizaton of adult non-treated, dexamethasone-treated or vitamin D3-treated rats. Gen Pharmacol 31: 789–791.
  39. Karabélyos C, Horváth C, Holló I, Csaba G (1998) Effect of neonatal vitamin D3 treatment (hormonal imprinting) on the bone mineralization of adult non-treated and dexamethason-treated rats. Hum Exp Toxicol 17: 424–429.
  40. Karabélyos C, Horváth C, Holló I, Csaba G (1999) Effect of perinatal synthetic steroid hormone (allylestrenol, diethylstilbestrol) treatment (hormonal imprinting) on the bone mineralization of the adult male and female rat. Life Sci 64: 105–110.
  41. Curtis EM, Krstic N, Cook E, D’Angelo S, Crozier SR, et al. (2018) Gestational vitamin D supplementation leads to reduced perinatal RXRA DNA methylation: Results from the MAVIDOS trial. J Bone Miner Res 2018 Oct 15. [crossref]
  42. Zopf Y, Rabe C, Neubert A, Janson C, Btune K, et al. (2009) Gender-based differences in drug prescription: relation to adverse drug reactions. Pharmacology 84: 333–339.
  43. Rademaker M (2001) Do women have more adverse drug reactions? Am J Clin Dermatol 2: 349–351. [crossref]
  44. Baggio G, Corsini A, Floreani A, Giannini S, Zagonel V (2013) Gender medicine: a task for the third millennium. Clin Chem Lab Med 51: 713–727. [crossref]
  45. Greenfield SF (2002) Women and alcohol use disorders. Harv Rev Psychiatry 10: 76–85. [crossref]
  46. Lymperi S, Giwercman A (2018) Endocrine disruptors and testicular function. Metabolism 86: 79–90. [crossref]
  47. Csaba G, Dobozy O, Szeberényi S (1987) A single neonatal treatment with methylcholanthrene or benzo(a)pyrene alters microsomal enzyme activity for life. Acta Physiol Hung 70: 87–91. [crossref]
  48. Csaba G, Szeberényi S, Dobozy O (1986) Influence of single neonatal treatment with allylestrenol or diethylstilbestrol on microsomal enzyme activity of rat liver in adulthood. Med Biol 64: 197–200. [crossref]
  49. Waxman DJ (1984) Rat hepatic cytochrome P-450 isoenzyme 2c. Identification as a male-specific, developmentally induced steroid 16 alpha hydroxylase and comparison to a female-specific cytochrome P-450 isoenzyme. J Biol Chem 25: 15481–15490.
  50. Hood E (2005) Are EDCs blurring issues of gender? Environ Health Perspect 113: 670–677. [crossref]
  51. Csaba G (2018) Lifelong impact of breastmilk transmitted hormones and endocrine disruptors. J Clin Endocrinol Res In Press 2018.
  52. Bar-El DS, Reifen R (2010) Soy as an endocrine disruptor: cause for caution? J Pediatr Endocrinol Metab 23: 855–861. [crossref]
  53. Csaba G (2018) Effect of endocrine disruptor phytoestrogens on the immune system: Present and future. Acta Microbiol Immunol Hung 65: 1–14. [crossref]
  54. Bennetau-Pelissero C (2016) Risks and benefits of phytoestrogens: where are we now? Curr Opin Clin Nutr Metab Care 19: 477–483. [crossref]
  55. Csaba G (2018) The role of endocrine disruptors in future human endocrine evolution: The ED-exohormone system. Current Trends Endocrinol under publication.
  56. Csaba G (2017) Vitamin-caused faulty perinatal hormonal imprinting and its consequences in adult age. Physiol Int 104: 217–225. [crossref]