Abstract
A certified reagent kit for newborn screening was transferred on a fully automated dried blood spot platform. The dried blood spot cards are directly eluted and the extract is online guided to tandem mass spectrometry instrument, where the amino acid and acyl carnitine panel is detected. The method takes 2 minutes per sample and requires no human interaction for up to 500 samples. The method is fully standardized through the automation and the usage of only certified consumables and reference material. The manual reagent kit was first modified to fit the automated platform, secondly validated and third, successfully transferred into a routine newborn screening laboratory.
Keywords
Dried blood spot, Newborn, Screening, Amino acid, Carnitine, Automation
Introduction
Newborn screening (NBS) is a public health program provided by most of the countries around the world aimed at screening newborns for a list of serious genetic and metabolic disorders. Early diagnosis of these conditions can help prevent their further development, which if untreated often results in brain damage, organ damage, and even death [1–4]. A routine neonatal screening procedure requires that a health professional takes a few drops of blood from the baby’s heel, applies them onto special filter paper and sends such prepared samples to a laboratory for a number of analytical tests [5].
The amino acids and acyl carnitines are detected in modern methods with tandem mass spectrometry (MS/MS). MS/MS is a fundamentally different technology than systems previously used by most newborn screening laboratories, such as bacterial inhibition assays. It is a versatile and modular system that can be easily adapted to the preferred testing approach by the user. This has led to numerous variations of newborn screening by MS/MS, and it became a challenge to compare results between laboratories. There is a recognized need to develop consensus solutions to provide more consistency between MS/MS screening programs [6–9].
This validation addresses a certified screening method using fully automated analysis equipment from sample recognition towards extraction and analysis. The method was based on the commercial MassChrom® Reagent Kit from Chromsystems to allow full standardization of the complete process. The method development was performed at the Shimadzu laboratory (Reinach, Switzerland) and the application has been transferred to a routine NBS laboratory in Switzerland (Childrens Hospital Zurich). After the method development, a validation was performed, followed by a transfer into a routine laboratory focusing on inter-, intra-day variations, correlation and robustness. To standardize the sample preparation, handling and extraction, a fully automated DBS system from CAMAG (DBS- MS 500) was integrated into the workflow. The main goal of this study was to validate this change in analytical procedure.
Application of automated DBS card handling systems, which are connected to mass spectrometry analyzers, offers a modern and fast approach where a circular area of the DBS is directly eluted from the filter paper card without any punching [9–12].
Materials and Methods
Chemicals
The following MassChrom Reagents (Chromsystems Munich, Germany) were used; Mobile Phase (No. 57001), Internal Standard (No. 57004), Extraction Buffer (No. 57008) and Mass Check Controls propionylcarnitine, decanoylcarnitine, lauroylcarnitine, myristoylcarnitine, palmitoylcarnitine and stearoylcarnitine, were purchased from Sigma-Aldrich (St. Louis, USA). MassChrom rinsing solution (No. 55007) was used for the rinsing process and also purchased from Chromsystems (Munich, Germany). Dried blood spot cards (903, TFN, MN818 and 2992) were provided by CAMAG (Muttenz, Switzerland). Fresh whole blood was obtained from the local blood donation center (Basel, Switzerland). The blood was previously tested for infectious diseases.
Analytical Methods
A DBS-MS 500 unit (CAMAG, Muttenz, Switzerland) was attached as front end to a modularHPLC system from Shimadzu (Kyoto, Japan), containing a system controller (CBM-20A), a Nexera X2pump and a degasser (DGU-20ASR). The loop outlet of the DBS-MS 500 system was connected with a1.8 m PEEK tubing (yellow 1/16» OD x .007» ID) using a KrudKatcher Ultra (KrudKatcher Ultra,Phenomenex, Torrance, CA, USA) inline filter at the mass spectrometer inlet. Analysis was performedin positive multiple reaction monitoring (MRM) mode on an electrospray ionization tandem massspectrometry system 8060 in Reinach and 8050 in Zurich (Shimadzu, Kyoto, Japan). The extract wasdirectly injected into the mass spectrometer without an analytical column.
The elution was performed isocratic with the mobile phase from the kit using a flow gradient starting at 0.2 mL/min to 0.6 mL/min in 0.3 min to 1.9 min, 1.91 min back to 0.2 mL/min, 2.0 min controller stop. The following m/z transitions were programmed for the mass spectrometry detection (Table 1);
Table 1. m/z transitions
|
Name |
Precursor m/z |
Product m/z |
Dwell (msec) |
Q1 Pre Bias (V) |
CE |
Q3 Pre Bias (V) |
|
Alanine |
90.2 |
44.2 |
10 |
-10 |
-12 |
-19 |
|
Alanine-2H 4 |
94.2 |
48.2 |
10 |
-10 |
-12 |
-19 |
|
Arginine |
175.2 |
70.2 |
10 |
-10 |
-24 |
-16 |
|
Arginine-2H 7 |
182.2 |
77.2 |
10 |
-10 |
-24 |
-16 |
|
Aspartic acid |
134.2 |
134.2 |
10 |
-15 |
-12 |
-13 |
|
Aspartic acid-2H 3 |
137.2 |
75 |
10 |
-16 |
-16 |
-27 |
|
Citrulline |
176.1 |
113.1 |
10 |
-10 |
-16 |
-25 |
|
Citrulline-2H 2 |
178.1 |
115.1 |
10 |
-10 |
-16 |
-25 |
|
Glutamic acid |
148.15 |
84.1 |
10 |
-17 |
-17 |
-14 |
|
Glutamic acid-2H 5 |
153.1 |
88.2 |
10 |
-17 |
-18 |
-19 |
|
Glycine |
76 |
30 |
10 |
-11 |
-12 |
-30 |
|
Glycine-13C3/ 15N1 |
79 |
32 |
10 |
-10 |
-16 |
-28 |
|
Leucine |
132 |
86.2 |
10 |
-16 |
-12 |
-19 |
|
Leucine-2H 3 |
135 |
89.2 |
10 |
-16 |
-12 |
-19 |
|
Methionine |
150.1 |
104.1 |
10 |
-18 |
-14 |
-22 |
|
Methionine-2H 3 |
153.1 |
107 |
10 |
-18 |
-13 |
-18 |
|
Ornithine |
133.2 |
133.2 |
10 |
-16 |
-12 |
-27 |
|
Omithine-2H 6 |
139.2 |
76 |
10 |
-15 |
-19 |
-15 |
|
Phenylalanine |
166.2 |
120.2 |
10 |
-18 |
-14 |
-28 |
|
Phenylalanine-2H 5 |
171.2 |
125.2 |
10 |
-18 |
-14 |
-28 |
|
Proline |
116.2 |
70.1 |
10 |
-14 |
-18 |
-23 |
|
Proline-2H 7 |
123.2 |
77.1 |
10 |
-13 |
-18 |
-16 |
|
Tyrosine |
182.1 |
123.1 |
10 |
-10 |
-18 |
-24 |
|
Tyrosine-2H 4 |
186.1 |
127.1 |
10 |
-10 |
-18 |
-24 |
|
Valine |
118.2 |
72.1 |
10 |
-14 |
-13 |
-17 |
|
Valine-2H 8 |
126.2 |
80.2 |
10 |
-14 |
-13 |
-17 |
|
Carnitine |
162 |
85 |
10 |
-21 |
-23 |
-20 |
|
Carnitine-2H 9 |
171 |
85.1 |
10 |
-10 |
-23 |
-17 |
|
Acetylcarnitine |
204 |
84.9 |
10 |
-20 |
-25 |
-20 |
|
Acetylcarnitine-2H 3 |
207 |
85.1 |
10 |
-11 |
-19 |
-18 |
|
Propionylcarnitine |
217.9 |
85 |
10 |
-20 |
-25 |
-20 |
|
Propionylcarnitine-2H 3 |
221 |
85.1 |
10 |
-12 |
-23 |
-18 |
|
Butyrylcarnitine |
231.9 |
85 |
10 |
-20 |
-25 |
-20 |
|
Butyrylcarnitine-2H 3 |
235 |
85.1 |
10 |
-13 |
-23 |
-17 |
|
Valerylcarnitine |
246 |
85.1 |
10 |
-20 |
-14 |
-21 |
|
Valerylcarnitine-2H 9 |
255 |
85.1 |
10 |
-14 |
-24 |
-17 |
|
C5DC-carnitine |
276.2 |
85 |
10 |
-46 |
||
|
C5DC-carnitine-2H 6 |
282.6 |
85 |
10 |
-15 |
-26 |
-19 |
|
Hexanoylcarnitine |
260 |
85 |
10 |
-20 |
-25 |
-20 |
|
Hexanoylcarnitine-2H 3 |
263 |
85.1 |
10 |
-13 |
-22 |
-14 |
|
Octanoylcarnitine |
288 |
85 |
10 |
-20 |
-30 |
-20 |
|
Octanoylcarnitine-2H 3 |
291 |
85.1 |
10 |
-15 |
-23 |
-14 |
|
Decanoylcarnitine |
316 |
85.1 |
10 |
-10 |
-24 |
-17 |
|
Decanoylcarnitine-2H 3 |
319 |
85.1 |
10 |
-10 |
-24 |
-17 |
|
Lauroylcarnitine |
344 |
85 |
10 |
-20 |
-28 |
-20 |
|
Lauroylcarnitine-2H 3 |
347 |
85.1 |
10 |
-11 |
-25 |
-19 |
|
Myristoylcarnitine |
372.2 |
85 |
10 |
-19 |
-30 |
-20 |
|
Myristoylcarnitine-2H 3 |
375 |
85.1 |
10 |
-11 |
-27 |
-17 |
|
Palmitovlcarnitine |
399.9 |
85.1 |
10 |
-12 |
-28 |
-18 |
|
Palmitoylcarnitine-2H 3 |
402.9 |
85.1 |
10 |
-12 |
-28 |
-18 |
|
Stearoylcarnitine |
427.9 |
85.1 |
10 |
-13 |
-29 |
-17 |
|
Stearoylcarnitine-2H 3 |
430.9 |
85.1 |
10 |
-13 |
-29 |
-17 |
ESI mode, Nebulizing gas; 1.5L/min, Heating gas Flow; 10 L/min, Interface Temperature; 300 °C, DL Temperature 300°C, Heat Block Temperature 400°C, Drying gas Flow; 10 L/min
The data analysis uses a linear curve type using the internal standard for the area calculation. The two Chromsystems MassCheck levels are used according to the specified concentrations. All peaks are as default integrated from 0.05 to 1.5 min with a width of 25 sec.
DBS-MS 500 Instrumentation and Settings
The MassChrom internal standard 57004 was dissolved in 25 mL extraction buffer 57008 according to the Chromsystems procedure and connected to elution bottle 1, this solution was used for extracting the DBS. The MassChrom rinsing solution was connected to rinsing bottle 1 (R1). The extraction head was cleaned in an ultra sound bath at 40 °C for 10 min prior to a large set of analyses. The extraction solvent was primed for 5 cycles and the rinsing solvents were flushed for 1 min (this process is an automated system prime method). The DBS cards were photographed with the built-in camera of the DBS-MS 500 before and after each extraction to check for the presence of a blood spot and to adjust the extraction head to the center of each spot. The Chronos for CAMAG software automatically recognized inadequate dried blood spots based on their roundness, diameter, and area. Inadequate DBS were excluded from analysis. The samples were extracted with a 4 mm diameter clamp and a volume of 60 μL and a 200 μL/min flow rate into a 20 μl loop (the 40 μl upfront volume is directed to the waste). The extraction solvent passes the sealed area on the DBS card horizontally from the bottom back to the bottom into a sample loop, which is online guided to the mass spectrometer after the elution step. The area next to the 4 mm extraction ring is not affected by the solvent and could be reused if needed. To complete the automated DBS extraction cycle, the system was rinsed for 20 s with R1 [11].
Standard and DBS Sample Preparation
DBS calibration samples for method development and implementation were prepared manually in the laboratory (described as calibrators). Later on for method validation, external quality control material from Chromsystems (Masscheck) was integrated into the analysis workflow and used for reference (described as controls).
Five calibration points were prepared for the validation process. Here, 10 mg of each analyte was dissolved in 10 ml of water for the amino acids and in 10 ml methanol for the acyl carnitines. For each level, a mix was prepared according to reference values provided by the MassCheck Controls from Chromsystems. EDTA stabilized blood was pooled and centrifuged at 1300 rcf for 5 minutes. The plasma and buffy coat layer was removed and replaced with saline (0.9% NaCl) [13]. After gently mixing, this washing procedure was repeated twice. After removing the wash solution, a spiked saline with amino acids and acyl carnitines in five different levels (A-E, Supplementary data) was added and gently mixed [14].
Aliquots of the five calibrator blood levels were spotted in 15, 30 and 50 μl (standard 30 μl) droplets by an Eppendorf pipette onto TFN, 226, 903, 818 and 2992 filter paper cards from different vendors and dried in a horizontal position for a minimum of three hours. After drying, the calibrators were placed in a plastic bag with desiccant and stored at -20 °C. Calibrators B and E were used to derive data for intra- and interday imprecision. Those levels were used to compare to the high and low control levels from the MassChrom kit which will be used for the routine afterwards.
To measure the external MassCheck control card, a DBS frame in the standardized format of 84.67 mm × 53.2 mm (w × h) was fastened to the previously cut out reference DBS spots (Figure 1). By using the X-offset of the DBS-MS 500, several extractions per reference spot can be performed.
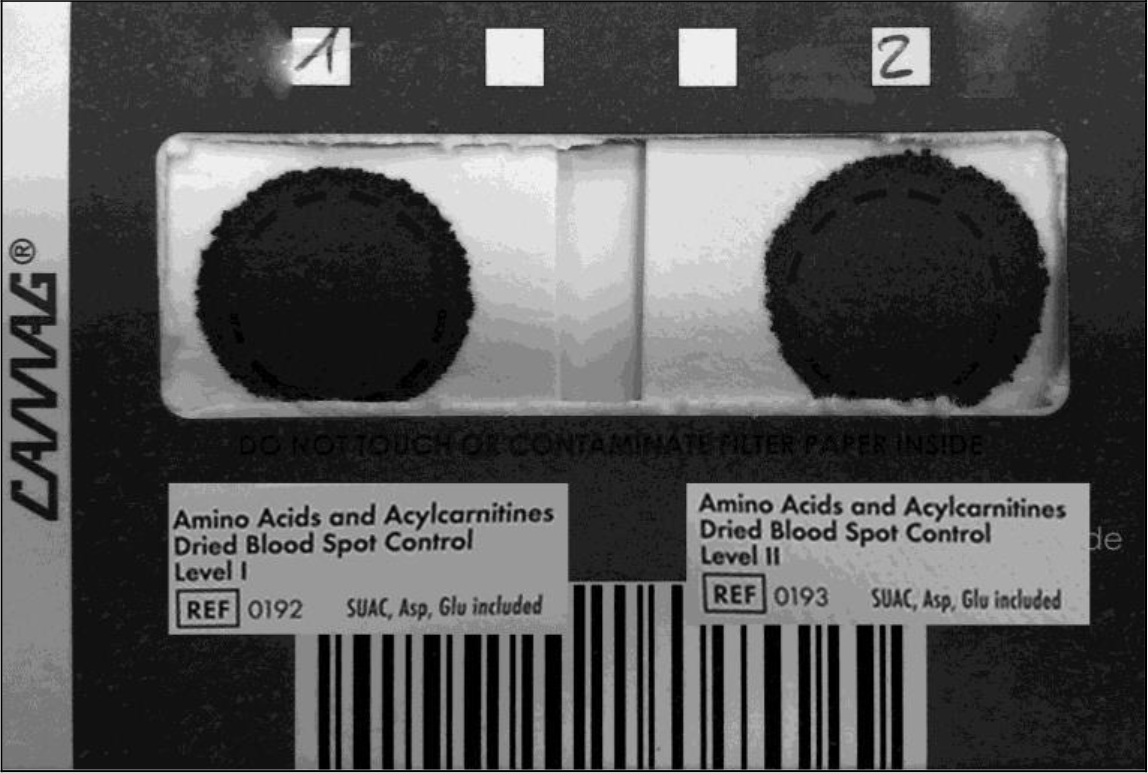
Figure 1. Manually prepared QC card.
All DBS were prepared from the same blood source, prepared with the same procedure to neutralize potential hematocrit effects [11], [15], [16] , which were not investigated in this study. All samples were prepared at one site and shipped to the other laboratory under controlled environment, to also eliminate the inaccuracy of different sample preparation.
The five calibration points were used for method validation and transfer, afterwards the routine measurement will be referred to the two Chromsystems MassCheck control levels high and low.
Validation Procedure
The inter- and intra-assay precision was obtained by measuring calibrator levels B and E at 3 consecutive days six fold. Precision was evaluated within a single validation run (intra-day) as well as between three runs recorded on different days (inter-day). The precision was calculated as the percentage relative standard deviation (CV, %) within an analytical run (intra-day precision, n = 6) and over all three runs (inter-day precision, n = 18). Depending on the analyte, CVs for within-run precision can range from 15% to 25% and for inter-run precision can range from 20% to 35% for newborn screening MS/MS assays [14]. The accuracy was assessed from the overall mean of each MassCheck control concentration divided by its nominal value (bias, %). Since all signals are related to official and certified reference material from Chromsystems [17], no other accuracy assays were conducted.
The extraction recovery of the DBS-MS 500 autosampler was investigated for DBS samples at level D. The five compounds methionine, proline, valine, carnitine and lauroyl-carnitine were chosen for this experiment. Each spot was extracted five times in triplicates. Between two extractions, a drying time of approximately 15 min was programmed. Using the built-in camera of the DBS-MS 500, the extraction head automatically locked onto the same area in the center of the blood spot. The recovery was finally estimated as the percentage ratio of the analyte peak area of the first extraction to the sum of the peak areas of all subsequently conducted extractions [11, 14].
Correlation and robustness was performed on each three days in two different laboratories. The correlation is determined using the 5 calibrator levels on 903 type filter paper, measured four fold. Each day, the run included a double measurement of each MassCheck level high and low as reference.
The carryover was assessed to study the possible effects from specimens with a high concentration of an analyte on the result of the subsequent specimen or specimens. Although there are several potential sources for carryover within the MS/MS system, the most common source is the autosampler injection port and the tubing leading to the MS/MS electrospray unit. To determine the carry over in the automated DBS-MS 500 system, an extraction with a high concentration at level E is performed, followed by three extractions of blank DBS cards. For no carryover, the analyte concentrations of the blank sample should be below the LOD concentration previously determined. This should be repeated a minimum of five times [14].
Although no interferences are known or have been documented [17], the blank filter papers used for specimen collection were checked for possible interferences of common m/z for any of the analytes measured, especially since new filter paper sources and new lot numbers are used. Here, we investigated the most commonly used filter paper types from different vendors used for manufacturing the DBS cards. Paper types are TFN and 226 from Ahlstrom, 903 from EBF, MN 818 from Macherey Nagel and 2992 from Hahnemühle. Calibrator level B, D and F were measured as triplicates on each paper type to detect precision and any significant off-set.
The robustness is determined during the interference and repeatability study by varying the following parameters; technician, card type, eluent preparation (using solvent and buffer from different lots), elapsed times (with or without breaks between the measurements) and laboratory environment (location, temperature and humidity). All cards used for the interference study were spotted with level a calibrator.
Matrix effects, an extended interference study and stability tests were not performed, since this data is given by the MassChrom kit and its process remain unchanged [17].
Documentation
The documentation process is given by the DBS-MS 500 instrument which takes a picture of the DBS card before and after each extraction to assure sample traceability. All pressures on the DBS card sampler as well as on the LC-MS/MS unit are monitored and documented.
The camera documentation system checks for preset values, where quality control parameters can be integrated. If the quality criteria are not met, the system automatically checks the next spot and continues the preset program. In addition, the camera detects already extracted spots and blocks those to prevent reanalysis. The system checks the xy shift of the circle on the card and the blood spot to center the extraction spot to the middle of each DBS (to avoid inhomogeneous distribution effects). Further, the inbuilt pressure sensors are monitoring the extraction and rinsing pressure (in this study, the extraction pressure was 0.5 bar and the rinsing pressure 45 bar). The maximum extraction pressure is 1.2 bar, depending on the age of the blood sample, and the system can be rinsed with pressure up to 100 bar to prevent carry over [9].
Results
MS/MS Method
The method from the MassChrom kit was transferred to the automated DBS-MS 500 platform allowing full automation of this process. The method was successfully installed at a routine NBS laboratory. Five calibrator levels of blood spotted on DBS cards were established for the method validation and installation. For routine, the two levels high and low from the MassCheck controls were used. Since the extract is guided online to the tandem mass spectrometry system, it only takes 2 minutes per sample. All processes are overlapping, where the DBS-MS 500 runs a wash program and extracts the consecutive sample while the MS/MS is detecting and reporting the target analytes of the previous sample.
Method validation
First, validation including additionally carry-over, interference, volume effects and recovery was performed after setting up the method on the automated platform. Evaluation of accuracy was not part of this method validation, since control material from the MassChrom kit was used as reference in all experiments. The intra- and inter-day variations as well as the coefficients of determination (R2) of the calibration standards are summarized in Table 2. All factors were within the general acceptance criteria for NBS screening methods [17]. Intra-day variations are all below 15% with the exception of aspartic acid and glutamic acid which are slightly above but still acceptable since the criteria sets a value of < 25%. Also, glutamic acid gave a relative high variation for the inter-day variation (still within the criteria), compared to the other values which are all below 25%. Therefore the optimization of the MRM transition of glutamic acid was carefully monitored for the method installation at the routine site.
Table 2. Selected recovery comparison to MassCheck controls
|
MassCheck |
Methionine |
Proline |
Valine |
Carnitine |
Laurovl-carnitine |
|
Extraction 1 |
0.6159 |
1.421 |
1.597 |
15.499 |
56.966 |
|
Extraction 2 |
0.1284 |
0.460 |
0.527 |
2.416 |
9.854 |
|
Extraction 3 |
0.0557 |
0.154 |
0.184 |
0.653 |
4.461 |
|
Extraction 4 |
0.0276 |
0.063 |
0.083 |
0.293 |
3.981 |
|
Extraction 5 |
0.0154 |
0.031 |
0.035 |
0.152 |
3.368 |
|
[%] |
[%] |
[%] |
[%] |
[%] |
|
|
MassCheck recovery |
73.1 |
66.7 |
65.8 |
81.5 |
72.4 |
|
Sample recovery |
79.9 |
70.3 |
61.5 |
80.0 |
76.4 |
DBS spots using 15, 30 and 50 μl blood were prepared at calibrator level A, C and E and compared as triplicates. The deviations from 50 μl to 30 μl spots were between 90.8 – 102.2 % and the deviations from 30 μl to 15 μl were between 78.2 – 88.8 %. There is a trend of smaller signals towards the 15 μl spots, however there is no obvious trend between 30 μl and 50 μl spots.
Carry-over from the high concentration to a blank DBS card passed the ICH guideline criteria and all investigated filter paper types were feasible for being used with this method. The best results were accomplished with the TFN filter paper (2.6% variation), paper types 226, 903, 229 were below 5% variation and the 818 paper moved with 6.0% on the last rank (supplementary data). The standard deviation of the complete panel from the triplicate measurement was taken into account.
The recovery of the compounds from the DBS card lies within 40 to 80%. This recovery remains constant for each analyte with the chosen extraction parameters. Since the results are always considered relative to the used MassChrom quality control card values with the same consistent recovery, this has no effect to the screening method, (see Table 2 and supplementary data).
Also the extraction behavior remains constant. This was investigated by comparison of freshly spotted blood and blood spots with 4 days of age stored at -20 °C (see supplementary data).
DBS spots using 15, 30 and 50 μl blood were prepared at calibrator level A, C and E and compared as triplicates. The deviations from 50 μl to 30 μl spots were between 90.8 – 102.2 % and the deviations from 30 μl to 15 μl were between 78.2 – 88.8 %. There is a trend of smaller signals towards the 15 μl spots, however there is no obvious trend between 30 μl and 50 μl spots.
Method Transfer into a Routine Environment
The previously developed and validated method was transferred into a routine environment. A short validation focusing on correlation and robustness was performed, where all five calibration levels were measured four-fold on 903 filter paper on three consecutive days. Each day was referred to high and low Mass Check control measured before the sample run.
Table 3. Intra-day, inter-day precision and R2 of calibrators level B (L1) and E (L2) from the spiked DBS samples (*Xle refers leucine/ Isoleucine)
|
Intraday day 1 |
Correlation |
Intraday day 2 |
Correlation |
Intraday day 3 |
Correlation |
Inter day |
|||||
|
LI [%] |
L2 [%] |
R2 |
LI [%] |
L2 [%] |
R2 |
LI [%] |
L2 [%] |
R2 |
LI [%] |
L2 [%] |
|
|
Alanine |
6.8 |
7.6 |
0.994 |
3.7 |
7.1 |
0.981 |
8.6 |
5.4 |
0.998 |
24.5 |
13.0 |
|
Arginine |
6.1 |
4.1 |
0.998 |
8.1 |
4.6 |
0.998 |
7.8 |
1.9 |
0.997 |
8.5 |
5.7 |
|
Aspartic acid |
15.7 |
6.8 |
0.964 |
13.1 |
6.8 |
0.987 |
5.3 |
10.9 |
0.925 |
13.9 |
10.4 |
|
Citrulline |
4.8 |
5.9 |
0.999 |
6.5 |
5.3 |
0.998 |
6.5 |
4.3 |
0.999 |
7.9 |
8.4 |
|
Glutamic acid |
15.5 |
7.2 |
0.998 |
1.4 |
4.3 |
0.997 |
3.5 |
3.4 |
0.995 |
32.4 |
11.7 |
|
Glycine |
9.2 |
9.9 |
0.998 |
9.2 |
9.9 |
0.998 |
7.7 |
12.3 |
0.987 |
8.7 |
18.9 |
|
Leucine (Xle*) |
6.5 |
4.2 |
0.999 |
2.8 |
5.0 |
0.999 |
5.0 |
3.5 |
0.901 |
12.3 |
9.5 |
|
Methionine |
10.3 |
4.8 |
0.999 |
9.6 |
6.1 |
0.985 |
11.9 |
4.8 |
0.999 |
24.9 |
5.8 |
|
Ornithine |
6.9 |
4.0 |
0.999 |
6.5 |
5.7 |
0.998 |
11.1 |
4.6 |
0.996 |
13.3 |
14.8 |
|
Phenylalanine |
5.7 |
3.9 |
0.999 |
4.3 |
4.9 |
0.999 |
8.6 |
8.3 |
0.998 |
11.7 |
6.0 |
|
Proline |
4.0 |
4.1 |
0.999 |
4.6 |
5.0 |
0.999 |
11.0 |
8.8 |
0.999 |
9.4 |
6.9 |
|
Tyrosine |
7.8 |
6.8 |
0.999 |
14.5 |
5.4 |
0.991 |
14.1 |
5.3 |
0.997 |
16.2 |
11.1 |
|
Valine |
6.0 |
4.3 |
0.999 |
4.7 |
4.2 |
0.999 |
4.8 |
2.9 |
0.999 |
6.5 |
6.3 |
|
Carnitine |
6.9 |
8.9 |
0.999 |
1.7 |
9.4 |
0.999 |
6.1 |
8.1 |
0.999 |
6.6 |
15.5 |
|
Acetvlcarnitine |
9.3 |
2.8 |
0.978 |
9.7 |
6.3 |
0.986 |
8.0 |
6.2 |
0.983 |
9.4 |
7.4 |
|
Propionylcarnitine |
2.3 |
2.9 |
0.998 |
1.5 |
3.3 |
0.999 |
3.8 |
3.6 |
0.996 |
12.9 |
3.3 |
|
Butyrylcarnitine |
8.8 |
2.9 |
0.999 |
6.3 |
4.0 |
0.998 |
10.2 |
8.1 |
0.999 |
11.1 |
7.8 |
|
Valerylcarnitine |
6.3 |
3.5 |
0.999 |
6.3 |
4.4 |
0.999 |
7.6 |
4.3 |
0.996 |
8.0 |
6.2 |
|
Hexanoylcarnitine |
9.2 |
3.1 |
0.999 |
5.0 |
5.6 |
0.998 |
6.5 |
7.7 |
0.998 |
15.0 |
7.0 |
|
Octanoylcarnitine |
5.7 |
3.5 |
0.999 |
6.6 |
3.6 |
0.999 |
5.4 |
7.4 |
0.997 |
10.0 |
6.7 |
|
Decanoylcarnitine |
5.0 |
2.4 |
0.978 |
3.7 |
12.5 |
0.998 |
7.0 |
4.5 |
0.997 |
15.4 |
9.4 |
|
Laurovlcarnitine |
14.0 |
4.2 |
0.999 |
11.5 |
4.2 |
0.999 |
7.8 |
3.5 |
0.999 |
12.8 |
4.2 |
|
Myristovlcarnitine |
3.2 |
5.0 |
0.997 |
3.4 |
3.3 |
0.998 |
5.9 |
6.6 |
0.999 |
10.8 |
5.6 |
|
Palmitoylcarnitine |
1.6 |
2.7 |
0.996 |
1.3 |
1.8 |
0.997 |
1.3 |
2.5 |
0.996 |
14.8 |
10.6 |
|
Stearoylcarnitine |
2.3 |
2.8 |
0.995 |
1.8 |
2.4 |
0.999 |
2.1 |
3.2 |
0.995 |
18.1 |
14.1 |
At the Children’s hospital in Zurich, the Shimadzu MS/MS 8050 was coupled to a DBS-MS 500 unit as used for the method development. The criteria were met for intra- and inter-day variation following the validation procedure (supplementary data).
Discussion
The described method is fully automated and uses exclusively certified consumables and reference material. Through this degree of standardization, the application can be directly transferred in-between newborn screening laboratories and therefore following the trend towards the development of standardized programs. The method represents a high throughput application with only 2 minutes per sample. All processes are well documented by the reporting system of the DBS- MS 500, where a picture is taken of each spot before and after the extraction and all pressures for extraction, rinsing and LC pump are monitored. The DBS card picture is analyzed with image recognition software, providing results for the spot diameter, area and roundness, which can be used as quality control criteria. Also, the system detects a spot which has been previously extracted, to avoid multiple extractions of the same area. In a standard setting, the extraction is performed automatically from the center of each spot to overcome inhomogeneous distribution effects within the DBS sample [18].
We encountered a relative high endogenous concentration of the target analytes in the available donor blood. To bring this into the range of interest, the blood was washed with saline following a protocol. This procedure allowed gently spiking the washed red blood cells with the target analytes in the according concentrations. The five calibration points were used for method development, validation and installation at the routine site. After implementing the method, all results were referred to externally prepared and certified reference cards from the MassChrom kit.
The protocol of the MassChrom kit describes an extraction of a 3.2 mm disc in 100 μl extraction buffer (including the internal standard). Here, a 4 mm area was sealed on the DBS card and extracted with 60 μl into a 20 μl loop, whereas the first 40 μl are guided into waste. This was experimentally optimized using different loop volumes, extraction volumes and flow rates. This outcome could be due to an initially high portion of certain analytes, such as salts and phospholipids, causing matrix effects and ion suppression in the ESI source. However, the basic principle of this result needs to be further investigated. The method uses 60 μl of extraction buffer per sample instead of 100 μl from the protocol, which reduces the amount of solvent and analytical standard. In addition, consumables for sample preparation according to the protocol such as Eppendorf vials and pipette tips are no longer required.
Leucine, isoleucine, hydroxy l proline and allo-isoleucine are detected as sum (Xle) and are not separated within this method. An abnormal result for this parameter will have the automatic consequence of a second tier method using an analytical column prior the mass spectrometer to properly distinguish between all isobars. This is needed for the detection of maple syrup urine disease (MSUD).
A volume of 30 μl blood was chosen for the preparation of the calibrator spots. The 50 μl standard volume from literature resulted in relatively large spots on the standard filter paper card for automation with a spot-to-spot distance of 13.7 mm. The 50 μl spots were overlapping if all four positions on the DBS card were spotted. A comparison of 30 and 50 μl droplets showed no difference in the results.
Conclusion
A validated reagent kit for the extraction and analysis of dried blood spots in the field of newborn screening was transferred and validated on an automated DBS card extraction platform. First, a validation was performed and the method was then successfully transferred into a routine environment. Each process step is well documented and all analysis steps follow Good Laboratory Practice (GLP) [19]. The method can be easily modified or extended and transferred to other routine laboratories.
Author Contributions
Stefan Gaugler and Vincente Luis Cebolla Burillo participated in the concept and design of the study. Jana Rykl contributed to the optimization of the MS methods. Stefan Gaugler and Jana Rykl did the method development work, Stefan Gaugler did the practical work at the Children’s Hospital Zurich. Stefan Gaugler was responsible for drafting the manuscript. Vincente Luis Cebolla Burillo was responsible for revising the manuscript. All authors approved the manuscript as submitted.
Conflict of Interest
Jana Rykl is an employee of Shimadzu Schweiz GmbH (Reinach, Switzerland) and Stefan Gaugler is an employee of CAMAG (Muttenz, Switzerland). None of the other authors report any conflict of interest regarding this study. All instrumentations are property of the respective companies and laboratories.
References
- G. Nys, M. G. M. Kok, A. C. Servais, and M. Fillet, “Beyond dried blood spot: Current microsampling techniques in the context of biomedical applications,” TrAC – Trends Anal. Chem., vol. 97, pp. 326–332, 2017.
- J. L. Merritt, L. L. Brody, G. Pino, and P. Rinaldo, “Newborn screening for proximal urea cycle disorders: Current evidence supporting recommendations for newborn screening,” Mol. Genet. Metab., no. February, pp. 0–1, 2018.
- H. Lemonde, “Newborn screening for inborn errors of metabolism,” Paediatr. Child Health (Oxford)., vol. 25, no. 3, pp. 103–107, 2014.
- U. Groselj, M. Zerjav, A. Smon, N. Angelkova, D. Anton, I. Baric, M. Djordjevic, L. Grimci, M. Ivanova, A. Kadam, V. Mulliqi, H. Maksic, O. Marginean, O. Margineanu, O. Milijanovic, F. Moldovanu, M. Muresan, S. Murko, M. Nanu, B. Repic, M. Samardzic, V. Sarnavka, A. Savov, M. Stojiljkovic, B. Suzic, R. Tincheva, H. Tahirovic, A. Toromanovic, N. Usurelu, and T. Battelino, “Newborn screening in southeastern Europe,” Mol. Genet. Metab., vol. 113, no. 1–2, pp. 42–45, 2014.
- A. W. El-Hattab, M. Almannai, and V. R. Sutton, “Newborn Screening: History, Current Status, and Future Directions,” Pediatr. Clin. North Am., vol. 65, no. 2, pp. 389–405, 2018.
- A. Starkweather, B. Coleman, V. B. De Mendoza, M. Fu, J. Taylor, W. Henderson, C. Kenner, D. Walker, L. Amankwaa, and C. Anderson, “American Academy of Nursing on Policy Policy brief : Improve coverage of newborn genetic screening to include the Recommended Uniform Screening Panel and newborn screening registry,” Nurs. Outlook, vol. 65, no. 4, pp. 480–484, 2017.
- M. Resano, M. A. Belarra, E. García-Ruiz, M. Aramendía, and L. Rello, “Dried matrix spots and clinical elemental analysis. Current status, difficulties, and opportunities,” TrAC – Trends Anal. Chem., vol. 99, pp. 75–87, 2018.
- R. Fingerhut, M. L. Silva Polanco, G. D. J. Silva Arevalo, and M. A. Swiderska, “First experience with a fully automated extraction system for simultaneous on-line direct tandem mass spectrometric analysis of amino acids and (acyl-)carnitines in a newborn screening setting,” Rapid Commun. Mass Spectrom., vol. 28, no. 8, pp. 965–973, 2014.
- S. Gaugler, J. Rykl, I. Wegner, T. von Däniken, R. Fingerhut, and G. Schlotterbeck, “Extended and Fully Automated Newborn Screening Method for Mass Spectrometry Detection,” Int. J. Neonatal Screen., vol. 4, no. 1, p. 2, 2017.
- “CAMAG DBS,” 2018. [Online]. Available: http://www.camag.com/en/dbs/what_is_dried_blood_spot_sampling.cfm. [Accessed: 29-May-2018].
- M. H. U. Duthaler, B. Berger, S. Erb, M. Battegay, E. Letang, S. Gaugler, S. Krähenbühl, “Automated high throughput analysis of antiretroviral drugs in dried blood spots.,” J Mass Spectrom., vol. 52, no. 8, pp. 534–542, 2017.
- S. Gaugler, J. Rykl, M. Grill, and V. L. Cebolla, “Fully automated drug screening of dried blood spots using online LC-MS / MS analysis,” J. Appl. Bioanal., vol. 4, no. 1, pp. 7–15, 2018.
- D. H. Chace, B. W. Adam, S. J. Smith, J. R. Alexander, S. L. Hillman, and W. H. Hannon, “Validation of accuracy-based amino acid reference materials in dried-blood spots by tandem mass spectrometry for newborn screening assays.,” Clin. Chem., vol. 45, no. 8 Pt 1, pp. 1269–77, 1999.
- G. L. Hoffman, “CLSI guideline NBS04-A,” 2010.
- P. Abu-Rabie, P. Denniff, N. Spooner, B. Z. Chowdhry, and F. S. Pullen, “Investigation of different approaches to incorporating internal standard in DBS quantitative bioanalytical workflows and their effect on nullifying hematocrit-based assay bias,” Anal. Chem., vol. 87, no. 9, pp. 4996–5003, 2015.
- N. Kostić, Y. Dotsikas, N. Jović, G. Stevanović, A. Malenović, and M. Medenica, “Quantitation of pregabalin in dried blood spots and dried plasma spots by validated LC-MS/MS methods,” J. Pharm. Biomed. Anal., vol. 109, pp. 79–84, 2015.
- Chromsystems, “MassChrom Amino acids and Acylcarnitines from Dried Blood (non derivatised), 57000, EN 06/2016 R7,” 2016.
- G. Nys, M. Kok, A.-C. Servais, and M. Fillet, “Beyond dried blood spot: current microsampling techniques in the context of biomedical applications,” Trends Anal. Chem., vol. In press, 2017.
- European Medicines Agency, “Guideline on bioanalytical method validation,” 2015.
Supplementary data
Filter paper comparison
|
226 |
Average |
3.7 % |
|
TFN |
Average |
2.7 % |
|
903 |
Average |
3.6 % |
|
2992 |
Average |
2.9 % |
|
903NBS |
Average |
2.6 % |
|
818 |
Average |
6.0 % |
Calibration sample preparation
|
Spike A |
Spike B |
Spike C |
Spike D |
Spike E |
|
|
[ul] |
[ul] |
[ul] |
[ul] |
[ul] |
|
|
AA, CO/I Spike |
25 |
50 |
100 |
167 |
250 |
|
AC Spike |
5 |
10 |
25 |
50 |
100 |
|
H20 |
225 |
200 |
150 |
83 |
0 |
|
MeOH |
95 |
90 |
75 |
50 |
0 |
|
NaCl 0.9% |
2150 |
2150 |
2150 |
2150 |
2150 |
|
Red blood cells |
2500 |
2500 |
2500 |
2500 |
2500 |
|
Total volume |
5000 |
5000 |
5000 |
5000 |
5000 |
|
Carry over (Area blank/Area E * 100%) |
Recovery |
||
|
Alanine |
2.1 |
55.6 |
% |
|
Arginine |
0.1 |
63.3 |
% |
|
Aspartic acid |
1.8 |
74.4 |
% |
|
Citrulline |
0.1 |
66.5 |
% |
|
Glutamic acid |
0.1 |
44.0 |
% |
|
Glycine |
1.8 |
68.4 |
% |
|
Leucine (Xle) |
0.1 |
65.6 |
% |
|
Methionine |
0.1 |
76.9 |
% |
|
Ornithine |
0.1 |
64.5 |
% |
|
Phenylalanine |
0.3 |
68.3 |
% |
|
Proline |
0.3 |
70.3 |
% |
|
Tyrosine |
0.3 |
55.1 |
% |
|
Valine |
0.3 |
61.5 |
% |
|
Carnitine |
0.1 |
80.0 |
% |
|
Acetylcarnitine |
0.1 |
78.7 |
% |
|
Propionylcarnitine |
0.1 |
50.1 |
% |
|
Butyrvlcarnitine |
0.1 |
81.0 |
% |
|
Valerylcarnitine |
0.1 |
81.7 |
% |
|
Hexanoylcarnitine |
0.3 |
75.6 |
% |
|
Octanoylcarnitine |
0.6 |
77.4 |
% |
|
Decanoylcarnitine |
0.8 |
72.3 |
% |
|
Lauroylcarnitine |
0.9 |
76.4 |
% |
|
Mvristoylcarnitine |
0.1 |
70.8 |
% |
|
Palmitoylcarnitine |
0.2 |
40.9 |
% |
|
Stearoylcarnitine |
0.2 |
43.4 |
% |
Intra-day, inter-day precision and R2 of calibrators level B (LI) and E (L2) from the spiked DBS samples in the routine laboratory
|
Intraday day 1 |
Correlation |
Intraday day 2 |
Correlation |
Intraday day 3 |
Correlation |
Interday |
|||||
|
LI [%] |
L2 [%] |
R2 |
LI [%] |
L2 [%] |
R2 |
LI [%] |
L2 [%] |
R2 |
LI [%] |
L2 [%] |
|
|
Alanine |
13.3 |
4.8 |
0.980 |
6.9 |
6.6 |
0.994 |
3.8 |
10.0 |
0.994 |
21.9 |
9.1 |
|
Arginine |
6.5 |
4.0 |
0.999 |
5.0 |
2.0 |
0.998 |
4.7 |
3.2 |
0.999 |
6.9 |
4.5 |
|
Aspartic add |
7.9 |
7.1 |
0.996 |
13.9 |
9.5 |
0.996 |
11.4 |
5.5 |
0.962 |
19.7 |
13.3 |
|
Citrulline |
6.0 |
6.8 |
1.000 |
6.7 |
4.0 |
0.999 |
7.4 |
5.0 |
0.998 |
6.9 |
5.5 |
|
Glutamic add |
1.0 |
5.4 |
0.994 |
9.8 |
2.9 |
0.993 |
10.8 |
7.0 |
0.999 |
19.6 |
14.2 |
|
Glycine |
14.7 |
14.7 |
0.994 |
10.8 |
14.5 |
0.980 |
10.3 |
14.1 |
0.991 |
15.0 |
23.6 |
|
Leucine (Xle) |
7.5 |
3.1 |
0.999 |
2.4 |
2.5 |
0.998 |
4.7 |
2.4 |
0.999 |
11.6 |
9.7 |
|
Methionine |
13.2 |
5.0 |
0.997 |
14.3 |
7.3 |
0.997 |
8.4 |
9.5 |
0.999 |
21.3 |
13.7 |
|
Ornithine |
5.9 |
2.9 |
0.997 |
15.2 |
9.3 |
0.994 |
9.5 |
6.7 |
0.994 |
12.2 |
13.6 |
|
Phenylalanine |
9.9 |
7.6 |
0.999 |
4.9 |
3.4 |
0.999 |
6.1 |
3.6 |
1.000 |
7.9 |
14.8 |
|
Proline |
9.9 |
5.2 |
0.999 |
4.3 |
2.8 |
0.998 |
5.8 |
5.7 |
0.999 |
7.4 |
6.2 |
|
Tyrosine |
11.1 |
17.0 |
0.945 |
14.3 |
3.0 |
0.999 |
13.3 |
5.7 |
0.998 |
21.6 |
20.7 |
|
Valine |
10.2 |
8.6 |
0.997 |
12.4 |
2.1 |
0.998 |
3.9 |
3.0 |
0.997 |
11.7 |
9.1 |
|
Carnitine |
3.6 |
4.4 |
0.997 |
5.2 |
8.8 |
0.998 |
7.9 |
11.6 |
0.997 |
7.2 |
27.5 |
|
Acetylcarnitine |
8.1 |
3.9 |
0.989 |
6.5 |
5.7 |
0.995 |
13.2 |
6.1 |
0.993 |
9.7 |
12.7 |
|
Propionylcarnitine |
1.3 |
2.4 |
0.998 |
3.1 |
3.0 |
1.000 |
3.7 |
3.9 |
0.999 |
11.7 |
3.6 |
|
Butyrylcarnitine |
6.0 |
5.4 |
0.997 |
8.7 |
4.5 |
0.999 |
11.8 |
5.1 |
0.999 |
9.2 |
10.4 |
|
Valerylcarnitine |
7.3 |
5.5 |
0.999 |
6.7 |
3.8 |
1.000 |
9.6 |
5.3 |
0.999 |
8.5 |
6.5 |
|
Hexanoylcarnitine |
9.7 |
7.1 |
0.999 |
9.6 |
4.8 |
0.999 |
11.2 |
6.2 |
0.999 |
16.3 |
6.9 |
|
Octanoylcarnitine |
8.1 |
4.6 |
0.999 |
5.8 |
5.0 |
0.999 |
5.3 |
3.6 |
0.999 |
7.4 |
4.9 |
|
Decanoylcarnitine |
15.3 |
6.1 |
0.999 |
5.1 |
3.4 |
0.999 |
6.0 |
2.3 |
0.999 |
10.1 |
4.2 |
|
Lauroylcarnitine |
4.7 |
4.5 |
0.999 |
3.7 |
2.1 |
0.999 |
6.3 |
4.3 |
0.999 |
7.5 |
4.6 |
|
Myristoylcarnitine |
6.9 |
3.8 |
0.998 |
6.2 |
3.2 |
0.998 |
2.6 |
5.9 |
0.997 |
6.1 |
5.1 |
|
Palmitovlcarnitine |
3.9 |
4.7 |
0.995 |
8.2 |
11.4 |
0.896 |
6.7 |
5.5 |
0.992 |
8.8 |
7.8 |
|
Stearoylcarnitine |
4.8 |
2.3 |
0.985 |
17.4 |
14.4 |
0.973 |
19.0 |
15.3 |
0.954 |
34.9 |
18.5 |