Abstract
Mithramycin A is a potent inhibitor of EWS-FLI1, a transcription factor implicated in Ewings sarcoma. However, a clinical trial initiated to evaluate its efficacy revealed hepatotoxicity at doses well below those required for inhibition of EWS-FLI1 activity. In the present study, we used a chemogenomic screen against gene deletion mutants of the yeast Saccharomyces cerevisiae to generate hypothesis on its cellular mechanism of hepatotoxicity. Our findings show that it disrupts calcium homeostasis in S. cerevisiae. Studies in HepG2 cells grown in monolayer and as spheroids confirmed that it not only induced sustained elevated cytosolic Ca2+ levels but also induced endoplasmic reticulum stress. Cells exposed to the compound were ultimately found to undergo calpain mediated apoptosis. These data suggest that mithramycin A is a direct toxin to liver cells and its toxicity is mediated, at least in part, by disruption of Ca2+ homeostasis.
Keywords
Mithramycin A; Hepatotoxicity; HepG2 cells; Calcium homeostasis
Introduction
Mithramycin A (MTA) is a microbial product first isolated from fermentation of Streptomyces plicatus [1]. In a previous work employing high throughput screening aimed at the discovery of small molecule inhibitors of the transcription factor EWS-FLI1, a therapeutic target in Ewings sarcoma, we reported the identification of MTA as the highest scoring inhibitor. EWS-FLI1, an aberrant transcription factor arising from a reciprocal chromosomal translocation mutation, is only found in Ewings sarcoma tumor cells and, as such, represents an attractive therapeutic target. As with most cancer related transcription factors, however, it has been difficult to target because of lack of surface involutions suitable for high affinity binding of small molecules. Based on results from studies in xenografts and reports of clinical activity in the early seventies [2,3], a combined phase I/II clinical trial was initiated. However, MTA was found to induce liver toxicity in patients at a plasma concentration substantially below that required to suppress EWS-FLI1 activity [4]. The discovery of MTA as a potent inhibitor of EWS-FLI1 activity has made targeting this transcription factor tractable while also opening avenues for the development of MTA analogs with improved liver toxicity profiles. We recently tested several biosynthetic analogs of MTA and identified two analogs with improved targeting of EWS-FLI1 [5]. Though its mechanism of liver toxicity is not well understood, reports of hepatotoxicity in humans along with those observed in animal models suggest that MTA may be a direct hepatotoxin [6]. A better understanding of the mechanism of liver toxicity of MTA and analogs currently under preclinical testing is needed to identify suitable analogs for further development.
Materials and Methods
Reagents, Cells and Culture Conditions
MTA (Cayman Chemical, Cat. #11434), calcium orange (ThermoFisher, Cat. #C3015), HepG2 (ATCC, Cat. #HB-8065), ionomycin (Sigma, Cat. #407953) were all commercially obtained. Caspase3/7 spheroid staining reagent was obtained from Nexcelom (Cat. #CS1-V0002-1) while luciferase reporter constructs for ATF6 (Cat. #E3661), NFAT (Cat. #E8481), and CRE (Cat. #E8471) were all obtained from Promega.
MTA Yeast Chemogenomic Screen
MTA Minimum Inhibitory Concentration (MIC) in the wild type yeast BY4743 (MATa/α his3Δ1/his3Δ1 leu2Δ0/leu2Δ0 LYS2/lys2Δ0 met15Δ0/MET15 ura3Δ0/ura3Δ0) was determined using the broth microdilution assay [7]. A range of sub-inhibitory concentrations (2.4 – 3mM) were first tested to determine a dose that causes 10–20% growth inhibition. This concentration was used for a genome-wide screening of Saccharomyces cerevisiae pooled deletion collection, composed of essential heterozygous (~1150 strains) and homozygous (~4800 strains) diploid gene deletion mutants. These were separately diluted to an OD600 of 0.06 in 900µL of YPD medium containing either 2.7mM MTA or DMSO and were grown in 48-well plates for 10 and 20 generations at 30 °C, respectively. The heterozygous and homozygous samples were then combined and 3 OD600 unit of cells for each sample were collected for genomic DNA extraction, PCR amplification of molecular barcodes, microarray hybridization and scanning as previously described [8,9]. Two independent biological replicates were performed for each sample. Intensity values for the barcodes on the TAG4 arrays are extracted by the GeneChip operating software (Affymetrix) and log2 ratio of the median normalized intensity values of each barcode in drug treated vs. DMSO control was calculated using GeneSpring software (ver. 13.0). This data has been deposited at NCBI’s Gene Expression Omnibus inder accession number GSE122458. Gene ontology (GO) enrichment analysis with BiNGO (ver. 3.0.3), a Cytoscape (ver. 3.3.0) plug-in [10], was used for functional profiling of susceptible mutants in our large-scale experiment. Significantly enriched biological processes and cellular components were evaluated using a hypergeometric test corrected for multiple hypothesis testing (P < 0.0001) using a Benjamini-Hochberg false discovery rate (FDR) correction and then visualized using the Enrichment Map (ver. 2.0.1) plug-in [11] developed for Cytoscape. Nodes in maps represent enriched biological processes or cellular components (hypergeometric test FDR < 0.0001) with edges indicating gene overlap between enriched processes/cellular components. Line width in maps is proportional to degree of overlap and edges are not shown where the overlap coefficient is less than 0.5. GO biological processes and cellular components that were too specific (containing less than five genes) or too general (contain greater than 300 genes) were excluded from the maps.
Confirmation of MTA-sensitive Strains
Selected strains identified as MTA-sensitive in the primary screen were subsequently confirmed by growing individual isolates along with the parental strain BY4743 in 100 µL of YPD with or without 2.7mM MTA in 96-well plates for 20 hours at 30 °C and 200 rpm on a shaking incubator. The OD600 for treated and untreated samples was obtained using a BMG OmegaStar plate reader and the relative growth rate determined as the growth ratio of drug treated to untreated controls.
Generating and Imaging HepG2 Spheroids
HepG2 cells being grown in T225 flasks were harvested via trypsinization and pelleted via centrifugation. After removal of the supernatant, the cells were resuspended at 1.75×10⁴ cells per milliliter in EMEM medium containing 10% FBS. 40 µL of this cell suspension was seeded into black-walled clear bottomed ultralow-attachment 384-well plates (Corning, #3830). Cells were incubated for 52–58 hours or until well-defined spheroids were formed. Control and MTA treated spheroids were stained with commercial Hoechst and caspase 3/7 reagents (Nexcelom, #CSK-V0003-1) following the manufacturer’s protocol. Data on spheroid size, shape, fluorescence and bright field images were all acquired on a BioTek Cytation 3 imager using a 10X objective.
JC1, ATP, and Luciferase Reporter Assays
For ATP and luciferase reporter microplate reader-based assays, HepG2 cells were seeded into 384-well plates at a density of 5000 cells per well in 27 µL of phenolred-free growth media. After incubation overnight, cells in these plates were treated with either 10 µM MTA (final concentration), 1 µM ionomycin (final concentration) or DMSO control for 24 hours prior to the addition of ATP reagent as described previously [12]. Eight replicates per condition and two independent experiments were performed. Setup of the reporter assay has been described previously [5]. But briefly, the transcription factor luciferase reporter or minimal-promoter luciferase reporter (negative control), or constitutively active (CMV) luciferase reporter (positive control) were transfected into HepG2 cells (5,000 cells/well) along with a constitutively active renilla luciferase construct in a white 96-well plate. After incubation for 24 hours, medium in each well was replaced 10 µM MTA or DMSO in either standard medium or Ca2+-free MEM spinner medium (Quality Biological, Cat. #112-021-101). After incubation for an additional 24 hours, firefly and renilla luciferase signals were read using Dual-Glo reagent (Promega, Cat. #E2920). Minimal promoter (minP) and constitutively active promoter (CMV) luciferase activity were used as controls to assess background reporter activity and general transcriptional activity, respectively. For the JC1 flow cytometry measurement of changes in mitochondrial membrane potential, HepG2 cells treated with MTA, ionomycin or DMSO for 24 hours were harvested and washed with Hank’s Balanced Salt Solution (HBSS). Pelleted cells were then stained by resuspending in 20 µM JC-1 in HBSS and incubating for 10 minutes at 37 °C. After pelleting, removal of the loading solution, and washing with HBSS, cells were finally resuspended in HBSS buffer. Samples were analyzed on an Accuri C6 flow cytometer. The data acquired were analyzed using FCS Express 4 software. Four individual samples for each condition were tested and results are reporter as averages from two independent experiments.
Caspase-3/7 and Calpain Activation Assays
HepG2 cells were seeded at 3000 and 8000 cells per well for caspase3/7 and calpain assays, respectively, in 27 µL medium in white 384-well plates and incubated overnight. For caspase assays 3µL of 10X of MTA and controls were added and plates were incubated for 24 hours. After equilibrating to room temperature, caspase activation assay was run following the manufacturer’s protocol (Promega, #G8091) by adding 30 µL of caspase assay reagent, incubating for 30 minutes and reading luminescence using a plate reader. Six replicate wells per treatment were used. For calpain activation assay, after seeding and incubating cells overnight, cells were treated with 1 µL of BAPTA-AM (5 µM final concentration) and incubated for 30 minutes. Following this, calpain activation was measured using an assay kit (Promega, #G8501) with the following modifications in the recommended protocol. 1 µL of the synthetic calpain substrate Suc-LLVY-amino luciferin in Calpain-Glo buffer (20 µM final concentration) was first added
Western Blotting
HepG2 cells were seeded into T75 ultralow attachments Flasks (Corning, Cat. #3814) and allowed to form spheroids by placing in an incubator for 72 hours. MTA or DMSO control was added to these and flasks were allowed to incubate for an additional 48 hours. Spheroids were harvested as pellets via centrifugation. Pellets were then lysed using NP-40 lysis buffer (Thermo, # FNN0021) supplemented with PMSF (1 mM final concentration) and protease inhibitor cocktail (Thermo, #78430). Prepared Lysates were cleared by centrifugation and 20 mg of protein was loaded onto gels. Gels were blotted onto nitrocellulose membranes. These membranes were probed with GRP78 (SantaCruz, #sc-13539) antibody. Blots were then probed with secondary antibodies tagged with IRDye 680 and IRDye 800 prior to scanning with an Odyssey infra-red scanner.
Statistical Analysis
All data reported is shown as the sample mean ± the Standard Deviation (SD). Pairwise comparisons between means of controls and treatment were performed using a Student t-test (two tailed, unpaired, unpaired) where, for each couple of normally distributed populations, the null hypothesis that the means are equal were verified. Difference between control and treatment data was considered statistically significant if the Student t-test gives a significance level P (P value) less than 0.05.
Results
MTA Impacts Cation Homeostasis in S. cerevisiae
The complete pool of barcoded nnon-essential homozygous and essential heterozygous diploid deletion strains of S. cerevisiae was used to identify gene deletions that confer sensitivity to MTA. However, prior to screening this collection, a sub-inhibitory concentration of MTA that resulted in 10–20% (IC10–20) growth of the BY4743 parental strain, 2.7 mM MTA (Figure 1A), was determined under the same condition used for screening the pooled collection. Screening the pooled collection at this concentration and at a log2 ratio cut-off of 2, we found 48 homozygous gene deletion mutants whose growth rates were significantly inhibited in the presence of MTA compared to control treatment. None of the essential heterozygous deletion strains in our screen showed sensitivity to MTA suggesting lack of a specific protein target through which it exerts its inhibitory action in yeast. Hypersensitivity of non-essential homozygous deletion mutants that are involved in the cellular cation homeostasis pathway, however, pointed to the importance of cation homeostasis in resistance to the compound. An analysis of supersensitive mutants indicated a statistically significant enrichment for Gene Ontology (GO) biological process terms relevant to cation homeostasis (Table 1, Figure 1B). Hypersensitivity of deletion mutants in this major functional group to sub-inhibitory concentration of MTA was confirmed by retesting cherry-picked representative individual deletion mutants as shown in Figure 1C. Classification of MTA-sensitive mutants based on GO cellular component revealed significant enrichment for the vacuolar proton-transporting V-type ATPase complex (P-value = 6.92E-07) (Table 2, Figure 1D). Cytosolic Ca2+ homeostasis is a known constitutive function of yeast V-ATPase [13]. Taken together, the MTA chemical-genetic profile presented herein, demonstrates the compound’s impact on cation homeostasis pathway in yeast in general and Ca2+ homeostasis in particular.
Table 1. GO biological process term enrichment in Mithramycin A sensitive strains.
|
GO Biological Process |
P-Value |
Systematic Name/Standard Name |
|
Cellular monovalent inorganic cation homeostasis |
4.35E-09 |
YCL005W-A/VMA9, YJL129C/TRK1, YBR127C/VMA2, YEL051W/VMA8, YKL119C7VPH2, YEL027W/VMA3, YGL095C/VPS45, YLR447C/VMA6 |
|
Monovalent inorganic cation homeostasis |
4.35E-09 |
|
|
Cellular cation homeostasis |
8.52E-07 |
YGL167C/PMR1, YCL005W-A/VMA9, YJL129C/TRK1, YCR044C/PER1, YBR127C/VMA2, YFL051W/VMA8, YKL119C/VPH2, YEL027W/VMA3, YGL095C/VPS45, YLR447C/VMA6 |
|
Cellular Ion homeostasis |
1.78E-06 |
|
|
Cation homeostasis |
1.78E-06 |
|
|
Ion homeostasis |
3.80E-06 |
|
|
Cellular chemical homeostasis |
3.80E-06 |
|
|
Cellular homeostasis |
1.56E-05 |
|
|
Chemical homeostasis |
1.55E-05 |
|
|
Monovalent inorganic cation transport |
1.12E-05 |
YCL005W-A/VMA9, YJL129C/TRK1, YBR127C/VMA2, YEL051W/VMA8, YEL027W/VMA3, YLR447C/VMA6 |
|
Intracellular pH reduction |
4.35E-09 |
YCL005W-A/VMA9, YBR127C/VMA2, YEL051W/VMA8, YKL119C/VPH2, YEL027W/VMA3, YGL095C/VPS45, YLR447C/VMA6 |
|
pH reduction |
4.35E-09 |
|
|
vacuolar acidification |
4.35E-09 |
|
|
Regulation of intracellular pH |
1.44E-08 |
|
|
Regulation of cellular pH |
1.44E-08 |
|
|
Regulation of pH |
2.00E-08 |
|
|
Energy coupled proton transport, against electrochemical gradient |
2.60E-05 |
YCL005W-A/VMA9, YBR127C/VMA2, YEL027W/VMA3, YLR447C/VMA6 |
|
ATP hydrolysis coupled proton transport |
2.60E-05 |
|
|
Proton transport |
4.81E-05 |
YCL005W-A/VMA9, YBR127C/VMA2, YEL051W/VMA8, YEL027W/VMA3, YLR447C/VMA6 |
|
Hydrogen transport |
5.02E-05 |
|
|
Endocytosis |
3.77E-05 |
YNL297C/MON2, YGR167W/CLC1, YBR164C/ARL1, YEL027W/VMA3, YCR028C/FEN2, YLR240W/VPS34, YLR337C/VRP1 |
|
Vacuolar transport |
5.02E-05 |
YLR261C/VPS63, YNL297C/MON2, YML071C/COG8, YBR164C/ARL1, YEL027W/VMA3, YGL095C/VPS45, YLR447C/VMA6, YLR372W/EL03 |
Table 2. GO cellular component term enrichment in MTA sensitive strains.
|
GO cellular component |
P-Value |
Systematic Name/Standard Name |
|
vacuolar proton-transporting V-type ATPase complex |
6.92E-07 |
YCL005W-A/VMA9, YBR127C/VMA2, YEL051W/VMA8, YEL027W/VMA3, YLR447C/VMA6 |
|
proton-transporting V-type ATPase complex |
6.92E-07 |
|
|
proton-transporting two-sector ATPase complex |
2.90E-05 |
|
|
vacuolar membrane |
3.06E-05 |
YCL005W-A/VMA9, YCR044C/PER1, YBR127C/VMA2, YEL051W/VMA8, YJL154C/VPS35, YEL027W/VMA3, YCR028C/FEN2, YGL095C/VPS45, YLR240W/VPS34, YLR447C/VMA6 |
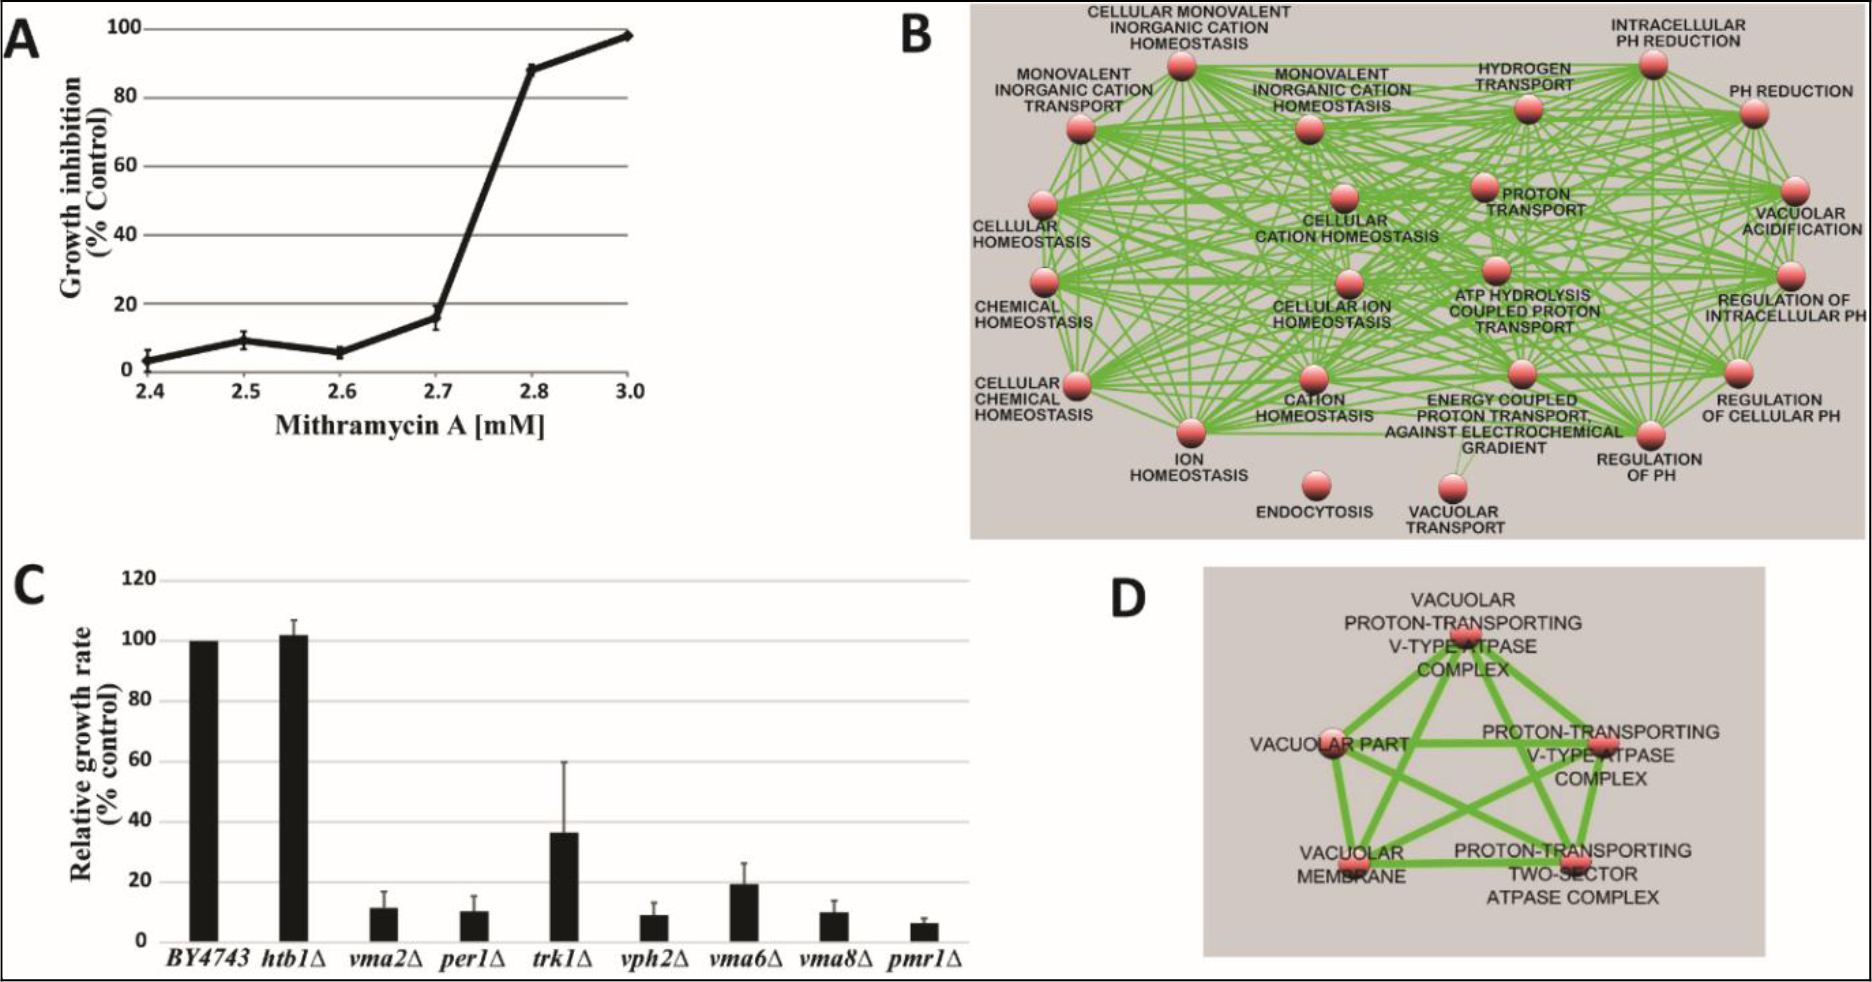
Figure 1. A) An IC10–20 of 2.7mM was determined after prescreening parental (wild-type) yeast against MTA. This concentration was selected for genome-wide screening. B) Map of GO biological process enriched in the MTA chemogenomic profile. C) Confirmation of hypersensitivity of selected strains to MTA. Htb1 deletion mutant was used as negative control. Results represent Mean ± standard deviation of quadruplicates. D) MTA GO cellular component enrichment map.
MTA Induces Persistent Elevation of Cytosolic Calcium Levels in HepG2 Cells
Many proteins involved in acquiring, utilizing, storing, and regulating levels of inorganic ions are functionally conserved from yeast to man [14]. We, therefore, asked whether MTA also had an impact on Ca2+ homeostasis in mammalian liver cells. To determine effect on Ca2+ homeostasis, we used HepG2 cells grown both in monolayer and as spheroids, which are well-suited to studying direct toxicity to liver cells by small molecules [15]. We found that MTA showed a dose dependent reduction in spheroid size and cell viability in HepG2 cells grown in monolayer (Figure 2A). We also found that treatment with MTA resulted in immediate and sustained elevation of cytosolic calcium levels in HepG2 cells cultured in monolayer (Figure 2B). NFAT is known to be expressed in HepG2 cells and contributes to cell proliferation as part of the Ca2+/calcineurin/NFAT signaling pathway [16]. Therefore, a luciferase reporter for NFAT activity was also used to gauge MTA’s impact on Ca2+ levels. This was done in both Ca2+-free and Ca2+-containing medium. The results showed that while MTA treatment significantly increased NFAT reporter activity in HepG2 cells in Ca2+-containing medium, it induced an even greater reporter response in Ca2+-free medium (Figure 2C). Pretreatment with EGTA to chelate extracellular Ca2+ or treatment in Ca2+-free media only partially reversed MTA’s effect on HepG2 spheroid size and shape (Figure 2D). Because of this observation, we next examined any potential effects on the Endoplasmic Reticulum (ER), the largest intracellular Ca2+ store. Increased ATF6 expression has been shown to be a marker of ER stress in HepG2 cells [17]. An ATF6 luciferase reporter construct used to assess changes in ATF6 activity in response to MTA treatment in HepG2 cells being grown in Ca2+-containing and Ca2+-free medium showed a 4.8- and 6.9-fold increase in reporter activity, respectively, on MTA treatment relative to vehicle (Figure 2E). Changes in levels of the ER stress marker protein GRP78 were also readily apparent in lysates from MTA-treated spheroids as shown in Figure 2F [17,18]. These findings appear to implicate increase in cytosolic Ca2+ levels owing to both influx of Ca2+ from the extracellular environment and intracellular stores. Together, these findings also suggest that, similar to observations in yeast, MTA causes disruption of Ca2+ homeostasis in HepG2 cells.
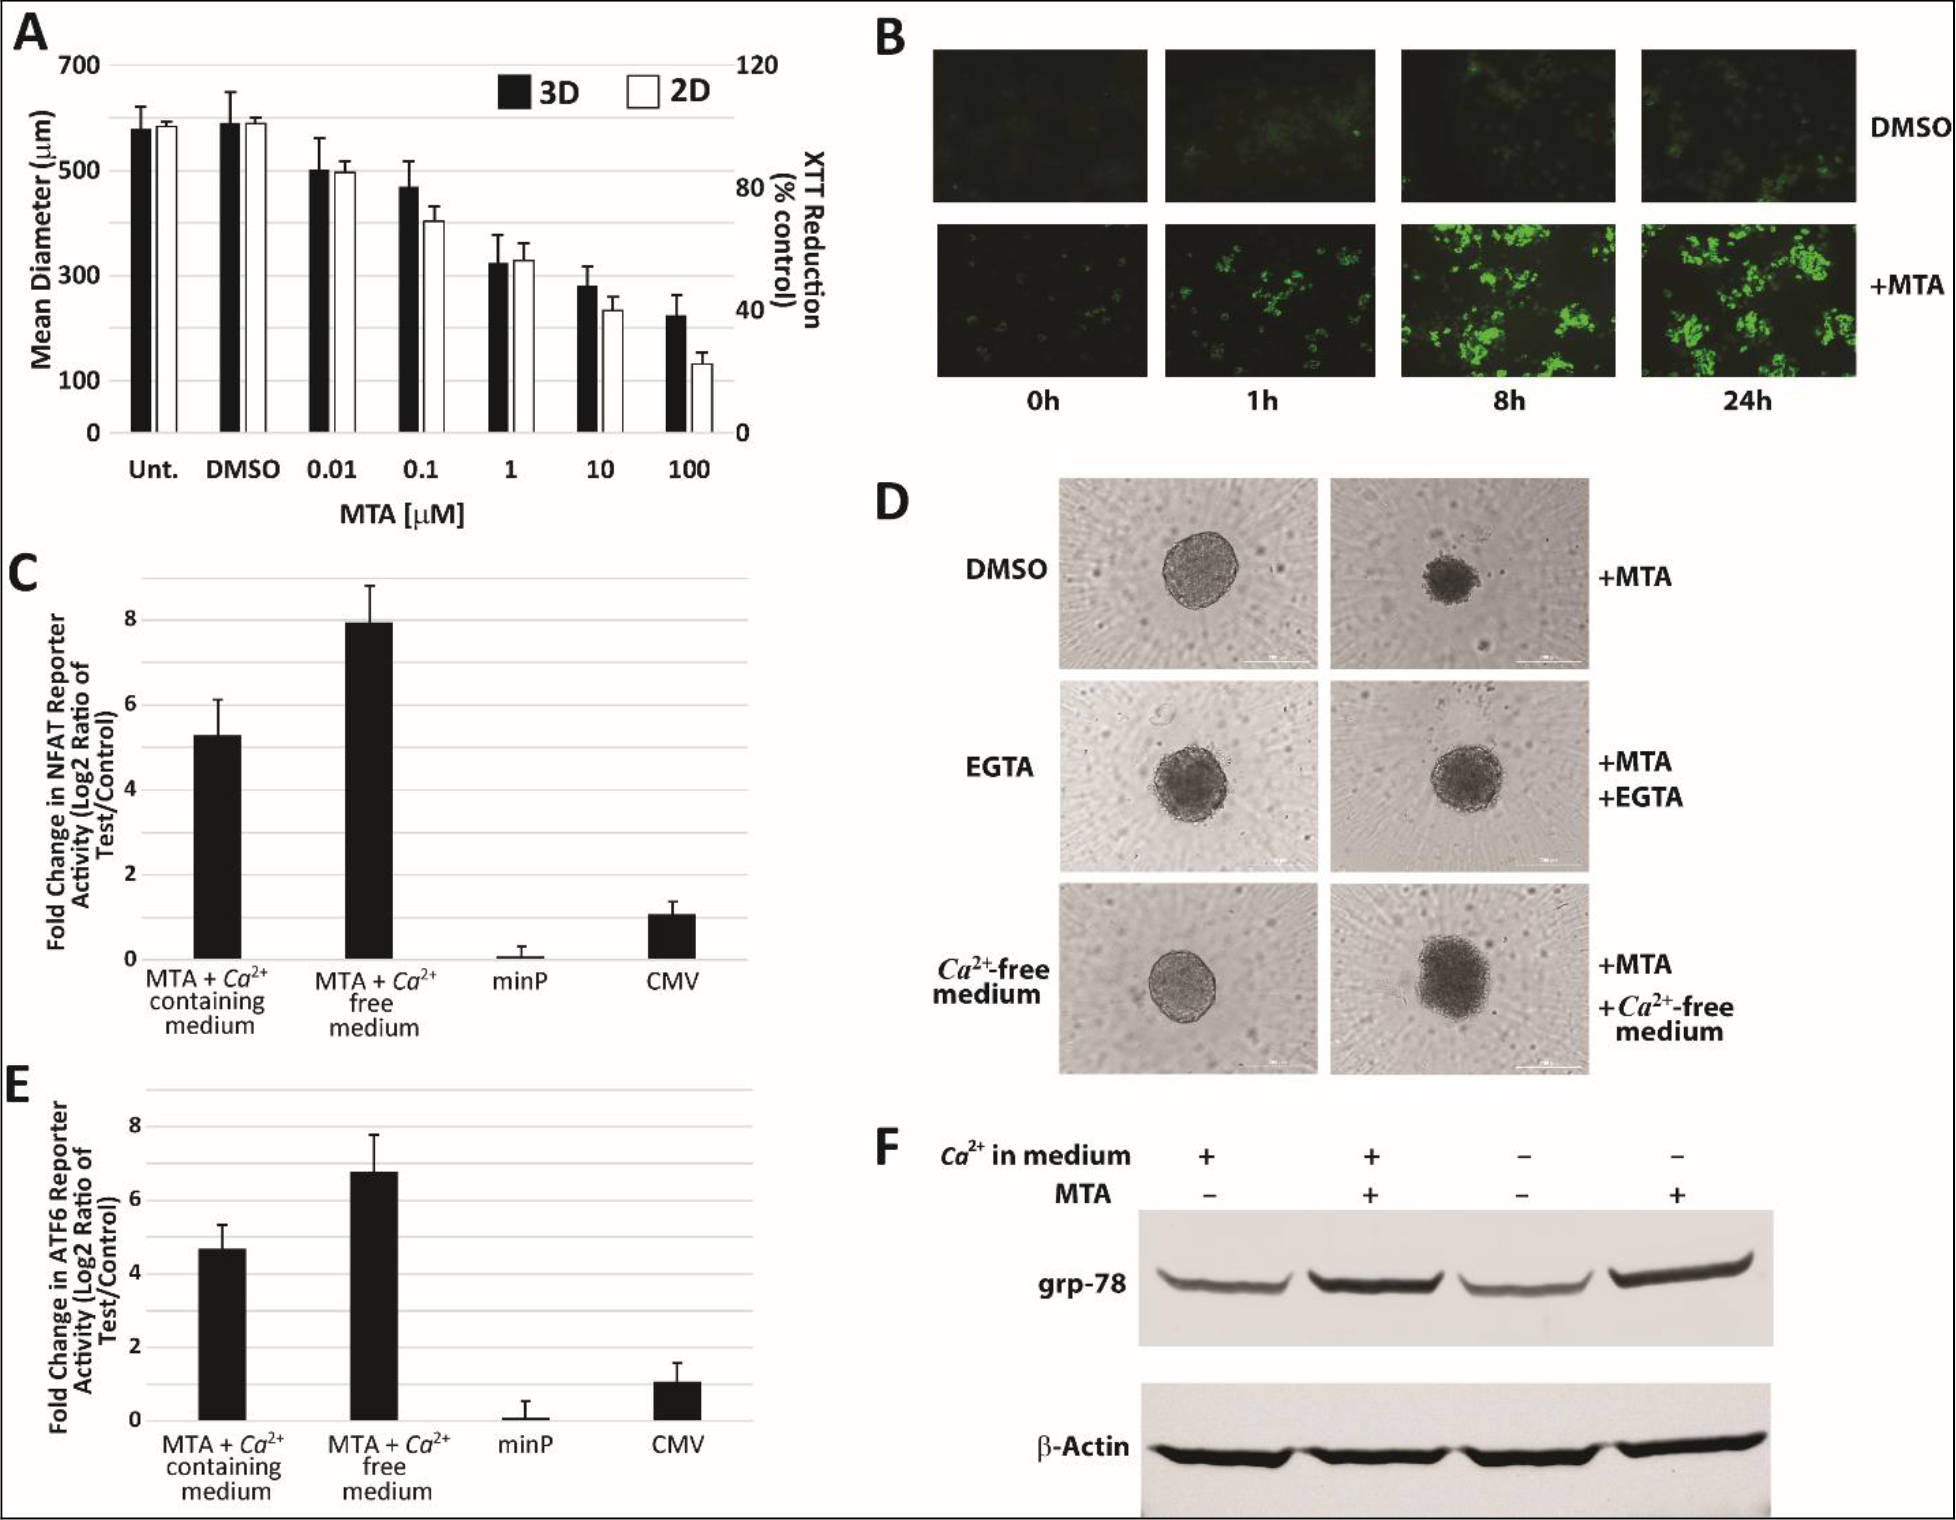
Figure 2. MTA induces rise in cytosolic Ca2+ levels in HepG2 cells. (A) MTA showed dose dependent inhibitory effect on growth of HepG2 spheroids (3D) and cells grown in monolayer (2D). Representative fluorescence imaging of control (DMSO) and MTA treated cells (B) grown as monolayer and loaded with the calcium binding dye calcium Orange AM show increased fluorescence intensity over time in MTA treated cells indicating increase in cytosolic calcium levels. MTA treatment (10 mM) for 24 hours also resulted in increased luciferase reporter activity in HepG2 cells transiently transfected with a reporter construct for either NFAT (C) or ATF-6 (E) in both Ca2+-containing and Ca2+-free medium relative to control treatment. (D) Representative images of spheroids of control and MTA (10 mM, 48h) treated HepG2 cells in either Ca2+-free medium or in medium pretreated with 1.8 mM EGTA to chelate extracellular Ca2+ showed partial reversal of MTA’s effect on spheroid size and shape. Western blot of lysates from spheroid treatment with MTA in both Ca2+-containing and Ca2+-free medium showed upregulation of markers of ER stress (F).
MTA Induces Cell Injury in HepG2 Cells
Dysregulation of Ca2+ homeostasis has been implicated in the induction of apoptosis via involvement in onset of the Mitochondrial Permeability Transition (MPT) [19]. As a result, we also looked at whether MTA induced MPT using JC1 to assess changes in the mitochondrial membrane potential. Treatment of HepG2 cells with MTA, however, resulted in an increase in JC1 aggregate signal (Figure 3A) suggesting hyperpolarization of the mitochondrial membrane. We sought corroboration for this finding by quantifying changes in cellular ATP content since ATP production requires the existence of mitochondrial membrane potential. Treated HepG2 cells grown either as monolayer (Figure 3B) or as spheroids (Figure 3C) were both found to have increased total ATP content consistent with findings of increased mitochondrial membrane potential.
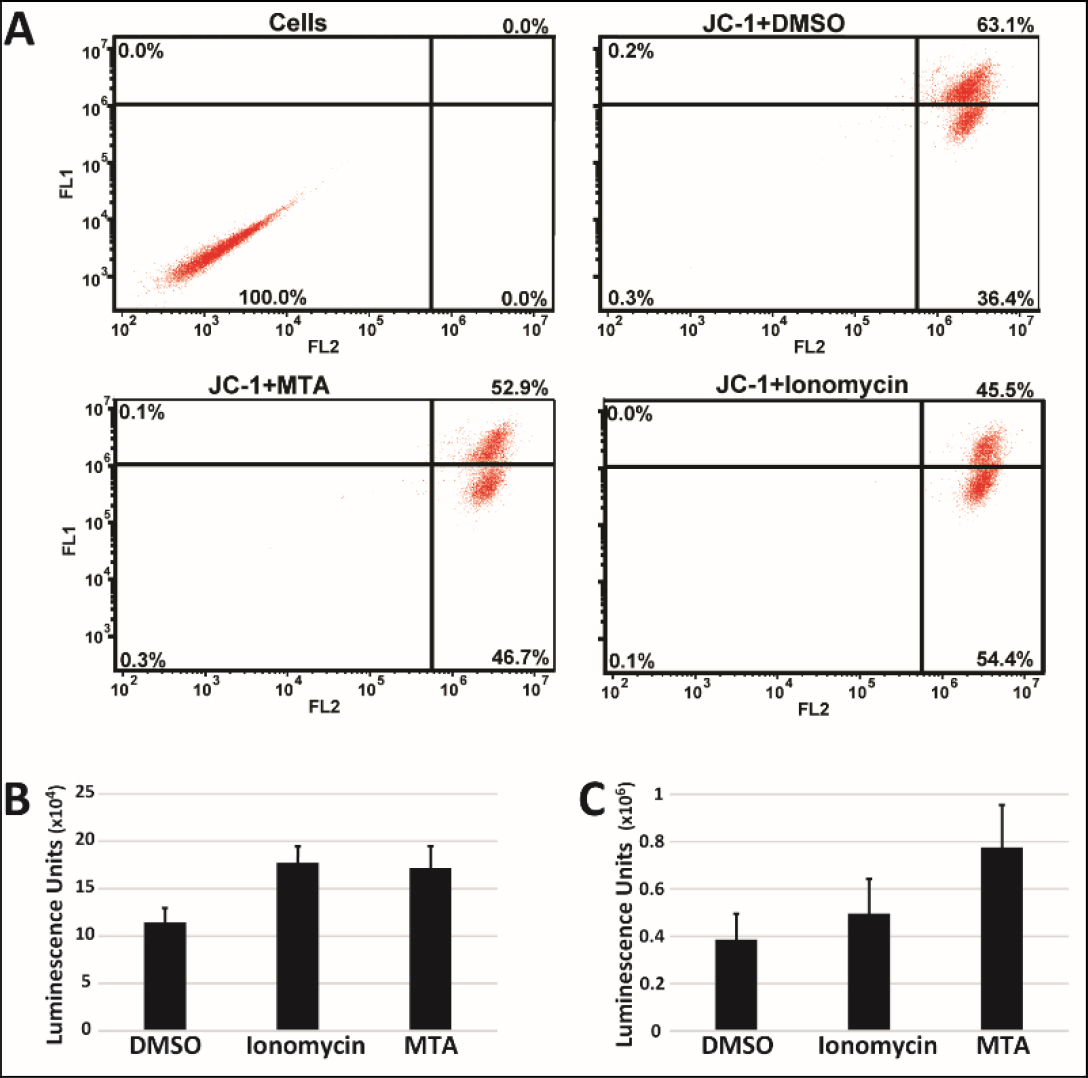
Figure 3. MTA increases Mitochondrial potential. A) HepG2 cells treated with 10µM MTA for 24h were stained with JC-1. 1µM of the calcium ionophore ionomycin was used as a positive control. Shown are representative plots of experiments. Total ATP content in HepG2 cells grown as monolayer (B) and spheroids (C) was measured using ATP fueled luciferase activity 24h after treatment with 10 µM MTA.
Increased mitochondrial membrane potential has been shown to be an early event in the induction of apoptosis in response to treatment by compounds in HepG2 cells [20]. Spheroid imaging and size measurements in many of the experiments conducted also revealed a decrease in size and change in shape upon MTA treatment suggesting impact on cell proliferation and survival. As a result, we first looked at whether MTA induced apoptosis. Imaging of MTA treated HepG2 spheroids stained with caspase 3/7 reagent measuring caspase 3/7 activity revealed that treated cells were positively stained (Figure 4A). Caspase 3/7 activity in MTA treated HepG2 cells grown as a monolayer were also found to be induced 3-fold 48 hours after treatment (Figure 4B). No increase in the activity of caspases 8 or 9 was observed in MTA treated cells. Since induction of apoptosis via activation of caspase 7 by calpain has been implicated in response to increase in cytosolic Ca2+ concentrations [21], calpain activation in HepG2 cells was assessed. It was found that MTA induced a 3-fold increase in calpain activity. Calpain activation by MTA was reversed by pretreatment with the cell permeable calcium chelator BAPTA-AM (Figure 4C). Pretreatment with BAPTA-AM was also found to inhibit caspase 3/7 (Figure 4D) activation suggesting that this activation is dependent on elevation of free cytosolic Ca2+ levels. Together, the data on disruption of mitochondrial membrane potential and induction of apoptosis by MTA in HepG2 cells point to MTA being a direct toxin.
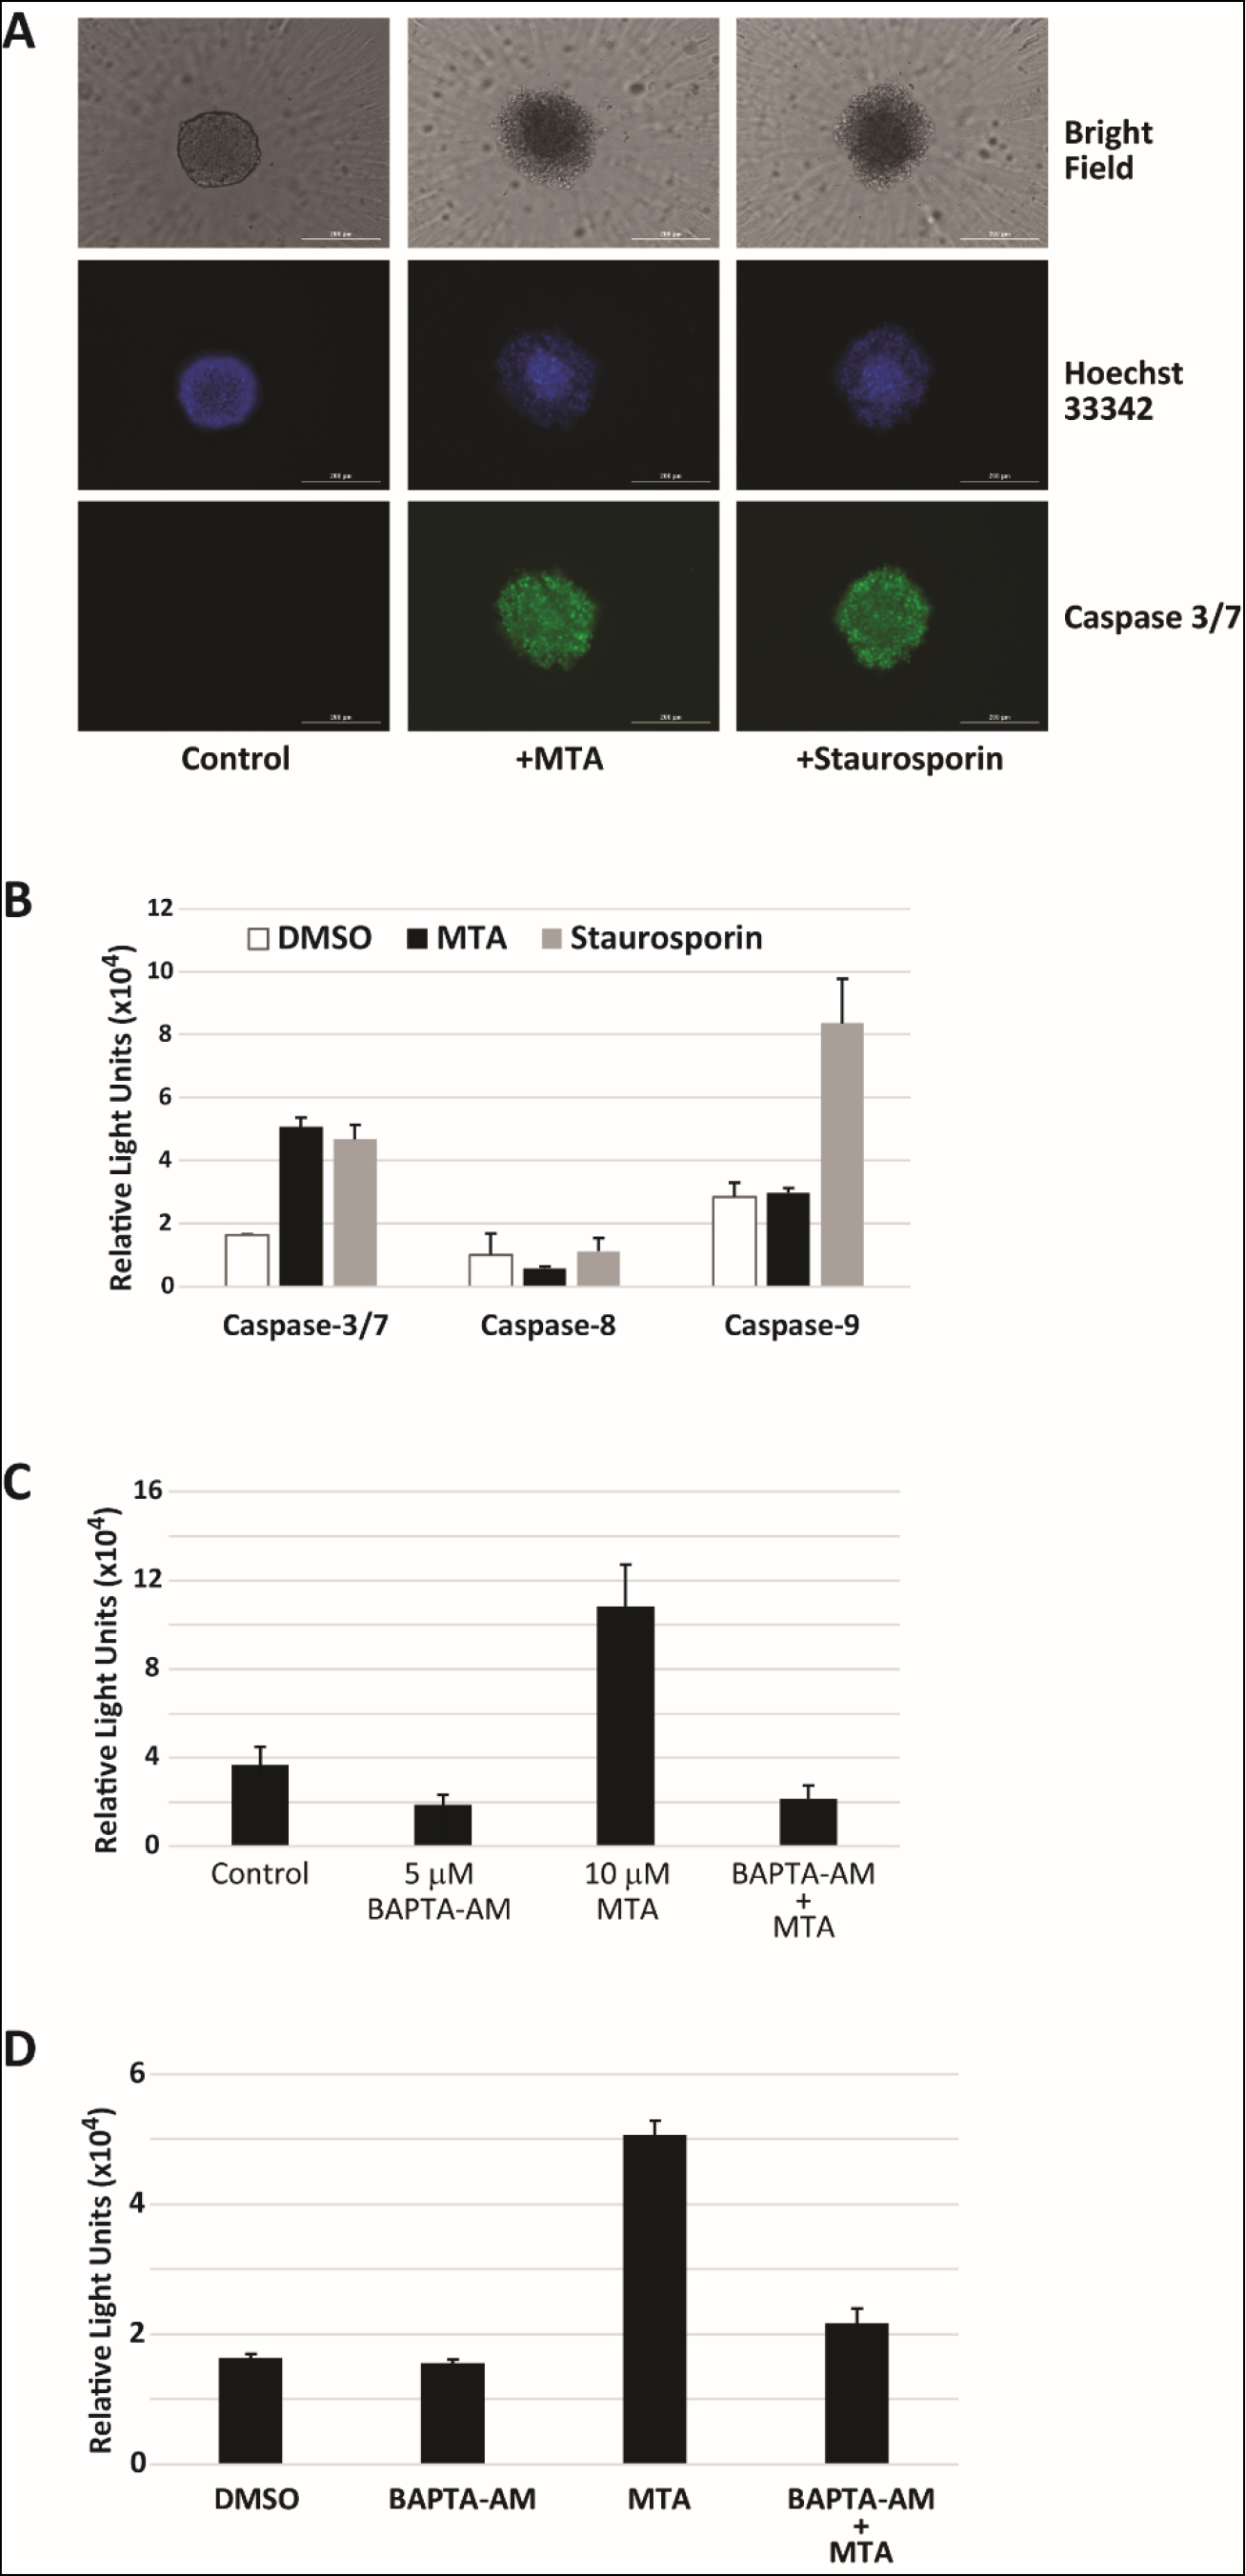
Figure 4. MTA induces apoptosis in HepG2 cells. A) Control, 10 µM MTA and 20 nM staurosporine (positive control) treated HepG2 spheroids were stained with both Hoechst 33342 DNA stain (purple) and caspase 3/7 stain (green) and imaged. Shown are representative images acquired 48h after treatment. B) Relative caspase 3/7/8/9 activity 48h after treatment with 10 µM MTA. C) Calpain activation was detected in response to MTA treatment in HepG2 cells using a luminescence detection kit. MTA induced activation was reversed by pretreatment of cells with the intracellular calcium chelator BAPTA-AM. D) Pretreatment of HepG2 cells with 5 µM BAPTA-AM significantly reduced caspase-3/7 activation by in HepG2 cells treated with 10 µM MTA for 48h.
Discussion
In a previous effort to find novel agents targeting EWS-FLI1 in Ewings sarcoma, we identified MTA as the highest scoring lead compound. However, liver toxicity during clinical trials at subinhibitory concentrations halted development of MTA. A better understanding of the mechanism of its liver toxicity is needed for further development of more recent analogs with improved activity profile. To the best of our knowledge, this is the first study to describe a potential cellular mechanism for its hepatotoxicity.
In the present study, we performed a chemical genomics screen of non-essential homozygous and essential heterozygous gene deletion mutants of S. cerevisiae to gain insight into the MTA’s mode of action. Screening of this “disruptome” against bioactive compounds has been shown to provide valuable insight into target genes and gene involved in resistance to these compounds [22]. Through gene ontology analysis of sensitive strains, we showed that MTA’s chemogenomic profile revealed its involvement in dysregulation of calcium homeostasis through impact on V-ATPases, which are critical for generation of a pH gradient that drives secondary transporters to maintain cellular ion homeostasis. Comparison of MTA’s chemogenomic profile with that of Amiodarone’s shows close similarity [23,24]. Amiodarone’s antifungal activity is mediated by perturbation of calcium homeostasis with hypersensitivity of vma mutants in its chemogenomic profile ascribed to defects in ion homeostasis. Hypersensitivity of multiple vma deletion mutants encoding subunits of the vacuolar membrane H+-ATPase in the MTA chemogenomic profile (i.e., vma9Δ, vma2Δ, vma8Δ, vma3Δ and vma6Δ) not only indicates disruption of the cation homeostasis pathway by MTA but also underscores the critical role of V-ATPases in resistance to MTA’s inhibitory action [25].
There are many reports that link drug-induced liver toxicity to perturbation of calcium homeostasis. Elevation in cytosolic Ca2+ concentration is implicated in toxic liver injury associated with a number of compounds including diclofenac [26], senecionine and trans-4-OH-2-hexenal [27], halothane [28,29], and antivirals efavirenz and ritonavir [30]. In HepG2 cells, we found that MTA induced a sustained increase in cytosolic calcium levels through mobilization from the extra cellular medium and intracellular stores resulting in inhibition of cell proliferation. However, unlike several reports in different cell lines where such elevation causes mitochondrial depolarization and mitochondria mediated apoptosis, we found no alterations in the levels of or activation of mitochondria and apoptosis related proteins including Bcl-2 and BAX ruling out immediate involvement in induction of apoptosis by mitochondria. On the other hand, studies have shown that calpains are activated by sustained elevation of cytosolic calcium in HepG2 cells [31]. Our findings of calpain activation and partial reversal of the apoptosis in MTA treated cells with a calpain inhibitor are consistent with this observation and further underscore the critical role of impaired calcium homeostasis pathway in drug-induced direct hepatotoxicity.
Although its exact cellular mechanism of action has not been elucidated in mammalian cells, studies have shown that MTA forms complexes with GC-rich regions of DNA [32]. Formation of this complex is, however, dependent on the presence of divalent cations [33]. This DNA binding ability is thought to be responsible for its anticancer effects where carcinogenesis and disease progression is driven by transcription factors that preferentially bind GC-rich regions. Comparison of MTA’s haploinsufficiency and homozygous deletion profiles in yeast deletion mutants with those of well-characterized DNA binding compounds such as doxorubicin and actinomycin D [34], however, did not reveal enrichments in genes involved in DNA synthesis and repair. Western blotting analysis of lysates from MTA treated monolayer or spheroid HepG2 cultures also did not show activation of proteins such as ATM and ATR involved in DNA repair. These suggest that, its effect in HepG2 cells is primarily mediated through its impact on calcium homeostasis.
In summary, we propose that MTA acts as a direct hepatotoxin and that this activity ensues subsequent to dysregulation of calcium homeostasis and induction of ER stress resulting in apoptosis. This discovery will allow for a better characterization of hepatotoxicity much earlier in the discovery phase of synthetic and biosynthetic analogs currently being generated for targeting EWS-FLI1 in Ewings sarcoma.
Acknowledgement
This work has been funded in part with Federal funds from the Frederick National Laboratory for Cancer Research, National Institutes of Health, under contract HHSN261200800001E and in part by the Intramural Research Program of NIH, Frederick National Lab, and Center for Cancer Research. The content of this publication does not necessarily reflect the views or policies of the Department of Health and Human Services, nor does the mention of trade names, commercial products, or organizations imply endorsement by the U.S. Government.
References
- Haskell T, Ryder A, P. Frohardt R, A. Fusari S, L. Jakubowski Z, et al. (1958) The Isolation and Characterization of Three Crystalline Antibiotics from Streptomyces plicatus. J Am Chem Soc 80: 743–747.
- Grohar P, Woldemichael G, Griffin L, Mendoza A, Chen Q-R, et al. (2011) Identification of an Inhibitor of the EWS-FLI1 Oncogenic Transcription Factor by High-Throughput Screening. Journal of the National Cancer Institute 103: 962–978.
- Kofman S, Perlia CP, Economou SG (1973) Mithramycin in the treatment of metastatic Ewing’s sarcoma. Cancer 31: 889–893. [crossref]
- Grohar PJ, Glod J, Peer CJ, Sissung TM, et al. (2017) A phase I/II trial and pharmacokinetic study of mithramycin in children and adults with refractory Ewing sarcoma and EWS-FLI1 fusion transcript. Cancer Chemother Pharmacol 80: 645–652. [crossref]
- Osgood CL, Maloney N, Kidd CG, Kitchen-Goosen SM, Segars LE, et al. (2016) Identification of mithramycin analogs with improved targeting of the EWS-FLI1 transcription factor. Clinical Cancer Research 22: 4105–4118. [crossref]
- King PD, Perry MC (2001) Hepatotoxicity of chemotherapy. Oncologist 6: 162–176. [crossref]
- CLSI (2008) Reference method for broth dilution antifungal susceptibility testing of yeasts. approved standard M27- A3, 3rd edn, Clinical and Laboratory Standards Institute, Wayne, PA ,USA.
- Ericson E, Hoon S, Onge RPS, Giaever G, Nislow C (2010) Exploring gene function and drug action using chemogenomic dosage assays. Methods enzymol 470: 233–255 [crossref]
- Pierce SE, Davis RW, Nislow C, Giaever G (2007) Genome-wide analysis of barcoded Saccharomyces cerevisiae gene-deletion mutants in pooled cultures. Nat protoc 2: 2958–2974. [crossref]
- Maere S, Heymans K, Kuiper M (2005) BiNGO: a Cytoscape plugin to assess overrepresentation of gene ontology categories in biological networks. Bioinformatics 21: 3448–3449. [crossref]
- Merico D, Isserlin R, Stueker O, Emili A, Bader GD (2010) Enrichment map: a network-based method for gene-set enrichment visualization and interpretation. PLoS One 5: e13984. [crossref]
- Caropreso V, Darvishi E1, Turbyville TJ2, Ratnayake R1, Grohar PJ3, et al. (2016) Englerin A Inhibits EWS-FLI1 DNA Binding in Ewing Sarcoma Cells. J Biol Chem 291: 10058–10066. [crossref]
- Förster C, Kane PM (2000) Cytosolic Ca2+ Homeostasis Is a Constitutive Function of the V-ATPase in Saccharomyces cerevisiae. Journal of Biological Chemistry 275: 38245–38253. [crossref]
- Cyert MS, Philpott CC (2013) Regulation of cation balance in Saccharomyces cerevisiae. Genetics 193: 677–713. [crossref]
- Ramaiahgari SC, den Braver MW, Herpers B, Terpstra V, Commandeur JNM, et al. (2014) A 3D in vitro model of differentiated HepG2 cell spheroids with improved liver-like properties for repeated dose high-throughput toxicity studies. Archives of Toxicology 88: 1083–1095. [crossref]
- Wang S, Kang X, Cao S, Cheng H, Wang D, et al. (2012) Calcineurin/NFATc1 Pathway Contributes to Cell Proliferation in Hepatocellular Carcinoma. Digestive Diseases and Sciences 57: 3184–3188. [crossref]
- Bosquet A, Guaita-Esteruelas S, Saavedra P, Rodríguez-Calvo R, Heras M, Girona J, et al. (2016) Exogenous FABP4 induces endoplasmic reticulum stress in HepG2 liver cells. Atherosclerosis 249: 191–199. [crossref]
- Woldemichael GM, Turbyville TJ, Vasselli JR, Linehan WM, McMahon JB (2012) Lack of a Functional VHL Gene Product Sensitizes Renal Cell Carcinoma Cells to the Apoptotic Effects of the Protein Synthesis Inhibitor Verrucarin A. Neoplasia 14: 771-IN728. [crossref]
- Schanne FA, Kane AB, Young EE, Farber JL (1979) Calcium dependence of toxic cell death: a final common pathway. Science 206: 700–702. [crossref]
- Cao J, Liu Y, Jia L, Zhou H-M, Kong Y, Yang G, et al. (2007) Curcumin induces apoptosis through mitochondrial hyperpolarization and mtDNA damage in human hepatoma G2 cells. Free Radical Biology and Medicine 43: 968–975. [crossref]
- Gafni J, Cong X, Chen SF, Gibson BW, Ellerby LM (2009) Calpain-1 cleaves and activates caspase-7. J Biol Chem 284: 25441–25449. [crossref]
- Giaever G1, Nislow C (2014) The yeast deletion collection: a decade of functional genomics. Genetics 197: 451–465. [crossref]
- Gupta SS, Ton VK, Beaudry V, Rulli S, Cunningham K, et al. (2003) Antifungal activity of amiodarone is mediated by disruption of calcium homeostasis. The Journal of biological chemistry 278: 28831–28839. [crossref]
- Muend S, Rao R (2008) Fungicidal activity of amiodarone is tightly coupled to calcium influx. FEMS Yeast Res 8: 425–431. [crossref]
- Forster C, Kane PM (2000) Cytosolic Ca2+ homeostasis is a constitutive function of the V-ATPase in Saccharomyces cerevisiae. J Biol Chem 275: 38245–38253. [crossref]
- Lim MS, Lim PL, Gupta R, Boelsterli UA (2006) Critical role of free cytosolic calcium, but not uncoupling, in mitochondrial permeability transition and cell death induced by diclofenac oxidative metabolites in immortalized human hepatocytes. Toxicology and applied pharmacology 217: 322–331. [crossref]
- Griffin DS, Segall HJ (1987) Role of cellular calcium homeostasis in toxic liver injury induced by the pyrrolizidine alkaloid senecionine and the alkenal trans-4-OH-2-hexenal. Journal of biochemical toxicology 2: 155–167. [crossref]
- Farrell GC, Mahoney J, Bilous M, Frost L (1988) Altered hepatic calcium homeostasis in guinea pigs with halothane-induced hepatotoxicity. J Pharmacol Exp Ther 247: 751–756. [crossref]
- Yu WF, Yang LQ, Zhou MT, Liu ZQ, Li Q (2005) Ca2+ cytochemical changes of hepatotoxicity caused by halothane and sevoflurane in enzyme-induced hypoxic rats. World J Gastroenterol 11: 5025–5028. [crossref]
- Kao E, Shinohara M, Feng M, Lau MY, Ji C (2012) Human immunodeficiency virus protease inhibitors modulate Ca2+ homeostasis and potentiate alcoholic stress and injury in mice and primary mouse and human hepatocytes. Hepatology (Baltimore, Md) 56: 594–604. [crossref]
- Caro AA, Cederbaum AI (2002) Role of calcium and calcium-activated proteases in CYP2E1-dependent toxicity in HEPG2 cells. J Biol Chem 277: 104–113. [crossref]
- Albertini V, Jain A, Vignati S, Napoli S, Rinaldi A, et al. (2006) Novel GC-rich DNA-binding compound produced by a genetically engineered mutant of the mithramycin producer Streptomyces argillaceus exhibits improved transcriptional repressor activity: implications for cancer therapy. Nucleic acids research 34: 1721–1734. [crossref]
- Cons BM1, Fox KR (1989) Interaction of mithramycin with metal ions and DNA. Biochem Biophys Res Commun 160: 517–524. [crossref]
- Hoepfner D, Helliwell SB, Sadlish H, Schuierer S, Filipuzzi I, et al. (2014) High-resolution chemical dissection of a model eukaryote reveals targets, pathways and gene functions. Microbiological Research 169: 107–120. [crossref]