Author Archives: author

Thoughts at a White Coat Ceremony

DOI: 10.31038/IMROJ.2019422


The first documented White Coat Ceremony was held 10 years after I entered medical school. Dr. Arnold P. Gold held his first White Coat Ceremony four years after that [1]. White Coat Ceremonies have spread throughout US medical schools and even internationally [2,3], largely through the support of the foundation established by Dr. Gold, his family and his colleagues [3]. I confess that when I first heard of these events sometime in the mid to late 1990s, the idea of presenting a white coat to entering medical students in a ceremony so that they would understand that they are beginning their entry into a profession, reminded me of an old Monty Python sketch. A middle-aged man with spectacles (not unlike me) goes into an employment office and asks if there are any job openings for a lion tamer. When asked about his qualifications, he pulls out a pith helmet and says, “I’ve got the hat”.

After I began attending White Coat Ceremonies in 2011, I realized my flippant initial reaction was unjust. I have come to appreciate White Coat Ceremonies as an opportunity for helping new students understand and embrace the values of the medical profession, with the white coat as a symbol of those values. Of course, the holistic admissions practices of most medical schools, at least in the US, aim to ensure that matriculated students possess many of the underlying humanistic qualities desired in physicians; and certainly, the students should understand that ultimately what makes one a physician is not the white coat but the person who is inside it.

However, even the apparently innocuous activity of the White Coat Ceremony has generated controversy. There was always some debate about the timing of the ceremony in the process of education: some schools would hold their ceremony at matriculation, while others might schedule it at the point in the curriculum where students shift from their preclinical studies to working in the clinics and wards. As earlier clinical exposure becomes more common, it is likely that White Coat Ceremonies held in the end of the second year of medical school will shift earlier in the educational process. More significant controversies revolve around the purpose and symbolism of the White Coat Ceremony itself.

For Dr. Arnold Gold, it seems clear that there was no intrinsic conflict between “humanism” and medical “professionalism” and the White Coat Ceremony represented both [3]. This perspective was certainly that held by physicians of his generation [4], and certainly is an aspirational goal even now. Even early in their history, White Coat Ceremonies were recognized as a tool for inculcating and teaching professionalism [5]. More recent commentators have argued that humanism, defined by values that are egalitarian and universal, has become distinct from professionalism, which may be parochial and culturally determined, and to at least some degree, self-interested [6]. It has also been suggested that the White Coat Ceremony is a defensive action by the medical profession, symbolizing a claim of entitlement in a world where physician leadership of healthcare is challenged [7]. Perhaps reflecting these perceived conflicts is a model in which a “profession-entry” ceremony is held early in the first year followed by a later “humanistic” ceremony including individual statements of values, a high level of student engagement, and artistic performances [2]. Most White Coat Ceremonies include recitation of some sort of commitment or oath: the meaning and appropriateness of such recitations has also been debated [8,9].

The widely discussed issue of physician burnout engages the issues reflected in debates about the appropriateness and meaning of White Coat Ceremonies. Challenges to the autonomy of the medical profession are not only of a financial or administrative nature, but also reflect challenges to the humanistic expectations of patient centeredness and empathy. For that reason, it has been suggested that the term “burnout” should be replaced by the term “moral injury” [10].

When I discuss these issues with students, either individually or in small group learning settings, I emphasize that medicine is one of the professions as traditionally defined. More specifically, it is one of the three characterized as “learned professions”. Medicine is also a vocation, or if one prefers, a “calling”. The word “vocation” derives from the same Latin root as “vocal”. It refers to something to which one is called or summoned, and accepting the call implies a commitment with attendant obligations. For medicine, the commitment is to the service of the patient. For each of us, the obligation is for that service always to reflect our best, with a further obligation that through lifelong learning we will strive to ensure that the gap between our best and the ever-shifting target of “THE best” is always small as circumstances permit. The White Coat Ceremony and the acceptance by a student of her or his first white coat symbolize recognition that they are beginning the path to that commitment and to the obligations that follow from it.

In thinking about these issues, I am reminded of things other than Monty Python. When I was in college, the US Navy ran a series of recruiting commercials with the tagline “It’s not a job, it’s an adventure”. Medicine is not just a job: it is a profession, a calling, a commitment. However, a lot of us believe it is also an adventure [11].

Adapted from remarks made at the James H. Quillen College of Medicine Class of 2022 White Coat Ceremony – July 20, 2018.  Dr. Means is a former dean of the College

The White Coat Ceremony was supported in part by the Arnold P. Gold Foundation.

References

  1. Gold A, Gold S (2006) Humanism in medicine from the perspective of the Arnold Gold Foundation: challenges to maintaining the care in health care. Journal of child neurology 21: 546–549.
  2. Tamai R, Koyawala N, Dietrick B, Pain D, Shochet R (2019) Cloaking as a community: re-imagining the White Coat Ceremony with a medical school learning community. J Med Educ Curric Dev 6: 2382120519830375.
  3. Kavan MG (2009) The White Coat Ceremony: a tribute to the humanism of Arnold P. Gold. Journal of child neurology 24: 1051–1052.
  4. Lepore MJ (1982) Death of the Clinician: Requiem Or Reveille? Springfield, IL USA: Charles C. Thomas; 1982.
  5. Swick HM, Szenas P, Danoff D, Whitcomb ME (1999) Teaching professionalism in undergraduate medical education. Jama 282: 830–832.
  6. Goldberg JL (2008) Humanism or professionalism? The White Coat Ceremony and medical education. Academic Medicine: Journal of the Association of American Medical Colleges 83: 715–722.
  7. Russell PC (2002) The White Coat Ceremony: turning trust into entitlement. Teaching and learning in medicine 14: 56–59.
  8. Huber SJ (2003) The White Coat Ceremony: a contemporary medical ritual. Journal of medical ethics. 29: 364–366.
  9. Veatch RM (2002) White coat ceremonies: a second opinion. Journal of medical ethics. 28: 5–9.
  10. Heston TF (2019) Pahang JA. Moral Injury or Burnout? South Med J 112: 483.
  11. Robinson GC (1957) Adventures in Medical Education. A Personal Narrative of the Great Advance of American Medicine. Cambridge: Commonwealth Fund 1957.

The Integrated Medicine route for women’s Health and oncology in the Local Health Unit (AUSL) of Bologna and in the Emilia-Romagna Region

DOI: 10.31038/IGOJ.2019243

Short Communication

In contemporary medicine hyperspecialistic and technological visions coexist with a widespread illiteracy about what is psychophysical wellbeing. People are looking for solutions that are able to take into account physical and mental illnesses as a whole. On the other hand, health professionals live the contradiction between the increase in scientific knowledge and the rigidity of the therapeutic intervention field. Among them the most common feeling is frustration, which comes out in fact from the feeling of being mechanicals of the body or of the brain rather than promoters or facilitators of human health.

This is particularly true in the field of women’s health and facing oncological diseases, where physical health is intertwined with personal, familiar, psychological and social aspects.

The integration proposal in the Emilia-Romagna Region and in the Local Health Unit of Bologna arises from these two discomforts: on the one hand from the need to know the effectiveness and the applicability of alternative and Complementary Medicine (CAM), according to the clinical efficacy criteria, within the services of the Local Health Unit and, on the other hand, from the request of women taking part in self-help groups for breast-operated women, who sought relief from side effects of adjuvant drugs.

Within the Local Health Unit of Bologna, the process of CAM integration in oncology and in the field of women’s health was born in 2004, together with the First Experimental Programme for the integration of CAM in the regional health system. Some study projects were proposed and carried out on women’s issues and with high social and health relevance.

First of all a pilot project exploring the effectiveness of acupuncture in a small group of women subjected to adjuvant therapy after breast cancer [1].

Then a survey on the free clinic services of the City of Bologna was carried out. The focus of the study was the use of CAM in women aged between 45 and 65 years (one year of observation) and the results showed that 30% of women used CAM professionals and/or CAM remedies, alone or together with replacement therapy. The survey, designed in collaboration with the University of Sydney, revealed a hidden side of CAM use and a trend that is still confirmed in the clinical reality [2,3].

Afterwards a pilot study about the use of a technique derived from acupuncture, the needle-injection in the acupuncture point SP 6 (Sanyinjiao) of Vitamin K1, in order to reduce menstrual pain in young women suffering from severe primary dysmenorrhea. At the beginning of menstrual pain, 19 young women (aged between 15 and 19 years) were treated. The method reduced pain (measured by VAS) by about 50% in acute and decreased the use of analgesic drugs; this result was kept reduced for about 4 months after the initial treatment [4].

In oncology, the results of the pilot project and of the AcCliMaT project have furthered the continuation of the works, throughout selection criteria that can be found in the Regional guidance document, which represents the theoretical basis and the reference methodological framework for the Third Regional Experimental Programme about CAM [1]. Starting from the criteria presented there, the choice of the study focus on the prevention / reduction / control of adverse events, related to non-physiological menopause(which represents a serious problem for the quality of life of women with breast cancer), has been privileged.

AcCliMaT Study Project

AcCliMaT is a pragmatic, randomized and controlled trial comparing acupuncture plus enhanced self-care versus enhanced self-care alone. A total of 190 women with breast cancer were randomly assigned. The acupuncture group received 10 traditional acupuncture treatment sessions, according to a therapeutic protocol derived from a consensus among the acupuncturists of the project group. Within the acupuncture treatment group, there was a reduction of the primary outcome, Hot Flash Score (HSF) that measures the intensity and frequency of hot flashes, significantly lower than the control group (46% difference between the two groups). The Menopause Quality of Life (MenQoL) questionnaire also showed a better quality of life in the group with acupuncture plus self-care; a result that tends to remain in the follow up.

The AcCliMaT study confirms what has been highlighted in literature: acupuncture represents a possibility of treating and improving the quality of life in post-intervention of women with breast cancer and the integration between acupuncture and self-care represents a further advantage for the reduction of hot flushes and for the control of the climacteric syndrome, improving the quality of life of women with breast cancer. This is the basis on which the project of Integrative Medicine in Oncology was set up [5].

Integrated Medicine in Oncology in Emilia-Romagna Region (Med.I.O.R.E.R.)

The Med.I.O.R.E.R project represents the link between the research phase and the construction of acupuncture services dedicated to women operated for breast cancer. It is a prospective, multicentre study evaluating a model of integration of CAM treatments in the oncology departments and services of the Healthcare Centres of the Emilia-Romagna Region and responds to the need, more and more frequently expressed by patients suffering from breast cancer, to reduce the side effects of chemo-radiotherapy and adjuvant therapy. The project aims at the construction of integrated medicine surgeries in which Traditional Acupuncture plus Self-care treatments will be offered. The Med.I.O.R.E.R. project involves the measurement of quantitative process indicators and the collection of qualitative data related to the satisfaction of both professionals and patients.

The Primary Outcomes: The Primary Outcomes are frequency of sending patients to the CAM surgery, effective use of the path by patients, compliance, average number of accesses per patient to the integrated medicine surgery and the number of patients included for each centre.

The Secondary Outcomes: The Secondary Outcomes are the level of integration of the Acupuncture plus Self-care intervention in the clinical oncological practice of the Healthcare Centres of the Emilia-Romagna Region, dedicated to the climacteric syndrome in women with breast cancer; the adequacy of the offer according to the demand (external pressure index); the adequacy of the integrated medical pathway within the organization (focus groups, interviews of integrated medicine).

Conclusion

The Integrated Medicine route in oncology goes on with great belief and satisfaction from professionals and women with breast cancer and demonstrates how the inclusion of CAM methods, supported by scientific evidence and local clinical experiences conducted with scientific criteria, represents an advantage for the quality of life of women with breast cancer. At the same time, it confirms what Zhang Xiaorui (WHO Coordination Officer) wrote on December 2000: “The scientific, safe and effective use of traditional medicine will certainly further promote the development of traditional medicine and traditional medicine will undoubtedly make more and more contributions to human health in the 21st century”.

References

  1. http://assr.regione.emilia-romagna.it/it/funzioni/mnc/doc-omncer
  2. Cardini F, LesiLombardoF,Van der Sluijs C (2010 )The use of complementary and alternative medicine by women experiencing menopausal symptoms in Bologna. BMC Women’s Health 10: 7.
  3. Corinnevander  Sluijs, Flavia L. Lombardo, GraziaLesi, Alan Bensoussan, Francesco Cardini (2013) Social and Cultural Factors Affecting Complementary and Alternative Medicine (CAM) Use during Menopause in Sydney and Bologna – Hindawi Publishing Corporation Evidence-Based Complementary and AlternativeMedicine 2013.
  4. Grazia Lesi, Annagiulia Gramenzi, Clarissa Frascà, Francesco Cardini, Clede Maria (2017) Acupuncture Point Injection of Vitamin K1 to Treat Severe Primary Dysmenorrhea: Case Series at a Women’s Health Service in Bologna. Garavini Chinese Medicine  8: 33–41.
  5. Grazia Lesi, GiorgiaRazzini, Muriel Assunta Musti, Elisa Stivanello, Chiara Petrucci, et al. Acupuncture As an Integrative Approach for the Treatment ofHot Flashes in Women With Breast Cancer: A ProspectiveMulticenter Randomized Controlled Trial (AcCliMaT) J Clin Oncol 4: 1795–802.

Aging and Care: Attitudes of undergraduate students towards elderly People

DOI: 10.31038/ASMHS.2019344

Abstract

Objectives: To consider and understand how the attitude toward elderly people among the adolescents, based on experience of interacting with or receiving assistance from elderly individuals. The study aims to analyze what kind of difference there is in the consciousness of the youth to the elderly by examining the relation between experience which contacts the elderly and support from the elderly in Japan.

Methods: The subjects were first-year students from four universities in Japan. This survey was used in this study concerns effect of experience interacting with the elderly on the attitude toward elderly people, based on the concept of the “attitude toward old people”(Kogan) model. Statistical evaluation of the data was included in variance analysis.

Results: Overall, 358 participants were surveyed, 125 males (34.9%) and 233 female (65.1%). The mean score Kogan for total participants 131.2±16.2. Those adolescents who had experience volunteer activities for the elderly, having cared for the elderly, having experience received caring from an older person were significantly high total score Kogan.

Discussions: The Attitudes of university students towards elderly people should be evaluated currently to be able to improve the provision of care for elderly people and to prevent possible negative beliefs through tracking elderly people.

Keywords

Attitudes toward Elderly, Experience with Older Adults, Supportive Relationship

Introduction

The ageing of the population is one of the challenging strategy of societies. Who would provide care for elderly people, may likely have a direct effect on the quality of care in the future. However, across the international studies support the gerontology as an adolescent is not a highly choicest aging care career [1]. Discovering the attitude of Japanese adolescents toward elderly people may help illuminate reasons gerontology is not a highly choicest career in Japan. It is reasonable to elucidate how the perception of elderly people, they are more likely to be educated in geriatric environment.

Therefore, it is responsible for educators and societies to understand the factors influencing adolescent attitude that drive adolescent’s experience of interacting with or receiving assistance from elderly individuals would be a good influence for positive attitudes to elderly people. The knowledge gained from this study can help guide aging related education program in Japan, thereby ensuring the developing of elderly care services of the growing elderly population. Japan’s aging rate is expected to reach about 40% in 2016 [2]. It is considered that there is a direct effect on the quality of the elderly support by how young people who shoulder the future elderly care in Japan of the declining birth rate perceive the elderly. In “Comprehensive Strategy for the Promotion of Policies for Dementia (2015)” [3] of the Ministry of Health, Labour and Welfare, it is important to examine what kind of value the young generation who shoulders the elderly care has for the elderly and what kind of education and enlightenment activity are necessary, because it is clarified that the understanding promotion to the elderly including the person of the dementia is positively taken in school education. In Japan, the majority of households are nuclear family units, however middle-age family member still plays an important role in the lives and assist care of elders. Younger family members do not live close to their elders and not interact with them.

Institutional care of elders in Japan is common, others are receiving home care services, day care support services, and Life support services at home. These services are developing in the world not only japan, but view augment between community-based caregiving and Institutional care [4]. Since the introduction of universal long-term care insurance (LTCI) in the spring of 2000,those aged 65 and over who need nursing care in their daily lives are eligible to receive the care services of LTCI. Consumers can choose the services and providers that they want. To that end, Japan has developed several services for elders who need care but the increase in the number of elderly people requiring LTCI, and associate costs of these services, are imposing a burden on our society. It has been reported that most institutions and service provider businesses face difficulties in their operation, specific human resource. From a health strategy for promoting understanding about elderly-including people with dementia in school education, examining the values of young people who are responsible for care of the elderly.

For the image of the elderly, it has been reported that the experience of living with the elderly is not an important determinant factor [5], the experience of interaction with the elderly, the frequency of interaction, the relationship and the way of involvement are related, and the attitude of parents and grandparents may also influence [6]. In addition, there is a tendency for people with little knowledge about dementia to have a positive image, and those who have experience of volunteering for elderly people with dementia to have a positive image compared to those without such experience. This indicates that not only knowledge about dementia, but also actual involvement with dementia may lead to a positive image.

Though it is clarified that studies which specialize affect the consciousness for the elderly of the youth, it is little examined from caring experience of the elderly, experience which received the care from the elderly. In this study, it was considered that it was necessary to examine the consciousness of the elderly by paying attention to both sides of the contact with the elderly such as learning which the youth specializes in experience, focusing on the university student who shifts from the adolescence to the adulthood. In this study, it was made that what kind of difference there is in the consciousness of the youth to the elderly by examining the relation between experience which contacts the elderly and support from the elderly. By this study, it aims at getting the suggestion for promoting the elderly understanding for the youth.

Methods

Study Sample

Participants for this study consisted of undergraduate students, who are first glade, at four universities in Japan. Students were selected using convenience sampling.

Measures

The demographic information included age, gender, department, status of cohabitation with elder people. Additional questions included experience regarding the elderly, whether presence/absence of volunteering experience with elder people, experience care for elder people, experience being taken care by elderly people, and perception about elderly care. The Japanese version of Kogan’s Attitudes towards Old People Scale (KAOP) was used in this survey. The response for favorable items and scored by assigning 1 point to “strong disagree”, 6 points to “strongly agree”, and the total positive items were calculated. A high score indicated a positive attitude toward elderly people.

Data Analysis

Descriptive statistics were used to report the demographic data. Statistical evaluation of the data was included in percentage, mean, Independent t-test was used to assess differences in score among categorical variables. A significant level of 0.05 was used for all analyses. SPSS Japanese version 25 was used for data entry and analysis.

Result

A convenience sample of 373 participants, among the responses excluding those with no responses to one or more items 358 responses were selected for the analysis. Participant characteristics are displayed in Table 1.

Table 1. Demographic characteristics of participants (N = 358)

Characteristic

n

% of Total Participants

Gender

Male

125

34.9

Female

233

65.1

Age

18–40

MEAN

18.96 ± 2.48

Subject Faculty

Nursing

157

43.9

Medical

95

26.5

Non-Health

106

29.6

Have experience living with an older person

156

43.5

Have experience living with a dementia older person

27

7.5

Have experience volunteer activities for an older person

131

36.5

Have experience caring for an older person

58

16.2

Have experience recieving from an older person

203

56.5

Age 18 to 40 years (M=18.96, SD=2.5), Sixty-five percent of the students were female and thirty-five percent of the students were male. Forty-three percent students have lived with the elderly. Thirty-six percent had experience of volunteer activities for the elderly, and caring experience for the elderly was sixteen percent, and the experience which received the care from the elderly was fifty-six percent.

The overall attitude score was in the positive direction (M=131.2, SD=16.2) with score ranging from a minimum of 57 to a maximum of 200 (Table 2). The participants’ mean score indicated slightly positive attitude toward elders. The mean total negative item score was 51.9 out of a possible highest score of 103. The mean total positive item score was 56.4 out of a possible score of 97. Both of these scores are within the range of positive attitudes according to Tomioka [7]. Total KAOP by sample characteristics used to assess the differences in mean score between and among variables, and significant differences were found. No significant differences were found in attitude scores within categories of living with elderly people, living with dementia elderly people. Those adolescents who had experience volunteer activities for the elderly, having cared for the elderly, having experience received caring from an older person were significantly higher total KAOP and negative item scores than those who had no having (Table 2).

Table 2. Total Kogan’s Attitudes toward Old People scale

Total KAOP

Negative Item Total

Positive Item Total

P

Median

Median

Median

Gender

Male

123.74

68.73

55.02

**

Female

135.25

78.12

57.13

Department

Nursing

135.52

78.31

57.21

**

Medicine

132.51

75.81

56.69

Non-Health

123.75

68.84

54.92

Living with an older person

Yes

131.61

75.34

56.23

ns

No

130.91

74.45

56.46

Living with a dementia older person

Yes

132.74

75.19

57.56

ns

No

131.08

74.81

56.28

Have experience volunteer activities for an older person

Yes

133.12

76.22

56.89

*

No

130.15

74.04

56.11

Have experience caring for an older person

Yes

134.43

78.16

56.28

*

No

130.66

74.23

56.43

Have experience recieving from an older person

Yes

131.16

75.25

55.91

*

No

128.64

72.68

55.96

** p<.01,* p<.05 ns:no significant

Discussion

Similar to the study conducted by Tomioka [7], Japanese college students’ attitude toward elderly in this study were generally slightly positive. Based on these results, Japanese adolescents exhibited a somewhat more positive attitudinal disposition toward elders than adolescents from other countries [8–10]. Previous study reported high negative attitude toward elderly people [8], however this study’s participants nurse and medical students have lower negative attitude than expected. Because the curricular emphases include gerontology and educational preparation given in many elementary schools and junior high school. In this study, students would be having experience volunteering activities with elderly people before college students. Female students held positive attitudes compared with male students. This finding was consistent with the majority of national and international studies. One factor might help explain the gender difference that the more caring nature of females [11].

The most statistically significant was interactive with elderly people through taking care for elderly or receiving care from elderly people. Those students who expressed tracking with elderly people had higher attitude scores, as seen in the study by Turgay et al. [12]. Therefore, continuing to be existing culture norms of respect and loyalty for elders may help positive attitudes of adolescents. Overall, these findings indicate that there is room for improvement in adolescent’ attitudes toward elderly people. The Attitudes of adolescents towards elderly people should be evaluated currently to be able to improve the provision of care for elderly people and to prevent possible negative beliefs through tracking elderly people. Educational preparation is a major factor in adolescent attitudes; therefore, gerontology education and experience connecting with elderly people should be important part of education curriculum.

References

  1. Brenda H, Jenny B (2001) Who will look after my Grandmother?. Journal of Gerontorogical Nursing 27: 12–17.
  2. Cabinet Office, Government of Japan (2012) Korei, kihon-kentoukai. Available at: http://www8.cao.go.jp/kourei/kihon-kentoukai/pdf/report-3.pdf
  3. Ministry of Health, Labor and Welfare (2015) Dementia policy promotion integrated strategy (new orange plan). Japan.
  4. William G, Cynthia M, Cready J & Pawelak E (2005) The Past and Future of Home and Community-Based Long-Term Care. A Multidisciplinary Journal of Population Health and Policy 83: 1468–0009.
  5. Hosaka K, Sodei T (1988) College student’s Image for the elderly-Analysis by SD Method. Journal Social gerontology 27, 22–33.(in Japanese)
  6. OkumuraY, Kuze J (2009) Factors related to the students’ image of elderly people- Comparison of the image of elderly with dementia and healthy elderly -, Journal of health sciences. Nihon Fukushi University 12: 31–38.(in Japanese)
  7. Tomioka H (2017) Attitude towards Aging and Old Adults among Japanese College Students-Its Relations to Aging Anxiety and Self-Efficacy-, Department Bulletin Paper. kyoikugakuronsyu 69: 61–79. (in Japanese)
  8. Matthew LS, Caroline DB, Clay C, SangNam A, Samuel DT, et al. (2017) Factors associated with ageist attitudes among college student, Geriatr Gerontol Int 17: 1698–1706.
  9. Alquwez N, Cruz JP, Almazan JU, Alamri MS, Mesde JJ (2018) The Arabic version of the Kogan Attitudes towards older People scale among Saudi nursing students; a psychometric analysis, Annuals of Saudi Medicine 38: 399–407.
  10. Bernardini Z, Moraru M, Kakache A, Macias N.(2008) Attitudes toward the elderly among students of health care related studies at the University of Salamanca, Spain. Journal of Continuing Education in the Health Professions 28: 86–90.
  11. Lambrinou E, Sourtzi P, Kalokerinou A, Lemonidou C (2009) Attitudes and knowledge of the Greek nursing students towards older people. Nursing Education Today 29: 617–622.
  12. Turgay AS, Sahin S, Aykar F, Sari D, Badir A et al. (2015) Attitude of Turkish nursing students toward elderly people. European Geriatric Medicine 6: 267–270.

A Systematic Review on the Effectiveness of Palmitoylethanolamide for the Treatment of Pain in Arthrogenic Temporomandibular Joint Dysfunction and Related Disorders

DOI: 10.31038/JDMR.2019243

Abstract

Arthrogenic temporomandibular joint dysfunction is a prevalent condition often associated with arthralgia. It is also commonly caused by osteoarthritis. Palmitoylethanolamide has been reported to exhibit analgesic, neuroprotective and anti-inflammatory effects in pain pathological conditions. This paper will critically appraise recent evidence on the effectiveness of palmitoylethanolamide for the treatment of pain in arthrogenic temporomandibular joint dysfunction and related disorders. This paper will assess both the magnitude and longevity of the analgesic effect of palmitoylethanolamide.

Method: An electronic database search was performed by two independent authors on the following databases: PubMed, Web of Science, Medline and Embase. A total of 23 articles were retrieved including relevant articles from reference lists. After the elimination of duplicates and further eligibility screening, a resultant total of 5 articles were suitable for review. One of these was a retrospective cohort study while the following 4 were randomised clinical trials. There was considerable heterogeneity of primary outcome variables and trial design across all selected studies which did not permit a meta-analysis of results.

Conclusion: Palmitoylethanolamide is effective for the treatment of pain in arthrogenic temporomandibular joint dysfunction and related disorders. However, the longevity of palmitoylethanolamide-induced analgesia remains unclear. Further high-quality trials are warranted to reveal the relative effectiveness of palmitoylethanolamide in comparison to current medication.

Keywords

Arthralgia, Pain, Palmitoylethanolamide, Temporomandibular Joint Dysfunction

Introduction

The Temporomandibular Joint (TMJ) is one of the most frequently used joints in the body. Over time, normal or parafunctional use can lead to the initiation of degenerative joint disease, [1]. Degenerative joint disease localised to the TMJ is termed: arthrogenic temporomandibular joint dysfunction (A-TMD), according to group III of the RDC/TMD, [2]. Current evidence shows that A-TMD accounts for 30% of all TMD cases, [3]. A-TMD has considerable global prevalence and accounts for a high proportion of socioeconomic costs, which are typically related with other psychological disorders, such as depression, [4,5]. A-TMD is a growing public health concern due to its debilitating repercussions on essential orofacial functions such as mastication, speaking and swallowing, [6], which in amalgamation with psychological comorbidities can ultimately impede patient quality of life.

Osteoarthritis (OA) is the most common degenerative TMJ disease associated with A-TMD, affecting 50% of individuals beyond the age of 65 years and existing in adolescents following TMJ trauma, [7,8]. The pathogenesis of OA involves a cascade of aberrant biomechanical alterations in the tissues of the joint that subsequently triggers the immune response. Immune cells instigate an inflammatory response by secreting various inflammatory mediators, [9]. The process is coupled with the activation and release of cartilage degrading factors such as matrix metalloproteinase and prostaglandin E which further damage the articular cartilage, [10]. This results in articular cartilage degradation and remodelling of the subchondral bone, causing chronic pain with a central sensitisation component in most cases, [11].

Sensory innervation of the TMJ is derived from the mandibular (V3) branch of the trigeminal cranial nerve. The inferior alveolar nerve (a branch of the mandibular nerve) provides sensory innervation to the mandibular dental arch, which is itself the third branch of the trigeminal nerve. Therefore, orofacial trauma in the mandibular vicinity can give rise to referred pain in the TMJ, [12].

Current pharmacological treatment of A-TMD quintessentially entails the use of acetaminophen or NSAIDs. Several studies have revealed that acetaminophen provides negligible short-term benefit for patients with OA, [13,14]. NSAIDs have proven to be more effective for pain relief than acetaminophen for patients with arthralgia, [15,16]. Despite the superior effectiveness of NSAIDs to acetaminophen, it is well-documented that long-term NSAID overuse has been associated with increased likelihood of adverse side effects such as gastric and cardiovascular complications [17,18]. Considering this, there is an urgent need to develop innovative drugs that produce both significant analgesic effects and minimal side effects.

Palmitoylethanolamide (PEA) is an endogenous N-acylethanolamine and is analogous to the endocannabinoid anandamide, [19] but without psychotropic influences. PEA has been described to induce analgesic, neuroprotective and anti-inflammatory effects in previous studies involving acute and chronic pain states, [20,21]. The precise mechanism of action of PEA is not entirely understood, although it has been posited that PEA may interact with peroxisome proliferator-activated receptor (PPAR)-α which exhibits anti-inflammatory effects, [22]. The literature also suggests that PEA mimics an endogenous ligand for the CB2 receptors, [23], which mediates analgesic effects in neuropathic pain states, [24]. The beneficial effects of PEA have been demonstrated in previous studies either alone or in combination with a different drug [25,26]. In this regard, PEA shows promising results for an innovative pharmacological intervention. However, the paucity of knowledge on the duration of the treatment effect derived from PEA warrants further investigation.

This systematic review aims to critically appraise evidence on the effectiveness of PEA for the treatment of pain in arthrogenic temporomandibular joint dysfunction and related disorders. Both the magnitude and longevity of the analgesic effect of PEA will be assessed.

Methods

This systematic review is grounded upon the recommendations of the PRISMA statement for systematic reviews, [27].

Data Sources and Search Strategy

An electronic literature search was conducted on the following databases: PubMed, Web of Science, Medline and Embase up to 14 July 2019, with no restrictions on the publication language or date. The key words inputted in this search were: Arthralgia; pain; palmitoylethanolamide and temporomandibular joint dysfunction. (Table S1) depicts the search terms and strategy (see supporting information). The reference list of provisionally selected studies was manually reviewed to identify studies that were absent from the electronic databases and were then included for further screening. We methodically contacted corresponding authors for studies with partial data [28–32].

Eligibility Criteria and Study Selection

The inclusion and exclusion criteria for study selection are itemised in (Table 1). Titles and abstracts of all studies found from the database search were manually screened for compatibility with the inclusion criteria by two review authors.  Data was extracted based on the nature of participants’ TMD, type of intervention, comparison or control interventions, relevant outcome variables and study design.

Table 1. Eligibility criteria for study selection.

Inclusion criteria

Exclusion criteria

Participants

1. Active A-TMD

2. Osteoarthritis

3. Orofacial trauma

1. Mixed TMD

2. Myogenic TMD

Experimental Intervention

PEA

Non-PEA treatment

Comparison or control intervention

1. NSAIDs

2. Opiates

3. Muscle relaxants

4. Analgesics

5. Benzodiazepines

6. Anticonvulsants

N/A

Primary outcome variable

Pain

Non-pain related

Study design

All designs

N/A

Notes: N/A: Not applicable, NSAID: Non-steroidal anti-inflammatory drugs PEA: Palmitoylethanolamide, TMD: Temporomandibular joint dysfunction

After selecting studies based on eligibility criteria, the kappa coefficient (k) for agreement among the reviewers was k = 0.937.

Data collection

A standardised proforma was used to systematically cumulate data on the type of study design, participant characteristics, intervention and control or comparison characteristics, primary outcome variables, and follow-up intervals if present. Additional pertinent data such as the funding source, potential conflict of interests between authors and reported risk of bias was also collected.

Risk of Bias and Quality Assessment

The risk of bias (RoB) and subsequent methodological quality of the selected studies was ascertained according to the Cochrane Risk of Bias Tool, [33] by two independent reviewers. The tool was used to assess bias from the following domains: random sequence generation, allocation concealment, blinding of participants and personnel, blinding of outcome assessment, incomplete outcome data, selective reporting, and other bias. Each domain was scored as either ‘low’, ‘high’ or ‘unclear’ RoB for each respective study. The overall RoB in a study was categorized as high quality if all criteria were scored as ‘low’ RoB; moderate quality if only one criterion was scored as ‘high’ RoB or if two criteria were scored as ‘unclear’ RoB and Low quality if two or more criteria were scored as ‘high’ RoB or if at least three criteria possessed ‘unclear’ RoB, [33].

Discrepancies in overall RoB classifications for each study between reviewers was settled by providing supporting reasons and a final consensus was reached. After critical appraisal of selected studies, there was a final agreement of k = 0.884 between reviewers.

Patient involvement

No patients with A-TMD were involved in the conceptualisation or completion of this review, assessment of outcomes, interpretation of findings, or editing of the manuscript.

Results

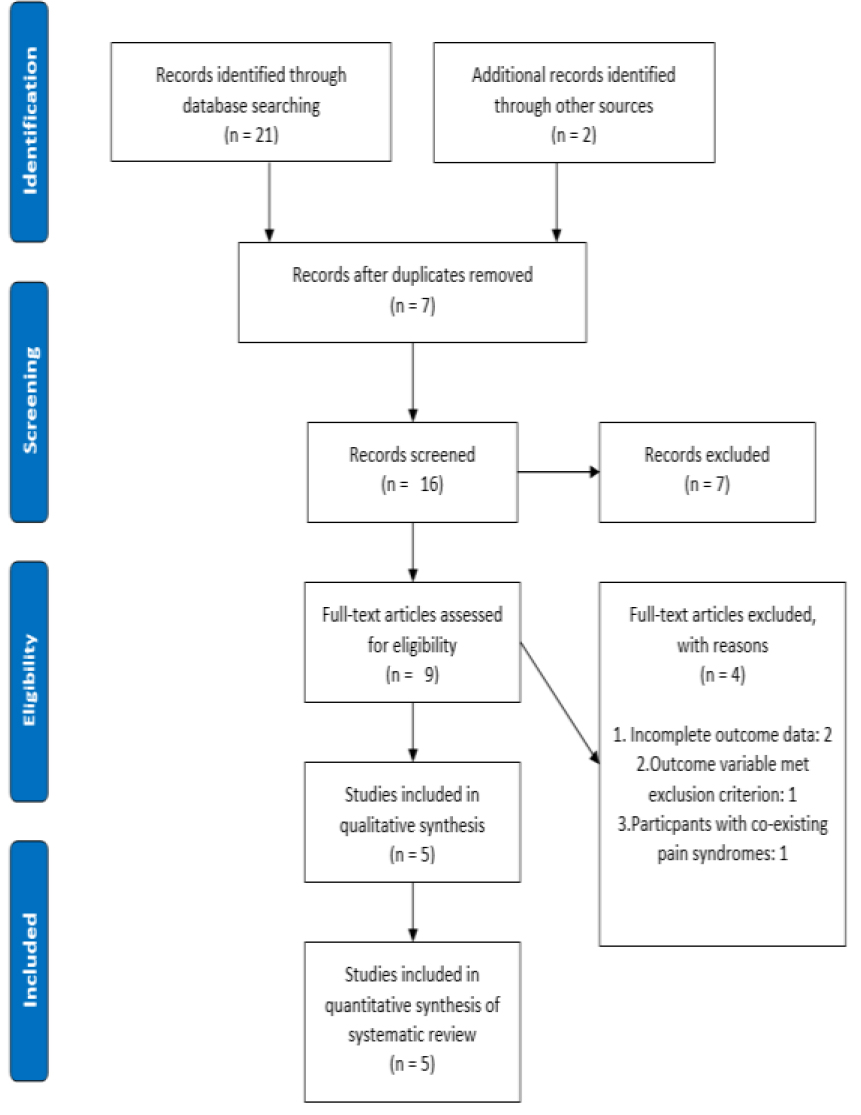
As shown in (Figure 1), 21 studies were obtained from the initial electronic database search and 2 additional studies were later found from a manual search of reference lists. After the elimination of duplicates, screening titles, abstracts and full texts, 5 studies with a cumulative total of 227 trial participants were included in this review.

JDMR-19-129-Immanuel _UK_F1

Figure 1. PRISMA flowchart of study selection.

Study characteristics

Details on the key characteristics of the 5 eligible studies are provided in (Table 2). A total of 4 randomised clinical trials (RCTs) and 1 retrospective cohort study were retrieved. Of the 185 participants who were randomised, 108 (58%) were assigned to receive PEA. The mean sample size was 45.4 (range: 24–111). The mean age of participants in human trials was 40.5 years (range: 18–60) and the median proportion of male individuals was 41.6% (range: 33–47%). No follow -up assessment was detected in 4 studies, yet a single study, [28] showed a follow-up period ranging from 3 to 7 days.

Table 2. Characteristics of selected studies.

Author(s), date, country

Participant characteristics

PEA Intervention

Comparison/ Control intervention

Assessment interval(s)

Outcome variable(s)

Bacci et al, 2011

Italy

Condition: Bilateral impacted lower third molar extractions

Treatment + control group combined:

n = 30

Total M: F = N/D

Mean age of total participants = 24.00 ± 21.21

m-PEA tablet

Dose: 300mg x2 tablets per day for 15 days

Unilateral impacted lower third molar extraction without m-PEA

Measurement at baseline, Follow-up at 3 days post-surgery and 7 days post-surgery

Pain assessed by VAS

Marini et al, 2012

Italy

Condition: TMJ osteoarthritis and arthralgia

1.PEA group: n = 12

2.Control group: n = 12

Total M: F = 8:16

Mean age of total participants = 39.00 ± 15.00

PEA tablet

Dose: 300mg in morning and 600mg in evening for days. Then 300mg x2 per day for 7 days.

Ibuprofen

Dose: 600mg x3 per day for 14 days

Measurement at baseline, day 1 before treatment and day 14. No follow-up.

Pain assessed by VAS

Bartolucci et al, 2018

Italy

Condition: Induced TMJ inflammation in rats

1.Sham group: n = 10

2.Sham + PEA: n = 10

3.CFA + vehicle: n = 10

4.CFA + PEA: n = 10

Total M: F = N/A

Mean age of total participants: N/A

Intraperitoneal m-PEA administration in:

1.Sham +PEA group

2.CFA + PEA group

Dose: 10 mg/kg

1.Sham group (Saline injection into left TMJ capsule)

2.CFA + vehicle group (50 µl of CFA injection into left TMJ capsule)

Measurement at 24 hours and 72 hours post-injection respectively. No follow-up.

Mechanical allodynia threshold

Marini et al, 2018

Italy

TMJ osteoarthritis and arthralgia

1.um-PEA + celecoxib group: n = 6

2.um-PEA group: n = 6

Total M: F = 5: 7

Mean age of total participants: 42.50 ± 24.75

um-PEA tablet + celecoxib tablet

Dose: um-PEA 600mg x1 + celecoxib 200mg in the morning and 200mg in the evening for first 4 days. Then, 600mg um-PEA daily for 14 days

um-PEA tablet (600mg for 14 days)

Measurement at baseline and each day for 14 days. No follow-up.

Pain assessed by VAS

Steels et al, 2019

Australia

Knee osteoarthritis

1.300mg PEA group: n = 36

2.600mg PEA group: n = 35

3.Placebo group: n = 40

Total M: F = N/D

Mean age of total participants: 57.00 ± 26.87

1.300mg PEA tablet group

Dose: 150mg x2 per day for 8 weeks

2.600mg PEA tablet group

Dose: 300mg x2 per day for 8 weeks

Placebo group (received maltodextrin x2 per day for 8 weeks)

Measurement at baseline, day 2, week 1, week 4 and week 8. No follow-up.

Pain assessed by NRS

Notes: CFA – Complete freund’s adjuvant, N/D – Not detected, NRS – Numerical rating scale, VAS – Visual analogue scale, m-PEA – Micronised palmitoylethanolamide, PEA – Palmitoylethanolamide, um-PEA – Unmicronised PEA.

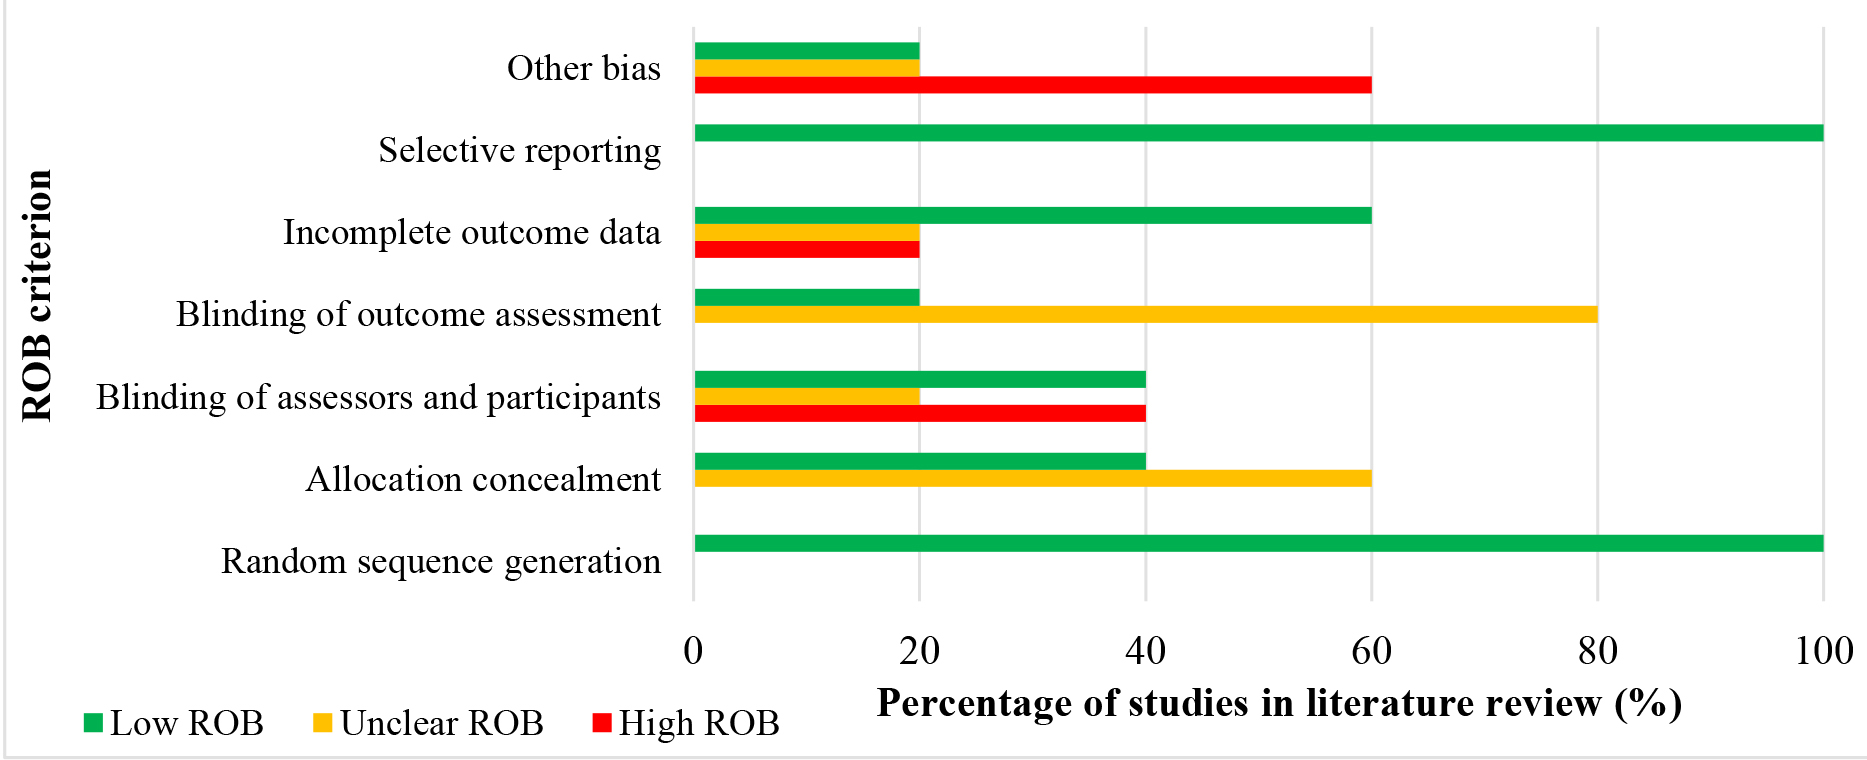
The overall quality was moderate for 3 studies (60%) and low quality for 2 studies (40%). (Figure 2) shows the cumulative RoB on each RoB criterion presented as a percentage across all selected studies. More specifically, the risk of selection bias (sequence generation and allocation concealment) was unclear for 30% of studies and low for 70% of studies. The risk of performance bias (blinding of patients and investigators) and detection bias (blinding of investigators) was low for 20% and 10% of studies, respectively. Lastly, 60% of trials presented with low RoB for incomplete outcome data. Overall, we have interpreted the results of the included studies with moderate confidence in the quality of the studies in question. (Table 3) shows a comprehensive assessment of the RoB for each study. Figure 2 depicts the proportion of RoB for each criterion across all selected studies.

JDMR-19-129-Immanuel _UK_F2

Figure 2.A cumulative risk of bias graph representing the reviewer’s findings on each risk of bias criterion presented as a percentage across all selected studies in the literature review.

Table 3. Methodological quality appraisal of selected studies and associated risk of bias.

Study
(Author and year)

Random sequence generation

Allocation concealment

Blinding of assessors and participants

Blinding of outcome assessment

Incomplete outcome data

Selective reporting

Other bias

Overall quality rating

Bacci et al, 2011

Low

Unclear

High

Unclear

Low

Low

Low

Moderate

Marini et al, 2012

Low

Low

Low

Low

Low

Low

Unclear

Moderate

Bartolucci et al, 2018

Low

Unclear

High

Unclear

High

Low

High

Low

Marini et al, 2018

Low

Unclear

Unclear

Unclear

Unclear

Low

High

Low

Steels et al, 2019

Low

Low

Low

Unclear

Low

Low

High

Moderate

Notes: ‘High’, ‘low’ or ‘unclear’ risk of bias RoB.

Arthrogenic TMD

Three studies, [29,31,32] addressed the effectiveness of PEA on A-TMD. The participant eligibility criteria used for 2 of the 3 studies, [29,31] were based on group III of the Research Diagnostic Criteria for TMD (RDC/TMD). All 3 studies concluded that PEA is useful for attenuating A-TMD-related pain and few studies revealed that PEA is superior to common NSAIDs in pain reduction, [29,31]. All 3 studies concluded that PEA is an effective treatment for TMJ pain associated with A-TMD. Further details are shown in Table 2.

Osteoarthritis

One study, [30] investigated the effectiveness of PEA for the treatment of pain in patients with knee OA. As previously mentioned, the data from this trial is applicable to A-TMD due to the similar pathophysiology and symptomatology of both conditions. Steels et al, [30] implemented comprehensive eligibility criteria which only included patients with moderate knee OA and were medically stable. The study ultimately concluded that PEA is effective for pain attenuation in knee OA, and as such this finding is generalisable to A-TMD.

Orofacial pain

One study, [28] investigated the effectiveness of PEA following bilateral tooth extraction. Again, as previously stated, the data from this trial was deemed to be pertinent to A-TMD and provide further evidence to support or negate the effectiveness of PEA in pain reduction. The participant eligibility criteria were based on signs and symptoms as well as radiographic dentition assessment. This study also concluded that PEA demonstrated an ameliorative effect on orofacial pain.

Adverse events

The medical literature shows that PEA is well-tolerated by human subjects. A total of 2 separate mild adverse events were reported by 2 individual participants treated with 300 mg of Normast™ after an impacted molar tooth extraction, [28]. This represents an incidence risk of 0.88% across the pooled sample size of selected studies (227) and is therefore insignificant. One patient reported a transient episode of drowsiness after Normast™ treatment. Another patient reported a 2–3-hour episode of cardiac palpitations on the third day of the trial. This arose 1 hour after Normast™ administration, and subsequently the patient dropped out of the trial after this incident. This patient’s medical history showed evidence of cannabinoid use. Hence, it is therefore logical to suggest that the symptom reported by this patient was due to the synergic effect of PEA and tetrahydrocannabinol. The low rate of adverse events for PEA is encouraging, however we cannot definitively conclude whether the low incidence of adverse events depicts a true low risk based on the few published studies.

Discussion

Principal findings

In the present systematic review, we merged data from 5 studies involving 227 participants. These studies generally used a small sample size, with the largest consisting of 111 patients. Based on RCTs at moderate and low risk of bias, we discovered moderate to high quality evidence that PEA has a significant effect on pain reduction in A-TMD. This finding was also corroborated by a single animal study, [32]. However, the longevity of this analgesic effect remains inconclusive due to the dearth of trials that include a follow-up period.

PEA effectiveness

This systematic review shows that offering PEA to patients with A-TMD and associated conditions, may prove to be an effective pharmacological intervention to enhance clinical outcomes. All 5 studies in this review concluded that PEA was indeed effective for pain reduction.

Firstly, Bacci et al, [28] found that on the third day after extraction, the mean VAS recorded by the Normast™ group was 3.8 ± 3.09 cm, whereas the control group showed a change of 5.5 ± 2.42 cm. Similarly, this trend continued at the 7-day follow-up interval with the mean VAS for the Normast™ group inferior compared to the control group at 1.0 ± 1.82 cm and 1.5 ± 2.18 cm respectively. Despite this positive finding, the authors did not report a power calculation and the study used a small sample size of 30 participants, of which only 26 completed the protocol. Consequently, the small sample size may have increased the prospect of detecting a false-positive (Type II error) result, which reduces the power of the study. Although a strength of this study, was the implementation of a rigorous screening protocol and assessment for homogeneity of baseline characteristics which may have diminished the effect of confounding bias on the summative results.

In addition, the results of the study by Marini et al, [31] showed that VAS scores decreased to 37.42 ± 0.36 mm and 7.69 ± 0.16 mm in the ibuprofen and PEA groups respectively by the end of treatment. The difference between the mean VAS values at baseline and those obtained at treatment cessation between both groups was statistically significant (p = 0.0001). However, a limitation of this study was the short trial duration (14 days) and as such, there is uncertainty whether the favourable findings are sustainable in treated individuals in the long-term.

Another study by Marini et al, [29] showed a gradual decline in pain intensity following the administration of Celecoxib + um-PEA. Mean VAS scores reduced from 71.08 ± 8.7 mm at baseline to 5.5 ± 2.1 mm at treatment cessation, so the decrement in mean VAS score over time was vastly significant (p = 0.0001). However, the authors failed to report or potentially omitted data on the results for the um-PEA alone group and as such, it is difficult to deduce if um-PEA caused the statistically significant results observed. Yet, other similar studies have discovered significant results in favour of PEA. Thus, in this case, um-PEA was likely to have induced the significant analgesic effect in this trial.

Furthermore, Steels et al, [30] revealed that NRS pain scores were significantly reduced in the 300 mg PEA group (p = 0.0005) and 600 mg PEA group (p < 0.001) compared to the placebo group. In the 300 mg PEA group, there was a considerable increase in the number of participants that no longer experienced pain during the study (baseline, n = 8; week 1, n=15; week 4, n=17; and week 8, n=21). A similar trend was also observed for the 600 mg PEA group (baseline, n=9; week 1, n=14); week 4, n=23; and week 8, n=24). Overall, both groups demonstrated a 163% and 167% increase in absolute pain resolution respectively. However, the placebo group showed negligible dissimilarity in the number of patients that no longer experienced pain during the trial (baseline, n=13; week 1, n=14; week 4, n=11; week 8, n=11). This discrepancy highlights the marked effectiveness of PEA in pain attenuation for arthralgia.

The findings in the animal study by Bartolucci et al, [32] were considered with less weighting in this review due to both the limited validity of the trial design and the use of an unconventional outcome variable which made comparisons with other studies challenging. Despite this, the study did provide ancillary evidence as to the effectiveness of PEA. The authors reported that CFA-injected rats (induced A-TMD) treated with m-PEA, displayed reduced orofacial mechanical allodynia in comparison to the CFA-vehicle group. A criticism of this study resides in the difficulty to extrapolate these findings to human subjects due to the significant disparity in pharmacokinetics of PEA and dosage regimens in both species, conceivably leading to variation in effectiveness and toxicity of the drug. However, a benefit of this study is that it supports the superiority of m-PEA over um-PEA which will ultimately inform future human trials.

Strengths and limitations of this study

This systematic review is the first to investigate the effectiveness of PEA for the treatment of pain in A-TMD and related disorders. This review possesses several strengths. Firstly, we conducted a rigorous and extensive literature search, contacted several authors, and meticulously examined the reference lists of all provisional studies to find relevant articles. Therefore, the likelihood that a trial was missed, in the presence of an already limited evidence base, was low. Additionally, most included studies involved participants with similar characteristics that would be observed in clinical practice. Therefore, the results from this review is generalizable to the clinical population.

However, we acknowledge several limitations in this review. Solely studies published in peer-reviewed journals and in the English language were selected for review which may predispose our findings to publication bias. There may also be the potential for confirmation bias, owing to the selection and interpretation of data which validates pre-existing hypotheses. However, the utilisation of a systematic search strategy, methodological quality appraisal and independent reviewers may assuage this matter. Another short coming was the inclusion of trials whereby a placebo control group was absent, lacked blinding or possessed obscure blinding protocols. Such drawbacks may perhaps cause the gauged benefits of PEA to be understated or overestimated. Additionally, the significant heterogeneity in trial design, outcome variables and PEA formulation did not permit a meta-analysis, and therefore the clinical significance of PEA could not be assessed.

Implications for future research

The clinical data regarding the effectiveness and tolerability of PEA are promising, yet further randomised clinical trials are necessary to reveal the clinical significance of PEA on a larger scale. Due to the shortcomings of the included trials in this systematic review, we recommend several developments for future research on this topic: 1) Use randomised, placebo-controlled trial design to facilitate unbiased measurements on the effectiveness, tolerability and longevity of PEA ; 2) Consistent and complete reporting of adverse events in all study groups; 3) Conduct cost-effectiveness analysis such that the quality-adjusted life years can be established and inform policy makers ; 4) Implement trial follow-up assessments to assess the longevity or potential long-term side effects of PEA treatment;  5) Ensure trials are sufficiently powered, with statistically satisfactory homogeneity in outcome variables and participant characteristics to permit future meta-analyses; and 6) Conduct head-to-head comparisons with current medication to discover the relative effectiveness of PEA and further inform policy makers.

Conclusion

This systematic review imparts introductory evidence that PEA is effective for the treatment of pain in A-TMD and related disorders. The findings from this review are promising as PEA demonstrates a superior analgesic effect to some NSAIDs, yet the longevity of this effect remains indeterminate. Further high-quality trials with follow-up assessments are warranted to compare the effectiveness of PEA relative to various medications currently used for the treatment of pain in A-TMD.

Acknowledgement

We thank the authors of selected studies who provided clarification of their trials for this systematic review.

Abbreviations

A-TMD:

Arthrogenic temporomandibular joint dysfunction

M-PEA:

Micronised PEA

NSAID:

Non-steroidal anti-inflammatory drug

OA:

Osteoarthritis

PEA:

Palmitoylethanolamide

PRISMA:

Preferred Reporting Items for Systematic Reviews and Meta-Analyses

RCT:

Randomised clinical trial

RDC/TMD:

Research Diagnostic Criteria for Temporomandibular joint disorders

RoB:

Risk of bias

TMD:

Temporomandibular joint dysfunction

TMJ:

Temporomandibular joint

Um-PEA:

Unmicronised PEA

VAS:

Visual analogue scale

Table S1. Literature search terms and strategy

Database (search date)

Search

PubMed (14 July, 2019)

(palmitoylethanolamide OR Palmitoylethanolamide OR PEA) AND (temporomandibular joint dysfunction OR TMD OR temporomandibular joint disc disorder) AND (pain OR arthralgia)

Web of science (14 July, 2019)

(Palmitoylethanolamide OR PEA) AND (temporomandibular joint dysfunction OR temporo-mandibular disorder TMD OR TMJ)

Medline (14 July, 2019)

(Palmitoylethanolamide OR PEA) AND (TMD OR TMJ OR temporo-mandibular disorder OR temporomandibular joint dysfunction)

Embase (14 July, 2019)

#1 TMJ OR TMD OR temporomandibular AND joint OR ‘temporo-mandibular’ AND joint OR ‘temporo-mandibular’ AND disorder

#2 ‘palmitoylethanolamide’ OR PEA AND ‘Palmitoylethanolamide’

#1 and #2

References

  1. Cairns B (2010) Pathophysiology of TMD pain-basic mechanisms and their implications for pharmacotherapy. Journal of Oral Rehabilitation 37: 391–410.
  2. Dworkin SF, LeResche L (1992) Research diagnostic criteria for temporomandibular disorders: review, criteria, examinations and specifications critique. J Craniomandib Disord 6: 301.
  3. Manfredini D, Guarda-Nardini L, Winocur E, Piccotti F (2011) Research diagnostic criteria for temporomandibular disorders: a systematic review of axis I epidemiologic findings. Oral Surgery, Oral Medicine, Oral Pathology, Oral Radiology, and Endodontology 112: 453–462.
  4. Giannakopoulos NN, Keller L, Rammelsberg P, Kronmüller KT, Schmitter M (2010) Anxiety and depression in patients with chronic temporomandibular pain and in controls. J Dent 38: 369–376. [crossref]
  5. Gil-Martínez A, Grande-Alonso M, La Touche R, Lara-Lara M, López-López A, et al. (2016) Psychosocial and Somatosensory Factors in Women with Chronic Migraine and Painful Temporomandibular Disorders. Pain Res Manag 2016: 3945673. [crossref]
  6. de Melo Júnior PC, Aroucha JMCNL, Arnaud M, Lima MGS, Gomes SGF, et al. (2019) Prevalence of TMD and level of chronic pain in a group of Brazilian adolescents. PLoS One 14: e0205874.[crossref]
  7. Zhang Y, Jordan JM (2010) Epidemiology of osteoarthritis. Clin Geriatr Med 26: 355–369. [crossref]
  8. Wieland H, Michaelis M, Kirschbaum B, Rudolphi K (2005) Osteoarthritis — an untreatable disease? Nature Reviews Drug Discovery 4: 331–344.
  9. Kalladka M, Quek S, Heir G, Eliav E (2014) Temporomandibular Joint Osteoarthritis: Diagnosis and Long-Term Conservative Management: A Topic Review. The Journal of Indian Prosthodontic Society 14: 6–15.
  10. Tanaka E, Detamore MS, Mercuri LG (2008) Degenerative disorders of the temporomandibular joint: etiology, diagnosis, and treatment. J Dent Res 87: 296–307.
  11. Kosek E, Ordeberg G (2000) Abnormalities of somatosensory perception in patients with painful osteoarthritis normalize following successful treatment. European journal of pain 3: 229–238.
  12. Dolatabadi M, Lassemi Em (2012) Trauma to the Temporomandibular Joint Following Tooth Extraction via Dental Students. Trauma Monthly 16: 205–205.
  13. Machado GC, Maher CG, Ferreira PH, Pinheiro MB, Lin CW, et al. (2015) Efficacy and safety of paracetamol for spinal pain and osteoarthritis: systematic review and meta-analysis of randomised placebo controlled trials. BMJ 350: h1225. [crossref]
  14. Bjordal J, Klovning A, Ljunggren A, Slørdal L (2007) Short-term efficacy of pharmacotherapeutic interventions in osteoarthritic knee pain: A meta-analysis of randomised placebo-controlled trials. European Journal of Pain 11: 125–138.
  15. Zhang W (2004) Does paracetamol (acetaminophen) reduce the pain of osteoarthritis? a meta-analysis of randomised controlled trials. Annals of the Rheumatic Diseases 63: 901–907
  16. Rasmussen S (2018) NSAIDs are superior to paracetamol for osteoarthritic pain and function in a network meta-analysis. BMJ Evid Based Med 23: 40–41. [crossref]
  17. Hinz B, Brune K (2004) Pain and osteoarthritis: new drugs and mechanisms. Curr Opin Rheumatol 16: 628–633. [crossref]
  18. Farkouh M, Greenberg B (2009) An Evidence-Based Review of the Cardiovascular Risks of Nonsteroidal Anti-Inflammatory Drugs. The American Journal of Cardiology 103: 1227–1237.
  19. Lambert D, Vandevoorde S, Jonsson K, Fowler C (2002) The Palmitoylethanolamide Family: A New Class of Anti-Inflammatory Agents? Current Medicinal Chemistry 9: 663–674.
  20. Cocito D, Peci E, Ciaramitaro P, Merola A, Lopiano L (2014) Short-term efficacy of ultramicronized palmitoylethanolamide in peripheral neuropathic pain. Pain Res Treat 2014: 854560. [crossref]
  21. Skaper SD, Facci L, Fusco M, Della Valle MF (2014) Palmitoylethanolamide, a naturally occurring disease-modifying agent in neuropathic pain. Inflammopharmacology 22: 79–94.
  22. Paterniti I, Impellizzeri D, Crupi R, Morabito R (2013) Molecular evidence for the involvement of PPAR-d and PPAR-? in anti-inflammatory and neuroprotective activities of palmitoylethanolamide after spinal cord trauma. Journal of Neuroinflammation 10.
  23. Costa B, Comelli F, Bettoni I, Colleoni M (2008) The endogenous fatty acid amide, palmitoylethanolamide, has anti-allodynic and anti-hyperalgesic effects in a murine model of neuropathic pain: involvement of CB1, TRPV1 and PPAR? receptors and neurotrophic factors. Pain 139: 541–550.
  24. Wallace V, Segerdahl A, Lambert D, Vandevoorde S (2009) The effect of the palmitoylethanolamide analogue, palmitoylallylamide (L-29) on pain behaviour in rodent models of neuropathy. British Journal of Pharmacology 151: 1117–1128.
  25. Passavanti MB, Alfieri A, Pace MC, Pota V, Sansone P, et al. (2019) Clinical applications of palmitoylethanolamide in pain management: protocol for a scoping review. Syst Rev 8: 9. [crossref]
  26. Gabrielsson L, Mattsson S, Fowler C (2016) Palmitoylethanolamide for the treatment of pain: pharmacokinetics, safety and efficacy. British Journal of Clinical Pharmacology 82: 932–942.
  27. Liberati A, Altman DG, Tetzlaff J, Mulrow C, Gøtzsche PC, et al. (2009) The PRISMA statement for reporting systematic reviews and meta-analyses of studies that evaluate health care interventions: explanation and elaboration. J Clin Epidemiol 62: 1–34. [crossref]
  28. Bacci C, Cassetta G, Emanuele B, Berengo M (2011) Randomized Split-Mouth Study on Postoperative Effects of Palmitoylethanolamide for Impacted Lower Third Molar Surgery. ISRN Surgery 1–6.
  29. Marini I, Cavallaro J, Bartolucci M, Alessandri-Bonetti A (2018) Can Celecoxib enhance Palmitoylethanolamide’s effect in the treatment of Temporo-mandibular arthralgia in osteoarthritis patients? Journal of Translational Science 5.
  30. Steels E., Venkatesh R, Steels E, Vitetta G (2019) A double-blind randomized placebo-controlled study assessing safety, tolerability and efficacy of palmitoylethanolamide for symptoms of knee osteoarthritis. Inflammopharmacology 27: 475–485.
  31. Marini I, Bartolucci M, Bortolotti F, Gatto M (2012) Palmitoylethanolamide versus a non-steroidal anti-inflammatory drug for the treatment of temporomandibular inflammatory joint pain. J orofac pain 26: 29–104.
  32. Bartolucci M, Marini I, Bortolotti F, Impellizzeri D (2018) Micronized palmitoylethanolamide reduces joint pain and glial cell activation. Inflammation Research 67: 891–901.
  33. Higgins JP, Altman DG, Gøtzsche PC, Moher D (2011) Cochrane Bias Methods Group, Cochrane Statistical Methods Group. The Cochrane Collaboration’s tool for assessing risk of bias in randomised trials. BMJ 343: 5928.

Recent trends and future challenges in the biomechanics of soft active materials

DOI: 10.31038/NAMS.2019234


Contemporary research in Mechanics involves profound crosstalk among historically different disciplines such as Biology, Medicine other than more traditional ones, e.g. Mathematics and Engineering. Such an interaction emerged as a novel, vigorous and highly productive discipline, namely Biomechanics [1]. In the last twenty year, theoretical and computational foundations in Biomechanics have been posed starting from cornerstone experimental campaigns [2]. Interestingly, as our understanding of the behavior of biological tissues increased, novel and more challenging questions arise [3–7]. In particular, the today challenge faces the theoretical and computational modeling of soft active materials, which inherently involve a sophisticated multiphysics setting [4–19]. To further complicate the scenario, state-of-the-art experimental imaging allowed us to understand the microstructural organization of soft media better at different scales [20–23]. As a consequence, scientific attention is needed for the quantitative characterization of spatio-temporal multiscale features implicated in the behavior of active biomaterials [24–26].

The present short commentary aims at stimulating a vast and variegate community to enforce more scientific energies towards such a challenging arena involving a quantitative understanding of complex materials. The prerequisite is a multi-and cross-disciplinary attitude implementing the interaction among different communities that must mutually influence each other. New groundbreaking ideas are expected to arise from these interactions finally resulting in significant advances in both theoretical, computational and applied science. A profound understanding of soft active materials represents a unique opportunity to introduce novel methodologies in urgent social contexts. Renewable energies [27], recycling processes [28], biocompatible and miniaturized sensors for next-generation biomedical devices [29], innovative pharmaceutical products and therapies [30] are only a few examples. Future human-related sustainability is tightly linked to our understanding of complex biological phenomena to be imitated in intelligent engineering applications.

References

  1. Humphrey JD (2002) Cardiovascular Solid Mechanics: Cells, Tissues, and Organs. Springer
  2. Fung YC (1993) Biomechanics: Mechanical Properties of Living Tissues. Springer.
  3. Ambrosi D, Ben Amar M,  Cyron CJ, DeSimone A,  Goriely A et al (2019) Growth and remodelling of living tissues: perspectives, challenges and opportunities. Journal of the Royal Society Interface 16: 20190233
  4. Vasta M, Gizzi A, Pandolfi A (2018) A spectral decomposition approach for the mechanical statistical characterization of distributed fiber-reinforced tissues Int J Nonlin Mech 106: 258–265
  5. Gizzi A, Pandolfi A, Vasta M (2018) A generalized statistical approach for modeling fiber-reinforced materials. J Eng Math 109: 211–226
  6. Gizzi A, Pandolfi A, Vasta M (2016) Statistical characterization of the anisotropic strain energy in soft materials with distributed fibers Mech Mater 92: 119–138
  7. Vasta M, Gizzi A, Pandolfi A (2014) On three- and two-dimensional fibers distributed models of biological tissues. Prob Eng Mech 37: 170 − 179
  8. DeSimone A, Noselli G, Lucantonio A, Ciarletta P (2017) Special issue on ‘active behavior in soft matter and mechanobiology’. Meccanica 52: 3271–3272
  9. Ruiz-Baier R, Gizzi A, Loppini A, Cherubini C, Filippi S (2019) Modelling thermo-electro-mechanical effects in orthotropic cardiac tissue. Comm Comput Phys.
  10. Loppini A, Gizzi A, Ruiz-Baier R, Cherubini C, Fenton FH, et al.(2018) Competingmechanisms of stress-assisted diffusivity and stretch-activated currents in cardiac electromechanics. Front Physiol 9: 1714
  11. Brandstaeter S, Gizzi A, Fuchs SL, Gebauer AM, Aydin RC, et al (2018) Computational model of gastric motility with active-strain electromechanics Z Angew Math Mech 98: 2177–2197
  12. Lenarda P, Gizzi A, Paggi M (2018) A modeling framework for electro-mechanical interaction between excitable deformable cells. Eur J Mech A – Sol 72: 374–392
  13. Cherubini C, Filippi S, Gizzi A, Ruiz-Baier R (2017) A note on stress-driven anisotropic diffusion and its role in active deformable media. J Theor Biol 430: 221–228
  14. Pandolfi A, Gizzi A, Vasta M (2017) Visco-electro-elastic models of fiber-distributed active tissues Meccanica 52: 3399–3415
  15. Pandolfi A, Gizzi A, Vasta M (2016) Coupled electro-mechanical models of fiber-distributed active tissues. J Biomech. 49: 2436–2444
  16. Gizzi A, Cherubini C, Filippi S, Pandolfi A (2015) Theoretical and numerical modeling of nonlinear electromechanics with applications to biological active media Comm Comput Phys 17: 93−126
  17. Ruiz-Baier R, Gizzi A, Rossi S, Cherubini C, Laadhari A, et al (2014) Mathematical modelling of active contraction in isolated cardiomyocytes Mat Med Biol 3: 259 – 283.
  18. Marino M, Pontrelli G, Vairo G, Wriggers P (2017) A chemo-mechano-biological formulation for the effects of biochemical alterations on arterial mechanics: the role of molecular transport and multiscale tissue remodeling. Journal of The Royal Society Interface 14: 20170615.
  19. Ambrosi D, Pezzuto S. Active stress vs. active strain in mechanobiology: constitutive issues. Journal of Elasticity 107: 199–212.
  20. Ambrosi D, Arioli G, Nobile F (2011) A Quarteroni. Electromechanical coupling in cardiac dynamics: the active strain approach. SIAM Journal of Applied Mathematics 71: 605–621.
  21. Rubart M (2004) Two-Photon Microscopy of Cells and Tissue. Circulation Research
  22. Zoumi A, Lu X,  Kassab GS, Tromberg BJ (2004) Imaging coronary artery microstructure using second-harmonic and two-photon fluorescence microscopy. Biophysical Journal 87: 2778–2786
  23. Dürre K, Keber FC, Bleicher P, Brauns F,  Cyron CF (2018) Capping protein-controlled actin polymerization shapes lipid membranes. Nature communications 9: 1630.
  24. Marino M, Wriggers P (2019) Micro–macro constitutive modeling and finite element analytical-based formulations for fibrous materials: A multiscale structural approach for crimped fibers. Computer Methods in Applied Mechanics and Engineering 344: 938–969
  25. Maceri F, Marino M, Vairo G (2010) A unified multiscale mechanical model for soft collagenous tissues with regular fiber arrangement. Journal of biomechanics 43: 355–363.
  26. Maceri F, Marino M, Vairo G (2012) An insight on multiscale tendon modeling in muscle–tendon integrated behavior. Biomechanics and modeling in mechanobiology 11: 505–517.
  27. Chiodo L (2019) Two-dimensional innovative materials for photovoltaics. Current Opinion in Green and Sustainable Chemistry 17: 49–56.
  28. Gentile F, Coluccio ML, Francardi M, Perozziello G, Malara N et al. (2014) Electroless formation of silver nanoaggregates: an experimental and molecular dynamics approach. Sensors (Basel) 14: 6056–6083.
  29.  Kassab GS, Gregersen H,  Movahed MR (2008) System and method for measuring cross-sectional areas and pressure gradients in luminal organs. US Patent 7: 454, 244.
  30. Guerrieri F, Chiodo L, Salerno D, Jeddari S, Ruocco G, et al. (2016)  The HBX-DLEU2 LNCRNA Complex Regulates Transcription from the HBV CCCDNA and from Cellular Genes in CIS and in Trans. Journal of Hepatology 64: 213–424.

Where is Unimolecular Electronics?

DOI: 10.31038/NAMS.2019233


The field of proposed “unimolecular devices” consisting of a single molecule between measuring electrodes was born in the 1974 theoretical paper by Arieh (now Ari) Aviram and his doctoral adviser Mark A. Ratner [1], which proposed a one-molecule rectifier (=one-way conductor) of electricity, as the molecular equivalent of the inorganic “pn junction” rectifier using macroscopic  “p or n-doped” semiconductors.

The first such rectifier was a heterojunction monolayer in 1990 [2], confirmed in 1993 [3] and proven as a homojunction monolayer rectifier in 1997 [4]. Since then, at least 50 rectifiers have been studied world-wide, along with many more unimolecular wires [5–7].

The hope had been that such unimolecular devices (of size 2 nm each)could match or replace the competing gradual yet dramatic decrease in component size of inorganic semiconductor devices in integrated circuits (Moore’s “law”) [8]. That hope has been dashed [7] because (i) the currents measured through single molecular wires or rectifiers have varied by two to three orders of magnitude (high dispersion), (ii) the proposed molecular equivalent of a junction transistor [9] has not been realized, (iii) the rectification ratios have remained too small (but see below), and (iv) because of limited funding.

There has been, however some hopeful progress:

Nijhuis and co-workers have seen rectification in monolayers of alkyne-linked bisferrocene with a pentadecanethiol “tail” sandwiched between template-stripped Pt and Ga In eutectic electrodes that reached a rectification ratio RR(V) = –I(V)/I(–V) of 630,000 [10];

Cyganik and co-workers have created a periodic closed-packed monolayer of a phenylcarbene covalently bonded to Au (111) but have not yet measured any currents across the monolayer [11]: in the future this may facilitate a current through these carbenes with minimal dispersion, as the best way to measure unimolecular wires and rectifiers (if the other end can also be suitably bonded to the second electrode in similar close-packed fashion). Never, never, never, never give up [12].

References

  1. Aviram A, Ratner MA (1974) Molecular Rectifiers. Chem Phys Lett 29: 277–283
  2. Ashwell GJ,  Sambles JR, Martin AS, Parker WG,  Szablewski M (1989) Rectifying Characteristics of Mg |(C16H33-Q3CNQ LB Film) | Pt Structures, J Chem Soc Chem Commun 1989: 1744–1376.
  3. Martin AS, Sambles JR, Ashwell GJ (1993) Molecular Rectifier. Phy Rev Lett 70: 218–221.
  4. Metzger RM, Chen B, Hoepfner U, Lakshmi kantham MV, Vuillaume D, et al. (1997) Unimolecular Electrical Rectification in Hexadecyl quinolinium Tricyano quinodi methanide. J Am Chem Soc 119: 10455–10466.
  5. Metzger RM (2003) Unimolecular Electrical Rectifiers. Chem Rev. 103: 383–3834.
  6. Metzger RM (2015) Unimolecular Electronics. Chem Rev 115: 5056–5115.
  7. Metzger RM (2018) Quo Vadis, Unimolecular Electronics? Nanoscale 10: 1016–10332
  8. Moore GE (1965) Electronics 38: 114.
  9. Toher C, Nozaki D, Cuniberti G, Metzger RM (2013) Unimolecular Amplifier: Principles of a Three-Terminal Device with Power Gain. Nanoscale 5: 6975–6984.
  10. Chen X, Roehmer M, Yuan L, Du W, Thompson D, et al. (2017) Molecular Diodes with Rectification Ratios Exceeding 105 Driven by Electrostatic Interactions. Nature Nanotechnol 12: 797–803.
  11. Cyganik P (Jagiellonian University, Krakow), unpublished results.
  12. Sir Winston Churchill, high-school graduation speech, ca. 1941.

Perinatal and Child Mortality, Under-Nutrition and Cerebral Palsy: A Cross Sectional Survey in Rural Bangladesh

DOI: 10.31038/AWHC.2019254


Bangladesh has achieved commendable progress in alleviation of poverty in recent years and, in association, the overall nutritional status of mothers and children has improved, and child mortality has fallen [1,2]. According to the regular Bangladesh Demographic and Health Surveys, the Stillbirth Rate (SBR) fell from 37 per 1000 pregnancies in 2004 to 21 in 2014 [3], and the Perinatal Mortality Rate (PMR) fell from 65 deaths per 1000 pregnancies in 2000 to 44 in 2014. And from 1994 to 2014, for every 1000 live births, the Neonatal Mortality Rate (NMR) fell from 52 to 28, the Infant Mortality Rate from 87 to 38, and the <5 year Child Mortality Rate from 133 to 46. While BDHS provide information from many regions, they do not provide specific data from the far north of Mymensingh District where two non-government agencies, Symbiosis International and the Mennonite Central Committee, have, for many years, been involved in developmental projects. In November 2018, in order to review their progress and to plan for the future, these organisations surveyed indices of child and maternal health, and related socio-economic factors, in 25 sites in that region. This paper reviews aspects of morbidity and mortality of children in those sites and compares them with BDHS and other sources. In other reports we examine anthropometry of children and factors relating to maternal health.

Methods

Over two consecutive weeks in November 2018 surveys were performed in 25 sites in and around the administrative centres of Haluaghat and Dhobaura, and the main obstetric facility, Joyramkura Hospital. Cross -sectional data was collected by two teams of Bangladeshi and Australian NGO workers, and senior medical students from Western Sydney University, under the supervision of an Australian general practitioner experienced in rural, remote and indigenous medicine, and the Professor of Paediatrics from Western Sydney University. Data was recorded on paper, transcribed to a computer, and later analysed with reference to WHO standards. Anthropometric data was gained by specially constructed stadiometers with fixed metal measuring ‘tapes’ and with portable weighing machines which were carried, along with other equipment, into the various villages. Anthropometric data of age, heights and weights was reported as Height Per Age (HAZ), Weight Per Age (WAZ) and Weight For Height (WHZ), and expressed as Standard Deviations (SD) from the mean of the reference population in accordance with World Health Organisation practice [4,5]. Moderate disturbances of anthropometry are defined as greater or less than 2SD from the mean: severe from 3SD. Reduced HAZ ratios denote the presence and degree of ‘stunting’, mostly due to chronic under-nutrition and or disease. Reduced WHZ suggests ‘wasting’ from acute malnutrition or disease, and reduced WAZ suggests ‘marasmus’ associated with acute or chronic loss of weight. SBR is defined as death of a foetus equal to or after 28 weeks of gestation. PMR is defined as the total of Stillbirths and Deaths in the first week of life per 1000 pregnancies. NMR is the number of deaths in the first month of life per 1000 live births. IMR is the number of deaths in the first year of life per 1000 live births. Under 5 CMR is the number of children dying <5 years of age per 1000 live births.No verbal post-mortem assessment of cause of death was undertaken: the mother’s simple explanation was accepted. Nor were undertaken any detailed histories of children suffering from chronic disease. Major clinical features were classified and some children were referred for further investigation at Joyramkura Hospital. Those with cardiac abnormalities confirmed by echocardiography were referred to higher centres.

Statistics

Data was cleansed and imported into a relational database enabling cross correlating queries to be executed. WHO anthropometric factors of Height Vs Age (HAZ), Weight Vs Age (WAZ), Weight Vs Height (WHZ) were calculated using the WHO published mathematical algorithms [6]. Outliers were identified according to WHO statements of limits and discarded as per WHO stated process. Data was converted to Z Scores and expressed as the Standard Deviation (SD) from the mean of the WHO reference standard population for both male and female [7]. Continuous unpaired data was analysed using zTest,. Count data was analysed using Chi-Squared Best Fit assuming equal proportions and trend data analysed using Chi-Squared Tend Analysis. Correlations were performed using Pearson’s correlation. In all tests sample size was > 30 and the null hypothesis rejected for results > 95% confidence, resultant P-Values are reported. We perform all comparisons against the combined male-female scores, unless otherwise stated. We used Minitab Express for all statistical analysis.

Ethics

The surveys were approved by governance of both Symbiosis International and Mennonite Central Committees as quality assurance of current programmes and preparation for future activity. Representatives of those NGOs visited the sites in advance, explained the aims and the process, and invited participation. Mothers and their children attended voluntarily. Data was de-identified for analysis but a list was kept in confidence in case of need to contact the parents eg with regard to medical concerns.

Results

Surveys were held in 25 sites, and included 2987 children and 1982 mothers.

Anthropometry

Growth restriction was revealed to be a major problem. In summary, and with regard to combined sexes of children <5 years of age, 36.2% were moderately stunted (HAZ <-2SD) and 14.6% severely stunted (<-3SD). 32.5% were moderately (WAZ <-2SD) and 10.4% were severely underweight (<-3SD). 15.8% were moderately (WHZ<-2SD) and 6.5% were severely wasted (<-3SD). Similar restriction was found in children aged from 5–14 years: 25.6% were moderately (HAZ <-2SD) and 6.5% were severely stunted (<-3SD). 29.4% were moderately (WAZ<-2SD) and 10.7% were severely underweight (<-3SD). Growth restriction was also common in mothers, of whom 15.3% were stunted. That this rate increased to 25.6% in children 5–14, and then to 36.2% in those <5 years, suggests stunting is increasing in recent years.

Mortality

Of 4408 live births, 93 died in the first week of life, 122 within the first month, 199 in the first year, and 275 within the first five years of life. These statistics suggest a PMR of 109.0, and an NMR of 27.7, IMR of 17.5, and an <5 CMR of 62.4. These live born deaths had been preceded by 435 stillbirths, giving an SBR of 89.8. No data was collected on the sex of the deceased. Thus, the SBR in our surveyed sites would appear to be almost four times greater than the national average (89.8 vs 21), the PMR to be over twice the national rate (109 vs 44), the NMR similar to that rate (27.7 vs 28), the IMR half that rate (17.5 vs 38) and the CMR one and half times greater than the national rate (62.4 vs 46). The CMR was 25% higher in stunted mothers, than non stunted (p=0.0326), and was inversely related to family income (p=0.0179) which is a surrogate for maternal education.

Causes of Death

In almost half of the deaths (46.5%), the mother declared she did not know why her child had died. In 18.9% of cases, she thought deaths were related to the birth process. In 12.0%, she declared pneumonia to have been the cause. 6.9% of the children had drowned. 3.3% were reported to have become suddenly ‘sick’, and diarrhoea featured in another 2.2%. Trauma accounted for 1.8% of deaths, and others appeared to have died of malformations and malignancy.

Morbidity

Children with chronic disease were identified by the mother during the surveys, and significant abnormality was confirmed in 106 children. 52 were suffering from Cerebral Palsy (CP): 12 with serious cardiac disease; 12 with syndromes including 5 with Down Syndrome; 5 with unspecified developmental delay; 5 with external eye problems including severe strabismus and microphthalmia; 4 with deaf-mutism; 2 with congenital dislocation of the hip; and 2 with treated myelo-meningocoele . Overall, this gave a prevalence of physical impairment due to neurological causes of 18.1 per 1000. Sundry cases included one each of elephantiasis, rheumatoid arthritis, urinary incontinence, and renal hydronephrosis, while 5 had inguinal hernias, and one a huge omphalocoele.

Of the 52 children with cerebral palsy, 27 were boys and 25 girls with a mean age of 5.3 years. All were severely affected with Gross Motor Function Classifications in the range of 4 and 5 but none were receiving physiotherapy or special schooling, and none appeared to have mechanical aids. All appeared to have been associated with birthing difficulties, except for one associated with head injury at 3 years of age, another with febrile illness at 18/12 of age, and another with severe gastro-enteritis at a similar age. Under-nutrition was a major complication of CP: 42.3% were stunted (HAZ < -2SD) compared with 25% of local children without CP (PValue 0.0048) and 23.1% were <-3SD. 44.2% were underweight (WAZ<-2SD) compared with 23.7% without CP (PValue 0.0006), and 18 of that 23 were <-3SD. There was no gender difference. Cardiac abnormalities included 3 with Tetralogy of Fallot, 2 with cardiomyopathy, 3 with septal defects, 3 with valvular disease (2 stenoses and 1 incompetence) and 1 patent ductus arteriosus. All appeared to be of congenital origin.

Discussion

The survey revealed severe levels of morbidity and mortality in children in rural areas in the north of the Mymensingh District. The degree of growth restriction rivals the worst in the country and must be fundamental to the high rate of mortality. It is well known that under-nutrition reduces immunity and is associated with a three to four times greater rate of mortality. Our survey confirmed the presence of socio-economic correlations of under-nutrition that have international recognition. As reported elsewhere, the stunting of children was associated with stunting of mothers, and maternal stunting was associated with reduced age at marriage, income, education and proper disposal of human waste. As most of our children were born at home with untrained birth attendants, birth weights are unknown, but the 9% prevalence of in-utero growth restriction recorded in the private obstetric facility, Joyramkura Hospital, suggests a much higher rate in poor, undernourished mothers delivering in the villages. Intra-uterine growth restriction will contribute to the stunting of children and thus the mortality rate. That the survey revealed the rate of stunting to have increased from 15.3% in mothers, to 25.6% in children 5–14, and then to 36.2% in those <5 years, suggests its prevalence is increasing in the north, despite the nation’s fall in poverty. Why this should be so is not clear: perhaps poverty has worsened in the north. Alternatively, the rising prevalence of overweight in stunted and other mothers (as discussed in another report) might suggest disposable income is being spent on calorie dense foods and drinks which fatten the mother but do not provide sufficient nutrition for linear growth in the child.

The very high rate of stunting and underweight in children with CP confirms their special vulnerability. Reasons for under-nutrition include difficulties in feeding and swallowing, problems with consistency of the diet, problems with understanding the cause of CP, and poverty [8]. It was reassuring the rate of undernutrition was similar for males and females because, sometimes, the latter are perceived as a greater burden. Home births, attended by un-trained personnel, distant in time and location from the obstetric facility at Joyramkura, must be the basis of the appalling rate of still and perinatal death rates. The gestational age of babies still born in poor rural areas is often unknown [9] but up to 50% of such deaths are likely to be due to intra-partum difficulties [10]. The low rate of hypertensive and diabetic complications at Joyramkura Hospital would support this concept of ‘mechanical’ rather than medical causation [11]. Therefore, prolonged and obstructed labour is likely to be a major cause of deaths of children of all ages, and of cerebral palsy in survivors [12].

Given the extraordinary Stillbirth Rate, it may not be reassuring that the NMR and IMR in northern Mymensingh approximate the national rate. It could merely signify that babies are expiring during rather than after birth. The <5 CMR of 62.4 in northern Mymensingh, however, rivals the highest rate in Bangladesh (67 per 1000) reported from rural Sylhet [13]. The striking feature in our survey is that the cause of almost half of the deaths was unknown to the mother. This would suggest reliance on village ‘physicians’ without recourse to trained opinion. In confirmation, only 1452 emergency visits and 1578 admissions of children <5 years were recorded in 2018 in the government hospital at Dhobaura which serves a population of 225,399 [14]. In the same year, only 1331 emergency visits and 875 admissions of children <5years were recorded in the government hospital in Haluaghat, the other administrative centre in the region, serving a population of 333,065 inhabitants [15]. Only 8 visits a day from a population of over half a million people supports the concept of help being sought elsewhere. While almost half the mothers seemed to have little understanding of why their children had died, some deaths were ascribed to unspecified problems at birth, and others to such recognised causes as pneumonia [16] and drowning [17]. Preventable infections must have played a role: though almost all mothers declared their children had been vaccinated, no details were available, and a ‘drop out’ rate of around 50% of Bacille Calmette Guerin, Pentavalent, Measles and even poliomyelitis vaccinations was reported by health authorities in Dhubaura. Similarly, there was no guarantee that government distribution of vitamin A had been successful, though gastro-enteritis was not a prominent cause of death. 52 cases of cerebral palsy from 4408 live births suggests an extremely high rate of CP (11.8 per 1000) compared to the international rate of around 2 per 1000 live births. Regrettably, rates 5 to 10 times higher than the international one may not be unusual in Low to Middle Income Countries [18,19]. In one study in Bangladesh it was calculated to be 3.4 per 1000, but estimated to be much higher because of early deaths and difficulties in diagnosis [20]. The overall rate of Physical Impairment (PI) due to neurological disease in our ‘broad brush’ survey was 18.1 per 1000, three times higher than the 6.1 per 1000 revealed in a much more sensitive study in Bangladesh [21]. Most likely, our study has seriously underestimated the prevalence of PI. We only counted survivors with gross impairment. Consideration should be given to cause of death, and sensitive screening should be performed to assess true prevalence and plan for intervention.

The consequences of cerebral palsy extend beyond the child to include psychological and financial costs to the family, especially to the mother [22,23]. The quality of maternal life has been shown to be much reduced in association with a child with CP. Early diagnosis, therefore, may provide opportunity for positive intervention: for neurological improvement by taking advantage of cerebral plasticity, for reduction of spasticity, for provision of aids from eye glasses to wheelchairs, for community understanding and cultural acceptance of handicap, and thus for improvement in maternal quality of life. Such early diagnosis might be achieved by the ‘Key Informant’s Method’ developed by the Child Sight Foundation in Shajadpur, Bangladesh, in which ‘knowledgeable members of the community (key informants) are trained to effectively identify children with moderate-severe physical impairments, sensory impairments and epilepsy’ [24]. Identified children and carers then gather for evaluation and low cost, family and community based intervention. Details are recorded for the creation of a Bangladesh Cerebral Palsy Register [25] which is intended to reveal causes and initiate response. CP incurs cultural, financial, logistic and staffing challenges but surveys should progress from prevalence to intervention [26–28]. At present, interventions are limited. In the Shajadhur study, 78.2% of children had never received rehabilitation, and only a fifth were attending regular school [29]. In northern Mymensingh District, such services do not existent. Our survey revealed 10 children with congenital heart disease and another 2 with dilated cardiomyopathy of possible congenital origin. The mean age was 7.2 years raising the likelihood of under-estimation because of survivor bias. Therefore, our rate of 3 per 1000 does not confront reports of a ‘normal’ incidence of moderate to severe abnormalities of around 6 per thousand [30]. In rural Bangladesh, one problem is diagnosis, the other is cost of surgery when even the bus fare to Dhaka may be prohibitive.

Our survey has limitations. First, given the propensity for home births attended by untrained personnel, dates, weights and gestations were usually unrecorded and as lamented in BDHS 2014, ‘any memory of ages and causes of death, even of stillbirths themselves, dims with passing years in retrospective, cross sectional studies’. Second, associated with decreasing memory is the tendency to ‘heap’ ages at standard digits of, say, 6 months or 1 year. We sought to minimise this limitation by expressing age in half years. For example, if a mother declared the child to be 3 years old, we calculated on the basis of it being 3 1/2. We were reassured, however, by the BDHS declaration that the ratio of deaths under one week to those under one month should be around 70 % if estimation of age is reasonable. Our ratio was 76%, probably reflecting increased obstetric difficulties. A third limitation is that we relied on mothers’ statements as interpreted through a single translator.

Conclusion

Despite limitations, our survey has revealed major problems of morbidity and mortality of children in northern Mymensingh District. Stunting is prevalent and inter-generational. Home deliveries prevail and are rewarded by an extra-ordinary rate of still and perinatal death, and subsequent development of cerebral palsy. There is also a high rate of death in older children, for reasons often unknown to the mothers. Attendance rates at local government hospitals suggest reliance on village ‘physicians’. There is an urgent need for timely referral of obstetric and child health problems to an equipped facility. Screening for cerebral palsy and provision for intervention should be performed…and will be in the near future.

References

  1. Headey D, Hoddinott J, Ali D, Tesfaye R, Dereje M (2015) The Other Asian Enigma: Explaining the Rapid Reduction of Undernutrition in Bangladesh. World Development 66: 749–761.
  2. World Bank (2018) Bangladesh continues to reduce poverty but at a decreased rate. Available online: https://www.worldbank.org/en/news/feature/2017/10/24/bangladesh-continues-to-reduce-poverty-but-at-slower-pace (accessed June 7, 2019).
  3. Abir T, Agho KE, Ogbo FA, Stevens GJ, Page A, et al. (2017) Predictors of stillbirths in Bangladesh: evidence from the 2004–2014 nation-wide household surveys. Glob Health Action 10: 1410048.
  4. WHO Multicentre Growth Reference Study Group (2006) Reliability of anthropometric measurements in the WHO Multicentre Growth Reference Study. Acta Paediatr Suppl 450: 38–46.
  5. The WHO Anthro Survey Analyser. https://www.who.int/nutgrowthdb/software/en/ (accessed June 7, 2019).
  6. de Onis M, Adelheid Onyango , Elaine Borghi , Amani Siyam , Monika Blössner, et al. (2012) Worldwide implementation of the WHO Child Growth Standards. Public Health Nutrition 15: 1603–1610.
  7. de Onis M (2006) Reliability of anthropometric measurements in the WHO Multicentre Growth Reference Study. Acta Pædiatrica 95: 38–46.
  8. Jahan I, Muhit M, Karim T, Smithers-Sheedy H, Novak I, et al. (2019) What makes children with cerebral palsy vulnerable to malnutrition? Findings from the Bangladesh cerebral palsy register (BCPR). Disabil Rehabil 41: 2247–2254.
  9. Lawn JE, Yakoob MY, Haws RA, Soomro T, Darmstadt GL, (2009) 3.2 million stillbirths: epidemiology and overview of the evidence review. BMC Pregnancy Childbirth 9: 1.
  10. Campbell O, Gipson R, el-Mohandes A, Issa AH, Matta N, et al. (2004) The Egypt National Perinatal/Neonatal Mortality Study 2000. J Perinatol 24: 284–289.
  11. Joyramkura Hospital Annual Report; Annual Report (2018) Joyramkura Hospital: Joyramkura, Bangladesh.
  12. Baqui AH, Choi Y, Williams EK, Arifeen SE, Mannan I, et al. (2011) Levels, timing, and etiology of stillbirths in Sylhet district of Bangladesh. BMC Pregnancy Childbirth 11: 25.
  13. National Institute of Population Research and Training, Mitra and Associates, ICF International (2016) Bangladesh Demographic and Health Survey 2014; Dhaka, Bangladesh and Rockville, Maryland, USA.
  14. Local Health Bulletin 2018 for Dhobaura Upazila Health Complex (2018) Health Bulletin for Ministry of Health and Family Welfare: Mymensingh, Bangladesh.
  15. Local Health Bulletin 2018 for Haluaghat Upazila Health Complex (2018) Health Bulletin for Ministry of Health and Family Welfare: Mymensingh, Bangladesh.
  16. Baqui AH, Black RE, Arifeen SE (1998) Pneumonia mortality and healthcare utilization in young children in rural Bangladesh a prospective verbal autopsy. Bull World Health Organ 76: 161–171.
  17. Rahman A, Giashuddin SM, Svanstrom L, Rahman F (2006) Drowning–a major but neglected child health problem in rural Bangladesh: implications for low income countries. Int J Inj Contr Saf Promot 13: 101–105.
  18. Couper J (2002) Prevalence of childhood disability in rural KwaZulu-Natal. S Afr Med J 92: 549–552.
  19. Cruz M, Jenkins R, Silberberg D (2006) The burden of brain disorders. Science 312: 53.
  20. Khandaker G, Muhit M, Karim T, Smithers-Sheedy H, Novak I, et al. (2019) Epidemiology of cerebral palsy in Bangladesh: a population-based surveillance study. Dev Med Child Neurol 61: 601–609.
  21. Murthy GV, Mactaggart I, Mohammad M, Islam J, Noe C (2014) Bangladesh, K.I.M.S.G. Assessing the prevalence of sensory and motor impairments in childhood in Bangladesh using key informants. Arch Dis Child 99: 1103–1108.
  22. Mobarak R, Khan NZ, Munir S, Zaman SS, McConachie H (2000) Predictors of stress in mothers of children with cerebral palsy in Bangladesh. J Pediatr Psychol 25: 427–433.
  23. Ones K, Yilmaz E, Cetinkaya B, Caglar N (2005) Assessment of the quality of life of mothers of children with cerebral palsy (primary caregivers). Neurorehabil Neural Repair 19: 232–237.
  24. Mackey S, Murthy GV, Muhit MA, Islam JJ, Foster A (2012) Validation of the key informant method to identify children with disabilities: methods and results from a pilot study in Bangladesh. J Trop Pediatr 58: 269–274.
  25. Khandaker G, Smithers-Sheedy H, Islam J, Alam M, Jung J, et al. (2015) Bangladesh Cerebral Palsy Register (BCPR): a pilot study to develop a national cerebral palsy (CP) register with surveillance of children for CP. BMC Neurol 15: 173.
  26. Maloni PK, Despres ER, Habbous J, Primmer AR, Slatten JB, (2010) Perceptions of disability among mothers of children with disability in Bangladesh: implications for rehabilitation service delivery. Disabil Rehabil 32: 845–854.
  27. McConachie H, Huq S, Munir S, Kamrunnahar, Akhter N et al. (2001) Difficulties for mothers in using an early intervention service for children with cerebral palsy in Bangladesh. Child Care Health Dev 27: 1–12.
  28. Yousafzai AK, Lynch P, Gladstone M (2014) Moving beyond prevalence studies: screening and interventions for children with disabilities in low-income and middle-income countries. Arch Dis Child 99: 840–848.
  29. Khandaker G, Muhit M, Rashid H, Khan A, Islam J, et al. (2014) Infectious causes of childhood disability: results from a pilot study in rural Bangladesh. J Trop Pediatr 60: 363–369.
  30. Hoffman JI, Kaplan S (2002) The incidence of congenital heart disease. J Am Coll Cardiol 39: 1890–1900.

Transparent electrodes based on graphene

DOI: 10.31038/NAMS.2019232

Abstract

Novel architectures of transparent electrodes incorporating graphene into its design are explored to improve the silicon-heterojunction-cell technology. Two configurations are studied based on the place where the atomic graphene is. The main results obtained reveal the dramatic dependence of atomic graphene position on the transparent-electrode properties. In addition, the electrode performance is also affected by the transparent conductive oxide material chosen in the designed structure. Specifically, the incorporation of graphene into an electrode shows a significant reduction of its sheet resistance (55 Ω/sq.) and the weighted reflectance of whole structure down up to 10% when combined with a transparent conductive oxide such as indium tin oxide. Such electrode shows an average conductance value as high as 13.12 mS. These data undergone so far clearly suggest the possibility to noticeably improve transparent electrode technology when graphene is incorporated, and therefore to further enhance the contact technology for solar cells.

Keywords

graphene, transparent conductive oxides, front-electrode, solar devices.

Introduction

The exceptional properties of graphene, a two dimensional version of carbon, turn this material into very attractive from both companies and research groups since the publication of pioneering work by Novoselov et al. [1]. Its high thermal conductivity, its excellent mechanical properties, its huge specific surface area and its exceptional electronic conductivity make graphene a promising candidate for a large field of applications such as displays, touch screens or solar cells [2-4].

On the other hand, photovoltaic (PV) technology is expected to play a major role in the renewable-energy sector because of the fight against the climate change. This climate action has as its main aim to reduce greenhouse gas emissions. The targets defined by European Union within the framework of “Clean Energy for All European package” reflect the need for changing markets dynamics in the energy sector, considering the PV sector as one of the most involved in this issue [5]. PV market is currently being dominated by silicon-wafer technology in a 90%. This sector requires exhaustive technological solutions to achieve thinner and cheaper products. In this sense, silicon-heterojunction (SHJ) technology is emerging as a low-temperature reliable solution, where new architectures of transparent conductive electrodes to generate and extract the current in a more efficient way are required [6]. In this sense, this work presents the development of a novel transparent electrode that incorporates graphene with the main aims of exploring its possible advantages and improving solar cell performance.

Methods and materials

The transparent conductive electrodes (TCEs) are based on the combination between atomic graphene and a transparent conductive oxide (TCO). In this design, the graphene would help to improve the electrical properties, and the TCO would play the role of antireflective layer (AR), essential property for the specific application in SHJ technology.

The synthesis of graphene was carried out by chemical vapour deposition (CVD) using a commercial cold-wall CVD reactor from Aixtron. All the process gases (argon (Ar), hydrogen (H2), and methane (CH4)) were flushed before the growth. The temperature was then raised to 1050°C under Ar atmosphere. Once the temperature was stabilized, a mixture of 0.7 % CH4 / 31% H2 / 68.3 % Ar (in volume) was introduced for 15 minutes at 50 mbar of pressure. The synthesized graphene on the Cu foil was transferred to the different substrates using a home-built system designed to automatically transfer graphene [7].

The TCO materials were fabricated at low temperature using a commercial UNIVEX 450B sputtering system with confocal geometry from Leybold. The gas used in the sputtering process was Ar with a purity of 99.999%, and its flux was controlled with a mass-flow controller. The choice of TCO materials was aluminum-doped zinc oxide (AZO), from 4-inch ZnO:Al2O3 (98/2 wt.%, Neyco) commercial ceramic target operated by Radio-Frequency (RF), and indium tin oxide (ITO) from 4-inch In2O3: SnO2 (90/10 wt.%, Neyco) commercial ceramic target operated by Direct Current (DC).

The TCE performance is determined by analysing the electrical and optical properties. From electrical point of view, the sheet resistance and conductivity are evaluated from a mapping of electrical conductance carried out using a non-contact and non-destructive commercial Onyx system from Das Nano Company, based on reflection-mode terahertz time-domain spectroscopy (THz-TDS). Finally, the optical analysis consists on the evaluation of the AR capability of the TCE. This AR capability was determined from the analysis of weighted reflectance Rp defined as,

NAMS_2019_Susana M Fernández_F4

where Rhem is the hemispherical reflectance measured by using a UV/Visible/NIR Perkin-Elmer Lambda 1050 spectrophotometer equipped with a 6 mm integrating sphere accessory; and  e(λ) is the global spectral AM1.5G irradiance.

Results and discussion

The challenges of introducing graphene in the TCE structure were evaluated. Two different configurations were studied: configuration 1, where the atomic graphene was transferred on top of sputtered TCO-on-substrate (crystalline silicon); and configuration 2, where the TCO was sputtered on top of the atomic graphene, transferred directly onto the crystalline silicon. It was found that the compatibility between the process temperatures required in each step was extremely relevant into the electrode performance. For this reason, the transfer process was carried out at room temperature; thereby, a possible damage into the TCO layer would be avoided. In addition, the dependence of the place where the atomic graphene was located and the number of monolayers transferred were also crucial. The effect of sputtering deposition parameters on the electrical electrode performance was checked carefully. As the first choice, the TCO used in the design was an 80nm-thick AZO thin film. Measured electrical data of the TCEs fabricated incorporating up to three graphene monolayers at different places are pictured in Figure 1. It can be observed that the measured sheet resistances were far from the theoretical ones (straight line). More precisely, the sheet resistances of TCE fabricated with configuration 1 were far lower than those measured in the TCEs with configuration 2. This was attributed to the huge damage produced in the graphene atomic order because of the bombardment generated during sputtering process [8]. This fact would be making possible to exclude the configuration 2 from the study. With regard to the number of graphene monolayers, any preliminary conclusion may be determined from the experimental results. On contrary, from the theoretical point of view, an improvement of the sheet resistance would be expected with each graphene monolayer incorporated. As summary from these preliminary experimental electrical results, the optimum TCE design would be that one in which the atomic graphene was placed on top of TCO material, named configuration 1 in this work.

NAMS_2019_Susana M Fernández_F1

Figure 1. TCE’s sheet resistance measured as function of number of monolayers incorporated in the design, depending on its place (configuration 1: monolayer graphene transferred on top of TCO; configuration 2: TCO sputtered on top of graphene). In this case, the TCO incorporated into the design was an 80 nm-thick AZO layer. As comparison, theoretical values are also included.

The next step was to determine which TCO material was more appropriated to be used in the TCE structure. Taking theoretical sheet resistances into account (showed as a straight line in
Figure 1), three graphene monolayers were used. Table 1 shows the sheet resistance values of TCEs fabricated as function of the TCO material used. As these data revealed, a strong effect was observed depending on the TCO incorporated in the structure, reaching ~55 Ω/sq. with ITO versus ~116 Ω/sq. with AZO. This difference was attributed to the possible aluminum diffusion from the AZO layer into graphene monolayers. This aluminum diffusion would lead to the formation of other compounds, such as aluminum carbide, affecting the graphene order and hence, the electrical parameters [9]. As conclusion, the electrical performance was considerably improved using an aluminum-free TCO material, just as in the case of ITO.

Table 1. Measured sheet resistances of the TCEs fabricated in configuration 1.

TCO Material

Graphene monolayers

Rsheet (Ω/sq.)

ITO

3

55 ± 5

AZO

3

116 ± 6

Figure 2 shows the THz-TDS conductance and resistance maps acquired in reflection-mode for the TCE based on three graphene monolayers transferred on top of 80 nm-thick ITO thin film. It can be appreciated a central region with an average conductance of 13.12 mS, and a maximum value of 14.03 mS measured in the center of the sample. A region of lower conductivity close to 10-12 mS was observed in the edge of sample, attributed to the edge effect of graphene transfer. The average conductance value of 13.12 mS was considerably higher than the measured one of a common TCO, ~10mS, making the TCE presented here an alternative and competitive front-electrode [10]. In addition, from the resistance map, a sheet resistance of 76.2 Ω/sq. was extracted in the center region of the sample, slightly higher than the measured one using conventional transmission line method.

NAMS_2019_Susana M Fernández_F2

Figure 2. THz-TDS conductance and resistance maps acquired in reflection-mode for the optimum TCE based on three graphene monolayers transferred on top of 80nm-thick ITO thin film sputtered on crystalline silicon.

With regard to optical properties, Figure 3 pictures the total (hemispherical) reflectance measured with the integrated sphere of two TCEs based on AZO and ITO, respectively. It should be noted that the combination of graphene with a TCO reduced the weighted reflectance of the whole TCE, close to 10%, providing a better AR capability than a bare common TCO (~12%). This superior AR capability is considered as very promising result that could be advantageous for SHJ technology, reducing the amount of light reflected and hence, improving the solar cell performance.

NAMS_2019_Susana M Fernández_F3

Figure 3. Total (hemispherical) reflectance spectra in the visible range (300-875 nm) of a system of two graphene monolayers stacked on top of a 80 nm-thick AZO film on crystalline silicon (fill circle symbol), on top of 80 nm-thick ITO film on crystalline silicon (open circle symbol), and the bare crystalline silicon wafer (straight line).

Finally, taking the electrical and optical properties studied into account, the optimized TCE is based on three graphene monolayers transferred on top of 80 nm-thick ITO. This result clearly suggests the possibility to improve the TCEs with the incorporation of graphene, and therefore, to further enhance the SHJ technology performance.

Conclusions

In this work, the key parameters for choosing the most appropriated and reliable combination of TCE were determined. Firstly, the compatibility of the TCO and graphene fabrication processes was analysed. The choice of the most appropriate TCO material was studied, observing a negative influence on electrical properties when TCO was based on aluminum. Hence, it was demonstrated the excellent performance of a TCE based on three graphene monolayers transferred on top of 80 nm-thick ITO thin films sputtered on crystalline silicon. This is a very attractive result that allows predicting that the incorporation of graphene to a cell’s front electrode could be very benefit on (i) the reduction of silicon-heterojunction transparent-electrode sheet resistances, and (ii) the decrease of the cell’s reflectance, favouring the absorption of more photons.

Acknowledgements

Authors acknowledge the partial financial support provided by the Spanish Ministry of Science & Innovation under the project DIGRAFEN (ENE2017-88065-C2-1-R) and (ENE2017-88065-C2-2-R); A. Inés and I. Arnedo acknowledges the financial support provided  by FEDER and the Spanish Ministry of Science, Innovation and Universities – State Research Agency, under the project TEC2017-85529-C3-2-R (AEI/FEDER, UE).

References

  1. Novoselov KS, Geim AK, Morozov SV, Jiang D, et al. (2004) Electric Field Effect in Atomically Thin Carbon Films. Science.
  2. Pang S, Hernandez Y, Feng X, Müllen K (2011) Graphene as transparent electrode material for organic electronics. Adv. Mater.
  3. Ahn JH, Hong BH (2014) Graphene for displays that bend. Nature Nanotech.
  4. Zang Y, Li LB, Chu Q, Pu H, et al. (2018) Graphene as transparent electrode in Si solar cells: A dry transfer method. AIP Advances.
  5. Web page. Available: https://ec.europa.eu/energy/en/topics/energy-strategy-and-energy-union/clean-energy-all-europeans
  6. Green MA, Emery K, Hishikawa Y, Warta, et al. (2017) Solar cell efficiency tables (version 49). Prog. Photovolt: Res. Appl.
  7. Bosca A, Pedrós J, Martínez J, Palacios T, et al. (2016) Automatic Graphene transfer system for improved material quality and efficiency. Scientific Reports.
  8. Qiu XP, Shin YJ, Niu J, Kulothungasagaran N, et al. (2012) Disorder-free sputtering method on graphene. AIP Advances
  9. Rashad, M, Pan, F, Yu, Z, Asif, M, et al. (2015) Investigation on microstructural, mechanical and electrochemical properties of aluminum composites reinforced with graphene nanoplatelets. Prog. Nat. Sci.-Mater.
  10. Bøggild P, Mackenzie DMA, Whelan PR, Petersen DH, et al. (2017) Mapping the electrical properties of large-area graphene. 2D Materials.

Sensory Stimulation and Bradykinesia Aponeurotic Stimulation Effects on Parkinson Bradykinesia

DOI: 10.31038/JCRM.2019244

Abstract

Introduction: Bradykinesia is one of the main motor symptoms in Parkinson Disease (PD). Studies have shown that patients with PD exhibit bradykinesia because they have difficulties integrating multi-sensorial information, mainly proprioception, leading to difficulties in modulating the velocity of self-paced voluntary movements. We hypothesized that stimulation of aponeurotic tissues of the upper limb, which contains numerous types of mechanoreceptors, could therefore have a therapeutic effect on PD-induced bradykinesia.

Method: We investigated changes in bradykinesia in patients with PD after aponeurotic stimulation (AS) of tissues of upper limb muscles with a metallic hook, according to the diacutaneous fibrolysis method. A control group received placebo stimulation (PS) that consisted of manipulating the skin over the muscles that were the targets for AS treatment. We assessed symptoms of bradykinesia in a total of 10 patients with PD in terms of movement velocity for upward rotations of the outstretched arm and in terms of UPDRS motor score, before and after AS or PS treatment.

Results: Parkinson’s motor symptoms, as measured by the UPDRS motor scored, decreased for the AS group from 31.3±13.2 % to 26.8±12 % (p<0.003), whereas for the control group there was no significant difference after PS treatment. AS treatment also led to an increase in peak velocity at the shoulder (8.1±1.3°/s before vs. 10.2±1.1°/s after; p=0.037), whereas the placebo treatment induced no significant modifications.

Conclusions: The results of this pilot study suggest that aponeurotic stimulation directly improves motor output, with the potential of alleviating bradykinesia in patients with PD.

Introduction

Current knowledge attributes movement disorders in PD to a dysfunction of the basal ganglia-motor cortex circuits, but it is also known that abnormalities in the processing of peripheral afferents may interfere with movement execution [1]. Studies have shown that patients with PD rely excessively on visual information to guide movements [1–3] and that they present deficits in the conscious perception of limb and body motion (i.e. kinaesthesia) [4]. Exploring rehabilitation possibilities for PD-related movement disorders via sensory stimulation is therefore very attractive, especially since cutaneous and proprioceptive stimulation strongly activates both the olivo-cerebellum and basal ganglia networks [5–6]. In this light, we hypothesized that diacutaneous fibrolysis method, a form of aponeurotic manipulation, could be beneficial. By applying this approach on the triceps surae, Vezsely et al [7]. Showed that dorsi-flexion at the ankle increased while passive tension decreased. More importantly, tendon reflexes decreased, indicating a modification of proprioceptive information processing. To the extent that sensory processes may underlie bradykinesia in PD, aponeurotic stimulation could affect, and hopefully alleviate, some of these symptoms.

Methods

Participants

Ten participants gave written consent and the Ethical Committee of the “Hôpital Brugmann” (Brussels) approved the study. Table 1 shows the characteristics of each participant. Each participant continued their usual medical treatment and for those using deep brain electrical stimulation (DBS), the stimulation was turned on during the experiment.

Experimental procedure

Participants performed a pointing task consisting of an upward rotation of the outstretched arm around the shoulder joint, initiated after a self-timed delay. Patients were seated in front of a panel showing two targets and pointed at these targets with a laser pointer fixed to their index finger (Figure 1A). Movements of reflective markers attached to the upper limb were recorded in 3D at 100 Hz with an optoelectronic device (BTS Elite System).

An experimental session consisted of 10 pointing movements performed before and after 45 minutes of AS or PS treatment (see below). At the beginning and end of the session, a therapist performed the UPDRS test (part III: Motor evaluation) [8] concerning motor function. One week before the recording session, each patient was trained to perform the pointing movements at their own ‘natural’ velocity.

JCRM 2019-119 - Ana Bengoetxea Belgium_F1

Figure 1:

A) Experimental conditions. Seated subjects pointed with a laser to targets (diameter of 4 cm) located at a distance of 3.5m. The starting target was in the middle of the panel and the ending target 42 cm above. They were asked to perform the movements with the upper arm in an extended position (shoulder movements around a nominal position of 90° flexion, with the elbow fully extended).

B) Mean peak shoulder velocity (Vy) before (ordinate) versus after (abscissa) treatment. Open circles represent the PS treatment group and black circles the AS treatment group. Dashed lines show the range (mean±SD) for the healthy control group.

C) Mean and SD for Vy before and after PS and AS treatment, and for healthy control subjects.

A second therapist imposed passive movements of the patient’s shoulder and elbow used to localize the muscles manifesting the greatest rigidity. In general the main muscles manipulated were: the superior or inferior trapezium, the anterior and posterior deltoid, the external or internal rotators of the shoulder, the pectoralis major, the triceps brachii and the brachialis. AS treatment consisted of back-and-forth displacements of the aponeurotic tissues enrobing the heads of the target muscles, applied by a hook perpendicular to the axis of the muscular fibers. PS stimulation consisted of manipulating the skin over the same target muscles. The second therapist was the only person to know if AS or PS was applied to a given patient.

We computed the peak angular velocity for rotation at the shoulder (Vy) from the 3D marker data for each pointing movement. Statistical analyses consisted of repeated measure ANOVA (Statistica®, StatSoft) with treatment (AS or PS) and repetition (before or after treatment) as within-subjects factors, applied to Vy and to UPDRS scores.

Results

Before manipulation the AS and PS groups presented no significant differences in their motor UPDRS scores. ANOVA showed a significant cross-effect (F(1, 9)=8.76, p=0.016) between test repetition (before or after treatment) and treatment type (AS or PS). The subsequent Bonferroni-corrected post-hoc analyses showed a highly significant decrease of the UPDRS motor score from 31.3±13.2% to 26.8±12 % after AS treatment compared to before (p<0.003), whereas for the PS treatment group there was no significant difference (Table 1).

Table 1. Profile and clinical features of subjects. UPDRS score for part III (Motor evaluation) and scores on selected items before and after treatment.

JCRM 2019-119 - Ana Bengoetxea Belgium_F2

We then assessed what items of the UPDRS presented the main changes after treatment. Table 1 shows the values before and after treatment for 6 specific items (the values correspond only to the treated upper limb); 3 of them corresponding to the ‘triad’ of main symptoms of PD disease and the 3 others corresponding to hand movements. It is interesting to note that treatment produced a significant cross-effect between the ‘hand’ and ‘triad’ groups (F(1, 9)=6.024, p=0.04). After treatment the mean of hand-movement items decreased from 1.36±0.16 to 1.06±0.18 (Bonferroni post-hoc p<0.01), whereas the mean values of the triad symptoms remained stable (1.26±0.13 and 1.23±0.15, respectively).

Figure 1B shows Vy measured for our participants, compared to the mean±SD of “natural” shoulder velocity for 10 healthy control subjects (area between dashed lines) who performed this pointing movement after the same training as our patients. Patients presented significantly lower Vy on average than the control group (8.8±0.8°/s vs. 13.8±1.5°/s), however, we found no difference in Vy between our two patient groups prior to treatment (8.2±1.3°/s for AS vs. 9.9±1.9°/s for PS). Repeated measures ANOVA showed a significant main effect of test period (before and after treatment) on Vy (F(1,9)=5.7, p=0.04). Bonferroni post-hoc tests showed that treatment modified Vy only for the AS group (10.23±1.13°/s after versus 8.17±1.28°/s before; p=0.037) whereas the PS treatment induced no significant modifications (Figure 1C).

Discussion

Aponeurotic stimulation increased the shoulder velocity for vertical pointing movements (Vy) and improved the velocity of hand gestures (UPDRS’s items), indicating a decrease of bradykinesia in our PD patients. It is worth noting that our participants performed these movements under conditions that increase the risk of bradykinesia, because they were voluntary, internally driven movements with accuracy constraints [9] and because repeating movements makes the symptoms more prominent [10]. It is also worth noting that our treatment produced a positive effect on the UPDRS items concerning repetitive sequential movements of isolated fingers, hand and wrist (items 23, 24 and 25 respectively).

Conclusions

More research is needed to understand the mechanisms of motor output improvement brought on by the aponeurotic stimulation. Whatever the cause, however, the results from this pilot study indicate that aponeurotic manipulation could provide a new therapeutic approach to improve the quality of every-day movements in patients with PD.

Acknowledgments

This work was funded by the Belgian National Fund for Scientific Research (FNRS), the Research Fund of the Université Libre de Bruxelles (Belgium), the Belgian Federal Science Policy Office, the European Space Agency (AO-2004, 118), the FP7 support (ICT-247959-MINDWALKER). The authors thank J. McIntyre for fruitful comments about the manuscript, J. Burnotte for teaching all the subtleties of the aponeurotic technique, all the persons who participated in the study, the LNMB team for rich discussions, E. Hortmanns and T. d’Angelo for expert technical assistance and C. de Scoville for administrative assistance.

References

  1. Abbruzzese G, Berardelli A. (2003) Sensorimotor integration in movement disorders. Mov Disord 18(3): 231–40. [Crossref]
  2. Adamovich SV, Berkinblit MB, Hening W, Sage J, Poizner H. (2001) The interaction of visual and proprioceptive inputs in pointing to actual and remembered targets in Parkinson’s disease. Neuroscience 104 (4): 1027–41. [Crossref]
  3. Poizner H, Feldman AG, Levin MF, Berkinblit MB, Hening WA, Patel A, Adamovich SV. (2000) The timing of arm-trunk coordination is deficient and vision-dependent in Parkinson’s patients during reaching movements. Exp Brain Res 133(3): 279–92. [Crossref]
  4. Konczak J, Krawczewski K, Tuite P, Maschke M. (2007) The perception of passive motion in Parkinson’s disease. J Neurol 254(5): 655–63. [Crossref]
  5. Ekerot CF, Garwicz M, Jörntell H. (1997) The control of forelimb movements by intermediate cerebellum. Prog Brain Res 114: 423–9. [Crossref]
  6. Hoshi E, Tremblay L, Féger J, Carras PL, Strick PL. (2005) The cerebellum communicates with the basal ganglia. Nat Neurosci 8(11): 1491–3. [Crossref]
  7. Vezsely M, Guissard N, Duchateau J. (2000) Contribution à l‘étude des effets de la fibrolyse diacutanée sur le triceps sural. Annales de kinésithérapie 27: 54–59.
  8. Fahn S, Elton RL, Members of the UPDRS Development Committee. (1987) The Unified Parkinson’s Disease Rating Scale. In Fahn S, Marsden CD, Calne DB, Goldstein M, editors. Recent developments in Parkinson’s disease, vol 2. Florham Park, NJ: Macmillan Health Care Information 153–163, 293–304
  9. Sheridan MR, Flowers KA. (1990) Movement variability and bradykinesia in Parkinson’s disease. Brain 113 ( Pt 4): 1149–61 [Crossref]
  10. Agostino R, Berardelli A, Formica A, Stocchi F, Accornero N, Manfredi M. (1994) Analysis of repetitive and nonrepetitive sequential arm movements in patients with Parkinson’s disease. Mov Disord 9(3): 311–4 [Crossref]

Prenatal Weight Management: What Can Care Providers Do to Prevent Maternal Excessive Weight Gain?

DOI: 10.31038/AWHC.2019253

Abstract

Maternal prenatal weight data can be used to estimate infant birth weight, connect weight concerns of the women before and after pregnancy, and prevent offspring obesity. Prenatal weight data can be interpreted in relation to many contexts, such as BMI, weight loss or gain, body fat, and patient perspectives. The primary goals for weight management during pregnancy include helping pregnant women achieve an optimal weight but to avoid excessive gestational weight gain. To prevent excessive gestational weight gain among pregnant women, healthcare providers can focus on utilizing integrated and inter professional collaborative team care approach, the 5A’s method for lifestyle counseling, and self-monitoring strategy to empower pregnant women for behavioral change. Prenatal weight management is important for a healthy pregnancy with short- and long-term health implications for the mother and the baby.

Keywords

Weight Gain, Weight Management, Excessive Gestational Weight Gain, 5a’s Method, Self-Monitoring, Obesity

There are many reasons for why prenatal weight management is needed. First, maternal prenatal weight gain can be used to predict the size of an infant. A previous population study, based on 2,438 pregnant women from four ethnic groups and with a viable singleton pregnancy, found an increased risk of giving birth to a baby of either small or large for gestational age among women with below or above the average of gestational weight gain [1]. Second, prenatal weight management is part of the life course weight control intervention for women. Overweight and obesity before pregnancy is strongly associated with excessive gestational weight gain during pregnancy [2]. For some women, concerns about body weight before pregnancy may continue or intensify throughout the pregnancy. Moreover, three-quarter of women retain, on average, 3.5 kg of pregnancy weight at 6 months postpartum and those who gain excessive weight during pregnancy are likely to retain weight after birth [3]. The third reason is that prenatal weight management may prevent intergenerational obesity in the offspring. Growing evidence has pointed to the link between unfavorable intrauterine environment (e.g., excessive gestational weight gain, maternal obesity, and over nutrition) and offspring excess adiposity and childhood obesity [4]. Prevention of childhood obesity can start in the fetal stage by avoiding maternal excessive gestational weight gain through maternal healthy lifestyle. Prenatal weight, therefore, has short- and long-term health implications for the mother and the baby. Healthcare providers should be cognizant of prenatal weight management.

Prenatal Weight and Objective and Subjective Reference Value

Body Mass Index

Body mass index (BMI) is the most commonly used reference value to define adults who are underweight (BMI < 18.5 kg/m2), normal weight (BMI = 18.5–24.9 kg/m2), overweight (BMI = 25–29.9 kg/m2), or obese (BMI ≥ 30 kg/m2) [5]. Assessing prepregnancy BMI is important because optimal gestational weight gain recommended for each woman is individualized and based on her prepregnancy BMI. For instance, gestational weight gain recommendations by the Institute of Medicine [6] are 38–40 lb, 25–35 lb, 15–25 lb, and 11–20 lb for women of underweight, normal weight, overweight, and obese, respectively.

Weight Change

Body weight can also be assessed in the context of change, such as weight loss or weight gain between two time points. In non-pregnant women with overweight or obesity, a weight loss of 2.5–5.5 kg in two or more years can reduce type 2 diabetes by 30% to 60% [7]. Weight loss, however, is not recommended for pregnant women. A weight gain of more than 40 pounds for a singleton pregnancy from the beginning to the end of pregnancy is not favorable regardless of pre-pregnancy BMI [6]. Prenatal weight change can also be evaluated weekly. For instance, based on the IOM weight gain recommendations, a woman with a prepregnancy BMI ≥ 30 kg/m2 in the second and third trimester is to gain 0.4 to 0.6 lb per week. A recent study indicates that pregnant women not receiving weight gain advice from their healthcare providers are likely to gain inadequate or excessive weight during pregnancy [8]. Care providers should have a conversation with pregnant women regarding their optimal recommended gestational weight gain. Furthermore, accuracy of a weight scale may alter weight readings.

Stein et al. [9] found that about 21% of the 223 weight scales collected from primary care clinics, diabetology/endocrinology clinics, weight loss facilities, and fitness centers were inaccurate by more than 6.0 lb when the scales were tested using the 250.0 lb. (113.6 kg) test. Regular calibration of weight scales following manufacture instructions can increase precision of weight measures.

Body Fat

Another context to consider when evaluating body weight is body fat. About 23.5% of US adults with normal weight are metabolically abnormal (normal-weight obesity) and it is their body fat that makes them susceptible to developing a metabolic disorder [10]. Increased body weight from body fat, particularly from abdominal adiposity, is of concern. A non-pregnant woman with a waist circumference of 35 inches (88 cm) has an increased risk for cardiometabolic disease [11]. For pregnant women, there is no agreeable reference value for body fat. A previous study found that an increase of 0.14 kg per week in abdominal fat among pregnant women is associated with an odds ratio of 1.31 (95% CI: 1.10–1.56) for gestational diabetes [12]. There are many ways to measure body fat and other body compositions, such as dual-energy x-ray absorptiometry, bio-impedance analysis, computed tomography, and magnetic resonance imaging [13]. Some of these methods may be cumbersome, expensive, and impractical in practice but are objective measures often performed in research.

Patient Perspectives

A previous study found that body ‘fatness’ and ‘excess fat’ were not desirable terms perceived by study participants with obesity; instead, they preferred a neutral term such as ‘weight’ [14]. These findings suggest that care providers need to be skillful and sensitive during clinical encounters with pregnant women when addressing gestational weight gain issues. Assessing weight in the context of patient perspectives is essential. Body weight change may connote physical, emotional, and relationship issues. A pregnant woman may report difficulty in climbing staircases, walking longer distances, playing with her young children at length, or lying down to sleep due to the weight she gains during pregnancy. An increase in body weight may also make women feel dissatisfied with their bodies or not want to socialize with their friends. Subjective personal perspective about weight gain from pregnant women can also help healthcare providers create individualized care plans that are meaningful to their pregnant patients.

Prenatal Weight Management

The US Preventive Services Task Force [15] recommends clinicians offer or refer patients with a BMI of 30 kg/m2 or higher to intensive, multicomponent behavioral interventions. This weight management recommendation is based on the evidence that obesity is a risk factor for many chronic diseases and that behavioral interventions can help people lose weight and therefore decrease disease risk. Weight management for pregnant women, however, is unique and challenging due to several reasons. First, currently there are no agreeable guidelines for weight loss during pregnancy. For pregnant women with a BMI of 30 kg/m2 or higher, the American College of Obstetricians and Gynecologists or ACOG [16] suggests dietary control, exercise, and behavioral modifications be the primary weight management strategies. Second, one half of pregnant women gain excessive weight during pregnancy [2] and each woman’s optimal amount of weight gain is individualized based on her prepregnancy BMI. Prenatal weight management, therefore, should be discussed between all pregnant women and their healthcare providers and this demand may require modifications of practice for some care systems. Third, some providers may be reluctant to discuss with their patients weight management due to time constraint and lack of counseling knowledge and skills [17]. As reported in a previous study, patients wanted their primary care providers to be partners in their weight management efforts, but they recognized limitations of provider’s time and expertise [18].

To help pregnant women adhere to IOM weight gain recommendations and prevent excessive weight gain, care providers may consider an integrated approach as addressed in the ACOG [16] clinical guidelines. This approach begins before conception and through pregnancy and postpartum, especially for women with a BMI in the obesity category. As implied in this approach, care providers in various practice settings, such as primary care centers and in-patient units serving reproductive-age women in-between pregnancy, during pregnancy, and after pregnancy, should discuss weight management with the women.

Another approach is to encourage interprofessional collaboration to maximize support for the women from nurses, physicians, nutritionists, health coaches, and other professionals. A practice guide published by the National Blood, Heart, and Lung Institute [19] states that a practitioner is encouraged to involve other professionals in lifestyle counseling. In fact, primary care providers in a previous study reported they were comfortable to involve ancillary staff who had the skills to do lifestyle counseling for patients [17]. The 5 A’s model (ask, advise, assess, assist, and arrange), endorsed by the Agency for Healthcare Research and Quality [20] and originally developed for smoking cessation, is a useful guide for behavior counseling and can be used in prenatal weight and lifestyle counseling. For instance, Eaton et al. [21] used the 5A’s (address the agenda, assess, advise, assist, and arrange) to do nutrition counseling in primary care setting. Vallis et al. [22] provided detailed definitions for the 5 A’s (ask, assess, advice, agree, and assist) for obesity counseling and they added an “agree” step to invite clients to develop a workable, measurable, and achievable plan.

The American Association of Clinical Endocrinologists and the American College of Endocrinology clinical guidelines [23] suggest self-monitoring, goal setting, stress reduction, stimulus control, behavioral contracting, cognitive restructuring, and social support as behavioral change strategies. Among them, self-monitoring is the most used strategy and requires minimal skills of the women. It has also been found that self-monitoring strategy is the most effective strategy as compared to other strategies in promoting health eating and physical activity and postpartum weight loss [24, 25]. Care providers can empower pregnant women by encouraging them to use self-monitoring strategy to monitor body weight change and weight-related behavior, such as food intake and physical activity. Care providers and pregnant women can then look at self-monitored data and collectively decide ‘problem behaviors’ and propose potential solutions.

Summary

Weight gain in pregnancy is an indicator for fetal growth and infant birthweight. Prenatal weight assessment and management should be viewed as part of a life course intervention and as an opportunity to prevent potential obesity in the offspring and the mother. Due to its health implications in the mother and the baby, prenatal weight assessment and management should be incorporated in prenatal practice. Healthcare providers should aim to help pregnant women achieve optimal weight recommended by the Institute of Medicine and avoid excessive gestational weight gain. Healthcare providers can approach prenatal weight management using an integrated team care model, interprofessional collaborative practice, the 5 A’s method for lifestyle behavior counseling, and a self-monitoring strategy to identify problem areas in eating and physical activity, and solutions to modify unfavorable behaviors.

Acknowledgement

The author received no funding for this work. The author thanks Elisabeth Ferris-Rowe, MD, MS for her valuable input and Rosa Lindsey, MA for her assistance with manuscript editing.

References

  1. Pugh SJ, Hinkle SN, Kim S, Albert PS (2018) Combined influence of gestational weight gain and estimated fetal weight on risk assessment for small-or large for-gestational -age birth weight. A prospective cohort study. J of Ultrasound Med 37: 935–940.
  2. Branum AM, Sharma AJ, Deputy NP (2016) QuickStats. Gestational weight gain among women with full-term, singleton births, compared with recommendations – 48 States and the District of Columbia, 2015. MMWR 65: 1121.
  3. Hollis JL, Crozier SR, Inskip HM, Cooper C (2017) Modifiable risk factors of maternal postpartum weight retention: An analysis of their combined impact and potential opportunities for prevention. Int J Obes (London) 41: 1091–1098.
  4. Ma RCW, Popkin BM (2017) Intergenerational diabetes and obesity—A cycle to break? PLoS Med 14: e1002415.
  5. World Health Organization (2019) BMI classification. [Internet] [2019 September 30]. Available: https://www.who.int/gho/ncd/risk_factors/bmi_text/en/
  6. Institute of Medicine (2009) Weight gain during pregnancy: Reexamining the guidelines. Washington, DC: The National Academies Press. [Internet] [2019 September 30]. Available: http://nationalacademies.org/hmd/reports/2009/weight-gain-during-pregnancy-reexamining-the-guidelines.aspx
  7. National Heart, Lung and Blood Institute (2013) Managing overweight and obesity in adults. Systematic evidence review from the expert panel [Internet]. [2019 September 30]. Available: https://www.nhlbi.nih.gov/sites/default/files/media/docs/obesity-evidence-review.pdf
  8. Deputy NP,  Sharma AJ, Kim SY, Olson CK (2018) Achieving appropriate gestational weight gain: The role of healthcare provider advice. J Womens Health (Larchmt) 27: 552–560.
  9. Stein RJ, Haddock CK, Poston WSC, Catanese D (2005) Precision in weighing: A comparison of scales found in physician offices, fitness centers, and weight loss centers. Public Health Rep 120: 266–270.
  10. Rubin R (2018) What’s the best way to treat normal-weight people with metabolic abnormalities? JAMA 320: 223–225.
  11. Klein S, Allison DB, Heymsfield SB, Kelley DE (2007) Waist circumference and cardiometabolic risk: A consensus statement from Shaping America’s Health: Association for Weight Management and Obesity Prevention; NAASO, the Obesity Society; the American Society for Nutrition; and the American Diabetes Association. Obesity 15: 1061–1067.
  12. Sommer C, Mørkrid K, Jenum AK, Sletner L (2014) Weight gain, total fat gain and regional fat gain during pregnancy and the association with gestational diabetes: a population-based cohort study. Int J Obes 38: 76–81.
  13. McCarthy MA, Strauss BJG, Walker SP, Pernezel M (2004) Determination of maternal body composition in pregnancy and its relevance to perinatal outcomes. Obstet Gynecol Surv 59: 731–742.
  14. Volger S, Vetter ML, Dougherty M, Panigrahi E (2012) Patients’ preferred terms for describing their excess weight: Discussing obesity in clinical practice. Obesity (Silver Spring) 20: 147–150.
  15. U.S. Preventive Services Task Force (2018) Weight Loss to Prevent Obesity-Related Morbidity and Mortality in Adults: Behavioral Interventions. [Internet] [2019 September 30]. Available: https://www.uspreventiveservicestaskforce.org/Page/Document/RecommendationStatementFinal/obesity-in-adults-interventions1
  16. American College of Obstetricians and Gynecologists (2015) Obesity in Pregnancy. Practice Bulletin number 156. Obstet & Gynecol 126: 112–126.
  17. Bennett WL, Gudzune KA, Appel LA, Clark JM (2013) Insights from the POWER practice-based weight loss trial: A focus group study on the PCP’s role in weight management. J Gen Intern Med 29: 50–58.
  18. Bloom K, Adler J, Bridges C, Bernstein J (2018) Examining patient perspectives on weight management support in the primary care setting. J Primary Prevention 39: 387–399.
  19. National Heart, Lung and Blood Institute (2010) The practical guide for identification, evaluation, and treatment of overweight and obese adults. NIH Publication Number 00-4084. [Internet] [2019 September 30].Available: Retried September 18, 2018 from https://www.nhlbi.nih.gov/files/docs/guidelines/prctgd_c.pdf
  20. Agency for Healthcare Research and Quality (2012). Five Major Steps to Intervention (The “5 A’s”). [Internet] [2019 September 30]. Available:  https://www.ahrq.gov/prevention/guidelines/tobacco/5steps.html
  21. Eaton CB, McBride PE, Gans KA, Underbakke GL (2003) Teaching Nutrition Skills to Primary Care Practitioners. J Nutr133: 563–566.
  22. Vallis M, Piccinini-Vallis H, Sharma AM, Freedhoff Y (2013) Modified 5 as minimal intervention for obesity counseling in primary care. Can Fam Physician 59: 27–31.
  23. Garvey WT, Mechanick JI, Brett EM, Garber AJ (2016) American Association of Clinical Endocrinologists and American College of endocrinology Comprehensive clinical practice guidelines for medical care of patient with obesity. Endocr Prac 22: 1–203.
  24. Lim S, O’Reilly S, Behrens H, Skinner T (2015) Effective strategies for weight loss in post-partum women: a systematic review and meta-analysis. Obes Rev 16: 972–987.
  25. Michie S, Abraham C, Whittington C, McAteer J (2009). Effective techniques in healthy eating and physical activity interventions: A meta-regression. Health Psychol 28: 690–701.