Author Archives: author

The Cognitive Economics of OTC Health: A Mind Genomics Exploration

DOI: 10.31038/JPPR.2019242

Abstract

Using the paradigms of Mind Genomics, consumers evaluated different combinations of brand, features, and performance of antacids, with the former elements combined into small, easy-to-read combinations (vignettes.) Each respondent rated a unique set of 63 vignettes on two attributes, interest in the product, and price that would be paid for a week supply of the product. The deconstruction of the vignettes into the contribution of components revealed large differences in the contribution of the components of the vignette to both interest and to price. The strongest performing elements dealt with the specific uses of the product.  Price covered with interest, with some anomalies, the most striking being the high price assigned to a well-known expensive brand, (brand) Zantac, which did not perform well in terms of interest. Respondent thus ‘know’ price from their experience, and do not simply assign higher prices to elements they like. The mind-set segments were complex, showing that even with as many as four mind-sets, consumer lump together product features, and performance.

Introduction

In 2012 author HRM was asked by the new owner of one of the old-brand antacids to help understand the ‘mind of the antacid user.’ The objective of the researcher was to uncover both the messages to which an antacid user would respond, and to understand the cognitive economics of these messages, specifically how much was each message worth in dollars and cents.  The objectives were both business and scientific. The business application was to refresh the messaging. The scientific application was to create a base of knowledge about the mind of the OTC consumer. Most of the information extant to date was either store-information from the ‘trade,’ or the data from a set of disconnected short reports from market researchers about the product, data that could easily be woven into a single coherent database.

The data reported here come from that study, owned in its entirety by author HRM, and thus available for publication. The importance of the paper is both substantive, revealing the mind of the consumer, and methodological, showing how to understand both what is important, and the value of that importance.

Anti-acid drugs, available on prescription by a physician, possess the potential to block gastric digestion of food allergens and consequently elevate the risk for food sensitization [1–4].

Over-The-Counter (OTC) antacids also increase the gastric pH, in turn increasing the risk for sensitization against food allergens, even to those that are usually digestion-labile [5]. The increasing medical concern with the widespread usage of antacids world-wide may be partly correlated with the recognition of the dramatic increase in food allergies during the past decades.  The broadest use of antacids is in the US. In the richer, more developed West European countries (Germany, Belgium, Italy and the UK) antacids also play a remarkable role. In Latin American countries, Mexico, Argentina, Brazil antacids are used less frequently. Furthermore, the antacids used in these Latin American countries are different brands and different formulations, versus the formulations and brands used by West Europeans [6] there are many similarities in preferences and patterns of antacids use between countries, but most antacids used are OTC, and most regular users keep a stock of them. National variations between Europeans and Americans partly explained by cultural differences that shape one’s perceptions regarding symptoms affecting their treatment needs, preferences and expectations [7].

In contrast to Europeans, Americans consume several brands that they freely obtain from drug stores reflecting a broad OTC market but. Furthermore, in the US antacids are used not only as a treatment for symptoms of gastro-esophageal reflux but for other disease with similar symptoms [8] The widespread use of antacids is not limited to those who report occasional heartburn, but rather antacids are used widely for other issues that the patient self-treats [9].

Furthermore, antacids have become the most commonly prescribed medication for patients with ISB (irritable bowel syndrome), rather than for the original use to treat reflux disease [10]. This popularity of antacids may be explained by patients’ expectations for a treatment to provide a quick, long lasting relief. As a consequence, the use of antacids may be expected to increase in the future because it drives patient satisfaction, may improve clinical outcomes, together the components for a useful medical intervention [11].

Studies on patient expectations from antacids and proper communication regarding their safe use are scarce. The ongoing, indiscriminate use of antacids for a broad range of abdominal diseases, increase the gastric pH and the risk for sensitization to food allergens. It is relevant at the psychological level to understand how people perceive antacids, what they expect from treatment with antacids and to what extent they are aware of long- term risks of its wide use for diseases other than gastro-esophageal, acid reflux.

This study focuses on mapping patient perceptions and expectations, uncover general trends for the total population, and searching for mind-set segments, different groups of individuals who perceive the use and benefit of antacids in different ways. The study is part of the effort of Mind Genomics, an emerging science, to drive better medical outcomes by understanding the ‘mind of the patient’ and the ‘mind of the health professional,’ in order to create better communications by the health professionals, and better outcomes for the patient.

Method

The approach we used is known by the rubric of Mind Genomics. Simply stated, Mind Genomics quantifies ideas on different dimensions, and uncovers new-to-the-world minds-sets of people, groups of individuals who are similar in the pattern of responses to the particular stimulus.  The methods of Mind Genomics derive from the statistical discipline of experimental design [12], wherein the independent variables are complete messages of ideas.  Applications of Mind Genomics have ranged from food to drugs to jewelry, and so forth [13].

Mind Genomics began as a topic in mathematical psychology, ‘Conjoint Measurement’ [14] The approach, experimental design of ideas, found ready interest in marketing, led by pioneer researcher Paul Green and his colleagues at the Wharton School of Business of the University of Pennsylvania [15,16]. The underlying science of conjoint measurement has thus almost a 60- year history, but it is during the past 25 years, that the approach has found wide use in applications, perhaps because the method migrated from a custom set up to an ad hoc, DIY (do-it-yourself) system [17,18].

Mind Genomics follows these steps to uncover what motivates people.

  1. Identify questions and their answers. The metaphor of questions and answers makes the task easier for those who are just beginning to explore the mind of people in this manner. People find asking questions to be easy. It is the specific questions which are hard. Once the questions are framed, it becomes easy to formulate answers.  This study used seven questions, each with five answers (a so-called 7×5 design). The questions (and answers) appear in Table 1.
  2. The questions tell the story. The answers provide the detail. It is the combination of answers from different questions which become the vignettes that the respondents will rate in the actual evaluation. As Table 1 shows, the answers are not specific permutations of the question, but rather different ‘snapshots.’ The questions become simply the means by which to elicit the answers in the preparatory portion of the research, ahead of the actual evaluations. The respondents never see the questions, but rather only see the answers.
  3. The specific choice of questions and answers addressed dual. The first objective was to understand the decision criteria of people regarding antacids. This was the scientific criterion. The second objective was to use these data to help reposition one of the antacids for the commercial market. The second objective, repositioning the antacid, required us to study brand as the first question, although the actual position of the brand name in the test vignettes (combinations of answers) could have been in any one of the different positions.
  4. The answers are combined by experimental design into vignettes, combinations comprising 2–4 answers. Each answer appeared six times across the 63 vignettes and was absent 57 times.  The experimental design thus creates incomplete vignettes. Although some practitioners using experimental design insist on having each vignette complete, with one answer from each of the seven questions, that approach is rife with problems, such as multi-collinearity (lack of independence of the answers as predictor variables in regression), and the sheer difficulty of reading 63 vignettes of seven elements each. The strategy used here ensures statistical independence, and reduces the onerousness of the task, an important consideration in this type of research.
  5. The respondents rated each vignette twice, first on interest, and second on price that they would pay.  We selected five price points and presented them in the same irregular order. The decision to present the prices in irregular order was based on the desire to make sure that there was no similar pattern in answers to the two rating scales, so that a respondent interested in a product description would ordinary select a higher price. The presentation in irregular order removes that possible bias.
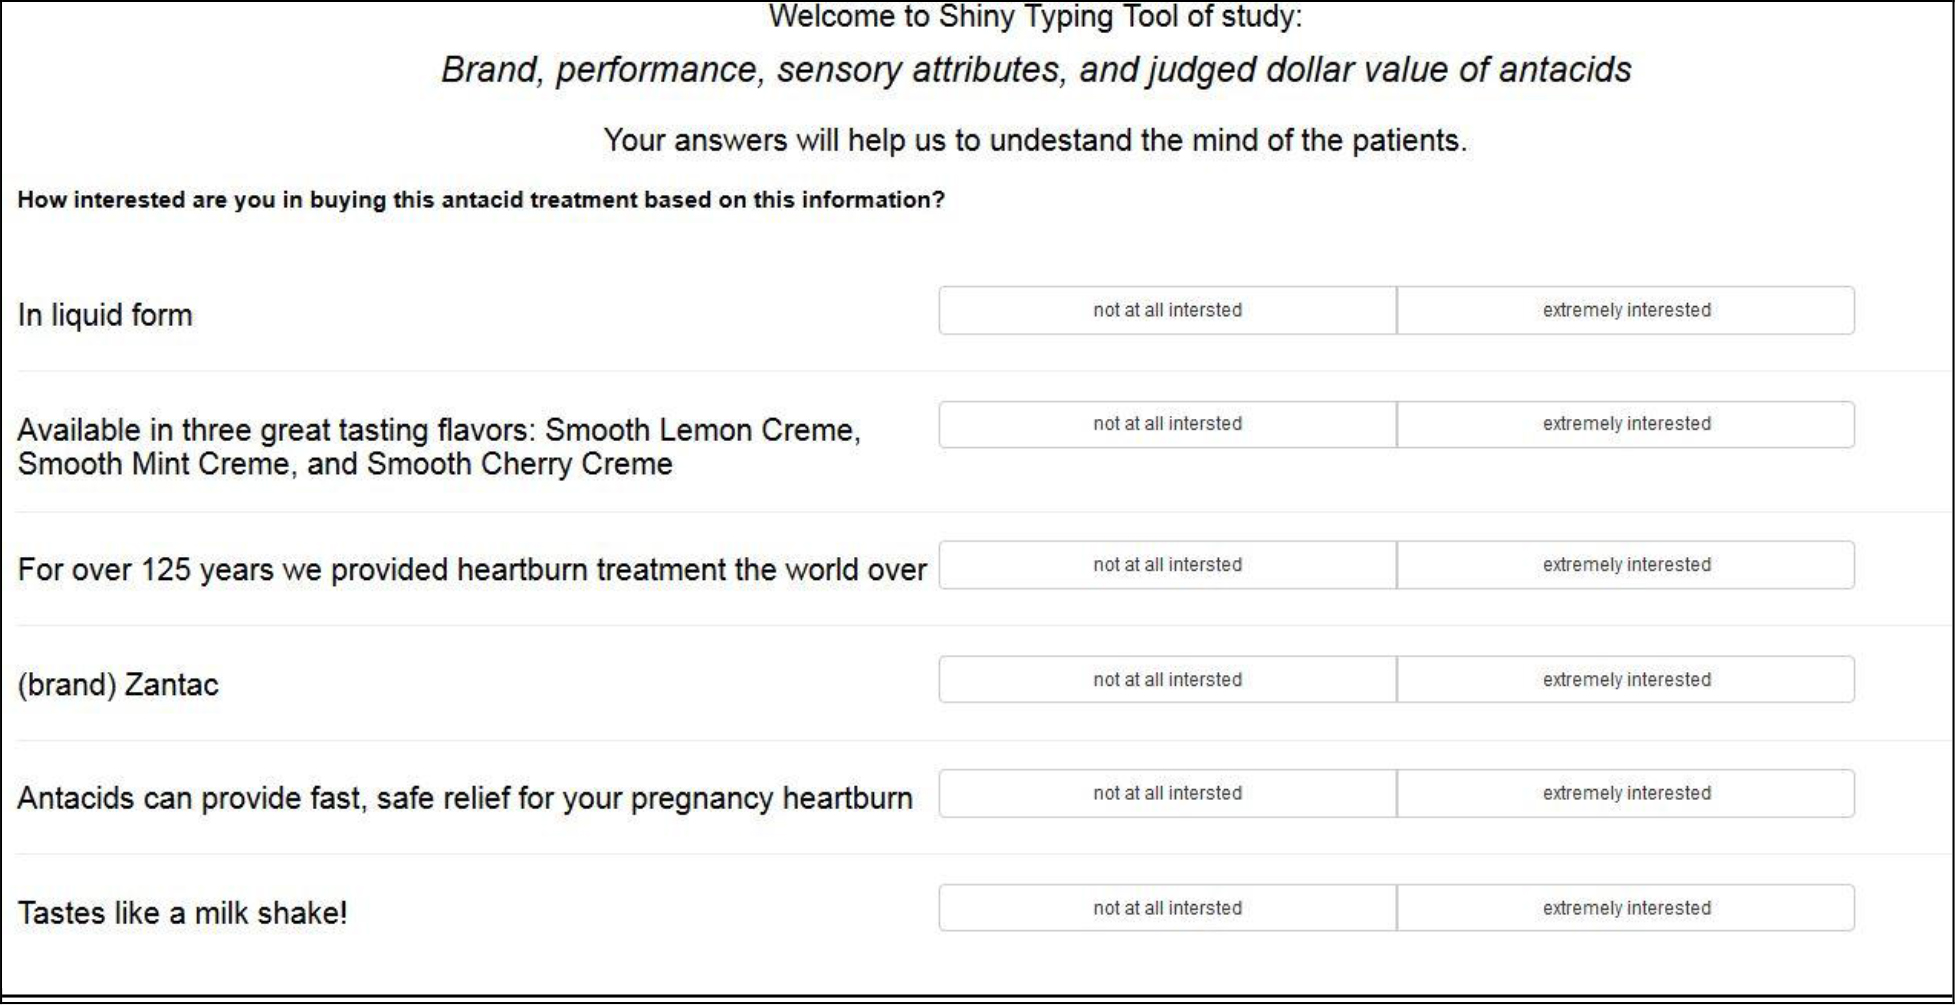
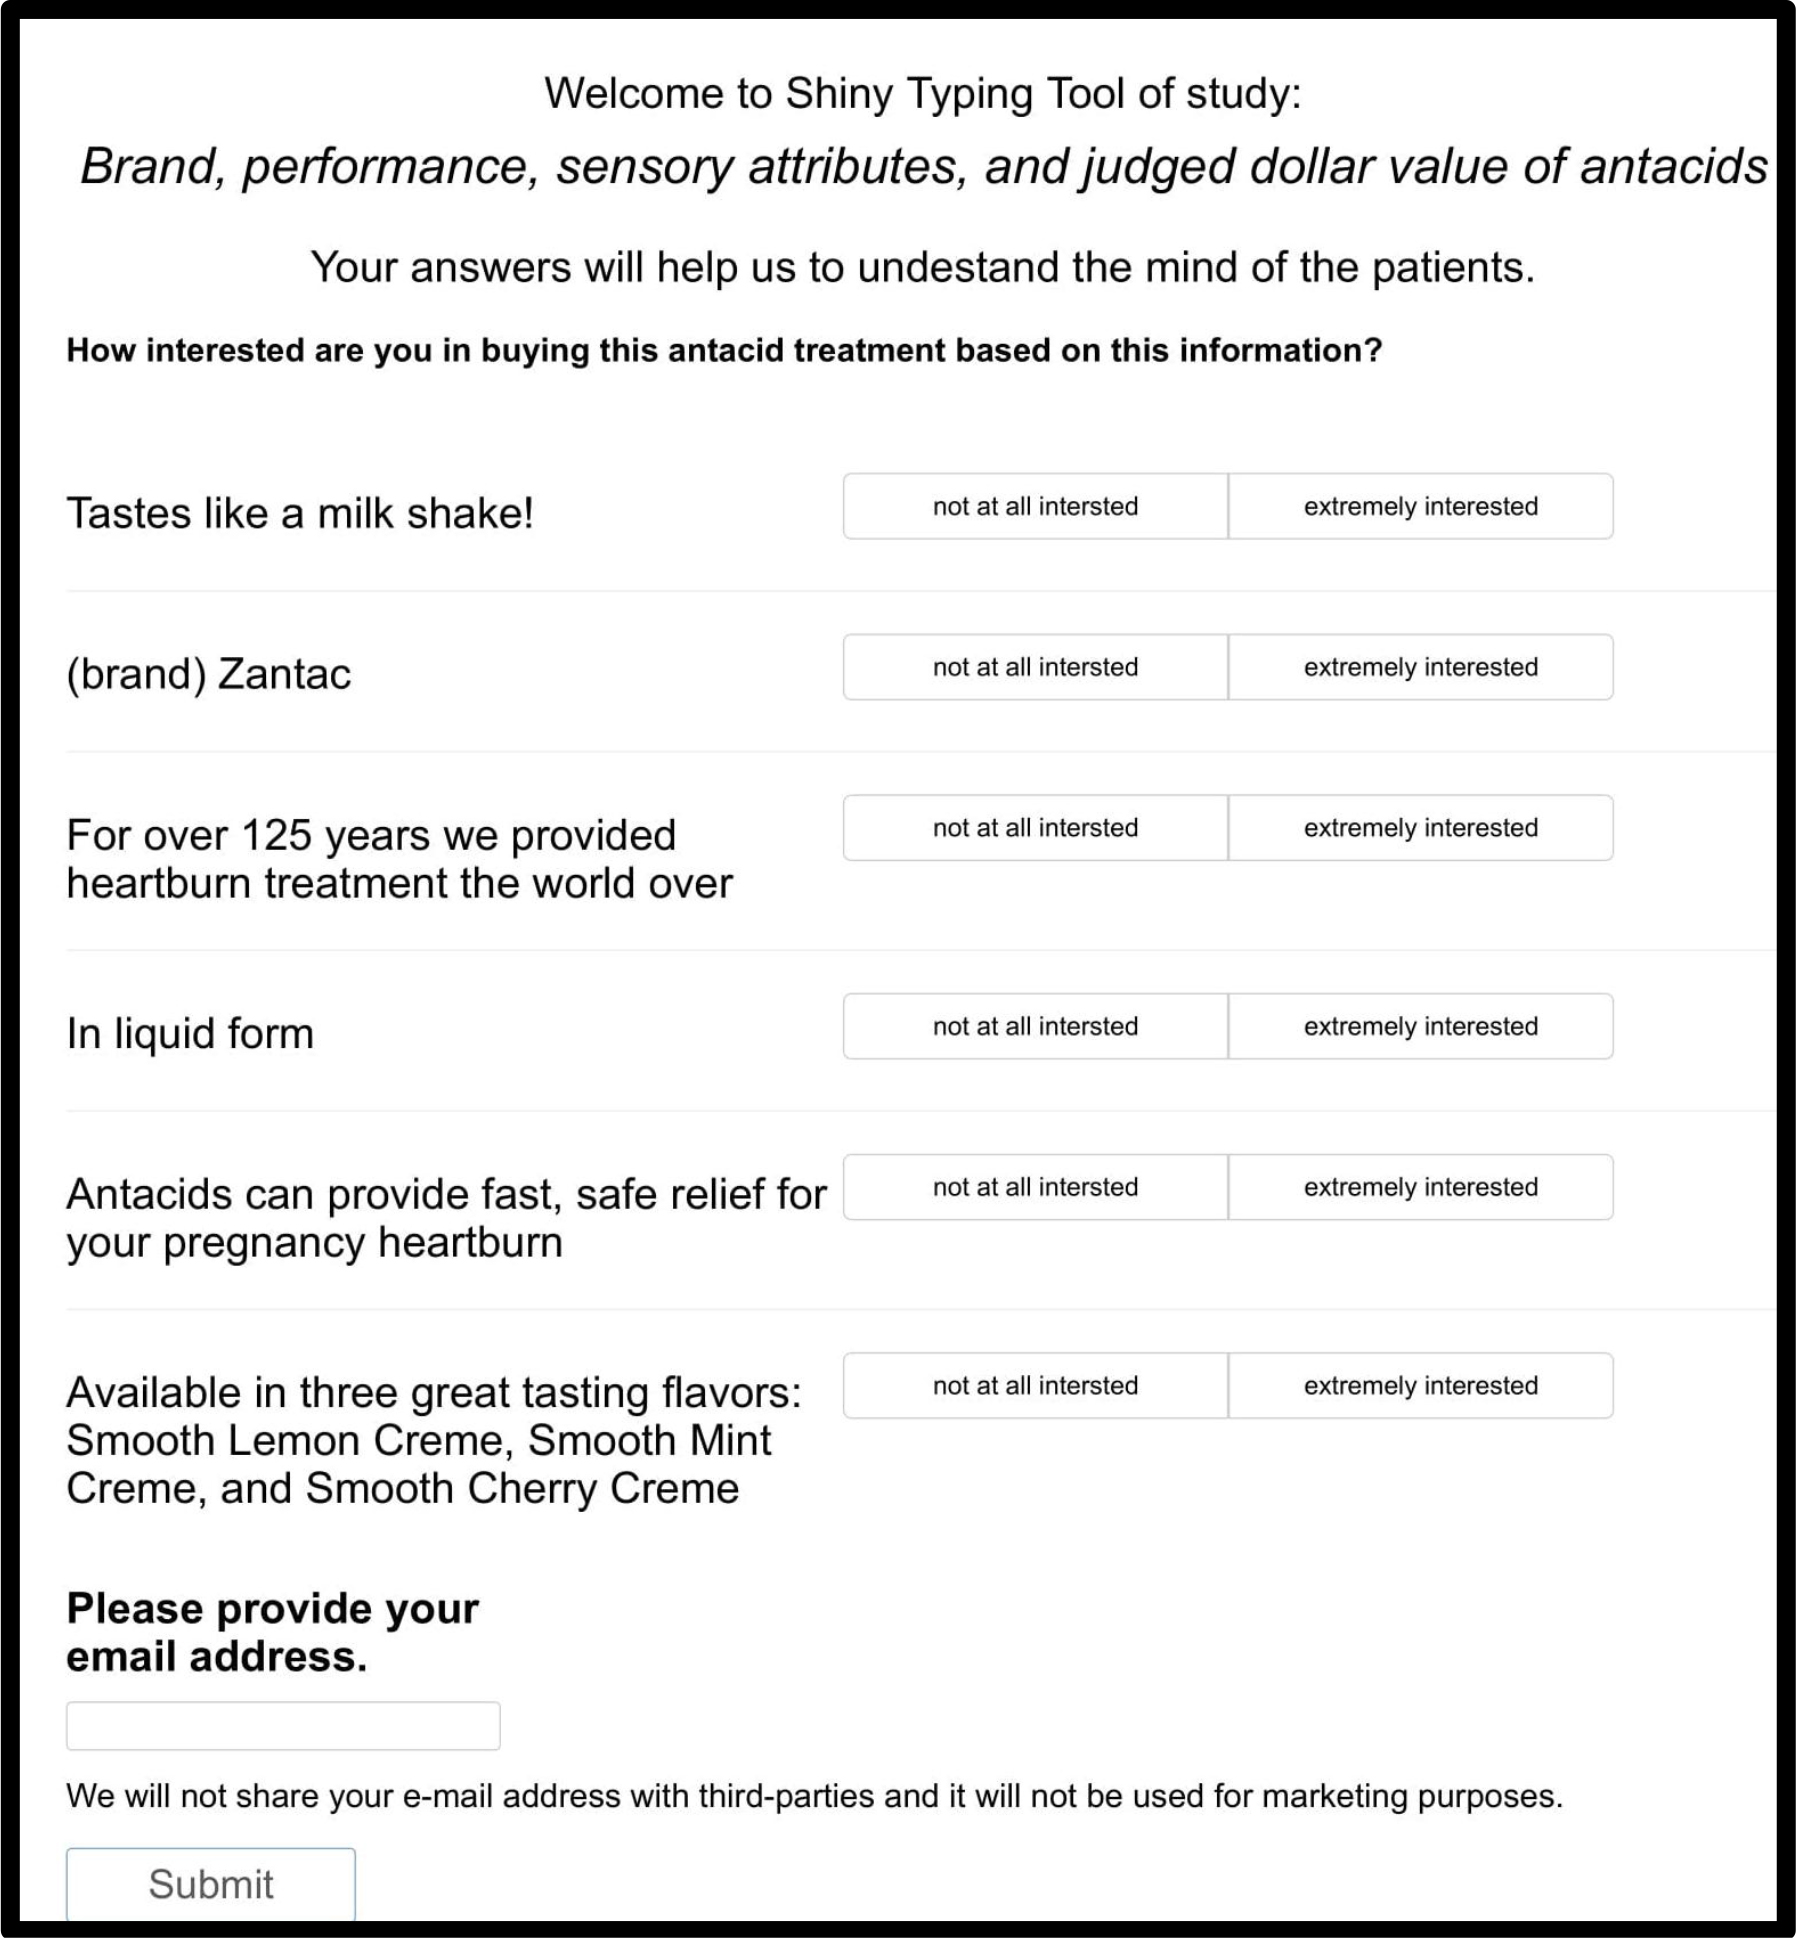
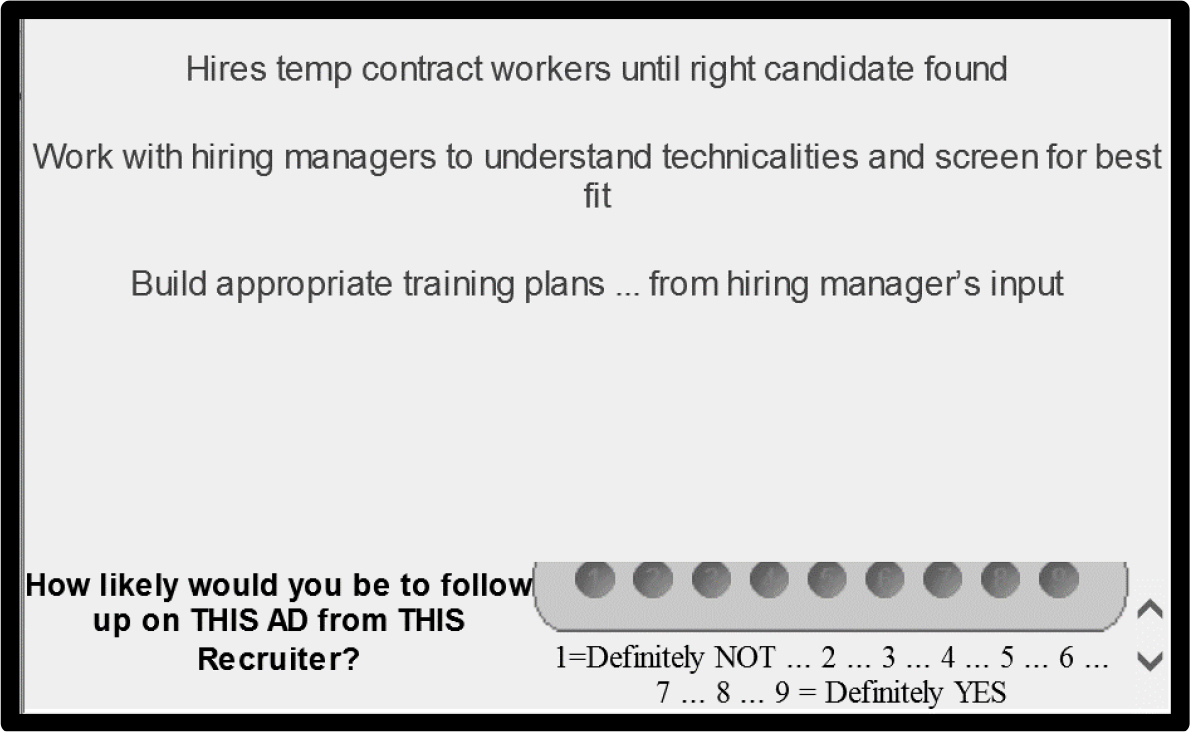
  6. Figure 1 shows an example of a vignette comprising three answers, and the rating on the bottom for the first question. The same vignette was presented, but the question changed, this time instructing the respondent to select a price.
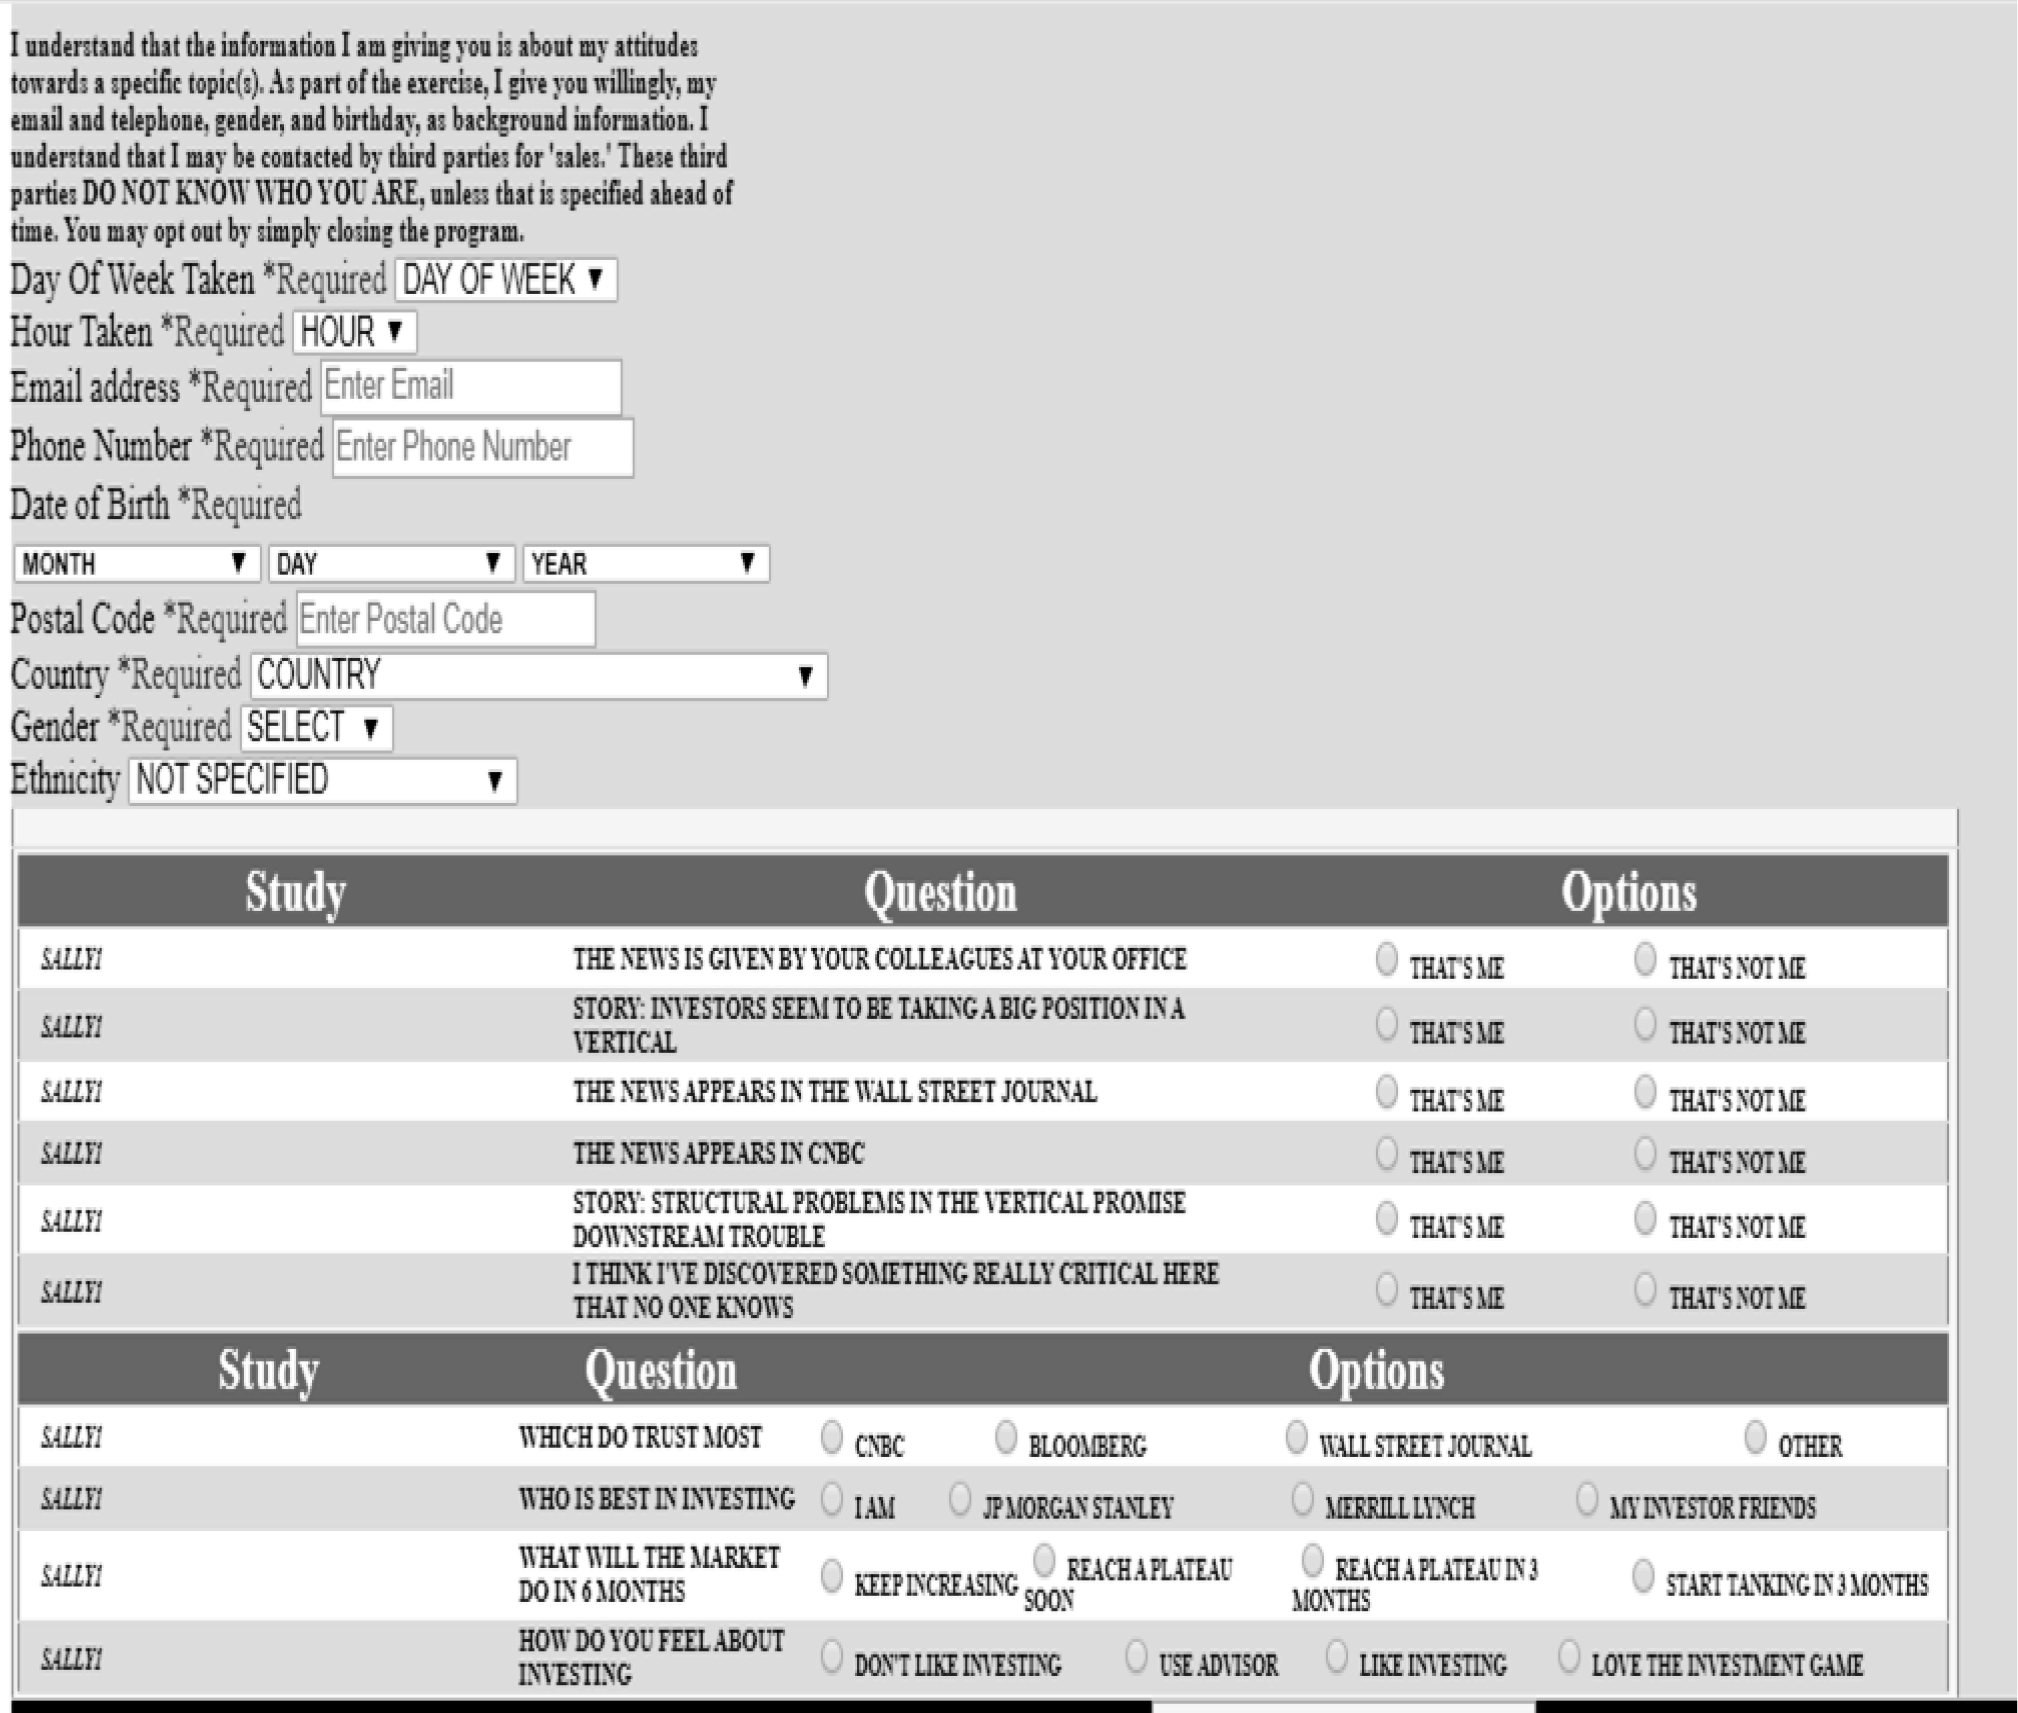
  7. The respondents were run with a panel company (Turk Prime, Inc.), specializing in on-line panels of this type. The respondents are already members of the panel, for which they receive incentives, distributed by the panel company. Figure 2 shows the orientation page sent to those respondents who agreed to participate. The orientation itself gives little information about the topic of the study, other than it deals with an antacid treatment. The rest of the orientation focuses on the time for the interview, the two questions, and the instruction to consider the entire screen (the full vignette) as one idea.
  8. At the end of the respondent’s evaluation of the 63 vignettes on the two rating questions, the respondent completed a detailed self-profiling classification, which instructed the respondent to profile WHO the respondent is, WHAT the respondent believes to be important in an antacid, what BEHAVIORS the respondent follows when taking an antacid (e.g., frequency), and finally, and from what MEDICAL conditions relevant to an antacid does the respondent suffer. This information provides the means by which to analyze the results provided by different, pre-defined groups of respondents. We focus our analysis on total panel, on gender (showing little difference), and on mind-set segment (showing far more differences.)

MIND GENOMICS-034_JPPR_F1

Figure 1. Example of three-answer vignette and the rating scale on the bottom for Question #1 (interest).

MIND GENOMICS-034_JPPR_F2

Figure 2. The orientation page shown to the respondent at the start of the web-based experiment.

Table 1. The seven questions and the five answers/question.

What is the brand name of the product?

A1

(brand) Zantac

A2

(brand) Tums

A3

(brand) Briosche

A4

(brand) Alka-Seltzer

A5

(brand) Mylanta

What is the form of the product?

B1

In pill form

B2

In liquid form

B3

In chewable tablets

B4

In fizzy tablets

B5

In capsules

What is unusual and/or special about the product?

C1

Faster … more complete absorption of this effervescent antacid versus conventional tablets

C2

All natural and aspirin free … It’s simply a great product!

C3

Some antacids contain aluminum hydroxide or calcium carbonate, which can cause constipation … NOT US!

C4

For over 125 years we provided heartburn treatment the world over

C5

Though over-the-counter antacids are considered safe & effective … not all antacids are for every “body”

How does the product taste?

D1

No taste betrays the fact that this is an antacid

D2

Available in three great tasting flavors: Smooth Lemon Creme, Smooth Mint Creme, and Smooth Cherry Crème”

D3

Tastes like a milk shake!

D4

Does not taste “pasty or chalky” like most popular antacids

D5

With its crisp, clean lemon taste, it’s a pleasure to take to relieve your symptoms!

How does it relieve your heartburn, and how then do you feel?

E1

Relieves your heartburn, acid indigestion, and upset stomach without unnecessary chemicals, ingredients, or preservatives

E2

Has 600 mg of calcium in each dose, which helps to treat osteoporosis … two benefits in one!

E3

Enjoy all of your favorite foods without the threat of heartburn holding you back

E4

Starts to work instantly

E5

It’s also great in relieving nausea, and helps with a hangover too

How do you get it and use it?

F1

Just pour a capful (or a foil pack) into 4oz of water and within 10 seconds relief is on its way!

F2

This antacid is available through most retail drug stores, food stores, or mass merchandisers

F3

The expiration date on our product is for 5 years!

F4

With 12 child friendly handy dandy foils … makes sure your child has relief close by whether they are at home, going to a friend’s or throwing an awesome birthday party!

F5

Dissolves in your mouth …  you don’t need water to swallow it

Who uses it, and for what?

G1

Antacids can provide fast, safe relief for your pregnancy heartburn

G2

Antacids are frequently given to babies to reduce the acidity of stomach contents which are refluxed into the food pipe

G3

The same medication in different forms … for people who need to have different methods to choose from

G4

For people with occasional, mild to moderate symptoms of heartburn, antacids are often all that is needed to control the symptoms

G5

Pain, gas, indigestion … relieve the symptoms and recover from overeating by taking an over-the-counter antacid

Creating the Data for Analysis

We follow a specific pattern of data analysis, one laid down over 35 years of research. The objective of the analysis is to use OLS (ordinary least-squares) regression to deconstruct the ratings into the contribution of the individual answers, i.e., the 35 elements. In the OLS regression, the 35 elements will become the independent variables, and the ratings, or more correctly the transformed ratings, will become the dependent variables.

We follow these steps:

  1. Transform the ratings from Question #1 (interest in buying) from a 9-point scale to a 2-point scale. Ratings of 1–6 are transformed to 0. Ratings of 7–9 are transformed to 100. A small random number (<10-5) is added to the newly created binary values in order to create some small variation in the transformed ratings, so that the regression modeling does not crash.  The transformation moves us from the consideration of responses as ‘degree of interest’ to no/yes, might or might not buy, would not buy (ratings 1-6), or would buy (ratings 7-9). The transformation is done in the interest of interpretability, because the reality is that it is easier to understand the meaning of no/yes than to understand the meaning of a scale value.
  2. Transform the selection of prices from Question #2 to the actual dollar value specified by the questionnaire. Again, add a very small random number (<10-5) to ensure that the regression model does not crash in those cases when the respondent selects the same price for all vignettes evaluated.
  3. Considering the data from Question #1 (interest), run a simple OLS regression model relating the presence/absence of the 35 elements to the binary ratings. The regression model is run at the level of the individual respondent, after the ratings have been transformed. The corresponding coefficients are averaged across all the relevant respondents in the subgroup.   The equation is written as follows:

    Binary Rating (Question #1) = k0 + k1(A1) + k2(A2)… k35(G5)

  4. Following the above-described approach and considering the data from Question #2 (price in dollars and cents), run a second, simple OLS regression relating the presence/absence of the 35 elements to the price paid.  The equation does not have an additive constant, because of the ingoing assumption that no one would pay any money without knowing about the product.  The equation is written as follows:

    Price Selection (Question #2) = k1(A1) + k2(A2) … k35(G5)

Results – Total Panel

Table 2 shows the summary statistics from the total panel.

Table 2. Coefficients for the additive models showing the contribution to interest and to price, respectively.


 Total Panel (n=201)

INT

Price

Additive constant

13

E5

It’s also great in relieving nausea, and helps with a hangover too

12

1.60

E2

Has 600 mg of calcium in each dose, which helps to treat osteoporosis … two benefits in one!

11

1.67

E1

Relieves your heartburn, acid indigestion, and upset stomach without unnecessary chemicals, ingredients, or preservatives

10

1.70

D2

Available in three great tasting flavors: Smooth Lemon Creme, Smooth Mint Creme, and Smooth Cherry Crème”

9

1.55

E4

Starts to work instantly

9

1.55

D3

Tastes like a milk shake!

8

1.49

G5

Pain, gas, indigestion … relieve the symptoms and recover from overeating by taking an over-the-counter antacid

8

1.15

A1

(brand) Zantac

8

1.61

E3

Enjoy all of your favorite foods without the threat of heartburn holding you back

7

1.37

G4

For people with occasional, mild to moderate symptoms of heartburn, antacids are often all that is needed to control the symptoms

6

1.22

G1

Antacids can provide fast, safe relief for your pregnancy heartburn

6

1.06

A2

(brand) Tums

6

1.04

B3

In chewable tablets

6

1.06

G3

The same medication in different forms … for people who need to have different methods to choose from

5

1.04

B5

In capsules

4

1.22

C4

For over 125 years we provided heartburn treatment the world over

4

1.32

D5

With its crisp, clean lemon taste, it’s a pleasure to take to relieve your symptoms!

3

1.27

B1

In pill form

3

1.18

C2

All natural and aspirin free … It’s simply a great product!

3

1.46

F1

Just pour a capful (or a foil pack) into 4oz of water and within 10 seconds relief is on its way!

2

1.35

C1

Faster … more complete absorption of this effervescent antacid versus conventional tablets

2

1.35

F2

This antacid is available through most retail drug stores, food stores, or mass merchandisers

2

1.11

C3

Some antacids contain aluminum hydroxide or calcium carbonate, which can cause constipation … NOT US!

2

1.28

G2

Antacids are frequently given to babies to reduce the acidity of stomach contents which are refluxed into the food pipe

2

1.05

D4

Does not taste “pasty or chalky” like most popular antacids

2

1.30

F5

Dissolves in your mouth …  you don’t need water to swallow it

2

1.26

B2

In liquid form

0

1.12

D1

No taste betrays the fact that this is an antacid

0

1.08

A4

(brand) Alka-Seltzer

0

0.94

F3

The expiration date on our product is for 5 years!

0

1.36

B4

In fizzy tablets

0

0.89

C5

Though over-the-counter antacids are considered safe & effective … not all antacids are for every “body”

0

1.10

A3

(brand) Briosche

-1

1.08

A5

(brand) Mylanta

-1

1.14

F4

With 12 child friendly handy dandy foils … makes sure your child has relief close by whether they are at home, going to a friend’s or throwing an awesome birthday party!

-2

1.12

The basic interest in the product is 13. This means that without any additional information about the antacid, only about 13% of the respondents would assign a rating of 7-9, a strong positive rating for interest. It is the answers, the elements of the vignette, which must do the work. By itself, the antacid is not of much interest, at least to the total panel.

The strongest elements or answers to questions for the respondents are those which talk about ‘relief’ or ‘treatment.’ It is the concrete claim which is convincing. These three are the following:

It’s also great in relieving nausea, and helps with a hangover too

Has 600 mg of calcium in each dose, which helps to treat osteoporosis … two benefits in one!

Relieves your heartburn, acid indigestion, and upset stomach without unnecessary chemicals, ingredients, or preservatives

There is a generally positive relation between the price one is willing to pay and the interest in the feature. Table 2 shows these part-worth dollar values. Figure 3 shows the scatterplot for the 35 answers, with the abscissa showing the interest in the element, and the ordinate showing the price that one is willing to pay. The OLS regression enables us to deconstruct the price into the part-worth contributions of the 35 answers or elements, just as OLS regression enabled us to deconstruct the binary rating into the part-worth contributions.  As we saw for the interest coefficients, the highest prices are associated with the direct benefits from usage (relieve nausea, treats osteoporosis, relieves heartburn.) There is one more high price, that associated with brand (brand) Zantac, not so much because of the interest in brand (brand) Zantac, but more likely because of the generally higher price one pays for brand (brand) Zantac.

MIND GENOMICS-034_JPPR_F3

Figure 3. Scatterplot showing the relation between the coefficient for the price model (ordinate) and the corresponding coefficient for the interest mode (abscissa). The equation is: Price = 1.106 + 0.04(Interest). The correlation is 0.67.

Gender Differences are Minor

One of the first questions asked by researchers is whether there are gender differences. With around 100 respondents of each gender, we can answer that question easily for the case of antacids. Table 3 shows that the additive constant is slightly higher for females than for males (16 versus 9), but both are very low.  For the most part, the coefficients are similar; except for a large difference in element E2 (Has 600 mg of calcium in each dose, which helps to treat osteoporosis … two benefits in one!).  Osteoporosis affects women far more than it affects men. The coefficient for this element among women is the highest (coefficient = 15).

Table 3. Comparing male and female coefficients for the strongest performing elements.


Total

Male

Female

Base Size

201

88

113

Additive constant

13

9

16

E5

It’s also great in relieving nausea, and helps with a hangover too

12

9

14

E2

Has 600 mg of calcium in each dose, which helps to treat osteoporosis … two benefits in one!

11

5

15

E1

Relieves your heartburn, acid indigestion, and upset stomach without unnecessary chemicals, ingredients, or preservatives

10

12

10

D2

Available in three great tasting flavors: Smooth Lemon Creme, Smooth Mint Creme, and Smooth Cherry Crème”

9

9

10

D3

Tastes like a milk shake!

9

10

8

E4

Starts to work instantly

9

9

8

G5

Pain, gas, indigestion … relieve the symptoms and recover from overeating by taking an over-the-counter antacid

8

8

8

A1

(brand) Zantac

8

7

8

G4

For people with occasional, mild to moderate symptoms of heartburn, antacids are often all that is needed to control the symptoms

6

8

5

Mind-Sets

One of the fundamental features of Mind Genomics is its establishment of so-called mind-sets, i.e., groups of ideas which naturally move together. These mind-sets are discovered by clustering together respondents based upon the pattern of their coefficients, in this case the 35 coefficients from the models created when we relate the presence/absence of the 35 elements to the rating of interest.

The method used to identify these mind-sets comes from the category of approaches known as cluster analysis [19]. Clustering is a well-accepted general approach to finding similar-behaving groups of objects, in our case similar-behaving groups of ideas or people. We use clustering, combining it with both people and with ideas, respectively.  When we cluster the people, we are really looking for combinations of ideas which naturally move together, discovering those combinations using the people (our respondents) as the natural ‘carriers of the ideas.’

The notion of dividing people by the way they think is not new. Pioneer research William Wells discussed psychographics in the early 1960’s, with psychographics turning into the clustering or division of people into like-minded groups, based upon how the way they perceive the world, and how they act in their everyday lives.  Psychographics works from the general to the particular, dividing people into general groups, such as those who are ‘ecology-oriented’ versus others who are ‘consumption oriented.’  In contrast, the approach espoused here, Mind Genomics, works from the specific up to the general, taking a ‘pointillist’ approach. That is, for Mind Genomics, there are no general groups of people, but simply groups emerging from specific situations, and specific topics [20].

The method of k-means clustering used allows us to divide our 201 respondents into as many groups as we want, with the property that the variability within a group or cluster is relatively small (the patterns of the coefficients are similar), whereas the variability across the means of the coefficients from cluster to cluster is large (the patterns of the coefficients are different from cluster to cluster.)

Cluster analysis can extract from 2-201 clusters for our data. The objective of the analysis is to minimize the number of clusters (parsimony) while making the clusters easy to understand (interpretability.)  Extracting too few clusters produces hard-to-understand, unclear results. Extracting too many clusters creates a mountain of results which makes it hard to comprehend the underlying structure of the different mind-sets.

Table 4 shows the strongest performing elements (answers) after the extraction of two mind-sets, the most parsimonious solution emerging from cluster analysis. Only the elements with coefficients of 8 or higher are shown. It is clear from Table 4 that although the cluster analysis emerges with the most parsimonious of solutions, the interpretability of the solutions is low. There are simply too many different types of elements performing well in the emergent mind-sets. One could always stretch one’s definition to make sense of the disparate elements, but the objective of clustering is to simplify, not to create new groupings that are difficult to comprehend. It is the sense of ‘intuitive simplicity’ that is important in clustering, not the creation of new-to-the-world combinations of ideas.

Table 4. Strong performing elements for antacids from the two-segment solution.


Total

Mind-Set 1

Mind-Set 2

Base Size

201

80

121

Additive constant

13

10

15

Mind-Set 1 – Focus on brand

A1

(brand) Zantac

8

20

-1

E5

It’s also great in relieving nausea, and helps with a hangover too

12

13

11

A4

(brand) Alka-Seltzer

0

11

-7

A2

(brand) Tums

6

11

3

A5

(brand) Mylanta

-1

8

-8

Mind-Set 2 – Focus on flavor, and on traditional uses

D2

Available in three great tasting flavors: Smooth Lemon Creme, Smooth Mint Creme, and Smooth Cherry Crème”

9

0

16

E2

Has 600 mg of calcium in each dose, which helps to treat osteoporosis … two benefits in one!

11

7

13

E1

Relieves your heartburn, acid indigestion, and upset stomach without unnecessary chemicals, ingredients, or preservatives

10

6

13

D3

Tastes like a milk shake!

9

3

12

G5

Pain, gas, indigestion … relieve the symptoms and recover from overeating by taking an over-the-counter antacid

8

3

11

G1

Antacids can provide fast, safe relief for your pregnancy heartburn

6

0

10

E4

Starts to work instantly

9

7

9

G4

For people with occasional, mild to moderate symptoms of heartburn, antacids are often all that is needed to control the symptoms

6

3

8

B3

In chewable tablets

6

2

8

G3

The same medication in different forms … for people who need to have different methods to choose from

5

2

8

We see a somewhat more reasonable result in Table 5, when we extract three clusters or mind-sets, instead of two. The mind-sets are still not quite ‘crisp,’ comprising as they do different types of messages.

Table 5. Strong performing elements for antacids from the three-segment solution.

Total

Mind- Set 1

Mind- Set 2

Mind- Set 3

Base Size

201

32

121

48

Additive constant

13

17

15

5

Mind-Set 1 – Focus on brand, purchase, and traditional use

A1

(brand) Zantac

8

24

-1

18

A4

(brand) Alka-Seltzer

0

12

-7

11

F2

This antacid is available through most retail drug stores, food stores, or mass merchandisers

2

12

1

-1

G4

For people with occasional, mild to moderate symptoms of heartburn, antacids are often all that is needed to control the symptoms

6

9

8

-1

E2

Has 600 mg of calcium in each dose, which helps to treat osteoporosis … two benefits in one!

11

8

13

6

Mind-set 2 – Focus on flavor, and on traditional uses

D2

Available in three great tasting flavors: Smooth Lemon Creme, Smooth Mint Creme, and Smooth Cherry Crème”

9

-3

16

2

E1

Relieves your heartburn, acid indigestion, and upset stomach without unnecessary chemicals, ingredients, or preservatives

10

1

13

10

D3

Tastes like a milk shake!

9

6

12

2

E5

It’s also great in relieving nausea, and helps with a hangover too

12

7

11

16

G5

Pain, gas, indigestion … relieve the symptoms and recover from overeating by taking an over-the-counter antacid

8

5

11

2

G1

Antacids can provide fast, safe relief for your pregnancy heartburn

6

6

10

-5

E4

Starts to work instantly

9

7

9

7

B3

In chewable tablets

6

-4

8

6

G3

The same medication in different forms … for people who need to have different methods to choose from

5

7

8

-2

Mind-Set 3 – Melange of assorted messages

C4

For over 125 years we provided heartburn treatment the world over

4

-4

2

14

A2

(brand) Tums

6

7

3

14

C1

Faster … more complete absorption of this effervescent antacid versus conventional tablets

2

-2

-1

12

C2

All natural and aspirin free … It’s simply a great product!

3

0

1

11

A5

(brand) Mylanta

-1

6

-8

10

B2

In liquid form

1

-9

-1

9

D5

With its crisp, clean lemon taste, it’s a pleasure to take to relieve your symptoms!

3

-3

3

9

A3

(brand) Briosche

-1

4

-6

9

E3

Enjoy all of your favorite foods without the threat of heartburn holding you back

7

3

7

8

C5

Though over-the-counter antacids are considered safe & effective … not all antacids are for every “body”

0

-7

-2

8

B5

In capsules

4

1

4

8

When we look at four mind-sets we see a slight ‘sharpening’ of the clusters, but there is still no hint that we are going to get one cluster focusing, say, on flavor, another on brand, another on usage, and so forth (see Table 6)

Table 6. Strong performing elements for antacids from the four-segment solution.

Total

Mind- Set 1

Mind- Set 2

Mind- Set 3

Mind- Set 4

Base Size

201

32

72

48

49

Additive constant

13

17

13

5

18

Mind-Set 1 – Focus on brand, purchase, and traditional use

A1

(brand) Zantac

8

24

-4

18

3

A4

(brand) Alka-Seltzer

0

12

-3

11

-13

F2

This antacid is available through most retail drug stores, food stores, or mass merchandisers

2

12

-2

-1

5

G4

For people with occasional, mild to moderate symptoms of heartburn, antacids are often all that is needed to control the symptoms

6

9

10

-1

5

E2

Has 600 mg of calcium in each dose, which helps to treat osteoporosis … two benefits in one!

11

8

16

6

9

Mind-Set 2 – Sensory seekers, focus on issues from eating

D2

Available in three great tasting flavors: Smooth Lemon Creme, Smooth Mint Creme, and Smooth Cherry Crème”

9

-3

28

2

-3

D3

Tastes like a milk shake!

9

6

27

2

-10

G5

Pain, gas, indigestion … relieve the symptoms and recover from overeating by taking an over-the-counter antacid

8

5

19

2

0

E5

It’s also great in relieving nausea, and helps with a hangover too

12

7

15

16

6

G1

Antacids can provide fast, safe relief for your pregnancy heartburn

6

6

14

-5

5

D4

Does not taste “pasty or chalky” like most popular antacids

2

-7

13

-1

-6

E1

Relieves your heartburn, acid indigestion, and upset stomach without unnecessary chemicals, ingredients, or preservatives

10

1

12

10

15

D5

With its crisp, clean lemon taste, it’s a pleasure to take to relieve your symptoms!

3

-3

10

9

-9

E4

Starts to work instantly

9

7

10

7

9

E3

Enjoy all of your favorite foods without the threat of heartburn holding you back

7

3

10

8

4

G3

The same medication in different forms … for people who need to have different methods to choose from

5

7

8

-2

7

Mind-Set 3 – Focus on brands and forms

C4

For over 125 years we provided heartburn treatment the world over

4

-4

2

14

1

A2

(brand) Tums

6

7

0

14

7

C1

Faster … more complete absorption of this effervescent antacid versus conventional tablets

2

-2

-1

12

0

C2

All natural and aspirin free … It’s simply a great product!

3

0

-1

11

4

A5

(brand) Mylanta

-1

6

-7

10

-9

B2

In liquid form

1

-9

5

9

-9

A3

(brand) Briosche

-1

4

-9

9

-1

C5

Though over-the-counter antacids are considered safe & effective … not all antacids are for every “body”

0

-7

-5

8

2

B5

In capsules

4

1

3

8

5

Mind-Set 4 – Miscellaneous

B3

In chewable tablets

6

-4

4

6

15

F3

The expiration date on our product is for 5 years!

0

5

-2

-8

8

From our efforts to divide the respondents into different mind-sets we see that in the case of antacids we have some elements or answers which emerge quickly, such as flavor and certain kinds of benefits (e.g., due to nausea.) Nonetheless, the mind-set segmentation for antacid remains puzzling, perhaps because the product combines brand, form, and function in a way that is hard to dissociate easily. Whether this continued mixing of different types of ‘messages’ in a cluster will continue as we continue to extract an increasing number of clusters is not relevant here. What is relevant is the discovery of a new type of product, where it appears difficult to dissociate form, function, and benefit.

How Does Brand Interact with the Different Answers to Drive Price?

The systematized permutation approach used by Mind Genomics assures that set of 63 x 201 vignettes (12,663) cover a wide number of combinations, rather than 63 combinations repeated 201 times, once for each respondent [21]. The strategy of Mind Genomics is insight through directly measuring much of the stimulus space. The strategy of conventional research is insight by covering just a little of the stimulus space, doing so with reduced variability in the estimation through replication or through reducing external ‘noise’ that could affect the results.

The strategy of massively increase coverage has a benefit, namely it allows the stratification of the vignettes by brand. That is, the 12,663 vignettes can be stratified into six sets of vignettes, one set for vignettes with each brand, including a set for vignettes with no brand. The full set of respondents contributes to each stratum, so the regression analyses must be run on a group basis. That is, the power of a ‘within-subjects design’ is sacrificed, but in its place is a sense of how the same elements perform in the presence of different brands.

Table 7 shows the nature of the interaction between brand and elements. The elements are sorted from high to low, based upon the price that is estimated for the element in the absence of brand. Thus, element E2 (Has 600 mg of calcium in each dose, which helps to treat osteoporosis … two benefits in one!) has the highest value ($1.62), whereas the ‘puffery’ statement (All natural and aspirin free … It’s simply a great product!) has the lowest value ($1.31).

Table 7. Scenario analysis of dollar value ascribed to each element, when the vignettes are stratified by brand. The table suggests an interaction of brand and message. The table shows cells shaded when the dollar value exceeds $2.00.


None

(brand) Zantac

(brand) Tums

(brand) Briosche

(brand) Alka-Seltzer

(brand) Mylanta

A0

A1

A2

A3

A4

A5

E2

Has 600 mg of calcium in each dose, which helps to treat osteoporosis … two benefits in one!

1.62

2.03

1.68

2.45

2.29

2.12

E1

Relieves your heartburn, acid indigestion, and upset stomach without unnecessary chemicals, ingredients, or preservatives

1.57

1.94

2.16

2.27

1.69

1.83

D3

Tastes like a milk shake!

1.56

1.65

1.63

1.56

1.67

2.01

G4

For people with occasional, mild to moderate symptoms of heartburn, antacids are often all that is needed to control the symptoms

1.50

1.40

1.32

1.68

1.47

1.92

E5

It’s also great in relieving nausea, and helps with a hangover too

1.45

1.99

1.93

1.90

1.53

2.05

F3

The expiration date on our product is for 5 years!

1.43

1.88

1.21

1.23

1.42

1.36

E4

Starts to work instantly

1.40

2.27

1.97

1.69

1.37

1.88

G5

Pain, gas, indigestion … relieve the symptoms and recover from overeating by taking an over-the-counter antacid

1.36

1.85

1.09

1.87

1.75

1.79

F1

Just pour a capful (or a foil pack) into 4oz of water and within 10 seconds relief is on its way!

1.35

1.68

1.54

1.78

1.75

1.34

G2

Antacids are frequently given to babies to reduce the acidity of stomach contents which are refluxed into the food pipe

1.35

1.32

1.41

1.45

1.59

1.23

C1

Faster … more complete absorption of this effervescent antacid versus conventional tablets

1.32

1.95

1.38

1.71

1.78

1.49

G1

Antacids can provide fast, safe relief for your pregnancy heartburn

1.32

1.65

1.30

1.46

1.72

1.49

C2

All natural and aspirin free … It’s simply a great product!

1.31

2.19

1.95

1.81

1.63

1.99

What emerges from Table 7 is the fact that some elements, such as the strong performer, E2, with 600 mg of calcium, can dramatically increase in dollar value in the presence of brands, whereas other elements such as element G2, with less cogent messages (Antacids are frequently given to babies to reduce the acidity of stomach contents which are refluxed into the food pipe) can increase price, but far less dramatically.

The results for this analysis further suggest that brands interact with messages in ways that must be measured. It is not that a specific brand name adds approximately the same amount to each element. Rather, there is a unique pattern of interactions between brand name and element, a pattern that must be empirically uncovered.

Finding Respondents in Order to Increase the Effectiveness of Messaging

An increasingly important topic in health is to get people to comply with the prescriptions from their doctors.  The problem of compliance is certainly very important in the case of prescription medicines, but it may be important as well for medicines that should be taken daily, if only as a precautionary measure. Antacids may be in the category of medicines which are for momentary symptomatic relief but may also be taken on an ongoing basis.

How does a physician or a company find the correct messages, especially for an OTC (over the counter) product that should be taken regularly? The world of today, as of this writing (spring, 2019) is individual targeting, individual messaging. The mind-sets emerging from this study represent different ways of responding to the messages about antacid.

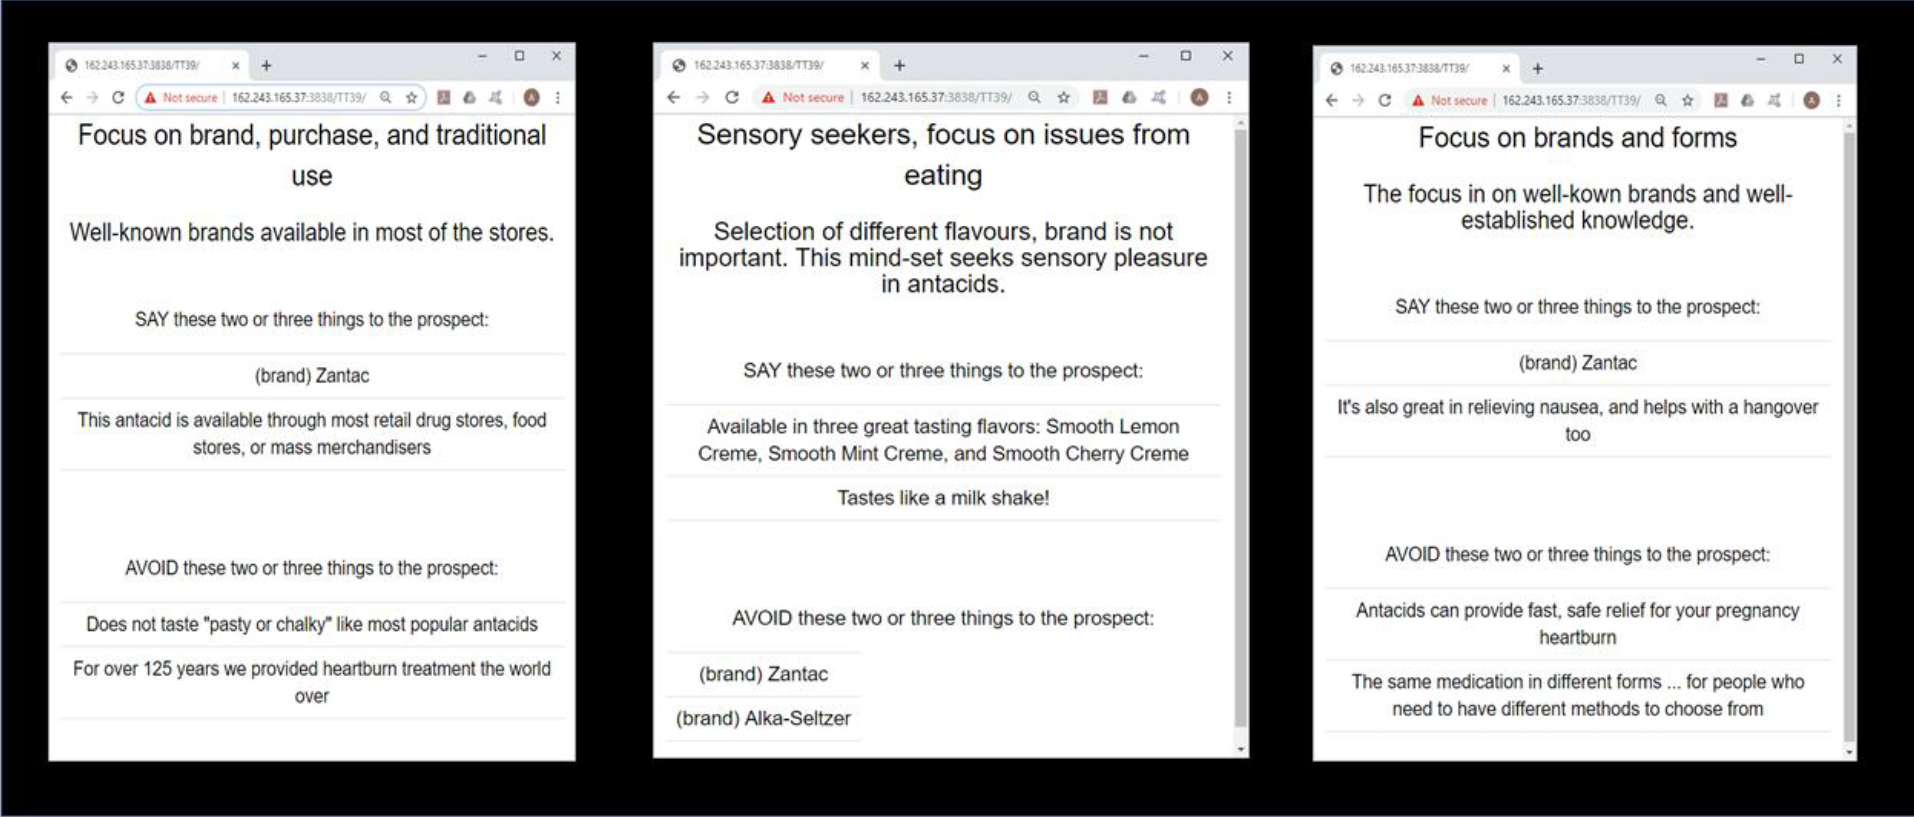
Author Gere has developed a PVI, personal viewpoint identifier, by which a person can be assigned to one of a set of mind-sets, by answering six questions. Figure 3 shows the PVI for Mind-Sets 1,2, and 3 in Table 6. Mind-Set 4 is not relevant. The focus is on assigning a person to the most likely of these three mind-sets. As of this writing (June, 2019) the PVI for this study can be found at this website: http://162.243.165.37:3838/TT39/

Discussion and Conclusion

In previous years marketers have looked at the world of OTC in terms of how to communicate the product to the world of consumers.  The introduction of market segmentation using psychographics pushed the world of OTC marketing towards consumer claims, but at the same time claims having a ‘shade’ of medical efficacy. Indeed, efficacy claims for OTC are regulated, and the marketer is limited to what can be said.

The combination of a fundamental consumer product with medical aspects brings with it the special problem of just what to say, so that the messages are allowable, understandable to the consumer, and convincing.  In ordinary Rx medicines, the communication to the consumer need not ‘convince the consumer to purchase,’ but rather convince the patient to comply.  In OTC there is the fine line between convincing to purchase and convincing to use properly.

Mind Genomics as presented in this paper provides a wealth of information about what works in terms of messaging to convince. The ability to mix brands with messages about the product and about how the product works produces a realistic set of vignettes of the type that might be encountered in the ‘real world.’ The knowledge emerging from the mind-set segmentation shows how to find the most appropriate messaging, solving some of the marketing issues.

MIND GENOMICS-034_JPPR_F4

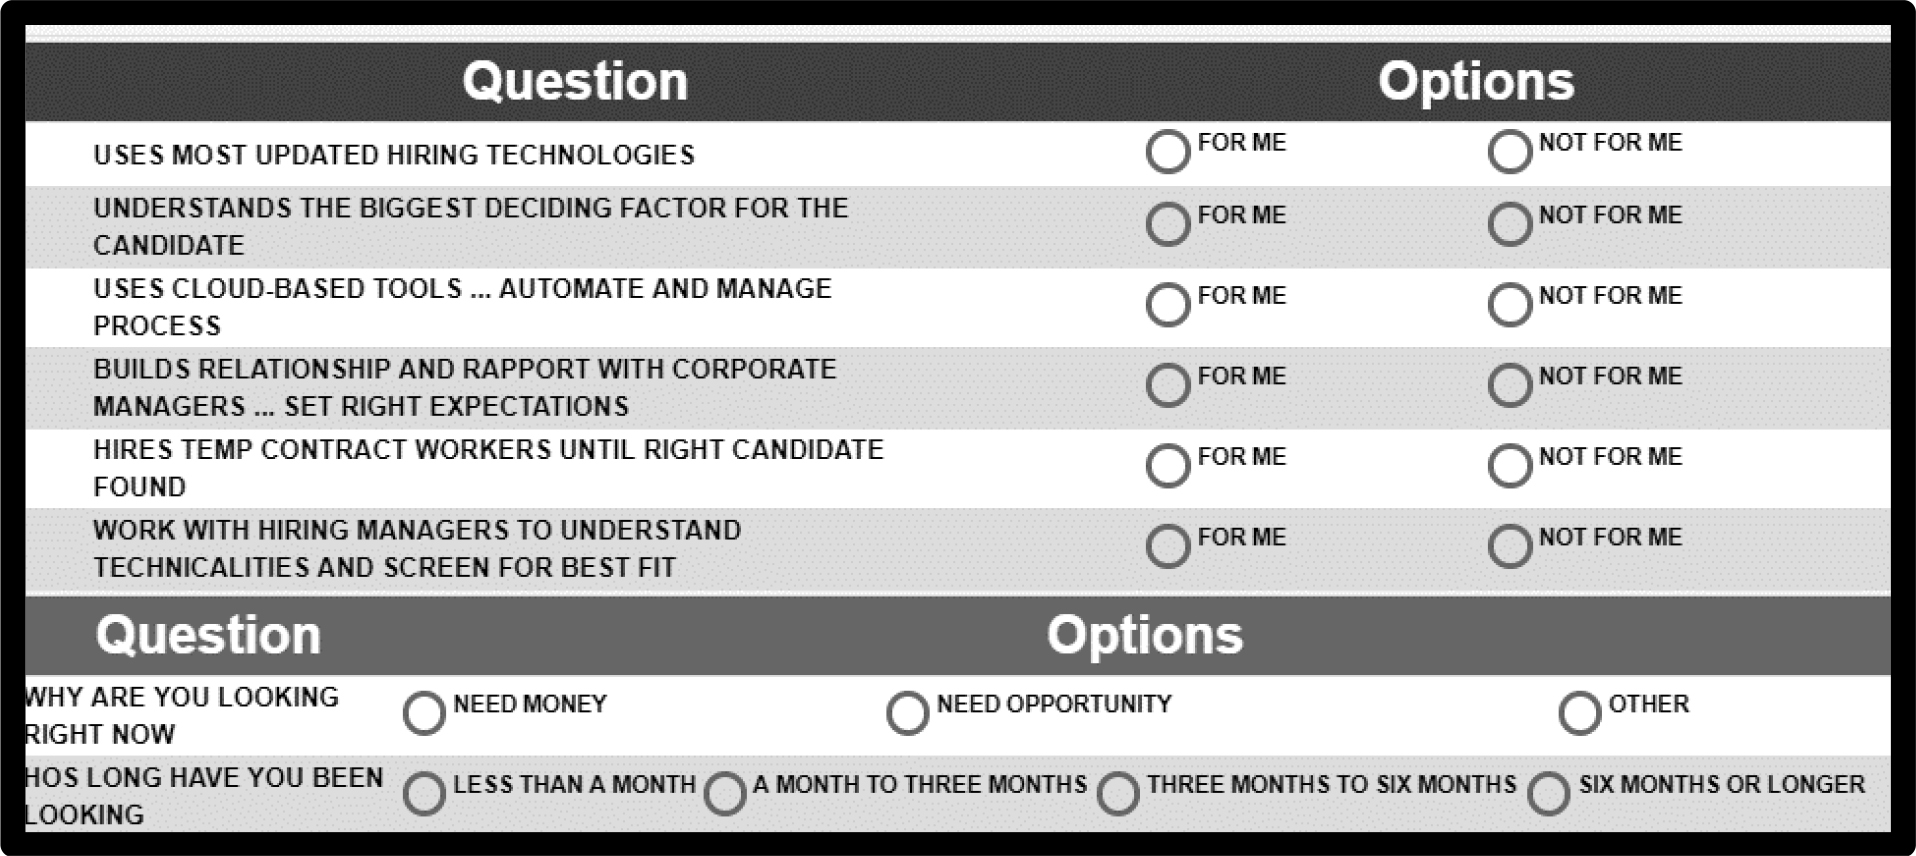
Figure 3. Welcome screen of the PVI presenting the six questions and the binary answer scales.

MIND GENOMICS-034_JPPR_F5

Figure 4. Feedback screens of the PVI. Each mind-set has its personalized feedback screen presenting the name of the mind-set along with a short description. The ‘say’ and the avoid ‘elements’ appear as part of the feedback. The use of the ‘brand’ name as part of the feedback is optional.

MIND GENOMICS-034_JPPR_F6

The novel introduction of price as a second component opens up a totally new area of research, ‘homo economicus, economic man, and the dollar value of the messaging.  The data from the total panel suggest that for the world of antacids, the interest in the product correlates quite well with the price willing to pay.  These are starting data. It will be interesting to see whether we continue to see the same high correlation between interest (emotional reaction) and price (economic decision).

Acknowledgement

Attila Gere thanks the support of the Premium Postdoctoral Researcher Program of the Hungarian Academy of Sciences.

The authors would like to acknowledge the assistance of Professor Gillie Gabay, School of Behavioral Science and Psychology, College of Management, Israel.

References

  1. Schöll I, Untersmayr E, Bakos N (2005) Antiulcer drugs promote oral sensitization and hypersensitivity to hazelnut allergens in BALB/c mice and humans. American Journal of Clinical Nutrition. 81: 154–160.
  2. Schöll I, Ackermann U, Ozdemir C (2007) Anti-ulcer treatment during pregnancy induces food allergy in mouse mothers and a Th2-bias in their offspring. Federation of Societies of Experimental Biology Journal 21: 1264–1270.
  3. Untersmayr E, Bakos N, Schöll I (2005) Anti-ulcer drugs promote IgE formation toward dietary antigens in adult patients. Federation of the Societies for Experimental Biology Journal 5: 656–858.
  4. Untersmayr E, Schöll I, Swoboda I (2003) Antacid medication inhibits digestion of dietary proteins and causes food allergy: a fish allergy model in BALB/c mice. Journal of Allergy and Clinical Immunology 112: 616–623.
  5. Pali-Schöll, Herzog R, Wallmann J, Szalai K, Brunner R, et al.  (2010) Antacids and dietary supplements with an influence on the gastric pH increase the risk for food sensitization. Clinical & Experimental Allergy 40: 1091–1098.
  6. Mueller-Lissner S, Quigley EM, Helfrich I, Schaefer E (2010) Drug treatment of chronic-intermittent abdominal cramping and pain: a multi-national survey on usage and attitudes. Alimentary pharmacology & therapeutics 32: 472–477.
  7. Faresjo A, Anastasiou F, Lionis C, Johansson S, Wallander MA, Faresjo T (2006) Health-related quality of life of irritable bowel syndrome patients in different cultural settings. Health and Quality of Life Outcomes 4: 21.
  8. Klauser AG, Schindlbeck NE, Mue;ler-Lissner SA (1990) Symptoms in gastrooesophageal reflux disease. Lancet 335: 205–208.
  9. Quigley EMM, Locke GR, Mueller-Lissner S (2006) Prevalence and management of abdominal cramping and pain: a multi-national survey. Alimentary pharmacology & therapeutics 24: 411–420.
  10. Hungin APS, Chang L, Locke GR, Dennis EH, Barghout V (2005) Irritable bowel syndrome in the United States: prevalence, symptom patterns and impact. Alimentary pharmacology & therapeutics 21: 1365–1475.
  11. Olden K, De Garmo RG, Jhingran P (2002) Patient satisfaction with alosetron for the treatment of women with diarrhea-predominant irritable bowel syndrome. American Journal of Gastroenterology 97: 3139–3146.
  12. Box GE, Hunter WG, Hunter JS (1978) Statistics for experimenters, New York, John Wiley.
  13. Moskowitz HR, Gofman A (2007) Selling blue elephants: How to make great products that people want before they even know they want them. Pearson Education.
  14. Luce RD, Tukey JW (1964) Simultaneous conjoint measurement: A new type of fundamental measurement. Journal of mathematical psychology 1: 1–27.
  15. Green PE, Rao VR (1971) Conjoint measurement for quantifying judgmental data. Journal of marketing research 8: 355–363.
  16. Green PE, Srinivasan V (1990) Conjoint analysis in marketing: new developments with implications for research and practice. The journal of marketing 54: 3–19.
  17. Moskowitz HR, Gofman A, Itty B, Katz R, Manchaiah M, Ma Z (2001) Rapid, inexpensive, actionable concept generation and optimization: the use and promise of self-authoring conjoint analysis. Food Service Technology 1: 149–167.
  18. Moskowitz HR (2012) Mind genomics’: The experimental inductive science of the ordinary, and its application to aspects of food and feeding. Physiology & Behavior 107: 606–613.
  19. Jubes R, Jain AK (1980) Clustering methodologies in exploratory data analysis. Advances in Computers 19: 113–238.
  20. Wells WD (2011) Chapter 13: Life Style and Psychographics: Definitions, Uses, and Problems. In: Wells WD (ed.), Life Style and Psychographics. Marketing Classics Press, Decatur, GA, USA.
  21. Gofman A, Moskowitz H (2010) Isomorphic permuted experimental designs and their application in conjoint analysis. Journal of Sensory Studies 25: 127–145.

The Minds and Mind-Sets of Younger and Older Investors Regarding Information: A Mind Genomics Cartography

DOI: 10.31038/ASMHS.2019354

Abstract

We present a new way to understand the mind of the investor, moving away from technical models of investing to determining in simple terms of type of information that the person feels to be important when deciding to invest. The experiment identifies the relative importance of different types and sources of information to which a person might pay attention. The approach, Mind Genomics, combines simple messages or elements to create vignettes, concepts which present several different aspects of the news and information. The respondent rates these different combinations in terms of the degree to which the combination reflects the respondent. Mind Genomics reveals three clearly different mind-sets of individuals, from those who focus on the source of the information, those who focus on the story and information, and those who focus on what their friends are saying and their own insights from mathematical models. Mind Genomics presents a new approach to understanding decision making under uncertainty, based upon the nature of the mind of the person.

Introduction

The world of investing combines a plethora of disciplines, some economic, some mathematical, most psychological, and a great deal of simple human behavior which constitutes the quotidian behavior of daily life. There is vast literature on what the person ‘might be doing,’ what type of information does the person take into account, predispositions riskiness, financial acuity, and comfort. Entire courses about Finance are devoted to the stock market, to the psychology of investing, and so forth. An excursion in the world of the psychology of investing usually begins with economics as the foundation, and the human player linked into the economics, either obeying the laws of rationality proclaimed by economic theory, or behaving as human beings filled with emotion and biases, proclaimed by the new discipline of behavioral economics. The focus may be on risk taking [1], on the nature of information [2], on the tonality of information provided by the corporation such as social conscientiousness [3], on gender [4, 5] even the susceptibility of the respondent investor to the messaging of others [6]. Yet, with all this information we do not get a sense of the mind of the investor as separate from the act of investing, although there are papers on ‘investor psychology’ [7, 8].

This study steps back from the increasingly sophisticated analysis to look at the simple presentation of investing behavior, the type of presentation that a person in psychology might find interesting, e.g., a brokerage. We look at how people respond to descriptions of investor behavior, to say ‘fits me’ or ‘doesn’t fit me.’ We are not looking for theoretical structures, but simply for a way to understand the way people think of themselves. We are acting as a psychologist, a doctor, a diagnostician of the mind, and not presenting a deep approach of what we believe are the theoretical bases for underlying behavior’.

Method

The research used the approach developed for the emerging psychological science of Mind Genomics, with origins in experimental psychology, experimental design, and marketing. The objective of Mind Genomics is to map out the decision rules for a topic, with that topic being familiar, such as eating a food, choosing a physician, selecting a product in a store, or in this study, investing in the stock market. In all of these topics, one either asks the respondent to describe her or his behavior through qualitative research (focus groups; discussions), observes the behavior, uses surveys, or following Mind Genomics, presenting the respondent with simulated situations, and observing the behavior. Mind Genomics produces a cartography of ideas or perhaps more appropriately, a listing of the relevant idea in a topic, and a metric associated with these ideas. The metric may be the linkage of the idea to oneself (fits me) or the degree to which the idea drives an expected action, such as choose to invest or choose to buy.

The origins of Mind Genomics in terms of psychology and philosophy comes from the method of induction, offered by philosopher Francis Bacon, combined with the Socratic Method for asking questions. In the simplest terms, a Mind Genomics exploration or cartography of a topic comprises the definition of the topic, the asking of four ideas, the creation of four answers for each question, the combination of these answers into vignettes, and finally obtaining respondent ratings of these combinations, followed by a statistical analysis of the ratings of combinations to show the ‘effect’ of each individual idea. The scientific history of Mind Genomics has its origins in the merger of experimental psychology to understand the ‘mind’ statistics using experimental design to create the necessary stimuli, and marketing research which focuses on the daily life of people. The necessary papers constituting the background can be found by looking at the introduction and references provided by [9, 10, 11] psychology, market research and Box [12] experimental design in the field of statistics. As described above, the Mind Genomics method may seem to be one of the many different forms of surveys, and one would not be totally wrong to conclude so. Yet, there is a difference between a survey and a Mind Genomics cartography. With a survey, one asks the respondent a question, and obtains one of several answers. The analysis shows which answers are linked with a question/ The analysis provides mind-sets as well, different patterns of answers to the same question. The analysis does not show causality, however, as might be the conclusion if one could link a response (invest) to a set of messages. In contrast to the intellectual history and applications of the survey method, Mind Genomics can be said to be an experiment. Mind Genomics creates a set of systematically created combinations with known elements in each combination, presents these combinations to the respondent, who integrates the information in each combination, and rates the combination on a scale defined by the researcher. The analysis links the response to the individual element, revealing the decision criteria of the respondent. The respondent need not explicate the criterion for decision; they emerge from the regression analysis.

For the world of investment, Mind Genomics works at the level of the conversation, not the level of technical. That is, the test elements, the stimuli, are mixed into vignettes, combinations of simple phrases describing the nature of the information that a person might obtain from everyday life. These elements are presented as key sources of information. The respondent is then instructed to read each vignette, i.e., combination of ‘information’ and say whether paying attention to that combination of information ‘describes me’ or does not describe me.

Explicating a Mind Genomics Experiment – What information is Perceived to be ‘Relevant’

A great deal of the informal talk about investment deals with the source of the information, and perhaps some surface specifics. This information can be gleaned from participating in the myriad conversations which occur in the morning in offices, at breakfasts among friends, and so forth. Mind Genomics captures this information through a Socratic process, comprising the requirement to generate four questions which tell a story, and then four answers to each question. The task is not particularly challenging but does require people to think in a critical manner. (Table 1) presents the four questions and the four answers to each question. If this study were to be a simple questionnaire, then the researcher would list the answers in some randomized order, present the 16 answers as 16 actual ‘questions’ and instruct the respondent to scale the importance of the answer in terms of how affects the respondent’s decision when thinking about an investment, whether the respondent is an actual investor or instructed to think in the way an investor would think. The important thing to keep in mind is that the survey forces an intellectual consideration of each answer ‘separately,’ and out of context. The task is difficult primarily because it is hard to think of just one idea at a time. Often the respondent attempts to give the researcher answers deemed to be politically correct and appropriate. Mind Genomics works in a different way.

Table 1. The four questions and the four answers to each question.


Question A: Where do you read the news of business that you follow?

A1

The news appears in the Wall Street Journal

A2

The news appears in Bloomberg

A3

The news appears in CNBC

A4

The news is given by your colleagues at your office


Question B: What is the major business news break of the morning?

B1

Story:   Imminent tariffs and how they will affect trade

B2

Story:  Structural problems in the vertical promise downstream trouble

B3

Story: Investors seem to be taking a big position in a vertical

B4

Story: Investors seem to be selling off more rapidly than expected


Question C: What are the details of the specific vertical that you follow?

C1

Follow the vertical because I’m heavily knowledgeable in it and feel it’s home

C2

Just got into the vertical because of recommendations from people I trust

C3

The mathematical models I use say ‘this vertical is hot’

C4

Everyone in the office is abuzz about something big happening here


Question D: What is the tonality of the story?

D1

The tone of the news is so clear that I feel I just have to do something

D2

I think I’ve discovered something really critical here that no one knows

D3

Everything I hear tells me no one knows exactly … what a chance for ME

D4

My experience tells me there’s money to be made here …  I just know it

The underlying premise is that people may not be able to tell an interviewer what they want, how they make a decision, and what they will do. At a conscious level the respondent may not even know the answers to the questions, but the social constraints of interviewing require an answer or permission to not guess. Yet, for the most part, people behave in a consistent manner, even though they might not be aware of just how consistent their behavior might be. The question is how to determine what people think when they cannot or will not reveal this in a directed questionnaire, despite their real-world consistent behavior. In the Mind Genomics experiment the researcher identifies messages which may be relevant. These are the 16 answers to the four questions in (Table 1). The role of the question is simply to set the story, and to elicit the answers. It is the answers which are relevant. Mind Genomics then combines these answers (elements) into small, easy to read vignettes, concepts, according to an experimental design. The design ensures that each of the elements appears an equal number of times in different vignettes and constitutes only part of the vignette. Other elements are present in the same vignette. The respondent’s task is to read the entire vignette as one idea and assign a rating. The respondent rates 24 such vignettes. The combination of different elements makes it impossible for the respondent to focus on one element. Rather, as in real life, the respondent must respond quickly, almost intuitively, to the combination. What emerges is a more valid response to the test stimuli, the vignettes. As will be explicated below, the experimental design allows the researcher to deconstruct the response to the mixture, the vignette, into the separate contributions of the 16 elements.

Creating the Test Combinations (Vignettes) by Experimental Design

People are accustomed to reading paragraphs or collections of disparate information, and making a decision on the combination. It is intellectual challenging when reading a combination to assign the relative importance of each piece of information in the combination, although when pressed to do so, the respondent can probably come up with a criterion. There are a number of methods which try to estimate the likely performance of a combination by the evaluation of single elements (self-explication of components), or the choice between pairs of elements [13]. These approaches are cognitively challenging, making the respondent move beyond sampling and rapidly evaluating the combination, but rather focus on the components of a mixture, an atypical situation.

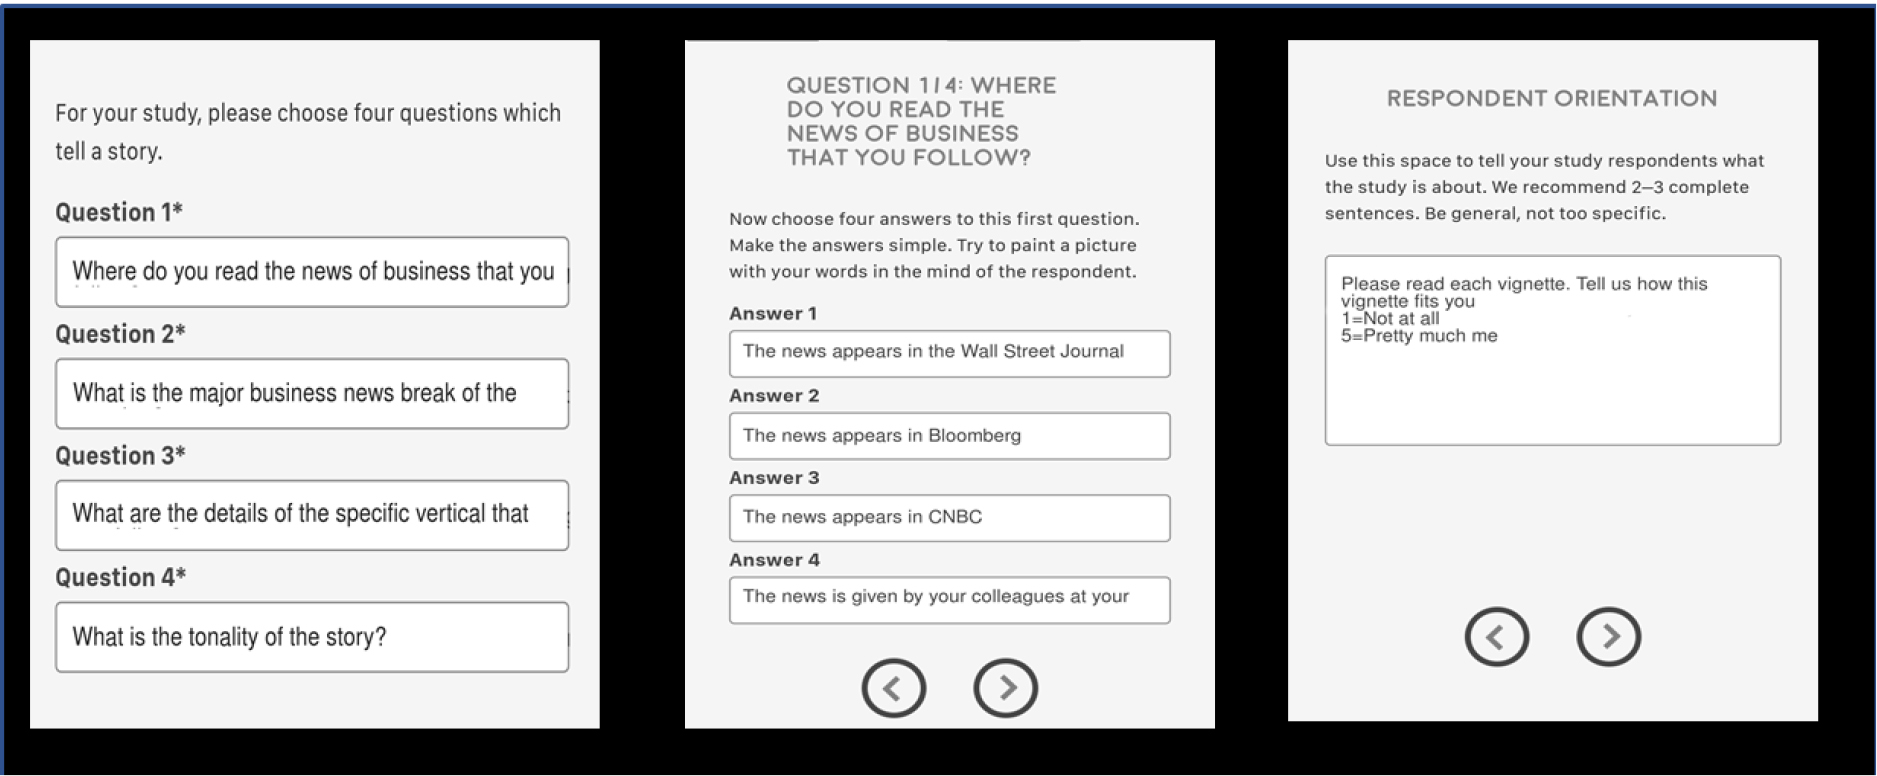
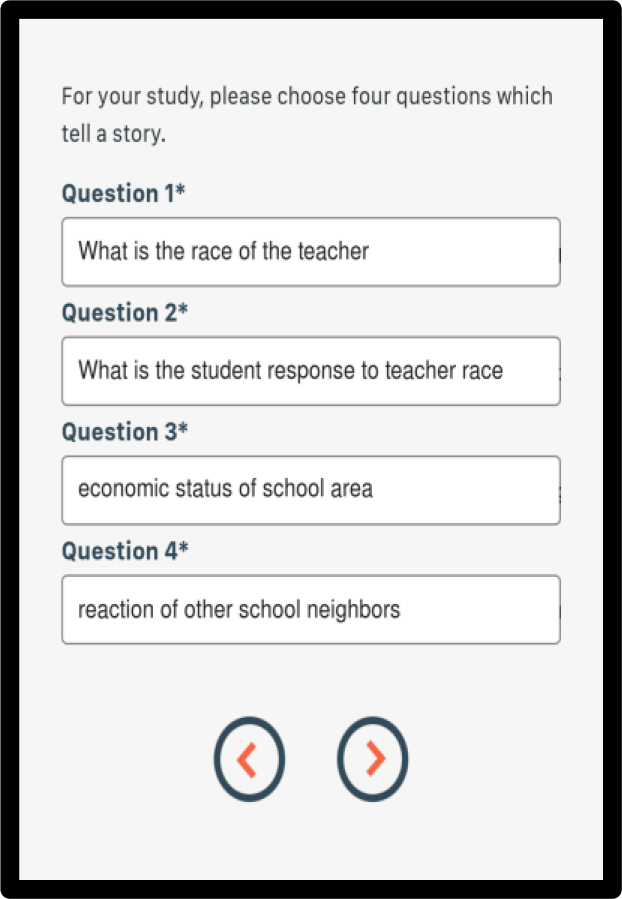
In the Mind Genomics system, the 16 answers or elements are combined into a set of 24 vignettes, combinations, with the experimental design valid for a single individual. That is, all of the 16 elements are statistically independent of each other, each vignette comprises at most only one element or answer from any question, and there are vignettes in which answers from some questions are missing. Each vignette comprises 2–4 elements. This approach, the within-subjects design, is very powerful because it allows the data to be analyzed at the level of the individual respondent, a property very critical for mind-set segmentation. One other feature deserves mention. When only one set of 24 vignettes were to be tested, the researcher would have to be very careful about selecting the specific vignettes. Rather than forcing a lot of thinking about just what combinations to develop by the experimental design, Mind Genomics makes use of a patented technology, permuted experimental design [14] to systematically vary the specific elements that are combined in the vignettes. The mathematics of the design are maintained, but the combinations different for each person. Thus, it becomes possible to explore a topic area quickly, reduce most of the intellectual bias, and uncover the ‘mind of the respondent’. The set-up of the study has been automated (www.BimiLeap.com). The app allows the researcher to type in the questions, then the answers, and a rating scale. Afterwards, the researcher selects the panel, generally using an on-line panel provider. (Figure 1) shows the set of set up screens that the researcher would use to create the experiment. After the researcher has set up the study, the researcher launches the study. Usually the on-line panel providers generate the necessary, qualified respondents in about 2–3 hours. The data are analyzed automatically to generate summary models for total panel, gender, age, a third question (type of information), and emergent mind-sets (discussed later on.)

MIND GENOMICS-033_ASMHS_F1

Figure 1. The set-up of the study in the BimiLeap app prior to the experiment. The left panel shows the four questions, the middle panel shows the four answers to the first question, and the right panel shows the respondent orientation and scale.

The analytic approach for each subgroup (e.g., total panel, gender, age, third question, mind-set) is the same, comprising the assemblage of all the data for the relevant respondents for that subgroup (24 records for each respondent), and a linear regression model relating the presence/absence of the elements in a vignette (code 0=absent, 1=present) to the rating (1–5), or more generally to a binary transformation of the rating (1–3 ® 0 ; 4–5 ® 100). The binary transformation reflects legacy from consumer research and management needs. Consumer researchers often use category or Likert Scales, anchored at both ends (e.g., our 1–5 scale). Managers often prefer data presented in binary form, no/yes, no go/go, reject/accept, etc.

Building Models to Show How The Elements Drive The Binary Response (Top2Box) and response time (RT)

The experimental design created for each individual respondent produce 1200 individual vignettes or combinations of elements, most of which differ from each other. Thus, the Mind Genomics experiment covers a wide range of alternative combinations of elements. The experimental design created for each indivual, based as it is on a ‘kernel’ experimental design permuted for the respondents, ensures that the set of 16 elements are statistically independent of each other.

The data matrix comprises 1200 rows 24 rows for each respondent. Each respondent has a unique identification number, and a set of 16 columns to store the the independent variables. The independent variables, the 16 answers or elements, are coded 0 or 1, respectively. A 0 represents the fact that the element is absent from the vignette, whereas a 1 represents the fact that the element is present in the vignette. The three dependent variables are the original rating on a 5-point scale, the binary equivalent (Top2Box, 0/100) emerging from a recoding of the ratings, and finally the number of seconds showing the ‘response time’ (or reaction time), defined as the time between the appearance of the vignette and the respondent rating. (Table 2) shows part of the data set that will be used in the regression modeling (Table 2) shows the data structure. The experimental design comprises simply the listing of the different elements. The design must be translated into a series of 0’s (element absent from the vignette), and 1’s (the element present in the vignette.) The statistical modeling, OLS (ordinary least-squares) regression analysis, assigns a weight to each of the 16 predictor variables (A1-D4) so that by knowing what elements are in the vignette one can estimate the likely rating by simply summing up the coefficient [12].

Table 2. Structure of the first eight vignettes, and the ratings.

Respondent self-description from the self-profiling classification at the start of the experiment
Investor Type – Active, Reads the news Gender = Male

Test Order

1

2

3

4

5

6

7

8

Element (Answer)


Answer to Question A

A1

A1

A4

A2

A2

A3

A4

A4

Answer to Question B

B4

B3

B4


B3

B2

B3

B1

Answer to Question C

C1

 Absent

C1

C4

C2

C2

C4

 Absent

Answer to Question D

 Absent

D1

 Absent

D2

D4

D3

D3

D4

Binary expansion of design


A1

1

1

0

0

0

0

0

0

A2

0

0

0

1

1

0

0

0

A3

0

0

0

0

0

1

0

0

A4

0

0

1

0

0

0

1

1

B1

0

0

0

0

0

0

0

1

B2

0

0

0

0

0

1

0

0

B3

0

1

0

0

1

0

1

0

B4

1

0

1

0

0

0

0

0

C1

1

0

1

0

0

0

0

0

C2

0

0

0

0

1

1

0

0

C3

0

0

0

0

0

0

0

0

C4

0

0

0

1

0

0

1

0

D1

0

1

0

0

0

0

0

0

D2

0

0

0

1

0

0

0

0

D3

0

0

0

0

0

1

1

0

D4

0

0

0

0

1

0

0

1

Dependent variables


Rating

3

4

4

1

3

3

4

1

Top2Box

0

100

100

0

0

0

100

0

Response time

9.0

3.9

2.4

3.9

2.6

1.8

2.4

2.9

The actual study was run in the middle of August, 2019, using an on-line panel provide, Luc.id. The actual process of developing the study, running the respondents, and then analyzing the data, took approximately three hours, from start to finish, using the above-mentioned program www.BimiLeap.com. The program itself guides the user, from the start (specifying the topic, posing the questions, requiring four answers to each question) on through instructing the respondents, asking other questions beyond age and gender, and then requiring the researcher to write a short paragraph of WHY the study is being done. The latter requirement, a short paragraph about WHY, comes from the major use of the BimiLeap program to ‘teach critical thinking,’ and not just to be a survey tool. A great deal of consumer research can be made tortuous by forcing the researcher to create a questionnaire, call a panel service, and run the study. The approach of BimiLeap and other modern platforms is to dispense with the back and forth process of dealing directly with an on-line field service. The approach requires the research to specify the specifics of the respondent, assuming they are not overly specific, and then launch the study with a credit card. Everything else is automated. The process returns with a report in PowerPoint® and well as the raw data and relevant tabulations in Excel®. This automated set-up allows the entire process to be completed in 2–3 hours, with the set up of the study, e.g., thinking of the questions and answers, the critical thinking, coming to the fore as the rate-limiting step.

Modeling

For the OLS regression we use ALL the data from all relevant respondents in a defined subgroup. For example, with 50 respondents, and with 24 vignettes for each respondent the relevant data for the total panel is 50×24 or 1200 rows of data, also called ‘observations.’ The independent variables are the 16 elements, coded 1 or 0. The dependent variable is the so-called Top2Box (a term from consumer research). The Top2Box becomes 100 (plus a small random number) when the original rating is 4 or 5. The Top2Box becomes 0 (plus a small random number) when the original rating is 1,2 or 3, respedtively. In a second analysis, looking at response time as the dependent variable, the same structure of analysis holds, except that the dependent variable is simply the response time from the appearance of the vignette on the respondent’s screen until the rating. The response time is recorded to the nearest 10th of a second.

We inteprret the coefficient as the, probability that the respondent will assign a rating of 4–5 to a vignette when the eleent appears vignette. When we switch to the response time, the we intepret the coefficient as the number of seconds neede to process the element, i.e., to read it and move on. A benefit of the modeling is its ability to deconstruct the compound stimulus, the vignette, into the part-worth contributions of the individual elements. Researchers often believe that this decomposition can be done easily and with only a bit of attention. A strategy occasionally used is to circle the relevant elements if a vignette. This ‘strategu of highlight what seems to be important’ seems at first quite reasonable, but in light of the power of the regression analysis enabled by the experimental design, such manual circling appears to be inefficient, primitive, and unable to deal at all with response time and processing speed. (Table 3) presents the output of the regression analysis. Most regression packages present the regression results in the same fashion. The elements are presented at the left of the table, with abbreviation first, and then the text of the element. The elements are presented in descending order of magnitude, as shown by the column marked ‘Coeff.’

Table 3. Statistical output of the regression model for the Total Panel. The dependent variable is the binary transformation ‘describes me.’  The independent variables are the 16 answers or elements in the vignettes.


 Dep

Coeff

SE

t-stat

p-Val

C1

Follow the vertical because I’m heavily knowledgeable in it and feel it’s home

11.06

3.706

2.98

0.00

B3

Story: Investors seem to be taking a big position in a vertical

11.01

3.694

2.98

0.00

A2

The news appears in Bloomberg

10.21

3.757

2.72

0.01

A4

The news is given by your colleagues at your office

10.12

3.787

2.67

0.01

A3

The news appears in CNBC

9.87

3.757

2.63

0.01

D1

The tone of the news is so clear that I feel I just have to do something

9.09

3.739

2.43

0.02

A1

The news appears in the Wall Street Journal

8.83

3.712

2.38

0.02

B4

Story: Investors seem to be selling off more rapidly than expected

8.44

3.673

2.30

0.02

C2

Just got into the vertical because of recommendations from people I trust

8.00

3.739

2.14

0.03

B1

Story:   Imminent tariffs and how they will affect trade

7.75

3.654

2.12

0.03

D2

I think I’ve discovered something really critical here that no one knows

6.79

3.800

1.79

0.07

C4

Everyone in the office is abuzz about something big happening here

6.16

3.75

1.64

0.10

D4

My experience tells me there’s money to be made here …  I just know it

4.15

3.744

1.00

0.27

B2

Story:  Structural problems in the vertical promise downstream trouble

3.49

3.710

0.94

0.35

C3

The mathematical models I use say ‘this vertical is hot’

3.24

3.685

0.88

0.38

D3

Everything I hear tells me no one knows exactly … what a chance for ME

2.75

3.795

0.73

0.47

The regression model estimates the coefficients, k1-k16, for the simple linear equation:

Top2 or Number of Seconds = k1(A1) + k2(A2) … k16(D4)

For the Top2Box model, the coefficient (coeff), shows the expected number of binary points that would be added to a vignette if the element were inserted into the vignette. This can be interpreted as the incremental percent of respondents who would rate the vignette as 4 or 5 when the element is inserted into the vignette.

The element most describing the respondents in their own opinion, at least on average, is:

C1: Follow the vertical because I’m heavily knowledgeable in it and feel it’s home (coefficient of 11.06.)

The element least describing the respondents in their own opinion, at least on average, is:

D3 Everything I hear tells me no one knows exactly … what a chance for ME (coefficient of 2.75)

Next to the coeff (coefficient) is the column label SE. SE is the standard error of the coefficient, or the expected variability of the coefficient if the study were repeated. The coefficient is an estimated parameter for real data. As such, the variation in the data upon repeated studies may be expected to affect the estimated value of the coefficient. The lower the variation in the coefficient, i.e., the lower the value of SE, the more likely it is that we have value of the coefficient which is not truly 0. The likelihood of having a coefficient truly different from 0 is given by the t-stat (t-statistic, a measure of the signal/noise ratio), and the p-value, the probability that the t-statistic is really 0. We should look at all of the coefficients above 0.11 as being truly different from 0. Our data suggests most of the elements are really truly different from 0, i.e., probably are somewhat truly descriptive of the respondents as a group. The only elements which are probably 0 are these four, with coefficients lower than 5.

D4  My experience tells me there’s money to be made here … I just know it4.15

B2   Story: Structural problems in the vertical promise downstream trouble 3.49

C3  The mathematical models I use say ‘this vertical is hot’ 3.24

D3  Everything I hear tells me no one knows exactly … what a chance for Me 2.75

The user interpretation of the coefficients is different from the statistical interpretation. The coefficient shows the linkage between the person and the element. High coefficients mean that there is a strong linkage. In percentage terms, where 0 is no linkage and 100 is perfect linkages, i.e., 0=does not describe me … 100=describes me, the coefficient gives the additive percent towards the complete linkage. The elements are additive. That is, one can put up to four elements together, when they are answers to different questions and estimate the total degree of linkage.

The regression model does not have an additive constant for this study. The rationale for omitting the additive constant, i.e., forcing the regression model through 0, is that in the absence of elements there is no meaning to the additive constant. In contrast, were the rating scale to be ‘likelihood to purchase,’ and a 1–5 scale transformed in the same way, the additive constant would be meaningful. It would be the likely interest in purchasing the product or service in the absence of any information. That likelihood value is both relevant and truly informative.

Results From the Regression Analysis

The regression modeling was done with a variety of subgroups, as the respondents defined themselves. (Table 4) shows us the coefficients from the total panel, from genders, and from the two ages. It is clear from (Table 4) that many numbers are linked to the way the respondent feels about herself or himself. These are the elements which generate coefficients of 10 or higher, twice the standard error, and thus a coefficient whose t-statistic approaches or exceeding 2.0.

Table 4. Performance of the elements by key subgroups, defined by who the respondents say they ARE


Subgroups self-defined by who the respondent IS
Top 2 – Fits Me

Total

Male

Female

Age < 60

Age 60+

B3

Story: Investors seem to be taking a big position in a vertical

10

11

10

10

12

A2

The news appears in Bloomberg

11

16

10

13

8

A3

The news appears in CNBC

10

24

5

6

12

B4

Story: Investors seem to be selling off more rapidly than expected

11

21

7

6

9

B1

Story:   Imminent tariffs and how they will affect trade

10

17

7

8

7

C1

Follow the vertical because I’m heavily knowledgeable in it and feel it’s home

8

18

3

10

12

A1

The news appears in the Wall Street Journal

8

14

5

2

14

A4

The news is given by your colleagues at your office

8

7

9

11

10

C2

Just got into the vertical because of recommendations from people I trust

9

15

7

8

8

B2

Story:  Structural problems in the vertical promise downstream trouble

9

5

10

1

5

C4

Everyone in the office is abuzz about something big happening here

6

10

5

7

5

D2

I think I’ve discovered something really critical here that no one knows

3

2

4

2

12

D1

The tone of the news is so clear that I feel I just have to do something

3

-5

6

7

11

C3

The mathematical models I use say ‘this vertical is hot’

7

5

7

0

7

D3

Everything I hear tells me no one knows exactly … what a chance for ME

4

5

4

-4

8

D4

My experience tells me there’s money to be made here …  I just know it

3

8

2

-2

9

One way to look at these results might be to sort the elements by the number of subgroups which find the element to be important (i.e., the coefficient of 10 or higher). Whe we do this sort, we find that there are just two extraordinarily strong elements, elements whose strong performance is not surprising.

B3       Story: Investors seem to be taking a big position in a vertical

A2       The news appears in Bloomberg

Despite the presence of strong performing elements in each group, there is no easy story to be gleaned from the data. The data are statistically strong but suggest that either there is no pattern, or more likely, the pattern has little to do with who the respondents ARE in a geo-demographic sense. When we look at the respondents by their self-described attitudes towards investing, the picture becomes much clearer, as (Table 5) shows. Those who do not like investing feel that they are best described by elements which convey a ‘general feeling.’ Those who invest with advice feel they are best described by messages about the source of the information and described by their own research. Those who are active investors feel that they are described both by the source and by the ‘story.’

Table 5. Performance of the elements by key subgroups, defined by how the respondent describes her or his attitude towards investing


Subgroups self-defined by how the respondent defines her/his investing behavior
Top 2 – Fits ME

Do not like investing

Invest with advice

Active investor

D4

My experience tells me there’s money to be made here …  I just know it

14

0

7

D1

The tone of the news is so clear that I feel I just have to do something

13

3

11

A3

The news appears in CNBC

12

11

9

D3

Everything I hear tells me no one knows exactly … what a chance for ME

11

-2

5

A1

The news appears in the Wall Street Journal

6

13

6

C1

Follow the vertical because I’m heavily knowledgeable in it and feel it’s home

-6

12

15

A2

The news appears in Bloomberg

0

10

12

B3

Story: Investors seem to be taking a big position in a vertical

-1

0

28

B4

Story: Investors seem to be selling off more rapidly than expected

8

-5

23

B1

Story:   Imminent tariffs and how they will affect trade

-4

3

18

A4

The news is given by your colleagues at your office

7

7

11

B2

Story:  Structural problems in the vertical promise downstream trouble

-3

0

11

C2

Just got into the vertical because of recommendations from people I trust

0

7

10

D2

I think I’ve discovered something really critical here that no one knows

8

3

9

C4

Everyone in the office is abuzz about something big happening here

3

4

7

C3

The mathematical models I use say ‘this vertical is hot’

-5

4

5

Mind Sets

One of the tenets of the emerging psychological science of Mind Genomics is that for each topic of everyday experience (e.g., shopping, consulting a doctor, etc.) or even thinking (e.g., about issues of ethics and morality) there exist small, specific domains of the topic. Rather than the grand top of investing, for example, the domain might be limited to the ‘nature of the information to which I am exposed.’ That topic is the subject of this Mind Genomics cartography. Mind Genomics posits that in every domain of the topic, small or large, there may be several different patterns of information to which an individual might respond, rather than only one pattern. That is, individuals differ from each other in the nature of the information to which they respond, the messages which ‘inform their decision.’ Beyond simply positing these different groups of individuals, Mind Genomics provides the computational machinery both to identify these different groups, so-called Mind-Sets for a topic and then a way to assign any new person to one of the Mind-Sets, the method being called the PVI, the personal viewpoint identifier. Discovering Mind-Sets is a statistical process, objective in nature for its computations, but subjective in terms of decision-making about the nature of the revealed Mind-Sets. The approach is quite straightforward, following a statistical path comprising four steps:

Step 1 Select the basic data from which the Mind-Sets will be uncovered

The basic data comprises the 16 coefficients for each respondent. Each respondent generates 16 coefficients from the regression model relating the transformed binary response to the presence/absence of the element.

Step 2 Estimate the ‘distance’ between each pair of respondents

The distance may be defined in any number of ways, ranging from the Minkowski R metric (e.g., the mean squared differences along each of the 16 pairs of coefficients, for R = 2, the familiar Euclidean measure of distance), to the Pearson distance, a metric which looks at the similarity of patterns. The Pearson distance between any two objects e.g., people, is value (1-R), where R is the Pearson correlation between the two respondents, based upon the values of the 16 coefficients. The Pearson R has maximum of +1 when two variables are perfectly related to each other in a linear fashion, and thus show the same pattern. The distance is thus 0, because the two patterns are perfectly related. The value (1-R) is 0, when R = 1. The Pearson R has a minimum of -1 when two patterns are perfectly inversely related to each other. The distance is thus 2 (1- – 1 = 2).

Step 3 Place the respondents into either two or three mutually exclusive and exhaustive groups

This is called clustering [15] The objective of clustering is to minimize the distances within a Clustering this requires computation. The composition of the clusters, the emergent mind-sets, will vary somewhat depending upon the way the ‘distance’ is defined. This should not be worrisome since the clustering is simply meant to be a heuristic, to divide the respondents in a way that may be useful for other analyses.

Step 4 Interpret the clusters or mind-sets

The mind-sets, mutually exclusive and exhaustive, should ‘make sense’ (interpretable), and should be as few as possible (parsimonious.)

(Table 6) suggests three different mind-sets, as follows

Table 6. Performance of the elements by three mind-sets, subgroups, defined by similar patterns in the way people describe their attitudes towards investing. Mind-Set is abbreviated MS


Mind-Sets (MS) emerging from similar patterns of coefficients Top 2 – Fits ME

MS1

MS2

MS3


Mind-Set 1– Responds to where the news appears


A1

The news appears in the Wall Street Journal

19

4

2

A2

The news appears in Bloomberg

18

2

15

A3

The news appears in CNBC

17

13

1

A4

The news is given by your colleagues at your office

15

-5

18


Mind-Set 2 – Responds to the story


B2

Story:  Structural problems in the vertical promise downstream trouble

-2

18

7

B3

Story: Investors seem to be taking a big position in a vertical

9

17

1

B1

Story:   Imminent tariffs and how they will affect trade

10

14

4

B4

Story: Investors seem to be selling off more rapidly than expected

9

13

10

C1

Follow the vertical because I’m heavily knowledgeable in it and feel it’s home

7

12

5


Mind-Set 3 Responds to recommendations of friends & math models


C2

Just got into the vertical because of recommendations from people i trust

8

3

17

C3

The mathematical models i use say ‘this vertical is hot’

1

5

14

C4

Everyone in the office is abuzz about something big happening here

0

6

11


Does not seem important for any mind-set


D1

The tone of the news is so clear that i feel i just have to do something

2

-1

9

D2

I think I’ve discovered something really critical here that no one knows

9

-7

8

D3

Everything I hear tells me no one knows exactly … what a chance for ME

9

0

6

D4

My experience tells me there’s money to be made here.. i just know it

-1

8

4

Mind-Set 1 – Responds to where the news appears,

The news appears in the Wall Street Journal

The news appears in Bloomberg

Mind-Set 2– Responds to the story

Story: Structural problems in the vertical promise downstream trouble

Story: Investors seem to be taking a big position in a vertical

Mind-Set 3 Responds to recommendations of friends and appears to be intuition-driven

Just got into the vertical because of recommendations from people I trust

Finding the Mind-Sets In the Population

Respondents who differ in their attitudes in terms of the nature of information to which they respond may or may not realize that there are different groups, different mind-sets. (Tables 5, 6) show clear differences among the groups in terms of their responses to different types of information, which covary with the group to which they belong. Yet, if one subscribes to the belief that people want to hear messages which resonate with them, it might be a better strategy to work with mind-sets of investors, rather than relying upon how the investor defines herself or himself. What might happen if one were to know at the start of the conversation the mind-set to which a prospect belongs? One could then be more comfortable choosing the messages because many of these messages linked with the mind-sets show very high coefficients, 15 or higher. (Table 7) shows the distribution of the three mind-sets by total panel, gender, age group, and self-stated preferences for the type of information. There is no clear pattern.

Table 7. Distribution of the respondents by total and the three mind-sets.


Total

MS1

MS2

MS3


Where

Story

Friends & Tech

Total

50

14

19

17


Female

36

8

12

16

Male

14

6

7

1


Age < 60

22

8

7

7

Age 60+

28

6

12

10


Don’t like investing

9

2

2

5

Invest with advice

19

5

10

4

Active investor, study the news

17

5

5

7

Use technology, models

5

2

2

1

An alternative way uses an algorithm known as the PVI, the personal viewpoint identifier. The PVI asks the respond six questions derived from the experiment, and from the pattern of answers the PVI assigns the new person to the most likely mind-set. The PVI algorithm uses the coefficients to identify which combination of elements, posed as questions and answered with a 2-point scale (Not ME: Me) (Figure 2) shows the PVI questionnaire as presented to the respondent. The order of questions varies across the respondents. The PVI also allows the researcher to ask specialty questions as well, in order to gain more knowledge. The PVI takes about a minute to complete

MIND GENOMICS-033_ASMHS_F2

Figure 2. The PVI (personal viewpoint identifier) for the investing experiment.

Response Time and Engagement

Experimental psychology began with the systematic study of reaction time, the time between the presentation of a stimulus (e.g., our vignette), and the time when the respondent assigned a rating, or simply noted that she or he ‘detected’ the stimulus. There is the abiding, probably correct, belief that longer reaction times correspond to ‘more things going on in the mind.’ Shorter reaction times, therefore, suggest fewer things going on in the mind, or the fact that the respond ‘sees’ the message and discards it without consideration [16]. The Mind Genomics experiment itself lasts 3–4 minutes in the 5-minute interview. During that time the respondent is presented with 24 vignettes, and required to read the vignette (more likely glancing through it, grazing for information), and then responds. There is little time to read the entire vignette. The reaction must be almost automatic, namely see, rate, see, rate, etc.

(Table 8) presents the estimated response times for the 16 elements, by key self-defined group (gender, age, respectively). The respondents answer quickly, and are not at all aware of how much time they spend on each element. The OLS regression estimates the likely number of seconds required for each element to be read and processed. Those elements which generate coefficients of 2.0 (two seconds or longer) are shown in in shaded cells, and bold type. These are the elements to which the respondent attends, whether the attention reflects an emotional reaction, or an attempt to comprehend the meaning of the element. (Table 8) suggests that older respondents typically take longer to process then information than do younger respondents. Those over 60 show higher coefficients for response time than those respondents under 60. There is also the suggestion that the genders differ in what engages them. Female’s attention is engaged by other people (The news is given by your colleagues at your office), whereas male’s attention is engaged by technology (The mathematical models I use say ‘this vertical is hot’).

Table 8. Response time in seconds for each element. Data for total panel, gender, and age, respectively.


Estimated response times in seconds for each element by the total panel, gender, and age

Total

Male

Female

LT 60

GT 60

D1

The tone of the news is so clear that I feel I just have to do something

1.7

2.1

1.5

1.4

1.7

D2

I think I’ve discovered something really critical here that no one knows

2.3

2.0

2.4

1.4

1.2

C2

Just got into the vertical because of recommendations from people I trust

1.6

2.0

1.4

1.3

1.5

C3

The mathematical models I use say ‘this vertical is hot’

1.3

2.0

1.0

1.6

2.0

A4

The news is given by your colleagues at your office

2.0

1.3

2.4

1.6

1.7

A1

The news appears in the Wall Street Journal

2.1

1.8

2.2

1.5

1.7

A2

The news appears in Bloomberg

2.0

1.4

2.2

1.4

1.6

B2

Story:  Structural problems in the vertical promise downstream trouble

1.6

1.9

1.5

2.3

2.2

B4

Story: Investors seem to be selling off more rapidly than expected

1.7

1.8

1.7

2.1

2.0

B1

Story:   Imminent tariffs and how they will affect trade

1.6

1.6

1.6

2.0

2.1

B3

Story: Investors seem to be taking a big position in a vertical

1.6

1.7

1.6

1.9

2.1

A3

The news appears in CNBC

1.5

1.4

1.5

1.9

1.4

C4

Everyone in the office is abuzz about something big happening here

1.8

1.5

1.9

1.7

1.8

C1

Follow the vertical because I’m heavily knowledgeable in it and feel it’s home

1.4

1.4

1.5

1.7

1.7

D3

Everything I hear tells me no one knows exactly … what a chance for ME

1.6

1.8

1.5

1.5

1.9

D4

My experience tells me there’s money to be made here …  I just know it

1.8

1.7

1.9

1.3

1.8

When we move to self-defined groups in terms of how one invests (e.g., invests with advice, etc.), (Table 9) suggests clearly different patterns of engagement. Those who say that they do not like investment pay a great deal of attention to the story. Those who say that they invest with advice also pay attention to the elements dealing with the story, as well as pay attention to ‘clues’ about performance, typically given by others. Those who say that they are active investors pay attention to one element, ‘Story: Investors seem to be taking a big position in a vertical.’ When we move to the mind-sets defined by the pattern of coefficients, we see that there are differences as well, albeit not the strong differences that we saw for those who self-define themselves in different ways in terms of attitudes toward investing.

Table 9. Response time in seconds for each element. Data shown for three different self-descriptions of the respondent’s attitude toward investing.


Subgroups self-defined by how the respondent defines her/his investing behavior Response Time

Do not like investing

Invest with advice

Active investor

B4

Story: Investors seem to be selling off more rapidly than expected

2.9

2.4

1.6

B1

Story:   Imminent tariffs and how they will affect trade

2.7

2.2

1.8

B2

Story:  Structural problems in the vertical promise downstream trouble

2.3

2.5

1.9

B3

Story: Investors seem to be taking a big position in a vertical

2.0

2.0

2.2

C3

The mathematical models I use say ‘this vertical is hot’

0.6

2.5

1.5

C1

Follow the vertical because I’m heavily knowledgeable in it and feel it’s home

0.5

2.5

1.5

C4

Everyone in the office is abuzz about something big happening here

1.6

2.1

1.6

C2

Just got into the vertical because of recommendations from people I trust

0.6

2.0

1.1

A4

The news is given by your colleagues at your office

1.3

1.5

1.9

D3

Everything I hear tells me no one knows exactly … what a chance for ME

1.6

1.6

1.8

A1

The news appears in the Wall Street Journal

1.8

1.4

1.7

A3

The news appears in CNBC

1.8

1.7

1.5

D1

The tone of the news is so clear that I feel I just have to do something

1.3

1.8

1.4

D4

My experience tells me there’s money to be made here …  I just know it

1.4

1.7

1.4

A2

The news appears in Bloomberg

1.5

1.7

1.3

D2

I think I’ve discovered something really critical here that no one knows

1.6

1.7

0.9

Table 10. Response time in seconds for each element. Data shown for three Mind-Sets.


MS1

MS2

MS3


Where

Story

Friends

A1

The news appears in the Wall Street Journal

2.3

2.0

2.0

A4

The news is given by your colleagues at your office

2.2

1.8

2.2

D2

I think I’ve discovered something really critical here that no one knows

2.2

2.2

2.5

D4

My experience tells me there’s money to be made here … I just know it

2.1

1.7

1.8

D1

The tone of the news is so clear that i feel i just have to do something

2.0

1.6

1.5

A2

The news appears in Bloomberg

1.9

2.0

2.2

B4

Story: Investors seem to be selling off more rapidly than expected

1.8

2.0

1.4

C4

Everyone in the office is abuzz about something big happening here

1.8

1.7

1.9

B2

Story:  Structural problems in the vertical promise downstream trouble

1.1

1.7

1.9

B3

Story: Investors seem to be taking a big position in a vertical

1.4

1.4

1.9

B1

Story:   Imminent tariffs and how they will affect trade

1.8

1.4

1.6

C1

Follow the vertical because I’m heavily knowledgeable in it and feel it’s home

1.5

1.3

1.6

A3

The news appears in CNBC

1.4

1.3

1.6

D3

Everything I hear tells me no one knows exactly … what a chance for ME

1.6

1.7

1.5

C2

Just got into the vertical because of recommendations from people i trust

1.5

1.7

1.5

C3

The mathematical models i use say ‘this vertical is hot’

1.3

1.6

0.9

Those who fall into Mind-Set1, paying attention to news from different sources, pay attention to messages which promote some type of discovery, either from the news, from listening to friends and colleagues, or intuition.

Those who fall into Mind-Set 2, paying attention to the story, pay attention to the source (Wall Street Journal, Bloomberg) and to news about sell-offs, and to a sense of finding out something that no one else knows.

Those who fall into Mind-Set 3, paying attention to friends and their own intuition pay attention to the Wall Street Journal, to Bloomberg, to their own unique discovery, and to colleagues.

What is surprising here is that the response times, a measure of engagement, does not covary strongly with who the respondents are. That is, a respondent who feels strongly about something which defines her or him may not be engaged with that message if engagement is measured by response time.

Discussion

As we saw in the introduction, a literature search on investing behavior uncovers a vast range of issues, ranging from behaviors used, strategies adopted, and the inner mind of the investor. To a great degree studies about the psychology of investing have emerged, not unexpectedly, from the marriage of finance and psychology. The emphasis of these studies is on the financial implications of psychological states of mind and its co-variation with strategies. There is relatively little published dealing with the discourse between the investment specialist and the customer. The sheer issue of gaining versus losing deflects the focus from the purely psychological ‘attitude’ to the attitude of investing as an economic behavior What is missing is the person-to-person behavior, the social aspect of the investor, not the economic aspect. Knowledge of the mind of the investor provides us with a new avenue of understanding finance. The field of behavioral economics focuses on the nature of people’s decision making under uncertainty. Investing is in that class. We are often treated to interesting experiments on how people make their investment choices, on the ratiableonal approach to investment. We are less exposed to issues about the nature of information. The approach presented here provides a simple, easy-to-execute foundational study on the ‘mind of the investor,’ not so much dealing with rationality or irrationality, but rather dealing with the way the investigator navigates through opportunities, through information, through communication with others, respectively. Through Mind Genomics we use the economic aspects of the investing simply as a set of test stimuli, ‘assayed’ by the human mind. Our focus is on the mind anticipating economics-relevant behavior [17, 18] and not on the marriage of the mind and the theoretical underpinnings of economics [8].

Acknowledgement

Attila Gere thanks the support of Premium Postdoctoral Research Program of the Hungarian Academy of Sciences.

References

  1. Gervais S and Odean T (2001) Learning to be overconfident. Review of Finance Studies 14: 1–27.
  2. Mezick EM (2002) Investing wisely: Individual investors as information seekers. Journal of Business & Finance Librarianship 7: 3–23.
  3. Escrig-Olmedo E, Munoz-Torres MJ, Fernandez-Izquierdo MA (2010) Socially responsible investing: sustainability indices, ESG rating and information provider agencies. International Journal of Sustainable economy 2: 442–461.
  4. Barber BM and Odean T (2001) Boys will be boys: Gender, overconfidence, and common stock investment. Quarterly Journal of Economics 116: 261–292.
  5. Bengtsson C, Persson M, Willenhag P (2005) Gender and overconfidence. Economics Letters 86: 9–203.
  6. Barber BM and Odean T (2000) Too many cooks spoil the profits: Investment club performance. Financial Analysis Journal 56: 17–25.
  7. Hirshleifer D and Subahmanyam A (1998) Investor psychology and security market under- and overreactions. Journal of Finance 53: 1839–1886.
  8. Tversky A and Kahneman D (1974) Judgment under uncertainty: Heuristics and biases. Science. 185: 1124–1131.
  9. Moskowitz HR and Gofman A (2007) Selling blue elephants: How to make great products that people want before they even know they want them. Pearson Education.
  10. Green PE and Rao VR (1971) Conjoint measurement for quantifying judgmental data. Journal of Marketing Research 8: 355–363.
  11. Green PE and Srinivasan V (1990) Conjoint analysis in marketing: new developments with implications for research and practice. The Journal of Marketing 54: 3–19.
  12. Box GE, Hunter WG, Hunter JS (1978) Statistics for experimenters, New York, John Wiley.
  13. Louviere JJ, Flynn TN, Marley AAJ (2015) Best-worst scaling: Theory, methods and applications. Cambridge University Press.
  14. Gofman A and Moskowitz H (2010) Isomorphic permuted experimental designs and their application in conjoint analysis. Journal of Sensory Studies 25: 127–145.
  15. Dubes R and Jain AK (1980) Clustering methodologies in exploratory data analysis. Advances in Computers 19: 113–238.
  16. Boring EG (1929) A History of Experimental Psychology. The Century Company, NY.
  17. Cross F (1973) The behavior of stock prices on Fridays and Mondays. Financial Analysis Journal 29: 67–69.
  18. Menkhoff L, Schmidt U, Brozynski T (2006) The impact of experience on risk taking, overconfidence, and herding of fund managers: Complementary survey evidence. European Economic Review 50: 1753–1766.

Conferences about topics which pull at the heart: A Mind Genomics exploration

DOI: 10.31038/ASMHS.2019353

Abstract

The objective of this study was to understand how ordinary people react to information about conferences. The study is part of the Mind Genomics exploration of the world of the everyday. Respondents evaluated systematically created vignettes about conferences, with the elements of the vignettes presenting information about the topic of the conference, the way the material is presented to excite emotions, the way the facts are presented, and the after-conference activities, respectively. The study introduced the assessment of interactions between ideas in a vignette (scenario analysis). The results suggest three clearly different mind-sets; those who focus on the topic, those who focus on the nature of the presenter, and those who focus on the after-conference activities. These three mind-sets distribute similarly in the population. The study presents a PVI, personal viewpoint identifier, allowing a conference planner to understand the mind-set to which members of the prospective audience may belong, which knowledge may produce a more impactful conference.

Introduction

One need only look at the proliferation of non-governmental organization intent on solving key issues in the world to get a sense of an increasing social awareness. Beyond the world of the organization is the world of the meeting, where experts and others in the field come together, under one or another aegis or directorate, to discuss the problems, to formulate solutions, or simply to meet. The meetings are in the thousands, often by invitation, and limited, presumably to those attendees whose interest is established in the topic. Every organization attempts to validate its meaning, its raison d’etre, either by publications which communicate important information to the world, by publications of an academic nature which dissect the problem, or more typically in today’s world, by a ‘meeting.’ The meeting, formally titled ‘conference’ , assembles those who are involved in the topic. The conference may turn into a standard, periodic meeting, or become a one-off attempt to ‘solve a problem’ or at least to discuss how various experts would approach the problem. One needs only look at the announcements of such meetings to get a sense of how popular it is for people to get together for short, concentrated periods of time, be available to the public as the public face of those concerned, come up with recommendations, and then scatter back to their regular jobs. Our focus in this paper is to understand how the average person reacts to these types of conferences. To be sure, the topic of ‘meeting’ is not one of high interest to people, unless they are somehow involved. Despite the special nature of conferences, the notion of conferences is by now well known, especially due to the high-profile nature of conferences dealing with important issues. The emerging science of Mind Genomics, the study of the everyday, provides a perfect tool to understand how ordinary people respond to descriptions of these ‘meetings.’ We are not taking the pulse of people towards meetings in general, the points of satisfaction and dissatisfaction, but rather trying to understand the mind of the typical person confronted with special topic, issue-related conferences.

The world of public conferences

The topics of conferences vary dramatically. Most conferences are of minor importance, dealing with specific issues and relevant to a limited number of people, the organizers and the attendees. On the other hand, there are major conferences, often sponsored by world organizations such as the United Nations or by NGO’s (non-government organizations.) The participation of NGO’s continues to interest researchers [1–4], perhaps because the NGO’s are involved with high-profile topics. Conferences are also venues for professionals to meet, and especially for graduate students to introduce themselves to their colleagues, and present papers about their work [5,6] For the seasoned professional, conferences are a venue for promoting one’s work, and for developing a support system [7,8]. For the undergraduate student, an often-overlooked ground of nascent professionals, conferences can provide a launching pad to create a life-long professional [9] The focus of published research literature dealing with conferences is the topic itself, and secondarily a venue in which people interact [10]. In spirit the literature is sociology, the interact of people, and not psychology, the individual’s needs, wants, feelings, and behavior. There is some literature on the desires of conference attendees in terms of they want [11,12], and even papers dealing with people’s behaviors in conferences, such as tweeting [13]. The result of such investigations reveals the nature of people’s participation, and even prescriptions about creating good conferences [14]. They do not tell us about the inner feelings of people towards a conference as a part of their daily life.

This paper moves from the conferences as a topic of sociology, looking from the outside, to a topic of psychology, looking at the conference from the inside, focusing on the reactions of a respondent presented with vignettes, small descriptions, about conferences. Each description comprises different features of the conference; topic, speaker, nature of information, follow up activities. The objective of the Mind Genomics effort in general, and this study in particular, is to create the science of the everyday, using one’s knowledge of quotidian events like conferences, to understand the way people think about and make decisions about the ordinary events of their lives.

The Mind Genomics approach

When confronted with everyday situations, especially those which do not require much thinking, and where there is no real ‘risk,’ the typical person acts automatically, what Nobel Laureate Daniel Kahneman calls involving the System 1 mode of thought. System 1 is the emotion-driven, automatic system upon which virtually people rely most of the time. System 1rapidly processes the information, incorporates emotions, and drives a response, often on what seems to be ‘auto-pilot.’ Such a system is necessary to navigate a life in which many choices are required to be made each few minutes, ranging from where to move when walking, to how to eat a meal, and so forth [15]. The automatic responses and behaviors need to be limited to the very ordinary. For example, people who attend the meetings often form opinions in what seems to be an automatic fashion, talking freely about the different aspects of the meeting without much rehearsal. That is, people respond to the meetings, can dissect the different aspects of the meetings with great ease after the fact, and in the case of boring meetings, during the meeting as people talk with each other while ignoring the presenter. The set of tools to investigate the aspects of the everyday are housed in Mind Genomics. Mind Genomics is the emerging science of the everyday, created to look at the nature of the different patterns of reactions that people exhibit to descriptions of situations [16–18]. The intellectual history of Mind Genomics emerges from mathematical psychology [19], and the adaptation to market research with consumers [20, 21]. When applied to social issues such as meetings sponsored by NGO’s, Mind Genomics reveals what is important about the meeting versus what is unimportant, or how the presenter affects the credibility of the information being presented.

Raw materials

The input to Mind Genomics comprises a set of questions, and alternative answers to each question. Table 1 presents the four questions and the set of 16 answers. Typically, these questions ‘tell a story’, with the different answers providing the necessary material to ‘flesh out’ the story. The questions never appear in the actual experiment with respondents. Rather, the questions are used to elicit the answers, which will appear in combination.

Table 1 presents the information in a way which enables the respondent to ‘graze the vignette,’ and extract the relevant ideas. Each answer is prefaced by an introductory phrase, such as ‘conference topic,’ ‘presenter,’ ‘expert’ and ‘follow-up’ respectively. Although this format does not lead to grammatically elegant vignettes, the format makes it easy to present the respondent with the information necessary to make a decision. In studies using experimentally designed combinations of ideas, with individuals exposed to many combinations, it is becoming increasingly vital to shorten the interview. The time for elegantly written but dense paragraphs has passed, as researchers are forced to do increasingly shorter interviews and experiments. The design of the individual elements in this study (Table 1), and the design of the vignettes are done with the recognition that the entire Mind Genomics experiment should last no more than five minutes.

Table 1. The questions and answers about conferences.


Question A: What is the nature of the conference?

A1

conference topic: problems in world environment

A2

conference topic: problems teaching students to think critically

A3

conference topic: loss of respect and empathy of people towards each other

A4

conference topic: government actions and quality of life


Question B: How are the problems presented to excite emotions?

B1

presenter: talks about personal experiences and suffering

B2

presenter: video presentation narrated

B3

presenter: well-known social activist

B4

presenter: critical NGO (non-governmental organization)


Question C: How do experts present the facts?

C1

expert: well-known university professor with to-do list

C2

expert: well-known author on topic

C3

expert: panel of business people

C4

expert: high government official in topic area


Question D: How does the conference ensure its real value with post conference activities?

D1

follow-up: create workshops to teach how to solve

D2

follow-up: create workshops in schools

D3

follow-up: a stronger awareness thru media

D4

follow-up: create free groups to give meaning and motivation

The answers are combined according to an underlying experimental design, a prescription of what answers or ‘elements’ should be combined [22] The experimental design prescribes a set of 24 combinations for the array of four questions and four answers for each question. The underlying experimental design ensures that all 16 answers are statistically independent, permitting the analysis by OLS (ordinary least-squares) regression. The underlying experimental design ensures that some of the test combinations, called ‘vignettes’, are incomplete, lacking either one or two answers. This deliberate creation of incomplete vignettes is done so that the coefficients from the OLS regression have ‘absolute value,’ allowing them to be compared from study to study, even when the studies comprise other types of messages.

Each respondent evaluated a totally unique set of combinations of vignettes, created according to the same underlying experimental design, but ‘permuted’. This strategy enables the researcher to assess many different combinations of answers or elements [23] it is important to emphasize that this strategy of testing many different vignettes, with 1–2 evaluations of each vignette, means that we look for patterns by looking at the entire space of alternatives, rather than looking for patterns by canceling out the variability. Most research looks for patterns by suppressing the noise through replication. Mind Genomics does the exact opposite, discovering the pattern by looking at a lot of the space, even if the individual measures are ‘noisy.’

The rating 5-pooint rating scale combining understanding and action

Traditionally, Mind Genomics has worked with bipolar Likert scales, anchored at the top and at the bottom. The scales usually have focused on one dimension, whether that be ‘do not understand versus understand’ (what is), or ‘not motivated to do something versus motivated to do something’ (intended action.). When the two topics of ‘what is’ versus’ intended are investigated in the same study, they often have been separate questions, answered quickly in succession. The Mind Genomics experiment presented here represents the next generation, in which a single rating question is created to encompass two dimensions.

For this study, the five rating points appear below:

Here are conferences dealing with major problems. How do you feel about this specific conference as described? Choose one of the following five answers

1=tuned out immediately. ..waste of time

2=don’t understand facts & not motivated to solve problem

3=understand facts but not motivated to solve problem

4=don’t understand facts but motivated to solve problem

5=understand facts & motivated to solve problem

Analyzing the results at a surface level

The easiest way to understand the data, and to compare groups looks at averages. We create the following key dependent variables, and then compare them by group:

  1. Response time
  2. Rating 1 converted to binary (tuned out)
  3. Rating 5 converted to binary (understand facts & motivated to solve problems),
  4. Ratings 3&5 converted to binary, a so-called ‘netted variable’ that we call UNDERSTAND.
  5. Ratings 4&5 converted to binary, another ‘netted variable’ that we call MOTIVATED TO SOLVE PROBLEMS

Table 2 shows the average value for each of these five variables, for total panel, and key subgroups (gender, age, self-defined focus on the topic of these conferences, and finally two groups of mind-sets emerging from dividing the 50 respondents into complementary groups, based upon the pattern how motivated they are to solve problems

Table 2. Average ratings for response time (seconds), and binary variables, based upon the analysis of subgroups.


RT
SECONDS

R1
TUNED OUT

R5
YES UNDERTAND YES MOTIVATED

NET YES UNDERSTAND

NET YES

MOTIVATED

1

Total

5.1

14

23

51

48

2

Female

5.4

13

24

49

51

3

Male

4.7

16

23

54

45

4

Age 50+

7.0

25

23

49

42

5

Age 30–49

4.3

6

27

56

54

6

Age 15–29

2.7

12

16

45

47

7

Q3 Interested

5.0

6

28

56

57

8

Q3 Skeptic

5.9

32

15

43

30

9

Q3 Passionate

3.9

9

21

52

51

10

Q3 Turned off

5.7

46

5

26

19

11

Q3 Not applicable

5.5

22

22

53

31

12

Mind-Set 2A

4.0

14

27

51

54

13

Mind-Set 2B

6.1

15

19

51

42

14

Mind-Set 3C

4.1

13

20

46

53

15

Mind-Set 3D

5.9

12

18

51

45

16

Mind-Set 3E

5.3

19

32

57

45

The important lesson from Table 2 is that there are differences which manifest themselves in the response time, and in the pattern of ratings. We see the expected differences between the respondents who say that they are ‘tuned out’ versus those say they are passionate. Furthermore, some age differences emerge, few gender differences emerge, and so forth.

Table 2 lacks the cognitive dimension of the results. We see behaviors, but the averages have only meaning in a numerical way, telling us an external measure, a measure that we attempt to use as we search for an underlying pattern. The pattern lies within the mind of the researcher, not in the data. There is no cognitive richness in the data presented by Table 2, but only patterns, the meaning of which must be imposed on the data, and with any luck, will be perceived as appropriate for the data, not as imposed on the data.

Finally, in (Table 2) there is the story, but the story is general, not specific, not rich, and certain does not tell us of the inner workings of the mind of the respondent.

Linking messages to judgments

We undertook this Mind Genomic study to understand how people react to the different aspects of these NGO-sponsored conferences. We focused on five different responses that people might have, including absolutely no interest (Rating 1, R1), do not understand and not motivated to solve the problem (Rating 2, R2), understand but not motivated to solve the problem (Rating 3), do not understand but motivated to solve the problem (Rating 4, R4), and finally understand and motivated to solve the problem (Rating3, R3) or motivated to solve the problem (Rating5, R5). We also presented two net key variables; understand (Rating3 + Rating4, R3+R4), and motivated to solve the problem (Rating4 + Rating5, R4+R5).

The underlying experimental design enables us to relate the presence/absence of the 16 elements to either one of the responses (1–5), or any subset of the responses (e.g., those of men versus those of women). The approach used is known generically as regression analysis, occasionally referred to as ‘curve fitting.’ The objective is to deconstruct the dependent variable to the contribution of the 16 contributing elements the answers provided the four questions. The cases or observations for the regression analysis comprise the full set of 1200 vignettes, wherein one knows both the composition of the vignette, e.g., which of the answers were present,’ and the reaction, e.g., which rating or net rating was selected, and thus converted to 100. All rating variables will be presented after transformation to the binary values 0 (not chosen) or 100 (chosen) when the respondent evaluated the vignette. (Table 3) shows us the coefficients for six dependent variables; R1, R5, Net Not Understand, Net Not Motivated, Net Understand, Net Motivated. The model begins with the additive constant. The additive constant is the estimated value of the dependent variable when there are not elements or answers in the vignette, a hypothetical situation since all vignettes comprised at least two elements, and at most four elements. Nonetheless, the additive constant is a useful number, behaving as a baseline. When we look at the coefficients, we should keep in mind that the underlying statistics of the regression enable us to estimate the likelihood that the coefficient that we observe is not just a random occurrence from an underlying distribution of coefficients with a real average or mean of 0. That critical value is 8 or higher, or -8 and lower. Knowledge of that range (beyond +/- 8) helps us focus on those answers or elements which drive a strong positive or negative response. These strong performers are shown as number in bold font, and in shaded cells. Visual inspection suggests possible patterns in this otherwise daunting ‘wall of numbers.’

Table 3. Links between elements (answers, messages) in the vignettes and six dependent variables. The strong linkages are shown in bold font, and shaded cells.


Total

R1 TUNED OUT

R5 YES UND YE & SMOT

NET NOT UNDERSTAND

NET NOT MOTIVATED

NET UNDERSTAND

NET MOTIVATED


CONSTANT

24

20

26

40

50

36

A1

conference topic: problems in world environment

-2

-2

5

-4

-2

6

A2

conference topic: problems teaching students to think critically

-7

6

0

-3

8

11

A3

conference topic: loss of respect and empathy of people towards each other

-3

10

-3

-9

6

12

A4

conference topic: government actions and quality of life

-5

4

3

-4

2

9

B1

presenter: talks about personal experiences and suffering

-3

3

6

-6

-3

8

B2

presenter: video presentation narrated

0

2

4

-7

-4

7

B3

presenter: well-known social activist

-5

3

6

-3

-1

8

B4

presenter: critical NGO (non-governmental organization)

-1

2

9

-6

-8

8

C1

expert: well-known university professor with to-do list

-4

-2

6

7

-2

-3

C2

expert: well-known author on topic

-3

1

0

8

3

-5

C3

expert: panel of business people

1

-3

3

4

-4

-5

C4

expert: high government official in topic area

-3

-4

-1

7

4

-4

D1

follow-up: create workshops to teach how to solve

-6

2

3

1

3

5

D2

follow-up: create workshops in schools

-1

0

-1

-2

1

3

D3

follow-up: a stronger awareness thru media

0

-7

3

6

-3

-6

D4

follow-up: create free groups to give meaning and motivation

-3

2

-2

-1

5

4

We look now in a rapid fashion at the six response variables:

R1 – Tuned out: This response has a low additive constant, 24, meaning that in the absence of elements in the vignette, approximately one quarter of the responses will be ‘tuned out;’ There are no key drivers of ‘tuning out’, at least with the total panel.

R5 – Understand and motivated to make a change: This variable has the lowest additive constant, 20, meaning that in the absence of elements in the vignette, approximately one fifth of the responses will be this positive. It is the job of the elements, the answers, to drive understanding and motivation. Only one element is sufficiently powerful to drive this response, A3, conference topic: loss of respect and empathy of people towards each other. The strong response to A3 emerges because of the strong ‘pull’ of this idea.

Net Not Understand: This variable is constructed from the two response variables which feature ‘Do Not Understand’. They are rating choices R2 and R4. When either is selected, the newly constructed variable, Net Not Understand, is given the value of 100. When neither is selected, Net Not Understand is given the value of 0. Ironically, the only group which promotes a possible misunderstanding is the presenter being from a critical NGO (non-governmental organization.) This suggest that the role of NGO is not perceived as very instructive, at least by the average American respondent.

NET NOT MOTIVATED (to solve problems): This variable takes on the value 100 when the respondent chooses R2 or R3, both involving no motivation to solve problems. Otherwise, this variable takes on the value 0. The key destroyer of motivation to these respondents is the presenter being the well-known author on the topic. It is as if having the well-known author is a symbolic fulfillment of what has to be done. Metaphorically, the author is the ‘priest’ who atones for the congregation. An analogy may be made to modern corporations which send their employees to conferences on innovation, have walls of awards and certificates in their lobbies, but are prisoners to outdated processes, and believe that despite innovation, ‘process is king.’ As long as the employees listen to experts, the corporation may be said to fulfill its role to embrace innovation.

NET UNDERSTAND: This variable is constructed from R3 and R5. Both responses talk about understanding the facts. The additive constant is high. The key element driving this response is the conference dealing with teaching students to think critically. The respondents believe that they will understand the issues involved.

NET MOTIVATED: This variable is constructed from R4 and R5. Both responses talk about being motivated to change. The elements appear to connect with the human experience:

conference topic: loss of respect and empathy of people towards each other

conference topic: problems teaching students to think critically

conference topic: government actions and quality of life

presenter: talks about personal experiences and suffering

presenter: well-known social activist

presenter: critical NGO (non-governmental organization)

Does the topic of the conference affect how people judge the different vignettes?

The features or messages to which one responds are not independent of each other. That is, depending upon one part of the message, another part of the message may either make sense or not make sense. A good example is the price. For example, we can lay out prices for an object, and ask people to rate the degree to which the price is fair. Yet, none of the pricing data makes sense unless we know the object or service for which the price is designed. A $2.00 price for a loaf of bread is meaningful. A $2.00 price for an automobile makes no sense whatsoever.

The Mind Genomics system enables us to assess pairwise interactions answers from different questions (or elements from different silos.) This ability to address the issue of interactions emerges as a happy byproduct of the nature of the underlying experimental design, a structure which specifies the test combinations. The design remains the same for all respondents, but the actual combinations change from one respondent to another. The ensures a statistically robust set of combinations, with all the answers from one question appearing with all the answers in the other questions. In other words, the final set of combinations is sufficiently robust to allow us to pull out pairwise combinations.

The strategy to uncover pairwise interactions is straightforward both in computation and in meaning, respectively. We divide the set of 1200 vignettes into strata, based upon the answer in one question. In the analysis presented here we divide the 1200 vignettes into five strata, depending upon the specific question. We will focus on Question A, the topic of the conference. Our focus now is how the different elements or answers perform when the conference topic is held constant, focusing on problems in world environment, problems in teaching students to think critically, and so forth.

We first sort the data, creating five strata, depending upon the particular topic. We then run the OLS regression once again, this time running the data separately in each stratum. The OLS regression is run on 12 predictors, the four answers from Question B, the four answers from Question C, and the four answers from Question D. Thus, we have five parallel analyses, one for each topic, and one analysis where no topic is specified. Thus, the focus is not on the topics as separate, but the topics as guiding the performance of the remaining elements. This approach has been coined ‘scenario analysis’ [24]. The reason for the term ‘scenario’ is that the analysis operates with a specific type of meeting, the ‘scenario’ in which everything is judged.

What makes a respondent feel that he or she would tune-out, i.e., reject the conference

We begin our analysis of interactions by identifying those elements or answers which lead to the respondent ‘tuning out.’

  1. No topic (all vignettes lack the presence of A1-A4): These vignettes generate a fair amount of tune-out responses. The additive constant is 26, meaning that in the absolute of a topic, and just information about the presenter and the follow-up,, about one out of four responses will be ‘tuned out’ (R1). What really bores people, however, is a presenter with a video narration. The coefficient is +12, a really boring strategy.
  2. Problems in the world’s environment: This topic is also slightly boring, with an additive constant of 20. That 20 means that in the absence of answers or specific elements, just knowing that the conference is about problems in the world’s environment will generate about 20% responses of ‘tuned out.’ However, there are no elements which drive ‘tuned out.’ The elements themselves are interesting.
  3. Problems in teaching students to think critically: This topic of a conference is more interesting. The additive constant is 15, meaning only 15% of the responses are expected to be ‘tuned-out’ when the specific elements or messages are missing. Once again, we see that no elements or answers drive boredom and tune-out. The specifics are interesting.
  4. The loss of respect and empathy of people towards each other: This is also a fundamentally more interesting topic, with the additive constant of 14. There are three elements which drive the respondent feel that he or she would tune out, despite the fundamentally interesting nature of the topic:

    follow-up: create workshops in schools

    presenter: critical NGO (non-governmental organization)

    presenter: well-known social activist

  5. Government actions and the quality of life: This is perhaps the most likely topic to drive the response of ‘tuned out.’ The additive constant is 25. Beyond that, however, we find no elements which are turn-offs.
  6. We conclude from this analysis that there are interactions between the topic of the conference and the elements which can be found boring. Some interactions are dramatic. A narrated video presentation might be a turn off by itself when there is no topic specified, and a turn-off when the topic is loss of respect and empathy of people towards each other (coefficients of +12 and +6, respectively), but will be not a turn off when the topic is government actions and the quality of life (Table 4).

Table 4. Scenario analysis. How the nature of the conference (top row) drives the response R1 (tuned out).


Dependent variable = R1
(TUNED OUT)

no topic

 problems in world environment

 problems teaching students to think critically

 loss of respect and empathy of people towards each other

 government actions and quality of life


Additive constant

26

20

15

14

25

B2

presenter: video presentation narrated

12

-3

-3

6

-9

C2

expert: well-known author on topic

1

-5

0

-16

-1

C3

expert: panel of business people

1

-1

1

-4

7

D2

follow-up: create workshops in schools

0

0

-10

12

-2

B4

presenter: critical NGO (non-governmental organization)

-2

-2

-4

8

-7

D1

follow-up: create workshops to teach how to solve

-5

-8

-5

1

-5

D3

follow-up: a stronger awareness thru media

-5

1

4

7

-4

D4

follow-up: create free groups to give meaning and motivation

-6

-9

-2

3

-5

C1

expert: well-known university professor with to-do list

-7

4

3

-12

-9

C4

expert: high government official in topic area

-7

2

4

-7

-8

B1

presenter: talks about personal experiences and suffering

-8

3

-3

1

0

B3

presenter: well-known social activist

-11

-3

-4

8

-12

Getting the message across – what drives the response of ‘I understand the facts’?

Our second analysis looks at the drivers of ‘I understand the facts), which comprises responses R3 and R5, together. When a respondent selected R3 or R5, this new ‘net variable’ of ‘understand’ was assigned the value 100. When a respondent selected R1, R2 or R4, respectively, this new net variable ‘understand’ was assigned the value 0. The analysis then proceeded as did the previous analysis, considering five strata, based upon the topic of the conference. (Table 5) shows the detailed results.

Table 5. Scenario analysis. How the nature of the conference (top row) drives the ‘net response’ of understand the facts (combined Rating3 and Rating5).


Understand the facts
(R3 and R5)

No topic

 problems in world environment

 problems teaching students to think critically

 loss of respect and empathy of people towards each other

 government actions and quality of life


Additive constant

45

67

54

47

52

D4

follow-up: create free groups to give meaning and motivation

21

-1

-2

1

9

C4

expert: high government official in topic area

17

-7

0

9

8

C3

expert: panel of business people

15

-1

-13

5

-15

D2

follow-up: create workshops in schools

14

-3

1

0

-3

C2

expert: well-known author on topic

8

4

10

8

-2

C1

expert: well-known university professor with to-do list

7

-8

-15

18

-4

D1

follow-up: create workshops to teach how to solve

7

-13

9

-5

9

D3

follow-up: a stronger awareness thru media

7

-13

2

-3

-5

B3

presenter: well-known social activist

-9

-5

-4

4

-1

B1

presenter: talks about personal experiences and suffering

-12

-29

8

-4

3

B4

presenter: critical NGO (non-governmental organization)

-24

-17

0

-5

-4

B2

presenter: video presentation narrated

-36

-12

10

4

3

  1. The additive constants suggest that even without elements or answers, at least half of the responses are going to encompass some understanding. The most likely understanding will come from conferences dealing with problems in the world’s environment. The least likely understand will come from conferences dealing with loss of respect and empathy of people towards each other.
  2. No topic specified – strongest contribution to understanding comes from creating free groups to give meaning and motivation. Follow up here is important.
  3. Problems in world environment – basic understanding is very high (additive constant = 67), but no elements or answers increase understanding.
  4. Problems teaching students to think critically’

    expert: well-known author on topic

    presenter: video presentation narrated

  5. Loss of respect and empathy of people towards each other – expert: well-known university professor with to-do list
  6. Government actions and quality of life –

    Follow up: create free groups to give meaning and motivation

    expert: high government official in topic area

What makes the respondent feel that she or is motivated to make changes?

Our third analysis looks at the net rating of ‘yes, motivated to make changes.’ This net variable comprises the selection of rating 4 (do not understand the facts, motivated to make changes) or the selection of rating 5 (understand the facts, motivated to make changes).

The actual analysis is identical. The only difference is the choice of the dependent variable. (Table 6) presents the detailed results regarding what motivates the reader to believe that she or he will take action.

Table 6: Scenario analysis. How the nature of the conference (top row) drives the ‘net response’ of motivated to make changes (combined Rating4 and Rating 5).


Motivated to make changes (R4 and R5)

No topic

 problems in world environment

 problems teaching students to think critically

 loss of respect and empathy of people towards each other

 government actions and quality of life


Additive constant

51

31

36

59

47

C4

expert: high government official in topic area

4

-2

-13

-8

1

D3

follow-up: a stronger awareness thru media

3

4

-15

-19

-2

B1

presenter: talks about personal experiences and suffering

1

13

0

16

9

B4

presenter: critical NGO (non-governmental organization)

0

16

12

-4

16

B3

presenter: well-known social activist

-1

11

22

-6

2

C1

expert: well-known university professor with to-do list

-1

-14

4

2

-6

D1

follow-up: create workshops to teach how to solve

-5

15

-2

1

9

D2

follow-up: create workshops in schools

-5

7

17

-12

-3

B2

presenter: video presentation narrated

-6

20

19

0

0

C3

expert: panel of business people

-7

-15

9

-2

-11

D4

follow-up: create free groups to give meaning and motivation

-8

22

9

-4

9

C2

expert: well-known author on topic

-18

-4

10

1

-11

When we look at the additive constants, showing the expected likelihood of people saying ‘I am motivated to make changes,’ we find that the highest motivation emerges with conferences on loss of respect and empathy of people towards each other (additive constant = 59.) The lowest likelihood emerges with conferences regarding problems in the world’s environment (additive constant = 31), and problems teaching students to thinking critically (additive constant = 36).

The elements or answers which drive the motivation tell their own stories. The operating elements which ‘work’ must have a topic of the conference

Problems in the world’s environment – best to have a video presentation and follow-up groups.

Problems teaching students to think critically – best to have a social activist presenting, or a narrated video presentation, and then follow-up groups

Loss of respect and empathy of people towards each other – best to have a person with experience talking about the experience

Government actions and quality of life – best to have an NGO presenter

Gender differences

Often, genders do not differ dramatically from each other, except in topics that are gender-relevant, such as cosmetics. The data from the total panel (Table 3) can be deconstructed into the responses by gender (Table 7). When we look at males versus females for the net response of ‘understand’ (ratings 3 and 5 combined), we see that women are more likely to say that they ‘understand the fact’s (additive constant 55 for women, 43 for men), and that they are also more ‘motivated’ (additive constant 41 for women, 28 for men). Thus, the first observation is that women will be more likely to say that they are affected by the conference.

Table 7. Comparison of male versus female in their ratings of ‘understand the facts’ and ‘motivated to make a change.’ The numbers in the body of the table are the coefficients from the ‘net’ models (understand = R3 & R5; motivated = R4 & R5).


Understand

Understand


Motivated

Motivated


M

F


M

F


Additive constant

43

55


28

41

A1

conference topic: problems in world environment

5

-8


8

5

A2

conference topic: problems teaching students to think critically

19

-3


5

17

A3

conference topic: loss of respect and empathy of people towards each other

12

0


3

21

A4

conference topic: government actions and quality of life

2

2


5

13

B1

presenter: talks about personal experiences and suffering

1

-6


7

9

B2

presenter: video presentation narrated

2

-9


3

11

B3

presenter: well-known social activist

0

0


10

6

B4

presenter: critical NGO (non-governmental organization)

3

-16


13

3

C1

expert: well-known university professor with to-do list

2

-6


-1

-4

C2

expert: well-known author on topic

0

7


1

-9

C3

expert: panel of business people

-6

-2


4

-12

C4

expert: high government official in topic area

-2

9


2

-9

D1

follow-up: create workshops to teach how to solve

2

4


8

2

D2

follow-up: create workshops in schools

9

-6


8

-2

D3

follow-up: a stronger awareness thru media

0

-5


-4

-8

D4

follow-up: create free groups to give meaning and motivation

3

7


6

3

The real gender differences emerge when we look at the answers or elements. In terms of helping the person to understand the facts, men strongly feel that the conference will help them to understand two topics, problems teaching students to think critically and loss of respect and empathy of people towards each other. It may be that these are the only topics that men feel they will learn something new.

When it comes to the topic of motivation, (Table 7) shows dramatic differences by gender. Men are convinced by presenters from NGO’s and by social activists. Men start at a lower level (additive constant = 28), feeling that it will be harder to motivate them, and in turn feel that NGO’s and social activists will be effective. Women, in contrast, are far more likely to say that they will be motivated (additive constant = 41). The truly dramatic topics, those which women think will motivate them those dealing with loss of respective and empathy (coefficient = 21), teaching students to think critically (coefficient = 17), and government actions and the quality of life (coefficient = 13).

In search of different mind-sets

It has become increasingly clear during the past decades that people differ dramatically in what they find interesting. This variation across people in liking is not a new discovery. The old adage holds increasingly today: Of taste one does not dispute. Each person has his or her own pattern of preferences, these preferences ranging from the sensory experience one enjoys (e.g., different flavors), but moving on to experiences themselves (ways of being treated; activities to do on vacations.)

The notion of differences across people is obvious. One important question is to develop a way to measure the pattern of preferences, which has been done by Mind Genomics, and just demonstrated for data from the total panel versus from males versus females. The next question is to determine whether there are fundamental groups of people, so that the patterns of preference are similar within a group, but the patterns of the groups differ dramatically from each other?

Discovering different groups, mind-sets, can be formulated in terms of a statistical problem answerable by the technique of clustering [25]. Each respondent in this study generated a set of 16 coefficients, one coefficient for each of the 16 phrases. The coefficients we choose are those emerging out of Ratings 4 and 5, motivated to change. Clustering divides the set of 50 respondents into mutually exclusive groups, with the property that the patterns within a group are similar to each other, whereas the patterns of the averages of the groups are very different from each other. These groups, statistically developed, are called Mind-Sets in the parlance of Mind Genomics.

The clustering procedures works with a measure of ‘distance’ between pairs of respondents. The distance is defined as the quantity (1-R), where R is the Pearson correlation coefficient. Thus, the distance measure looks at how well the two patterns correlate. When the patterns of coefficients from two respondents correlate perfectly, they are really reacting in the same way to the answers or elements. The Pearson correlation is 1.0, and the distance should be minimal, which it is. The distance is (1-R), i.e., (1–1), or 0. In contrast, when the two respondents react in opposite ways, they are maximally different from each other. The Pearson correlation is -1, and the distance is maximal (1 – – 1 = 2.)

The clustering procedure is agnostic, not concerned with the meaning of the clusters, focusing only on satisfying the mathematical criteria of maximal distance between the averages of the two clusters on the 16 answers, and minimal distance between pairs of respondents within a cluster. The clustering must be augmented by some researcher input, specifically:

Parsimony – fewer clusters or mind-sets are better than more, both from an aesthetic point of view in research, as well as from an actionability point of view when the data are put to use.

Interpretability – the cluster must ‘make sense,’ i.e., tell a story

The two clusters based upon ‘Motivated’ (R4 and R5; converted to binary) were not interpretable. Too many different ‘stories’ emerged. The three clusters which emerged based upon ‘Motivated’ tell a more coherent story, and so we settle on the three clusters

The three-cluster solution is remarkably simple to interpret, suggesting three different ways to motivate the audience. There are those who are motivated by the topic, those who are motivated by the presenter, and those who are motivated by the after-conference opportunities to share ideas (Table 8).

Table 8. Comparison of three emergent Mind-Sets based on clustering the coefficients from ‘Motivated’ (R4 & R5). The numbers in the body of the table are the coefficients from the ‘net’ models (motivated R4 & R5; understand the facts R3 & R5.


Motivate (R4 & R5 as binary)


Understand (R3 & R5 as binary)


MS1

MS2

MS3


MS1

MS2

MS3


Additive constant

26

50

26


30

46

77


Mind-Set 1 – Responds to the topic


A3

conference topic: loss of respect and empathy of people towards each other

29

5

7


15

9

-6

A4

conference topic: government actions and quality of life

25

9

-6


9

1

-3

A1

conference topic: problems in world environment

24

4

-6


-4

-2

0

A2

conference topic: problems teaching students to think critically

23

1

12


21

7

-4

D2

follow-up: create workshops in schools

16

-19

12


2

3

-4


Mind-set 2 – responds to the type of presenter


B3

presenter: well-known social activist

-1

18

7


1

-1

-3

B2

presenter: video presentation narrated

-1

17

2


5

-2

-15

B4

presenter: critical NGO ( non-governmental organization)

6

16

-1


-10

-2

-12

B1

presenter: talks about personal experiences and suffering

4

14

3


-4

0

-5


Mind-set 3 – Responds to activities created for the after-conference


D1

follow-up: create workshops to teach how to solve

6

-19

30


5

2

1

D4

follow-up: create free groups to give meaning and motivation

5

-11

24


12

4

-3


Does not appeal to any of the three Mind-sets generated from Motivation


C2

expert: well-known author on topic

-11

3

-2


20

-3

-8

C4

expert: high government official in topic area

-21

5

2


12

-1

1

C1

expert: well-known university professor with to-do list

-9

-2

2


10

-9

-5

C3

expert: panel of business people

-9

0

-3


6

-10

-11

D3

follow-up: a stronger awareness thru media

6

-25

6


1

5

-19

Finding mind-sets in the general population for better conference design and effective messaging

Mind Genomics as we have just demonstrated begins to provide a corpus of information about the aspects of daily life. The issue beyond science and discovery is application. How can one apply these results in a way which makes the discoveries more than simply part of the knowledge base of sociology and human behavior? Can we learn more if we can expand the discovery of these three mind-sets beyond the limited confines of this study of 50 respondents? In other words, can we apply this information to create better conferences, or at least better understand the audience’s predispositions towards what they want in a conference?

It will be difficult, if not impossible, to assign a person to the proper mind-set simply by knowing who the person IS. (Table 9) shows the distribution of the three mind-sets by gender, by age, and by how the person describes herself or himself when it comes to issues about the world. The distribution is fairly flat, so any opportunity to find a specific group of people with a designated mind-set if probably going to end up in failure.

Table 9. Distribution of the three mind-sets across gender, age, and self-report attitude towards conferences.


Mind-Set 1 – Responds to the topic

Mind-set 2 – responds to the type of presenter

Mind-set 3 – Responds to activities created for the after-conference

Total

Total

16

18

16

50

Gender


Male

9

9

6

24

Female

7

9

10

26

Age


No Answer

0

1

0

1

Age 15 to 29

3

3

2

8

Age 30 to 49

5

9

7

21

Age 50 plus

8

5

7

20

Attitude towards
conferences


Turned Off

0

2

2

4

Skeptical

1

3

3

7

Interested in the world

10

11

8

29

Passionate

3

2

2

7

No answer

2

0

1

3

An alternative way to identify people comes from reducing the large-scale experiment to a set of questions, the PVI, the personal viewpoint identifier. The questions emerge from the actual experiment, the study described here. The PVI as currently designed, comprises a fixed number of six questions, with the questions themselves taken from the actual study, and thus varying from study to study. The respondent reads each question and chooses one of two answers. The total set of 64 patterns is mapped to the assignment to a mind-set. Thus, each of the possible patterns corresponds to the likely membership in one of the three mind-sets. The approach is empirical, based upon the actual study, with the PVI created shortly after the experiment.

(Figure 1) shows the PVI as the respondent see it. It takes approximately 30–45 seconds to complete the PVI. The appropriate mind-set may either be returned in a report to the respondent as a motivating device to make the PVI fun, and in turn, the data may be store in a digital record. That record, obtained from thousands of people, may be used for marketing in the case of commercial events, and follow-up for other uses, e.g., for health when the topic is not conferences, but health-issues and concerns.

A parenthetical note: Without the knowledge of mind-sets, and the disturbing reality that these mind-sets distribute without any noticeable skew towards a specific group in the population, marketers, event planners and others continue to believe that who a person is co-varies with how a person thinks. That is, in the absence of such knowledge, one must use demographics and other variables. Rather than doing the simple Mind-Genomics experiment followed by a PVI for the topic, the strategy has evolved to using Big Data of low information density, coupled with very high-powered analytics. The metaphor is needing to rely upon powerful, expensive equipment in a mine where the gold is rare, rather than using simple equipment or even one’s own hands in a mine where the gold is abundant.
MIND GENOMICS-032_ASMHS_f1

Figure 1. The PVI for conferences as the respondent would see it.

Response time

Beyond the aspect of what persuades at a cognitive level, aspects captured in the rating, lies a whole world of ‘processing,’ of psychological aspects to which the cognitive mind may not be privy. Experimental psychologists almost a century and a half ago recognized that beneath the surface responses to test stimuli lie many factors, such as attitudes, norms, and so forth. These factors govern the response but cannot be articulated.

Recent developments in Mind Genomics have focused on capturing the response time to vignettes, defined as the time between the appearance of the test stimulus and the response to the test stimulus. With the advent of today’s computer technology this information is readily available. The response times (often referred to in the literature as ‘reaction times’) become meaningful when they can be paired with specific stimuli, as they are in the Mind Genomics paradigm. That is, when the researcher can estimate the number of seconds that can be linked with each answer, it becomes possible to learn more about what engages the respondent. We don’t know what is happening, but we do know that some answers are processed more slowly (longer response times), and some elements are processed more quickly (shorter response times.)

The analysis of response times requires a slightly modified equation. The equation incorporates all the answers or elements as predictors, but there is no additive constant. The rationale is that in the absence of answers or elements in the vignette the response time is 0. We write the equation as follows:

Response time = k1(A1) + k2(A2) … k16(D4)

(Table 10) shows the response times for the three mind-sets generated from the mind-sets based upon ‘motivation’. The table shows the longest response times as shaded cells with bold font. What surprises in a delightful way is the observation that the different mind-sets pay attention in accordance with their mind-sets. The correspondence is not perfect, but there is a clear connection between what persuades/motivates and what people attend to. This is an area worth exploring in more detail.

Table 10. Estimated response times attributes to the different answers/elements, from each of the three mind-sets.


MS1

MS2

MS3


Most engaging – MS1 (responds to topic)


C4

expert: high government official in topic area

2.4

1.5

1.4

C1

expert: well-known university professor with to-do list

2.2

1.5

1.3

A4

conference topic: government actions and quality of life

2.1

1.6

1.7

A2

conference topic: problems teaching students to think critically

1.9

1.3

1.3

C2

expert: well-known author on topic

1.9

1.5

1.6


Most engaging – MS2 (responds to presenter)


B4

presenter: critical NGO .. non-governmental organization

1.0

2.0

1.2


Most engaging – MS3 (responds to after-conference activities)


D4

follow-up: create free groups to give meaning and motivation

1.7

0.9

2.2

D3

follow-up: a stronger awareness thru media

1.3

0.2

1.9


Less engaging


B3

presenter: well-known social activist

1.6

1.7

1.7

B1

presenter: talks about personal experiences and suffering

1.6

1.4

1.7

C3

expert: panel of business people

1.7

1.6

1.6

D2

follow-up: create workshops in schools

1.5

0.3

1.6

D1

follow-up: create workshops to teach how to solve

1.6

0.2

1.6

B2

presenter: video presentation narrated

1.3

1.4

1.5

A3

conference topic: loss of respect and empathy of people towards each other

1.7

1.0

1.3

A1

conference topic: problems in world environment

1.7

1.1

1.0

Discussion and conclusion

The literature of conferences is a growing one. The focus, however, is the nature of the specific conferences, from the point of view of the topic, and the influence of the topic. Few papers, if any, focus on the psychology of the listener, other than perhaps papers dealing with the role of conferences in the development of a person’s professional career. This paper introduces a new world of understanding conferences, not so much from the topic and the importance of the topic to the world, but rather conferences as a part of a person’s quotidian, daily life. As noted in the presentation of Mind Genomics, the world of the everyday presents us with a way to understand people. With the tools of Mind Genomics, we begin a new psychology of people, the psychology of the ordinary, of which conferences as a topic constitute one facet.

The results from the data should not surprise, although the reality is that were one to be asked about ‘what makes a good conference,’ one might not emerge with answers as clear as those provided by Mind Genomics. Nor, in fact, would there be the specifics provided by the cognitively rich stimuli used in Mind Genomics studies, specific, meaningful statements. The initial foray into ‘what interests a person in a conference’ shows the simplicity by which one can begin to create a detailed understanding of a person’s mind with regard to a topic. The call now should be for systematics, namely structured investigations. Should the topic of such investigations be ‘conferences,’ and the current study comprises, the next steps would be the way the conferences are organized, the nature of the material presented, the tonalities of the presentation, the venues, and so forth. Following this structured approach, it is likely that an entire “foundational knowledge infrastructure” (FKI) about conferences might be constructed within the period of a year, providing insight to the specific topic of conferences, but potentially greater insight into the nature of social interactions of a formal nature. The potential of a set of FKI’s, updated each year, and done cross-sectionally within a topic, across topics, within a country, and across countries, beckons, almost a ‘Wiki of the Mind.’

Acknowledgement

Attila Gere thanks the support of Premium Postdoctoral Research Program of the Hungarian Academy of Sciences.

References

  1. Clark AM, Friedman EJ, Hochstetler K (1998) The sovereign limits of global civil society: a comparison of NGO participation in UN world conferences on the environment, human rights, and women. World Politics 51: 1–35.
  2. Gordenker L (1995) NGO participation in the international policy process. Third World Quarterly 16: 543–556.
  3. Ritchie C (1995) Coordinate? Cooperate? Harmonise? NGO policy and operational coalitions. Third World Quarterly 16: 513–524.
  4. Van Rooy A (1997) The frontiers of influence: NGO lobbying at the 1974 World Food Conference, the1992 Earth Summit and beyond. World Development 25: 93–114.
  5. Gardner SK, Barnes BJ (2007) Graduate student involvement: Socialization for the professional role. Journal of College Student Development 48: 369–387.
  6. Jacobs N, McFarlane A (2005) Conferences as learning communities: some early lessons in using ‘back-channel’technologies at an academic conference–distributed intelligence or divided attention? Journal of Computer Assisted Learning 21: 317–329.
  7. Kowalsky M (2012) Networking at conferences: Developing your professional support system. Knowledge Quest 41: 60.
  8. Shoaff-Ballanger SM, Davis DJ (1992) Professional conferences for art educators: A pilgrimage to excellence. Art Education 45: 37–44.
  9. Carsrud AL, Palladino JJ, Tanke ED, Aubrecht L, Huber RJ (1984) Undergraduate psychology research conferences: Goals, policies, and procedures. Teaching of Psychology 11: 141–145.
  10. Gunawardena CN (1995) Social presence theory and implications for interaction and collaborative learning in computer conferences. International Journal of Educational Telecommunications 1: 147–166.
  11. Hines SS (2014) What do library workers want from professional conferences? In: Revolutionizing the development of library and information professionals: Planning for the future (1–16). IGI Global.
  12. López-Pastor VM, Monjas R, Manrique JC (2011) Fifteen years of action research as professional development: Seeking more collaborative, useful and democratic systems for teachers. Educational Action Research 19: 153–170.
  13. Reinhardt W, Ebner M, Beham G, Costa C (2009) How people are using Twitter during conferences. Creativity and Innovation Competencies on the Web. Proceedings of the 5th EduMedia Pg No: 145–156.
  14. Werner SE, Kenefick C (2005) A Primer for effective organization of professional conferences. Medical Reference Services Quarterly 24: 39–54.
  15. Kahneman D, Egan P (2011) Thinking, fast and slow. New York: Farrar, Straus and Giroux.
  16. Moskowitz HR, Gofman A, Itty B, Katz R, Manchaiah M, et al. (2001) Rapid, inexpensive, actionable concept generation and optimization: the use and promise of self-authoring conjoint analysis for the food service industry. Food Service Technology 1: 149–167.
  17. Moskowitz H, Gofman A, I novation Inc (2003) System and method for content optimization. U.S. Patent 6: 662,215.
  18. Moskowitz HR, Gofman A, Beckley J, Ashman H (2006) Founding a new science: Mind genomics. Journal of sensory studies 21: 266–307.
  19. Luce RD, Tukey JW (1964) Simultaneous conjoint measurement: A new type of fundamental measurement. Journal of mathematical psychology 1: 1–27.
  20. Green PE, Rao VR (1971) Conjoint measurement for quantifying judgmental data. Journal of marketing research 8: 355–363.
  21. Green PE, Srinivasan V (1990) Conjoint analysis in marketing: new developments with implications for research and practice. The journal of marketing 54: 3–19.
  22. Box GE, Hunter WG, Hunter JS (1978) Statistics for experimenters, New York, John Wiley.
  23. Gofman A, Moskowitz H (2010) Isomorphic permuted experimental designs and their application in conjoint analysis. Journal of Sensory Studies 25: 127–145.
  24. Moskowitz HR, Gofman A (2007) Selling blue elephants: How to make great products that people want before they even know they want them. Pearson Education.
  25. Dubes R, Jain AK (1980) Clustering methodologies in exploratory data analysis. Advances in Computers 19: 113–238.
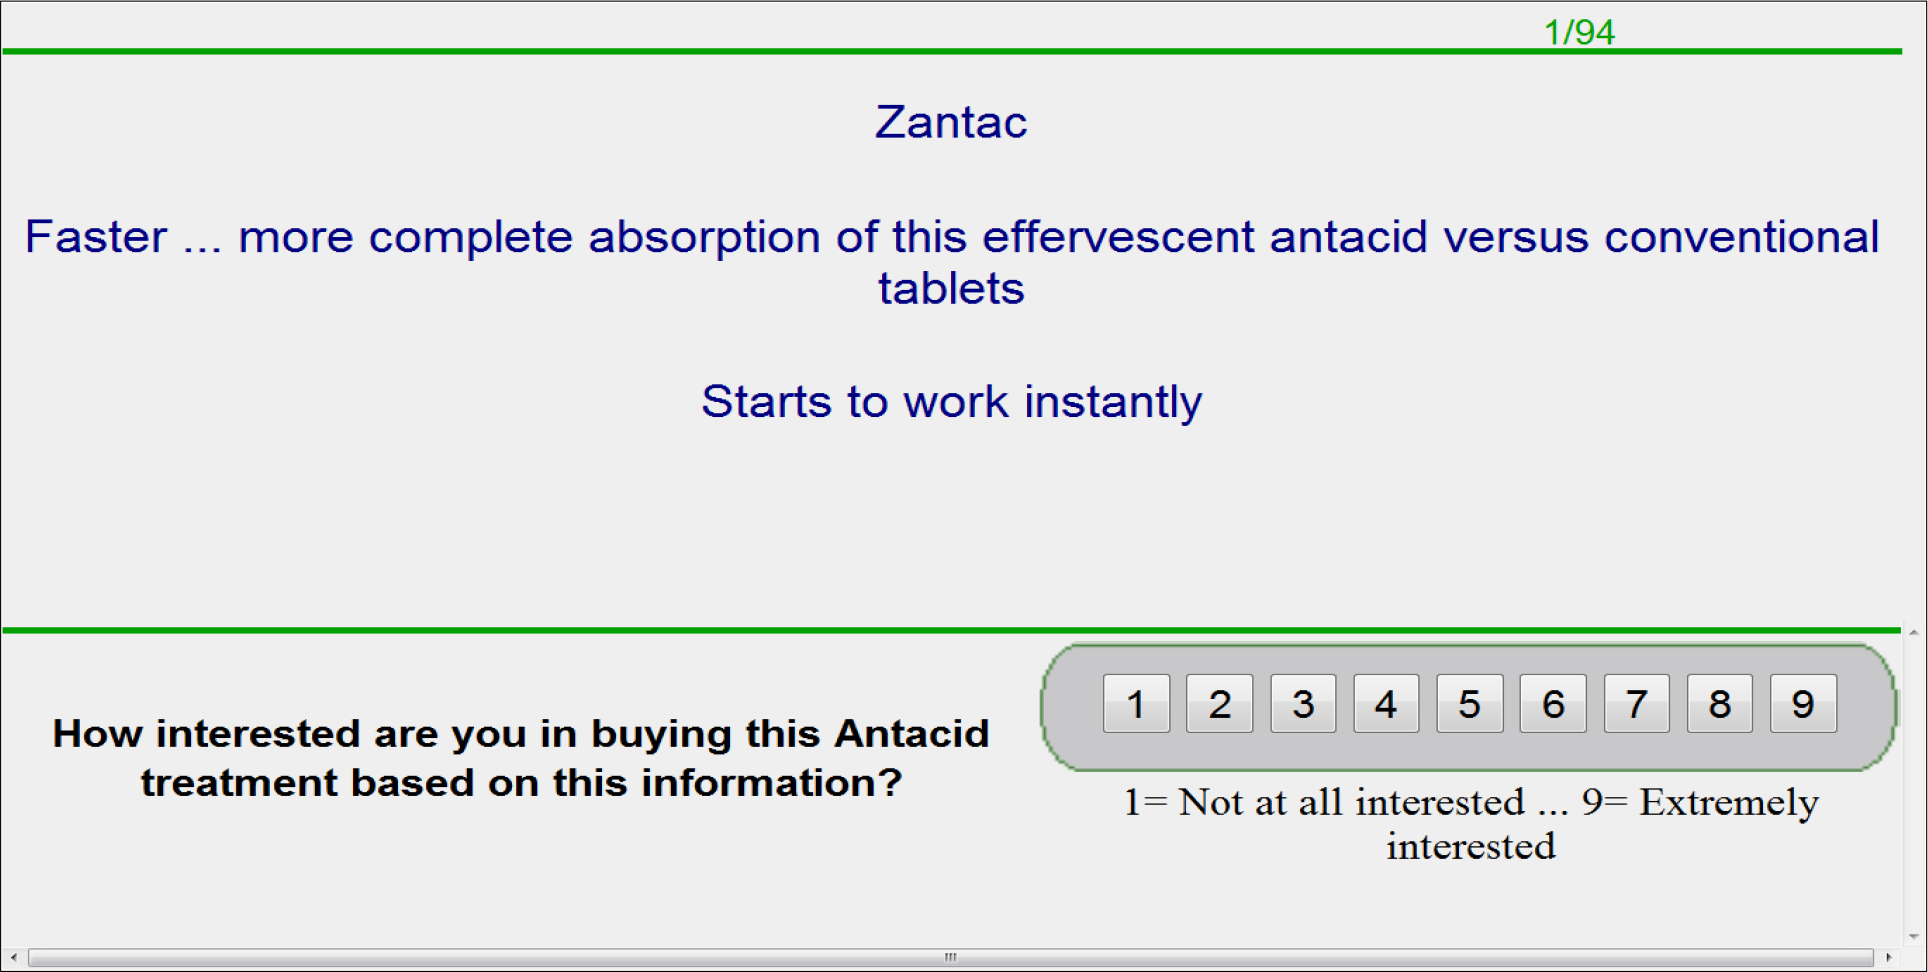
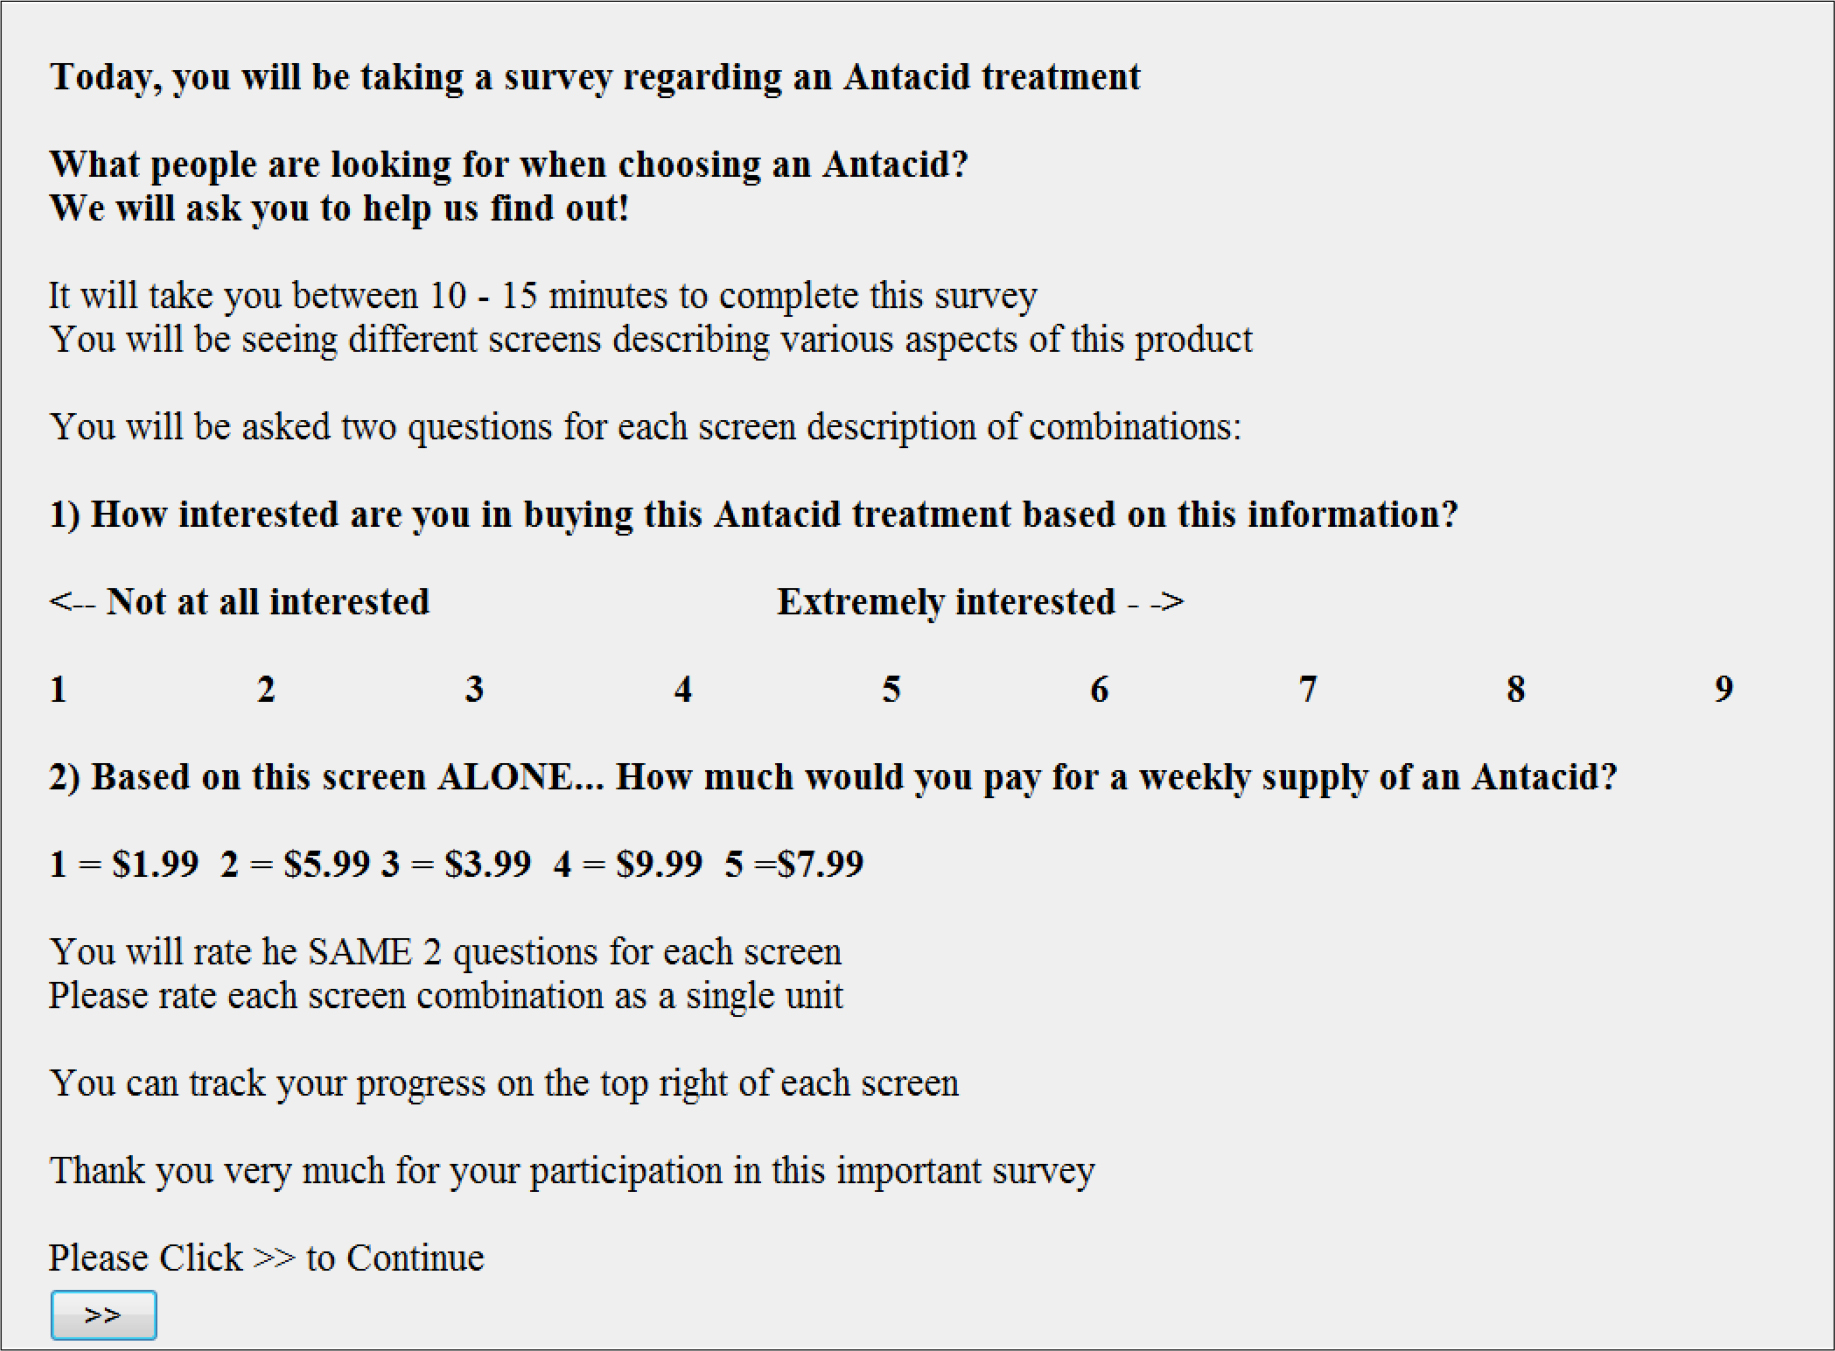
Mind Genomics to Teach Critical Thinking and Prepare Job Candidates for Interviews

DOI: 10.31038/ASMHS.2019352

Abstract

We present a new approach to help students prepare for interviews. The approach applies a user-friendly app (BimiLeap) developed from the science of Mind Genomics. The app teaches students how to think critically and creatively, in a structured way, with feedback from panel respondents unknown to the student. From the viewpoint of the student as job applicant, the Mind Genomics approach can teach the applicant, a prospective employee to think better, and while learning to do so, help the applicant create an individual portfolio of studies that can be presented to the interviewer. The portfolio demonstrates the applicant’s ability to do independent research relevant to the company doing the hiring. From the viewpoint of the hiring company, the Mind Genomics approach provides a test of intellectual proficiency, either as a homework assignment before the interview or as a test given to the respondent with the topic chosen by the interviewing company.

Introduction

As of this writing, there is an increasingly competitive environment for jobs [1]. Many papers are appearing decrying the nature of education as not preparing a person for the job [2]. The popular press, especially the Internet is a treasure of Cassandra-like predictions of the world of jobs which faces us during the next ten years. The issues are legion; hyper-competition, automation will make many of today’s jobs irrelevant, and that the new work environment is making the world one of ‘gigs; rather than lifetime employment and corporate loyalty. The job applicant will no doubt face a different world. Coupled with the structural changes of competition and automation is the reality that in many any cases the applications for jobs are screened by machine. There may be dozens if not hundreds of applicants for the same job. The hyper-competition breeds frustration, demoralization, and at the worse, the conscious decision simply to drop out of the job world, and no-launch career. The foregoing is reflected both in the academic and in the popular literature [3,4]. The loss of hope is an emerging problem for many countries, and the foreshadows the specter of a country slowly depopulating as the young people flee the country to more opportunities elsewhere.

The World of Job Seeking Today

The popular as well as the academic literature are replete with advice about how to prepare for jobs. Indeed, in Google Scholar®, the phrase ‘preparing for a job interview’ generates approximately 744,000 hits as of this writing (Summer 2019.) Going one step further, the phrase ‘practical guide for job interview’ generated 944,000 hits. The number of hits in Google® itself is much greater, and the different facets of jobs as subtopics to search becomes overwhelming. There is a dual problem as well, the problem faced by the hiring group and by the interviewer. The problem is simply how to cut through the façade thrown up by the job seeker, to find out the who the job seeker ‘really is’ and what the job seeker can ‘really do.’ The issues facing the interviewer in the job interview range from understanding the true abilities of the candidate to avoiding emotional manipulation by the candidate. The notion of manipulation as a topic is widespread in the academic literature for the simple reason that the job interview is a critical event in the life of the job seeker [5]. It is not harder to understand that almost all job seekers will present themselves in the best possible light, taking credit for successes, and avoiding the very mention of a failure. The old adage works here ‘success has many fathers but failure is an orphan’. How then can the interviewer probe more deeply into the mind of the respondent, to understand the thinking capability of the respondent?

How Mind Genomics Works and its Application to the Interview Process

We present here a suggestion, based upon the developing research of Mind Genomics, and the now readily available app, www.BimiLeap.com. The basic idea is that the Mind Genomics approach, described below, becomes a tool, either to produce interesting, relevant knowledge which distinguishes the candidate from the other candidates by virtue of the effort, or its dual, a method to assess the thinking capabilities of the candidate at the time of the interview, thus avoiding the effort to deconstruct letters of reference in what’s true and what’s hyperbole. The spirit of using computers for interviews is not new but what is new is the use of the computer both to prepare the student and to test the student, using the same technology. The preparation is not ‘test preparation’ but rather education to think in a critical way. The test is not standard testing and performance, but rather demonstration of ability to solve a new problem, on demand, using critical thinking. Can experimentation increase both the likelihood of getting a specific job, but also the ability of the job applicant to ‘think’, preparing for a career where change is the only constant? In previous papers by this team of researchers, the notion has been offered that there is a structured way to think, one which can apply to the creation of a bank of knowledge about how we make everyday decision. The approach is Mind Genomics, a method which allows the researcher to combine different ideas according to experimental design [6], obtain responses from subjects, and then determine which specific ideas drive the decision. We present Mind Genomics from the viewpoint of preparing students, really applicants in general, an idea which goes back decades, and comprises a variety of approaches [7].

Mind Genomics has been used in areas ranging from politics to food to medicine to law and so forth [8]. The studies are serious, scientific studies, which form part of an emerging archive of knowledge about the world of the everyday and decision-making. It is the suggestion of the authors that the very same approach to knowledge might be well-used by the job seeker, both to train her or his mind, but also to provide material of immediate relevance and important to the interview. The remainder of this paper demonstrates the application, results which are of immediately interest to the interviewer as well as being a scientific contribution, and finally data which suggest a process to teach the job applicant, how to think. Mind Genomics traces its history to both mathematical psychology [9], and to marketing research [10,11]. These early studies investigated how people mentally ‘weight; different factors to arrive at a decision. The early studies worked on either simplistic problems with academic rigor but little practical application, or on large-scale problems in marketing. The early processes were cumbersome, requiring that respondent either choose one of two test stimuli of different combinations of features, or rate known combinations of features.

More recent efforts have focused on creating simpler, rapid, and user-friendly methods which can be adapted to an app (www.BimiLeap.com), and in turn widely used by those who are not academically oriented to publish papers, but rather need the information for practical decisions. The evolution of the science of Mind Genomics has expanded the applications, making them easy, archival, usable by anyone from age 8–9 and older. Mind Genomics follows these straightforward steps. Where relevant, the steps can be embedded in the interview process.

Step 1 – Define a Topic or A Problem

The interviewer can define a problem before or during the interview, or the job seeker can exercise initiative and define the problem. The problem selected for this study is: ‘What attracts a prospective job seeker to select a training/placement company?’

Step 2 – Create a Structure by Asking Four Questions Which ‘Tell a Story’

This is the Socratic approach, of asking and answering questions. Table 1 shows the four questions for this project.

Table 1. The topic, the four questions and the four answers to each question


Topic: What attracts a prospective job seeker to select a training/placement company?’


Question 1 – How does the company satisfy client needs for trained personnel?

A1

Uses multiple sourcing options…e.g., relationship-marketing, social media and advertising

A2

Hires temp contract workers until right candidate found

A3

Educational program to train potential candidate

A4

Willing to invest more for the right talent


Question B: How does the company customize the process for the client?

B1

Sound interview process, including direct contact with the hiring manager

B2

Understands the biggest deciding factor for the candidate

B3

Involves upper management in meetings

B4

Streamlines the process, beat competition by moving quicker in hiring process


Question C: What up-to-date technologies does the company adopt in order to be effective?

C1

Uses centralized data & analytics

C2

Uses most updated hiring technologies

C3

Uses cloud-based tools … automate and manage process

C4

Work with hiring managers to understand technicalities and screen for best fit


Question D: How does the company stay ‘close’ to its client to anticipate needs?

D1

Communicate with corporate managers … define needed skill sets

D2

Builds relationship and rapport with corporate managers … set right expectations

D3

Emphasizes why speed important … to find right candidate who fits

D4

Build appropriate training plans … from hiring manager’s input

Step 3 – Provide Four Answers for Each Question

Typically, these questions and answers are provided by the job candidate. To the degree that the candidate can provide clearly thought-out, relevant, and different answers, one may surmise that the candidate can think in a structured way. Table 1 shows the four answers provided by one job candidate. At this point it is important to note that the system enables the job candidate to demonstrate his or her proficiency and knowledge about the topic, about the company, or about a discipline in which the candidate has been involved.

The actual task of creating the material may be given to the job candidate in at least two ways:

  1. The candidate may receive the topic, but the candidate should provide both the questions and the answers. This entire sequence of events, from receiving the topic to providing the questions and answers, to executing the study could then reveal whether the candidate has the intellectual capability to follow instructions, yet think critically, and execute a study.
  2. The candidate may receive the topic at the time of interview and be give a fixed number of hours to run the actual study under supervision, as part of an interview. It would probably be a good idea for the candidate to ‘train’ on the mechanics of the process before the interview, doing so in a relaxed manner, in privacy, free to make mistakes. The actual test would be supervised, however.

Step 4: Combine The Elements (Answers) Into Vignettes According to An Experimental Design

The elements comprise single ideas. Mind Genomics combines these single ideas into vignettes, i.e., vignettes, comprising 2–4 ideas (elements, answers), with at most one element from each question, but often no elements or answers from a question. To the outsider looking at the 24 vignettes specified by the experimental design it might appear that the elements are thrown together at random. Nothing could be further from the truth. The experimental design is a planned set of vignettes with the property that each element appears an equal number of times against different backgrounds provided by the elements from the other questions. Furthermore, the 16 elements or answers are statistically independent of each other, allowing the ratings to be collected from individual respondents to be ‘linked’ to the presence/absence of the individual respondent ratings. Finally, and very important, is the feature that the set of specific test vignettes for each respondent different from the specific test vignette of every other respondent. This pattern, so-called permuted design [12], allows the research to cover a wide number of vignettes in the ‘design space.’ The metaphor here is the tightness of estimation by testing a lot of different vignettes, each with error but with the total pattern studied, rather than obtaining tight estimations by replicating the number of judgments on a small set of vignettes presumed to represent the larger array of vignettes. In a sense, Mind Genomics is an MRi of the mind, taking different pictures by responses to vignettes. Figure 1 shows an example of a vignette.

MIND GENOMICS-031_ASMHS-F1

Figure 1. Example of a vignette comprising three elements, and the rating scale on the bottom of the screen shot.

Step 5: Self-Profiling Classification

At the end of the evaluation, the respondent completed an extensive classification questionnaire, allowing the research to obtain more information about the respondent, in terms of who the respondent IS, what the respondent BELIEVES, and so forth. For this project we present only three of the questions, age, gender, and general response to the vignettes. The data appear in Table 2.

Step 6 – Transform The 9-Point Rating Scale Into A Binary Scale (0/100)

The transformation allows the use of the research results to better understand the meaning of the data. Although there is more precision in the 9-point scale than in the binary scale, simply because of the granularity of the results, most users of the research do not know how to work with Likert scales, the reason being that Likert scales do not promote decision-making. To make the data easy to interpret and easy to act upon, we transform the data, dividing the 9-point scale into two halves. The upper half comprises the ratings of 7–9, and ia recoded to 100 (plus a very small random number, for regression as explained below.) The recode to `100’ signifies ‘YES.’ The lower half comprises the ratings of 1–6, and is recoded to 0 (plus a very small random number), to signify ‘NO.’

Table 2. Self-profiling classification of the respondents who participated


N

%

Q1: Please indicate your gender.

Male

30

57%

Female

23

43%

Q2: Which of the following best describes your age?

Under 18

0

0%

18 to 24

2

4%

25 to 34

21

40%

35 to 44

14

26%

45 to 54

6

11%

55 to 64

6

11%

65 and older

4

8%

Q3: Based on all the ads that you saw, how interested would you be in applying for a new job at this type of company?

1 = Not interested

3

6%

2 = Maybe

36

68%

3 = For sure

14

26%

Step 7 – Use OLS (Ordinary Least-Squares) Regression To Relate The Presence/Absence Of Each Of The 16 Elements To The Binary Recoded Data

OLS regression deconstructs the rating into a simple linear model: Binary Rating = k0 + k1(A1) … k16(D4). Each element generates a unique coefficient. The additive constant, k0, is the estimated binary value in the absence of elements, a purely hypothetical situation. All vignettes by design comprised 2–4 elements, so the additive constant can be considered a baseline., i.e., the inherent predisposition to say ‘YES.’

Step 8 – Compute The Parameters Of The Model For Total Panel, For Key Subgroups As They Define Themselves, And For Mind-Sets (Explained Below)

Table 3 presents the summary of coefficients for total, gender, and age. All coefficients of 15 or higher are shown in shaded cells, and bold type. The additive constant tells us the likelihood of ‘following up with this recruiter.’ Since the ratings were transformed to their binary values, the additive constant tells us the likely percent of responses that would be ‘YES, I’d follow up with this recruiter,’ assuming the three highest ratings, 7–9, signify ‘YES.’ What emerges as fascinating is the lack of confidence without supporting evidence, with the only respondents ‘willing’ to believe the recruiter even at all are the older respondents, and not really (additive constant = 11.) It will be the individual elements which must do all the work.

Table 3. Performance of elements among total panel, genders, and ages


Total

Male

Female

Age 25–34

Age 35–44


Base Size

53

30

23

21

14


Additive constant

-1

-1

-1

-13

11

B2

Understands the biggest deciding factor for the candidate

21

29

10

16

29

B1

Sound interview process, including direct contact with the hiring manager

20

23

16

15

25

D4

Build appropriate training plans … from hiring manager’s input

19

14

25

20

14

C4

Work with hiring managers to understand technicalities and screen for best fit

18

15

21

17

16

A4

Willing to invest more for the right talent

17

16

19

22

11

A3

Educational program to train potential candidate

16

18

12

13

20

D2

Builds relationship and rapport with corporate managers … set right expectations

15

16

12

20

5

B4

Streamlines the process, beat competition by moving quicker in hiring process

15

17

12

15

24

C2

Uses most updated hiring technologies

14

11

17

22

2

D1

Communicate with corporate managers … define needed skill sets

13

10

16

12

16

B3

Involves upper management in meetings

11

19

1

6

20

A1

Uses multiple sourcing options…e.g., relationship-marketing, social media and advertising

10

11

9

10

20

D3

Emphasizes why speed important … to find right candidate who fits

8

6

11

9

3

C3

Uses cloud-based tools … automate and manage process

7

5

9

9

5

C1

Uses centralized data & analytics

7

7

6

12

-3

A2

Hires temp contract workers until right candidate found

0

1

-1

2

2

The 16 elements are sorted in descending order, based upon the total sample.

  1. Many of the elements perform very well. Previous studies and unpublished observations suggest that coefficients whose values are greater than +10 correspond to elements which drive positive decisions. These data reveal a cadre of elements which drive a strong positive reaction. Knowledge of these features should help the company and the prospective job candidate seeking to work with a training and recruiting company:

    Understands the biggest deciding factor for the candidate

    Sound interview process, including direct contact with the hiring manager

    Build appropriate training plans … from hiring manager’s input

    Work with hiring managers to understand technicalities and screen for best fit

    Willing to invest more for the right talent

    Educational program to train potential candidate

  2. Genders differ. Males dramatically respond more to these elements:

    Understands the biggest deciding factor for the candidate

    Involves upper management in meetings

  3. Ages differ as well. Younger respondents respond strongly to technology and are sensitive to the opinion of higher-level managers

    Uses most updated hiring technologies (22 for younger respondents, 2 for the older respondents)

    Builds relationship and rapport with corporate managers … set right expectations (20 for younger respondents, 5 for the older respondents)

Dividing Respondents By Their Decisions And By Their Mind-Sets, Respectively

The classification questionnaire, done at the end of the Mind Genomics experiment, allows the respondent to how she or he feels about the potential job. We first compare two out of the three self-defined groups, those who say that they may follow up with the company they liked most (n=36) and those who say that they are sure that they would follow up (n=14). Table 4 shows these results. Each group shows a very low additive constant, around 0. Those who are ‘sure’ about following up show eight very strong elements, with coefficients of 20 or higher. However, there is no pattern which makes us ‘smarter’ about the mind of those who say that they would follow up. We know what works, but we cannot generate a rule, although we get a sense of focus on the job seeker and on a relationship with the hiring manager.

Table 4. Performance of elements among total panel, self-stated likelihood to use a company which provides the messages they like the most, and emergent mind-sets based upon the pattern of coefficients


Total

Q3 Maybe

Q3 Sure

MS1 -People

MS2-Technology


Base Size

53

36

14

28

25


Additive constant

-1

1

-5

3

-5


Mind-Set 1 – Empathic and People Oriented


B2

Understands the biggest deciding factor for the candidate

21

19

23

29

13

D4

Build appropriate training plans … from hiring manager’s input

19

17

23

21

17

D2

Builds relationship and rapport with corporate managers … set right expectations

15

15

16

20

8

B1

Sound interview process, including direct contact with the hiring manager

20

18

24

18

21

A4

Willing to invest more for the right talent

17

17

17

18

16

A3

Educational program to train potential candidate

16

14

20

17

14


Mind-Set 2 – Technology Oriented


C4

Work with hiring managers to understand technicalities and screen for best fit

18

19

22

8

28

B4

Streamlines the process, beat competition by moving quicker in hiring process

15

13

20

10

20

C2

Uses most updated hiring technologies

14

11

26

7

20

C3

Uses cloud-based tools … automate and manage process

7

5

16

-3

17


Does not drive either mind-set


A2

Hires temp contract workers until right candidate found

0

-3

7

-12

14

A1

Uses multiple sourcing options…e.g., relationship-marketing, social media and advertising

10

5

23

7

13

D1

Communicate with corporate managers … define needed skill sets

13

12

13

13

12

B3

Involves upper management in meetings

11

7

17

11

11

C1

Uses centralized data & analytics

7

6

19

5

9

D3

Emphasizes why speed important … to find right candidate who fits

8

8

9

13

2

Uses most updated hiring technologies

Sound interview process, including direct contact with the hiring manager

Understands the biggest deciding factor for the candidate

Build appropriate training plans … from hiring manager’s input

Uses multiple sourcing options…e.g., relationship-marketing, social media and advertising

Work with hiring managers to understand technicalities and screen for best fit

Educational program to train potential candidate

Streamlines the process, beat competition by moving quicker in hiring process

Those say they ‘might’ follow up six strong elements, but all are lower than 20.

Understands the biggest deciding factor for the candidate

Work with hiring managers to understand technicalities and screen for best fit

Sound interview process, including direct contact with the hiring manager

Build appropriate training plans … from hiring manager’s input

Willing to invest more for the right talent

Builds relationship and rapport with corporate managers … set right expectations

It is important to note that with these data we see no interest in companies with technology as their focus. Rather, we sense that the general pattern is focus on the candidate, on the human aspect. We will see that this picture of the mind of the job seeker is only half-revealed by standard questions about interest. We will see in a moment that there is another mind-set, technology-oriented, comprising half the population of respondents, but hidden until revealed by the extraction of mind-sets. A far stronger approach to finding differences among people in the population looks at the pattern of their individual coefficients, with the attempt to identify groups of individuals with radically different ways of thinking about the same elements or messages. The segmentation method, clustering, has been well described in the statistics literature [13] and is a mainstay of the Mind Genomics armory. The key is to focus on a micro-area, such as the offerings of the technology personnel company, rather than focusing on a grand division of people. When the segmentation is done on the pattern of coefficients for this ‘micro-topic,’ the results are often dramatic, clear, and compelling. Table 4 shows the coefficients from the two mind-sets. It is clear from Table 4 that Mind-Set 1 comprises individuals who respond to a company which is empathic, and people oriented. Mind-Set 2 comprises individuals who respond to a company which is technology oriented. The differences between the two mind-sets is clear, dramatic, and easy to interpret.

Finding These Mind-Sets In The Population

The mind-sets distribute in the population in ways that cannot be easily predicted. In some occasions we might be sufficiently fortunate to find a co-variation between mind-set membership and some other easily defined. That happy event is not the usual case. Rather, the mind-sets might distribute in a slightly uneven pattern, but not a pattern upon which one could readily rely when assigning individuals to mind-sets for a topic. Except for very common topics it is quite unlikely that there will be either any data on a specific, newly discovered mind-set, such data dealing either with the nature of the mind-set, or the rules to discover individuals with the mind-set. The topics are too small, too focused, too specific, too ‘local’ for general studies of more ‘global’ mind-sets [14]. A different way is needed, one which is grounded in speed, ease, low-cost, and can be adapted quickly to any data set of the type found by Mind Genomics. Recent efforts by author Gere suggest that such a method can be created. The approach is based upon a Monte Carlo simulation of assignments to one of two or one of three mind-sets, based upon the mean coefficients by mind-set of six elements (here 6 of 16). The coefficients are perturbed by noise and searched to identify the elements which most strongly differentiate among the segments. The method creates a set of six ‘questions,’ using the text of the individual elements, creates two answers, and computes the 64 possible patterns. That approach, done 20,000 times in a Monte Carlo simulation, identifies the best six elements, and the most likely mind-set corresponding to each of the 64 possible binary patterns. Figure 2 shows an example of the PVI, the personal viewpoint identifier. The PVI expands the use of the study when the results are to be used to understand prospective clients of the customer. By knowing the mind-set to which each person belongs, one can tailor the appropriate program for the specific individual who has signed on as a client. Furthermore, by knowing the mind-set to which a prospect belongs, the company can send the appropriate messages to convert the prospect to a client.

Discussion – Technical Aids To Creating A Personal Portfolio

When one thinks about the strategies for interviewing, for getting a job, the notion of doing a ‘pilot study’ may seem strange as a way to ‘market oneself.’ Yet, such marketing may become necessary in the evolving world where the combination of critical thinking and ability to do data analytics could be a key part of self-marketing. As far back as 2003 the notion of ‘self-marketing’ was becoming increasingly relevant to students looking for jobs [1]. Fifteen years before, it was already an issue in the world of business schools [2]. The pilot study does not present an individual’s credentials, nor show the individual as a person. Or, in fact, does it? In the world of academics, one often does not proceed with research before one writes a proposal about the research. Quite frequently, it is necessary to buttress that proposal with some preliminary data to show that the approach proposed with come up with meaningful results. Indeed, it is often the case that one must do a study and complete it, doing so surreptitiously, presenting the findings in a proposal, in order to get funding for the study. That is, the study must be presented in proposal form, but with data guaranteeing the success of the project. We suggest here that the thinking of pilot projects as preliminaries to a big project be adopted for job seeking. What has been missing up to now may be an inexpensive, simple, rapid way to do these pilot projects, a way which can demonstrate the capabilities of the job applicant. We suggest that the approach presented here may be expanded to be of use to screen applicants. The screening might be done in two ways, as suggested in the introduction to this paper:

MIND GENOMICS-031_ASMHS-F2

Figure 2. The PVI (personal viewpoint identifier), created to assign a new person to one of the two mind-sets uncovered in this study

HOMEWORK: The Company presents the job applicant with a problem and gives the applicant a week to come up with the specific topic, the four questions, and the four answers to each question. If the job applicant appears to have provided an appropriate set of questions and answer, the company may decide to hire the candidate, even without running the study, simply on the basis of the homework done by the applicant.

ON-SITE PERFORMANCE TEST: This performance test may be done in a defined time period, e.g., five hours, from start to finish, either with the respondent at home, or in the corporate office. In a very strongly competitive market, he company may invite all candidates into a central test site, a room full of candidates with computers, give the candidates specific topic, instruct them to set up the study, run the study, each with 50–100 respondents (paid for by the company), get the results in perhaps two or three hours. The next step would be to measure the quality of the candidate’s thinking by looking at the performance of the elements, the performance of the elements by subgroup, and indeed whether or not the candidate’s actual study has been able to identify new, interesting, and potentially relevant mind-sets. Such a candidate would stand out as promising. The benefits are both a real-life test of abilities, and a possible crowd-sourced solution to a problem faced by the company, with the ‘crowd’ comprising the job applicants ‘doing the thinking’ and the respondents (unknown to anyone, but real people), providing evaluations of what to them are real and meaningful ideas involved with a problem.

Acknowledgement

Attila Gere thanks the support of Premium Postdoctoral Research Program of the Hungarian Academy of Sciences.

References

  1. Taylor KA (2003) Marketing yourself in the competitive job market: An innovative course preparing undergraduates for marketing careers. Journal of Marketing Education 25: 97–107.
  2. Buckley MR, Peach EB, Weitzel W (1989) Are collegiate business programs adequately preparing students for the business world? Journal of Education for Business 65: 101–105.
  3. Hansen K, Oliphant GC, Oliphant BJ, Hansen RS (2009) Best practices in preparing students for mock interviews. Business Communication Quarterly 72: 318–327.
  4. Krannich CR, Krannich RL (1990) Interview for Success. Impact Publications.
  5. Baron RA (1997) Impression Management, Fairness, & the Employment. Journal of Business Ethics 16: 801–810. 
  6. Box GE, Hunter WG, Hunter JS (1978) Statistics for experimenters, New York, John Wiley.
  7. Latham GP, Saari LM, Pursell ED, Campion MA (1980) The situational interview. Journal of Applied Psychology 65: 422–427.
  8. Moskowitz HR, Gofman A (2007) Selling blue elephants: How to make great products that people want before they even know they want them. Pearson Education.
  9. Luce, R.D. & Tukey, J.W., 1964. Simultaneous conjoint measurement: A new type of fundamental measurement. Journal of mathematical psychology 1: 1–27.
  10. Green PE, Rao VR (1971) Conjoint measurement for quantifying judgmental data. Journal of marketing research 8: 355–363.
  11. Green PE, Srinivasan V (1990) Conjoint analysis in marketing: new developments with implications for Research & practice. The Journal of Marketing 54: 3–19.
  12. Gofman A, Moskowitz H (2010) Isomorphic permuted experimental designs & their application in conjoint analysis. Journal of Sensory Studies 25: 127–145.
  13. Dubes RC, Jain AK (1988) Algorithms for Clustering Data. Prentice Hall.
  14. Weinstein A, Cahill DJ (2014) Lifestyle Market Segmentation. Routledge.

Prospects for students as students see them: A Mind Genomics Exploration

DOI: 10.31038/ASMHS.2019351

Abstract

To determine what young people (ages 13–27) feel about the prospects of students after they leave school, we investigated systematically varied vignettes about schools. The vignettes comprised statements (elements) about teachers, the students, the response of the community to the school, and the behavior of the students, respectively, the elements combined according to an experimental design. The data suggest that it is the specific messages, not the general categories of messages, which drive the expectations of good versus poor performance. There is evidence for at least two mind-sets, those focused on the teacher-student relationship versus those focused on the teacher-community relationship. We present the PVI, personal viewpoint identifier, to assign new students to one of the two mind-sets.

Introduction

The world of education is critical for the future of a nation. Educators realize that, and struggle with the appropriate way to educate the student. The issues are complex, the struggles to educate real, and the complexities baffling. The situation is made even more complicated by the realization that education is not just the role of the student and the teacher, but is influenced by society, local and national, by economics, and by the nature of the social matrix from which the student originates. Any introduction should stop there. The literature is too vast.

A cursory review of the truly vast literature reveals the deep concerns with the outcome of education, and the natural consequence, studies of what drives a good outcome. The factors can be as diverse as the nature of the teacher, and especially the preparation for teaching [1], the involvement of the community [2, 3, 4] and of course the nature of the student [5, 6, 7, 8]. The focus of these studies is on outcomes, with the search to discover what factors produce the best outcome. The studies are sociological in nature, however, and do not give a sense of the inner thinking and feeling [9] What is missing from most of these studies, if not all, is a study of the mind of the student, in terms of what motivates the student.

Author Moskowitz applied the approach presented here to study how students want to study mathematics [10]. The objective was to work from the inside of the mind of the student to the outside, to discover the granular features of experience to which a student attends when thinking about what she or he wants in when learning mathematics. This study follows the same approach, working from the inside of the mind of the student to the outside, to discover what a student thinks will drive success five years hence. The approach is psychological in nature, combining projective techniques [11] and applied experimental design (conjoint measurement; [12, 13, 14] a new synthesis embodied in the emerging science of Mind Genomics [15].

The topic of this paper is education, or more specifically the expectations of young paper (ages 13–27) of future success or failure as a function of reading about systematically constructed descriptions of ‘softer aspects’ of the educational situation, primarily dealing with emotions and relations, not on pedagogy. The education situations comprise systematically constructed combinations of answers to four questions, specifically:

The race of the teacher:

The response of the student to the teacher’s race

The economic status of the school area

The reaction of those in the community

Mind Genomics Method

Mind Genomics is a newly emerging science, dealing with the analysis of quotidian, everyday experiences, and how people judge the different aspects of these experiences [15] The objective of the Mind Genomics studies is to identify which aspects of a situation are most relevant to the individual. Mind Genomics uses small, easy-to-run, affordable, rapid, and manageable experiments to understand how a person evaluates the different aspects of experience to arrive at a judgment. Experiments mean that Mind Genomics ends up tracing responses to specific independent variables. For the case of education in the study reported here, the experiment allows us to trace how a person’s estimate of student performance in five years relates to a variety of independent variables,, such as the race of the teacher, the reaction of students to the teacher, the nature of the students, and the nature of the local community in which the school is located.

It should become obvious from the description above that Mind Genomics differs profoundly from the analyses of education appearing in the scientific literature. The traditional approaches to education focus on a description of ‘what happened’ (description) and ‘what should happen’ (prescription.) These approaches work in the world of the external. Mind Genomics moves insight, looking at how people think and feel about the everyday. Thus, Mind Genomics provides a new direction by which to understand education specifically in this paper, but a person’s thinking in general. Mind Genomics follows a series of well-defined steps, using a combination of raw materials developed by a Socratic approach, evaluation by respondents of vignettes comprising mixtures of these materials (field work), and then the deconstruction of the responses into the contributions of the individual elements (analysis.) The results reveal what the respondents feel to be the most important factors for future success. Mind Genomics works at the granular level, so the results can lead both to knowledge and to application.

Test stimuli

The test stimuli comprise a series of questions which tell a story. The questions never appear in the study but are only inserted into the Socratic process to give the test stimuli, the vignettes, a structure. (Figure 1) shows the screen shot of the program, giving a sense of how the researcher is guided in critical thinking. For each question the researcher is prompted to give four different answers, the answers being simple stand-alone phrases communicating different ideas appropriate for the question. (Figure 2) shows a screen shot of the program, showing how the researcher is guided to give the four answers to one question. The structure of the underlying technology is limited to four questions, each with four answers. That structure was designed to allow researchers to work in ‘real time,’ identify a topic, phrase the four questions, provide the answers, and launch the study, all within a period 30–45 minutes, with the answers coming back an hour or two after launch. Such speed and a process, which essentially constitutes a complete circle, can only be accomplished by following a simple template, such as the template followed here. The four answers comprise just enough text to convey the answer, and no more. The Mind Genomics system encourages the researcher to focus on the idea, not on an elegant, dense paragraph of information. The ingoing assumption is that the respondent will graze, rather than read each test stimulus, and so the answer must be simple and ‘punchy.

MIND GENOMICS-030_ASMHS_F1

Figure 1. The set-up program, requiring the respondent to create the four questions.

(Table 1) shows the four questions, and the four answers to each question. The objective of Mind Genomics studies of this type is to explore and map an area, either a large area in general with little detail, or very meticulously and great deal for a small, circumscribed, limited areas. It is vital, however, that researchers avoid the deadly ‘analysis paralysis’ which affects so much consumer research, wherein one has only one study to discover the answers. The Mind Genomics system is iterative, so that the set of questions and answers can be revised on a second iteration, and on further iterations, to achieve a granular understand of the problem.

Table 1. The four questions and the four answers to each question.

Question A: What is the race of the teacher

A1

teacher is black

A2

teacher is Caucasian

A3

teacher is Asian

A4

teacher is Hispanic

Question B: What is the student response to teacher race

B1

students are docile

B2

students are antagonistic towards teacher

B3

students identify with teacher race

B4

students are accepting of the teacher

Question C: economic status of school area

C1

school in depressed area

C2

school in gentrified area

C3

school in established middle class area

C4

school in area with many new immigrants

Question D: reaction of other school neighbors

D1

community supports educators

D2

community indifferent to educators

D3

community hostile to educators

D4

community embraces educators

Experimental Design:

Mind Genomics works by combining the answers (but not the questions) into short, easy-to-read combinations called vignettes or concepts. Each vignette comprises at most one answer from a question. The four questions need not contribute an answer to the vignette. The experimental design, really a ‘recipe book’ prescribes the specific set of 24 vignettes to be presented to a respondent. Some of the vignettes comprised four answers, one answer from each of the four questions. The experimental design also prescribes some vignettes to have three answers, with the answer from one of the questions absent. Some vignettes comprise only two questions. The creation of such ‘incomplete’ vignettes enables the 16 answers to be statistically independent of each other, and thus analyzable by OLS (ordinary least squares) regression. Each respondent evaluated a unique set of 24 vignettes. The underlying experimental design was maintained, but the specific combinations changed, doing so according to a permutation scheme which defined new combinations [16]. By permuting the combinations, the Mind Genomics experiment with its 50 respondents covers many alternative combinations, the so-called design space. The rationale for testing many combinations, each with about 1–2 ratings, rather than testing the same set of 24 vignettes with 50 ratings, emerges from the worldview of Mind Genomics, which is based in the notion of cartography of the mind. The objective is to explore different aspects of how we make decisions, rather than to explore one specific aspect using many replicate judgments to average out ‘noise.’

MIND GENOMICS-030_ASMHS_F2

Figure 2. Screen shot showing how the researcher is guided to assign four answers to one question.

The vignettes

The test stimuli comprised vignettes. The vignette presented a short orientation statement at the top, and then the requisite 2–4 answers or elements prescribed by the underlying experimental design. There was not effort to make the 2–4 answers or elements ‘flow together’, by constructing a paragraph. Rather, the 2–4 answers were presented as simple phrases, stacked one atop another, without concern for the ‘sense’ of the combination. This simple and austere structure makes the respondent’s job easier. The respondent simply inspects the vignette and assigns a rating. With 24 vignettes to rate it is important to make the experience pleasant, not onerous It is important to avoid the dense paragraphs, constructed with connectives, paragraphs which are grammatically correct but difficult to read, and increasingly aversive as the respondent ‘plows through’ paragraph after paragraph. The Mind Genomics layout, stark as it is, reduces the onerous task.

Rating Scale

The 5-point rating scale, shown in (Table 2), allows the respondent to tell the researcher how she or he feels about the student, after reading the vignette. In psychological terms, the study actually invokes aspects of a projective test, where the respondent looks at a picture and tells a story. This projective method enables the researcher to understand the mind of the respondent, since the respondent is given no specific information about the students in the vignette, other than what is presented about the school situation itself. The only way that the respondent can assign a rating to the vignette is by projecting her or his feelings onto the situation as described.

Table 2. The 5-point rating scale and the two anchors.

Rating question:

The student LIFE SKILLS in 3 years

Low Anchor: Rating question

1=remain the same

High Anchor: Rating question

5=big positive change

Running the Experiment

The on-line study was run with 50 respondents, ages 13–27, half 13–19, half 20–27. The respondents for these studies are members of a very large group of on-line panels, connected by Luc.id, Inc., the strategic partner of Mind Genomics. The respondents (more than 20 million in total in the United States alone) have agreed to participate in these studies, for ‘considerations’ which increase their motivation to participate. The respondent identity and terms of agreement to participate are not relevant to the effort. The respondents are invited by Luc.id on behalf of the research project. The financial incentives and the panel make the research process go smoothly, with the entire study complete within 1–2 hours, with the data ready to report, or available for reanalysis, as was done here. The study was completed early June 2019, in one afternoon.

Moving From the Ratings to A Binary Scale

Mind Genomics follows the general approach of consumer research in terms of working with scales. Consumer researchers who use Likert scales, such the 5-point scale featured here, do not necessarily know what the scale means, even when the scale is anchored at both ends. A strategy to circumvent the problem of lack of understanding yet keep the scale for subsequent analyses, transforms the 5-point scale to a binary scale, with the convention that ratings of 1–3 are transformed to 0, and ratings of 4–5 are transformed to 100, respectively. The transformation produces a binary scale, understandable by those who use the scale, and easy to communicate.

In this study we transformed the 5-point rating in two ways:

Good Outcome: Ratings of 1–3 are transformed to 0 to denote a ‘not good outcome.’ Ratings of 4–5 are transformed to 100 to denote a ‘good outcome.’

Poor Outcome: Ratings of 1–2 are transformed to 100 to a denote a ‘poor outcome’. Ratings of 3–5 are transformed to 0 to denote a ‘not poor outcome.’

Note that a ‘not good outcome’ is not the same as a ‘poor outcome,’ and a ‘not poor outcome’ is not the same as a ‘good outcome.’

Relating the Presence/Absence of the Answers/Elements to the Binary Rating 0/100

Once the ratings are transformed, one can use OLS (ordinary least-squares) regression to relate the presence/absence of the 16 elements to the binary rating. Each respondent tested a variant of the basic experimental design, with the design ensuring that all he 16 elements or answers were statistically independent of each other. The design itself, and the permutation on top of the basic design, ensures that the OLS regression will be working with data appropriate for OLS regression. (Table 3) shows the parameters emerging from the OLS models from the total panel, comprising 1200 observations or cases (50 respondents, 24 observations or datapoints for each respondent.)

Table 3. Coefficients from the total panel for the model relating the outcome to the presence/absence of the 16 elements.

MODEL FOR

 Total Panel

Good Outcome

Poor Outcome

 Additive constant

37

23

D1

community supports educators

11

-8

B4

students are accepting of the teacher

10

-8

D4

community embraces educators

9

-5

A2

teacher is Caucasian

7

-2

B3

students identify with teacher race

6

0

C2

school in gentrified area

6

-3

C4

school in area with many new immigrants

5

-4

C3

school in established middle class area

4

0

A1

teacher is black

2

-2

B1

students are docile

2

1

A3

teacher is Asian

1

-3

A4

teacher is Hispanic

1

-6

C1

school in depressed area

-5

7

D2

community indifferent to educators

-5

5

D3

community hostile to educators

-11

15

B2

students are antagonistic towards teacher

-17

22

Additive constant: Expected percent of the time that the response will be ‘good outcome’ or ‘poor outcome’ in the absence of elements. All 24 vignettes evaluated by a respondent comprised 2–4 elements by design, so that additive constant is a purely estimated parameter. Nonetheless, the additive constant gives a good sense of the likelihood of a positive or negative response, almost a ‘baseline’ likelihood. Coefficient: Each element generates its own coefficient from the OLS regression. The results do not surprise. The table shows the strong performing elements. Statistical tests as well as observations from real life using the data suggest that coefficients of 8 or higher are associated with strong outcomes, whether positive or negative.

Key elements driving a perceived likelihood of a good outcome:

community supports educators

students are accepting of the teacher

community embraces educators

Key elements driving a perceived likelihood of a poor outcome:

community hostile to educators

students are antagonistic towards teacher

Positive Outcomes – Models by Who The Respondent IS:

The support data for these observations come from (Table 4). When we look at the respondents by gender, we find that, to begin with, men are more optimistic than women (additive constant 44 for men versus 30 for women). Women respond to many of the specifics, however, whereas men do not. To the women, the most important element is that the community support educators, an element which is not particularly relevant to men. When we look at respondents by age, we again see differences. The younger respondents are less optimistic about a positive outcome than are the older respondents (additive constant 34 versus 44.) There are no dramatic differences by age, however, at least differences that can be explained easily. When we look at the neighborhood from which the respondent comes, we find that respondents from neighborhoods that they define as poor are less optimistic than the respondents from rich neighborhoods, and they, in turn, are less optimistic than respondents from up and coming neighborhoods (additive constant 31 vs 37 vs 42.) Respondents from the poor neighborhoods believe that it is both the student response to the teacher and the community response to the teacher which will generate a positive outcome for the student.

Table 4. Relation between the presence/absence of elements and the likelihood of a POSITIVE outcome for the student.  The columns refer to who the person IS.

Gender

Age

Neighborhood


Positive outcome

Male

Female

13–19

20–27

Poor

Up & coming

Rich

Additive constant

44

30

34

44

31

42

37

A1

teacher is black

-4

9

3

1

-15

1

14

A2

teacher is Caucasian

3

10

13

0

-7

8

12

A3

teacher is Asian

-14

15

-1

1

2

-3

4

A4

teacher is Hispanic

-7

9

4

-4

-6

-3

9

B1

students are docile

5

-2

1

2

19

-2

-3

B2

students are antagonistic towards teacher

-13

-20

-19

-15

-2

-17

-28

B3

students identify with teacher race

7

7

0

11

20

4

2

B4

students are accepting of the teacher

5

15

6

13

22

7

14

C1

school in depressed area

-1

-10

-3

-8

0

-5

-22

C2

school in gentrified area

5

5

1

9

8

5

2

C3

school in established middle class area

2

6

3

2

9

4

-5

C4

school in area with many new immigrants

4

5

7

1

3

3

5

D1

community supports educators

3

19

10

12

21

4

23

D2

community indifferent to educators

-7

-4

-10

-2

-3

-10

5

D3

community hostile to educators

-5

-16

-8

-14

1

-12

-14

D4

community embraces educators

5

14

11

6

15

8

14

Negative outcomes:

(Table 5) shows the results when we look at the scale in the opposite directions, with ratings of 1–2 (poor outcome) transformed to 100. The additive constants are all low, meaning that in general there is not an overwhelming negative feeling among the respondents. Yet there are some dramatic differences in baseline negativity among complementary groups. Females are more pessimistic than males (additive constant 31 for females versus 13 for males.) Younger respondents are more pessimistic than older respondents (additive constant 30 versus 14.) Those respondents coming from a self-defined poor neighborhood are more pessimistic than respondents coming from an up and coming neighborhood and a rich neighborhood (additive constant 38 vs 18 and 14)

Table 5. Relation between the presence/absence of elements and the likelihood of a NEGATIVE outcome for the student.  The columns refer to who the person IS.

Gender

Age

Neighborhood


Negative outcome

Male

Female

13–19

20–27

Poor

Up & coming

Rich

Additive constant

13

31

30

14

38

18

14

A1

teacher is black

1

-6

-3

-2

-4

0

0

A2

teacher is Caucasian

4

-8

-7

3

4

0

-6

A3

teacher is Asian

5

-10

-2

-4

-1

3

-9

A4

teacher is Hispanic

1

-13

-8

-4

-13

-1

-8

B1

students are docile

-2

4

1

2

-2

0

5

B2

students are antagonistic towards teacher

18

25

24

20

24

16

37

B3

students identify with teacher race

2

-3

-3

2

-10

-3

11

B4

students are accepting of the teacher

-4

-11

-8

-6

-20

-4

-5

C1

school in depressed area

7

9

4

11

6

8

11

C2

school in gentrified area

-6

1

3

-8

-4

-1

0

C3

school in established middle class area

1

1

-2

4

0

3

-1

C4

school in area with many new immigrants

-6

0

-5

-1

-7

-2

-11

D1

community supports educators

1

-16

-15

1

-19

-4

-5

D2

community indifferent to educators

11

0

4

7

10

7

1

D3

community hostile to educators

12

19

13

13

20

D4

community embraces educators

5

-14

-12

-3

-7

The keys to a poor future from the set investigated here are similar across groups)

students are antagonistic towards teacher

community hostile to educators

school in depressed area (except for those respondents coming from a self-described poor area)

Interactions between pairs of elements (scenario analysis)

A recurring question in the assessment of attitudes through experimentation is whether it is possible to identify interactions between ideas. We know from everyday life that changing the framework of a story from one venue to another may shift the way one evaluates the events in the story. Lawyers know the value of reframing to affect the nature of the facts of events, and perhaps affect the way a judge or jury evaluates the other facts. The foundations of Mind Genomics in permuted experimental design allowed for the evaluation of interactions when the design was constructed to account for those interactions. Conventional experimental design deals with a limited number of different variables, making it necessary to ‘build in’ the appropriate test stimuli in order to capture these interactions. The key is that the researcher must know the interactions to explore ahead of time, knowledge which guides the specific combination. The permutation algorithm of Mind Genomics creates many different combinations, a side benefit of which is the ability to test the interactions of pairs of elements in an efficient manner. The approach has been called scenario analysis [15].

In simple terms, one identifies a specific question (e.g., Question C; where the school is), and recodes every one of the cases with one of five numbers, depending upon the answer to the question as it appears in the vignette. Putting this into operation we sort the 1200 vignettes into five strata or groups, depending upon the value of the answer to Question C. There will be vignettes which lack any mention of the area of the school (C=0), vignettes which mention that the school is in a depressed area (C1), vignettes which mention that the school is in a gentrified area (C2), vignettes which mention that the school is in an established middle class area (C3), and finally vignettes which mention that the school is in an area with many new immigrants (C4). The foregoing stratification allows us to apply OLS regression to each stratum separately. The model comprises the additive constant, and 12 predictor variables, rather than the original 16. The model immediately shows how the mention of an area where the school IS affects the coefficients.

(Table 6) shows the results for the total panel, for the positive outcomes. (Table 7) shows the results for the total panel for the negative outcomes. The elements are sorted by the coefficient value when ‘no area mentioned.’ (Table 6) shows some noteworthy interactions When no area is mentioned, the additive constant is 83. Students are very positive. Without any information about the area, the expectation is almost 100% for a positive outcome when we talk about a positive community. Moving to mentions of areas generates far lower additive constants, at least half the magnitude of the additive constant when the fixed message is school in a depressed area, and a quarter the size of the additive constant when the fixed message is school with many new immigrants. When the school is in a depressed area, the respondents feel that it will be the community which can help. When the school is in a gentrified area, the respondents feel that a Caucasian teacher will be best for the student future. When the school is in an established middle-class area and when the school is in an area with many new immigrants, there will be many factors which drive an expectation of a positive future. When we look at the negative outcomes, we find that the expectations are low for negative outcomes, except for mentioning that the school is in an area with many new immigrants (high additive constant = 40.) There are only a few elements which are consistently problematic, and bode badly for the students:

students are antagonistic towards teacher

community hostile to educators

Table 6. How specifying the location of the school interacts with other elements of the vignette to drive a POSITIVE expected outcome for the student.

Positive Outcome

no area mentioned

school in depressed area

school in gentrified area

school in established middle class area

school in area with many new immigrants


Additive constant

83

42

42

35

21

D4

community embraces educators

18

5

4

-2

28

D1

community supports educators

12

12

5

8

21

D2

community indifferent to educators

6

-11

-1

-16

1

A2

teacher is Caucasian

-4

-2

14

9

17

A3

teacher is Asian

-6

-5

-4

13

10

D3

community hostile to educators

-13

-11

-22

-11

3

A1

teacher is black

-16

-2

6

10

14

A4

teacher is Hispanic

-18

-1

-2

12

10

B3

students identify with teacher race

-26

-6

7

19

11

B4

students are accepting of the teacher

-34

3

15

19

13

B1

students are docile

-47

8

5

4

9

B2

students are antagonistic towards teacher

-52

-18

-6

-17

-19

Table 7. How specifying the location of the school interacts with other elements of the vignette to drive NEGATIVE expected outcome for the student.


Negative Outcome

no area mentioned

school in depressed area

school in gentrified area

school in established middle class area

school in area with many new immigrants


Additive constant

22

17

8

27

40

B2

students are antagonistic towards teacher

15

33

21

19

17

D3

community hostile to educators

15

19

27

10

5

B1

students are docile

8

1

1

-2

0

A4

teacher is Hispanic

6

-4

-13

-6

-12

A3

teacher is Asian

3

-5

-3

-3

-12

A1

teacher is black

2

-1

5

1

-15

D2

community indifferent to educators

2

16

7

4

-5

A2

teacher is Caucasian

1

1

-10

9

-13

B3

students identify with teacher race

-1

7

7

-10

-4

B4

students are accepting of the teacher

-4

2

2

-19

-13

D1

community supports educators

-16

3

9

-16

-17

D4

community embraces educators

-18

-3

12

6

-22

Mind-Sets

One of the ongoing features of the emerging science of Mind Genomics is the search for mind-sets, defined as different ways of thinking about the same ideas. We are all familiar with different patterns of preferences for food. People may perceive food in the same way in terms of the sensory aspects, but some people love the food, whereas others may feel indifferent or even dislike the food. The same differences in opinion occur for ideas, such as one’s perception of the causes of positive versus negative outcomes for students, the topic studied here. Mind Genomics uncovers these different mind-sets, or viewpoints, by creating individual-level equations for each of the respondents, and then clustering the respondents using the pattern of the coefficients. Translating the approach to our data, the algorithm for uncovering mind-sets begins by creating 50 equations relating the presence/absence of the 16 elements or answers to the rating. Each respondent generates a unique set of coefficients, a straightforward process because the 24 vignettes evaluated by each respondent constituted an experimental design. The process then finds the ‘distance’ between each pair of the respondents, putting the respondents into two and then three non-overlapping groups so that the ‘distances’ are small between pairs of respondents within a group, and the distance is large between the averages of groups (different mind-sets).

Clustering is a well-accepted process in statistics [17]. The outcome of clustering is a set of different groups, created by mathematical, not intuitive criteria. The mind sets should be as few as possible (parsimony), so that they can lead to differential actions when the knowledge of the mind-sets becomes available (e.g., different messaging), and interpretable, so that the clustering makes sense. (Table 8) suggests two different mind-sets, focus on the teacher, and focus on the community. The mind-sets are named in accordance with the nature of the elements or answers to questions generating the highest coefficients. The radical difference between the relatively low values for the highest coefficients from the total panel (Table 4) suggest that within the population we end up with ‘damped’ or suppressed results because there are opposing forces that we cannot see, mutually contradicting each other. Knowing these mind-sets enables the researcher to assess the results from other studies, first by putting the students into the proper mind-set, and then determine whether the measured outcome co-varies with mind-set in a meaningful way.

Table 8. Mind-Set differences in the relation between the presence/absence of elements and the likelihood of both positive and negative outcomes.

Positive Outcome

Negative Outcome

Teacher – Student

Teacher -Community

Teacher – Student

Teacher -Community

Additive constant

28

44

29

17

Mind Set 1 – Focus on the teacher-student interaction

B4

students are accepting of the teacher

23

-1

-11

-4

B3

students identify with teacher race

21

-7

-7

6

C3

school in established middle class area

17

-8

-6

6

B1

students are docile

14

-8

2

1

C2

school in gentrified area

11

1

-5

-2

C4

school in area with many new immigrants

11

-1

-3

-4

A3

teacher is Asian

9

-7

-8

3

A2

teacher is Caucasian

8

5

-8

2

Mind Set 2 – Focus on the teacher-community interaction

D1

community supports educators

0

22

-6

-10

D4

community embraces educators

1

17

-6

-4

D3

community hostile to educators

-19

-1

17

12

C1

school in depressed area

6

-13

9

6

B2

students are antagonistic towards teacher

-6

-26

19

25

Not relevant to either Mind Set

A1

teacher is black

-1

5

-7

1

D2

community indifferent to educators

-15

4

5

5

A4

teacher is Hispanic

4

-3

-6

-5

Finding These Mind-Sets In The Population

A commonly held misconception is that WHO a person IS determines how the person thinks. That is, a great deal of marketing and policy behavior assumes that those who are similar on easy-to-measure variables are similar to each other in terms of the way they think. Sometimes this approach can generate an unduly number of clusters, or personas, in attempt to be general across many areas, yet sufficiently granular to be ‘actionable’ so that the recommendations are specific. The Mind Genomics ‘project’ continues to suggest that there are well-defined mind-sets, emerging not so much from who the person is as from the way the person responds to a specific set of messages. Membership in a mind-set for one topic area does not predict (as yet) membership in another mind-set created for a different topic area.

(Table 9) shows the breakdown of membership in the two mind-sets. It is very difficult to identify a variable which predicts mind-set membership in this newly discovered pair of complementary mind-sets. Furthermore, in the world of everyday experience, there are so many different types of experiences, and so much granularity that the effort to assign new people to the discovered mind-sets will probably not be very successful if the only data is WHO the person is, or WHAT the person does. A different approach is represented by the PVI, the personal viewpoint identifier. The PVI is constructed for a specific topic by identifying the elements which best differentiate between or among mind-sets, converting them to questions, with a binary response scale, and then computing the full set of possible patterns of responses, and the mind-set to which each pattern of response most likely belongs. (Figure 3) presents the PVI. The respondent and/or the group commissioning the study receive the feedback about the respondent, shown for example in (Figure 4). The same information can be sent to the respondent.

MIND GENOMICS-030_ASMHS_F3

Figure 3. The six question PVI for mind-sets in education. As of this writing (September, 2019) the PVI is located at this website: https://www.pvi360.com/TypingToolPage.aspx?projectid=91&userid=2018

MIND GENOMICS-030_ASMHS_F4

Figure 4. The feedback page to the respondent. The respondent, a new individual, is assigned to the mind-set that is shaded based upon the pattern of answers to the first six questions in Figure 3.

Table 9. Classification profiles of the total panel and the two mind-sets.


Total

Mind-Set Teacher

Mind-Set Community

Total

50

23

27


Male

25

10

15

Female

25

13

12

Age 13–19

24

10

14

Age 20–27

26

13

13


Total

50

23

27

Poor

10

8

2

Rich

11

2

9

Up-Coming

24

9

15

Messages Which Engage- Response Time and Attention

In the history of experimental psychology there has been a movement to measure non-cognitive variables, such as response time (reaction time), heart rate, and so forth, with the belief that these measures somehow ‘reveal’ other processes of decision-making, processes which are not under conscious control, and thus somehow ‘more true.’ [18] talks about the original efforts of experimenters such as Wilhelm Wundt, to understand these deep psychological processes by measuring the time between the presentation of a stimulus and the time needed for the observer (respondent) to react. The longer response or reaction times were assumed to be filled with unconscious decision processes. Following this worldview, we introduce the response time measure as a way to estimate the length of time required for a respondent to ‘process’ the information in a vignette. The approach follows the analytic structure done for the binary transformed ratings. The only differences are that the dependent variable is the response time in seconds (to the nearest tenth of a second), and the regression equation does not have an additive constant. The rationale for no additive constant comes from the reasoning that in the absence of any elements in the vignette the response time is 0 seconds. (Table 10) shows the estimated response time for total panel, gender, age, neighborhood, and finally the two mind-sets. To make discovery easier, we have sorted the response time from long to short (more engaged to less engaged) by the total panel and highlighted in shaded cells all response times of 1.3 seconds or longer for an element. The choice of 1.3 seconds is arbitrary, but represents quite a long processing time for an element, consistent with other research findings which show that studies of socially and personally relevant issues generate long response times, whereas studies of messaging about commercial products and services generate quite short response times, rarely longer than 0.5 seconds.

Table 10. Response time (in seconds) to the 16 elements, by Total Panel and key subgroup.

Gender

Age

Neighborhood

Mind-Set


Total

Male

Female

13–19

20–27

Poor

Up & Coming

Rich

Focus Teacher

Focus Community

B4

students are accepting of the teacher

1.3

1.2

1.3

1.4

1.1

0.8

1.6

1.2

1.0

1.5

B3

students identify with teacher race

1.3

1.1

1.4

1.2

1.2

1.1

1.2

1.3

1.3

1.2

D2

community indifferent to educators

1.1

0.9

1.4

1.5

0.8

1.4

1.0

1.3

1.0

1.3

B2

students are antagonistic towards teacher

1.0

1.0

1.0

1.3

0.8

0.6

1.1

1.0

0.8

1.2

D3

community hostile to educators

1.0

0.9

1.2

1.4

0.7

1.5

1.0

0.8

1.0

1.1

D4

community embraces educators

1.0

1.0

1.0

1.4

0.7

1.4

0.8

0.8

0.9

1.1

C2

school in gentrified area

1.0

1.1

1.0

1.1

1.0

0.8

1.2

0.7

1.2

0.9

C3

school in established middle class area

1.0

0.7

1.3

1.1

1.0

0.9

0.8

1.3

1.1

0.9

D1

community supports educators

0.9

0.9

0.8

1.5

0.2

1.1

1.1

0.4

0.5

1.2

C4

school in area with many new immigrants

0.9

0.6

1.2

1.0

0.7

0.3

1.1

0.5

0.9

0.8

C1

school in depressed area

0.9

0.5

1.3

1.1

0.7

1.2

0.7

0.4

1.2

0.6

B1

students are docile

0.8

0.7

0.8

0.9

0.6

0.3

0.9

0.9

0.5

1.0

A4

teacher is Hispanic

0.7

0.6

0.8

0.1

1.3

1.1

0.5

1.7

0.8

0.6

A2

teacher is Caucasian

0.6

0.3

0.9

0.3

1.0

0.4

0.6

1.5

0.5

0.7

A1

teacher is black

0.6

0.4

0.7

0.2

1.0

0.8

0.3

1.3

0.6

0.6

A3

teacher is Asian

0.4

0.5

0.4

-0.1

0.9

0.6

0.3

1.4

0.6

0.4

The patterns emerging can be summarized as follows:

Total panel – Only one element engages

students are accepting of the teacher

Males – No element engages attention for the requisite 1.3 seconds

Females – No clear pattern, but appear to read the material in greater depth than do males

students identify with teacher race

community indifferent to educators

students are accepting of the teacher

school in established middle class area

school in depressed area

Age 13–19 – Respond to many elements about the community

community indifferent to educators

community supports educators

students are accepting of the teacher

community hostile to educators

community embraces educators

students are antagonistic towards teacher

Age 20–27 – Only one element engages

teacher is Hispanic

Poor Neighborhood – Elements having to do with the community

community hostile to educators

community indifferent to educators

community embraces educators

Up & Coming Neighborhood

students are accepting of the teacher

Rich Neighborhood – Focus on the nature of the teacher

teacher is Hispanic

teacher is Caucasian

teacher is Asian

students identify with teacher race

community indifferent to educators

school in established middle class area

teacher is black

Mind-Set 1 – Focus on Teacher

students identify with teacher race

Mind-Set 2 – Focus on Community – no clear pattern

students are accepting of the teacher

community indifferent to educators

Discussion and Conclusions

As of this writing, there is an increasing focus on the educational system, in terms of its ability to prepare the students. There are those who believe that the education system is ‘fine,’ because it complies with specific government objectives, and therefore there is little to worry about. There are others who believe that the education system is, in fact, a mess, resulting from the teacher’s focusing on ‘performance of standardized tests,’ and not on real teaching. Almost sixty years ago, educator Dr. Banesh Hoffmann, mathematics professor at Queens College and education refeormer, called out the education establishment in his controversial book, ‘The Tyranny of Testing.’ [19]. (Full disclosure; Professor Hoffmann was the major mathematics professor of author Moskowitz in 1964–1965, and contributed to the thinking which appears in this chapter) Today, there is an opportunity to reform education, to improve. The world has changed dramatically, the availability of technical aids to education and to creative thought has never been greater. The students of everyday are becoming increasingly sophisticated with computer electronics and even with coding thanks first to the widespread use of smartphones, and the social approbation given to coding.

When we step back, from the specifics to the general, and work with young people ages 13–27, we see that we have two groups. One group of young people feel that success is due to the interaction between the teacher and the student. Another group, a bit larger, feels that the success of a student is due far more to the interaction between the teacher and the community, specifically the community actively supporting the teacher. From the point of view of policy, it might well be a good idea to use this type of information to craft a dual message, how the teacher is a key, positive support to the student, and the community is a key, positive support to the teacher and the student. This PR campaign needs the specific words to use, a next step in the research effort reported here.

Acknowledgement

Attila Gere thanks the support of Premium Postdoctoral Research Program of the Hungarian Academy of Sciences.

References

  1. Hollins ER (2011) Teacher preparation for quality teaching. Journal of Teacher education 62: 395–407.
  2. Epstein JL and Sheldon SB (2006) Moving forward: Ideas for research on school, family, and community partnerships. SAGE handbook for research in education: Engaging ideas and enriching inquiry Pg No. 117–138.
  3. Kuh GD (2001) Organizational culture and student persistence: Prospects and puzzles. Journal of College Student Retention: Research Theory & Practice 3: 23–39.
  4. Kuh GD (1995) The other curriculum: Out-of-class experiences associated with student learning and personal development. The Journal of Higher Education 66: 123–155.
  5. Berger JB (2001) Understanding the organizational nature of student persistence: Empirically-based recommendations for practice. Journal of College Student Retention: Research Theory & Practice 3: 3–21.
  6. Bickel R and Papagiannis G (1988) Post-high school prospects and district-level dropout rates. Youth & Society 20: 123–147.
  7. Jordan WJ and Cooper R (2003) High school reform and Black male students: Limits and possibilities of policy and practice. Urban Education 38: 196–216.
  8. Kao G and Thompson JS (2003) Racial and ethnic stratification in educational achievement and attainment. Annual review of sociology 29: 417–442
  9. Heath AF, Rothon C, Kilpi E (2008) The second generation in Western Europe: Education, unemployment, and occupational attainment. Annual Review of Sociology 34: 211–235.
  10. Moskowitz HR and Park B (2015) How students want to study mathematics. Unpublished observations.
  11. Steinman RB (2009) Projective techniques in consumer research. International Bulletin of Business Administration 5: 37–45.
  12. Box GE, Hunter WG, Hunter JS (1978) Statistics for experimenters, New York, John Wiley.
  13. Green PE and Rao VR (1971) Conjoint measurement for quantifying judgmental data. Journal of Marketing Research 8: 355–363.
  14. Green PE and Srinivasan V (1990) Conjoint analysis in marketing: new developments with implications for research and practice. The Journal of Marketing 54: 3–19.
  15. Moskowitz HR and Gofman A (2007) Selling blue elephants: How to make great products that people want before they even know they want them. Pearson Education.
  16. Gofman A and Moskowitz H (2010) Isomorphic permuted experimental designs and their application in conjoint analysis. Journal of Sensory Studies 25: 127–145.
  17. Dubes R and Jain AK (1980) Clustering methodologies in exploratory data analysis. Advances in Computers 19: 113–238.
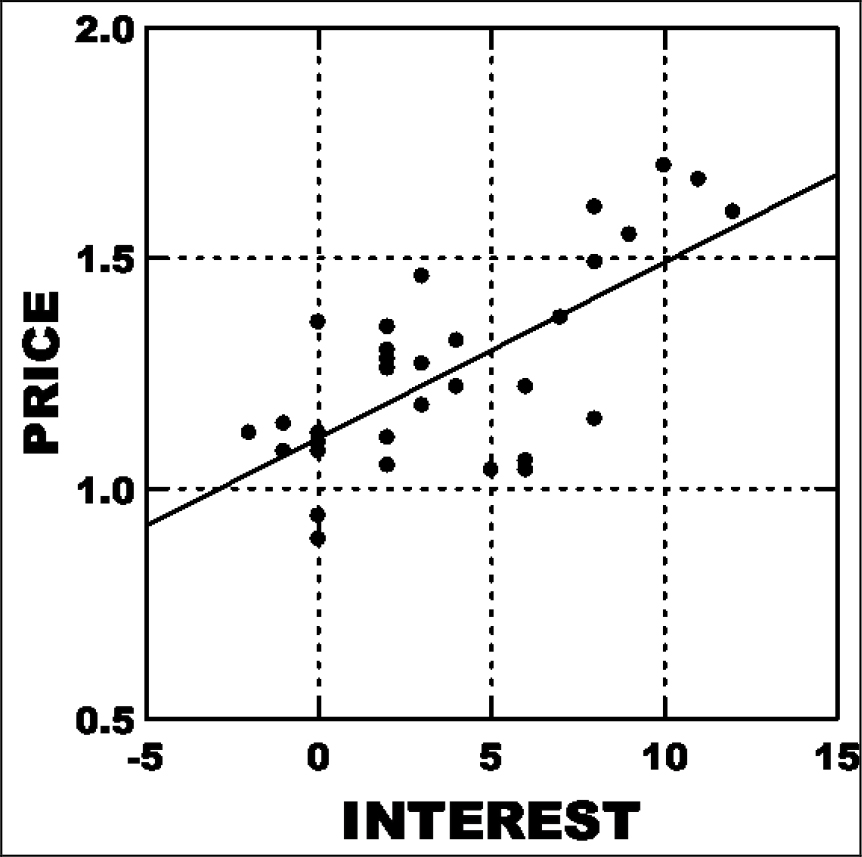
  18. Boring EG (1929) A History of Experimental Psychology. The Century Company, NY.
  19. Hoffmann B and Barzun J (2003) The tyranny of testing. Courier Corporation.

Preparing Nursing Students to Meet Public Expectations While Preserving Professional Values: Mind Genomics Cartography of The Public’s Voice

DOI: 10.31038/AWHC.2019262

Abstract

We present a new approach to designing a school and its curriculum. The approach is based upon experimental design of ideas, in which the researcher combines different features of a curriculum, creates a set of vignettes or test combinations, obtains responses from prospective students and others, and then deconstructs the response into the contribution of each individual element or idea. The approach is efficient, cannot be ‘gamed,’ and enables the designer to identify new to the world mind-sets of prospects. These mind-sets entail different ideas about what members of each mindset want. We finish by showing a personal viewpoint identifier, which enables the designer to assign a new person, student, faculty, or donor to one of the mind-sets uncovered. This approach can become a tool for designing a health-professional curriculum.

Introduction

With the increasing costs of medicine in these early decades of the 21st century, the profession of nursing is undergoing a renaissance. Nurses are becoming recognized as major players in the profession of health care [1, 2]. Nursing has advanced from care to a professional skill in various specialties growing towards a graduate profession status [3, 4]. As with any profession, there is a continuing need to monitor what the desire of customers. This study examines expectations of the public from nursing school. We present the general population with a variety of concepts or ‘vignettes’ about a nursing school, measure their reactions to these vignettes, and then uncover the most appealing concepts per mind-set.

The professional role of nurses is based on the socialization of a set of patterns of behavior. These patterns are embodied in the patient-nurse interactive relationship. The behavior requires skills, knowledge and behaviors based on values, attitudes, guided by the overarching goal of promoting a positive clinical outcome and patient well-being [5]. Nurses assimilate their professional identity through teaching and clinical practice, a combination which generates the ability to cope with the tension between the professional standardization and the nurse’s own individuality and proclivities [6]. Professional education in nursing functions as a disciplinary mechanism design to engender a professional ‘ideology’ and a professional identity as a medical profession stressing the biomedical model [5]. In contrast, the reality of nurses in clinical practice eventuates into what might well be described as shock as they witness traumatic events in the healthcare environment. The unexpected events which occur, often quite frequently, coupled with the individual styles of behavior displayed by senior professional nurses lead to anxiety and dissonance, responses often evident in the published literary discourse regarding the education in Nursing. Anxiety and dissonance are responses to the chasm separating the “theoretical-educational nursing learned in the classroom, the theory as opposed to the reality, the clinical practice experience at hospitals.

There is a looming gap between professional idealism and clinical- practice realism [7, 8]. Professional idealism highlights values of compassion, empathy, holism, cultural competency, and patient-centered care [9, 10]. Reality occasionally eventuates into other behaviors. The ability of nursing students to introject and then realize these values is inhibited by organization constraints and processes, burnout of nurses and staff shortages. All of the former have negative consequences, diminishing the opportunity to develop meaningful relationships with patients, and chipping away at both the satisfaction and sense of mission among nursing students [11]. After completing their education, nursing students were found divide into at least three groups; sustained idealists, compromised idealists and crushed idealists, respectively [12]. There are other effects [8]. views the professional socialization as leading to desensitization toward patients due to experiencing cynicism of senior nurses, and anxiety accompany their efforts to cope with and ameliorate the suffering patients in their care. To preserve themselves in a stressful, demanding at times, chaotic work environment, upon completing their education, nurses adapt emotional desensitization [5, 13]. The idealism of new entrants to Nursing gives way to disillusion after the nurses begin to face an onslaught of never-ending practical concerns [5]. Vulnerable and disoriented nurses, new to the nursing occupation, aspire to “fit in,” resulting in radical changes in understanding, attitudes and behavior towards patients.

Nurses Encounter Three Kinds of Dualism:

  1. The good nurse they introjected as themselves versus the bad nurse they encounter in hospitals.
  2. their genuineness based on their emotions versus the cynicism they experience as they witness nurses who only care about money
  3. An ambiguous identity of authority of the nurses who supervise them, and the lack of morality in the hospital setting.

The Nursing literature concludes that socialization into professional nursing is deeply problematic. Nurses who identify with their professional ideals throughout their education often end up losing professional values, and decline from their ideals to accepting the fact that they compromise, and deliver poor care [14, 15, 16]. The desire to articulate the impact of nursing practice propels professional preparation beyond the existence fuzzy fringes of medicine towards a unique contemporary identity [2].

This study represents an exploration of a method for understanding what the ‘public’ wants in a nursing school. The objective is to create a system to guide education, the system grounded in the feelings of the public towards general, operationally feasible topics and strategies that the nursing school can address. The success of the method (Mind Genomics) has been in understanding the mind of people for a variety of situations. With this success it may be possible for Mind Genomics to contribute to the world of nursing education.

The Background and Contribution of Mind Genomics to Aid Understanding

Mind Genomics is an emerging science, the focus of which is the experimenting science of the everyday. Research tells us a great deal about ‘what is’ but does not tell us how people make decisions about the quotidian, ordinary issues of their daily lives. We know that people have definite opinions about what they want and why they want it; polls and surveys provide us that information. We do not know however, their weighting schemes when they choose what to do. We know what people say, retrospectively, but we do not have a deep knowledge of the decision criteria for the events of the everyday. Rather than asking people to say what they would do Mind Genomics presents people with different combinations of features of a typical situation (here a nursing school) and instructs them to rate the entire combination. From the pattern of their choices for different combinations, Mind Genomics emerges with a set of weights, showing which option(s) or feature(s) in the combinations really ‘drives’ the decision. Through experiment, therefore, Mind Genomics reveals the ‘mind’ in a way that surveys and observations cannot. Mind Genomics shows causality, at least in terms of what the respondent says she or he would do when presented with the type of information one would encounter in a situation. The origin of Mind Genomics comes from statistics experimental design [17] from mathematical psychology conjoint measurement [18] from marketing applications of conjoint measurement [19, 20] and from psychophysical thinking [21]. The foundations have been explicated in several seminal papers, including how the science was founded [22] the major applications [23] and some of the specific mathematics which make the approach and the analyses possible, and actually quite straightforward [24]. The original approaches were patented. Mind-Genomics has been applied to health in several recent studies [25–30].

The Mind Genomics Method

Mind Genomics begins with the Socratic method of question and answer.

Step 1 defines the topic, which is a ‘New Nursing Services Company’

This first step seems so obvious, but it is important to the Mind Genomics experiment that each question and its associated set of answers be relevant to the topic.

Step 2 asks four questions which ‘tell a story’

As simple as that sounds, it requires a great deal of thinking. We are accustomed to facts, not to systematic thinking about a problem. Figure 1 show a screen shot where the researcher is instructed to write out the four questions.

MIND GENOMICS-029_AWHC_F1

Figure 1. Screen shot showing the screen in the program where the researcher must ask the four questions.

Step 3 Instructs the Researcher to Give Four Different Answers to Each Question

It is the answers which will be presented to the respondent. The answers may either be simple words when the topic is clear and concrete, easy to visualize (here a nursing school), or may be simple phrases when the concept is not clear and concrete, not easy to visualize (e.g., the daily routine of the nursing student in the school.). Figure 2 shows a screen shot of the page where the researcher must provide answers to question #3 (How does it train the students?)

MIND GENOMICS-029_AWHC_F2

Figure 2. Screen shot showing the page where the researcher provides the four answers to question #3.

The final array of questions and answers appears in Table 1. It will be the answers, in combination, which comprise the test stimuli. The respondent never sees the actual questions motivating the answers. The questions are simply there to create the structure and to motivate the answers.

Table 1. The four questions and the four answers to each question.


Question A: What is the major objective of the organization?

A1

to teach

A2

to prepare

A3

improve local health

A4

serves as test location for new medical development


Question B: Where do you see growth coming from?

B1

supported and promoted by local hospitals

B2

allies closely with local community

B3

allies closely with government

B4

supported by UN


Question C: how does it train the students?

C1

provides local training in homes

C2

fly students around the world for training

C3

places students in local doctor’s offices

C4

brings nurses to local community centers


Question D: how do you raise funds for this?

D1

supported by government contributions

D2

supported by citizens paying low fee for service

D3

allow researchers to work and help support

D4

supported by public appeals

Experimental Design and Test Vignettes

The foundation of Mind Genomics is the use of experimental design to combine disparate ideas, present these ideas to the respondent, obtain ratings, and relate the presence/absence of the ideas (also called answers or elements) to the ratings. At first glance one might confuse Mind Genomics with a survey, because a survey instructs the respondent to answer questions. The difference is that Mind Genomics is an experiment. The stimuli are pre-defined, systematic and structured mixtures of messages. The rating is assigned by the respondent based upon the impression of the entire message. The respondent assigns a single rating, mentally weighting the different elements in the vignette. It is the mental weights which are of interest to the researcher, for they reveal what are important features, and what are unimportant features.

The ratings are analyzed by the well-accepted method of OLS (ordinary least-squares, curve fitting) regression. The OLS reveals causality, how the individual elements in the vignettes or combinations ‘drive’ the ratings. It is also worth noting that the same element or answer appears many different times, continually combined with a variety of answers from other questions. This strategy produces, in the words of psychologist William James of Harvard University in the end of the 19th Century a ‘blooming, buzzing confusion,’ a phrase taken from his description of the world of the baby, but apt for the way the combinations of messages must appear to the respondent. The continual mixing and remixing of messages make it virtually impossible for the respondent to ‘game’ the system. The Mind Genomics experiment reveals quite quickly how the respondent really feels about the combinations, rather than providing answers which might be appropriate and ‘politically correct.’

The experimental design used in this study comprises 24 different vignettes or combinations. Each vignette comprises at most one answer from each question, but in many vignettes one or two questions do not contribute an answer, so that vignette is said to be ‘incomplete.’ The rationale for this strategy is a statistical consideration, namely, to allow the subsequent regression analysis (see below) to provide absolute values for the coefficients.

Every respondent evaluated a unique set of 24 vignettes. Each set was constructed so that the combinations of elements differed, even though the basic structure of the experimental design was maintained. This approach, so-called ‘permutation of the design’[24] allows the Mind Genomics experiment to measure responses to a great number of the possible combinations, albeit with each combination appearing only once or twice across all the respondents. This permutation strategy can be likened to the MRI, which takes ‘pictures’ of underlying tissue from many angles, and combines them by computer to create a three-dimensional image. Each picture in the MRI may be ‘noisy’ just like the data underlying each vignette is ‘noisy.’ Nonetheless, it is the pattern of pictures, and the pattern of responses which emerges clearly in both cases, even though the individual observations are noisy. In contrast, conventional research, specifically conjoint analysis, suppresses the noise through replication, but only covers a limited number of combinations.

A parenthetical note about worldviews in science. Much of science operates on the world view of suppressing noise by replicating the study many times, in order to get a better estimate of the ‘central tendency, i.e., the mean. Inferential statistics tells us that the precision of the measurement increase with the square root of the number of observations. Following this dictum, most researchers opt to increase the number of respondents testing the same stimuli in an experiment or responding to the same questionnaire in a survey. Mind Genomics differs because it looks at the patterns generated by many different combinations, not the response to one combination measured with great precision.

Executing the Mind Genomics study

The actual study takes approximately 3–5 minutes in the field, once the respondent is invited. The effort to run studies is simplified by a service, Luc.id Inc., which hosts on-line surveys, and is linked to the Mind Genomics program as an option. One can also send the study link to other respondents, but the approach of using a panel makes the recruitment more objective, and the panelists more cooperative, since they already do other studies.

The 40 respondents who participated were invited by Luc.id through a link. Most respondents participated within the first hour of launching the study, and all participated within the first two hours, allowing the Mind Genomics experiment to become one step in an easily iterated process. One need not know the answer. One can iterate quickly. The answer, if there is one, appears within the first 1–3 iterations, and certain by the fifth iteration. The key phase is ‘if there is one,’ i.e., if there is a real answer.

The respondent was first presented with an introduction, which simply said: Read our new medical vision. Do you think we will be successful? The respondent then read single vignettes, combinations of elements as shown in Figure 3. The respondent rated the vignette on the 9-point scale. The computer acquired the response, measured the response time between the appearance of the vignette and the rating, and then automatically sequenced to the next vignette. The typical response times are approximately 5 seconds (see Table 2). As just noted above, entire sequence takes 3–5 minutes at most, an experience which is not onerous to those accustomed to surveys lasting 30 minutes but may irritate the purist who wants the respondent to have an experience which is as much fun as a game.

Table 2: Average ratings for total panel, self-defined subgroups, and three emergent mind-sets.


9-Point Rating

Binary: Positive-Outcome (7–9)100

Binary: Negative-Outcome (1–3) 100

Response Time

Total

5.4

36

21

2.6

Female

5.6

39

20

2.9

Male

5.2

32

22

2.2

Age 15–24

5.3

33

28

1.6

Age 25–40

5.5

39

17

2.0

Age 41+

5.5

36

19

4.0

Mind-Set 3E

5.6

42

23

2.4

Mind-Set 3D

5.3

31

21

2.7

Mind-Set 3C

5.5

37

18

2.8

MIND GENOMICS-029_AWHC_F3

Figure 3. Example of a test vignette, configured for the smart phone.

Transforming the Data

The initial results come in the form of 9-point Likert scales, easy to create and administer, but very difficult to interpret. Indeed, it is not surprising that the standard practice of consumer research is to transform the 9-point rating scale (or other type of rating scale) to a binary scale, more easily understood by managers. Managers who are tasked with the job of ‘doing something with the data’ often ask simple questions like ‘what does an 9 or an 8 mean on the 9-point scale?’ or ‘should I be worried if I got a 5 or lower?’ and so forth.

One ongoing solution to the problem of interpreting the scale simply divides the scale into two parts, often of unequal size. We follow the conventions of consumer research, creating two new scales:

Positive-Outcome

Ratings 1–6 are converted to 0 to denote that these are ‘not positive’ outcomes. They are not ‘Negative-Outcomes,’ but rather just not positive ones. Ratings of 7–9 are converted to 100 to denote that these are ‘positive’ outcomes. The choice of the cut-point is arbitrary, and can be made more stringent by including only ratings of 8 or 9, or even only 9, and less stringent by including ratings such as 6–9, rather than 7–9 as ‘positive.

Negative-Outcome

Ratings of 1–3 are converted to 100 to denote that these are ‘negative’ outcomes. Ratings of 4–9 are converted to 0 to denote that these are not ‘negative’ outcomes. They are not Positive-Outcomes, necessarily, but certainly not Negative-Outcomes. The arbitrary choice holds once again, with possible cut-points being 1–2 as 100, or even only 1 and 100.

A very small random number (<10–5) is added to each rating in order to ensure that there is some variability within an individual’s ratings, were that individual to limit the ratings to regions where all of their ratings for the vignette would be coded either 0 or 100. Such a situation would cause the individual-level regression modeling to fail. The small random number does not affect the regression model, while ensuring the necessary variation in the dependent variable in order for the regression model to run.

Initial Results – Average Ratings Across Groups

A logical first analysis looks at averages for total and across groups, to determine whether there are any dramatic group to group difference. Table 2 shows the averages for the total panel and for key subgroups as well as three emergent mind-sets to be explicated later. The ratings suggest only a modest level of belief in the success of the enterprise, on average. It will have to be the individual elements which propel success, and not simply the basic idea.

The response time (RT) measured in seconds shows some interesting differences among groups. Females take longer to read the vignettes than do males, on average (2.9 seconds vs 2.2 seconds.) Older respondents take longer to read the vignettes than do younger respondents (4.0 seconds for those age 41+ versus a very fast 1.6 seconds for respondents ages 15–24.)

Despite these differences, we still do not know the relation between the individual elements in the vignettes and the Positive-Outcome, the Negative-Outcome, or the response time, respectively. The analysis of the data by deconstructing the patterns laid out through the experimental design will allow us a far better understanding of the mind of the respondent.

Modeling

The experimental design ensures that the 16 elements or answers are statistically independent of each other. By pooling together all data we generate a database from which we trace ‘causality,’ or the relation between the elements that we put into the vignettes and the responses that individuals make.

The models for the Positive and the Negative-Outcomes are estimated with an additive constant and appear in (Table 3). The additive constant is modest for Positive-Outcome (38) and quite low for Negative-Outcome, respectively (16). We conclude that the respondents feel that it will have to be the element themselves which must do a lot of the work to convince the respondent that there will be a good outcome.

Table 3. Parameters of the equations relating the presence/absence of the 16 elements to Positive-Outcomes (ratings 7–9 converted to 100), Negative-Outcome (rating 1–3 converted to 100), and response time (in seconds.)


Positive-Outcome

Negative-Outcome

Response Time


Additive constant

38

16

NA

A1

to teach

3

1

0.3

A2

to prepare

2

-1

0.2

C4

brings nurses to local community centers

2

0

0.9

B2

allies closely with local community

1

5

0.8

C1

provides local training in homes

1

-1

1.2

C3

places students in local doctor’s’ offices

1

-3

0.9

A3

improve local health

0

0

0.2

B1

supported and promoted by local hospitals

0

1

0.6

B4

supported by UN

0

2

0.5

D1

supported by government contributions

0

4

0.7

B3

allies closely with government

-1

5

0.9

D2

supported by citizens paying low fee for service

-1

0

0.8

A4

serves as test location for new medical development

-2

-2

0.7

D4

supported by public appeals

-2

3

1.3

D3

allow researchers to work and help support

-4

4

1.1

C2

fly students around the world for training

-7

1

1.2

When we look at the 16 individual coefficients, we find that there are no elements which strongly drive the Positive-Outcome. For the Negative-Outcome, only two elements really drive additional negativity:

allies closely with community

allies closely with government.

When we look at response time, we do not use an additive constant. The response time does not measure positive or negative, but rather engagement, i.e., time to read and digest the information. The longest response time was 1.3 seconds, supported by public appeals.

Interactions Between ‘Objective Of The Organization’ And Other Elements – Scenario Analysis

The permutation scheme created a large number of different vignettes, with only a few vignettes duplicated. A benefit of this strategy is the ability to uncover interactions between pairs of elements and show how some combinations generate coefficients far higher or far lower than would be expected from looking simply at the performance of the single elements.

Our focus is on how way the different ‘goals of the school’ (answers to question A) ‘interact’ with the remaining elements from the other questions. The process, known as ‘scenario analysis,’ follows these steps:

  1. Sort the data set into the five strata, i.e., sets of vignettes. These five strata are where there is no answer from Question A (goal of the organization), and then four remaining strata where the answer appearing in the vignette is A1, A2, A3, and A4, respectively.
  2. Run a separate regression analysis on each stratum.
  3. The independent variables for each of the five new regression analyses are now the 12 remaining elements or answers, (B1-B4; C1-C4; D1-D4). The variables A1-A4 do not appear in the regression model because they are constant for each regression analysis, and thus are not predictors.
  4. The actual analysis is straightforward and shown in Table 4 when the dependent variable is ‘Positive-Outcome,’ Table 5 when the dependent variable is ‘Negative-Outcome,’ and Table 6 when the dependent variable is Response Time. The very strong performing elements are shown by shaded cells, with coefficient values in bold type.
  5. Positive-Outcome: Table 4 shows pairs of elements where the stated goal or objective for the school either strongly increases the coefficient of the element (synergism) or strongly suppresses the coefficient of the element (suppression).
  6. An example of synergism is the combination of ‘provides local training in homes,’ element C1. In the absence of any objective stated, it generates a coefficient of +7. When combined with the objective ‘to teach’ the coefficient for ‘provides local training in homes’ jumps to +15.

Table 4: Scenario analysis – How the different objectives of the nursing school synergize with other elements to drive the prediction that the outcome will be positive.  Only combinations with strong synergism or suppression are shown.


Positive-Outcome

None

to teach

to prepare

improve local health

serves as test location for new medical development


A0

A1

A2

A3

A4


 Additive constant

18

49

28

38

53

C3

places students in local doctor’s offices

23

-13

20

-11

-8

D4

supported by public appeals

14

-12

-6

7

-8

C1

provides local training in homes

7

15

7

8

-16

B2

allies closely with local community

-3

-3

1

9

-3

D2

supported by citizens paying low fee for service

-5

-14

12

9

-6

Table 5: Subgroup models relating the presence/absence of elements to Positive-Outcome.


Total

Male

Female

Age

15–24

Age

 25–40

Age

41+


Additive constant – Positive Outcome

38

27

48

45

31

43

A1

to teach

3

-2

7

-3

10

-2

A2

to prepare

2

-2

5

-12

13

-2

C4

brings nurses to local community centers

2

10

-5

1

5

-2

C3

places students in local doctor’s offices

1

3

-1

-7

-1

8

B2

allies closely with local community

1

13

-8

11

-5

0

A3

improve local health

0

-6

4

-6

8

-6


 Additive constant – Negative Outcome


16

26

9

27

9

18 

B1

supported and promoted by local hospitals

1

-5

6

-4

8

B2

allies closely with local community

5

-2

10

0

12

B3

allies closely with government

5

-5

13

1

7

D3

allow researchers to work and help support

4

-1

8

1

4


 Response Time


D4

supported by public appeals

1.3

1.2

1.3

1.1

1.1

1.8 

C1

provides local training in homes

1.2

0.9

1.5

0.4

0.8

 2.3

C2

fly students around the world for training

1.2

1.0

1.5

0.9

0.9

1.9 

D3

allow researchers to work and help support

1.1

0.5

1.5

0.5

1.0

 1.5

C3

places students in local doctor’s offices

0.9

0.8

1.1

0.9

0.3

1.6 

C4

brings nurses to local community centers

0.9

0.9

1.0

0.9

0.3

1.6 

B3

allies closely with government

0.9

0.9

0.8

0.7

0.4

 1.4

D2

supported by citizens paying low fee for service

0.8

0.2

1.2

0.4

0.4

1.5 

Key Subgroups

The ability to create models for each individual means that it is easy to create models for pre-defined subgroups. Tables 4–6 show parameters of the models for key subgroups, when the respondents fall into the pre-defined subgroups generated from the self-profiling classification. For this analysis we look at the gender and age, respectively. In the interest of space, we show only those elements which score well in at least one subgroup.

Table 6: The three mind-sets and their reaction to elements in terms of ratings of ‘Positive-Outcome. 


Positive-Outcome

MS1

MS2

MS3


Additive constant

47

14

66


Mind-Set 1:  Focuses on training venue


C3

places students in local doctor’s offices

10

4

-16

C1

provides local training in homes

9

2

-10

A2

to prepare

8

1

-5


Mind-Set 2: Focus on practicality of support


B4

supported by UN

-2

17

-21

D1

supported by government contributions

-18

15

-6

B1

supported and promoted by local hospitals

-8

14

-12

D3

allow researchers to work and help support

-17

14

-14

B2

allies closely with local community

-7

13

-8

D4

supported by public appeals

-21

8

3


Mind-set 3 – Basically positive but can be ‘spooked’


No element drives a strong positive response beyond the additive constant (baseline)


Not a strong driver of any mind-set


A4

serves as test location for new medical development

4

-12

5

D2

supported by citizens paying low fee for service

-19

7

4

A1

to teach

7

1

-2

C4

brings nurses to local community centers

6

0

-2

A3

improve local health

5

-3

-2

C2

fly students around the world for training

-7

-7

-14

B3

allies closely with government

2

6

-16

Table 5 (top panel) shows the parameters of the models created for the subgroup when the dependent variable was chosen to be Positive-Outcome. The additive constant provides us with a with a baseline of expected Positive-Outcome in the absence of elements. For the total panel the additive constant is 38, but much higher for females (constant = 48), for younger respondents (age 15–24, constant = 45) and for the oldest respondents (age 41+, constant = 41+). If we were to hazard a rationale for the results it would be that females are basically more interested in the nursing school, as are those contemplating but not yet ready (age 15–24) and those who have made a career decision (age 41+.) Males are less interested, confirming the literature report that there is a dearth of males in professional nursing.

Table 5 (Middle panel) shows the parameters of the models for the subgroups when the dependent variable was chosen to be Negative-Outcome. The additive constants are all low. The highest additive constants are from males (constant = 26) and from age 15–24 (additive constant = 27.) Across the subgroups the key elements driving a predicted Negative-Outcome tends to be ‘allies closely with government,’ and ‘allies with the local community.”

Table 5 (bottom panel) shows the coefficients for the response time model by key subgroups. the longest response times are shaded. The data suggest that the oldest respondents take the longest to process the information. This tends to be a general pattern. It is not clear whether this longer time is because the older respondents take longer to read, longer to comprehend, or longer to respond, or any combination thereof.

Mind Sets

People can be divided by who they ARE, by what they DO, or by their BELIEFS. These ways of dividing people put people into complementary groups with the hope that people in the different groups will think ‘similarly’ about a specific topic. Once groups of people are discovered who ‘think alike,’ they can be efficiently targeted with messages engineered to appeal to them. Conventional research easily creates these clusters of individuals, these segments, based on situational data, behavioral data, or even responses to general questionnaires about a topic. The segments which emerge from these conventional methods are coherent, but only coherent with respect to the measures from which the clusters or segments were derived. People in the same behavioral segment behave similarly on the measures used. People in the same attitudinal or so-called psychographic segment, respond similarly to the general questions [31].

There is a fundamental flaw in most of the segmentation scheme in use today, namely the failure of the ‘top down segmentation’ to be specific and prescriptive at the level of action. The problem of top-down segmentation, dividing people on the basis of general patterns, is the problem of granularity, or more properly the inability of the general segmentation to deal with the granular application, the specific need. When we assume that people in attitudinal or psychographics respond ‘similarly,’ we are dealing with general responses. They may respond quite differently when the topic is far more specific, more granular, and far less general. With the data we have here, a two people might be in the same general segment for education yet respond quite differently when we deal with granular topic of nursing education.

Mind Genomics works at the level of the granular, where everyday life is lived. Rather than looking for these large segments, Mind Genomics operates at the level of specifics, granularity, at the level of the actual questions and answer for the topic. Mind Genomics works from the bottom up, in the manner of a pointillist artist, focusing on the segments which can be uncovered from the granular, individual-level data of a specific project.

The process to discover these Mind-Sets in the population is again quite straightforward, driven by a combination of statistical methods which are ‘objective,’ and interpretation, which is ‘subjective’. The method creates an individual-level model for each respondent, and clusters the models using cluster analysis [32] The results comprise a small number of groups, the so-called clusters, with the property that the patterns of coefficients within a cluster are all similar, whereas the pattern of averages of the coefficients differs dramatically from cluster to cluster. In simple terms, a cluster represents a group of like-minded individuals, based upon the pattern of their coefficients. The individuals are like-minded only with respect to the top of the nursing school. That is the clustering is based upon granular thinking of a specific topic.

The subjectivity of clustering comes when the researcher must decide how many clusters to select, and what to name the clusters for future work. The decision is based upon searching for the smallest number of clusters (parsimony), but with each cluster ‘telling a story’ based upon the pattern of its 16 coefficients (interpretability). These clusters become Mind-Sets in the terminology of Mind Genomics, namely groups which ‘think alike’ in the granular topic of this ‘nursing school.’

The clustering was based on the pattern of coefficients for Positive-Outcome. Once the clusters or mind-sets are established, we can look at the elements which drive Positive-Outcome, as well as Negative-Outcome and Response Time. Tables 6–8 show these three mind-sets, and the elements which drive the three dependent variables, respectively.

Table 7: The three mind-sets and their reaction to elements in terms of ratings of ‘Negative-Outcome.’ The table shows only the elements which drive a strong estimate of ‘Negative-Outcome’ for at least one of the three mind-sets.


Negative-Outcome

MS1

MS2

MS3


Additive constant

10

22

15


Mind-Set 1: Focuses on training venue


D3

allow researchers to work and help support

14

-4

4


Mind-Set 2: Focus on practicality of support


No element drives a strong negative response beyond the additive constant (baseline)


Mind-set 3 – Basically positive but can be ‘spooked’


B3

allies closely with government

7

-3

15

B4

supported by UN

2

-4

9

B1

supported and promoted by local hospitals

3

-6

8

Table 8: The three mind-sets and their reaction to elements in terms of Response Time. The table shows only those elements which generate a long response time (>1.4 seconds) for at least one mind-set.


Response time

MS1

MS2

MS3


Mind-Set 1: Focuses on training venue


D3

allow researchers to work and help support

1.5

0.4

1.6

C2

fly students around the world for training

1.4

1.5

0.8


Mind-Set 2: Focuses on practicality of support


C1

provides local training in homes

1.2

1.5

1.0

D4

supported by public appeals

1.2

1.3

1.4

C4

brings nurses to local community centers

0.8

1.3

0.7


Mind-set 3 – Basically positive but can be ‘spooked’


allow researchers to work and help support

1.5

0.4

1.6


supported by public appeals

1.2

1.3

1.4

Finding Mind-Sets In the Population

Mind Genomics usually uncovers the different minds in the population. The mind-sets emerge clearly because the input material underlaying the mind-sets are phrases which are ‘cognitively meaningful and rich.’ What does not emerge so quickly is a way to discover these mind-sets in the population. The mind-sets do not distribute by the conventional ways of dividing people, as Table 9 shows, for the distribution of mind-sets by gender and by age, respectively. Even psychographic divisions of people, such as their interest in education and so forth, often do not co-vary with the mind-sets. The mind-sets exist, but it is difficult to assign a new person to the proper mind-set unless the person participates in the research.

Table 9: Distribution of mind-sets by gender and age.


Total

Mind-Set 1: Focuses on training venue

Mind-Set 2: Focuses on practicality of support

Mind-set 3: Basically positive, but can be ‘spooked’

Total

40

12

16

12

Male

18

4

10

4

Female

22

8

6

8

Age 15–24

10

3

3

4

Age 25–34

16

7

5

4

Age 41+

14

2

8

4

Recently, author Gere has developed a set of algorithms using Monte Carlo simulations, in order to create a set ‘questions’ based on the elements. The pattern of answers to these questions allow the new person to be assigned to the most likely mind-set. The method is called the PVI, the personal viewpoint identifier. It is based on a Monte Carlo simulation, in which the likely pattern of responses to six questions created from six of the elements co-varies with membership in each of the three mind-sets. Figure 4 shows the six questions and the two answers to each question. There are 64 patterns based upon six questions and two answers. Each pattern is most likely with one of the two mind-sets. When a respondent generates a pattern by answering the question the most likely mind-set associated with that pattern becomes the mind-set to which the new person is assigned.

MIND GENOMICS-029_AWHC_F4

Figure 4. The six question PVI (Personal Viewpoint Identifier) for this study.

Discussion and Conclusions

The traditional topics of curriculum, approaches, and values have been left to the professionals in the field. The role of the ordinary person has generally been to get support for nursing schools (and indeed other types of schools), to fund schools and their programs, and then to quietly hand over the reins of control to professionals. The professional literature is replete with the points of view of professionals about what the curriculum should be, how the student should be taught, and trained to be ready to deliver nursing-care. The general public is often excluded from these discussions. Often, however, it is the general public, or at least those who RECEIVE nursing-care who are the ones able to add most to what is missing. Those involved in teaching, in the world of purveying knowledge, may not realize the changes occurring in their own field and the public expectations from Nursing. Up to now, Nursing has been considered a ‘weak signal,’ rather than the emerging need it really is, to increase patient trust, patient-adherence, patient experiences and patient resilience [33, 34].

Across mind-set segments, the public expects Nursing programs to better prepare nurses by enhancing their professionalism through exposure to more medical settings, as they encounter their clinical practice. For example, the data from the public, non-nursing world, suggests that nursing students should receive clinical practice at doctors’ offices, at local community health centers and at patients’ homes, each beyond the traditional hospital settings. The public also expects local community hospitals to support training of nursing students. Furthermore, the public expects nursing programs to allow researchers to support training and professionalism.  Future studies may test the effect of interventions to adopt the above recommendations on the tensions nursing students experience as they complete their professional education.

Postscript Mind Genomics Research as the Public’s Input and Guide for Educational Institutions

There is an emerging recognition that the fast-changing world of today requires different modalities for learning. Emblemizing this change in the world of textbooks, as an example. The era of heavy, expensive textbooks has gone, or is in the process of departing. These traditional textbooks enjoying two, three, four or more editions, provided a standardized body of knowledge updated regularly. The demands for knowledge are changing, forcing many schools to create their own unique ‘textbooks’ by cobbling together papers available on the Internet, and in the university’s own private collection. The need for creative thinking to develop professional schools for ‘today’ is beginning to be recognized. When we look at the data presented here, the requirements for a nursing school, not from the point of view of the teaching profession but from the point of view of the public, we see these results in a different light.

Acknowledgment

Attila Gere wishes to acknowledge the Premier Post-Doctoral Research Program of the Hungarian Academy of Sciences.

References

  1. Allen-Johnson A (2017) Framework for 21st century school nursing practice: Framing professional development. NASN School Nurse 32: 159–161.
  2. Cogan RM, Conway SM, Atkins JD (2017) Redesigning school nursing education in New Jersey to address the challenges and opportunities of population health. NASN School Nurse 32: 83–86.
  3. Andrew N (2012) Professional identity in nursing: are we there yet? Nurse Education Today 32: 846–849.
  4. National Association of School Nurses (2016) Framework for 21st century school nursing practice: National Association of School Nurses. NASN School Nurse 31: 45–53.
  5. Traynor M and Buus N (2016) Professional identity in nursing: UK students’ explanations for poor standards of care. Social Science & Medicine 166: 186–194.
  6. Frost HD and Regehr G (2013) “I am a doctor”: negotiating the discourses of standardization and diversity in professional identity construction. Academic Medicine 88: 1570–1577.
  7. Curtis K, Horton K, Smith P (2012) Student nurse socialisation in compassionate practice: A Grounded Theory study. Nurse Education Today 32: 790–795.
  8. Mackintosh C (2006) Caring: The socialisation of pre-registration student nurses: A longitudinal qualitative descriptive study. International Journal of Nursing Studies 43: 953–962.
  9. Apker J, Propp KM, Ford WSZ, Hofmeister N (2006) Collaboration, credibility, compassion, and coordination: professional nurse communication skill sets in health care team interactions. Journal of professional nursing 22: 180–189.
  10. Ozcan CT, Oflaz F, Bakir B (2012) The effect of a structured empathy course on the students of a medical and a nursing school. International nursing review 59: 532–538.
  11. Leiter MP, Jackson NJ, Shaughnessy K (2009) Contrasting burnout, turnover intention, control, value congruence and knowledge sharing between Baby Boomers and Generation X. Journal of Nursing Management 17:100–109.
  12. Maben J, Latter S, Clark JM (2007) The sustainability of ideals, values and the nursing mandate: evidence from a longitudinal qualitative study. Nursing Inquiry 14: 99–113.
  13. Williams LB, Bourgault AB, Valenti M, Howie M, Mathur S (2018) Predictors of underrepresented nursing students’ school satisfaction, success, and future education intent. Journal of Nursing Education 57: 142–149.
  14. Delamothe T (2011) We need to talk about nursing. British Medical Journal M.J 342: 3416 London.
  15. Francis R (2013) (a). Report of the Mid Staffordshire NHS Foundation Trust Public Inquiry: Executive summary. London: House of Commons.
  16. Francis R (2013) (b). Report of the Mid Staffordshire NHS Foundation Trust Public Inquiry: Volume III Present and Future Annexes. London: House of Commons.
  17. Box GE, Hunter WG, Hunter JS (1978) Statistics for experimenters, New York, John Wiley.
  18. Luce RD, Turkey JW (1964) Simultaneous conjoint measurement: A new type of fundamental measurement. Journal of mathematical psychology 1: 1–27.
  19. Green PE, Rao VR (1971) Conjoint measurement for quantifying judgmental data. Journal of marketing research 8: 355–363.
  20. Green PE, Srinivasan V (1990) Conjoint analysis in marketing: new developments with implications for research and practice. The journal of marketing 54: 3–19.
  21. Stevens SS (1975) Psychophysics: An Introduction to its Perceptual, Neural and Social Prospects, New York, John Wiley.
  22. Moskowitz HR, Gofman A, Beckley J, Ashman H (2006) Founding a new science: Mind genomics. Journal of sensory studies 21: 266–307.
  23. Moskowitz HR and Gofman A (2007) Selling blue elephants: How to make great products that people want before they even know they want them. Pearson Education.
  24. Gofman A and Moskowitz H (2010) Isomorphic permuted experimental designs and their application in conjoint analysis. Journal of Sensory Studies 25: 127–145.
  25. Gabay G, Zemel G, Gere A, Zemel R, Papajorgji P, Moskowitz HR (2018) On the threshold: What concerns healthy people about the prospect of cancer? Cancer Studies and Therapeutics Journal 3: 1–10.
  26. Gabay G, Gere A, Stanley J, Habsburg-Lothringen C, Moskowitz HR (2019) (a). Health threats awareness – Responses to warning messages about cancer and smartphone Usage. Cancer Studies Therapy Journal 4: 1–10.
  27. Gabay G, Gere A, Zemel G, Moskowitz D, Shifron R, Moskowitz HR (2019) (b). Expectations and attitudes regarding chronic pain control: An exploration using Mind Genomics. Internal Medicine Research Open Journal 4: 1–10.
  28. Gabay G, Gere A, Moskowitz HR (2019) (c). Uncovering communication messages for health promotion: The case of arthritis. Integrated Journal of Orthopedic Traumatology 2: 1–13.
  29. Gabay G, Gere A, Moskowitz HR (2019) (d). Understanding effective web messaging – The Case of Menopause. Integrated Gynecology & Obstetrics Journal 2: 1–16.
  30. Gabay G, Gere A, Stanley J, Habsburg-Lothringen C, Moskowitz HR (2019) (e). Health threats awareness – Responses to warning messages about Cancer and smartphone usage. Cancer Studies Therapeutics Journal 4: 1–10.
  31. Weinstein A and Cahill DJ (2014) Lifestyle market segmentation. Routledge.
  32. Dubes RC and Jain AK (1988) Algorithms for clustering data. Prentice Hall.
  33. Gabay G (2019) Patient Self-worth and Communication Barriers to Trust of Israeli Patients in Acute-Care Physicians at Public General Hospitals. Qualitative health research Pg No. 1049732319844999.
  34. Gabay G (2019) A Nonheroic Cancer Narrative: Body Deterioration, Grief, Disenfranchised Grief, and Growth. OMEGA-Journal of Death and Dying Pg No. 0030222819852836

Social Media Controversy Affecting the Introduction of HPV Vaccination for Young Girls in Cameroon

DOI: 10.31038/AWHC.2019255

Background

Cervical cancer is the second most frequent type of cancer in Cameroon [1]. More than 7.1 million Cameroonian women aged 15 and above are at risk of this disease [2]. In the past ten years, various pilot projects have demonstrated the efficacy and acceptability of Gardasil TM, the vaccine against Human Papillomavirus (HPV) [3,4]. Based on these successful demonstration phases, with the support of the Global Alliance for Vaccines and Immunization (GAVI), the HPV vaccine is finally being implemented countrywide by the Ministry of Public Health. The main objective of the vaccine roll-out will be to immunize at least 80% of 9-year-old girls, and thus reduce the morbidity and mortality due to cervical cancer and other HPV-related infections in Cameroon.

Controversy: social media campaign against HPV

In Cameroon, as in other countries, social media has become a powerful instrument for public communication, allowing users to initiate, modify, share and discuss personal experiences, information, opinions, images, video clips and just about everything online [5]. Although this novel communication channel can be an invaluable tool for networking and visibility on the global arena, it also carries the great potential of heavily negative influence on health campaigns. Studies have shown that false and unverified information is propagated on popular social media platforms such as Facebook, WhatsApp, Twitter, Instagram, Snapchat, with far-reaching and long-lasting deleterious impact on the health of our communities [6].

The launching of the HPV vaccine in Cameroon on 29 October 2014 did not raise as much controversy as the recent announcement by the Minister of Public Health on the decision to finally implement the use of the vaccine to the general population in the coming months. The recent fiery debate emanates from various anti-HPV vaccine campaigns carried out mainly on WhatsApp and Facebook that highlight adverse effects such as sterility that allegedly occurred in Japan and other countries [7].

Although Cameroonian parents are generally more inclined towards vaccinating their children [8], contrary social media campaigns are likely to negatively affect the government’s efforts to implement the use of this HPV vaccine for young girls. Studies have shown that parents and teenagers who have been exposed to anti-HPV vaccine messages on social media are more likely to remember the harmful effects than the health benefits reported [9]. More so, parents who listen to the negative stories are more likely to delay or even refuse the vaccination of their children [9]. Many Cameroonians have experienced the destructive effect of public scrutiny through social media in the face of national events and tragedies. In these instances, the narratives received by the public were almost completely controlled by social media, making it nearly impossible for the government to control the situations and protect its citizens. In the case of the HPV vaccine, social media videos, images and text messages are feeding the community with unsubstantiated myths and misinformation. This anti-campaign undermines the government’s efforts, in concertation with international health communities, to diligently work towards curbing the progress of cervical cancer in the country. On 13 September 2019, a press conference was held by experts from the Ministry of Public Health and the Association of Science Journalists and Communicators for Health Promotion in Cameroon in order to dispel the ambiguities around the controversies on the large-scale implementation of the HPV vaccine in the country.

Cultural and religious beliefs

Culture is known to weigh heavily on health behavior. It affects the perception of health, illness, beliefs about the causes of illness, approaches to health promotion, vaccination, experiences and expressions of disease, places where and people to whom patients go for help, and the type of care that patients prefer [10]. The videos widely spread through social media may promote cultural prejudices that suggest that vaccination is intended to sterilize children [8]. One of these videos cited some studies conducted in Japan and in other countries, alleging that sterility was among the adverse events highlighted in Japan [7]. It is thus not surprising that the planned implementation of HPV vaccination for young girls in Cameroon runs the risk of being rejected if effective community sensitization on the necessity of the vaccine is not carried out.

Conclusion and Recommendation

Vaccination against the Human Papillomavirus is an effective approach for the primary prevention and reduction of the burden of cervical cancer among young girls. The Cameroonian scientific community thus has the impetus to counteract the greatly negative influence of social media on the subject by setting the records straight through presenting empirical and scientific evidence that will leave no grounds for these myths and misinformation.

References

  1. Cameroon Human Papillomavirus and Related Cancers, Fact Sheet 2018 (2019) https://hpvcentre.net/statistics/reports/CMR_FS.pdf. Accessed on 03 October 2019.
  2. HPV Information Centre – HPVIC (2019) Cameroon Human Papillomavirus and Other Related Diseases Report.
  3. Ministère de la Santé Publique (2013) Yaoundé Cancer Registry.
  4. Ogembo JG, Manga S, Nulah K, Foglabenchi LH, Perlman S, et al. (2014) Achieving high uptake of human papillomavirus vaccine in Cameroon: Lessons learned in overcoming challenges. Vaccine 32: 4399–403. [crossref]
  5. Hao J, Gao B (2017) Advantages and Disadvantages for Nurses of Using Social Media. Journal of Primary Health Care and General Practice 1: 001.
  6. Katherine J, Igoe (2019) Establishing the Truth: Vaccines, Social Media, and the Spread of Misinformation. Harvard School of Public Health. https://www.hsph.harvard.edu/ecpe/vaccines-social-media-spread-misinformation/. Accessed on 02 October 2019.
  7. Okuhara (2019) Newspaper coverage before and after the HPV vaccination crisis began in Japan: a text mining analysis. BMC Public Health 19: 770.
  8. Kwedi Nolna S, Bonono CR, Nsangou Moncher M, Bindé T, Nolna D, et al. (2018) Factors influencing the performance of routine immunization in urban areas: A comparative case study of two cities in Cameroon: Douala and Yaoundé. Vaccine 36: 7549–7555. [crossref]
  9. Margolis MA, Brewer NT, Shah PD, Calo WA, Gilkey MB (2019) Stories about HPV vaccine in social media, traditional media, and conversations. Prev Med 118: 251–256. [crossref]
  10. White, Peter (2015) The concept of diseases and health care in African traditional religion in Ghana. HTS Theological Studies 71: 01–07.

Midlife Women and the Opioid Crisis: Commentary on the Role of Integrative Health

DOI: 10.31038/AWHC.2019261


Midlife women are experiencing increased rates of opioid use disorder (OUD) [1] and fatal overdose in the United States (US) [2]. Rates of opioid-related mortality have increased more rapidly among women than men [3], and when stratified by age, the increase in opioid-related mortality is particularly notable among middle-aged women [4]. Unique risk factors for opioid misuse and opioid use disorder (OUD) in women have been identified, including higher pain levels and increased opioid withdrawal symptoms [5] among women with OUD and higher rates of psychological comorbidities [6,7]. In addition, midlife women with co-occurring chronic pain and menopausal symptoms experience increased rates of risky opioid use including long-term opioid use,  high-dose opioid use, and co-prescription of CNS-depressants and opioids [8]. Thus, addressing pain, menopausal symptoms, and psychological comorbidities may help reduce rates of OUD and ultimately prevent fatal overdose among midlife women.

Complementary therapies (e.g., acupuncture, massage, and mindfulness) and an integrative approach to care (e.g., relationship-based, patient-centered, strengths-based coaching) are ideally poised to treat OUD and associated comorbidities [9]. As women utilize healthcare in greater rates than men [10], including complementary therapies, it seems plausible that the integration of IH modalities may improve women’s outcomes. Of particular interest is the evidence supporting acupuncture as a modality that may decrease psychological distress and therefore reduce OUD and the potential for overdose in women [11]. This brief commentary will provide an overview of the topic of midlife women and OUD, describe the relevance of complementary therapies and a person-centered, relationship-based approach to treatment, and provide suggestions relevant to future policy initiatives and research.

Compared to men, women experience more pain-related disease, have an increased sensitivity to pain [12], are more likely to be prescribed opioids [13], are more likely to “telescope” from use to misuse and first admission to treatment [1], and are at greater risk than men for the misuse of prescription opioid medications and thus for the development of OUD. Sex and gender differences occur in opioid risk and risk mitigation: rates of heroin use have increased at a faster rate while rates of nonmedical prescription opioid use have declined at a slower rate among women compared to men [14]. Women have also seen a sharper increase in opioid-related mortality than men [3]. Between 1999 and 2010, mortality rates increased by 400% for women and 237% for men [3]. Among persons with OUD, women experience a greater risk of mortality compared to the general population (SMR 5.1 95% CI: 4.5, 5.7) than men (SMR 4.3 95% CI: 4.0, 4.6), with an 18% increased risk of death among women compared to men (RR 1.18, 95% CI 1.02–1.36) [2]. When stratified by age, the increase in opioid-related mortality is particularly notable among middle-aged women; between 1999 and 2017, fatal opioid overdose rates increased by 485% among women aged 30–64 years [4]. Thus, identifying novel ways to promote health and prevent OUD among midlife women is critical.

Psychological and emotional distress have been identified as risk factors for OUD among women but not among men [15]. Research indicates that OUD is associated with intimate partner violence victimization, particularly among women, and that women may be particularly susceptible to such violence when under the influence of opioids [16]. Further, opioid-dependent women are more likely than their male counterparts to report higher levels of psychiatric morbidity (e.g., depression and anxiety), to use opioids in response to interpersonal stress, and to use opioids because of affective distress [6,7,15]. Post traumatic stress disorder (PTSD) is more strongly associated with opioid misuse and OUD among women than men. Of note, the desire to avoid symptoms of PTSD has been associated with higher odds of opioid misuse and OUD among women [17].

An integrative approach to care is uniquely situated to address the complex biopsychosocial aspects that fuel the chronic pain syndrome as well as provides care that is situated in a feminist praxis that values mutuality, growth and nurturance, shared power, reciprocity, and individualism. Integrative healthcare (IH) “reaffirms the importance of the relationship between practitioner and patient, focuses on the whole person, is informed by evidence, and makes use of all appropriate therapeutic approaches, healthcare professionals and disciplines to achieve optimal health and healing.” [18] IH includes both conventional or biomedical interventions (provided by physicians, nurses, pharmacists and others) as well as complementary therapies provided by credentialed therapists (i.e., naturopaths, herbalists, acupuncture/Traditional Chinese Medicine practitioners, and massage therapists). In an integrative health approach, plans to address pain would be developed collaboratively and tailored to address whole person (body-mind-spirit) condition, available resources (financial, material, human), and their values/goals. Rather than treating all chronic pain as similar and all clients seeking care as identical, the integrative approach listens deeply to the woman’s story, ensures that the authentic full voice of the person is heard, considers all aspects of the pain experience (benefits as well as limitations) and seeking solutions that are informed by evidence but selected in a manner that affirms the woman’s life purpose and values [19]. Therefore, rather than prescribing an opioid to address chronic pain, an integrative approach might include a complex intervention that includes progressive meditative movement (yoga or tai chi), nutritional changes (anti-inflammatory diet), and acupuncture that would address the complex mind-body mechanism associated with chronic pain [20].

Complementary therapies such as acupuncture, massage therapy, and mindfulness have been found to reduce OUD and associated comorbidities. Acupuncture has been evaluated for the treatment of pain and reduction of OUD in several studies. A meta-analysis was conducted across nine studies and acupuncture and electro-acupuncture were each more beneficial than sham acupuncture for the reduction of cravings for opioids and for the improvement of insomnia and depression [21]. Preliminary evidence suggests that acupuncture may also be beneficial in decreasing opioid dose and increasing opioid abstinence when combined with medication-assisted treatment (MAT) [22]. Further, acupuncture may offer decreased odds of opioid initiation. Compared to visiting a primary care provider, individuals with new-onset low back pain who visit an acupuncturist first demonstrate 91% decreased odds of short-term opioid use (95%CI 0.07 to 0.12) and 95% decreased odds of long-term opioid use (0.07, 95%CI 0.01 to 0.48) [23]. Mindful Awareness Body-oriented Therapy (MABT) has also demonstrated preliminary feasibility and acceptability when provided as an adjunct to MAT for those with OUD and has demonstrated decreased craving among women previously diagnosed with substance use disorder [24].  Additionally, Mindfulness Oriented Recovery Enhancement (MORE) reduces opioid craving among individuals with OUD taking MAT [25], and increases positive psychological health, as well [26].

 Multiple large-scale surveys of complementary and alternative medicine (CAM) [1] use in the United States (US) have been conducted, including data from the 2002, 2007, and 2012 Adult Alternative Medicine supplement to the National Health Interview Surveys [27]. Among US adults, “the prevalence of CAM use in the past 12 months” ranged from 32.3% in 2002 to 35.5% in 2007 and was most recently 33.2% in 2012. Among women seeking acupuncture, for example, nationwide prevalence is low (1.1%); however that translates to over one million American women. In addition to seeking IH services from a provider, women are utilizing IH independently. For example, women in the US are already practicing meditation more than men and presence of pain, anxiety/depression, and sleeping problems are some of the main factors that predict meditation use [28]. This indicates that IH is not only acceptable to women but also sought-after by those who have some of the very issues associated with opioid misuse and OUD among midlife women.

Since IH interventions such as acupuncture, MABT and MORE are promising in the treatment of OUD and associated comorbidities and since women are utilizing complementary therapies, it would seem beneficial to women for healthcare policy to support women’s affordable access to complementary therapies. Suggestions regarding policy include the provision of healthcare benefit coverage of complementary therapies, however the most recent data (from 2012) indicate that only a  minority of people in the US have health insurance coverage for complementary therapies such as acupuncture (20% of respondents reported at least partial coverage) and massage (15%) [29]. Because research findings regarding complementary therapies are likely to inform policy changes, additional research is needed to clarify the combined benefits of complementary therapies on pain, mental health conditions, and other symptoms on opioid use and concurrent use of medications such as benzodiazepines for anxiety, which are associated with higher rates of fatal opioid overdose. Further, additional studies of complementary therapies efficacy and effectiveness to reduce rates of OUD and associated comorbidities are needed to then translate those findings to real-world effectiveness studies. We encourage future work in these directions that might result in improved outcomes for women with OUD.

References

  1. Back SE, Payne RL, Wahlquist AH, Carter REStroud ZHaynes L, Hillhouse M, Brady KTLing W. et al. (2011) Comparative Profiles of Men and Women with Opioid Dependence: Results from a National Multisite Effectiveness Trial. The American Journal of Drug and Alcohol Abuse 37: 313–323.
  2. Evans E, Kelleghan A, Li L, Li LMin J, et al. (2015) Gender differences in mortality among treated opioid dependent patients. Drug Alcohol Depend155: 228–235.
  3. Vital signs (2013) overdoses of prescription opioid pain relievers and other drugs among women–United States, 1999-2010. MMWR Morbidity and mortality weekly report 62: 537–542.
  4. VanHouten JP, Rudd RA, Ballesteros MF, Mack KA (2019) Drug Overdose Deaths Among Women Aged 30–64 Years – United States, 1999–2017. MMWR Morb Mortal Wkly Rep 68: 1–5. [crossref]
  5. Huhn AS, Tompkins DA, Campbell CM, Dunn KE (2019) Individuals with Chronic Pain Who Misuse Prescription Opioids Report Sex-Based Differences in Pain and Opioid Withdrawal. Pain Med. [crossref]
  6. Jamison RN, Butler SF, Budman SH, Edwards RR, Wasan AD (2010) Gender differences in risk factors for aberrant prescription opioid use. J Pain 11: 312–320. [crossref]
  7. Huhn AS, Berry MS, Dunn KE (2019) Review: Sex-Based Differences in Treatment Outcomes for Persons With Opioid Use Disorder. Am J Addict 28: 246–261. [crossref]
  8. Gibson CJ, Li Y, Huang AJ, Rife T, Seal KH (2019) Menopausal Symptoms and Higher Risk Opioid Prescribing in a National Sample of Women Veterans with Chronic Pain. J Gen Intern Med.
  9. Services USDfHaH. Draft Report on Pain Management Best Practices: Updates, Gaps, Inconsistencies, and Recommendations (2019) https://www.hhs.gov/ash/advisory-committees/pain/reports/2018-12-draft-report-on-updates-gaps-inconsistencies-recommendations/index.html#1-introduction.
  10. The Use of Complementary and Alternative Medicine in the United States. Accessed from: https://nccih.nih.gov/research/statistics/2007/camsurvey_fs1.htm#most.%20last%20accessed%2010/19/19.
  11. Gary Deng, Jun J Mao (2019) Acupuncture to Reduce Opioid Consumption in Patients with Pain: Getting to the Right Points, Pain Medicine 20: 207–208.
  12. Pieretti S, Di Giannuario A, Di Giovannandrea R, Marzoli F, Piccaro G, et al. (2016) Gender differences in pain and its relief. Ann Ist Super Sanita 52: 184–189. [crossref]
  13. Frenk SM, Porter KS, Paulozzi LJ (2015) Prescription opioid analgesic use among adults: United States, 1999-2012. NCHS Data Brief : 1–8. [crossref]
  14. Marsh JC, Park K, Lin YA, Bersamira C (2018) Gender differences in trends for heroin use and nonmedical prescription opioid use, 2007-2014. J Subst Abuse Treat 87: 79–85. [crossref]
  15. Back SE, Lawson KM, Singleton LM, Brady KT (2011) Characteristics and correlates of men and women with prescription opioid dependence. Addict Behav 36: 829–834.
  16. Smith PH, Homish GG, Leonard KE, Cornelius JR (2012) Intimate Partner Violence and Specific Substance Use Disorders: Findings from the National Epidemiologic Survey on Alcohol and Related Conditions. Psychol Addict Behav 26: 236–245.
  17. Smith KZ, Smith PH, Cercone SA, McKee SA, Homish GG (2016) Past year non-medical opioid use and abuse and PTSD diagnosis: Interactions with sex and associations with symptom clusters. Addict Behav 58: 167–174.
  18. Health ACfIMa. Definition of integrative medicine and health.  http://www.imconsortium.org/about/about-us.cfm. Accessed 10/8/19.
  19. Koithan M (2015) The Promise of Integrative Nursing. Creat Nurs 21: 193–199. [crossref]
  20. Thompson S, Wagner (2019) J Integrative nursing management of pain In: Kreitzer MJ, Koithan M, (eds.). Integrative Nursing. 2nd edn. New York, NY: Oxford Press.
  21. Chen Z, Wang Y, Wang R, Xie J, Ren Y (2018) Efficacy of Acupuncture for Treating Opioid Use Disorder in Adults: A Systematic Review and Meta-Analysis. Evid Based Complement Alternat Med 2018: 3724708. [crossref]
  22. Zhou K, Jia P, Bhargava S, Zhang Y, Reza T, et al. (2017) Opioid tapering in patients with prescription opioid use disorder: A retrospective study. Scand J Pain 17: 167–173. [crossref]
  23. Kazis LE, Ameli O, Rothendler J, Garrity B (2019) Observational retrospective study of the association of initial healthcare provider for new-onset low back pain with early and long-term opioid use. BMJ Open 9: e028633. [crossref]
  24. Price CJ, Merrill JO, McCarty RL, Pike KC, Tsui JI (2019) A pilot study of mindful body awareness training as an adjunct to office-based medication treatment of opioid use disorder. J Subst Abuse Treat [crossref]
  25. Garland EL, Hanley AW, Kline A, Cooperman NA (2019) Mindfulness-Oriented Recovery Enhancement reduces opioid craving among individuals with opioid use disorder and chronic pain in medication assisted treatment: Ecological momentary assessments from a stage 1 randomized controlled trial. Drug Alcohol Depend 203: 61–65. [crossref]
  26. Garland EL, Hanley AW, Riquino MR, Reese SE, Baker AK, et al. (2019) Mindfulness-oriented recovery enhancement reduces opioid misuse risk via analgesic and positive psychological mechanisms: A randomized controlled trial. J Consult Clin Psychol 87: 927–940. [crossref]
  27. Clarke TC, Black LI, Stussman BJ, Barnes PM, Nahin RL. Trends in the use of complementary health approaches among adults: United States, 2002-2012. Natl Health Stat Report 2015: 1–16.
  28. Upchurch DM, Burke A, Dye C, Chyu L, Kusunoki Y, et al. (2008) A sociobehavioral model of acupuncture use, patterns, and satisfaction among women in the United States, 2002. Womens Health Issues 18: 62–71. [crossref]
  29. Nahin RL, Barnes PM, Stussman BJ (2016) Insurance Coverage for Complementary Health Approaches Among Adult Users: United States, 2002 and 2012. NCHS Data Brief Pg No: 1–8. [crossref]

[1] “CAM” is a term that was previously used to identify interventions such as acupuncture, massage, and mindfulness and the commonly used term now is “complementary therapies.”

Evaluation of Efficacy of Hypertonic Saline and Mannitol in Combination in Patients with a Traumatic Brain Injury

DOI: 10.31038/JNNC.2019211

Abstract

Title: Evaluation of Efficacy of Hypertonic Saline and Mannitol in Combination in Patients with a Traumatic Brain Injury

Background: Traumatic Brain Injury (TBI) is a major cause of disability and death. In 2013, an estimated 2.5 million emergency department visits were related to TBI. In current practice, hyperosmolar therapy such as bolus doses of intravenous mannitol 20% and sodium chloride 3% are commonly used as single agents for the treatment of Cerebral Edema And Intracranial Pressure (ICP) reduction. The Brain Trauma Foundation guidelines do not recommend a preferred agent, nor do they comment on the use of these agents in combination. Currently, there are no published studies evaluating combination hyperosmolar therapy for ICP reduction. The primary objective of this study is to evaluate the efficacy of bolus doses of intravenous mannitol 20% and sodium chloride 3% utilized as monotherapy or in combination in patients with TBI.

Methods: This single-center retrospective study identified cases using a medication usage report generated through the electronic medical record at Advocate Christ Medical Center. Subjects 14 years and older admitted to the trauma service following a diagnosis of TBI who received an intravenous bolus of mannitol 20% and/or sodium chloride 3% from August 1, 2013 through August 1, 2018 were included. Subjects without known trauma confirmed by radiographic imaging, those who received a sodium chloride 3% continuous infusion, pregnant patients, and those who expired within twenty-four hours of admission were excluded. The following data points were collected: age, weight, gender, race, serum creatinine, serum sodium, serum osmolality, mean arterial pressure, initial Glasgow Coma Score (GCS), diagnostic imaging, presence of cerebral edema and size of midline shift on computed tomography, dose and frequency of hyperosmolar agents, neurosurgical intervention, vasopressor requirements, intravenous fluids, Hospital And Intensive Care Unit (ICU) Length Of Stay (LOS). All data was recorded without patient identifiers, maintained confidentially, and was analyzed using descriptive and inferential statistics.

Results: A total of 1000 patients were screened of which 176 met the inclusion/exclusion criteria. In-hospital mortality was experienced by 6 of 24 patients in the combination group compared to 18 of 152 patients in the monotherapy group (p=0.08). Statically significant reductions were seen in need for neurosurgical intervention (p=0.04), vasopressor utilization (p=0.03), and ICU LOS (p=0.02) demonstrating a benefit of monotherapy over combination. No difference was seen in laboratory values or vitals measurements.

Conclusion: Combination therapy was associated with a trend towards increase mortality compared to monotherapy use.

Keywords

hypertonic saline, intracranial pressure, mannitol, Traumatic brain injury

Introduction

Traumatic Brain Injury (TBI) is a major cause of disability and death in the United States. According to the Center for Disease Control and Prevention there are approximately 2.5 million emergency department visits related to TBI each year. These injuries resulted in 282,000 hospitalizations and 56,000 deaths.[1] in 2010, the total economic impact of TBI was estimated to be $76.5 billion.[2]

A TBI is defined as a bump, blow, or jolt to the head that disrupts the normal function of the brain commonly caused by falls, blunt trauma, and motor vehicle crashes. The severity of injury ranges from mild to severe.[1] The Glasgow Coma Scale is a validated tool used to assess the initial severity of brain injury. A GCS score of 13–15 is considered mild injury, 9–12 is considered moderate injury, and 8 or less is considered severe TBI.[3] For those who survive, the effects of a TBI can be temporary or leave an individual with permanent deficits. Effects of TBI can include impaired thinking, memory, movement, emotional, and social functioning.[1] These issues not only affect individuals but can have lasting impacts on families, communities, and the healthcare system.

A primary mechanism of poor neurologic outcomes in TBI stems from cerebral edema and subsequent increase in Intracranial Pressure (ICP). Tissue swelling from the injury can increase pressure inside of the skull, alter blood perfusion, and cause additional damage to the brain. A normal ICP ranges from 5–15mmHg.[4] A sustained ICP of greater than 20mmHg for greater than five minutes is associated with increased morbidity and mortality.[5]

In current practice, osmotic therapy with intravenous mannitol or hypertonic saline is used in symptomatic patients with cerebral edema or ICP elevation. Hyperosmolar therapy creates an osmolar gradient across the blood-brain barrier and also causes a reduction in blood viscosity by decreasing red blood cell rigidity and cohesiveness improving microvascular circulation. Mannitol, a sugar alcohol, works as a potent osmotic diuretic. It is administered in Intravenous Piggyback (IVPB) bolus doses of 0.25–1 mg/kg every 6–8 hours. Adverse effects include hypovolemia, hypotension, acute kidney injury and metabolic disturbances. Hypertonic saline is supplied in a variety of concentrations, the 3% concentration is dosed 250–500mL (128–256 mEq sodium) IVPB bolus every 4–6 hours. Adverse effects include hypervolemia, hypertension, and electrolyte disturbances.[6] The two therapies are not mutually exclusive and may be used in combination. Guidelines from the Brain Trauma Foundation make no recommendation on a preferred agent, nor do they comment on the use of combination therapy.[7] Currently, there are no published studies evaluating combination hyperosmolar therapy for ICP reduction. The purpose of this study is to evaluate the safety and efficacy of the combination of mannitol and hypertonic saline versus each agent used as monotherapy.

Methods

Patient population and setting

The single study site was a large, urban level 1 trauma center located on the Southside of Chicago, Illinois. Eligible patients were identified using a medication usage report generated through the electronic medical record for those admitted from August 1, 2013 through August 1, 2018. Screening for further inclusion and data collection was completed using the financial identification number of each patient. This study was approved by the local Institutional Review Board.

Inclusion/exclusion

Patients were included if they were at least 14 years old. Patients also must have been admitted to the trauma service, have radiographic imaging confirming TBI, and receive at least one of the study drugs to be included. Patients were excluded if they were less than 14 years old, pregnant, died within 24 hours of admission, did not have a history of recent trauma or radiographic evidence of a TBI, or did not receive study drug as a bolus.

Outcomes

The primary outcome of this study was incidence of in-hospital mortality. Secondary outcomes included the occurrence of neurosurgical evacuation, change in serum sodium, creatinine, and osmolality, Mean Arterial Pressure (MAP), and hospital and ICU LOS. Change in baseline laboratory measurements was defined as change from prior to 24 hours after the first dose of hyperosmolar therapy. Change in baseline MAP measurements was defined as change from prior to 30 minutes after the first dose of hyperosmolar therapy.

Statistical Analysis

A sample size of 800 patients was calculated to achieve 80% power to detect a difference of 10 percentage points between groups for the primary outcome of in-hospital mortality. Demographic and baseline data points were calculated as mean or median dependent upon their normality as assessed by the Shapiro-Wilk Statistic. Statistical analysis of all endpoints was done by combining the HTS and MAN group to make a monotherapy group that was tested against combination. Chi-Square tests were performed for categorical data and Mann-Whitney U tests were performed for continuous data. All tests were two-tailed and a p-value of 0.05 was considered statistically significant in all analyses.

Results

A total of 1000 patients were screened for inclusion in this study and 176 patients met the criteria. A total of 81 patients received only sodium chloride 3% IVPB bolus, 71 patients received only mannitol 20% IVPB bolus, and 24 patients received a combination of these two agents in scheduled alternating IVPB bolus form. Patient demographics of the study groups did not differ statistically (Table 1). The typical patient was middle aged, male, of Caucasian or African American decent. Patients who received combination therapy tended to be younger, were more likely male, and more likely African American. The median dose of HTS for all patients who received a dose was 250mL (128mEq). The average mannitol dose was 0.8g/kg for all patients who received a dose. Most patients received 1–2 days of therapy as denoted by number of doses received.

Table 1. Patient Demographics

HTS (n=81)

MAN (n=71)

HTS+MAN (n=24)

Age (years), mean

53.7

50.8

41.2

Male, n (%)

63 (76.5)

54 (76.1)

20 (83.3)

Weight (kg), mean

84.1

92.8

81.4

Race, n (%)

Caucasian

37 (45.7)

36 (50.7)

8 (33.3)

African American

29 (35.8)

33 (46.5)

14 (58.3)

Hispanic

10 (12.3)

0

1 (4.2)

Unknown

5 (6.2)

2 (2.8)

1 (4.2)

Characteristics and severity of TBI at initial presentation were collected and are displayed in table 2. Patients who received combination therapy tended to have lower GCS scores than those receiving monotherapy, however this difference was not statistically significant. All patient groups were similar in terms of rates of cerebral edema and midline shift as well as imaging findings of types of hemorrhage.

Table 2. Injury Severity and Characteristics. Values are median [interquartile range] except those specified with † are mean ± standard deviation

HTS (n=81)

MAN (n=71)

HTS+MAN (n=24)

GCS

12 [7–15]

12 [7–15]

9.2 ± 4†

Presence of Cerebral Edema, n (%)

35 (43.2)

36 (50.7)

11 (45.8)

Presence of Midline Shift, n (%)

26 (32.1)

42 (59.2)

11 (45.8)

Imaging, n (%)

Subdural Hemorrhage

53 (65.4)

48 (67.6)

16 (66.7)

Subarachnoid Hemorrhage

47 (58.0)

34 (47.9)

15 (62.5)

Intraparenchymal Hemorrhage

30 (37.0)

24 (33.8)

7 (29.2)

Epidural Hemorrhage

3 (3.7)

6 (8.5)

2 (8.3)

Diffuse Axonal Hemorrhage

4 (4.9)

2 (2.8)

0

Intracerebral Hemorrhage

2 (2.5)

1 (1.4)

0

Results of the primary and secondary outcomes of the study are shown in table 3. For the primary endpoint of mortality, a non-significant relationship was identified between combination therapy and mortality, with 11.8% of those on hypertonic saline or mannitol expiring after 24 hours as compared to 25.0% of those on hypertonic saline and mannitol expiring after 24 hours (p=0.08).

Table 3. Primary and secondary study outcomes. Values are median [interquartile range] except those specified with † are mean ± standard deviation. * indicates significance at p=0.05.

Monotherapy

Combination

P-value

HTS (n=81)

MAN (n=71)

HTS+MAN (n=24)

Mortality, n (%)

7 (8.6)

11 (15.5)

6 (25)

0.08

Neurosurgical Procedure sPPrprIntervention, n (%)

14 (17.3)

32 (45.1)

11 (45.8)

0.04*

Craniotomy, n (%)

10 (12.4)

18 (25.3)

3 (12.5)

Craniectomy, n (%)

4 (4.9)

13 (18.3)

8 (33.3)

Both, n (%)

0

1 (1.4)

0

Vasopressors Used, n (%)

6 (7.4)

5 (7)

5 (20.8)

0.03*

Fluid Bolus Used, n (%)

16 (19.8)

23 (32.4)

8 (33.3)

0.43

Hospital LOS (days)

10.9 [6.2–16.4]

12.0 [7.6–18.6]

13.8 ± 7.4†

0.55

ICU LOS (days)

6.0 [3–9]

5.0 [3–10]

9.1 [5.5–11.6]

0.02*

Initial Serum Sodium (mmol/L)

139 (±3.9)†

139 [137–141]

138.5 (±3.7)†

0.63

Repeat Serum Sodium (mmol/L)

142.7 (±6.3)†

140 [138–144]

142.5 [140–146.5]

0.13

Initial Serum Creatinine (mg/dL)

0.9 [0.8–1.2]

1.0 [0.8–1.2]

0.9 [0.8–1.1]

0.61

Repeat Serum Creatinine (mg/dL)

1.0 [0.6–1.0]

0.8 [0.7–1.1]

0.8 [0.7–1.2]

0.63

Low Serum Osmolality (mOsm/kg)

299.9 (±12.9)†

293.8 (±13.4)†

303.6 (±21.6)†

0.11

High Serum Osmolality (mOsm/kg)

302 [293–322]

314.5 [304–328]

317.2 (±20.5)†

0.56

Initial MAP (mmHg), mean

92.7

97.0

97.4

Repeat MAP, n (%)

0.10

No Change

57 (70.4)

46 (64.8)

12 (50)

Increase > 10 mmHg

11 (13.6)

11 (15.5)

3 (12.5)

Decrease < 10 mmHg

13 (16)

14 (19.7)

9 (37.5)

For the secondary endpoint of ICU LOS, a significant relationship was identified with those who received either hypertonic saline or mannitol having a median ICU LOS of 6.0 as compared to those who received both hypertonic saline and mannitol having a median ICU LOS of 9.1 (p=0.02). A total 7.2% of those on hypertonic saline or mannitol received vasopressor therapy, compared to 20.8% of those on hypertonic saline and mannitol (p=0.03). Neurosurgical intervention was needed on 30.3% of those on hypertonic saline or mannitol as compared to 45.8% of those on combination therapy (p=0.04). No difference was seen in fluid bolus requirements (p=0.43) or hospital LOS (p=0.55). None of the baseline values or repeat laboratory values were found to be significantly different between the groups. Furthermore, no significant result was found on MAP measurements (p=0.10).

A post-hoc sub analysis was performed on the primary endpoint and the hypertonic saline group (Table 4). Hypertonic saline had statistically lower mortality compared to combination therapy (p=0.03). However, it was not statically superior to mannitol when compared directly (p=0.19).

Table 4. Primary Outcome Sub Analysis. * indicates significance at p=0.05.

Sub analysis: Sodium Chloride 3% vs Combination

HTS (n=81)

HTS+MAN (n-24)

P-value

Mortality, n (%)

7 (8.6)

6 (25)

0.03*

Sub analysis: Sodium Chloride 3% vs Mannitol

HTS (n=81)

MAN (n-71)

P-value

Mortality, n (%)

7 (8.6)

11 (15.5)

0.19

Discussion

In this retrospective study, TBI patients were administered hyperosmolar therapy to decrease intracranial pressure. We found a trend towards a decrease in in-hospital mortality associated with monotherapy use with either sodium chloride 3% or mannitol 20% compared to combination therapy. The dosing of both agents was in accordance with current practice and first doses were often administered immediately after the patient presented to the emergency department with traumatic injuries. All groups were similar in demographic and injury characteristics with the typical patient presenting with a moderate TBI.

We predicted that the mannitol group may experience more adverse events such as acute kidney injury and hypotension. However, we did not find these results as serum sodium, creatinine, osmolality and MAP measurements did not significantly change 24 hours after the first dose of hyperosmolar therapy. Previous literature may overestimate the detrimental effects of hyperosmolar therapy including mannitol, or the initial dosing used in our cohort may be low enough to avoid these effects. The patients included in our study were primarily young, otherwise healthy adults who may better tolerate the medications compared to older adults with a higher likelihood of co-morbid renal and cardiovascular conditions.

We found that monotherapy was associated with a decrease in neurosurgical interventions. This decrease likely led to a significant decrease in ICU and overall hospital LOS. These reductions result in a great cost savings and imply better outcomes for patients. The sub analysis of our primary outcome revealed a statically significant reduction in mortality with the use of sodium chloride 3% monotherapy compared to combination therapy with mannitol. However, sodium chloride 3% was not significantly better than monotherapy with mannitol. Sodium chloride 3% may be the preferred agent for ICP reduction after TBI, but further research is needed in this area. Based on the results of the primary outcome being nonsignificant, it was determined that mannitol alone would not be statistically superior than combination therapy at lowering in-hospital mortality as the composite of mannitol and hypertonic saline was not significant.

Our study suffered from several limitations. This data was collected from a single center in a retrospective manner. It did not meet power for the primary endpoint. The combination therapy group had a small sample size of 24 patients and these patients had a lower initial GCS score. This could mean this was a more critically ill group and thus more likely to need advanced therapies, have poorer outcomes and expire. However, none of the baseline data points were statistically significant between groups. We did not collect data on other injuries beyond those of the head which often contribute to patient death from traumatic causes. There was also variance in the dosing of hyperosmolar therapy, and timing of blood pressure and laboratory measurements. Lastly, our institution does not routinely use ICP monitors, consequently our efficacy data was purely symptom based.

Conclusion

Combination therapy was associated with a trend towards increased mortality compared to monotherapy use. Compared to combination therapy, subjects treated with monotherapy had a statistically significant reduction in ICU LOS, need for neurosurgical evacuation of hemorrhage, and vasopressor therapy to maintain MAP goals.

As this is the first published study evaluating the use of combination hyperosmolar therapy in TBI, further evaluation is needed. Specifically, the evaluation of a continuous infusion of hypertonic saline in addition to mannitol IVPB maybe an area of promise. Additionally, a prospective study would be able to set standard dosing and monitoring regimens. A randomized control study of monotherapy versus combination therapy for hyperosmolar agents in TBI would allow the establishment of a causal association of these therapies with outcomes such as mortality, ICU LOS, and need for neurosurgical interventions.

References

  1. Taylor CA, Jeneita M Bell, Matthew J Breiding, Likang Xu (2017) Traumatic Brain Injury – Related Emergency Department Visits, Hospitalizations, and Deaths – United States, 2007 and 2013. MMWR. US Department of Health and Human Services 66: 1–16.
  2. Faul M, Likang Xu, Marlena M. Wald, Victor G. Coronado (2010) CDC, National Center for Injury Prevention and Control.
  3. Teasdale G, Jennett B (1974) Assessment of coma and impaired consciousness. A practical scale. Lancet  2: 81–4.
  4. Boone MD, Oren-grinberg A, Robinson TM, Chen CC, Kasper EM (2015) Mannitol or hypertonic saline in the setting of traumatic brain injury: What have we learned? Surg Neurol Int 6: 177.
  5. Peters NA, Farrell LB, Smith JP (2018) Hyperosmolar Therapy for the Treatment of Cerebral Edema.US Pharmacist 43: 8–11.
  6. Muizelaar JP, Wei EP, Kontos HA, Becker DP (1983) Mannitol causes compensatory cerebral vasoconstriction and vasodilation in response to blood viscosity changes. J Neurosurg 59: 822–8.
  7. Carney N, Totten AM, Oʼreilly C (2017) Guidelines for the Management of Severe Traumatic Brain Injury, Fourth Edition. Neurosurgery 80: 6–15.

Cartography of Doctor-Patient Relationship: A Mind- Genomics Exploratory Study about the Public’s Response to Patient-Centered-Care

DOI: 10.31038/JCRM.2019251

Abstract

The nature of the doctor-patient interaction significantly affects the trust in their relationship. Barriers in communication which ignore the emotional needs of patients reduce patient trust in the doctor, as well as challenge the delivery of patient-centered-care, the preferred approach of care. Based on previously acknowledged determinants of patient trust in the patient-doctor relationship, we identified two patient mind-set segments which supersede age and gender. Patients in one mindset expect their doctor to greet them respectfully, to be empathic, to listen carefully without interrupting, and in the end feel that their doctor understands them. Patients in the second mind-set segment expect the doctor to enhance their internal locus of control. This second mind-set wants the doctor to educate them, providing clear, relevant, tailored, information and ensuring that they understand the information. This second mind-set wants the doctor to let them feel comfortable asking questions about what they didn’t understand, and walk them through a change process, by steps, towards self-management of their disease.

Introduction

Patient-Centered Care (PCC) has been demonstrated to improve clinical outcomes (IOM, 2001). The IOM defines patient centered care as “care that is respectful of and responsive to individual patient preferences, needs, and values” and that ensures “that patient values guide all clinical decisions” (IOM, 2001). From the perspective of the patient, the eight characteristics of care which indicate high quality and safe care are, respectively, respect for patient’s values; preferences and needs; coordinated and integrated care; clear, high-quality information; education for the patient and family; physical comfort; emotional support; involvement of family members; continuity in care-transitions; and access to care [1,2]. PCC leads to improved clinical outcomes. The pinnacle of PCC is the active engagement the patient when fateful health care decisions must be made; when the patient is at crossroads of medical options, and the divergent paths have meaningful consequences for the patient and family [3]. Patients at crossroads of medical action are vulnerable, have needs they cannot fulfill on their own, and rely on and have positive expectations from a doctor [4]. To address dimensions of PCC, the doctor is called upon to implement and evaluate care systems and work together with patients to produce optimal clinical outcomes. In these situations the patient-doctor interaction can strongly drive cooperation and ultimate outcome [5].

Trust is an attitude by which, in the absence of the ability to predict what will happen in the future, the patient believes that in the moment of truth, the doctor will behave according to expectations [4, 6, 7]. Trust by the patient in the doctor entails the acceptance by patient of her or his vulnerability [8]. The interaction with physicians may create this patient-trust or perhaps patient-distrust in a doctor. The importance of patient-trust in a doctor emerges from evidence indicating that patient trust is related to patient adherence to medication and to guidelines. Patient trust in a doctor is associated with fewer readmissions, better health outcomes better long-term health and higher quality of life [9–12]. In psycho-social discourse between doctor-patient the doctor can clarify patient’s expectations, whether clear or ambiguous, making the expectations concrete, and shaping the precise nature of these expectations. Lack of such discourse, i.e., treating the patient but not really interacting with the patient as a person, may be negatively affect the ultimate outcome, despite the doctor’s efforts to provide optimal care, and despite the sophistication of the medical treatment itself.

A model of an improved way to interact with patients comes from the world of psychotherapy. Research continues to demonstrate that high quality relationships between therapists and their clients result in more positive outcomes, Medicine continues to borrow characteristics of positive relationships from the field of Psychotherapy to doctor-patient relationships [13, 14]. Positive relationships entail attitudes and behaviors; acceptance, empathy, concern, support, flexibility, honesty, confidence, human warmth, openness and respect for the patient, and so forth. These characteristics nurture patient trust in the doctor and patients’ ability to assume responsibility for their health [15, 16]. The quality of the relationship depends on active listening, maintaining patient focus, on creating a calm and warm atmosphere, enhancing patient’s information and knowledge; n legitimizing expressions, avoiding directives, or too much information, and finally using language which expresses closeness [17,18].

When interacting with doctors, the patient relies on the knowledge, abilities, and skills of the doctor, especially when the interaction is done when the patient is suffering. In turn, the doctor depends on the patient who can provide accurate and comprehensive information about the specific symptoms of the disease in his body, information which lead to the accurate diagnosis, and in turn the accurate and appropriate treatment [19, 20]. This mutual dependence for the best outcome demands that the patient feel comfortable with the doctor, allowing the patient to expose weaknesses and limitations. The relation becomes a two-way street. In turn, good doctor-patient communication may build trust, a necessity for a beneficial and effective doctor-patient relationship [21–26].

According to studies, the more the doctor is empathic, technically competent, listening, reliable, honest and concerned for the patient’s well-being, compassionate, the greater appears to be the patient trust in the doctors. Patients who rated their doctors’ inter-personal abilities as high reported greater trust [27]. The higher the reputation of the doctor, the more the patient trusted the doctor. Finally, research shows that the more the doctor meets the patient’s expectations, the higher is the patient’s satisfaction, and the highest is the trust [28–30]. The patient’s ‘perceived locus of control’ has been report to be important for the trust that the patient puts in the doctor [18]. Perceived control, a psychological construct, is grounded in social learning theory. Perceived control moves along the continuum from perceived external locus of control to perceive internal of control focus [31]. Patients with internal locus of control perceive everything in their world as their responsibility. Patients with external locus of control attribute events in their lives to external factors, e.g., luck, boss, weather, and so forth [18, 31–33].

Patients with internal locus of control are directed to action [33, 34]. They look for relevant information on their illness and are more involved in decision-making. These patients with internal locus of control take responsibility for improving their health behaviors, reducing harmful health behaviors and accelerating recovery from illness [35–39]. A retrospective study also found that using communication that targets patient’s perceived control reduced the number of readmissions [9]. These findings suggest that one opportunity to improve outcomes is the adoption of communication style and content which enhance the patient’s internal locus of control. The actual behavior may be to guide patients to think about resources, both those in themselves, and those external to themselves, in order to improve health. These external resources may be forums, mobile phone reminders for taking one’s drugs, and so forth [40, 41]. The world of the doctor-patient interaction is shifting quickly, morphing into a less personal relationship. The increasing complexity of medical science, along with technology and business consideration prevent doctors from establishing a close bond with the patient. In the interest of efficiency, technology and business appear to be reducing the opportunity to create a beneficial bond between doctor and patient. The ‘patient intake’ may occur through portals at home; computer facilitated intake at the office. The traditional psycho-social model of patient-doctor interaction, whether true or simply somewhat romanticized, has given way to capitation, to short, tightly scheduled visits with the patient, in order to deliver optimal outcomes. The amount of communication is limited, the type of communication is reduced and so is the span of attention of the doctor [42]. This study examines patient preferences as to what to strengthen in doctor-patient communication by mind-set segmentation and what to avoid in communicating with patients in each mindset.

Methods

The Mind Genomics approach

Mind Genomics is an emerging psychological science which studies decision processes of the ‘every day.’ People live in the ordinary world, confronted by what is by now ‘standard problems,’ such as what to wear, what to buy, and of course when to go to their physician, and what truly private information can they feel comfortable when they share with their physician. Much of what we know about the psychology of the everyday comes from large-scale attitude and usage studies, usually done with the focus of selling a product or a service. These studies, also called habits and practices, are commissioned by corporations with the objective to understand possible opportunities with consumers, opportunities which emerge from the everyday. These studies do not look at the aspects of everyday life as the basis to understand the ‘algebra of the mind,’ the rules of decision making, except in isolated cases, and disconnected experiments.

Mind Genomics was developed in the 1980’s by author [43, 44, 45] to create an archival base of knowledge showing how people react to the different facets of a common situation. Since 2015 Mind Genomics is used in the health context [44, 46, 47, 48, 49, 50, 51, 52]. Rather than looking at isolated situations, and disconnected experiments, the ingoing vision was to take a specific ‘vertical’ of related experiences, and for each experience or ‘topic,’ identify the features of the experience and then list alternatives possible with each feature. Explained another way, Mind Genomics takes a topic, such as the patient’s experience when the visiting the doctor, divides the topic into questions defining the different aspects of the visit, and then provides a set of answers to each question. These answers represent alternatives which could happen. The final step combines these ‘answer’s (alternative events in visiting one’s doctor), creating many ‘vignettes,’ presents these vignettes to people, and gets their reactions to the different vignettes. The result is a portrait of how people react to these different answers, different aspects of visiting a doctor.

Sample

A sample of 25 patients who were asked to relate to their primary physician and define themselves as choosing to be healthy. This sample is a preliminary step in creating a baseline dataset, showing major trends. The small number of respondents is satisfactory for these early stage studies, where the objective is to get a sense of the topic areas which are very important to respondents. Each respondent participates in what is best considered to be an individual-level experiment. The pattern of the data from one individual suffices to show the mind-set of the individual toward the topic, i.e., what is important and what is not. Increasing the number of respondents does not add more precision, but rather allows different mind-sets to emerge. Early stage research, where the topic is not well researched and the key variables not yet known, benefits from a series of such small, exploratory studies, probing different facets of the topic. This first study falls into the class of the small, easily done, affordable explorations, the larger set of which can be woven into a detailed tapestry. Such research is usually not done when the effort is expended against one part of a topic, ignoring most others.

Procedure

Mind Genomics is an experiment, rather than a survey. The objective is to trace a path of causation, between what is described in the doctor-patient interaction and the patient’s response. The approach combines Socratic question/answer with experimental design, to create the inputs necessary for the experiment. The process follows these straightforward steps, forcing the researcher to think in a structured fashion, and in so doing produce the requisite input for the experiment.

Step 1: Define The Topic:  The topic here is the patient’s description of how she or he was treated, and felt, after a consult with the physician

Step 2: Ask Four Questions Pertaining to the Consult with the Physician: The four questions must tell a story. Asking the four questions requires the critical thinking by the researcher. The exercise becomes the foundation for either a good experiment or a poor experiment. (Table 1) presents the specific set of four questions focusing on the doctor-patient trust building interaction. We limited the amount of questions to avoid the research being onerous for respondents and for creating the science through straightforward insights, the ultimate goal.

Table 1. The four questions and the four answers for each question.


Question A: What is internal locus of control?

A1

Doctor encouraged to ask about what I didn’t understand

A2

Involved as much as I want to be with this doctor

A3

Doctor discussed the next step appropriate for me

A4

Doctor set up a clear follow up plan with me


Question B: How did the doctor educate the patient?

B1

Doctor gave me information about my condition

B2

Doctor referred me to where I can learn more about my condition

B3

Doctor made sure I understood the information

B4

Doctor validated and ensured my relevant information


Question C: How was the time spent in the consult?

C1

Doctor let me talk without interruption

C2

Doctor spent as much time as I needed

C3

Doctor interested in what I thought about the situation

C4

I felt the doctor understood me


Question D: What nonverbal language was used by the doctor?

D1

Doctor kept the contact with me

D2

Doctor listened carefully

D3

Doctor greeted me respectfully

D4

Doctor focused on me and not on the computer

Step 3: Provide Four Answers to Each Question: The four answers present different facets of the question, different alternatives. It will be the answers that will be seen by the respondent, in various combinations, the vignettes described below. The respondent will never see the questions. The only purpose of the question is to motivate the answers. (Table 1) shows the answers. They are presented in simple format, usually a declarative sentence, occasionally with a short reprise of the question in one/two words, a colon, and then the answer. (Table 1) shows the format of the answer, generally begun with the word ‘doctor’ in the starting part of the answer, unless the meaning of the answer would be distorted (A2, C4).

Materials

Step 4: Create Vignettes Using the Principles of Experimental Design: The standard approach to understand the patient’s feeling about the consult with the doctor uses a survey, a set of questions that are to be answered with a scale. Mind Genomics works differently because it is an experiment. Mind Genomics creates test descriptions, combinations of answers, and the vignettes, presents them to the respondent, and obtained an answer. The ratings of the vignettes are then deconstructed to provide a sense of how each element ‘drives’ the rating. Vignettes rather than single phrases provide three distinct benefits for the research.

  1. It is impossible to ‘game the system,’ to provide answers which tell a specific story. Virtually all respondents who begin with the attempt to provide a specific pattern of answers ‘give up’ because the combination is simply too difficult to deconstruct. The respondent soon adopts a strategy of assigning ratings by intuition, by ‘gut reaction,’ the precise criterion necessary for valid information.
  2. Respondents are more accustomed to stories than to single facts. The combination by vignettes presents a story.
  3. The experimental design allows the researcher to measure interactions among different answers, specifically whether the combination of two answers together is more powerful than one might expect, or engage the respondent’s attention longer (see response time below.)

The actual experimental design requires that the 16 answers be combined into 24 combinations, vignettes, with the vignettes comprising no more than one answer from each question, but sometimes absent answers from one or two questions. That is, the vignettes comprise 2–4 answers. The vignettes are incomplete, allowing the 16 answers, now elements in the vignette, to be statistically independent of each other. That statistical independence will allow the use of OLS (ordinary least-squares) regression to relate the presence/absence of the elements to the response.

The vignette is rated as a totality, using the rating scale below:

How likely are you to revisit this doctor and/or recommend to friends?

(1= don’t want to revisit, 9 = want to revisit).

Figure 1 (left panel) shows the four questions as they are entered into the BimiLeap program (www.BimiLeap.com), whether on an android device or on the web. Figure 1 (middle panel) shows the four answers to each question, as they are entered into the program. The BimiLeap program, the technology underlying the Mind Genomics science, enables the researcher to structure her or his thinking,

MIND GENOMICS 028_JCRM_f1

Figure 1. The left panel shows the four questions, ready to be entered. The middle panel shows the four answers to the first question, ready to be answered. The right panel shows a vignette, ready to be rated.

Recent developments in experimental design by [53] have created what is called ‘systematic permuted design.’ This advance generates several hundred permutations of the one basic design underlying the 4×4 structure (four questions, four answers.) The combinations in the permuted designs are different from each other, but each design is isomorphic to every other design. Thus, one need not be worried that the 24 combinations chosen for the experiment are the ‘correct combinations.’ Each respondent will see a different set of combinations, similar to the way the MRI (Magnetic Resonance Image) in medicine takes many pictures of the same tissue, from different angles, and puts them together. Each picture in the MRI is incomplete, but the combination reproduces the view of the underlying organ. In the same way, each set of 24 vignettes is a picture, but not the whole picture. It is the combination of the different vignettes in one large regression analysis which will provide the full picture.

Step 5: Invite the respondents to participate, using an e-panel (online) sample provider. For many studies it is tempting to source the respondents for the study using friends and others, such as people one knows on social media. The sourcing of respondents that way may work, but the time to do the research stretches into the days and weeks. A more efficient way works with a sample provider, who charges a small fee to recruit the panelists from a large pool of individuals, according to specific recruitment criteria. The panel provider for this study was Luc.id, Inc. The respondents were invited to participate. Within two hours the study was completed.

Step 6: Present the respondents with the systematically varied combinations, the vignettes, whether on a smartphone of any type, on a tablet, or on a personal computer. The Mind Genomics platform presents the vignettes on any platform, introduces the topic, presents the vignettes one at a time, records the rating and also records the response time, defined as the number of seconds between the presentation of the vignette and the response. When the rating is assigned, the vignette automatically disappears, and the next vignette appears. This process makes the experiment last 3–5 minutes, and does not frustrate the respondent. (Figure. 1) (Right panel) shows an example of one of the vignettes, along with the rating scale.

Results

The raw data from the Mind Genomics studies comprise the ratings and the response times. The users of the data are much more interested in no/yes answers. To make the data more useful, we divide the scale twice, first into the revisit/recommend ‘binary scale’ (ratings 8–9 transformed to 100, ratings 1–7 transformed to 0), and then into the not-revisit/not-recommend ‘binary scale (ratings 1–2 transformed to 100, ratings 3–9 transformed to 0.) The choice of the cut-point when bifurcating the scale is left to the researcher and may be altered depending upon the topic

The ratings are on a 9-point scale, are not very instructive to those who use the data. The standard approach in Mind Genomics is to transform the data, so that ratings of 1–6 are transformed to 0, and ratings of 7–9 are transformed to 100. In this study the majority of ratings are encompassed by the range 7–9. There would be very little to learn from the standard transformation. When we apply the more stringent criterion of ratings 8–9, we may learn more. Furthermore, there is something to be learned from ratings 1–2–3, the rejection range. To keep the analysis symmetric, we choose ratings 1–2 to analyze as well.

Creating a Model

The experimental design allows the researcher to relate the presence/absence of the elements to the ratings, by ensuring that the 16 elements are presented in combinations, so that the 16 elements are statistically independent of each other. Statistical independence enables the researcher to use OLS (ordinary least-squares) regression to relate the presence/absence of the elements to the binary ratings, and to the response time, respectively. The regressions are run first at the level of the individual respondent, the regression coefficients which will be stored, and used for clustering, discussed below. The regressions are then run with ALL the data from a particular subgroup included in the data (e.g., responses from all individuals declaring them females, or of a certain age range, etc.)

The data enable us to create three different models:

  1. Models relating the presence/absence of the elements to the Top2 Rating (Revisit/Recommend)
  2. Models relating the presence/absence of the elements to the Bottom2 Rating (Not Revisit/Not Recommend)
  3. Models relating the presence/absence of the element to the response time.

For the self-defined sub-groups. We will look at five groups, comprising Total Panel, two genders, and two age ranges, respectively.

Recommend/Revisit (Top 2)

The additive constant shows the estimate percent of the times that a rating would achieve the rating of 8–9 in the absence of elements. The additive constant refers to a hypothetical case, since all the vignettes comprises 2–4 elements as dictated by the underlying experimental design. Nonetheless, the additive constant is a good baseline.

(Table 2) shows an additive constant of 49 for the total panel, and similar values hovering around 50 for the genders. We concluded that in the absence of elements, about half the respondents will say they would revisit/recommend. Age makes a difference, with respondents under 40 less likely to revisit/recommend, versus respondents older than 40 more likely to revisit/recommend.(Table 2) shows the strong performing elements, with an element appearing in (Table 2) only when the element scores highly in at least one subgroup:

Table 2. Performance of the elements in terms of driving positive responses (Top2, Revisit/Recommend). Only strong performing elements in at least on key subgroup are shown (coefficient >9).


Top 2 (Revisit/Recommend)

Total

Male

Female

Age < 40

Age 40+


Additive constant

49

51

47

33

60

D2

Doctor spent as much time as I needed

9

16

4

9

8

D3

Doctor interested in what I thought about the situation

8

16

1

4

8

B1

Doctor gave me information about my condition

4

9

1

-4

8

C4

I felt the doctor understood me

3

-6

10

-1

5

D1

Doctor let me talk without interruption

2

7

-2

9

-4

Not-Recommend/Not-Revisit (Bot2)

The additive constant shows the estimate percent of the times that a rating would achieve the rating of 1–2 in the absence of elements. As stated above, the additive constant refers to a hypothetical case, since all the vignettes comprises 2–4 elements as dictated by the underlying experimental design. Nonetheless, the additive constant is a good baseline. (Table 3) shows an additive constant of 3 for the total panel, and similar values hovering around -5 to +5 except for males (additive constant = 10) and for younger responses, age < 40 (additive constant = 13). We conclude that the respondents most likely to be dissatisfied are probably the younger males. Across the five groups the elements driving dissatisfaction tend to be those wherein the patient took control of the interaction, not the doctor. It may well be patients divide on the degree to which they want the doctor to seize control of the interaction. (Table 3) shows the strong performing elements, this time ‘strong performing’ operationally defined as a coefficient > 7.

Table 3. Performance of the elements in terms of driving negative responses (Bot2, Not-Revisit/Not-Recommend). Only strong performing elements (coefficient > 7) are shown.


Bot 2 (Not-Revisit/Not-Recommend)

Total

Male

Female

Age < 40

Age 40+


Additive constant

3

9

-3

13

-2

C1

Doctor let me talk without interruption

6

7

5

2

8

C2

Doctor spent as much time as I needed

5

8

3

3

7

C3

Doctor interested in what I thought about the situation

5

4

6

1

7

Response Time (>1.3 seconds for an element)

The experimental design allows us to look at the response time to the 16 different elements by key subgroup There are only a few elements which demand our attention, operationally defined as an estimated response time for the element of 1.3 seconds or great. There is no clear pattern of response times across groups. (Table 4) shows the longest response times.

Table 4. Performance of the elements in terms of driving response times. Only response times > 1.4 seconds for at least one subgroup are shown.


Response Time

Total

Male

Female

Age < 40

Age 40+

B3

Doctor made sure I understood the information

1.7

1.2

2.1

0.9

2.1

B4

Doctor validated and ensured my relevant information

1.3

1.0

1.4

0.7

1.6

B1

Doctor gave me information about my condition

1.3

0.6

1.8

0.9

1.5

B2

Doctor referred me to where I can learn more about my condition

1.2

0.2

1.9

0.5

1.5

A3

Doctor discussed the next step appropriate for me

1.0

0.6

1.3

0.2

1.5

A2

Involved as much as I want to be with this doctor

1.2

0.5

1.8

0.8

1.4

C1

Doctor let me talk without interruption

1.1

1.1

1.1

0.5

1.4

A1

Doctor encouraged to ask about what I didn’t understand

1.0

0.6

1.6

1.0

1.3

Interactions among Elements

The permutation strategy produces many different combinations, not just one limited set. One beneficial outcome is that it is possible to measure how elements or answers to one question affect the coefficients of other elements. This approach is called scenario analysis, and is only possible when the underlying experimental design is systematically permuted to create the many combinations. The more conventional approach, testing a limited number of combinations but with many people, ends up forcing the research to choose a limited number of combinations, and in turn, forever forego the opportunity to discover interactions. The strategy used here is known as scenario analysis. We will hold the elements or answers to one question constant (e.g., D, non-verbal communication). There are five different elements in question D, answers or elements D1, D2, D3, and D4. There is also one other element, the fifth, when D does not appear.

The question thus becomes simply ‘How does each of the non-verbal communications, D0-D4, affect the response to the other elements? We follow these three simple, straightforward steps:

  1. Create Strata: Sort the raw data set into five strata, based upon the specific answer provided by Question D (non-verbal action of the doctor). The design offers us four different answers (see Table 1), as well as those vignettes where, deliberately, an answer from Question D is omitted.
  2. Regression: Run a simple regression, using as predictors A1-C4, for Top2 and for Bot2, respectively, with an additive constant.
  3. Lay out the coefficients in the form shown in Table 5 (Top2).

We begin with the dependent variable being Top2 (Revisit/Recommend). (Table 5) shows the five different sets of coefficients for the 12 elements A1-C4. The four Elements D1-D4, do not appear in the coefficients for the simple reason that they are constant within a stratum. (Table 5) shows five columns of data, one for each stratum, defined by D=0 (no answer from Question D appears in the vignette), and then one column for each stratum (D=1, D=2, D=3, D=4). The coefficients appeared in shaded format and in bold type when the value is +9 or above, a value for the coefficient meaning that when the element is added to the vignette, the percent of respondent sayings ‘I’ll recommend / revisit’ jumps an additional 9%. Finally, the elements A1-C4 are sorted by their value when D=0, i.e., they are sorted by their performance in those vignettes which do not have any element from Question D.

(Table 5) shows a remarkable number of strong-performing elements. What is more interesting is that some elements interact dramatically with certain elements from a different question, but not with other elements from the same question. For example, consider elements C3 and C4: Doctor interested in what I thought about the situation, and I felt the doctor understood me. These are two strong performing elements, remaining so when combined with Element D1 (doctor listened carefully). Yet with any other element or answer from question D, these two elements, C3 and C4, performed poorly.

Table 5. Scenario analysis showing how elements (answers) from Question D synergize the rating of Revisit/Recommend when combined with other elements from other questions.


Top 2: Revisit/Recommend

None

Doctor kept the contact with me

Doctor listened carefully

Doctor greeted me respectfully

Doctor focused on me and not on the computer


D=0

D=1

D=2

D=3

D=4


 Additive constant

24

73

40

64

52

C1

Doctor let me talk without interruption

56

-22

-1

-12

-10

C3

Doctor interested in what I thought about the situation

36

-6

13

-20

-22

C4

I felt the doctor understood me

31

-2

17

-6

-1

B1

Doctor gave me information about my condition

20

-21

15

19

-2

B4

Doctor validated and ensured my relevant information

16

-9

-1

12

-18

C2

Doctor spent as much time as I needed

15

5

20

-16

-19

B2

Doctor referred me to where I can learn more about my condition

4

9

12

6

-9

B3

Doctor made sure I understood the information

1

-4

13

7

-2

A3

Doctor discussed the next step appropriate for me

-1

-6

0

-9

13

A2

Involved as much as I want to be with this doctor

-9

-11

4

-11

17

A4

Doctor set up a clear follow up plan with me

-13

-24

-8

-7

28

A1

Doctor encouraged to ask about what I didn’t understand

-38

-28

7

9

29

We do not yet know the reason for the strong performance of pairs of elements, and why some elements suppress each other, whereas other elements synergize with each other to create far stronger performances (e.g., B3 + D2; Doctor made sure I understood the information + Doctor listened carefully.) Fortunately, these Mind Genomics studies are straightforward experiments, easy and affordable to do, allowing the enterprising research to investigate these interactions in a systematic, structured way.

Mind-Sets in the Population

A key tenet of Mind Genomics is that for a topic area, no matter how granular, there may exist two or more alternative groups of ideas, mind-sets, representing alternative ways of thinking about what is important. The key here is that the mind-sets are combinations of ideas. At any one time an individual may be assigned to membership in one mind-set. There is no clear information about the lability of membership in mind-sets, i.e., whether over a lifetime a person may shift from membership in one mind-set to membership in another mind-set.

The mind-sets are hypothesized to exist and extracted from the raw data by a simple set of statistical processes coupled with interpretation.

  1. Individual Model: Each respondent generates a model relating the presence/absence of the elements to the ratings. The dependent variable is the rating, or now a binary transformation of the rating. The convention has been to divide the scale into two halves, with ratings of 1–6 becoming 0, and 7–9 becoming 100. This is similar to our division of the scale into 1–7 versus 8–9. For the preparation of data for clustering (the basis of mind-sets) we follow the convention, not the more stringent 1–7 and 8–9 bifurcation.
  2. Use All Coefficients: The 16 coefficients from the individuals’ model are used as inputs for the clustering.
  3. Clustering: A k-means clustering [54] first divides the respondents into two complementary and exhaustive sets and then afterwards repeats the task, dividing the respondents into three complementary and exhaustive sets. The separation into groups or clusters uses a ‘distance’ measure between each pair of respondents. The clustering places respondents into two or three groups so that the set of person-to-person distances within a cluster is small, but the distance between the different clusters is large. This process is purely mathematical and does not involve interpretation.
  4. Interpretation: The pattern of average coefficients across the 16 elements, tell us the ‘interpretability’ of the cluster. The clustering must ‘tell a story’ (interpretable) and be parsimonious. The fewer the number of clusters the better.
  5. Table 6 shows the summary data for the two mind-sets, for Top2 (Revisit/Recommend) and for Bot2 (Not Revisit/Not Recommend). We will look at the two mind-sets in reverse order of mind-set.

Table 6. The models for Top2, Bot2, and Response Time for the two mind-sets. Shown are only the strong performing elements for Top2 (coefficient > 9) and for Bot2 (coefficient > 7).


MS1

MS2

MS1

MS2

MS1

MS2


Top2: Revisit / Recommend

Bot2: Not-Revisit / Not-Recommend

Response Time


Additive constant

65

37

-2

6

NA

NA


Mind-Set 2 – Focused on empathy


D3

Doctor greeted me respectfully

-1

14

4

-1

0.9

0.9

C4

I felt the doctor understood me

-11

13

4

-2

0.9

1.1

D2

Doctor listened carefully

5

12

-2

5

0.4

1.5

C1

Doctor let me talk without interruption

-14

9

6

6

1.1

1.1

D4

Doctor focused on me and not on the computer

-5

9

2

2

0.6

0.7

Mind-Set 1 – Focused on Doctor providing information (it’s about authority)

A2

Involved as much as I want to be with this doctor

4

-4

-2

7

0.9

1.4

C3

Doctor interested in what I thought about the situation

-3

-4

0

8

0.6

0.6

Mind-Set 2 focuses on empathy. The additive constant is moderate [37]. It is the elements which do the work. These elements pertain to the emotional response to the situation, and the feeling that the doctor was focusing on the patient as a human being. At the same time, it is the doctor who listens but does not let the patient take control in terms of driving the diagnosis. Here are the strong elements which drive revisit/recommend. Mind-Set 1 at first appears to be generally ready to revisit/recommend, with an additive constant of 65. Nothing really seems to drive respondents in Mind-Set 1 to either to revisit/recommend or not. The coefficients are low. The key to Mind-Set 1 lies in the elements to which they attend, as revealed by the estimated response times. The response times for the elements below are the longest for Mind-Set 1.

Finding these Mind-Sets in the Population

Most studies in the emerging science of Mind Genomics do not find a simple co-variation of mind-sets and the straightforward measures of a person, such as age, gender, and even education or residence. There is no such thing as the mind-set of a so-called Millennial or GenX with respect to how they want the doctor to treat them. The popular press may give the impression that the different groups in the population, such as the aging Baby Boomers, the Echo Boomers, The Millennials, and the GenX can be identified by homogeneous but changing values. Some larger-scale studies with Mind Genomics on various topics for clients suggest that this is not the case. We cannot simply ‘know’ the mind-set to which a person belongs simply by knowing the age group to which the person belongs.

Recently, author Gere has created a technique using the average coefficients from the subgroups to assign new people to the mind-sets. The approach uses a Monte-Carlo simulation of alternative patterns of coefficients, based upon adding slight f ‘noise’ (random variation), and then determining which coefficients still best differentiate between two mind-sets or among three mind-sets. The results of the simulation create six questions based upon the elements, and two responses, or a total of 64 patterns. Each pattern ‘maps’ to one of either two mind-sets, or to one of three mind-sets, respectively.

Figure 2 shows the PVI. The respondent fills out the form and receives the information mind-set membership in a return email.

MIND GENOMICS 028_JCRM_f2

Figure 2. The PVI (personal viewpoint identifier) for this study.

Discussion

This study tested patient preferences while interacting with doctors. Findings stress patient’s expectations to be involved and to feel understood and being valued by the doctor.

  1. Respondents in Mind-Set 1 – patients expect the doctor to enhance their internal locus of control by providing them relevant, tailored, information clearly and making sure they understand the information the doctor provided. Mind-Set 1 expects the doctor to enable them to comfortably ask questions about what they didn’t understand.
  2. Respondents in Mind-Set 2 expect to feel that the doctor views them as equal, as a person, being sensitive to their feelings. Mind-Set 2 expects expect the doctor to greet them respectfully, to be empathic, to carefully listen to them and to understand them. They expect the doctor to listen to them without interrupting them.

Barriers to doctor-patient communication exist [55, 56]. Doctors, however, can improve their communication skills [57]. Findings call upon doctors to make a difference for patients by creating inspiration and trust through communication according to patient expectations by mind-sets, regardless of patient age, and gender. Although patients may understand their illness and health in general, they expect their doctors, as a medical authority, to inspire them to take greater responsibility for their health [58, 59]. Encouraging patients to be active in communication with their doctors will increase responsiveness, maintain patient trust and promote adherence and healthy behaviors. Doctor’s awareness to the communication a patient prefers will enable the doctor to choose between alternatives by mind-set segment to build trust and promote patients’ self-management of illness [60]. Focusing on communication skills which enhance patient’s internal locus of control greatly increases patients’ readiness to adopt behavioral changes [61]. These skills focus on process communication which deals with what patients believe will help them to take responsibility for their health rather than focus on the disease and explanations on what it is and ways of treating it.

Acknowledgement

Attila Gere thanks the support of Premium Postdoctoral Research Program of the Hungarian Academy of Sciences.

References

  1. Coulter A and Ellins J (2007) Effectiveness of strategies for informing, educating, and involving patients. Bmj 7609, Pg No. 24–27.
  2. Jenkinson C, Coulter A and Bruster S (2002) The Picker Patient Experience Questionnaire: development and validation using data from in-patient surveys in five countries. International Journal for Quality in Health Care 5: 353–358.
  3. Stacey D, Bennett CL and Barry MJ (2011) Decision aids for people facing health treatment or screening decisions. Cochrane Database Syst Rev 10, CD001431.
  4. Hupcey JE, Penrod J, Morse JM and Mitcham C (2001) An exploration and advancement of the concept of trust. Journal of advanced nursing 2: 282–293.
  5. Barry MJ and Edgman-Levitan S (2012) Shared decision making—the pinnacle of patient-centered care. New England Journal of Medicine 366: 780–781.
  6. Goudge J and Gilson L (2005) How can trust be investigated? Drawing lessons from past experience. Social Science and Medicine 61: 1439–1451.
  7. Hupcey JE, Penrod J and Morse JM (2000) Establishing and maintaining trust during acute care hospitalizations. Scholarly Inquiry for Nursing Practice, 14(3), pp.227–242.
  8. Gabay G, Gere A, Stanley J, Habsburg-Lothringen C, Moskowitz HR (2019) (a). Health threats awareness- Responses to warning messages about cancer and smartphone Usage. Cancer Studies Therapy Journal 1: 1–10.
  9. Gabay G (2016) Exploring perceived control and self-rated health in re-admissions among younger adults: A retrospective Study. Patient Education and Counseling 99: 800–806.
  10. Gabay G (2019) a. Patient Self-worth and Communication Barriers to Trust of Israeli Patients in Acute-Care Physicians at Public General Hospitals. Qualitative health research Pg No. 1049732319844999.
  11. Gabay G (2019) b. A Nonheroic Cancer Narrative: Body Deterioration, Grief, Disenfranchised Grief, and Growth. OMEGA-Journal of Death and Dying Pg No. 0030222819852836
  12. Haskard KB, DiMatteo M R, Heritage J (2009) Affective and instrumental communication in primary care interactions: Predicting the satisfaction of nursing staff and patients. Health Communication 24: 21–32.
  13. Lee Y and Lin JL (2012) The effects of trust in physician on self-efficacy, adherence and diabetes. Outcomes, Social Science and Medicine 68: 1060–1068.
  14. Sharf J, Primavera LH, Diener MJ (2010) Dropout and therapeutic alliance: A meta-analysis of adult individual psychotherapy. Psychotherapy: Theory, Research, Practice, Training 4: 637.
  15. Ackerman SJ and Hilsenroth MJ (2003) A review of therapist characteristics and techniques positively impacting the therapeutic alliance. Clinical Psychology Review 23: 1–33.
  16. Flückiger C, Del Re AC, Wampold BE, Symonds D, Horvath AO (2012). How central is the alliance in psychotherapy? A multilevel longitudinal meta-analysis. Journal of Counseling Psychology 59: 1–10.
  17. Fife ST, Whiting JB, Bradford K, Davis S (2014). The therapeutic pyramid: A common factors synthesis of techniques, alliance, and way of being. Journal of Marital and Family Therapy 1: 20–33.
  18. Gabay G (2015) Perceived control over health, communication and patient–physician trust. Patient Education and Counseling 98: 1550–1557.
  19. Thompson L, McCabe R (2012). The effect of clinician-patient alliance and communication on treatment adherence in mental health care: a systematic review. BMC Psychiatry 1: 1.
  20. Miller W R and Rollnick S (2012) Motivational interviewing: Helping people change. Guilford press.
  21. Hawkins P, Shohet R, Ryde J Wilmot J (2012) Supervision in the Helping Professions. McGraw-Hill Education (UK).
  22. De Haan E, Duckworth A Birch D, Jones C (2013) Executive coaching outcome research: The contribution of common factors such as relationship, personality match, and self-efficacy. Consulting Psychology Journal: Practice and Research, 65, 40–46.
  23. Theeboom T, Beersma B, van Vianen AE (2014) Does coaching work? A meta-analysis on the effects of coaching on individual level outcomes in an organizational context. The Journal of Positive Psychology 9: 1–18.
  24. Gilson L (2003) Trust and the development of health care as a social institution. Social science & Medicine 7: 1453–1468.
  25. Pearson SD and Raeke LH (2000) Patients’ trust in physicians: many theories, few measures, and little data. Journal of General Internal Medicine 15: 509–513.
  26. Sheppard VB, Zambrana RE, Malley AS (2004) Providing health care to low income women: A matter of trust. Family Practice 21: 484–491.
  27. Ganesan S, Brown SP, Mariadoss BJ, Ho H. (2010) Buffering and amplifying effects of relationship commitment in business-to-business relationships. Journal of Marketing Research 47: 361–373.
  28. Schneider J, Kaplan SH, Greenfield S, Wenjun L, Wilson I (2004) Better physician patient relationships are associated with higher reported adherence to antiretroviral therapy in patients with HIV infection, Journal of General Internal Medicine 19: 1096–1103.
  29. Brown, M T and Bussell J K (2011) Medication adherence: WHO cares? In Mayo Clinic Proceedings. Elsevier 86: 304–314.
  30. Phillips A L, Leventhal H, Leventhal E A (2013) Assessing theoretical predictors of long-term medication adherence: Patients’ treatment-related beliefs, experiential feedback and habit Development. Psychology & Health 28: 1135–1151.
  31. Rotter J B (1975) Some problems and misconceptions related to the construct of internal versus external control of reinforcement. Journal of Consulting & Clinical Psychology 43: 56–67.
  32. Liang CY, Wang KY, Hwang SJ, Lin KC, Pan HH (2013) Factors affecting the physician-patient relationship of older veterans with inadequate health literacy: an observational study. The British Journal of General Practice 63: 354–360.
  33. Mearns J (2009) Social learning theory. Encyclopedia of human relationships 3: 1537–1540.
  34. Del Re AC, Flückiger C, Horvath AO, Symonds D, Wampold BE (2012) Therapist effects in the therapeutic alliance–outcome relationship: A restricted-maximum likelihood meta-analysis. Clinical Psychology Review 7: 642–649.
  35. Bergvik S, Sørlie T, Wynn R (2012) Coronary patients who returned to work had stronger internal locus of control beliefs than those who did not return to work. British Journal of Health Psychology 17: 596–608.
  36. Cross MJ, March LM, Lapsley HM, Byrne E, Brooks PM (2006) Patient self-efficacy and health locus of control: relationships with health status and arthritis related expenditure. Rheumatology 45: 92–96.
  37. Lefcourt HM (2014) Locus of control: Current trends in theory & research, Psychology Press.
  38. Patterson RE, Neuhouser ML, Hedderson MM, Schwartz SM, Standish L (2003) Changes in diet, physical activity, and supplement use among adults diagnosed with cancer. Journal of the American Dietetic Association 103: 323–328.
  39. Thøgersen-Ntoumani C, Ntoumanis N (2006) The role of self-determined motivation in the understanding of exercise-related behaviors, cognitions and physical selfevaluations. Journal of Sports Sciences 24: 393–404.
  40. Rotter JB (1979) Individual differences and perceived control, Choice and Perceived Control, Hillsdale, NJ, Lawrence Erlbaum Associates.
  41. Gabay G, Moskowitz RH (2015) Mind Genomics: What professional conduct enhances the emotional wellbeing of teens at the hospital. Journal of Psychological Abnormalities In Children 3: 147–162.
  42. Ariely D and Lanier WL (2015) Disturbing trends in physician burnout and satisfaction with work-life balance: dealing with malady among the nation’s healers. In Mayo Clinic Proceedings 90: 1593–1596.
  43. Moskowitz HR, Gofman A, Beckley J and Ashman H (2006) Founding a new science: Mind genomics. Journal of sensory studies 21: 266–307.
  44. Moskowitz HR and Gofman A (2007) Selling blue elephants: How to make great products that people want before they even know they want them. Pearson Education.
  45. Moskowitz HR (2012) ‘Mind genomics’: The experimental, inductive science of the ordinary, and its application to aspects of food and feeding. Physiology & behavior 4: 606–613.
  46. Gabay G, Kochman M, Moskowitz HR (2015) Market sensing Mind-Genomics and Health Promotion in Prince, M. and Priporas, C. V. (Eds) Market Sensing Today. Business Expert, Academic Publisher. Ch. 7 Pg No. 124–141. Boston.
  47. Gabay G, Moskowitz HR, Silcher M, Galanter E (2017) Mind Genomics: The New Novum Organum: Policy, Perceptions and Emotions in Health. Pardes Academic Publishing.
  48. Gabay G, Zemel G, Gere A, Zemel R, Papajorgji P, Moskowitz HR (2018) On the threshold: What concerns healthy people about the prospect of cancer? Cancer Studies and Therapeutics Journal 3: 1–10.
  49. Gabay G, Gere A, Zemel G, Moskowitz D, Shifron R, Moskowitz HR (2019) (b). Expectations and attitudes regarding chronic pain control: An exploration using Mind Genomics. Internal Medicine Research Open Journal 4: 1–10.
  50. Gabay G, Gere A, Moskowitz HR (2019) (c). Uncovering communication messages for health promotion: The case of arthritis. Integrated Journal of Orthopedic Traumatology 2: 1–13.
  51. Gabay G, Gere A, Moskowitz HR (2019) (d). Understanding effective web messaging-The Case of Menopause. Integrated Gynecology & Obstetrics Journal 2:1–16.
  52. Gabay G, Gere A, Stanley J, Habsburg-Lothringen C, Moskowitz HR (2019) (e). Health threats awareness – Responses to warning messages about Cancer and smartphone usage. Cancer Studies Therapeutics Journal 4: 1–10.
  53. Gofman A, Moskowitz H (2010) Isomorphic permuted experimental designs and their application in conjoint analysis. Journal of Sensory Studies 25: 127–145.
  54. Dubes RC and Jain AK (1988) Algorithms for clustering data. Prentice Hall.
  55. Sun N and Rau PLP (2017) Barriers to improve physician–patient communication in a primary care setting: Perspectives of Chinese physicians. Health Psychology and Behavioral Medicine 1: 166–176.
  56. Street Jr RL and Mazor KM (2017) Clinician–patient communication measures: Drilling down into assumptions, approaches, and analyses. Patient education and counseling 8: 1612–1618.
  57. Gabay G and Moskowitz HR (2012) The algebra of health concerns: implications of consumer perception of health loss, illness and the breakdown of the health system on anxiety. International Journal of Consumer Studies 36: 635–646.
  58. Helmes AW, Bowen DJ, Bengel J (2012) Patient preferences of decision-making in the context of genetic testing for breast cancer risk Genetics in Medicine 4: 150–157.
  59. Gabay G and Moskowitz HR (2012) The algebra of health concerns: implications of consumer perception of health loss, illness and the breakdown of the health system on anxiety. International Journal of Consumer Studies 6: 635–646.
  60. Hawley K (2015) Trust and distrust between patient and doctor. Journal of evaluation in clinical practice 5: 798–801.
  61. Roseman D, Osborn-Stafsnes J, Helwig A, Boslaugh S, Slate-Miller K (2013) lessons from four ‘aligning forces for quality communities bolster the case for patient-centered care. Health Affairs 32: 232–241.