Abstract
Objectives: A decades-old misconception about the oximetric diagnosis of shunts is that “the same shunt giving the same blood O2 saturation step-up would give markedly different blood O2 content step-ups if the blood hemoglobin concentration varied significantly.” One goal of this study was to disprove that misconception.
Background Although that misconception was disproven in 1996 and 1997, it still being published in a major cardiac catheterization textbook.
Methods: One purpose of this project was to reprogram and retest a mathematical model that disproved that misconception. The second purpose of this project has been to apply statistical principles and determine the accuracy of the oxygen content that the AVOXimeter®1000E calculates from measurements of hemoglobin concentration and %HbO2. The third purpose of this project has been to develop a statistically sound protocol for using the AVOXimeter®1000E to make the correct diagnosis from step-ups in oxygen content.
Results: The mathematical model showed conclusively that O2 saturation step-ups vary with hemoglobin concentration and that O2 content step-ups do not. However, the oxygen content that the AVOXimeter calculates for one particular blood sample is too inaccurate, but using the average of the hemoglobin concentration measurements from a shunt run will enable you to use O2 content step-ups to diagnose shunts.
Conclusions: If the protocol we recommend for a shunt run is used, the result should be a better probability for a correct diagnosis regardless of what the patient’s hemoglobin concentration is.
Keywords
Abnormalities, Cardiovascular Congenital, Diagnostic Techniques
Introduction
Early in the history of oximetric instruments to diagnose intracardiac and great-vessel shunts, two devices were used that physically or chemically extracted oxygen from blood samples: the Lex-02-Con [1] and the Van Slyke and Neill technique [2]. Both measured the total of dissolved and hemoglobin-bound oxygen. Those methods were later abandoned simply because they were too slow and laborious by today’s standards. For example, it took the Lex-02-Con about 2 or 3 minutes to analyze one blood sample.
When those oxygen-extracting devices were used, the standard method for diagnosing left-to-right shunts was to look for “step-ups” in oxygen content [O2] between two cardiovascular locations being investigated. Step-ups in the percent oxyhemoglobin (%HbO2) began to be used simply because the spectrophotometric oximeters and co-oximeters were much faster and easier to use. For example, the AVOXimeter® 1000E (Instrumentation Laboratory, Bedford, MA) takes less than 10 seconds to analyze a blood sample [3, 4]. In 1980, Antman et al. [5] published an important article about diagnosing shunts, but it unfortunately contained a misconception that has lasted for decades. That misconception, as stated in Grossman’s textbook [6, 7] is this: “…the same shunt giving the same blood O2 saturation step-up would give markedly different blood O2 content step-ups if the blood hemoglobin concentration varied significantly.”
Table 1 illustrates that misconception. The values in our Table I are all exactly the same as the table in Grossman’s textbook [8]. We generated those O2 content values [O2] by using hemoglobin concentration [Hb] and oxyhemoglobin saturation (%HbO2) as independent variables in a familiar equation that does not include dissolved oxygen: [O2] = [Hb] × (%HbO2/100) × 1.36. There is no variable in that equation for the rate of blood flow through a shunt, nor is there a variable for the rate at which blood is transporting oxygen through a shunt. That equation has nothing to do with a cause-and-effect relationship regarding shunts and the step-ups they cause in either %HbO2 or [O2]. Even though Shepherd and McMahan in 1996 [10] disproved that assertion we just quoted, it has been in and continues to be in every edition of Grossman’s textbook [6, 7] and other publications. Therefore, one purpose of this project has been to reprogram and reevaluate Shepherd and McMahan’s mathematical model of shunts and the step-ups they cause. Shepherd and McMahan [10] concluded that “Step-ups in oxygen content are potentially preferable to step-ups in saturation because a content step-up of a given amount is an unambiguous measure of a particular magnitude of shunting, whereas step-ups in saturation vary not only with shunting but also with the total hemoglobin concentration”. However, they also concluded that the detection of shunts should continue to be made on the basis of step-ups in saturation rather than oxygen content because the accuracy of oxygen content calculated by the multiwavelength, spectrophotometric AVOXimeter® 1000E is unknown, as Table 2 shows [3, 4].
Table 1. A classic misconception about shunts and the “step ups” they cause, i.e. step ups in O2 content supposedly vary with total Hb, but step ups in %HbO2 supposedly do not.
|
%HbO2 |
[O2] Content in mL O2/dL |
|
5 |
0.68 0.82 1.02 |
|
10 |
1.36 1.63 2.04 |
|
15 |
2.04 2.45 3.06 |
|
20 |
2.72 3.26 4.08 |
|
Total Hb (g/dL) |
10 12 15 |
Table 2. Specifications for the AVOXimeter 1000E
|
Measurement |
Operating Range |
Accuracy |
Precision |
|
Fractional O2 Saturation |
0–100% |
1% |
0.5% |
|
Total Hemoglobin (tHb, g/dL) |
4–25 |
tHb <10: 0.35 |
|
|
tHb >10: 0.45 |
0.3 |
||
|
Oxygen Content (O2 mL/dL) |
0–35 |
N/A |
N/A |
N/A = not available
In this publication the name AVOXimeter, refers to the AVOXimeter 1000E not the AVOXimeter 4000. The AVOXimeter 1000E is used in cardiac catheterization labs all over the world because it was designed specifically for that purpose. Its spectrophotometric measurements do not include the normally small amount of dissolved O2 in the blood of a patient breathing room air, e.g. 0.3 ml O2 /dL in arterial blood. Unlike simple two-wavelength spectrophotometric oximeters, the AVOXimeter 1000E makes accurate measurements of %HbO2, even if significant concentrations of carboxyhemoglobin, methemoglobin, and bilirubin are present [4]. The total hemoglobin concentration that the AVOXimeter reports is the sum of the concentrations of oxy-, deoxy-, carboxy-, and methemoglobin: [THb] = [HbO2] + [Hb]+ [HbCO] + [MetHb]. Even though the AVOXimeter does not report the concentrations of carboxy-, and methemoglobin, the displayed value for %HbO2 is this: %HbO2 = 100 * [HbO2] / ([Hb] + [HbO2] + [HbCO] + [HbMet]). The AVOXimeter 1000E uses Hüfner’s number (Hn), the volume of oxygen that can be carried by one gram of hemoglobin, to calculate the oxygen content of a blood sample: [O2] = [Hb] × (%HbO2/100) × Hn.
The AVOXimeter’s default value of Hn is 1.39 mL O2/g of Hb, and it does not need to be adjusted because of the levels of carboxy-, and methemoglobin, but the person operating the AVOXimeter can choose any value for Hn from 1.30 to 1.39 and let the AVOXimeter calculate the oxygen content of each sample [3, 4]. Various publications have evaluated the AVOXimeter [8–9], but none have reported its [O2] accuracy. Therefore, the second purpose of this project has been to apply statistical principles and determine the accuracy of the oxygen content that the AVOXimeter® 1000E calculates from measurements of [Hb] and %HbO2.
Because the AVOXimeter® 1000E was designed specifically for use in cardiac catheterization labs and because we understand how it works (see Conflict of Interest), the third purpose of this project has been to develop a statistically sound protocol for using the AVOXimeter® 1000E to make the correct diagnosis from step-ups in oxygen content.
Materials and Methods
Shunt Simulation Model
In 1996 and 1997, Shepherd et al. [10, 11] published two mathematical models of shunts and the shifts they cause in the percent oxyhemoglobin and oxygen content. The 1996 model was used to simulate left-to-right shunts. The 1997 model could simulate left-to-right shunts and right-to-left shunts flowing simultaneously. A video of that simulation of bi-directional shunting can be seen on YouTube:
https://www.youtube.com/watch?v=ac283O1IEws&t=1s
For this project, we studied the 1996 model and tested it by reprogramming it with an up-to-date version of the graphic, data-flow programming language called LabVIEW® (National Instruments, Austin, TX).
To create this shunt simulation model, we begin by letting the patient’s oxygen consumption rate (VO2) be an independent variable. In this model, VO2 can be set equal to any desired value. For example, the normal resting value in the textbook man is this:
VO2 = 250 ml O2 per minute. Eq. 1
Treating VO2 as an independent variable is supported by studies showing that the rate of oxygen consumption becomes dependent on blood flow only when blood flow falls to critically low levels [12–13].
In the model, we also let shunt flow (Qshunt) and systemic blood flow (Qs) be independent variables:
Qshunt = 0 ml per minute or any desired value. Eq. 2
Qs = 5,000 ml per minute or any desired value. Eq. 3
To simulate a left-to-right shunt, we let pulmonary blood flow (Qp) be the sum of systemic blood flow and shunt flow.
Qp = Qshunt. + Qs Eq. 4
Assuming lung function is adequate, we can use a normal pulmonary venous oxyhemoglobin saturation (%HbO2pv) and use the total hemoglobin concentration [Hb] to calculate the oxygen contents of pulmonary venous blood ([O2]pv). Thus,
[O2]pv = %HbO2pv × [Hb] × Hn/100. Eq. 5
The convective flux of oxygen in the pulmonary vein is simply the product of blood flow and oxygen content:
JO2pv = Qp × [O2]pv Eq. 6
In the absence of any right-to-left shunting, we simply let the systemic arterial oxygen content equal the oxygen concentration in pulmonary venous blood. Thus,
[O2]a = [O2]pv Eq. 7
The percent saturation in systemic arterial blood (%HbO2a) is given by
%HbO2a = (100 × [O2]a) / ([Hb] × Hn) Eq. 8
With values for the oxygen consumption rate, the arterial oxygen concentration, and systemic blood flow, we can solve the Fick Equation to obtain the oxygen concentration in mixed venous blood:
[O2]v = [O2]a – (VO2 / Qs ) Eq. 9
The rate of oxygen transport in mixed, systemic venous blood, i.e. the O2 flux (JO2v), is
JO2v = [O2]v × Qs Eq. 10
and the percent saturation in mixed venous blood is
%HbO2v = (100 × [O2]v) / ([Hb] × Hn). Eq. 11
The flux of oxygen through the shunt is
J02shunt = [O2]pv × Qshunt. Eq. 12
Adding the flux of oxygen through the shunt to the oxygen carried in mixed systemic venous blood gives the oxygen flux in the pulmonary artery:
JO2pa = JO2v + J02shunt Eq. 13
Dividing the oxygen flux in the pulmonary artery by pulmonary blood flow yields the concentration of oxygen in the pulmonary artery:
[O2]pa = JO2pa / Qp.Eq. 14
The percent saturation in pulmonary arterial blood is given by
%HbO2pa = (100 * [O2]pa) / ([Hb] * Hn). Eq. 15
We now have percent saturation at each of the four sites necessary to calculate the ratio of pulmonary to systemic blood flow. Because both Qp and Qs are already known, computing their ratio from the familiar shunt equation confirms the internal consistency of the model:
Qp / Qs = (%HbO2a – %HbO2v) / (%HbO2pv – %HbO2pa) Eq. 16
The “step-up” that would occur with a given magnitude of shunting can be computed both for oxyhemoglobin saturation and for oxygen content:
%HbO2 Step-up = (%HbO2pa – %HbO2v) Eq. 17
[O2] Step-up = 100 X ([O2]pa – [O2]v ).Eq. 18
Using the equations presented thus far, we can simulate shunting by specifying desired values for systemic blood flow, shunt flow, oxygen consumption rate, and total hemoglobin concentration. The model will then generate the oxygen saturations at the sites of interest and the step-ups that would occur with various initial conditions and magnitudes of shunting. In addition, because LabVIEW has built-in statistical calculators such as a cumulative distribution function, we can use various values for the inaccuracy of the AVOXimeter’s measurements of %HbO2, [Hb], and [O2] and calculate the probabilities of false-positive or false-negative diagnoses. Appendix I is an example.
Results
The first assessment of this shunt simulation model is shown in Figure 1. In this simulation of a shunt, the rate of systemic blood flow was left at 5,000 mL/min, the shunt flow was set at 2,000 mL/min, and hemoglobin concentration was treated as an independent variable. As the lower graph shows, this simulated left-to-right shunt flow caused an oxygen content step-up of 1.42 mL O2/dL. As the hemoglobin concentration was set at 5, 10, 15, and 20 g Hb/dL, the oxygen content step-up did not change. By contrast, as the upper graph shows, the same shunt flow caused step-ups in %HbO2 that declined in a nonlinear manner as the hemoglobin concentration took the same steps from 5 up to 20 g Hb/dL. These results are literally the opposite of what that longstanding misconception contends [5, 7].
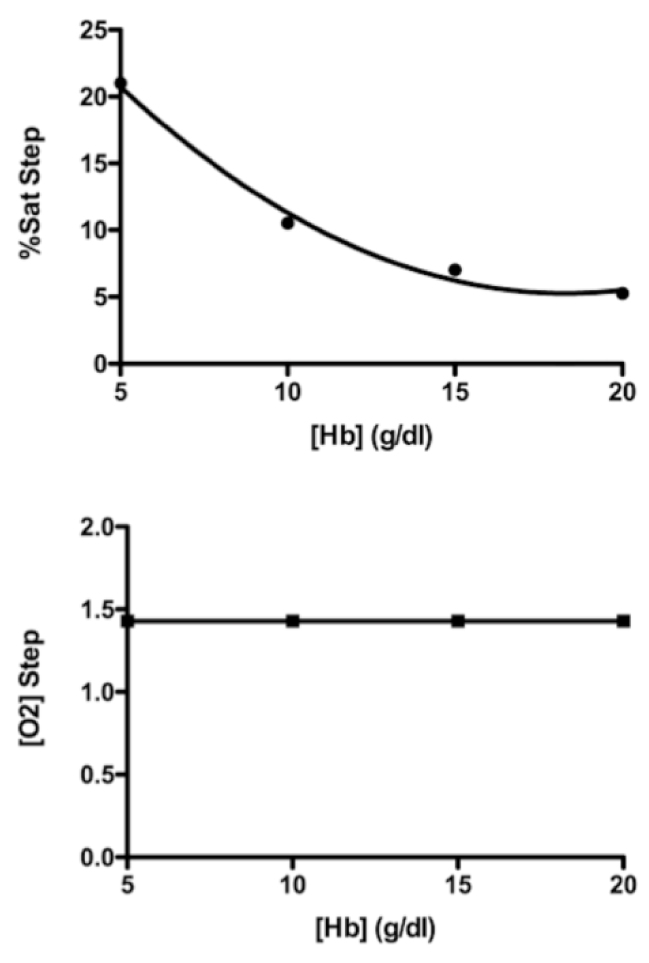
Figure 1. Simulation of a left-to-right shunt with a systemic blood flow of 5,000 mL/min and a shunt flow of 2,000 mL/min. Lower graph shows that a shunt flow of that magnitude caused an oxygen content step-up of 1.42 mL O2 /dL, and that [O2] step-up was not changed by hemoglobin concentrations of 5, 10, 15, and 20 g/dL. The upper graph shows the step-ups in %HbO2 were inversely related to the same hemoglobin concentrations.
Figures 2 and 3 show another way to illustrate the mathematical relationships in this shunt simulation model. In Figure 2, to the right of the zero flow line, simulated left-to-right shunts are causing step-ups in %HbO2, and to the left of the zero flow line, simulated right-to-left shunts are causing the %HbO2 to step down. And as shown previously in Figure 1, these shifts in %HbO2 depend on the oxygen-carrying capacity of blood, i.e. hemoglobin concentration. Furthermore, regardless of the direction in which blood is flowing, the magnitude of the %HbO2 shift is inversely related to the hemoglobin concentration.
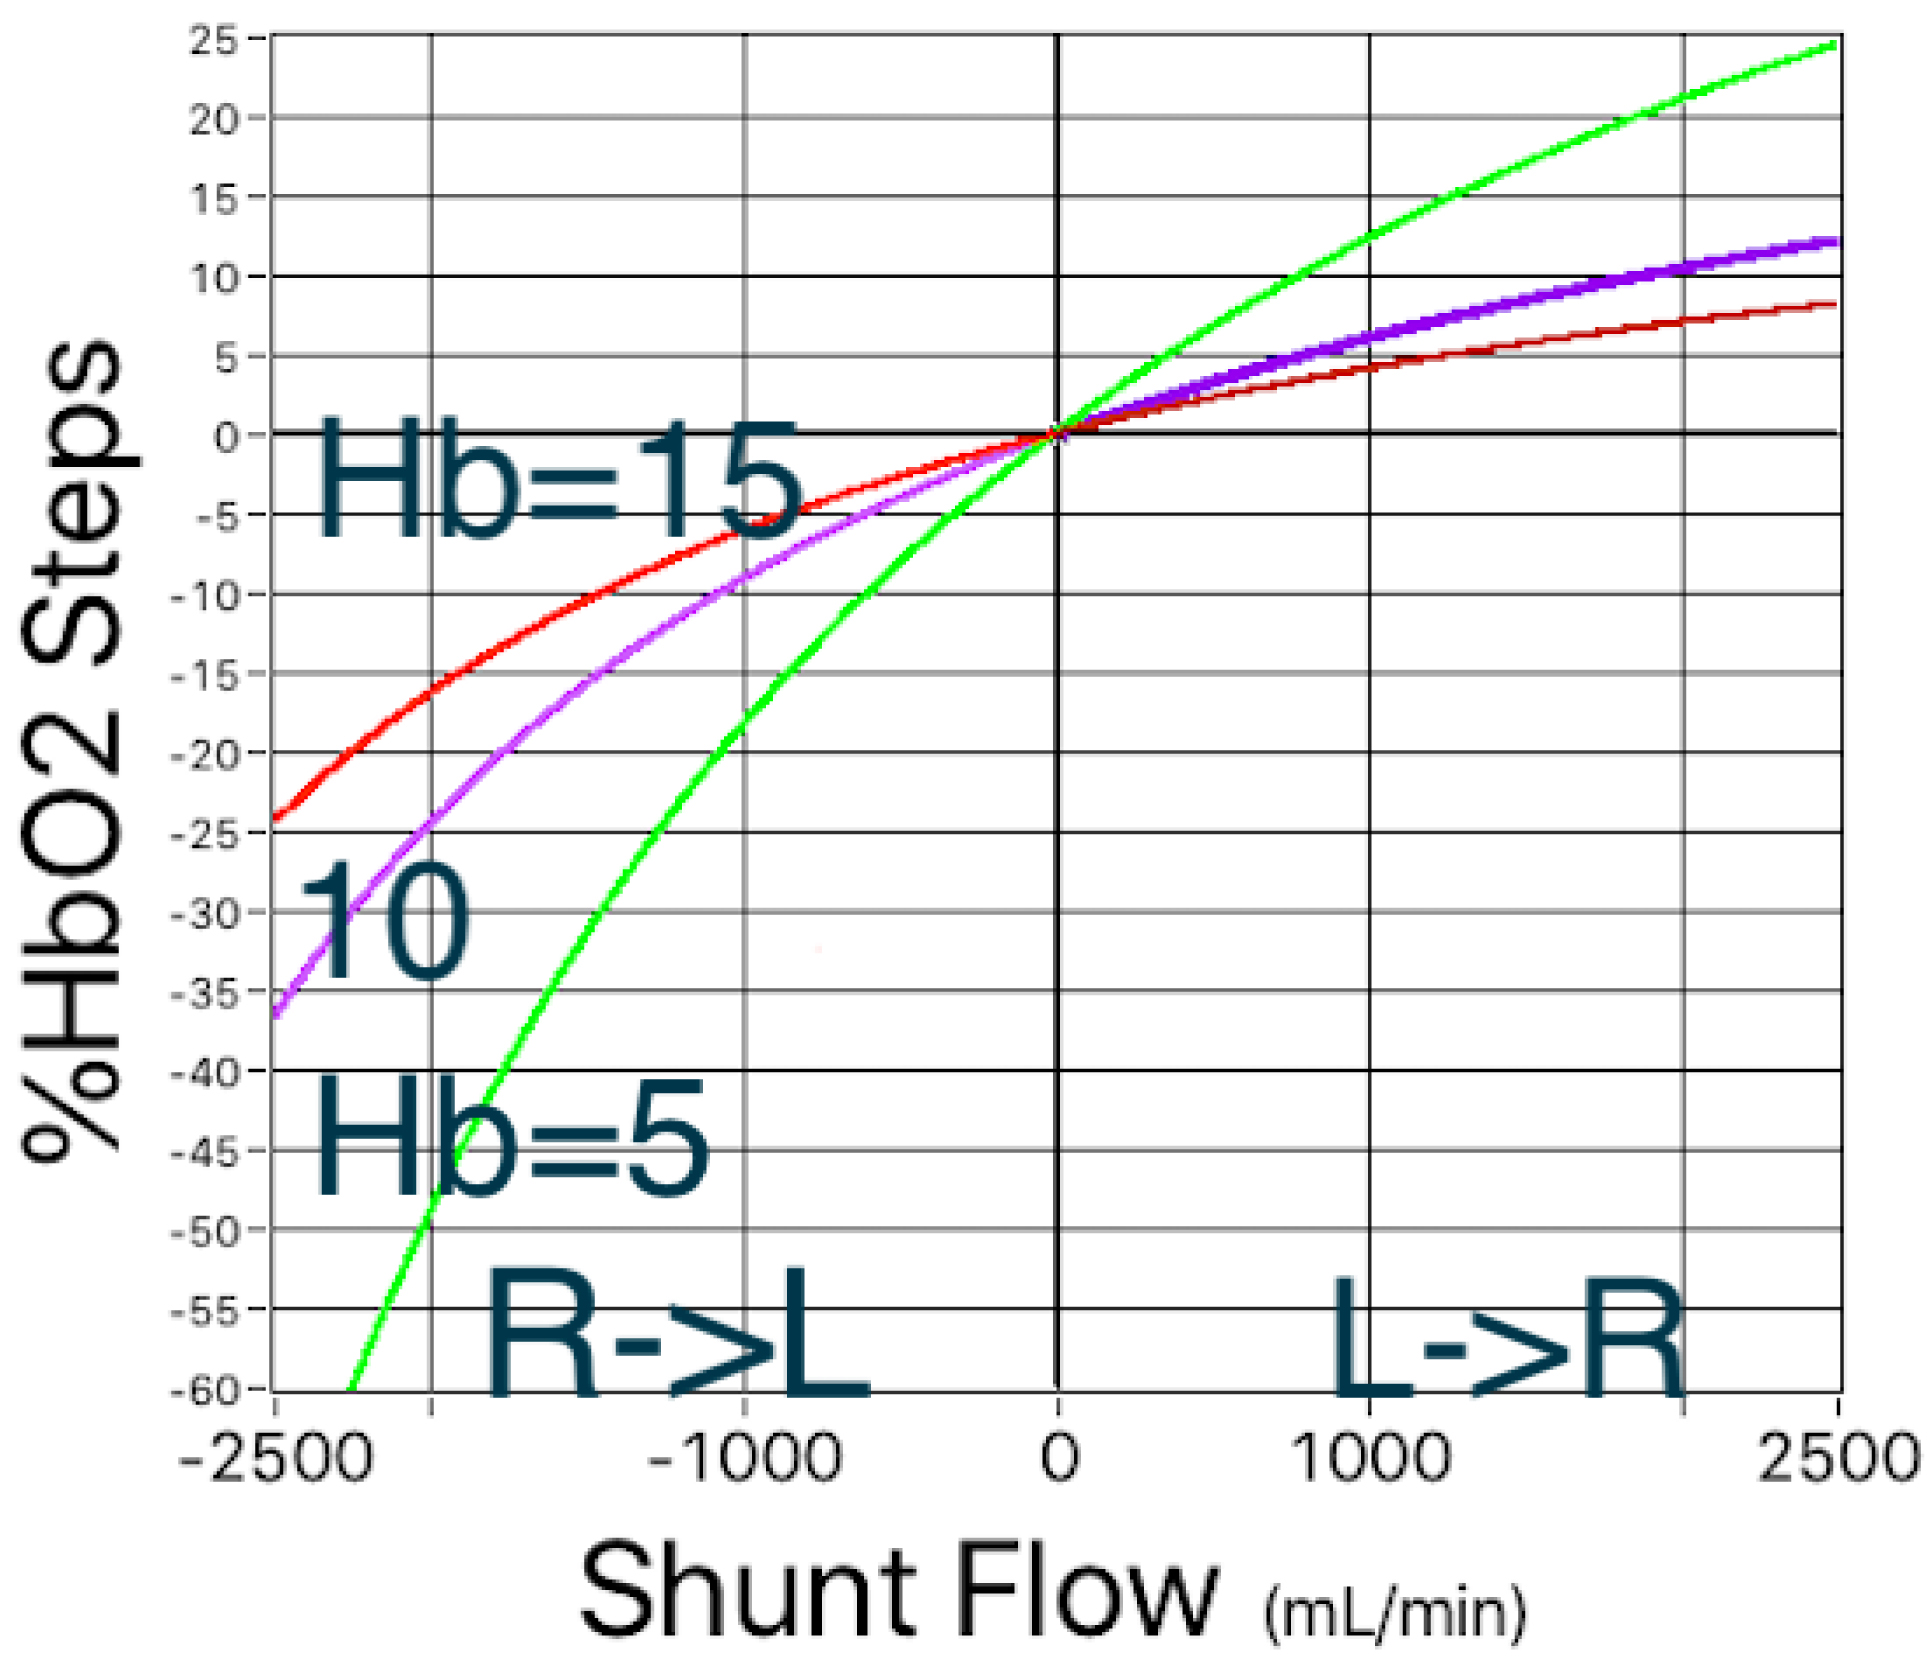
Figure 2. Simulated left-to-right and right-to-left shunts. In both directions, the magnitude of shifts in %HbO2 depend on the hemoglobin concentration.
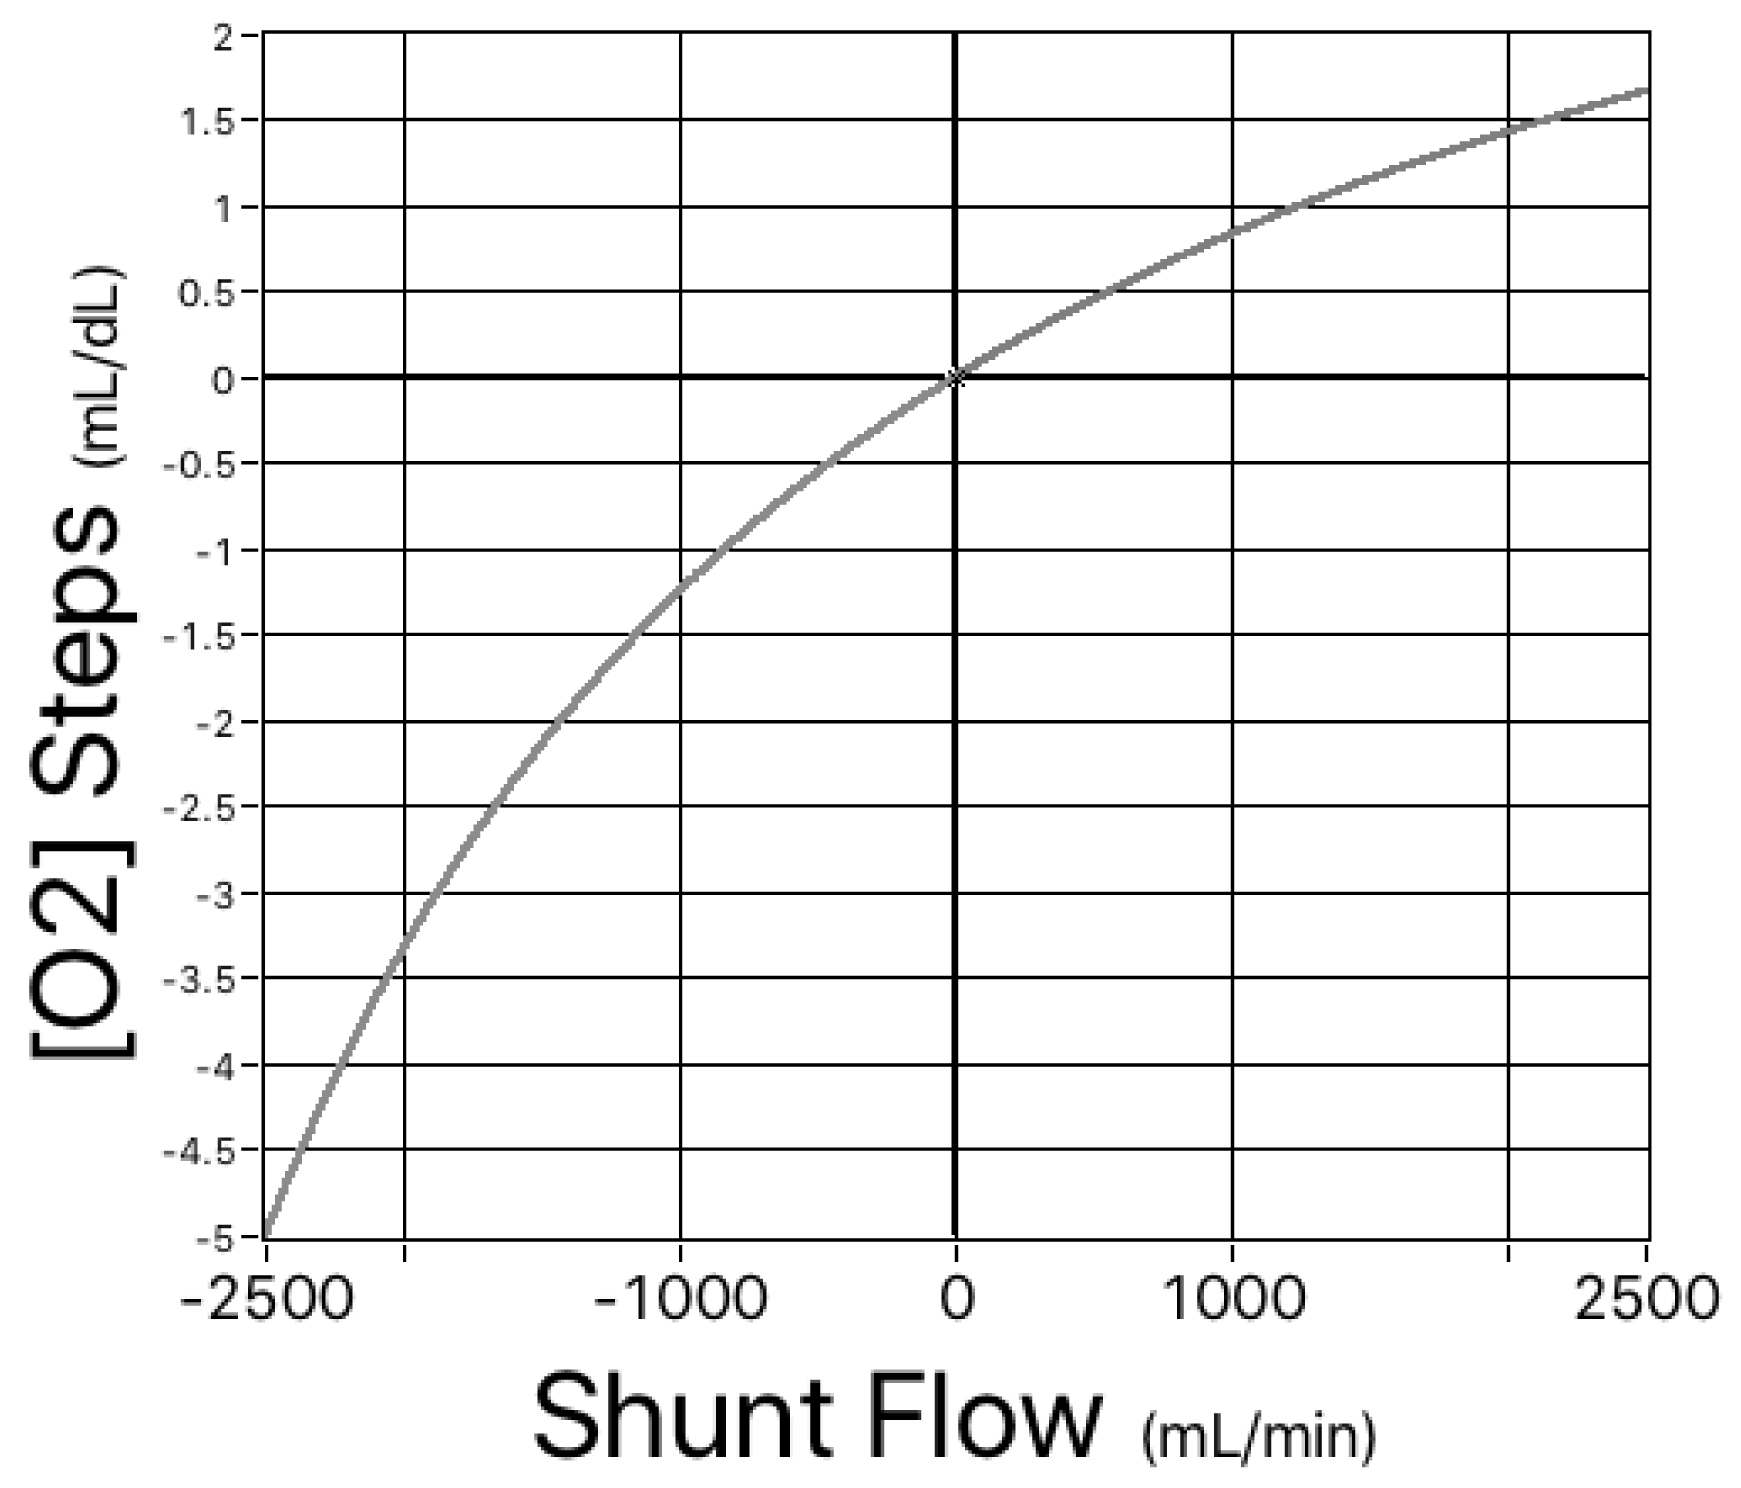
Figure 3. Simulated left-to-right and right-to-left shunts. For the same range of hemoglobin concentrations as shown in Figure 1, there is a single, nonlinear relationship between shunt flow and the magnitude of the shifts in oxygen content.
Having proven again [10] that shifts in oxygen content could potentially be a better diagnostic tool than steps in %HbO2, we now need to apply statistical principles and determine the accuracy of the oxygen content that the AVOXimeter 1000E calculates from measurements of [Hb] and %HbO2.
Accuracy of the AVOXimeter’s Calculated Oxygen Content [O2]
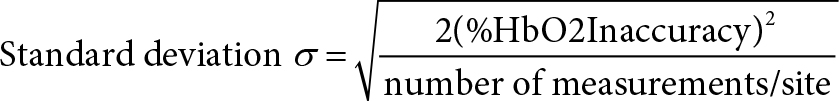
As mentioned earlier, the AVOXimeter 1000E calculates, for each blood sample, the oxygen content as the product of three variables: %HbO2, TotalHb, and a value for Hüfner’s number (3, 4). Shown below is the equation for the inaccuracy of the calculated oxygen content. Its derivation (Appendix II) requires assuming that the measurements of %HbO2 and TotalHb are statistically independent.

For one particular blood sample measured one time that assumption may not be valid. When the AVOXimeter 1000E is operating, it is turning on and off five different LEDs and recording the incident intensities of those five different wavelengths passing through five different monochromatic optical filters before reaching the light detector. Then when a blood-filled cuvette is inserted into the instrument, the intensities of those five wavelengths passing through the blood and those five stored incident intensities are used to calculate the %HbO2 and hemoglobin concentration and to make corrections for the light scattering caused by red blood cells. Therefore, the %HbO2 and the total hemoglobin concentration reported for one blood sample measured one time are probably not statistically independent. However, for two different blood samples or even for one blood sample measured twice, two different sets of incident intensities are recorded. The light reaching the detector will not be passing through the very same erythrocytes, there may be two possibly different assessments of the light scattered by red blood cells, and there could be a “drift in the wavelengths of the emitted light” [15]. Thus, the repeated measurements of %HbO2 and hemoglobin concentration are statistically independent. If the person running the AVOXimeter uses the average values of %HbO2 and total Hb from two or more measurements, that equation should yield a valid estimate of the [O2] inaccuracy.
When %HbO2 is 97%, total Hb is 15 g/dL, the %HbO2 inaccuracy is 1%, the Hb inaccuracy is 0.45 g/dL, and Hn = 1.36, the [O2] inaccuracy would be 0.627 mL O2/dL. For an otherwise identical sample of venous blood in which %HbO2 is 70%, the [O2] inaccuracy would be 0.474 mL O2/dL. If you look at Table 3, you will see that Dexter’s maximum normal step-up in [O2] to diagnose a right-ventricle-to-pulmonary-artery stent is an [O2] step-up of 0.5 ml O2/dL [16–18]. If you compare that with those two examples of [O2] inaccuracy, the oxygen content that the AVOXimeter automatically calculates for each blood sample is probably too inaccurate to use with Dexter’s diagnostic criteria. For example, if we use an [O2] inaccuracy of 0.47 mL O2/dL and Dexter’s [O2] step-up of 0.5 ml O2/dL, our model calculates a 22.8% probability of a false-positive diagnosis, whereas if an [O2] step-up of 0.5 ml O2/dL at a total Hb of 15 g/dL happened to be equivalent to a diagnostic criterion of 2.46 %HbO2, the probability of a false-positive diagnosis would be only 4%.
Table 3. Dexter’s (16–18) maximum normal step-ups in oxygen content. If the differences exceed the values shown, they are diagnostic criteria for a left-to-right shunt., as explained by Boehrer et al. (19).
|
|right atrium – superior vena cava| |
> 1.9 ml O2/dL |
|
|right ventricle – right atrium| |
> 0.9 ml O2/dL |
|
|pulmonary artery – right ventricle| |
> 0.5 ml O2/dL |
Figure 4 compares the effects of the AVOXimeter’s multiple-sample [O2] inaccuracy and its %HbO2 inaccuracy. To calculate those probabilities of a false-positive diagnosis, LabVIEW’s cumulative distribution function treated Dexter’s diagnostic criterion (0.5 mL O2/dL) as the step-up at which the probability of a shunt would be 50%, used a %HbO2 inaccuracy of 1%, and a [Hb] inaccuracy of 0.45 g/dL, i.e. the values shown in Tables II and III. What Figure 4 shows is if the equation at the end of Appendix II can be applied to the AVOXimeter’s calculated [O2], it would probably be too inaccurate if the average of only a few hemoglobin measurements were used.
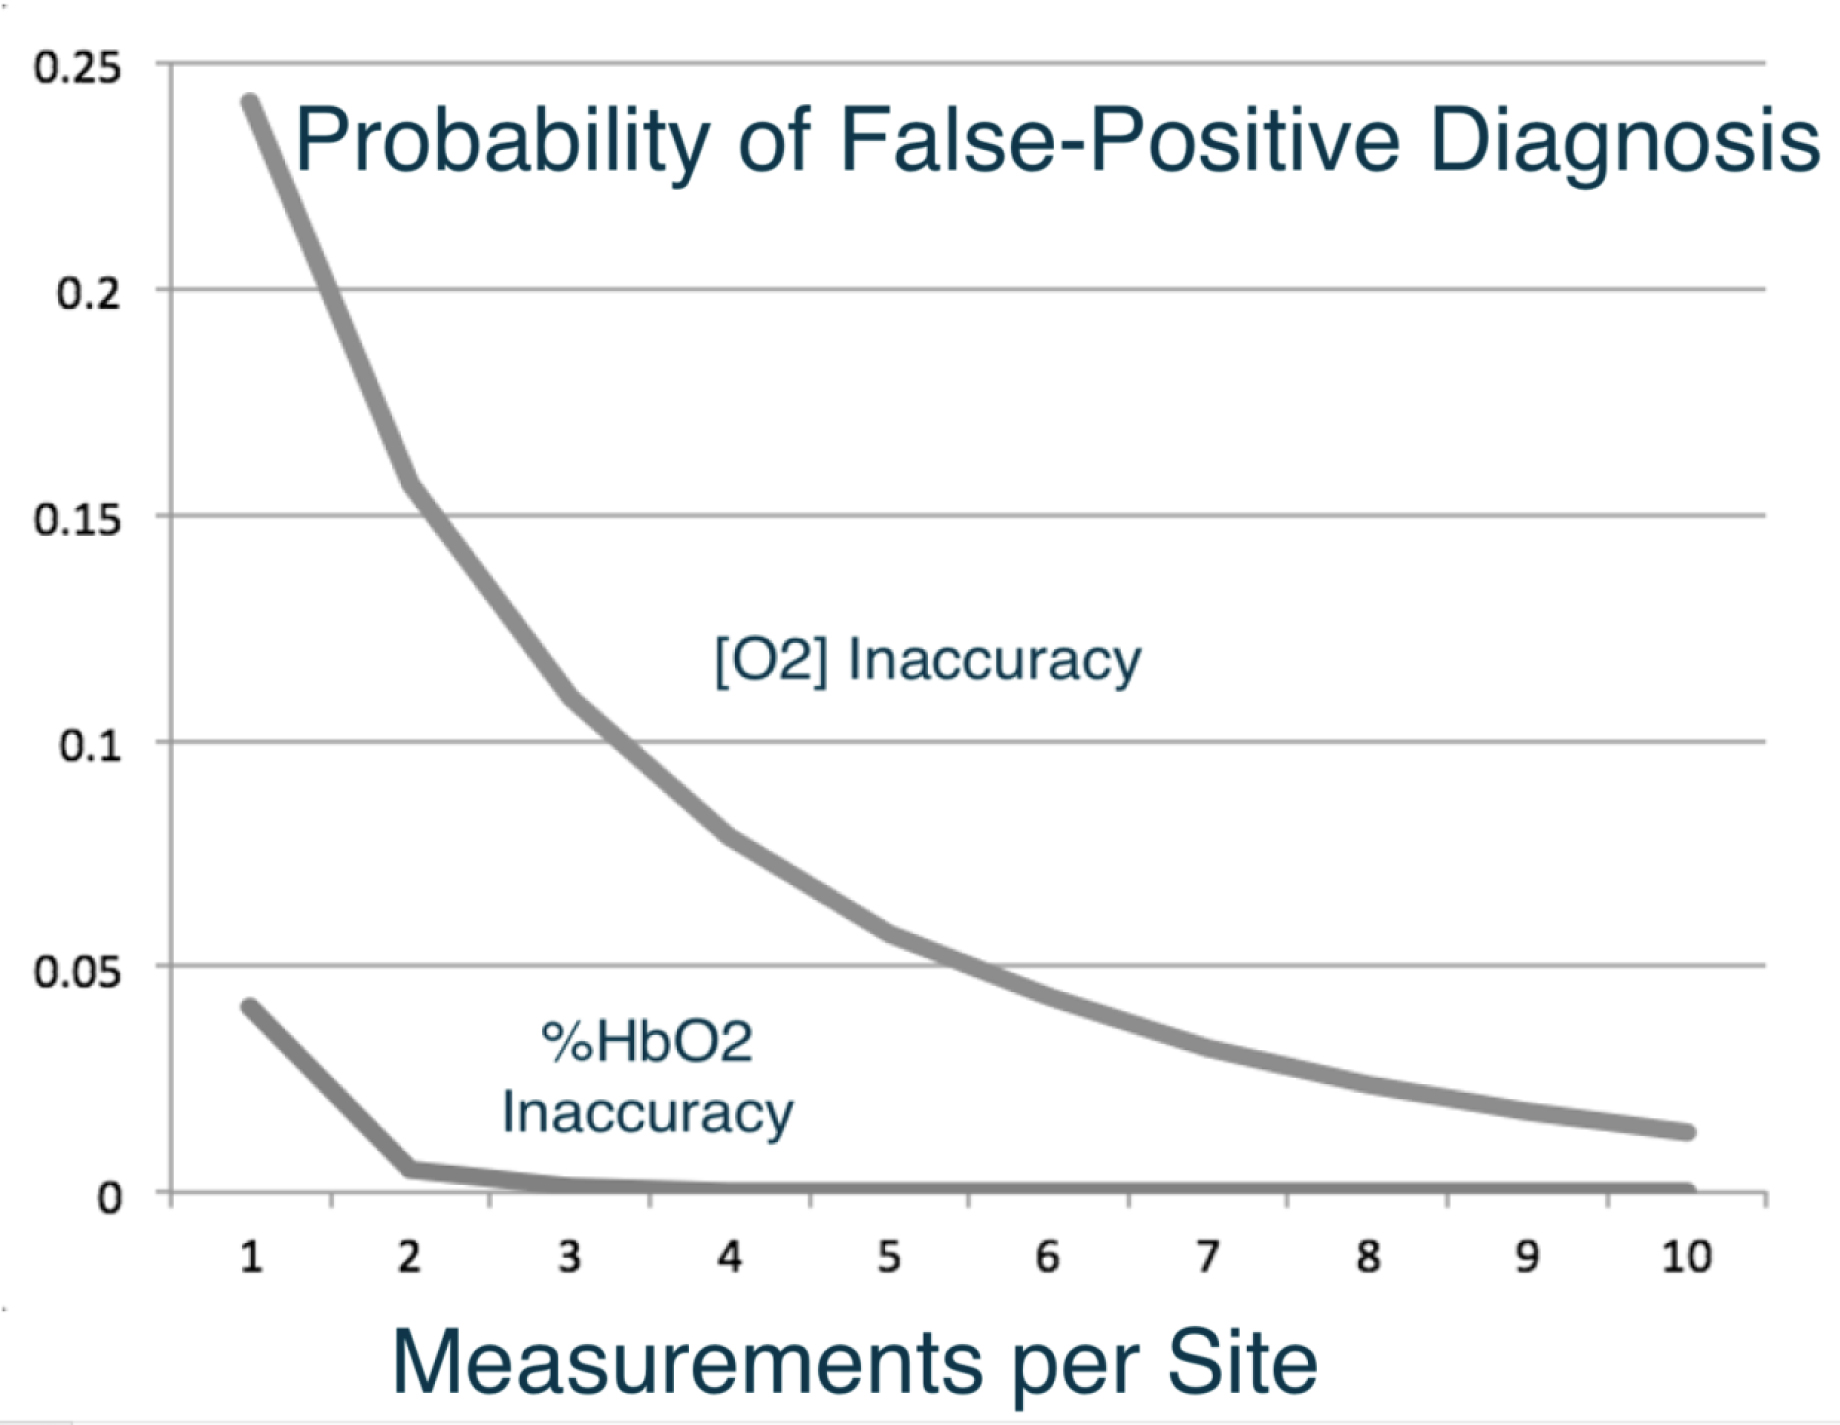
Figure 4 . Effects of the AVOXimeter’s [O2] inaccuracy and its %HbO2 inaccuracy on the probability of a false-positive diagnosis when either the step-up in [O2] or %HbO2 is used as the diagnostic criterion.
Figure 5 illustrates the effectiveness of calculating the mean value of multiple measurements of the hemoglobin concentration and using step-ups in [O2] to diagnose shunts. The diagnostic approach is the same as that described for Figure 4 and a systemic blood flow of 5,000 mL/min was also used, but shunt flow (Qshunt) was set to 1,000 mL/min. As Figure 5 shows, the probability of a false-negative diagnosis based on step-ups in [O2] goes down remarkably if the mean value of multiple measurements of the hemoglobin concentration is used. This is simply an application of the fundamental statistical principle called the law of large numbers.
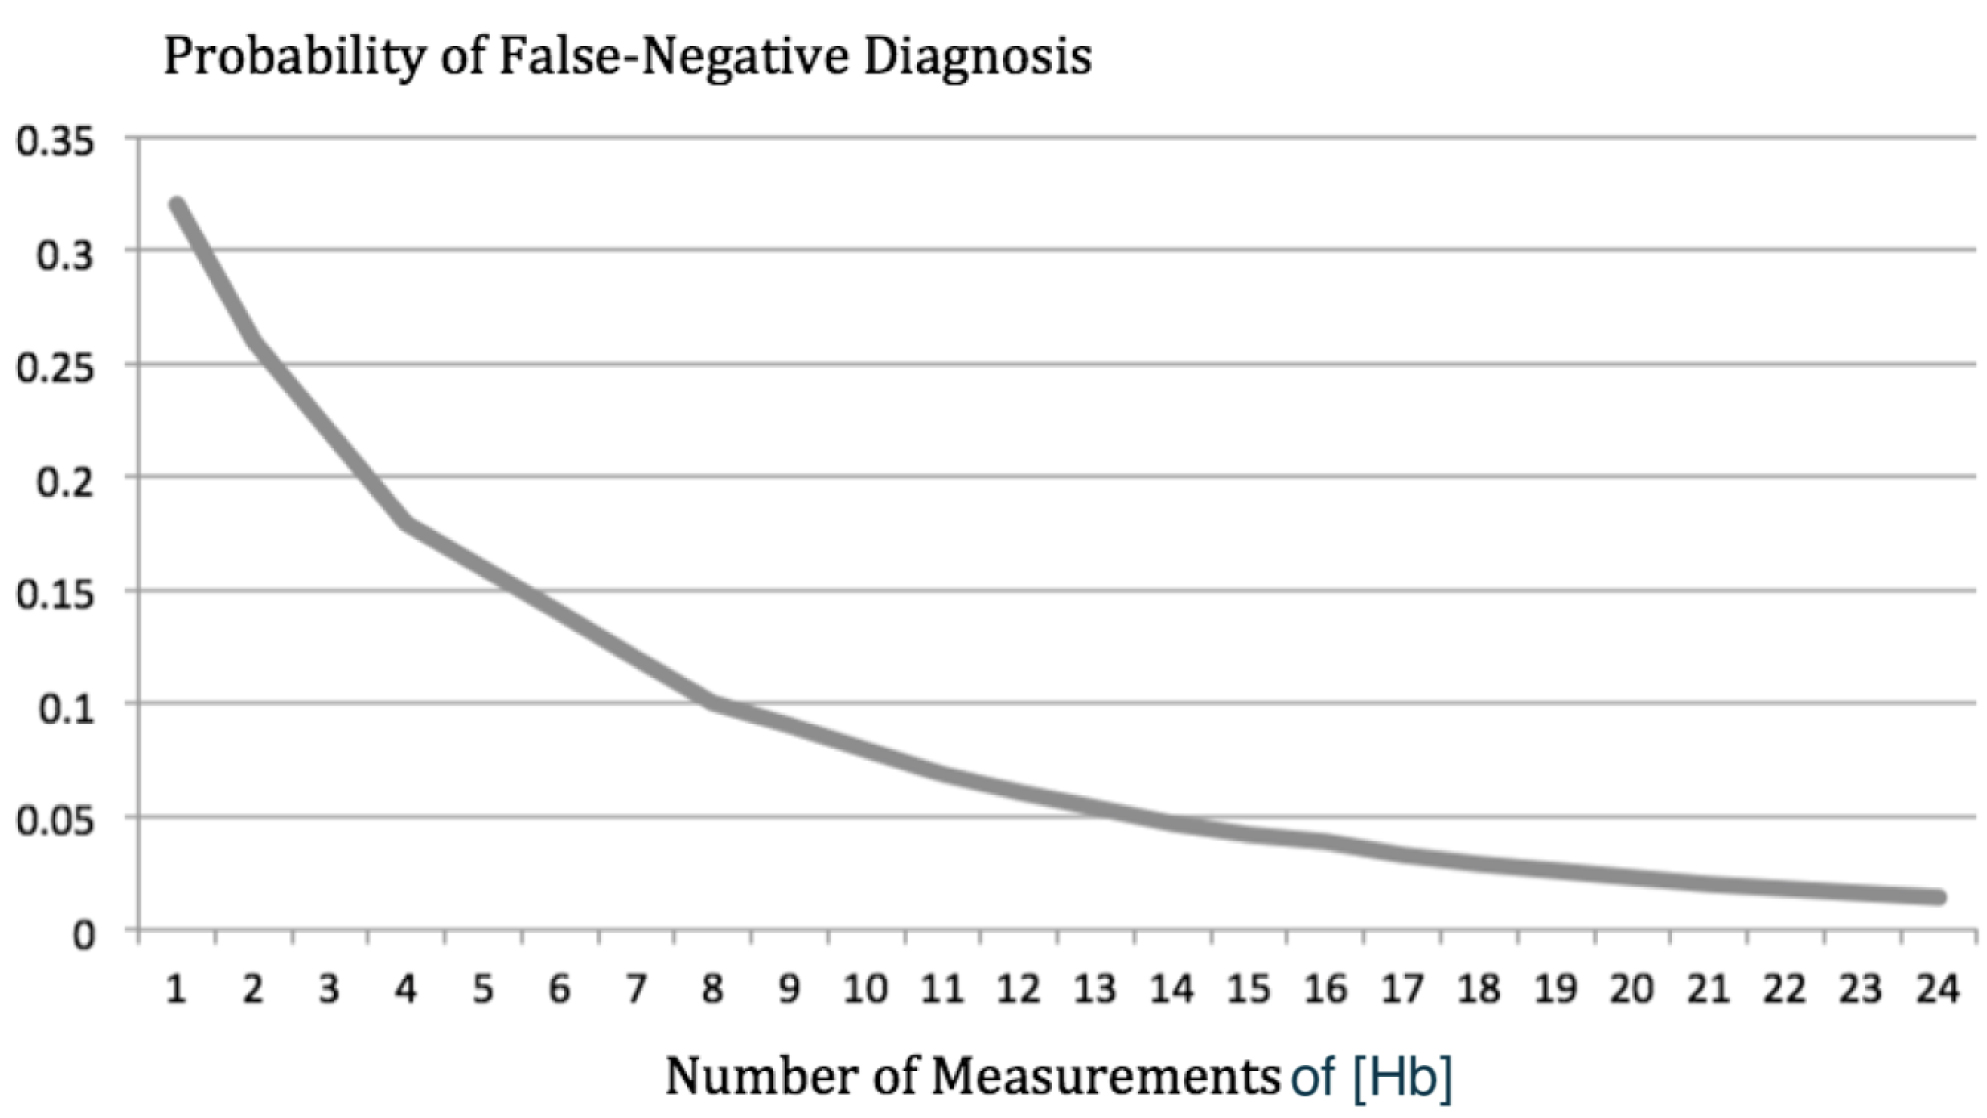
Figure 5. The probability of a false-negative diagnosis based on step-ups in [O2] is plotted as a function of the number of measurements of hemoglobin concentration used to calculate oxygen content. On that curve, the probability of a false-negative diagnosis goes from 32% down to 1%.
Discussion
Because the derivation of the equation at the end of Appendix II requires assuming that the measurements of %HbO2 and TotalHb are statistically independent, the inaccuracy of the [O2] that the AVOXimeter automatically calculates for each blood sample is still not known for certain. The AVOXimeter’s single-sample [O2] inaccuracy probably will not be known until its measurements are compared with a Lex-02-Con [1] or the Van Slyke and Neill technique [2]. Even if the AVOXimeter’s single-sample [O2] inaccuracy is never known for certain, we can describe an oximetry protocol that should give the staff of a cardiac catheterization laboratory a better chance to make a correct diagnosis by using shifts in oxygen content, rather than the shifts in %HbO2 that vary with hemoglobin concentration.
Conclusion
A Better Oximetry Protocol for Diagnosing Shunts
If the person operating the AVOXimeter puts in the patient’s ID number, and after inserting a cuvette and analyzing a blood sample, labels that measurement with the anatomical location from which it was drawn, the AVOXimeter stores the data and calculates the %HbO2 step-ups for each of the pairs of sites shown in Table 4.
Table 4. Six pairs of adjacent cardiovascular sites at which the Avoximeter® 1000E calculates “step-ups” in %HbO2 by subtracting the average %HbO2 at one site from the average %HbO2 at the other. The data from sub-sites are used in those calculations (3, 4).
|
Right atrium |
→ |
superior vena cava |
|
Right ventricle |
→ |
right atrium |
|
Pulmonary artery |
→ |
right ventricle |
|
Pulmonary vein |
→ |
left atrium |
|
Left atrium |
→ |
left ventricle |
|
Left ventricle |
→ |
aorta |
Because the AVOXimeter takes only 9 seconds to analyze a blood sample and because it calculates the mean of multiple %HbO2 measurements at each site, the person operating the AVOXimeter should reanalyze each blood sample a few times simply by reinserting the same cuvette containing the blood sample from that site. Doing so would not take much time because labeling the data with the anatomical site is similar to clicking on the answer to a multiple-choice question. Furthermore, Bailey et al. [9] put blood samples in disposable cuvettes and read them repeatedly at 1-min intervals and found that if the readings were started as soon as the cuvette was filled, accurate readings could be obtained for several minutes. However, filling multiple cuvettes with the same syringe is also possible even in a pediatric case because filling a cuvette takes only 50 μL of blood [20]. Even if you do a conventional shunt run (Table IV) and analyze each sample only one time, you will have 12 measurements of total hemoglobin concentration that you can average.
As Figure 5 shows, doing so would lower the probability of a false-negative diagnosis to 5%. Reinserting each cuvette just once would let you calculate the mean of 24 [Hb] measurements and take the probability of a false-negative diagnosis down to 1%.
When the shunt run is over, the AVOXimeter calculates the %HbO2 step-ups using the average of the measurements at each of the sites on the Table IV list. To use the oximetry protocol we are recommending, interfacing the AVOXimeter to a computer is not necessary but could help with the calculations. A description of the available hardware and software has been published [21], and free copies of the OxyReview software can be downloaded here: http://www.accriva.com/products/data-management-and-connectivity
Or here: https://drive.google.com/open?id=1YbLgHJXs4hBwldd_g5xfOFO86sJqhhax
According to that fundamental statistical principle, called the law of large numbers, the mean value of multiple measurements is much more accurate than a single measurement. It is also well known that the blood returning to the right side of the heart is not well mixed regarding %HbO2, but it is well mixed regarding total hemoglobin. Therefore, in calculating oxygen content, the average total hemoglobin can be used as a constant. In fact, Stark et al. [22] said “hemoglobin is a fixed number across all circulations in the body”. To diagnose the presence or absence of a shunt, calculate the average value of total hemoglobin from all of those measurements, multiply it times Hüfner’s 1.39 number [24–26] and times one of the mean %HbO2 step-ups stored in the AVOXimeter. Then see if the step-up in oxygen content is greater than Dexter’s diagnostic criterion for that pair of sites (Table III). The result is likely to be a correct diagnosis that is either the same as a diagnosis based on a %HbO2 step-up or much better depending on whether the patient has anemia, polycythemia, or a normal hematocrit.
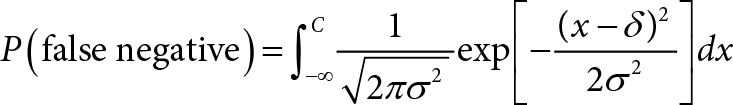
Appendix I: Probability of a False-Negative Diagnosis Calculated by LabVIEW
Define the following symbols:
δ = step-up in %HbO2
C = diagnostic criterion for a step-up
Then the probability of a false-negative diagnosis is:
Appendix II: Derivation of Equation for AVOXimeter’s [O2] Inaccuracy
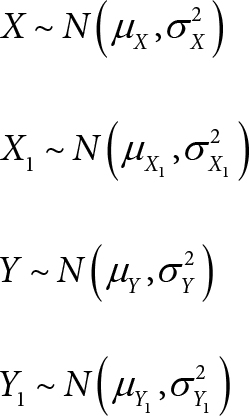
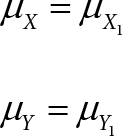
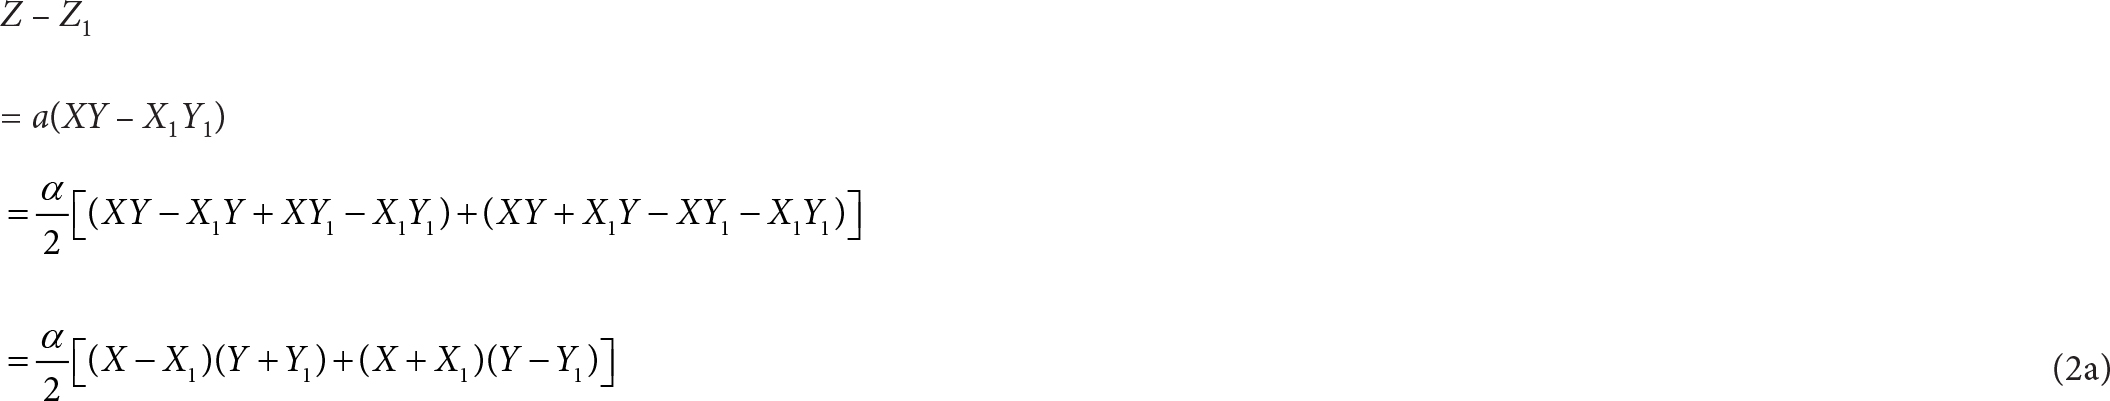
Let X and X1 be the measured oxygen saturations, [%HbO2] (in %), by the clinical oximeter and the standard reference method at a site respectively.
Let Y and Y1 be the measured total hemoglobin, [Total Hb] (in g/dL), by the clinical oximeter and the standard reference method at the site respectively.
Let Z and Z1 be the measured oxygen content, [O2] (in ml/dL), by the clinical oximeter and the standard reference method at the site respectively.
Denote a = 1.36 (ml/g) be the Hufner’s constant.
If a clinical oximeter is compared with a standard reference method, the bias of the oximeter is the mean of the differences between the measurements made with the two instruments:
bias of the oximeter in measuring [%HbO2] = μX − X1 = μX − μX1
bias of the oximeter in measuring [Total Hb] = μY −Y1 = μY− μY1
The error (or accuracy or inaccuracy) of the oximeter is the standard deviation of the differences between the measurements made with the two instruments:
error of the oximeter in measuring [%HbO2] = σX − X1
error of the oximeter in measuring [Total Hb] = σY − Y1
error of the oximeter in measuring [O2] = σZ − Z1
We make the following assumptions.
(A1) X, X1, Y, Y1 are independently and normally distributed:
(A2) The biases of the oximeter in measuring [%HbO2] and [Total Hb] are negligible:
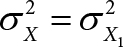
(A3) The variability of the oximeter in measuring [%HbO2] is the same as that of the standard reference method:
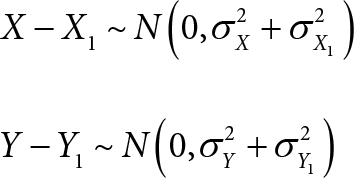
(C1) A consequence of assumptions (A1), (A2), and (A3) is that (X – X1) and (Y – Y1) are independently and normally distributed:
(C2) A consequence of assumptions (A2) and (A3) is that:
By the Hüfner’s equation, we have:
Z = αXY (1)
Z1 = αX1Y1 (2)
Subtracting Eq. (2) from Eq. (1):
We can show that (X – X1)(Y + Y1) and (X + X1)(Y – Y1) have zero covariance:
Cov[(X – X1)(Y + Y1), (X + X1)(Y – Y1)]
= E[(X – X1)(Y + Y1) (X + X1)(Y – Y1)] – E[(X – X1)(Y + Y1)] · E[(X + X1)(Y – Y1)]
= E[(X – X1)(X + X1)] · E[(Y + Y1)(Y – Y1)] – E(X – X1) · E(Y + Y1) · E[(X + X1)(Y – Y1)]
= 0 · E[(Y + Y1)(Y – Y1) – 0 · E(Y + Y1) · E[(X + X1)(Y – Y1)]
= 0
(The second equality above was due to the independence of X, X1, Y, Y1.)
(The second-to-last equality was due to (A2) and (C2).)
Since (X – X1)(Y + Y1) and (X + X1)(Y – Y1) have zero covariance, taking variance on both sides of Eq. (2a) would give us:

We apply Equation 9 of Shepherd et al. [14]:
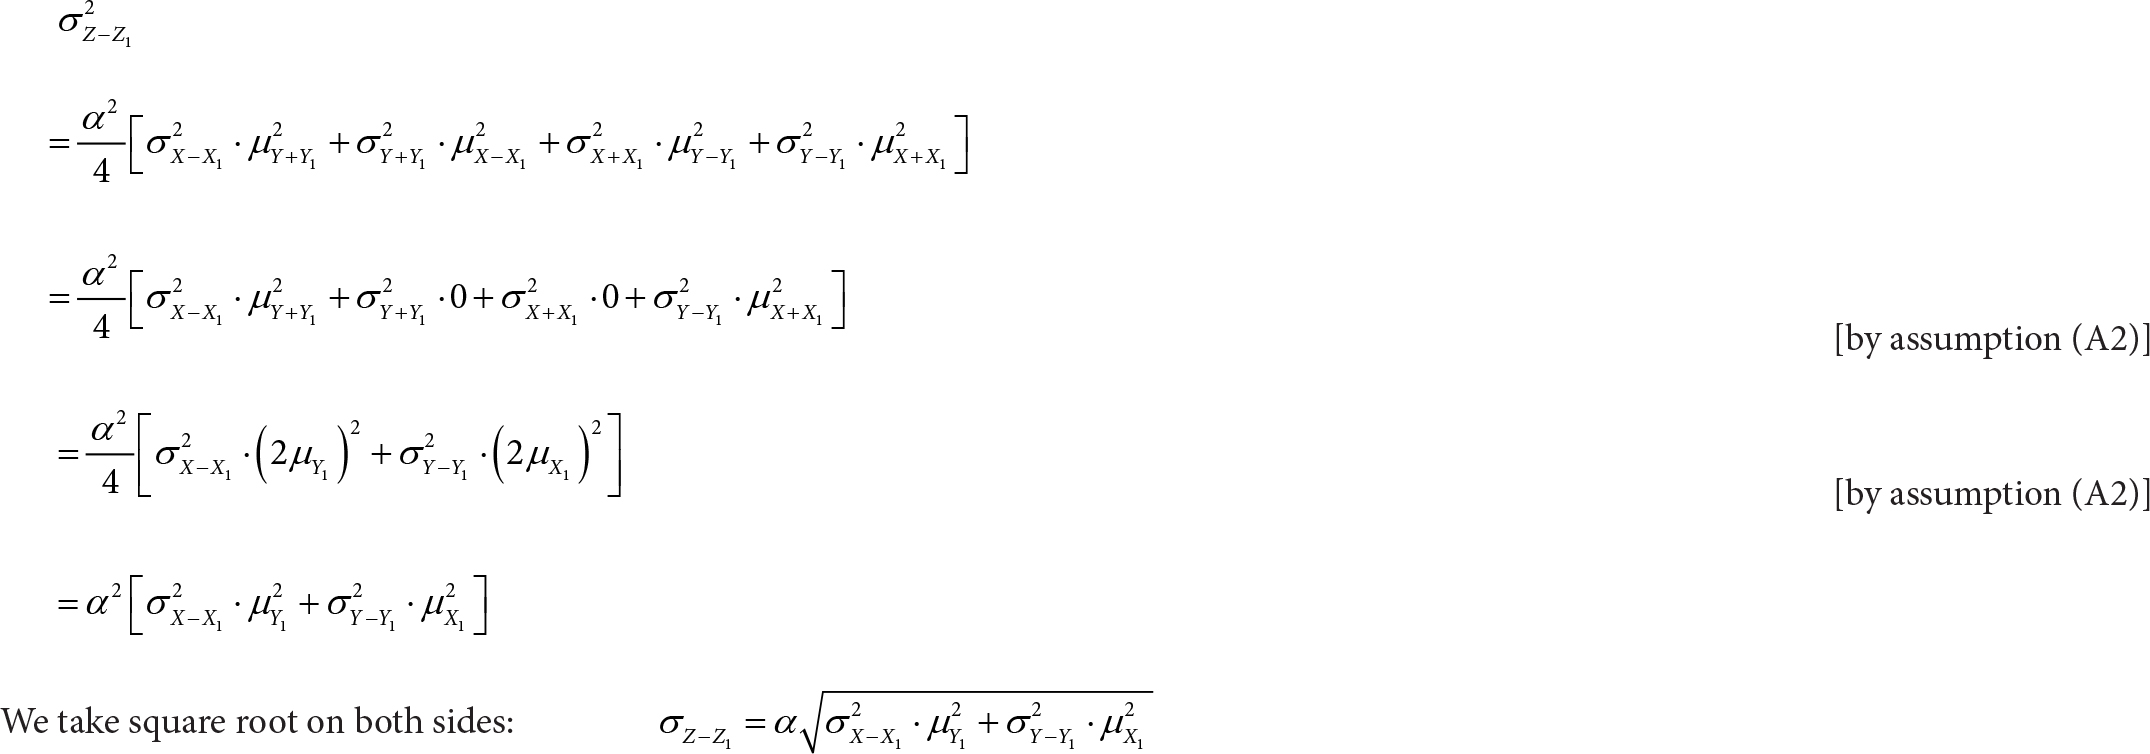
To conclude, we have derived the following equation:

Conflict of Interest
A.P. Shepherd was one of the inventors of the AVOXimeters and the disposable optical cuvettes they use, but his last patent has expired, so there is no financial conflict of interest. There is no conflict of interest regarding coauthor Wah-Kwan Ku.
Acknowldgements
Dr. Shepherd acknowledges the contributions three of his diseased colleagues made. C. Alex McMahan’s statistical methods enabled Shepherd to write the three cited publications in cardiology journals (10, 11, 14). John M. Steinke’s mathematics enabled them to invent and patent the AVOXimeters. Gary Lee Asbell designed the electronic circuits in those instruments.
References
- Selman BJ, White YS, Tait AR (1975) An evaluation of the Lex-0,-Con oxygen content analyser. Anaesthesia 30: 206–211.
- Van Slyke DD, Neill JM (1924) The determination of gases in blood and other solutions by vacuum extraction and manometric measurement. Journal of Biological Chemistry 61: 523–573.
- A-VOX Systems, Inc. AVOXimeter® 1000E (1998) Operator’s & Service Manual.
- International Technidyne Corp. AVOXimeter 1000E® (2008) Operator’s Manual.
- Antman EM, Marsh JD, Green LH, Grossman W (1980) Blood oxygen measurements in the assessment of intracardiac left to right shunts: a critical appraisal of methodology. Am J Cardiol 46: 265–271.
- Grossman W (1991) Shunt detection and measurement. Cardiac Catheterization, Angiography, and Intervention 4: 166–181.
- Grossman W (2013) In: Moscucci M, editor. Grossman & Baim’s Cardiac Catheterization, Angiography, and Intervention Philadelphia: Lippincott Williams & Wilkins 169.
- Freeman GL, Steinke JM (1993) Evaluation of two oximeters for use in cardiac catheterization laboratories. Cath and Cardiovasc Diag 30: 51–57.
- Bailey SR, Russell EL, Martinez A (1997) Evaluation of the AVOXimeter: Precision, long-term stability, linearity, and use without heparin. J Clin Monit 13: 191–198.
- Shepherd AP, McMahan CA (1996) Role of oximeter error in the diagnosis of shunts. Cath & Cardiovas Diagnosis 37: 435–446.
- Shepherd AP, Steinke JM, McMahan CA (1997) Effect of oximetry error on the diagnostic value of the Qp/Qs ratio. International Journal of Cardiology 61: 247–259.
- Kiel JW, Riedel GL, Shepherd AP (1987) Autoregulation of canine gastric mucosal blood flow. Gastroenterology 93: 12–20.
- Kvietys PR, Perry MA, Granger DN (1983) Intestinal capillary exchange capacity and oxygen delivery-to-demand ratio. Am J Physiology 245: G6354640.
- Shepherd AP, Terpolilli BM, Steinke JM (2007) A Hand-Held Device to Measure Oxygen Uptake: Performance Characteristics, Patient Selection, and the Propagation of its Measurement Error into Fick Cardiac Output Determinations. Journal of Invasive Cardiology 19: 113–122.
- Nobuhiro Yukawa, Takashi Suzuoka, Takeshi Saito, Alexander Forrest, Motoki Osawa, et.al. (1997) Data Processing in CO-Oximeters That Use Overdetermined Systems. Clinical Chemistry 43: 189–190.
- Dexter L, Haynes FW, Burwell CS (1947) Studies of congenital heart disease. II. The pressure and oxygen content of blood in the right auricle, right ventricle, and pulmonary artery in control patients, with observations on the oxygen saturation and source of pulmonary “capillary” blood. J Clinical Invest 26:554.
- Dexter L, Haynes FW, Burwell CS, Eppinger EC, Sosman MC, et al. Studies of congenital heart disease. iii. venous catheterization as a diagnostic aid in patent ductus arteriosus, tetralogy of fallot, ventricular septal defect, and auricular septal defect. J Clin Invest 26: 561–576.
- Dexter L, Haynes FW, Burwell CS, Eppinger EC, Sagerson RP, et al. (1947) Studies of congenital heart disease. I. The pressure and oxygen content of blood in the right auricle, right ventricle, and pulmonary artery in control patients with observations on the oxygen saturation and source of pulmonary capillary blood. Journal of Clinical Investigation 26: 554–560.
- Boehrer JD, Lange RA, Willard JE, Grayburn PA, Hillis LD (1993) Advantages and limitations of methods to detect, localize, and quantitate intracardiac right-to-left and bidirectional shunting. Am Heart J 125: 215–20.
- Toben B (2017) Oximetry Assessment of Intracardiac and Great Vessel Shunts. Respiratory Therapy 12: 34–36.
- Polito F, DeHavens A, Guadagni DF, Steinke JM, Shepherd AP (2004) Electronic Archival and Compliance System for a Point-of-Care Instrument Not Connected to the Hospital Information System: PC Interface for the AVOXimeter 1000E Cath Lab Oximeter. The Journal of Near-Patient Testing & Technology 3: 187–190.
- Stark RJ, Shekerdemian LS (2013) Estimating intracardiac and extracardiac shunting in the setting of complex congenital heart disease. Annals of Pediatric Cardiology 6: 145–151.
- Baim DS (2006) Shunt detection and Quantification. In: Grossman’s Cardiac Catheterization, Angioplasty, and Intervention. 7th ed. Philadelphia: Lippincott Williams and Wilkins 169.
- Shimizu S, Enoki Y, Kohzuki H, Ohga Y, Sakata S (1986) Determination of Hufner’s Factor and Inactive Hemoglobins in Human, Canine, and Murine Blood. Japanese Journal of Physiology 36: 1047–1051.
- Lumb AB (2000) Oxygen. In: Nunn’s Applied Respiratory Physiology. 5th ed. Oxford: Butterworth Heinemann 10: 169–202.
- Thomas C, Lumb AB (2012) Physiology of haemoglobin. British Journal of Anaesthesia 12: 251–256.