Author Archives: author

Mental Health Problems Following Military Missions: Veterans’ Experiences of The Quality of Care

DOI: 10.31038/AWHC.2019252

Abstract

The aim of this brief report is to present empirical data on female and male military veterans’ experiences of the quality of care they have received for mental health problems, following international military peace enforcement operations. The sample consists of all Swedish veterans who completed such missions during 2011–2015. The instrument Quality from the Patient’s Perspective (QPP) was used to assess experienced quality of care. Results show that female responders tended to experience the actual care received slightly less favorably than men. The most striking finding is that the mean scores of both men and women, and women in particular, were considerably lower (indicating that the quality of care was perceived as poor) than what has been reported in numerous previous studies using the QPP in a broad array of care contexts. Results were discussed in terms of lack of knowledge regarding veterans among health care professionals and stereotype conceptions of women in the military.

Keywords

Military Veterans, Mental Problems, Quality of Care, Gender Differences

Aim and Background

The aim of this brief report is to present empirical data on female and male officers’ and soldiers’ experiences of the quality of the care they have received for mental health problems, following international military peace enforcement missions. The sample consists of all Swedish military veterans who completed such missions during 2011–2015. Responses were obtained from 1614 men and 199 women (about 41 % response rate in both sexes). The mean age of the female responders was 37.6 years (SD = 10.6) and the mean age of the male group was 39.2 years (SD = 10.9). This difference was not statistically significant.

The questionnaire included a Yes/No question if the participant had sought health care help after the mission due to mental problems caused by the mission. Yes-responses were obtained from 143 men and 21 women. These individuals were asked to respond to follow-up questions on how they perceived the quality of care.

The quality of care questions were taken from the instrument Quality of care from the Patient’s Perspective     [1–3]. This instrument has been used in at least 100 internationally published studies in a broad array of care contexts, but not previously in a military setting. The QPP rests on a theoretical model of quality of care from a patient perspective [2]. This model has been operationalized to the QPP questionnaire. In this study 12 items were selected covering different aspects of received information (e.g. on drugs and their administration and self-care procedures), experienced commitment, empathy and respect from the doctors and perceived possibility to participate in the decision-making process regarding one’s own care. Each item had a 4-point response scale ranging from 1 (lowest quality) to 4 (highest quality). A composite scale score was computed by adding the raw scores of the 12 items and dividing this sum by 12. Thus, the overall quality of care scale score could range from 1 to 4.

The study was approved by the Swedish Regional Ethics Committee of Stockholm [4].

Results and Discussion

Results showed that the male veterans perceived the quality of care slightly more favorably than the female veterans on 11 of 12 items. The composite scale score among men was 2.35 (SD = 0.93), among women it was 1.93 (SD = 1.00). However, the differences between the means were not statistically significant on any of the individual items nor on the composite scale.

The most striking aspect of the results is the low absolute level of the ratings, indicating that the quality of care was perceived as poor. In previous patient studies, the mean scores among young and middle-aged adults tend to range between 3.10 and 3.30 [5]. The mean scores obtained in this study are the lowest (least favorable) that has been reported, at least to the best of my knowledge, in a broad variety of health care contexts. This is particularly the case for female officers and soldiers.

The men and women who take part in military peace enforcement operations are a select group in Sweden with above median physical and mental health. Despite this resourcefulness, some experience post-mission mental problems. When such problems arise, the individual is advised by the Swedish Armed Forces to contact their local primary health care center. In many cases, the personnel at these centers have limited, if any, knowledge of the military selection system and the stressors before, during and after a mission. A possible reason behind the unfavorable result on perceived actual care received is the lack of knowledge on part of the health care professionals. ”They did not understand me at all” is a typical comment. Continuing speculating, it is possible that the very low quality ratings by the female responders reflect stereotype beliefs on part of the health care professionals that the military is something for men and women who serve are a bit odd. Thus, to conclude, a deepened collaboration between the armed forces and the health care providers is recommended. The men and women who risk their lives for their country deserve better care.

References

  1. Larsson G, Wilde Larsson B (2010) Quality of care and patient satisfaction: A new theoretical and methodological approach. International Journal of Health Care Quality Assurance 23: 228–247.
  2. Wilde B, Starrin B, Larsson G, Larsson M (1993) Quality of care from a patient perspective: A grounded theory study. Scandinavian Journal of Caring Sciences 7: 113–120.
  3. Wilde B, Larsson G, Larsson ME, Starrin B (1994) Quality of care: Development of a patient-centred questionnaire based on a grounded theory model. Scandinavian Journal of Caring Sciences 8: 39–48.
  4. Regionala etikprövningsnämnden (2016)  Protokoll EPN 2016/53. Stockholm.
  5. Wilde B (1999) Patients’ views on quality of care: Age effects and identification of patient profiles. Journal of Clinical Nursing 87: 693–700.

Perinatal Mental Health Care across the Globe

DOI: 10.31038/AWHC.2019251

Abstract

The perinatal period is a vulnerable time for new mothers and their families. Broad public awareness and universal health education for all new mothers about perinatal mental illness carries significant impact. Timely screening for mental health disorders in pregnancy and postpartum is essential, followed by referrals to adequate treatments. Integrative care plays a significant role in enhancing reach and uptake. Stepped care models propose a range of treatment options based on symptoms and illness severity, and yield the most optimal outcomes for affected mothers and their children. Perinatal psychiatry, including integrative perinatal care, has over the past decades received more attention and resource allocation worldwide. But today various countries, based on their history of awareness and stigma towards perinatal illnesses, their access to overall mental health care, especially perinatal, based on insurance/payment coverage and established workforce, and based on overall national priorities and economic strength, face various challenges to establish comprehensive and systemic pathways of care for perinatal women suffering mental health challenges. Overall, there is still significant inequality across the globe both in low- and high-income countries in public awareness, infrastructure, and access, and there is still a long way to go to ease the suffering for affected perinatal women and their families.

Keywords

Perinatal Mental Health, Perinatal Care Models, Models in low- and High-Income Countries

Introduction

Perinatal mental health illness affects 10–15% of women during pregnancy and postpartum 1]. Per Diagnostic and Statistical Manual of Mental Disorders, 5th Edition, (DSM 5), the term postpartum defines women up to one month after delivery, however, in practice many postpartum mental health issues emerge during the entire first postpartum year. The last several decades have furthered our understanding regarding perinatal illness 2], primarily in two directions: (1) the recognition of the tremendous impact of untreated maternal mental illness on pregnancy and fetal outcomes, and the lasting consequences on subsequent child development 3]; and (2) the realization that there is a need for more effective models to reach impacted women on a large scale through the establishment of mental health care approaches integrated in primary care and the community 4–7]. Clearly, in order to establish optimal care for women’s perinatal mental health illness, there is the need for interdisciplinary collaboration and integrative treatment approaches [8,9]. In the following sections, we will elaborate on these integrative perinatal treatment approaches using examples from three countries –namely India, United States, and France. The three countries located on three continents represent very different perinatal mental health systems of care. We want to shed light on the cultural and political (i.e., organization and payment scheme of health care systems) contributions to presentation, detection and treatment of perinatal mental health disorders across these three very culturally and political varied countries.

Perinatal Mental Health in India

There are currently no formal protocols in India for any form of mental health screening in the perinatal period, and the integration of mental health into maternal health is quite inadequate. Screening is limited to institutional research and non-systematic administration. This could be attributed to several reasons including, (a) poor attention to mental health by the government until recently; (b) lack of training in mental health issues among midwives and obstetricians; and (c) the limitations of existing screening tools [10]. In particular, the latter point regarding culturally valid screening tools is highly relevant. As described by Bhui & Bhugra in 2008, women from India are more likely to have alternate explanatory models for mental illness, be more affected by stigma, and less likely to seek help [11]. Thus, a self-reported questionnaire is more likely to have false negatives, missing those with poor literacy and limited awareness of their own symptoms. Thus, in India, there is a need to develop simple and culturally relevant screening tools for perinatal depression and anxiety. Other culturally relevant factors are reliance on magico-religious explanatory models for mental illness, hence seeking religious healing instead of health care professionals; the cultural preference for male babies over female causing higher rates of depression with birth of a female infant; high prevalence of partner violence; mental health stigma; and low mental health literacy among professionals. Women with prior history of mental illness are stigmatized and lose autonomy in making decisions about pregnancy and childbirth. Medications are stopped prematurely due to lack of mental health awareness and poorly understood risks, without consulting mental health clinicians. Involving fathers more actively in care is needed but may sometimes be difficult, as childbirth is viewed as a woman’s business and it is often the maternal family which handles childbirth. Thus, India has a long way to go to overcome some culturally based obstacles to provide evidence-based perinatal mental health care. Moreover, culture and stigma are just some of the problems Indian women face when accessing adequate care for perinatal mental health. To date, India lacks a widespread infrastructure for the provision of any mental health care. For a population of 1 billion, there are fewer than 10,000 mental health professionals, with access to specialists limited mostly to urban areas. Only about 1–2% of the total health budget is spent on mental health [12]. Additionally, the priority for maternal and infant health has still been addressing more pressing issues such as malnutrition and anemia, along with ensuring that women have access to safe hospital deliveries. Both maternal and infant mortality are very high, and continue to be priorities over mental health [13].

Over the last decade, under the National Rural Healthcare Mission the Government of India has launched several programs to improve widespread access to health care for women [14]. A major component of this program was the implementation of Community Health volunteers called Accredited Social Health Activists (ASHAs), whose main aim is to form a reliable and consistent link between the community and the health system. They are the frontline staff (usually women) to whom villagers go for education, advice and monitoring of health related issues. By reducing ignorance and superstition, ASHA workers have been responsible for timely access of emergency and institutional childbirth services, and better utilization of outpatient and diagnostic health services. The Janani Suraksha Yojana (JSY) [15] and Janani Shishu Suraksha Karyakram (JSSK) [16] were launched in 2005, to improve access to antenatal care and reduce maternal and infant mortality. Under these programs, women are encouraged to improve nutrition during the antenatal period, ensure regular antenatal care, deliver in government health care facilities, and maintain regular follow up throughout the first year of the child’s life. Apart from that ASHA workers have also been trained in educating families regarding birth spacing and effective use of contraception. Each regional health center has auxiliary Nurse Midwives (ANMs), who act as supervisors and additional skilled resources for ASHA workers. Another current project is to train existing volunteer groups in identifying people with mental illness and connecting them to the right pathways of care. This program has been successfully evaluated outside of perinatal phase [17], but could in future be adopted more widely to include the perinatal population as well. Training of ASHA workers and other health professionals to screen for common mental health disorders specifically with focus on perinatal can be the next step in a wide-spread model of perinatal care

Apart from improving task workers at the ground level, National Mobile Medical Units (NMMUs) have been set up to enable access to remote areas. Mother and Child Health Wings with increased bed capacity have been sanctioned in high case load district hospitals as well as Child Health Centers which create additional beds for mothers and children. Furthermore, through nationally funded programs in many of India’s states, District Hospitals have telemedicine facilities, enabling easy access to specialists in tertiary care centers, including psychiatrists. The National Informatics Centre recently launched an electronic maternal and child tracking system that registers and follows women through pregnancy, postnatal care and children from infancy to adolescents [18]; Phone based infomercials and reminders have also been used to encourage safe pregnancy and aftercare and as a result, more recently the maternal and infant mortality rates have dropped significantly [14].

All the effort noted above demonstrate India’s national priority as a part of national Health Mission to establish a broad infrastructure for an impactful maternal and infant health care system, which would integrate access to perinatal mental health as well. At present perinatal mental health services are still only sparse and limited to academic institutions in a few cities, most of them restricted to outpatient services and only one inpatient mother-baby day-treatment unit (Mother-Baby Hospital in Bangalore). To further support perinatal mental health, the Indian Psychiatric Society now has a section on perinatal mental health, which has been championing the cause of maternal and child mental health. A nationally convened subcommittee of psychiatrists has been assigned the task of developing guidelines for perinatal mental health, with the parallel aim to have mental health incorporated in corresponding guidelines for obstetricians and pediatricians. Liaison between obstetric and psychiatric clinicians has increased and locally developed screening systems are being trialed.

Taken all together, India has still a long road ahead to have a wide-spread perinatal mental health system of care and perinatal mental health integration with primary care established, but activities towards achieving the goal are underway. However, despite many obstacles based on culture (e.g., beliefs, stigma, women’s rights) and other priorities (e.g., safe medical care), India is experiencing a surge of enthusiastic conversations among the responsible stakeholders about the importance of maternal and child mental health. The key is to now start putting these conversations into clinical practice and actively affect change. Successful integration and collaboration across mental health and primary care professionals and community members will reduce stigma and improve acceptance of mental health as a routine aspect of holistic healthcare in the perinatal period. This will ultimately bring positive change not only to the mother and young child, but also the whole family, and eventually the entire society.

Perinatal Mental Health in United States of America

Mental health care throughout the United States (US) varies drastically in access and type of services available. While geographic aspects may be important (e.g., vicinity to large metropolitan centers), one major impacting factor for care delivery in the US is the presence of different tiers of payment (insurance) systems for medical care. The insurance systems range from Medicaid (covering mostly chronically disabled patients, patients with income below the poverty line, and pregnant women) to various private insurance plans, each with its own eligibility and fee structures thus creating an uneven system which leaves many persons unprotected. With the establishment of the Affordable Care Act (ACA), also known as Obama Care, in 2010, an additional 45.7 million (15.7%) Americans became eligible for services. Under ACA all women with inadequate insurance coverage and below poverty line became eligible to receive comprehensive obstetrical care during pregnancy and up to 60 days postpartum and thus also eligible for access to quality mental health care.

From a larger politico-cultural perspective, health care inequality, especially for mental health, has unfortunately a long history in the US. There is a huge racial disparity; while most countries show a decrease in maternal mortality over past years the US is the only country with rising prevalence rate by almost 30% (between 2000 and 2014), and this rise is entirely accounted for by African American mothers [19]. Black women tend to initiate prenatal care later in pregnancy, and have limited access to affordable care overall, as the positive outcomes of ACA are still lagging. Moreover, the US is a racial and cultural “melting pot” in which attitudes towards mental health in general (and in particular towards perinatal mental health) varies widely based on cultural and economic background. Externalized stigma is particularly predominant in some subcultures preventing women from identifying and seeking help. This is true for African American, Latina, Asian or Arabic women, as well as the many other immigrant women from all over the world. Often women feel the need to identify as “strong” because they fear disclosure of any emotional problems may lead to losing child custody. Additionally, immigrants from many parts of the world have often limited knowledge of mental health, and in particular feel ashamed to disclose emotional problems in motherhood. Cultural sensitivity, access to interpreters with awareness of culture-bound obstacles, and provision of new engagement and treatment models is critical. One of such initiatives to overcome cultural barriers and the access gap was the establishment of the Centering Pregnancy group model as a nationwide initiative allowing for groups of women to experience pregnancy and postpartum health care visits together as a group thus promoting social support; however, results from this initiative are not yet known [20].

Despite of all these aforementioned obstacles, maternal perinatal mental health continues to be an important public health concern, and clinicians, professionals, and families alike are pushing for improvements. In an attempt to identify more women suffering from perinatal illness, primary care settings (i.e., family medicine, obstetrics and pediatrics) were recognized as an ideal place in which screening can be conducted. Already in 2009 the US Preventive Task Force (USPSTF) recommended screening adults for depression in general [21]. As a response to this initiative, several US states launched legislations mandating postpartum depression screening [22]. Additionally, The Mother’s Act, a federal legislation passed in 2010, offered government support for research that would support perinatal screening. Since many women in the US receive some level of health care during pregnancy, obstetricians and family practitioners, who deliver such care during pregnancy, were those identified as most feasible to conduct screening [23]. To support this initiative the American Congress of Obstetricians and Gynecologists (ACOG) came out to support such screening for perinatal mental illness in pregnancy and postpartum (ACOG,) [24]. Similarly, the American Academy of Pediatrics (AAP) also made a recommendation that all pediatricians should screen mothers when they present with their child to the 6-months well-baby visit.

However, soon it became apparent that screening without appropriate opportunity for treatment is not effective [25]. Nevertheless, despite recommendations put in place through national professional associations, many women were still not screened for peripartum depression or anxiety. Factors most commonly identified to interfere with follow through with the recommendations were as follows: (1) limited time and lack of reimbursement from insurances for screening; (2) illiteracy regarding perinatal mental illness and how to approach women with perinatal mental illness; (3) insufficient referral resources providing adequate quality perinatal mental health care.

This led to the proposition of several published models. First, models where detection and treatment can take place directly through obstetricians caring for pregnant women (the Perinatal Depression Management Program (PDMR) or Step Care Model [26]. in this model initial universal screening is performed with validated tools for perinatal depression during antenatal care visits. The providers would be educated about perinatal mental illness and be able to approach identified high-risk patients (those who scored above cut off) to complete a brief (~ 5–6 minutes) psychiatric assessment. These providers would also receive education about prescribing medicines for depression and anxiety (e.g., SSRIs), which have a low side effect profile and are safe during pregnancy and breastfeeding, so can easily be prescribed by non-psychiatrists. Patients with mild and moderate depression and anxiety disorder would be treated in the primary care setting. In contrast, patients with severe symptoms of mental illness would be quickly identified and referred out to mental health providers for specialty care. Despite this approach being well described and showing benefits [26], the uptake across the US has not been uniform.

Secondly, detection and referrals can take place in pediatric offices [27]. In this setting, new mothers can be successfully identified using standard screening tools such the Edinburgh Post depression scale (EPDS) [28], and if identified at risk could receive on-site counseling or, if medications are needed, referred out to specialty care. Pediatric primary care providers, unlike adult healthcare providers, have the most frequent contact with postpartum women through well-child visits. Well-child visits thus present an unparalleled opportunity to detect and intervene with postpartum mental illness.

Both these above mentioned models are most effective when mental health providers are embedded into the primary care settings allowing immediate and direct access to counseling [29,30]. Thus, obstetric and pediatric offices may have a mental health worker (often clinicians with social work background) available on site who can further assess all women who screened positive. Women at risk are then immediately identified and provided with either brief counseling by the social worker, or sent to see a psychiatrist either in the same clinic (available during special hours) or referred outside to a psychiatric clinic. However, again, lack of a uniformed health care system and one common health has made budget this great idea challenging to implement. Additionally, there are still large gaps in knowledge among women’s reproductive health care providers on how to optimally and safely screen and treat perinatal women with mental health disorders, and more work has to be done.

Depending on the severity of presenting symptoms among women with perinatal mental health problems, several different levels of care are available: outpatient, day hospital (or else called Partial Hospital) or inpatient treatments. Contrary to inpatient mother baby units (MBU) being widely spread through out the world (e.g., Europe, Australia) over the last 50 years, the US health system does not support resources necessary to keep a baby overnight on an adult psychiatry unit. Currently there exists only one small Perinatal Psychiatry Inpatient unit established in 2011 at the University of North Carolina that provides specialty perinatal inpatient care; Infants are allowed to stay on the unit during the day only. Another level of care is mother-baby partial hospital, where affected women (pregnant or postpartum) attend the program (if possible accompanied by their baby) during the day time for approximately 6 hours, and spend the night back at home or in an unsupervised sleeping arrangement (e.g., hotel). The first such unit opened in 2000 at Brown University [31], and since many more such units opened across the US. Many Academic settings have established specialized outpatient perinatal clinics and offer multimodal treatments. These outpatient clinics may offer also Intensive Outpatient Programs (IOPs), which are more intensive daytime groups of usually 3 hours.

Finally, several programs have been developed to provide therapeutic support for perinatal women with young children and their families who are poor or at high risk based on certain characteristics (e.g., poor, single mothers, young age etc). These programs are mostly government-funded and paid for by Medicaid. Examples of such interventions providing therapeutic support around mental health, coping with stressors and if applicable with parenting are the Nurse-Family Partnership (NFP) [32], or Healthy Families America (HFA) [33] just to name a few. Each State in the US may grant access to a variety of these programs. Specific trauma-focused psychotherapy group interventions for perinatal mothers with interpersonal trauma histories were recently also developed, including TARGET, a program for mothers with depression, PTSD and substance use disorders (SUDs) [34]; Mom Power, a 13 session program for mothers with interpersonal trauma history, mental health and parenting problems [35]; or Survivor Moms’ Companion (SMC), a psychoeducational program for pregnant trauma-survivor women with PTSD and depression delivered in pregnancy [36]. In summary, while perinatal mental health initiatives have started to be more widely implemented across the US, there are still gaps. While over the last years screening for perinatal depression has been mandatory in many States, it has not adequately improved referral and treatment outcomes. Furthermore, gains in perinatal mental health across the US are inconsistent, and large groups, especially Minority women and women living in poverty, have limited access to quality care despite several government-funded programs. Integrative perinatal care model while known to be effective, are still unevenly implemented across the US.

Perinatal Mental Health in Europe: exemplified by France

France has a long tradition of perinatal mental health dating back to the 19th century. Esquirol described women admitted after childbirth to the asylums, and shortly after, in 1858, Louis-Victor Marcé published the first monograph of perinatal psychiatric pathology. In more recent history, after World War II in 1945, France developed a nation-wide, free of charge, community-based Mother and Child Protection Service (PMI) aimed to support families during pregnancy until the child’s 3rd birthday. This service provides home visits by PMI midwives and nursery nurses if necessary, and preventive follow-up visits for children during which developmental screening and are conducted vaccinations, and in this context maternal mental health can also be screened for and referrals to specialty care placed. In addition, there are large governmental programs and recommendations in place supporting perinatal mental health. Recommendations have been established to conduct early prenatal interviews for all pregnant women and future fathers listening to their concerns, needs, difficulties and expectations for pregnancy, childbirth and future parenting, with the goal of defining the best medico-psycho-social follow-up and support for the pregnancy. However, a national survey in 2010 showed that only 40% of the pregnant women receive this early comprehensive prenatal interview, and that, it is mainly mothers with low psychosocial risk that attend this interview and get benefit from it [37]. However, some kind of psychosocial screening of high-risk women during pregnancy and/or in first 3 days postpartum is performed in all regions across France. Additionally, liaison psychiatry networks connected to obstetrical Maternity Units have been established providing psychiatric support to primary care treating pregnant and postpartum women on a wide scale.

Perinatal mental health services range in France, similarly to the US, from inpatient care, partial hospital day-treatment units and outpatient psychiatric clinics, to integrated care in primary care settings. In France, pathway to care has no gatekeeper (and women in France may directly access specialized perinatal psychiatry). In contrast to the US, the number of facilities per capita is much higher in France, and there are many specialized inpatient psychiatric units for joint mother-baby admissions and psychiatric care, run by a multidisciplinary staff. In this regard, France resembles more the broad range of perinatal psychiatry treatment options similar to the UK, Australia and a few others, mostly European, countries. In case of maternal severe psychiatric illness after the childbirth, the mother and her infant can be jointly admitted to an inpatient mother baby unit (MBU), where the mother receives psychiatric attention, while simultaneously the child’s safety, developmental needs and the mother-infant bond are supported [38]. Women (and infants) hospitalized in MBUs have a mean length of stay of about 9 weeks, and improvement rates are very high (69%-82% at discharge depending on primary diagnosis [39]. Discharges from MBUs and subsequent follow up are collaboratively prepared with the women, her social support system, and her treatment providers [40]. In addition, the outpatient perinatal system of care in France, in outpatient academic or governmental clinics or through private practice perinatal psychiatrists, is wide spread and comprehensively covering the country.

In summary, perinatal psychiatry in France (and Europe overall) has a long tradition, and the perinatal psychiatry infrastructure is well established. The offerings span a broad range of stepped care models. Guided by a multilevel administrative health care coordination system, France’s perinatal care spans from mother (-father)-infant psychotherapies offered in outpatient settings to joint mother-baby psychiatric hospitalizations in specialty MBUs. Similarly, to US and India, recent efforts are to enhance preventive public health care models, through integration of perinatal psychiatric care into primary care settings.

Conclusion

Perinatal psychiatry, including integrative perinatal care, has over the past decades received more attention across the globe, both in high- and middle/low- income countries, such as US, France or India. More attention and resources specifically to perinatal mental health are allocated worldwide, yet still the various countries based on historical awareness and stigma towards perinatal illnesses, access to overall mental health care, types of insurance/payment coverage, access to an established and educated workforce, and based on overall national priorities and economic strength, face different challenges in establishment of comprehensive and systemic pathways of care for perinatal women suffering mental health challenges. Overall, there is still significant inequality across the globe in public awareness, infrastructure, and access. In order to ease the suffering of affected women and their families during this critical time period of a new beginning, such that pregnancy and postpartum, we are tasked to do better, and establish more comprehensive and accessible perinatal mental health systems of care.

References

  1. Fisher J, Meena Cabral de Mello, b Vikram Patel, c Atif Rahman, d Thach Tran, et al. (2012) Prevalence and determinants of common perinatal mental disorders in women in low- and lower-middle-income countries: a systematic review. Bulletin of the World Health Organisation 90: 139–149.
  2. Muzik M, Thelen K, Rosenblum K (2011) Perinatal Depression: Detection and Treatment. A review. Neuropsychiatry 1: 179–195.
  3. Waxler E, Thelen K, Muzik M (2011) Maternal Perinatal Depression – Impact on Infant and Child Development. European Psychiatric Review 4: 41–44.
  4. Misra DP, Guyer B, Allston A (2002) Integrated perinatal health framework. A multiple determinants model with a life span approach. American Journal of Preventive Medecine 25: 65–75.
  5. Yonkers KA, Smith MV, Lin H, Howell HB, Shao L, et al. (2009) Depression screening of perinatal women: An evaluation of the Healthy Start depression initiative. Psychiatric Services 60: 322–328.
  6. Yonkers KA, Wisner KL, Stewart DE, Oberlander TF, Dell DL, et al. (2009) The management of depression during pregnancy: a report from the American Psychiatric Association and the American College of Obstetricians and Gynecologists. General Hospital Psychiatry 31: 403–413.
  7. Thomas M, Hutchison M, Castro G, Nau M, Shumway M, et al. (2017) Meeting Women Where They Are: Integration of Care As the Foundation of Treatment for At-Risk Pregnant and Postpartum Women. Matern Child Health J 21: 452–457. [crossref]
  8. Myors KA, Michelle Cleary, Maree Johnson, Virginia Schmied (2013) Collaboration and integrated services for perinatal mental health: an integrative review. Child and Adolescent Mental Health 18: 1–10.
  9. Milgrom J1, Gemmill AW2 (2014) Screening for perinatal depression. Best Pract Res Clin Obstet Gynaecol 28: 13–23. [crossref]
  10. Hema D, Girish N, Ramapriya, Chandra Prabha, Gururaj G (2008) Use of Edinburgh Postnatal Depression Scale (EPDS) in a private obstetrics setting. Journal of Obstetrics and Gynecology of India 58: 41–44.
  11. Bhui K, Bhugra D (2008) Explanatory models for mental distress: implications for clinical practice and research. British Journal of Psychiatry 181: 6–7.
  12. Patel V, Xiao S, Chen H, Hanna F, Jotheeswaran AT, et al. (2016) The magnitude of and health system responses to the mental health treatment gap in adults in India and China. Lancet 388: 3074–3084. [crossref]
  13. Doke PP1 (2016) Decline and disparity in maternal mortality in pre- and post-national health mission period in India. Indian J Public Health 60: 294–297. [crossref]
  14. NagarajanS, Vinod K. Paul, Namrata Yadav, Shuchita Gupta (2015) The National Rural Health Mission in India: its impact on maternal, neonatal, and infant mortality. Seminars in Fetal & Neonatal Medicine 20: 315–320.
  15. Gupta SK, Dinesh K. Pal, Rajesh Tiwari, Rajesh Garg, Ashish K. Shrivastava, et al. (2012) Impact of Janani Suraksha Yojana on institutional delivery rate and maternal morbidity and mortality: an observational study in India. Journal of Health, Population and Nutrition 30: 464–471.
  16. Salve HR, Charlette L, Kankaria A, Rai SK, Krishnan A, et al. (2017) Improving Access to Institutional Delivery through Janani Shishu Suraksha Karyakram: Evidence from Rural Haryana, North India. Indian J Community Med 42: 73–76. [crossref]
  17. Patel V, Weiss HA, Chowdhary N, Naik S, Pednekar S, et al. (2010) Effectiveness of an intervention led by lay health counsellors for depressive and anxiety disorders in primary care in Goa, India (MANAS): a cluster randomised controlled trial. Lancet 376: 2086–2095.
  18. Grollman C, Arregoces L, Martínez-Álvarez M, Pitt C, Mills A, et al. (2017) 11 years of tracking aid to reproductive, maternal, newborn, and child health: estimates and analysis for 2003–13 from the Countdown to 2015. Lancet Glob Health 5: e104-104e114. [crossref]
  19. MoaddabA, Dildy GA, Brown HL, Bateni ZH, Belfort MA, Sangi-Haghpeykar H, et al. (2016) Health care disparity and state-specific pregnancy-related mortality in the United States, 2005–2014. Obstetrics and Gynecology 128: 869–875
  20. Catling CJ, Medley N, Foureur M, Ryan C, Leap N, et al. (2015) Group versus conventional antenatal care for women. Cochrane Database Syst Rev 2: CD007622. [crossref]
  21. U.S. Preventive Services Task Force (2009) Preventive Services Task Force. Screening for depression in adults: U.S. preventive services task force recommendation statement. Annals of Internal Medicine 151: 784–792.
  22. Perinatal Depression Information Network: Legislation, 2011 Available at Pdinfonetwork.org Accessed January 23, 2012.
  23. Lee LC, Casanueva CE, Martin SL (2005) Depression among female family planning patients: Prevalence, risk factors, and use of mental health services. Journal of Women’s Health 14: 225–232.
  24. American College of Obstetrics and Gynecologists (AOCG) (2010) Women’s Health Care Physicians. Screening for depression during and after pregnancy. Committee opinion Pg No: 453.
  25. Thombs BD, Arthurs E, Coronado-Montoya S, Roseman M, Delisle VC, et al. (2014) Depression screening and patient outcomes in pregnancy or postpartum: A systematic review. Journal of Psychosomatic Research 76: 433–446.
  26. Miller LJ, Shade M, Vasireddy V (2009) Beyond screening: Assessment of perinatal depression in a perinatal care setting. Archives of women’s Mental Health 12: 329–334.
  27. Olin Su-chin S, et al. Journal of Women’s Health, 2017, Jul 4 Epub ahead of print. (https://doi-org.proxy.lib.umich.edu/10.1089/jwh.2016.6089)
  28. Cox JL, Holden JM, Sagovsky R (1987) Detection of postnatal depression. Development of the 10-item Edinburgh Postnatal Depression Scale. British Journal of Psychiatry 150: 782–786.
  29. Schmied V, Kim Psaila, Cathrine Fowler, Sue Kruske, et al. (2010) The nature and impact of collaboration and integrated service delivery for pregnant women, children and families. Journal of Clinical Nursing 19: 3516–3526.
  30. Hayes BA (2010) From ‘postnatal depression’ to ‘perinatal anxiety and depression’: key points of the National Perinatal Depression Plan for nurses and midwives in Australian primary health care settings. Contemp Nurse 35: 58–67. [crossref]
  31. Howard M, Battle CL, Pearlstein T, Rosene-Montella K (2006) A psychiatric mother–baby day hospital for pregnant and postpartum women. Archives of women’s mental health 9: 213–218.
  32. Olds DL (2010) The nurse-family partnership: From trials to practice. In A. Reynolds A, et al (eds.), Childhood programs and practices in the first decade of life: A human capital integration.). New York, NY: Cambridge University Press Pg No: 49–75.
  33. Holton JK, Harding K (2007) Healthy Families America®: Ruminations on Implementing a Home Visitation Program to Prevent Child Maltreatment. Journal of prevention & intervention in the community 34: 13–38.
  34. Ford JD, Russo E (2006) Trauma-focused, present-centered, emotional self-regulation approach to integrated treatment for posttraumatic stress and addiction: trauma adaptive recovery group education and therapy (TARGET). American Journal of Psychotherapy 60: 335–355.
  35. Rosenblum KL, Maria Muzik, Diana Morelen, Emily Alfafara, Nicole Miller, et al. (2017) A community-based randomized controlled trial of Mom Power parenting intervention for mothers with interpersonal trauma histories and their young children. Archives of Women’s Mental Health Jun 25 on line. (DOI: 10.1007/s00737-017-0734-9).
  36. Seng JS (2011) Integrating care for posttraumatic stress and physical comorbidities: the road is clear. Journal of American Psychiatry Nurses Association 17: 376–377.
  37. Bales M, Pambrun E, Melchior M, Glangeaud-Freudenthal NM, Charles MA, et al. (2015) Prenatal psychological distress and access to mental health care in the ELFE cohort. European psychiatry 30: 322–328.
  38. Brockington I, Butterworth R, Glangeaud-Freudenthal NM-C (2017) An international position paper on mother-infant (perinatal) mental health, with guidelines for clinical practice. Archives of Women’s Mental Health 20: 113–120.
  39. Glangeaud-Freudenthal NM-C, Sutter AL, Thieulin AC, Dagens-Lafont V, Zimmermann MA, et al. (2011) Inpatient mother and child postpartum psychiatric care: factors associated with improvement in maternal mental health. European Psychiatry 26: 215–223.
  40. Glangeaud-Freudenthal N.M.-C, Sutter-Dallay AL, Thieulin AC, Dagens V, Zimmermann MA, et al.(2013) Predictors of infant foster care in cases of maternal psychiatric disorders. Social Psychiatry and Psychiatric Epidemiology 48: 553–561.

Determination of Biuret Content in Fertilizers by High Performance Liquid Chromatography: Single-Laboratory Validation and Collaborative Ring Test Study

DOI: 10.31038/JPPR.2019236

Abstract

Urea or urea-based fertilizers has become the leading form of nitrogen fertilizers around the world. Biuret, as one of major by-products formed during the manufacturing of urea, was proved to be harmful to plant growth. A Single-Laboratory Validation (SLV) study for a newly proposed High Performance Liquid Chromatography (HPLC) method was conducted. A total of six samples were tested in the SLV study: two urea samples, and four compound fertilizers with various compositions from different sources. In addition, one biuret standard from Aldrich® and one biuret reference from Alfa Aesar® were used as standard materials. The system was linear over a concentration range of 0~200 ppm biuret, with a correlation coefficient≥0.999. Recoveries were determined by spiking three of the validation samples with known amounts of biuret standard solutions and measuring the biuret level according to the method. The recovery rates lies between 98.14% and 107.24%. Method precision was determined by analyzing of six validation samples under five replicate analyses, the RSDs ranged from 0.69% to 1.85%. Further study by Liquid Chromatography-Tandem Mass Spectrometry (LC-MS/MS) has revealed that the biuret was well-separated from urea and other N-containing compounds in the system by this method. Moreover, the proposed method is verified in the international Collaborative Ring Test (CRT) study organized by ISO/TC 134 “Fertilizers and Soil Conditioners”. Systematically statistical analysis on the data obtained has proven that this method is capable of effectively monitoring biuret content in a wide range of fertilizers.

Keywords

Biuret, Collaborative Ring Test, Fertilizer, High Performance Liquid Chromatography, International Standard, Single-Laboratory Validation

Introduction

Fertilizer has played an important role in improving both the quantity and quality of agricultural products [1–2]. Recently, urea, or urea-based fertilizers (Including urea formaldehyde slow release fertilizer, urea ammonium nitrate solution, sulfur coated urea, urea-based complex/compound fertilizer, etc.) has become the leading form of nitrogen fertilizers around the world, while some agricultural and environmental problems raised by the application of urea and urea-based fertilizers have attracted more and more attention [3–4]. Biuret, also known as 2-imidodicarbonic diamide (NH2CONHCONH2), is one of major by-products formed when molten urea was heated near or above its melting point during the manufacturing of urea and urea-based fertilizers [5–6]. The toxicity of biuret to plants was first observed and reported in the 1950s by US scientists during observing damages caused by urea foliage sprays on orchard plants such as citrus and pineapples [7–8]. The exact mechanism of biuret damage to different plants is still under investigation, but the harmful effects of high concentration of biuret to some sensitive plant species have been well documented [4,7,8], and many regulations/standards concerning the maximum allowed concentrations and/or the analysis methods have been published around the world [9–14].

There are at least three analytical methods available for the determination of biuret in fertilizers, including the traditional spectrophotometric methods [10–13], the atomic absorption spectrophotometric methods [14] and the HPLC methods [6,11,15]. The first two methods are based on the formation of complexation of biuret with copper ions [Cu(II)], and subsequent determination of the Cu(II) compound concentration by spectrophotometry [6,10,14]. There are two significant disadvantages of spectrophotometric methods: first, the formation of chromatic copper complexation, although well-known as the “Biuret Reaction”, is actually not the specific character of biuret, many other compounds such as urea-condensates (e.g. triuret), peptides and proteins may interfere with this complexation [15,19] second, both these spectrophotometric methods are complex and tedious, and are therefore more prone to multiple sources of error [6,11–14].

Recently, the HPLC methods have shown superiority over other types of methods, owing to their ability to quantitatively determine biuret content by completely separating biuret from numerous urea-condensates [6,11,15]. Some HPLC methods utilizing the C18 column with the detection wavelength of 200 nm [11] has been found to be effective for a variety of fertilizers, but could lose its efficacy when some specific compounds (e.g. nitrate, with strong adsorption under 200 nm) are present in the fertilizers (e.g. Urea Ammonium Nitrate (UAN) solution, nitrate-containing complex/compound fertilizer, etc.). To seek a uniform, quick and accurate method for the determination of biuret content in fertilizers [16,17], a high performance liquid chromatography method for the determination of biuret content in fertilizers was developed. A Single-Laboratory Validation (SLV) and systematically statistical analysis on the data obtained had proven that the proposed method was capable of effectively monitoring biuret content in a wide range of fertilizers. The reproducibility of the method was verified in the international Collaborative Ring Test (CRT) study organized by ISO/TC 134 “Fertilizers and Soil Conditioners”. On the basis of accuracy and precision of the results obtained in both SLV and CRT studies, it was conclude that the method is capable of measuring the amount of biuret present in the urea containing fertilizer accurately and with no interference from other urea or its adducts.

Experimental Section

This proposed method specifies the test procedure for the determination of the biuret content in liquid and solid urea containing fertilizers based on the HPLC method.

A. Principle

The biuret content in the fertilizer is extracted by aqueous acetonitrile mobile phase, and separated from other contents by reversed liquid chromatography on a propyl amino column, and the peak is detected by a UV detector attached to the HPLC. The external standard method is applied to determine the biuret content in fertilizer samples.

B. Reagents &Validation Materials

(a) Reagents

All reagents were of analytical grade. Acetonitrile (HPLC grade, Merck Co. Ltd., Germany) was used for preparation of the mobile phase. Deionized distilled water (18MOhm*cm) was used throughout the experiment. Biuret standard material (>99%, CAS 108-19-0, Lot #BCBH8859V) was purchased from Sigma-Aldrich® and was used for the HPLC quantitative analysis, and biuret reference material (>97%, CAS 108-19-0, Lot #L00812) from Alfa Aesar® were used in the LC-MS/MS qualitative analysis.

(b) Validation Materials

Two kinds of urea (SLV-054, SLV-108) and four kinds of compound fertilizers (SLV-003, SLV-125, SLV-012, SLV-114) from different sources were used as Single-Laboratory Validation (SLV) materials and are listed in Table 1. Each fertilizer sample to be tested has its distinguished content level of biuret. In order to establish a globally accepted analytical method, the validation materials for the Collaborative Ring Test (CRT) were selected to represent a wide variety of commercially available fertilizer products of different sources and manufacture processes. Seven different fertilizer products, including both liquid and solid urea-based fertilizers were selected for CRT and listed in Table 1, with biuret contents in the range of 0.10% ~ 1.01% (mass fraction).

Table 1. List of validation materials

Serial number

Type of fertilizer

Declared gradec

Note (raw material)

SLV-054a

urea

46–0–0

/

SLV-108

urea

46–0–0

/

SLV-003

compound fertilizer

15–15–15

urea, monoammonium phosphate, ammonium sulphate, potassium chloride

SLV-125

compound fertilizer

25–10–16

urea, monoammonium phosphate, potassium chloride, ammonium chloride

SLV-012

compound fertilizer

15–15–15

urea, monoammonium phosphate, potassium sulphate

SLV-114

compound fertilizer

25–11–10

urea, monoammonium phosphate, calcium superphosphate, potassium sulphate

CRT-001b

NPK compound fertilizer

N/A d

/

CRT -002

urea formaldehyde complex fertilizer

N/A

/

CRT -003

urea

N/A

/

CRT -004

NPK complex fertilizer

N/A

/

CRT -005

urea ammonium nitrate (UAN) solution

N/A

urea, ammonium nitrate

CRT -006

urea formaldehyde slow release liquid fertilizer (Trisert®)

N/A

triazone, as well as other urea-condensates

CRT -007

polymer sulfur coated urea (PSCU)

N/A

/

a SLV=single-laboratory validation

b CRT=collaborative ring test

c Declared grade listed in the order of N-P2O5-K2O

d N/A =not available

All solid fertilizer samples were grinded until they passed through a sieve of aperture size 0.5 mm, and mixed thoroughly for homogeneity before analysed. All liquid fertilizer samples mixed thoroughly for homogeneity before analyses.

C. Apparatus and Analysis Conditions

Ordinary laboratory apparatus, and

  1. High performance liquid chromatography (HPLC). – A Waters® 1525-2489-2707 HPLC system with a UV absorption detector having a minimum detection wavelength of 190 nm. LC operation conditions were: LC column, 250*4.6 mm propylamine (NH2) column with 5 µm particle size (APS-2 Hypersil, ThermoFisher Co. Ltd. Part #30705-254630 or Spherex NH2, Phenomenex Co. Ltd. Part #00G-00051-E0); mobile phase, 85% (v/v) acetonitrile in water; elution mode, isocratic; flow rate, 1.0~1.3 ml/min; injection volume, 10 µl; column temperature, 30~35 oC; and detection wavelength, 195 nm.
  2. Liquid Chromatography-Tandem Mass Spectrometry (LC-MS/MS). – A Shimadzu 20ADXR HPLC system with a UV absorption detector was used for LC separation. An AB Sciex Triple TOF® 4600 with an ESI source in positive ion mode with Analyst® software was used to control the LC and the MS. LC operation conditions were set as the same as the Waters® HPLC system previously described, the MS operation conditions were: ion source, ESI; scan mode, MS(30D~450D)+ MS/MS(30D~450D); curtain gas pressure, 35psi; ion spray voltage, 5500V; heater temperature, 600oC; ion source gas 1 pressure, 50psi; ion source auxiliary gas 2 pressure, 50psi; and collision gas, medium.
  3. Ultrasonic bath. – purchased from Shanghai Kudos ultrasonic instrument Co.,Ltd.
  4. Sample sieve. – With the aperture size of 0.50 mm.
  5. Syringe-driven filter. – With organic filter membrane of 0.22 µm pores.

D. Procedures

(a) Preparation of Test Solution:

For the solid fertilizer samples, weigh 0.1 g~0.5 g test sample (accurately to 0.0002 g, with biuret content of 1 mg~2 mg ca.) into a 25 ml beaker. Add 10 ml mobile phase and dissolve using an ultrasonic bath for 10 min. Transfer to a 25 ml volumetric flask and dilute to volume with mobile phase. Mix thoroughly and leave standing, filter with a syringe filer to obtain the test solution. For the liquid fertilizer samples, directly transfer 0.1 ml~0.5 ml of the test sample (accurately to 0.001 ml, with biuret content of 1 mg~2 mg ca.) into a 25 ml volumetric flask, dilute to volume with mobile phase. Mix thoroughly and leave standing, filter with syringe filer to obtain the test solution.

(b) Preparation of Biuret Stock Solution and Working Standard Solutions:

Weigh 0.5000 g biuret standard material [B(a)], dissolve by mobile phase, and transfer into a 1000ml volumetric flask, dilute to volume with mobile phase and mix to form the biuret stock solution. For the biuret working standard solution, pipette 0.00 ml, 0.50 ml, 1.00 ml, 3.00 ml, 5.00 ml and 10.00 ml biuret stock solution into 6 separate 25 ml volumetric flasks. Dilute with respective volumes of mobile phase and make up to the mark and mix thoroughly. Filter with 0.22 µm organic filter membrane (Table 2).

Table 2. Preparation of biuret working standard solutions

Volume of biuret standard solution (ml)

Mass of biuret (mg)

Concentration of biuret (mg/kg)

0.50

0.25

10.0

1.00

0.50

20.0

3.00

1.50

60.0

5.00

2.50

100.0

10.00

5.00

200.0

(c) Determination of the Biuret Content and Calculation

Ensure the HPLC apparatus operating conditions are optimized. Successively inject 10 μl working standard solution and determine the series of standard solution. Draw the standard curve and deduce the linear regression equation by the average peak areas of the biuret and the corresponding mass. Determine the test solution by the same procedure, measure the peak area, and calculate the biuret mass in each test solution according to the standard curve or linear regression equation.

The mass fraction of biuret (%), w, is calculated as follows:

JPPR 19 - 120_Michael M. Hojjatie_F5

Where m1 is the mass of biuret in mg, of the test solution, calculated according to the standard curve or linear regression equation corresponding to the peak areas; m is the mass in g, of the test portion. The mass fraction of biuret is the arithmetic average of two parallel test results. The statistical analysis of the data obtained from the SLV and CRT study was performed mainly according to procedures in ISO 5725-2:1994 [18].

Results and Discussion

A. Lc Chromatogram and Calibration Curve

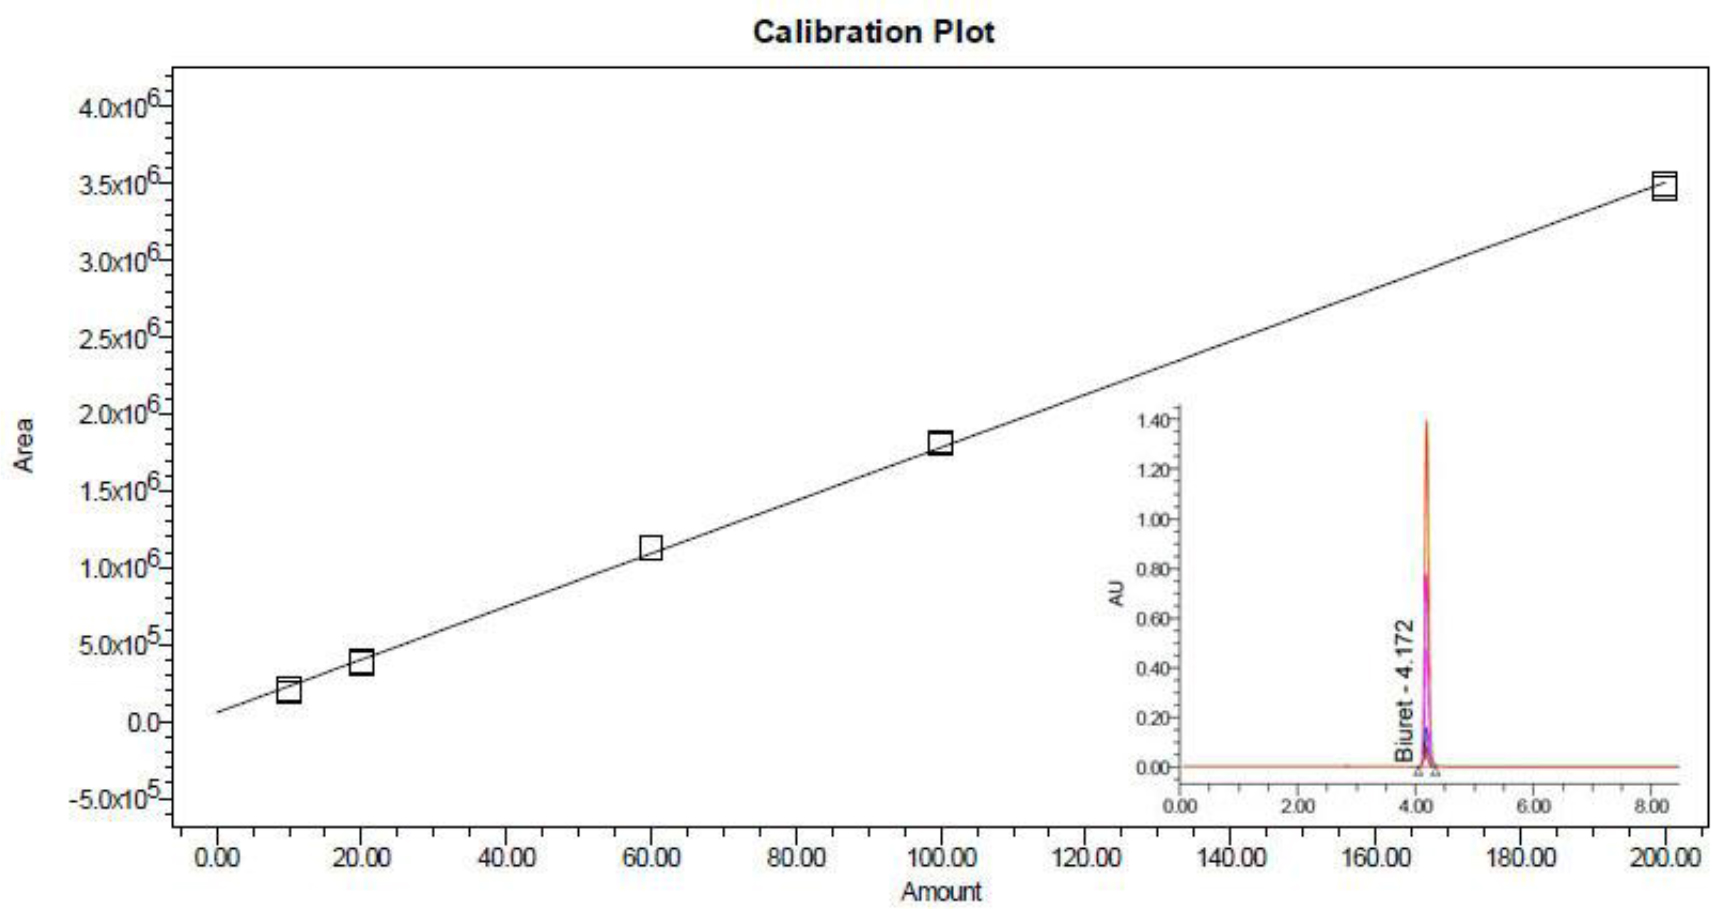
The LC chromatogram of biuret standard material is shown in Figure 1. The observed peak is attributed to the biuret, and no any other significant contamination could be found, showing high purity of the biuret standard material [B(a)]. The calibration plot illustrated that the method was linear over the region of 10.00 to 200.0 mg/kg, with a correlation coefficient ≥0.999.

JPPR 19 - 120_Michael M. Hojjatie_F1

Figure 1. LC chromatogram of biuret standard and calibration curve

B. Lc-Ms/Ms Analysis

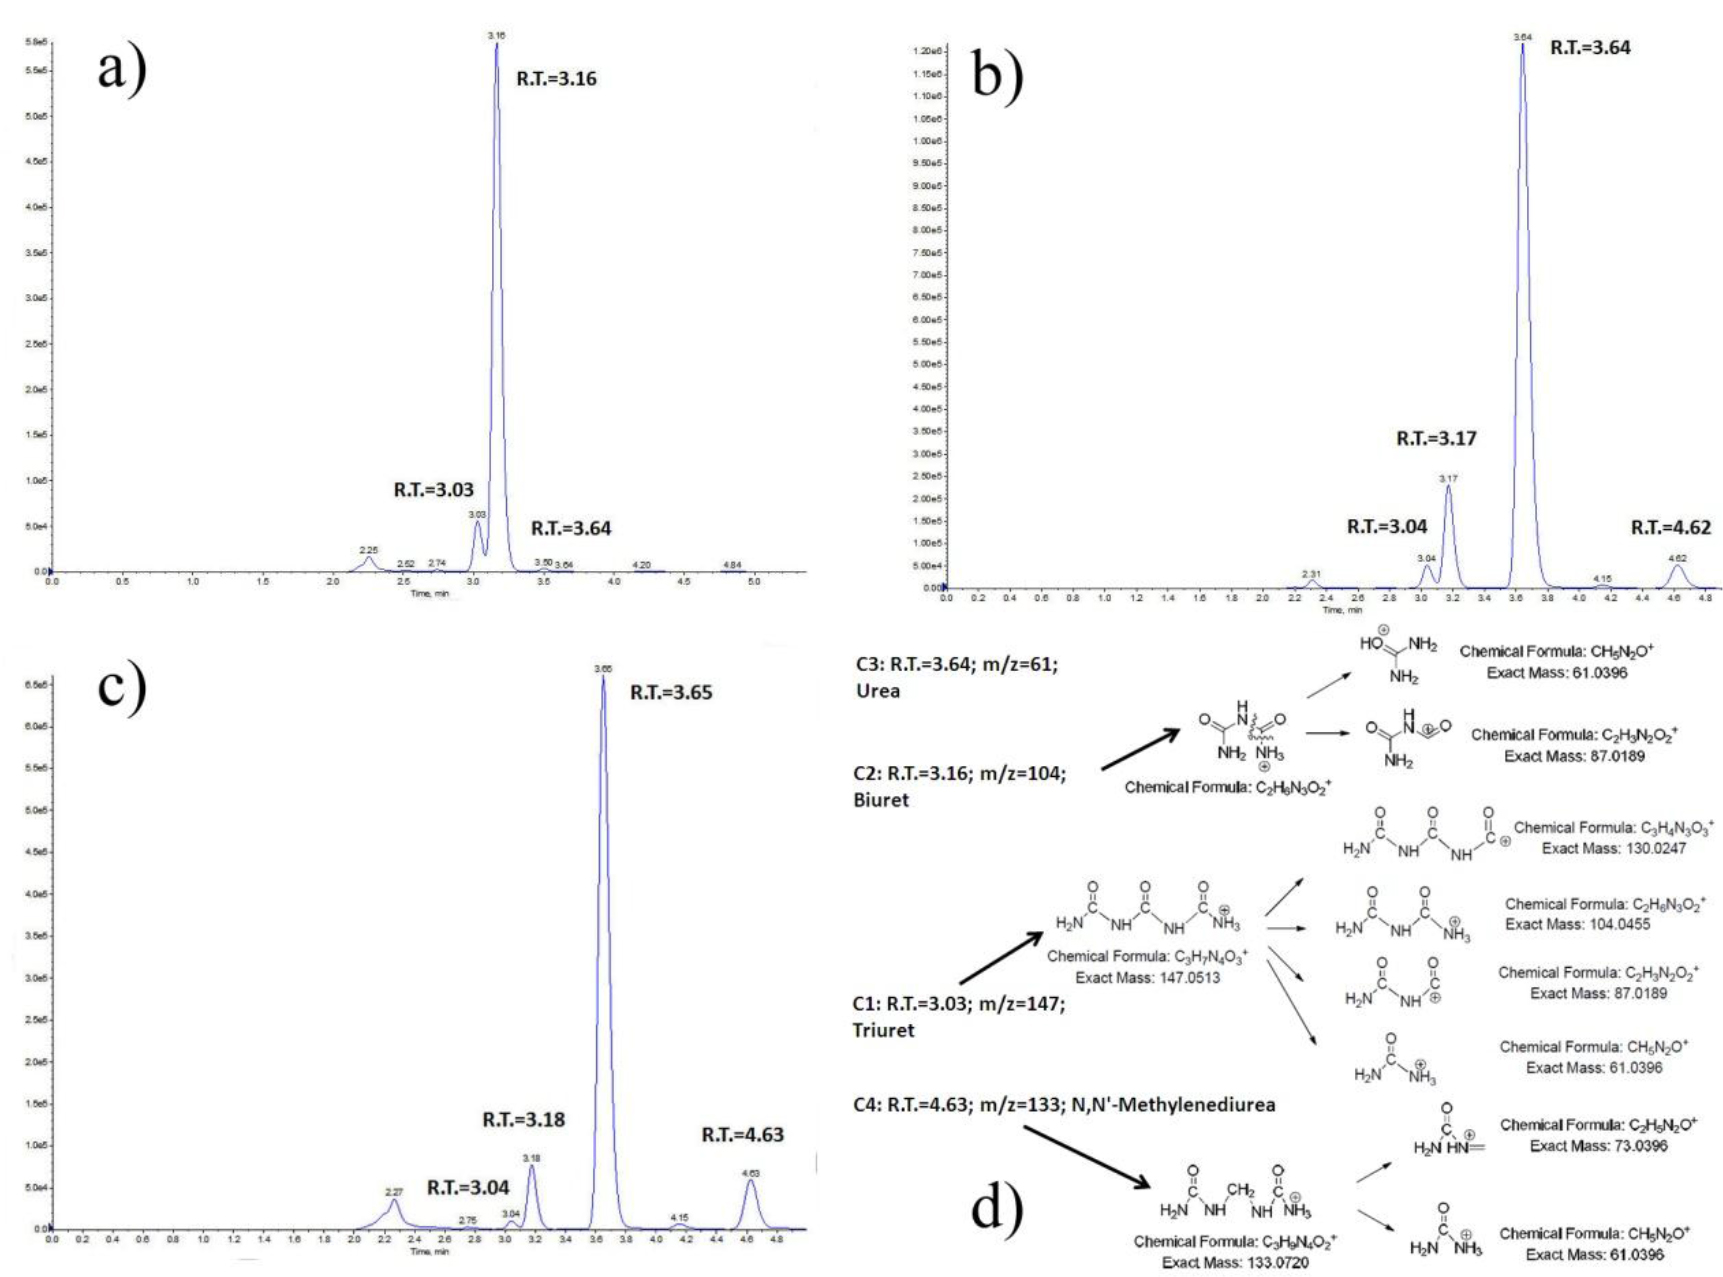
LC-MS/MS was introduced to analyze biuret reference material (> 97% from Alfa Aesar®) and some representative fertilizer samples, in order to verify the separation of biuret from many other compounds within various fertilizer matrices by the proposed method. Figure 2(a) depicted the LC-MS/MS quantitation ion chromatogram of biuret reference material; Figure 2(b) shows the chromatogram of sample #SLV-054 (Urea); Figure 2(c) is the chromatogram of sample #SLV-114 (Compound Fertilizer); and Figure 2(d) shows the proposed target compounds and their fragmentation pattern under positive ion ESI mode, corresponding to all the significant peaks found in quantitation ion chromatograms. Compound C1 with the retention time of 3.03~3.04 min corresponding to the protonated molecular ions [M+H]+ at m/z 147.0 was identified as triuret (C3H7N4O3+), which was also served as the precursor ion for fragments with [M+H]+ at m/z 130 (C3H7N3O3+), 104 (C2H6N3O2+), 87 (C2H3N2O2+) and 61 (CH5N2O+) in the tandem MS/MS. Compound C2 with the retention time of 3.16~3.18 min corresponding to the protonated molecular ions [M+H]+ at m/z 104.0 could be identified as the target biuret (C2H6N3O2+), which was also served as the precursor ion for fragments with [M+H]+ at m/z 87 (C2H3N2O2+) and 61 (CH5N2O+) in the tandem MS/MS. Compound C3 with the retention time of 3.64~3.65 min corresponding to the protonated molecular ions [M+H]+ at m/z 61 could be identified as urea, which has the strongest ion peak in chromatogram 2(a) in which the urea was the dominant component. Particularly since urea’s lone transition is the rather non-specific loss of ammonia (NH3) and due to its low molecular weight, urea formed no structurally significant ion by LC–MS/MS during our analysis. Compound C4 with the retention time of 4.62~4.63 min corresponding to the protonated molecular ions [M+H]+ at m/z 133.0 was identified as N,N’-methylenediurea (C3H9N4O2+), which was also served as the precursor ion for fragments with [M+H]+ at m/z 73 (C2H5N2O+) and 61 (CH5N2O+) in the tandem MS/MS.

JPPR 19 - 120_Michael M. Hojjatie_F2

Figure 2. LC-MS/MS quantitation ion chromatograms for potential compounds in biuret reference material and fertilizer samples

The LC-MS/MS result has shown that the propylamine (NH2) column utilized in our proposed method can successfully separate biuret form its analogues such as urea, triuret and N,N’-methylenediurea, thus indicated its possibility to be further extend to determine those aforementioned contaminants individually or simultaneously in a separate study.

C. Accuracy and Method Applicability

The accuracy of the proposed method was validated by the recovery rate test running for one urea and two kinds of compound fertilizers. In a typical procedure, a certain amount of biuret working standard solution with the concentrations of 60 mg/kg, 80 mg/kg and 100 mg/kg were spiked into the fertilizer sample, and then the test solutions were prepared and determined as described in the experimental section. The recovery rate was defined as the quotient of the recovery amount of the biuret divided by the amount of the biuret added. A summary of results tabulated in Table 3 below has shown that the spiked recoveries ranged from 98.14% to 107.24%, with a mean recovery of 102.24%.The recovery results met the requirement for standard method performances, in which the acceptable recovery limits for sample concentration around 100ppm (mg/kg) was given by 85%~110% [20].

Table 3. Recoveries for validation samples spiked with biuret

Serial number

Type of fertilizer

Spiking concentration (mg/kg)

Recovery (%)a

SLV-108

urea

60

98.14

SLV-108

urea

80

101.71

SLV-108

urea

100

103.50

SLV-125

compound fertilizer

60

101.46

SLV-125

compound fertilizer

80

100.22

SLV-125

compound fertilizer

100

103.51

SLV-114b

compound fertilizer

60

107.24

SLV-114b

compound fertilizer

80

104.86

SLV-114b

compound fertilizer

100

99.54

a. Average recovery = 102.24%.

b. In order to verify the method applicability, especially no interference from nitrate (common fertilizer component, with strong adsorption under 200 nm), an extra portion of 0.1g ammonium nitrate was added in validation sample SLV-114 during the recovery rate test.

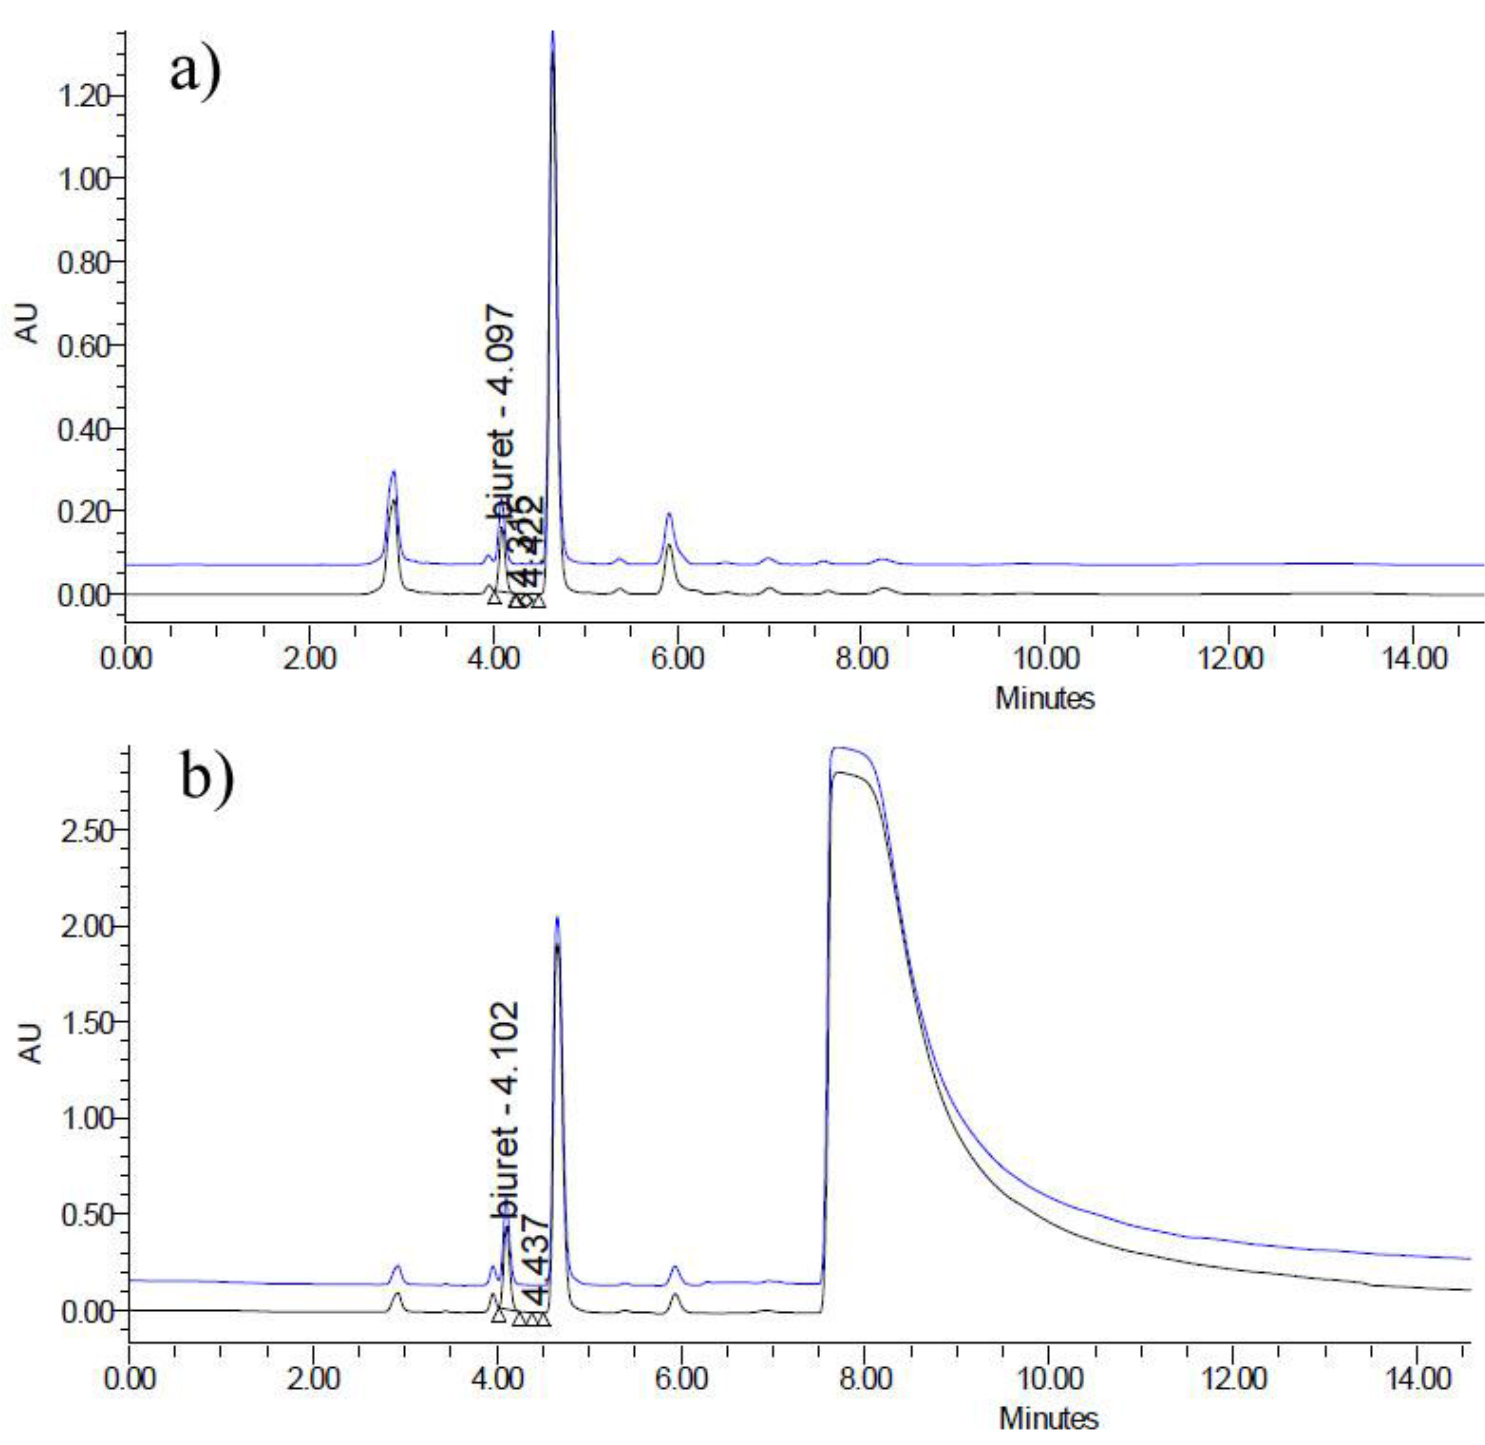
Method applicability has to be verified at a very early stage of method development, since many compounds existing in the fertilizer matrix would have peaks on the HPLC chromatogram and thus may interfere with the analysis of biuret. One sort of those compounds with great high concerning is nitrates, which usually are very common fertilizer components, with strong adsorption under 200 nm. C18 columns were proven to be not suitable to analyze those fertilizer containing nitrates, simply because they cannot separate nitrates from the target compound biuret. In order to verify the proposed method’s applicability, an extra portion of 0.1g ammonium nitrate was added in validation sample SLV-114 during the recovery rate test, with the detection wavelength at 195 nm.

Figure 3(a) depicts the HPLC chromatogram for validation sample SLV-114, and Figure 3(b) shows the HPLC chromatogram for validation sample SLV-114, spiked with 0.1g ammonium nitrate. The peaks with retention time of 4.1 min ca. in both chromatograms were identified as biuret; and the huge bump with retention time of 7.5~14 min ca. was attributed to the nitrate, and show a complete separation from the biuret and many other possible analogous compounds with potential interests.

JPPR 19 - 120_Michael M. Hojjatie_F3

Figure 3. a) HPLC chromatogram for validation sample SLV-114; b) HPLC chromatogram for validation sample SLV-114, spiked with 0.1g ammonium nitrate.

D. Precision

In order to verify the precision of the proposed method, namely, to illustrate the repeatability of the test results, 5 parallel tests on all the six Single-Laboratory Validation (SLV) materials were performed respectively. The Relative Standard Deviations (RSD%) were used to evaluate the results (Table 4) as follows:

Table 4. Precisions for validation samples

Serial number

Type of fertilizer

Results of 5 parallel tests (%)

Average test result of biuret (%)

Relative standard deviations (RSD, %)

SLV-054

urea

1.019; 1.063; 1.065; 1.062; 1.060

1.054

1.85

SLV-108

urea

0.621; 0.611; 0.610; 0.617; 0.612

0.614

0.76

SLV-003

compound fertilizer

0.085; 0.086; 0.087; 0.087; 0.085

0.086

1.10

SLV-125

compound fertilizer

0.949; 0.955; 0.967; 0.955; 0.950

0.955

0.75

SLV-012

compound fertilizer

0.540; 0.533; 0.530; 0.536; 0.535

0.535

0.69

SLV-114

compound fertilizer

0.334; 0.334; 0.333; 0.332; 0.320

0.331

1.81

According to the results from Table 4, all the RSDs of 5 parallel tests lie within the range of 0.69%~1.85%. The method precision results met the requirement for standard method performances, in which the acceptable RSD limits for sample concentration around 1% was given by 2% ca., thus implies that precision of the as-established method is quite convincible [20].

E. Collaborative Ring Test Results

As confirmed by the SLV test, the newly proposed HPLC method with propylamine column has shown a good separation of biuert from urea and other N-containing compounds in many urea-containing fertilizer matrices. The proposed method also has a relatively wide dynamic linear range, convincing accuracy as well as precision. A similar method with minor variation on the chromatographic column for the determination of biuret in water-soluble, urea based commercial inorganic fertilizer materials, urea solutions and surfur-coated urea by another SLV test has been reported [6]. Also, an acetonitrile-free HPLC method with C18 column as the alternative method does exist [23]. A collaborative round robin test was first conducted to compare these three methods. Through careful studies of the data obtained in the collaborative round robin test, the two methods using acetonitrile-water (85:15 ratio) mobile phase are capable of separating the biuret in all the urea-containing fertilizers samples under this study, but the method using C18 column with water as a mobile phase showed some limitations based on the types of fertilizer [17, 23]. Then, the proposed method with propylamine column is verified in an international Collaborative Ring Test (CRT) study organized by ISO/TC 134 “Fertilizers and Soil Conditioners”.

Seven samples, together with the SOP files were sent to 13 globally participating laboratories to ensure that all the participants could meet the identical method requirements and uniformity. The samples choices have shown a very diverse spectrum, from solid fertilizers to liquid fertilizers, from single fertilizer matrix to compound/complex fertilizers and from uncoated fertilizers to coated fertilizer, which including one NPK compound fertilizer (CRT-001), one urea formaldehyde complex fertilizer (CRT-002), one urea (CRT-003), one NPK complex fertilizer (CRT-004), one Urea Ammonium Nitrate (UAN) solution (CRT-005), one urea formaldehyde slow release liquid fertilizer (Trisert®) (CRT-006) and one Polymer Sulfur Coated Urea (PSCU) (CRT-007).

Statistical analysis of these results was carried out in accordance with procedures in related ISO standards on statistics [18], and also referred to the AOAC Guidelines for Standard Method Performance Requirements [20]. Basically, The Cochran’s tests and Grubbs’ tests [18, 21–22] were initially performed on the data collected to eliminate outliers. The mean level (m), the repeatability standard deviation (sr), the reproducibility standard deviation (sR) of this joint-proposed method were calculated and shown in Table 5 below.

Table 5. Mean level (m), repeatability standard deviation (sr), and reproducibility standard deviation (sR) of the joint-proposed method.

Sample

CRT-001

CRT-002

CRT-003

CRT-004

CRT-005

CRT-006

CRT-007

Number of valid data/outliers

13/0

13/0

12/1

13/0

12/1

13/0

12/1

Mean level of biuret , m% (mg/kg)

0.62

0.53

1.01

0.31

0.24

0.94

0.10

Repeatability standard deviation (sr)

1.03E-2

7.81E-3

8.84E-3

4.57E-3

3.14E-3

1.79E-2

1.43E-3

Reproducibility standard deviation (sR)

2.03E-2

3.53E-2

5.22E-2

2.29E-2

2.79E-2

6.18E-2

3.57E-2

An examination of the data in Table 5 above indicate that both the repeatability standard deviation (sr) and the reproducibility standard deviation (sR) tend to be irrelevant with the mean level of biuret (mg/kg). Thus, according to the ISO standards 5725 on statistics, the precision of the proposed method can be represented by the average values of sr and sR over different mean levels, and should be quoted, as a percentage by mass, as:

Repeatability standard deviation, sr = 7.71E–3(2)

Reproducibility standard deviation, sR= 3.66E–2 (3)

During the Collaborative Ring Test (CRT) studies, the method applicability and precision were further confirmed; moreover, some valuable comments from participating laboratories were received when the final results were submitted. Laboratory X reported that due to the delay of logistics they had used another amine column (GRACE Altima amino) instead, which led to a small variation on the retention time of biuret, but still attained a good separation. The committee still took their data into consideration since laboratory X’s data had passed through the entire statistical test. This led to a note that “Other HPLC conditions that can achieve the same separation effects may be used.” Laboratory Y reported that they have done a systematically research on the CRT-007 sample of Polymer Sulfur Coated Urea (PSCU) and had found that the biuret content determined has some relationship with the pre-treatment procedure of the sample, especially with the time of ultrasonic treatment during the dissolve process. The deduction was that the biuret content determined may vary due to the change of extraction percentage which linked to the pre-treatment procedure, and a detailed sample preparation procedure with respect to the time of ultrasonic treatment as precise as 10 minutes in the SOP as well as the draft international standard [17] is necessary. Overall, all the comments from the participating laboratories comments have helped to the further improvement of the proposed method.

Conclusion

A high performance liquid chromatography method for the determination of biuret content in fertilizers was developed for the ISO international standard 18643. A Single-Laboratory Validation (SLV) and systematically statistical analysis on the data obtained had proven that the proposed method was capable of effectively monitoring biuret content in a wide range of fertilizers. The reproducibility of the method was verified in the international Collaborative Ring Test (CRT) study organized by ISO/TC 134 “Fertilizers and Soil Conditioners”. On the basis of accuracy and precision of the results obtained in both SLV and CRT studies, it was conclude that the method is capable of measuring the amount of biuret present in the urea containing fertilizer accurately and with no interference from other urea or its adducts.

Acknowledgement

This work was supported by Research Project for Technology Standard (11DZ0502600, 13DZ0502600, Funded by Science and Technology Commission of Shanghai Municipality, China P. R.). We are indebted to President Mr. William L. Hall Jr. and Secretary Mrs. Mojdeh R. Tabari from ISO/TC134 for many kind help. We would thank Dr. Ruud van Belzen from Yara Sluidkil B. V. to share with their alternative acetonitrile-free HPLC method for a three-side (CHN-USA-NED) round robin test as a preliminary research and Dr. Chengyuan Cai from AB Sciex-China Pte. Ltd. for help on LC-MS/MS analysis.

JPPR 19 - 120_Michael M. Hojjatie_F4

References

  1. Morari F, VellidisG, Gay P (2011) Environment and human health effects: Fertilizers. In: J Nriagu (Ed), editor. Encyclopaedia of Environmental Health. Elsevier Science Publishers Pg No: 727–737.
  2. Foley JA, Ramankutty N, Brauman KA, Cassidy ES, Gerber JS, et al. (2011) D.P.M. Nature 478: 337–342.
  3. Hasan MM (1957) Biuret Phytotoxity. UCLA-Horticultural Science Publication, Los Angeles, CA.
  4. Mikkelsen R L (2007) Better Crops 91: 6–7.
  5. Redemann CE, Riesenfeld FC, Viola FS (1958) Ind. Eng. Chem 50: 633–636.
  6. Hojjatie MM, Abrams D (2014) J. AOAC Int 97: 712–720.
  7. Jones WW, (1954) Science 24: 499–500.
  8. Sanford WG, Gowing DP, Young HY, Leeper RW (1954) Science 27: 349–350.
  9. Slater JV (Ed) (2014) AAPFCO Official Publication No. 67, Laws and Regulations.
  10. Fertilizers – Spectrophotometric determination of biuret in urea. EN 15479:2009.
  11. Determination of biuret content for compound fertilizers (complex fertilizers). GB 22924–2008.
  12. Determination of urea-Part 2: Biuret content -Spectrophotometric method. GB 2441.2–2010.
  13. AOAC Official Method 960.04. Biuret in fertilizers-Spectrophotometric method.
  14. AOAC Official Method 976.01. Biuret in fertilizers-Atomic absorption spectrophotometric method.
  15. Thomas PM, Ernest RA, Robert GH, Robert CH (1982) Anal. Chem 54: 1504–1507.
  16. ISO/TC 134 Business Plan (2012) Pg No: 1–2.
  17. Fertilizers and soil conditioners – Determination of biuret content of urea-based fertilizers – HPLC method. ISO DIS 18643.
  18. Accuracy (trueness and precision) of measurement methods and results-Parts 2: Basic method for the determination of repeatability and reproducibility of a standard measurement method. ISO 5725–2:1994.
  19. Strulei CA, Averell PR (1970) The Analytical Chemistry of Nitrogen and Its Compounds. Wley-Interscience New York, Part 2, Chapter 11.
  20. Official Methods of Analysis of AOAC International, 19th Edition (2012) Appendix F: Guidelines for Standard Method Performance Requirements.
  21. Grubbs FE (1969) Technometrics 11: 1–21.
  22. Grubbs FE, Beck G (1972) Technometrics 14: 847–854.
  23. R. van Belzen et al. (2014) Unpublished results on the HPLC method for determination of biuret in fertilizers.

Occupational Performance of Children and Adolescents with Mucopolysaccharidosis Using Assistive Technologies

DOI: 10.31038/IMROJ.2019421

Abstract

Mucopolysaccharidoses (MPS) are a specific group of genetic diseases in which due to the accumulation of glycosaminoglycans (GAGs) in different organs and tissues, causes multisystemic changes that compromise the functionality and occupational performance of individuals. Occupational performance, understood as the participation and execution of activities of daily living, may be favoured using Assistive Technology (AT). Since there are no studies reporting the influence of AT on the occupational performance of children and adolescents with MPS, the objective of this study was to evaluate the occupational performance in self-care activities, based on the use of low-cost AT in children and adolescents with Mucopolysaccharidosis. Six individuals with MPS types I, IV-A and VI, aged 9 to 16 years participated. The instruments used for data collection were the Pediatric Disability Assessment Inventory (PEDI) – self-care area only, and the Canadian Occupational Performance Measure (COPM). The results showed that the tasks that presented the greatest disabilities in the performance are the areas of dressing, personal hygiene and bath. Thus, TA resources were made for five activities related to dressing and one for personal hygiene. After the use of AT, there was a positive and significant change in occupational performance and satisfaction of these individuals. Thus, the use of AT can significantly improve the occupational performance of this population.

Keywords

Adolescent, Assistive Technology, Child, Mucopolysaccharidosis, Occupational Performance, Self-Care Activities

Introduction

Mucopolysaccharidoses (MPS) are rare diseases, characterized by genetically determined metabolic errors, which are part of the Lysosomal Deposit Disease group. In these diseases there is accumulation of substrates that are normally degraded in lysosomes, and in MPS, deficiencies of specific enzymes lead to the accumulation of glycosaminoglycans (GAGs), resulting in a series of signs and symptoms, which together bring systemic impairment [1–3]. There is no cure for this group of diseases, and the current treatment is aimed at delaying its progress. Even with treatments, progression is nonetheless long-term, and changes in body structures and functions (joint stiffness, decreased range of motion, joint laxity, claw hand) result in limited functionality in the areas of occupational performance, especially in self-care tasks – related to dressing, personal hygiene and food [4].

Occupational performance is understood as the ability to perform routines and perform roles and tasks, involving the areas of self-care, productivity and leisure, being influenced by the factors of the individual, their skills and the context in which they are inserted [5]. Thus, for individuals with some form of physical limitation, occupational therapists may use Assistive Technology (AT) as an effort to enable improved independence and occupational performance, to the extent that limitations can be overcome through adaptations and use of ATs.

Assistive Technology allows a person with a limitation to perform activities and tasks more independently, and can be characterized as technology of high complexity (high cost – with electronic components) or low complexity (low cost), the latter being designed from everyday easily accessible materials that can often be made from materials available at home, in the office, at school or in the hospital. This type of AT is something that can be done right away to meet the needs of those who need it, with the resources at hand [7–9]. However, there are no studies linking the use of AT and MPS. Thus, this study aims to evaluate occupational performance in self-care activities, based on the use of low-cost assistive technology in children and adolescents with Mucopolysaccharidoses.

Methods

This is a prospective and descriptive longitudinal quantitative research, conducted at the outpatient infusion and enzyme replacement therapy center of a reference Hospital for the treatment of rare diseases, located in Rio de Janeiro – Brazil. Participated in the study: Six children and adolescents of both sexes between 9 years and 6 months and 16 years and 4 months of age, with type I, IV-A and VI MPS, with biochemical diagnosis of MPS that are treated with enzyme replacement in the institution’s medical genetics department. Were excluded from this research: Individuals with type III MPS because of neurological impairment; children and adolescents who had severe cognitive and / or motor impairment that prevented them from responding to assessments; and children and adolescents who reached the maximum PEDI score. For data collection, the Pediatric Disability Assessment Inventory – PEDI was used, only Part I – Child Abilities, which reports on the child’s functional abilities to perform daily activities and tasks and on the self-care scale [10] and, then, the Canadian Occupational Performance Measure – COPM was applied.

The PEDI was applied through a structured interview with children and adolescents, lasting on average 30 to 40 minutes, where it was identified if individuals can perform certain activities. The COPM was administered in around 10–15 minutes, with participants identifying issues related to their occupational performance related to the activities contained in PEDI. They chose the activities that were meaningful to them, quantifying the degree of satisfaction and importance they attributed to each of the activities. At the end of the application of the instruments, it was made a survey from the chosen activities (the activity that obtained the highest importance score in the COPM) and the possible assistive technology resources to be incorporated in the intervention process of the activity that gained the most quantification, by the participants, including from creating and building a low-cost TA resource to providing guidance to follow during activities performance. With the AT done, its use was trained with the participants and the responsible person accompanying them by the main researcher and after the participant’s minimum 2 weeks of AT use, the COPM was reapplied to assess if there were changes in occupational performance with the aid of the AT. This reapplication was made by a blinded evaluator who had no prior knowledge of previous results.

The COPM was created as an outcome measure, therefore, the total scores of the initial moment and the moment of re-evaluation were used with the objective of comparing the occurrence or not of changes in occupational performance and satisfaction, so it could be proved the effectiveness of an approach or intervention – in this case, the use of Assistive Technology. These changes were calculated by subtracting the evaluation values from the re-evaluation values, both for performance and satisfaction. The participants’ scores were not compared with each other, as COPM is an individual measure. With the completion of research data collection, the assistive technology resource made and/or adapted for each participant remained the same for continuous use. This study is part of a project approved by the Research Ethics Committee of the research site, under the number 1.827.932, valid until 31/10/2021, complying with the ethical principles in accordance with resolution 466/2012, and all participants were informed about the study, objectives, benefits and risks.

Results

From PEDI results we observed impacts on occupational performance, which consequently affects the ability to perform self-care tasks, especially in dressing, personal hygiene and bathing activities, as can be seen in Table 1. The changes in self-care activities observed from PEDI, participants chose the activities that were most significant through COPM, adding a value about it, to quantify its importance in performing it on a daily basis or wanting to execute it. Table 2 shows the chosen activities, the degree of importance and the AT made. It is noted that the activities varied, related to dressing or personal hygiene.

Table 1. Affected items grouped by tasks performed in PEDI self-care.

Participant

ITEMS AFFECTED

Feeding (14)*

Personal hygiene (14)*

Bathing (10)*

Dressing (20)*

Toilet use (5)*

Sphincter control (10)*

1

12

2

2

2

5

2

3

2

2

1

12

1

4

5

11

5

4

9

6

2

4

3

12

2

*:  Number of items contained in each self-care task according to PEDI.

Table 2. Description of activities, importance given by participants – COPM and AT made

Participant

MPS

Activities chosen at COPM

Grau de importância

AT

1

II

Put on socks

9

Sock on Applicator

2

IV-A

Brush hair

9

Hair brush with L-form

3

IV-A

Remove socks

8

Stretch cable to remove socks

4

VI

Put on socks

10

Sock on Applicator

5

VI

Wear lower end (buttoning and zipper handling)

9

Buttoning

6

VI

Dress upper and lower extremity (buttoning and zipper handling)

8

Buttoning

After making and training the ATs, Table 3 presents the changes in occupational performance and satisfaction in performing the selected tasks. The improvement of these two parameters was observed throughout the sample. However, it was observed that it was not possible to infer changes in two cases (participant 4 and participant 6), because they did not use the AT after training: participant 4 started training at home, but didn’t feel willing to keep using the AT, preferring that his mother did the activity for him; and participant 6, did not use, because he did not wear clothes that have button or zipper at home, only using to go out and preferring that his mother performed the activity.

Table 3. Importance / Performance / Satisfaction Relationship – Before and after the application of AT and observed changes

Participant/ MPS

Activity

Importance

Initial Evaluation

Revaluation

Change

Performance 1

Satisfaction 1

Performance  2

Satisfaction  2

Performance

Satisfaction

1 (type II)

Put on socks

9

2

2

5

8

3

6

2 (type  IV)

Brush hair

9

5

3

10

10

5

7

3 (type  IV)

Remove socks

8

2

4

4

7

2

3

4 (type  VI)

Put on socks

10

1

5

*

*

*

*

5 (type  VI)

buttoning and zipper handling

9

2

5

10

10

8

5

6 (type VI)

buttoning and zipper handling

8

3

5

*

*

*

*

Note: *: Data were not obtained as the participant reported not using the AT

Discussion

Children and adolescents with MPS, the limitation of mobility caused by the accumulation of glycosaminoglycans in tissues and joints, causes a loss in the ability to perform occupational activities, especially related to activities of daily living (ADLs), especially those requiring fine movements (eg: buttoning) or of large amplitudes (brush hair) [11–15]. It is widely discussed in the literature that progressive musculoskeletal impairment, found regardless of the type of MPS, impacts occupational performance. Studies show that joint stiffness, common in MPS, and even MPS IV-A-specific ligament laxity and muscle weakness, as well as carpal tunnel syndrome and Dupuytren’s contractures, all contribute to important limitation in self-care activities such as eating, dressing and personal hygiene [14, 16,17,18]. From the knowledge of body structure and function deficiencies related to self-care activities, it is possible to establish intervention priorities and select better strategies to be used, in order to enhance occupational performance. Among the intervention strategies, AT is a possibility of occupational therapist resource for the promotion of functionality [10].

Although the entire sample showed impairment in the area of dressing, the choices of tasks for making the AT were diverse and did not show a pattern by MPS type. This is because each individual sees itself in a way, and different activities may be a priority for one but not to the other. The activities that a person chooses to engage in are full of meaning and purpose and are related to their roles and how they relate to the world/environment [19], and therefore each individual attaches meaning and importance to each task of your day to day, like doing one activity is more important than performing another. With the application of COPM, besides allowing the choices of self-care activities that are significant for individuals, it was possible to measure the importance of the activity and quantify its performance and satisfaction. This is because according to the COPM theory was developed occupational performance is viewed as a subjective individual experience [20].

As much as it is not possible to make inferences between participants and their scores, it is possible to say that in the initial assessment of occupational performance, the average among participants was 2.5 points and in the revaluation, an improvement of the results was observed with an average of 7,25 points (minimum value of 4 and maximum of 10) There was also some improvement in the performance rate of activities, in the initial rating the group average was 4 (minimum 2 and maximum of 5) and in the revaluation the average value was 8.75 points (minimum 7 and maximum of 10). According to Carswell (2004), the variation found from 2 or more points in the COPM can be considered a clinically significant intervention [21]. That said, there was an improvement in the occupational performance of individuals with MPS, based on assistive technology, thus seeking to increase the independence of these individuals.

With these changes presented in a significant way,  it is possible to suggest that the higher the performance in performing self-care activities, the better the satisfaction in performing it, as seen in the work of Mildner et al., 2017, where the use of AT was described as significant in another health condition [22]. According to Persson et al. (2014) changes in occupational performance are associated with changes in psychosocial functioning and psychological well-being of individuals [23]. Regarding the non-use or abandonment of AT devices by users (occurred with two participants), Costa and collaborators (2015) conducted a literature review on the reasons that led individuals to abandon their resources. The most quoted factors were: problems with the user’s physical state; lack of information and training from both professionals and users; pain; functional limitations; preference for another resource or use of remaining capacities [24]. Among the factors mentioned, only the “preference of using remaining capacities” was found in this paper. In addition to this factor it was also quoted “lack of user motivation” and “lack of device functionality”.

Regarding AT, social acceptance is an important variable that permeates the decision of the user or his family to use the resource, because even if a certain resource improves the quality of life and occupational performance, but represents a negative social connotation and stigmatizing, the user tends to abandon it. If there is no support or encouragement from family members or if the device is viewed as a validation of being sick/being different (by the individual or family members) the chances of abandonment may be high [24–26].

Conclusion

AT has become an importante occupation therapeutic resource for children and adolescentes with problems in performing activities of daily living, such as MPS, increasing their autonomy and personal satisfaction. Thus, we highlight the importance of investing in future research in AT field focusing on occupational performance, especially self-care of individuals with MPS to then guide the intervention and occupational therapeutic care.

References

  1. Guarany NR, Schwartz IVD, Guarany FC, Giugliani R (2012) Functional capacity evaluation of patients with Mucopolysaccharidosis. J Pediatr Rehabil Med  1: 37–49.
  2. Nussbaum RL, Mcinnes RR, Willard HF (2008) Thompson e Thompson Genética médica, 7º edição. Saunders, Elsevier.
  3. Schwart, IVD, Boy R (2011) As doenças lisossômicas e tratamento das mucopolissacaridoses. Rev do Hosp Univ Ped Ernest 2.
  4. Silva MCA, Horovitz DDG, Ribeiro CTM (2015) Desempenho ocupacional de crianças e adolescentes com mucopolissacaridose de uma instituição de saúde do município do Rio de Janeiro [dissertação de mestrado]. Rio de Janeiro.
  5. Magalhães LC, Magalhães LV, Cardoso, AA (2009) Medida Canadense de Desempenho Ocupacional – COPM. Belo Horizonte: Editora UFMG.
  6. Barata-Assad DA, Elui VMC (2010) Limitações no desempenho ocupacional de indivíduos portadores de hemofilia em centro regional de hemoterapia de Ribeiro Preto, Brasil. Rev. Ter. Ocup. São Paulo 3: 198–206.
  7. Anson D. (2004) Tecnologia assistiva. In: Pedretti LW, Early MB. Terapia Ocupacional: Capacidades práticas para as disfunções físicas. Quinta edição. São Paulo: Roca P. 276–296
  8. Rodrigues AC (2008) Reabilitação: Tecnologia Assistiva. In: Rodrigues, AC. Reabilitação. Práticas inclusivas e estratégias para a ação.  São Paulo: Livraria e Editora Andreoli p. 39–41.
  9. Sfredo Y, Silva RCR. (2013) Terapia Ocupacional e o uso de tecnologia assistiva como recurso terapêutico na artrogripose. Cad Ter Ocup. UFSCar 3: 479 – 491.
  10. Mancini, MC (2005) Inventário de Avaliação Pediátrica de Incapacidade (PEDI): Manual da versão brasileira adaptada. Belo Horizonte; UFMG.
  11. Rocha JSM, Bonorandi AD, Oliveira LS, Silva MNS, Silva, VF (2012) Avaliação do desempenho motor em crianças com mucopolissacaridose II. Cad Ter Ocup UFSCar 2012 20(3): 403–12.
  12. Amaral IABS, Filho RLO; Neto JAR, Reis MCS. Avaliação da capacidade funcional de adolescentes portadores de Mucopolissacaridose do tipo II. Cad Bras Ter Ocup, São Carlos. 2017; 25(2): 297–303.
  13. Schwart, IVD; Boy, R. (2011) Às doenças lisossômicas e tratamento das mucopolissacaridoses. Rev do Hosp Univ Ped Ernest 2.
  14. Santos AC, Azevedo ACMM, Fagondes S, Burin MG, Giugliani R, Schwartz IVD (2008) Mucopolysaccharidosis type VI (Maroteaux-Lamy syndrome): assessment of joint mobility and grip and pinch strength. Jorn de Ped 2: 130–5.
  15. Pinto LLC, Schwartz IVD, Puga ACS, Vieira TA, Munoz MVR, Giugliani R, et al. (2006) Prospective study of 11 Brazilian patients with mucopolysaccharidosis II. Jornal de Ped 4: 273–8
  16. Vieira TA, Giugliani R, Schwartz I (2007) História natural das mucopolissacaridoses: Uma investigação da trajetória dos pacientes desde o nascimento até o diagnóstico. [dissertação de mestrado] [online]. Universidade Federal do Rio Grande do Sul, Porto Alegre.
  17. Viapina M, Burin MG, Wilke M, Schwartz IVD (2011) Síndrome de Morquio – Mucopolissacaridose IV-A. Serviço de Genética Médica – Hospital de Clínicas de Porto Alegre.
  18. Azevedo ACMM, Giugliani R (2004) Estudo clínico e bioquímico de 28 pacientes com MPS tipo VI. [Dissertação de mestrado]. Universidade Federal do Rio Grande do Sul; Porto Alegre.
  19. Pelosi, MB (2009) Tecnologias em comunicação alternativa sob o enfoque da terapia ocupacional. In: Deliberato D.; Gonçalves MJ; Macedo EC (Org.). Comunicação alternativa: teoria, prática, tecnologias e pesquisa. São Paulo: Memnon Edições Científicasp 163–173.
  20. Andolfato C, Mariotti MC (2009) Avaliação do paciente em hemodiálise por meio da medida canadense de desempenho ocupacional. Rev Ter Ocup Univ São Paulo 1: 1–7.
  21. Carswell A, Mccoll MA, Baptiste S, Law M, Polatajko HL, Pollock N (2004) The Canadian occupational performance measure: a research and clinical literature review. Can Jour Occup Ther 4: 210–222.
  22. Mildner AR, Ponte AS, Pommerehn J, Estivalet KM, Duarte BSL, Delboni MCC. Desempenho ocupacional de pessoas hemiplégicas pós-avc a partir do uso de tecnologias assistivas.
  23. Persson E (2014) Occupational performance and factors associated with outcomes in patients participating in a musculoskeletal pain rehabilitation programme. J Rehabil Med. Uppsala 46: 546–552.
  24. Costa CR, Ferreira FMRM, Bortolus MV, Carvalho MGR (2015) Dispositivos de tecnologia assistiva: fatores relacionados ao abandono. Cad. Ter. Ocup. UFSCar, São Carlos 3: 611–624.
  25. Kruger, JM; Ferreira, AR (2013) Aplicação da Tecnologia Assistiva para o desenvolvimento de uma classe ajustável para cadeirantes. Iberoamerican Journal of Industrial Engineering. Florianópolis 9: 43–69.
  26. Zelia ZLC, Bittencourt DC, Cheraid RC, Montilha, Elisabete RF (2016) Expectativas quanto ao uso de tecnologia assistiva. Journal of Research in Special Educational Needs 1: 492–496

Macro Elements and Their Concentrations in the Blood Serum and Feed

DOI: 10.31038/IJVB.2019322

Abstract

Within three years was analyzed mineral content (Ca, Mg) in feed and blood serum of dairy cows. Samples of serum and TMR – total mixed ratio, were from dairy farms (n = 24) from different regions of Slovakia. In samples was determined average levels of the calcium (Ca) and the magnesium (Mg) according to the methodology used by the Official lists methods and laboratory diagnosis of food and feed. The significant increase (P≤.0.05) of serum Ca level was found in cows in before calving in the B period and the statistical increase (P≤.0.05) of the serum Ca level were recorded in dairy cows in after calving in period C with comparison to the dairy cows in period A. In the period top lactation in the period B was observed decrease the serum Ca (33.8%) and in in the period C was decrease only 17.64%. In the period antepartum and postpartum was a decrease the serum Ca between from 20.75 to 31.90%. The serum magnesium in the period antepartum in the period B were decrease 38.03 % and 8 % decrease the serum Mg was in the period C – top lactation. Calcium and magnesium contens in TMR for dairy cows in production phases were in the range declared by the NRC (2001).

Key words

Atomic Absortion Spectrometer-AAS, Blood Serum, Calcium, Cows, Feed-TMR Total Mixed Ration For Dairy Cows, Mangnesium

Introduction

The amount of minerals in feed varies within a very wide range depending on ecological conditions, the composition of crops, the content of access nutrients in the soil, and the intensity of fertilization. The use of minerals from feed can be altered by the combination of feeds, but also by the intensity and the way of grass fertilization and the different representation of grasses, clover and herbs [1,2]. Mineral elements have crucial role in animal production and health. Minerals, in the form of chemical compounds, are naturally available through geological processes in the form of simple salts to very complex silicates [3]. Minerals are grouped into macrominerals, i.e. calcium (Ca), magnesium (Mg), sodium (Na), potassium (K), and phosphor (P), and microminerals, i.e. iron (Fe), copper (Cu), zinc (Zn), copper (Co), and manganese (Mn) [4]. Minerals have a special role in ensuring efficient growth, reproduction and immunocompetence in animals. Macrominerals are required in the development of bones and teeth and are also found in lipids, proteins, muscle, and tissue, while microminerals have a great impact on animal’s reproductive physiology and its imbalance causes various problems leading to lower reproductive efficiency. Mineral level can also be used for rapid and accurate in-vivo classification of cattle according to organic and non-organic production type [5]. The dairy cow experiences most physiological stress during the transition period when it moves from the demands of fetal growth through to calving, colostrum production and, eventually, maximal milk production. In addition to these drains on the animal’s physical resources, the cow must be in a suitable physiological state to ensure repair of any tissue damaged during calving, and to maintain resistance to disease challenges [6]. For high-quality control of health and nutrition status it is therefore necessary to gain detailed information about the changes in the internal environment during the individual stages of the productive life of animals [7]. Determination of indicators of the metabolic profile in course of the breeding season helps to diagnose the metabolic problems of the animals [8]. Cows’ nutrition and feed technology belong to the external factors that affect their production. TMR – total mixwed ration (mixed feed) is considered to be the optimal way to provide a balanced amount of nutrients for dairy cows. It is a feeding system for dairy cows, the essence of which consists in the combination of bulk fodder, grain, protein, minerals, vitamins and various additives [9]. Of the voluminous feed, the lucerne, clover and hay are rich in calcium. The most calcium-containing silage contains clover and lucerne silage. The opposite value shows corn silage in which the calcium value is seven times lower. The magnesium content in feed plants depends on the magnesium content of the soil, the soil pH and the fertilizer application method [10]. When feeding dairy cows, the requirements of dairy cows must be taken into account, especially during the breeding cycle [11]. The aim of our work is to monitor the occurrence of calcium and magnesium in TMR and in the blood serum of dairy cows.

Materials and Methods

Within three years (first year A, second year B, third year C), the calcium (Ca) and magnesium (Mg) content of the blood serum of dairy cows and TMR were monitored. Feed samples – TMR and blood serum came from Slovak breeds of production dairy cows (n = 24). Samples of TMR (A – n = 30; B – n = 36; C – n = 36) and blood serum (A – n = 180; B – n = 216; C – n = 216) 21 days before calving, – 21 days after calving and at the peak of lactation. For the determination of mineral substances in samples of plant and biological material, the methodology used in the List of Official Methods and Laboratory Diagnostics of Food and Feed [11] was used.

Blood samples were collected in the morning via the jugular vein. After proper clotting, the blood samples were centrifuged at 3500 rpm for 15 minutes and the serum samples were stored at -20°C until analyses. Before measuring, serum samples were deproteinized by supplementing trichloracetic acid at a 1:1 ratio. After centrifugation, the content of Ca and Mg in the supernatant was measured directly by using the flame method of an atomic absorption spectrometer (Unicam Solar, 939, Great Britain). Feed samples were processed by digestion in the microwave oven (MLS-1200 Mega, Milestone) by using 5 mL HNO3 and 1 mL HCl per 1 g of sample. The program of digestion was as follow: 1st step-250 W, 2 minutes; 2nd step-0W, 2 minutes; 3rd step-250W, 5 minutes; 4th step-400 W, 5 minutes; 5th step-500 W, 5 minutes; and 6th step-600W, 2 minutes. The digested samples of feeders were analyzed for the presence of Cu and Zn by using the flame method of an atomic absorption spectrometer (Unicam Solar, 939, Great Britain). The flame conditions were those recommended by the instrument manufacturer for Ca and Mg (wavelength 422.7 and 285.2, respectively, band pass 0.5 nm). The content of Cu and Zn in forage and blood were determined according to the methodology used by the Official lists methods and laboratory diagnosis of food and feed.

Statistical Analysis

The statistical evaluation of the results has been done by the program of microsoft Excel 7.0, using Student’s ttest at (P≤0.05) and (P≤0.01) level of significance. For the calulation of means, values below the detection limits were set to zero. We compared the values from each of the three years A, B, and C and between the individual production phases.

Results and Discussion

Calcium and Magnesium In Feed

The observed amounts of calcium and magnesium in mixed feed – TMR samples over the reference period are summarized in Table 1. The mean contents of calcium in feed intended for dairy cows in before calving dairy cows in the periods A and B (5.49 ± 1.97, 6.00 ± 0.59 g / kg) were at tolerance values (4.00–6.00 g / kg ) reported by [12]. In the period C, the calcium content was slightly increased by 6.45 ± 2.69 g / kg. The decreased calcium content was recorded in the TMR after calving at each observation period (Table 1) and in the A period at the top of lactation (6.93 ± 1.16 g / kg) and in the period B (5.93 ± 1.34 g / kg) compared to [12]. In the period C in feed intended for dairy cows at the peak of lactation (7.47 ± 2.09 g / kg), the amount of calcium was tolerated. In feed, in the B period was found the significant increase (P≤0.01) of the contents of Mg for dairy cows feeding in before calving in compared to the dairy cows from the period A. In the period C, in the feed was recorded the statistical increase (P≤0.05) of contents Ca in dairy cows feeding in top of lactation with comparison to the dairy cows from period B. Compared to the values reported by [13] in the curve samples of TMR (before calving 7.69g / kg, after calving 8.88 g / kg and at the top of lactation 8.49g / kg), the values of calcium are lower. In India, [14] found average quantities of Ca 0.63% in mixed feeds for dairy cows that are similar to our findings. He pointed to a strong correlation between the calcium and magnesium content of the plants and the blood serum content of the dairy cows.

Table 1. The concentration of Ca and Mg in feed for dairy cows.

g/kg

Before calving

After calving

Top of lactation

 x ± s

 x ± s

x ± s

A

Ca

5.49 ± 1.97

6.52 ± 0.59

 6.93 ± 1.16

Mg

 3.17 ± 0.76

 3.62 ± 0.64

3.87 ± 1.17

B

Ca

 6.00 ± 0.59

6.75 ± 1.38

5.93 ± 1.34

Mg

4.12 ± 0.77 **

 4.07 ± 0.53

 4.10 ± 0.75

C

Ca

 6.45 ± 2.69

6.72 ± 2.9

7.47 ± 2.09 *

Mg

3.94 ± 1.49

 3.87 ± 1.41

 4.18 ± 0.62

x = mean concentrations; s = standard deviation; statistically significant * p≤ 0.05 ; ** p≤ 0.01.

Magnesium content in the TMR monitored was increased compared to NRC (2001). Increased amounts of magnesium were found in postpartum feed during periods A, B, and C (3.62 ± 0.64, 4.07 ± 0.53 and 3.87 ± 1.41 g / kg). In feed, in the B period was found the significant increase (P≤0.01) of the contents of Mg for dairy cows feeding in before calving in compared to the dairy cows from the period A. In India, low levels of magnesium (0.28% Mg) were found in mixed feed for dairy cows [14, 15]  reported low levels of calcium in feed, where the soil had an adequate amount of calcium, and the magnesium concentration in the soils was below the critical level, but the feed was higher.

Calcium and Magnesium In Blood Serum

The mean levels of serum calcium found in the dairy cows before calving, after calving and top of lactation over the reference period were within the reference values (2.25–3.00 mmol / l) (Table 2). The significant increase (P≤.0.05) of serum Ca level was found in cows in before calving in the B period in comapred to the cows in the period A. Similarly, the statistical increase (P≤.0.05) of serum Ca level were recorded in dairy cows in after calving in period C with comparison to the dairy cows in period A. In the A period of the group of dairy cows that were in before calving, individual mild reductions in serum calcium were 31.9%, and 30.9% after calving and 25.72% at the top of lactation. In period B, individual serum calcium reduction was observed in 28.16% of dairy cows before calving, 23.4% after calving, and 33.6% of dairy cows at the top of lactation. A slight decrease in serum calcium was also observed in C period in the individual production stages of dairy cows ranging from 17.64% to 24.07% of dairy cows. Plasma Ca concentrations are reduced in early postpartum cows, because of increased demand of Ca for synthesis of milk coupled with the relativelyslow response in up-regulating Ca absorption from the intestinal tract. The postpartum depression in plasma and ionized Ca is greater in older cows [16]. [16,17] reported the lower concentration in blood serum of Ca of dairy cows in the individual production phases in compared to our results.

Table 2. The concentration of Ca nad Mg in blood serum of dairy cows.

mmol/L


before calving

after calving

top of lactation

x ± s

 x ± s

 x ± s

A

Ca

2,21 ± 0.30

2.28 ± 0.31

2.35 ± 0.38

Mg

0.81 ± 0.08

0.78 ± 0.10

0.84 ± 0.13

B

Ca

2.39 ± 0.27 *

2.70 ± 0.72

2.41 ± 0.41

Mg

0.87 ± 0.28

0.80 ± 0.16

0.87 ± 0.19

C

Ca

2,42 ± 0,46

2,34 ± 0,4

2,40 ± 0,30

Mg

0,87 ± 0,14

0,88 ± 0,15 *

0,90 ± 0,10

x = mean concentrations; s = standard deviation; statistically significant * p≤ 0.05.

Similarly, mean serum magnesium levels in the reference period in dairy cows ranged within the reference values (0.74–1.23 mmol/l). We observed a decrease in serum magnesium in period A and B in individual production, before claving 35.2% and 38.03% , after calving 29.55% and 37.41%, top of lactation 22.72% and 19.12%, respectively. In period C, the reduction in serum magnesium over the reference values was lower than 8% for dairy cows in the individual production phases. The observed slight decrease in serum calcium in the production phases in some dairy cows in the studied holdings revealed hypocalcaemia. Hypokalaemia occurs with increased colostrum formation. Insufficient parathyroid hormone concentration and decreased receptor activity for calcium in the gut and bones is not enough to keep blood calcium levels within physiological limits. Concurrent changes in magnesium concentration and disruption of Ca / Mg ratios occur. Disturbance of the mutual relationships of minerals, especially calcium and magnesium, causes CNS disorders, circulatory and energetic metabolism [18, 19, 20]. Some papers present concentrations of biochemical parameters in the blood of cows at different stages of lactation; their comparison is limited as the values are determined by different methods. They have a different number of animals, with different genetic equipment and kept under different conditions [17, 18, 21].

Conclusion

In conclusion, at work we monitored calcium and magnesium content in feed and blood serum of dairy cows in selected breeds of d airy cows for three years. Mineral deficiency in dairy cows can be the primary cause of many metabolic and production disorders. This study revealed some differences in blood serum. Reduction of serum calcium in production phases in dairy cows, the initial stage of hypocalcaemia in dairy cows. By following the principles of differentiated feeding of dairy cows by production phases and by monitoring the levels of minerals in blood serum and feed, avoid metabolic and production disorders.

References

  1. Bulletin of the Ministry of Agriculture SR (2004) Listing the Official Methods of Laboratory Diagnostics of Food and Feed: 339.
  2. Galik B, Biro D, Juracek M, Simko M, Ulman I (2010). The effect of different silage additives on macroelement concentration in Alfalfa silage. Krmiva 52: 183–188.
  3. Khan Z I, Ahmed K, Ashraf M, Valeem E E, Javed I (2008) A comparative study on mineral status of blood plasma of small ruminants and Pastures in Punjab, Pakistan. Pak. J Bot 41: 67–72.
  4. Maradal A B, Yadav P S, Vanita K (2004) Mineral status of buffaloes under farm feeding condition of Faridabad district of Haryana state. Indian J Anim Nutr 21: 104–110.
  5. Rodriguez-Bermudez R, Herrero-Latorre C, Lopez-Alonso M, Losada DE, Iglesias R, et al. (2018) Organic cattle products: Authenticating production origin by analysis of serum mineral content. Food Chem 264: 210–217.
  6. Andrieu S (2008) Is there a role for organic trace element supplements in transition cow health? Vet J 176: 77–83.
  7. Cavestany D, Blanc J E, Kulcsar M, Uriarte G, Chilibroste P, Meikle A et al. (2005) Studies of the transition cow under a pasture-based milk production system: metabolic profiles. J Vet Med Series A-Physiology Pathology Clinical Medicine 52: 1–7.
  8. Verheyen A J N, Maes D G D, Mateusen B, Deprez P, Janssens G P J, De Lange L et al. (2007) Serum biochemical reference values for gestating and lactating cows. Vet J 174: 92–98.
  9. Robinson PH, Meyer D (2010) Total Mixed Ration (TMR) Sampling Protocol, California : UCANR Publications, 14.
  10. Biro D (2010) Feeding of ruminants (book). Nitra, Slovak republic: Publishing Slovak Agricultural University, 135.
  11. Tancin V (2013) Livestock farming in marginal areas (Slovak language), Nitra, The Slovak republic. Center for animal research, 70.
  12. NRC 2001: Nutrient Requirements of Dairy Cattle. 7th Rev. Ed. National Research Council. Nat. Acad. Sci., Washington, DC. USA.
  13. Skalicka M, Maskalova I, Vajda V (2010) Relationship nutritional levels and levels of mineral metabolism in peripartum dairy cows and the production phase. Proceedings Lazar days of nutrition and veterinary dietetics 9: 73–76.
  14. Kumaresan A, Bujarbaruah KM, Pathak KA, Brajendra, Ramesh T (2010) Soil-plant-animal continuum in relation to macro and micro mineral status of dairy catle in subtropical hill. Trop Anim Health Prod 42: 569–577.
  15. Ashraft MY, Khan A, Ashraft, Zafar S (2006) Studies on transfer of mineral nutrients from feed, water, soil and plants to buffaloes inder arid environments. J Arid Environ 65: 632–643.
  16. Filipejova T, Kovacik J, Kovacik A, Bulla J (2010) Mineral profile of dairy cows from blood plasma and urine. Animal Physiology 2010 : proceedings of international conference  89–91.
  17. Slosarkova S, Dulicek J, Fleischer P (2010) Concentration of selected blood biochemistry parameters in Holstein cows during important stages of lactation. Animal Physiology 2010: proceedings of international conference: 415–424.
  18. Illek J (2014) Metabolic profiles in cattle and their interpretation (Metabolicke profily u skotu a jejich interpretace Czech language). Proceedings of lectures XIV. Kongres Chamber of Veterinary Surgeons of the Slovak Republic, Jasna, Demänovska Valley, Slovakia 30: 99–100.
  19. Pavlata L, Pechova R, Dvorak R (2008) Diferencialni diagnostika syndromu ulehnuti u krav. (Differential diagnosis of cow’s bedding syndrome ) Veterinarstvi 58: 43–51.
  20. Dorszewski P, Grabowicz M, Mikolajczak J ( 2006) Usefulness of various biological additions for ensiling green fodder of alfalfa. Polish J Nat Sci 3: 45–52.
  21. Marenjak T S, Poljicak Milas N, Zdelar-Tuk M (2006) Auswirkungen von Fütterung und Klima auf Milchleistung und biochemiches Blut und Milchprofil. Tierarztl. 61: 357–362.

Nanoparticles could be a promising candidate for asthma therapy

DOI: 10.31038/NAMS.2019231

Nanomedicine and asthma

Nanotechnology has been fundamental for respiratory medicine for various reasons; like exhibiting novel approaches in treating respiratory diseases and its applications in cosmetics, consumer products and medications which are continuously rising as well as therapeutic vaccinations. Additionally, it is being developed commercially to bring the new approach to patients [1]. Over the years many efforts are done to adopt nanotechnology for the treatment of human respiratory diseases like chronic obstructive pulmonary disease (COPD) and asthma. Asthma is a widespread heterogeneous, complex disease which affects about 300 million people around the world. This chronic inflammatory disease is characterized by airway hyperreactivity, mucus hypersecretion in the airways, and recurrent obstructive respiratory events in response to asthma “triggers [2].

Initially, asthma studies were restricted to mice, but the technology is progressing to clinical experiments. A clinical trial using nanoparticles has uncovered some of the reasons of chronic lung diseases, as ways to prevent and treat these diseases.

These nanoparticles can act as carriers for different drugs because they are so tiny to reach nearly every area and part of the human organism. Drugs can also be tied to the nanoparticles by a plenty of different linkers such as molecules or by encapsulation, which leads to better control of toxicokinetics [1].

Immunotherapy in asthma

Recently, research of allergen-specific immunotherapy (AIT) with nanoparticles (NPs) provides an effective and safe way for the treatment of allergic diseases [3]. It has been proved that encapsulation of DNA vaccines or allergens into nanostructures may provide promising results for the treatment of allergic asthma compared to the conventional AIT with noncapsulated allergen extracts [3]. Moreover, the approval of cytokine-targeting therapy like anti-IgE antibody for the treatment of asthma helped to develop novel biologicals that target T-helper Th1/Th2 interleukins; (IL)-4, IL-5, IL-13, IL-17, and IL-23 and also the epithelium-derived cytokines; IL-25, IL-33, and thymic stromal lymphopoietin [2].

PEGylated and citrated gold nanoparticles (Au)

Because of their unique and physicochemical features and availability, gold nanoparticles were used in early nanotechnology applications and stayed a contemporary research theme, with both Aurimmune (Cyt-6091) and AuroShell based on gold nanoparticles [4]. Au nanoparticles have numerous features that are attractive for use in cancer therapy; they can bind many drugs and proteins and can be targeted to tumor cells. They are tiny enough to penetrate the body and accumulate in tumors to enhance permeability and retention (EPR) effect [5].

Moreover, Omlor et al. [6] reported in their ovalbumin-induced airway inflammation study that gold nanoparticles have anti-inflammatory effect. Dispersions of both polyethylene‐glycol‐coated (PEGylated) and citrate/tannic‐acid‐coated (citrated) gold nanoparticles were applied by intranasal route to asthma and control mice. Particularly citrated gold nanoparticles inhibited both airway hyperreactivity and inflammatory infiltrates. The results suggested that gold nanoparticle-based asthma drugs could have therapeutic potential [6].

A novel anti-IL4Rα nanoparticle; superparamagnetic iron oxide nanoparticles (SPION)

Among different drug nano-carriers, superparamagnetic iron oxide nanoparticles (SPIONs) have shown promising potential in the field of nanomedicine. SPIONs have the highest drug targeting efficiency among other drug carriers, since their external magnetic surface applied to the target organs promotes the accumulation of magnetic nanoscales in the drug site of action [7].

Moreover, they have been used in preclinical applications like magnetic resonance imaging (MRI), hyperthermia, immunoassays, cell tracking, and drug delivery [8]. When iron oxide nanoparticles enter the body, they have the ability to interact with biological compounds such as proteins and cells; leading to distribution of NPs into different organs and tissues [9].

Recently, many strategies aimed to block IL4Rα, the receptor for a key pro-inflammatory pathway. Halwani et al. [10] reported that PEGylated dextran SPION conjugated to anti-IL4Rα blocking antibodies (anti-IL4Rα NPs) efficiently suppressed lung inflammation in a mice model of asthma. Interestingly, exposure to these nanoparticles deactivated CD4 and CD8 T cells and inhibited their ability to produce pro-inflammatory cytokines in murine lung tissue. Moreover, the number of immune cells; lymphocytes, neutrophils and eosinophils were also reduced [10].

These findings suggested that biological molecules targeting IL4Rα might supply a novel therapeutic modality, mostly for patients suffering from uncontrolled, severe asthma [11] [12].

Hydroxybenzyl alcohol (HBA)-incorporated polyoxalate nanoparticles (HPOX)

p-Hydroxybenzyl alcohol (HBA) was defined as one of phenolic compounds in herbal agents and has an important role in protection against oxidative damage-relative pathologies due to its anti-inflammatory properties [13]. Yoo et al. reported a category of fully biodegradable hydroxybenzyl alcohol (HBA)-incorporated polyoxalate (HPOX) as a new therapeutics of airway inflammatory diseases [14].

This anti-asthmatic effect was shown in a mouse model by decreasing the expression of pro-inflammatory mediators like iNOS and IL-4 and the recruitment of inflammatory cells. Moreover, these nanoparticles showed high potent anti-inflammatory and antioxidant influences by decreasing the generation of oxidative stress, scavenging H2O2 and inhibition the expression of pro inflammatory cytokines such as IL-1β, inducible nitric oxide synthase (iNOS), and cyclooxygenase-2 (COX-2) in activated macrophages [14].

Due to their superior anti-inflammatory, antioxidant, and anti-asthmatic properties, HPOX nanoparticles could have a major potential as drug transporter and therapeutics for the handling of asthma and other airway inflammatory diseases like COPD [14].

Curcumin-solid lipid nanoparticles (curcumin-SLNs)

Curcumin has unique pharmacological properties including the anti-inflammatory effect, however, its fast metabolization and low bioavailability have restricted its usage [15]. In asthma experimental rat model, curcumin-SLNs effectively suppressed inflammatory cell infiltration and airway hyperresponsiveness and also prevented the production of Th2 cytokines, including IL-4 and IL-13 [15]. These findings suggest that curcumin-SLNs can be a potential candidate for the treatment of allergic diseases like asthma [15].

Conclusion

Asthma is a widespread, chronic inflammatory, heterogeneous, and obstructive pulmonary disease. Nanoscale based drug delivery systems can offer great potential for modern therapeutics. This work summarizes some nanoparticles that are likely to show pharmacological efficacy targeting airway inflammation.

Many promising nano based drugs are currently undergoing clinical trials to be used as novel therapies against diseases such as lung cancer, COPD, and pulmonary fibrosis.

References

  1. Omlor AJ, Nguyen J, Bals R, Dinh QT (2015) Nanotechnology in respiratory medicine. Respir Res 16: 64.
  2. Heck S, Nguyen J, Le DD, Bals R, Dinh QT (2015) Pharmacological Therapy of Bronchial Asthma: The Role of Biologicals. Int Arch Allergy Immunol 168: 241–252.
  3. Pohlit H, Bellinghausen I, Frey H, Saloga J (2017) Recent advances in the use of nanoparticles for allergen-specific immunotherapy. Allergy 72: 1461–1474.
  4. Khlebtsov N, Dykman L (2011) Biodistribution and toxicity of engineered gold nanoparticles: a review of in vitro and in vivo studies. Chem Soc Rev 40: 1647–1671.
  5. Jain S, Coulter JA, Butterworth KT, Hounsell AR, McMahon SJ, et al.(2014) Gold nanoparticle cellular uptake, toxicity and radiosensitisation in hypoxic conditions. Radiother Oncol 110: 342–347.
  6. Omlor AJ, Le DD, Schlicker J, Hannig M, Ewen R, Heck S, et al. (2017) Local Effects on Airway Inflammation and Systemic Uptake of 5 nm PEGylated and Citrated Gold Nanoparticles in Asthmatic Mice. Small.
  7. Laurent S, Saei AA, Behzadi S, Panahifar A, Mahmoudi M (2014) Superparamagnetic iron oxide nanoparticles for delivery of therapeutic agents: opportunities and challenges. Expert Opin Drug Deliv 11: 1449–1470.
  8. Dulinska-Litewka J, Lazarczyk A, Halubiec P, Szafranski O, Karnas K, Karewicz A (2019) Superparamagnetic Iron Oxide Nanoparticles-Current and Prospective Medical Applications. Materials (Basel) 12.
  9. Kim JS, Yoon TJ, Yu KN, Kim BG, Park SJ, Kim HW, et al. (2006) Toxicity and tissue distribution of magnetic nanoparticles in mice. Toxicol Sci 89: 338–347.
  10. Halwani R, Sultana SA, Ratemi E, Afzal S, Kenana R, Al-Muhsen S, et al. (2016) A novel anti-IL4Ralpha nanoparticle efficiently controls lung inflammation during asthma. Exp Mol Med 48: e262.
  11. Corren J, Busse W, Meltzer EO, Mansfield L, Bensch G, Fahrenholz J, et al. (2010) A randomized, controlled, phase 2 study of AMG 317, an IL-4Ralpha antagonist, in patients with asthma. Am J Respir Crit Care Med 181: 788–796.
  12. Brightling CE, Saha S, Hollins F (2010) Interleukin-13: prospects for new treatments. Clin Exp Allergy 40: 42–49.
  13. Park H, Kim S, Kim S, Song Y, Seung K, Hong D, et al. (2010) Antioxidant and anti-inflammatory activities of hydroxybenzyl alcohol releasing biodegradable polyoxalate nanoparticles. Biomacromolecules 11: 2103–2108.
  14. Yoo D, Guk K, Kim H, Khang G, Wu D, Lee D (2013) Antioxidant polymeric nanoparticles as novel therapeutics for airway inflammatory diseases. Int J Pharm  450: 87–94.
  15. Wang W, Zhu R, Xie Q, Li A, Xiao Y, Li K, et al. (2012) Enhanced bioavailability and efficiency of curcumin for the treatment of asthma by its formulation in solid lipid nanoparticles. Int J Nanomedicine 7: 3667–3677.

Malaria: It’s Gynecological and Obstretic Effects on Humans – A Short Note

DOI: 10.31038/IGOJ.2019242

Short Commentary

Malaria is a vector borne disease of man caused by protozoans of the genus Plasmodium – P. vivax, P.ovale, P. malariae, P. falciparum and, more recently, P. knowlesi [1]. These parasites are present within the red blood cells, and they are transmitted by mosquitoes of the genus Anopheles.

Considering the medical importance of malaria in the context of the gynaecological and obstetric fields we have as objectives in this manuscript to contribute: (i) to the divulgation of the knowledge of human malaria in a general context; (ii) to emphasize the gynaecological and obstetric effects of malaria in the human population.  In support of these objectives we present:

In article [2] we emphasized “uncomplicated malaria entails a series of recurring episodes of chills, intense fever, and sweating and often includes other symptoms such as headache, malaise, fatigue, body aches, nauseas, and vomiting. In some cases, and especially in groups, such as children and pregnant women, the disease can progress to “severe malaria,” including complications, such as cerebral malaria/coma, seizures, severe anaemia, respiratory distress, kidney and liver failure, cardiovascular collapse, and shock”.

This article [3] states that “if a woman gets malaria while pregnant, she and her baby have an increased risk of developing serious complications such as: (1) premature birth – birth before 37 weeks of pregnancy: (i) low birth weight; (ii) restricted growth of the baby in the womb; (2) stillbirth; (3) miscarriage – death of the mother.

Conclusion

It was here demonstrated that malaria infection can be one cause of human infertility, and of strong negatives effects on pregnant women and their babies. We hope that within a short period of time malaria is combated of sustained form in the world and that it is irradiated soon based, principally, in the   initiative of the WHO, Known as the E-2020 initiative and malaria elimination [4].

Keywords

Malaria; Anopheles; pregnancy; gynecology; obstetric; vector-borne diseases.

References

  1. White NJ (2008) Plasmodium knowlesi: the fifth human malaria parasite. Clin Infect Dis. 2008 Jan 15; 46: 172–3.
  2. Marrelli MT, Brotto M (2016) The effect of malaria and anti-malarial drugs on skeletal and cardiac muscles. Malaria Journal 15: 524,
  3. https://www.nhs.uk/conditions/malaria/complications/
  4. Q&A on the E-2020 initiative and malaria elimination – WHO (3 July 2019).

Microscopic Adenomyosis

DOI: 10.31038/IGOJ.2019241

Commentary

Endometriosis is a frequent, chronic inflammatory estrogen-dependent gynecological disease characterized by the presence of extrauterine endometrial tissue, that affects up to 10% of all reproductive-aged women. The incidence increases to 30–50% in women with chronic pelvic pain and infertility [1, 2]. Most common sites of the ectopic endometrial-like tissue are the pelvic peritoneum and ovaries, but they can be found also under the peritoneal surface, where endometriosis is strongly associated with pelvic pain symptoms [3]. This disease has a noteworthy morbidity, with harmful effect upon women’s social working, personal life, and relations with physicians [4]. Notwithstanding, the pathogenesis, as well as the diagnosis and therapy for endometriosis are still not perfectly delineated [5]. Recently, our group and others have generated convincing experimental data suggesting that perturbation of the fine-tuning of the female genital system development during a critical window of time in fetal life as the pathogenetic event prompting to the progression of endometriosis later in life [6–12].

The lack of knowledge about this disease justifies the fact that, to date, endometriosis is an incredibly under-diagnosed and under-treated disease, with an excessively long-time interval between the commencement of the symptoms and conclusive diagnosis of 8–12 years [1]. This is due to the fact that most of the symptoms are non-specific and there are no non-invasive diagnostic investigations able to reach a definitive diagnosis [13]. The definite diagnosis of endometriosis can be obtained only by histological examination of the ectopic tissue implants collected by invasive surgical or exploratory procedures [1].

The histologic diagnosis of endometriosis is, usually, quite simple and is based essentially on the recognition of both endometriosic glands and stroma, or at least by one of these two elements [1]. The histological appearance of these elements is straightforward; nevertheless, immunohistochemical staining for cytokeratin markers and for CD10 can aid in identification of glands and stroma in doubtful cases [14]. The different histopathological aspects of endometriosis are well known and have been described in detail in an elegant work of Clement some years ago [14]. Even though the histological diagnosis of endometriosis is relatively easy, also for pathologists who are not experts in this pathology, it has been reported that approximately only 50% of biopsy specimens from areas suggestive of endometriosis at laparoscopic examination have been proven microscopically to be endometriosis. Since the definitive diagnosis of this disease is based on histological examination, it is important for the correct management of the patients, to avoid false negative results at histology.

This phenomenon is particularly true in the case of adenomyosis, a condition of endometriosis in which the endometrial glands are embedded into the myometrium of the uterus [15]. Based on the Sampson’s theory, endometriosis and adenomyosis have been considered for a long time two different clinical entities and it took approximately 80 years to put forward a new theory reunifying their pathogenesis [16]. Indeed, adenomyosis is still considered today an ‘elusive’ or ‘enigmatic’ disease because of the struggle in diagnosis, and of the indefinite and vague pattern of symptoms which may accompany it. Nevertheless, the frequent association of adenomyosis with other pelvic pathologies is a further aspect which complicates the understanding of related symptoms [17]. Finally, since the moderate to severe degrees of adenomyosis can be accurately diagnosed preoperatively by good-quality ultrasound or magnetic resonance imaging, it would be desirable in the near future to correlate symptomatology with specific findings on imaging and with pathological data.

In our experience it has happened more than once to review cases, reported as negative for adenomyosis, which showed the presence of microscopic adenomyosis foci that had escaped the observation of the pathologist. As an example, in Figure 1 we show a case of multiple microscopic adenomyosis in the posterior wall of the uterus of patients with endometriosis. Indeed, ultrasound analysis had shown alterations suggestive of adenomyosis of the posterior uterine wall, but the histological analysis of the tissue taken was negative. A careful analysis of the histological preparation, however, showed the presence of microscopic endometriotic glands. Immunohistochemical analysis with cytokeratin antibodies confirmed the epithelial nature of these structures. In Figure 2 we show another case of microscopic adenomyosis, in which two small glandular structures were found in the wall of the uterus, as clearly demonstrated by immunohistochemical analysis for cytokeratin. Interestingly, analysis by CD10 clearly showed that in microscopic adenomyosis the stromal component is absent.

IGOJ-19-Alfonso Baldi_f1

Figure 1. A case of microscopic adenomyosis in the posterior wall of the uterus is depicted. In this case a multifocal microscopic adenomyosis with several very small glands was evidenced

A) Histological appearance of the multifocal adenomyosis (Hematoxylin and Eosin; original magnification X20)

B) Immunohistochemical staining for pan-cytokeratin (ABC; original magnification X10)

C) Higher magnification of figure 1B (ABC; original magnification X20)

IGOJ-19-Alfonso Baldi_f2

Figure 2. A different case of microscopic adenomyosis in the posterior wall of the uterus is shown. In this case a single small glandular structure was found

A) A small glandular structure evidenced by the immunohistochemical staining for pan-cytokeratin (ABC; original magnification X10)

B) Higher magnification of figure 1° (ABC; original magnification X20)

C) The microscopic adenomyosis does not include stroma, as demonstrated by the negative stainining for CD10 (ABC; original magnification X20)

Currently, by means of ultrasound and magnetic resonance imaging analyses, is possible to define for adenomyosis a spectrum of lesions, ranging from increased thickness of the junctional zone to evident adenomyosis and adenomyomas, which in turn can be sub classified [18]. Moreover, it is commonly accepted by the scientific community that adenomyosis is a progressive disease that changes in appearance during the reproductive years. Therefore, it has been recognized the need of a consensus classification of uterine adenomyosis [18].

Based on our experience, microscopic adenomyosis could be considered the earliest form of adenomyosis and should enter the consensus classification of adenomyosis. Furthermore, in the light of this observation, we claim that such an initial state of adenomyosis is a source of symptomatology, thus explaining the presence, as often happens, of patients with negative diagnostic tests but with symptomatology in place, for which even doubts are often raised about the presence of this pathology. Microscopic adenomyosis also provides a rational basis for the occurrence that surgical interventions often do not resolve the symptoms of chronic pelvic pain. Nevertheless, the histological features of microscopic adenomyosis give us clues to the developmental dynamics of endometriosis and adenomyosis. The prevalent glandular-epithelial composition in microscopic adenomyosis may lead to the hypothesis that the role of the stromal component becomes fundamental in a successive phase, providing an essential support to the glandular structures by virtue of its sensitivity to the higher estrogenic growth input with respect to the epithelial component [19]. Finally, we also noted that the greater is tthe multifocal representation of the glands present, the greater is the symptomatic component of pelvic pain.

In conclusion, we propose to consider microscopic adenomyosis as a specific clinical entity and to include it in the classification of uterine adenomyosis Careful histological analysis and, in doubtful cases, the use of immunohistochemistry should always be performed, to eventually confirm the presence of microscopic glands in patients with clinical and instrumental signs suggestive for adenomyosis. This would be very important to reduce the delay in the diagnosis of this clinical entity, which is still high today and causes significant problems for both patients and physicians.

References

  1. Bulun SE (2009) Endometriosis. N Engl J Med 360: 268–279.
  2. Signorile PG, Campioni M, Vincenzi B, D’Avino A, Baldi A (2009) Rectovaginal septum endometriosis: an immunohistochemical analysis of 62 cases. In Vivo 23: 459–464.
  3. Baldi A, Campioni M, Signorile PG(2008) Endometriosis: pathogenesis, diagnosis, therapy and association with cancer. Oncol Rep 19: 843–846.
  4. Fuldeore M, Chwalisz K, Marx S, Wu N, Boulanger L, et al. (2001) Surgical procedures and their cost estimates among women with newly diagnosed endometriosis: a US database study. J Med Econ 14: 115–123.
  5. Benagiano G, Brosens I (2006) History of adenomyosis. Best Pract Res Clin Obstet Gynaecol 20: 449–463.
  6. Signorile PG, Baldi F, Bussani R, D’Armiento M, De Falco M, Baldi A (2009) Ectopic endometrium in human fetuses is a common event and sustains the theory of mullerianosis in the pathogenesis of endometriosis, a disease that predisposes to cancer. J Exp Clin Cancer Res 9: 28–49.
  7. Signorile PG, Baldi A (2010) Endometriosis: new concepts in the pathogenesis. Int J Biochem Cell Biol 42: 778–780.
  8. Signorile PG, Spugnini EP, Mita L, Mellone P, D’Avino A, et al. (2010) Pre-natal exposure of mice to bisphenol A elicits an endometriosis-like phenotype in female offspring. Gen Comp Endocrinol 168: 318–325.
  9. Signorile PG, Baldi F, Bussani R, D’Armiento M, De Falco M, et al. (2010) New evidence of the presence of endometriosis in the human fetus. Reprod Biomed Online 21: 142–147.
  10. Signorile PG, Baldi F, Bussani R, Viceconte R, Bulzomi P, et al. (2012) Embryologic origin of endometriosis: analysis of 101 human female fetuses. J Cell Physiol 227: 1653–1656.
  11. Bouquet de Jolinière J, Ayoubi JM, Lesec G, Validire P, Goguin A, et al. (2012) Identification of displaced endometrial glands and embryonic duct remnants in female fetal reproductive tract: possible pathogenetic role in endometriotic and pelvic neoplastic processes. Front Physiol 3: 444.
  12. Crispi S, Piccolo MT, D’Avino A, Donizetti A, Viceconte R, et al. (2013) Transcriptional profiling of endometriosis tissues identifies genes related to organogenesis defects. J Cell Physiol 228: 1927–1934.
  13. Ballard KD, Lowton K, Wright JT (2006) What’s the delay? A qualitative study of women’s experience of reaching a diagnosis of endometriosis. Fertil Steril 85: 1296–1301.
  14. Clement PB (2007) The pathology of endometriosis: a survey of the many faces of a common disease emphasizing diagnostic pitfalls and unusual and newly appreciated aspects. Adv Anat Pathol 14: 241–260.
  15. Thylan S Adenomyosis (1995) an ignored uterine disease. Nurse Pract 20: 8–9.
  16. Benagiano G, Brosens I, Carrara S. Adenomyosis (2009) new knowledge is generating new treatment strategies. Womens Health (Lond) 5: 297–311.
  17. Peric H, Fraser IS (2006) The symptomatology of adenomyosis. Best Pract Res Clin Obstet Gynaecol 20: 547–555.
  18. Gordts S, Brosens JJ, Fusi L, Benagiano G, Brosens I (2008) Uterine adenomyosis: a need for uniform terminology and consensus classification. Reprod Biomed Online 17: 244–248.
  19. Dyson MT, Kakinuma T, Pavone ME, Monsivais D, Navarro A, et al. (2015) Aberrant expression and localization of deoxyribonucleic acid methyltransferase 3B in endometriotic stromal cells. Fertil Steril 104: 953–963.

Post-Traumatic Stress Disorder: Diagnosis and Management

DOI: 10.31038/IJOT.2019253


Approximately one in three people in the UK report exposure to a significant traumatic event during the course of their life [1]. Traumatic events can include serious accidents or illness, physical or sexual assault, and neglect. This exposure rate is likely to be considerably higher for those working in trauma-prone occupations such as the military, emergency services, and in less developed countries where traumatic events are more commonplace [2]. Following exposure to a traumatic event, many individuals will experience a degree of short-term distress; however, the majority will recover in time without the need for formal psychological treatment. In a minority of cases, traumatic experiences can lead to psychological injuries which may manifest as adjustment disorders, Post-Traumatic Stress Disorder (PTSD) or depression. In particular, the development of PTSD can have a profoundly negative impact on one’s quality of life, with symptoms potentially affecting one’s relationships with others, workplace performance, sleeping patterns and daily functioning. PTSD can also have adverse consequences for physical health, with a recent meta-analysis finding PTSD to be significantly associated with musculoskeletal pain, cardio-respiratory symptoms, and gastrointestinal health [3].

Diagnosing PTSD

To meet criteria for a diagnosis of PTSD, the individual is required to have been exposed to ‘actual or threatened death, serious injury or sexual violence’ [4] either through direct contact, witnessing, or by indirectly learning that a very close family member/friend has been exposed to a violent or accidental trauma; or from an accumulation of direct/indirect exposure to aversive details of traumatic event(s) – usually through the course of professional duties (e.g. personnel working with child abuse cases, journalists reporting on violent criminal proceedings) [4]. The Diagnostic and Statistical Manual (DSM-5) details four core symptom clusters (B-E in Table 1) that must be present in order to make a diagnosis of PTSD:

These symptoms must have been experienced for one month or more to meet diagnostic criteria [4]. Up until 2018 there were few differences between the classification of PTSD as described by the DSM and ICD classification systems. However, in 2018, the ICD-11 recognised both PTSD and Complex PTSD (CPTSD) as stress disorders [5]. CPTSD can develop in a subset of individuals who are either particularly vulnerable or where trauma exposure is often prolonged or recurrent, from which escape is difficult or not possible (e.g. experiences of torture, slavery, childhood sexual/physical abuse) [5]. For a diagnosis of CPTSD to be made, an individual must first meet the ICD-11 diagnostic requirements for PTSD and then three additional symptom clusters related to a Disturbance of in Self-Organisation (DSO).

Table 1. DSM-5 PTSD Diagnostic Criteria

Criterion A

Traumatic stressor

Criterion B

Intrusive re-experiencing of the event (such as traumatic nightmares or flashbacks)

Criterion C

Avoidance of reminders of the traumatic event

Criterion D

Alterations in arousal and reactivity (such as hypervigilance, exaggerated startle response, or irritability)

Criterion E

Negative alterations in mood and cognitions (such as persistent negative affect or self-perception, or amnesia for key parts of the trauma not caused by alcohol, head injury and/or drugs)3

Table 2. ICD-11 Complex PTSD Criteria

1. Meets diagnostic requirements for PTSD;

2. Problems in affect regulation;

3. Beliefs about oneself as diminished, defeated or worthless, accompanied by feelings of shame, guilt or failure related to the traumatic event;

4. Difficulties in sustaining relationships and in feeling close to others.

By definition, a diagnosis of PTSD denotes that an individual is experiencing significant functional impairment which can extend to their personal, family, social, educational, occupational or other important areas of functioning. Symptoms of posttraumatic stress in the absence of such impairment does not constitute a diagnosis of PTSD, although may warrant other diagnostic labels, such as a trauma-related adjustment disorder.

Prevalence and Risk Factors for PTSD

Recent estimates have found the one-month prevalence of PTSD in the general UK population is 4.4% [1] with overall prevalence rates being similar between adult men and women. However, young women (16–24 years) have been found to be more likely to meet PTSD criteria (12.6% compared with 3.6% of men of the same age), although this effect declines with age [1]. Rates of PTSD also differ considerably between occupational groups, with prevalence rates of up to 20% of ambulance workers, up to 20% of war reporters, and between 7–30% of combat troops [6,7].

IJOT 19 - 128_Neil Greenberg_F1

Figure 1. Flow chart for PTSD treatment. NICE 2018

While anyone can develop PTSD after a traumatic event, incidence increases with trauma severity. Other risk factors for PTSD include exposure to previous trauma, psychiatric disorder history, lower educational attainment, appraisals of the work in operational theatre as being above an individual’s trade or experience, and low unit/organisation morale or poor social support [8,9]. PTSD is also highly comorbid with other mental health disorders, with comorbidity rates often greater than 80%. The most common comorbid conditions are depression, anxiety, and substance misuse [8].

PTSD Treatment

Formal therapeutic intervention is often unnecessary in the first month following trauma exposure; in fact, evidence suggests that the early provision of psychological debriefing or trauma-counselling is potentially harmful as it may increase the likelihood of longer-term mental disorders (National Institute For Health And Care Excellence [NICE], [10]). Instead, having social support and a temporary reduction in exposure to stressors facilitates recovery in most cases. NICE guidelines advocate ‘active monitoring’ of distressed trauma-exposed individuals in the first month post-incident [10].

Evidence shows that therapies that involve an element of talking about the traumatic experiences tend to have better outcomes than supportive counselling or by managing symptoms with psychiatric medication alone [10]. Several specialist trauma-focused psychological interventions have been developed to effectively address PTSD, including exposure therapy, Trauma Focused Cognitive Behaviour Therapy (TF-CBT) and Eye Movement Desensitisation and Reprocessing (EMDR). TF-CBT has been found to be effective for improving PTSD symptoms following exposure to a variety of trauma types, including sexual assault, childhood abuse and combat trauma. EMDR is also a mainstream PTSD treatment although not recommended for war-related PTSD. Both treatments are generally delivered as 8 to 12 weekly sessions. NICE guidelines currently endorse TF-CBT for individuals who present with PTSD one to three months post-trauma. For individuals whose PTSD symptoms have been present for longer than three months, TF-CBT should also be offered but it is likely they will require additional sessions [10].

Medication for PTSD is not recommended as a routine first-line treatment strategy, although it can often be complimentary in treating symptoms and comorbid depression, or severe hyperarousal. NICE guidelines advise that Selective Serotonin Reuptake Inhibitor (SSRI), such as sertraline, or venlafaxine is considered for adults with a diagnosis of PTSD if the patient has a preference for drug treatment [10].

Role Of Healthcare Professionals

During the course of clinical practice, healthcare professionals may encounter patients who have been exposed to a range of traumas, including providing physical care for those who have been physically injured in traumatic events. The NICE guidelines recommend healthcare professionals ask questions about trauma exposure – providing the patient with examples of potential traumatic events. Questions should also include whether the patient has experienced specific symptoms (e.g. avoidance, dissociation, nightmares, hyperarousal, etc.) [10].

While some healthcare professionals may feel ill-equipped to ask about trauma exposure or have concerns that such questions may provoke further patient distress, they should not avoid doing so. Being able to discuss a traumatic experience can be cathartic and, if distress is evident, then a referral for a formal assessment can be arranged. Asking about trauma exposure, and associated symptoms, sensitively as well as the impact that the trauma has had on a patient’s daily functioning, should be within the capability of all healthcare professionals. For example, an orthopaedic surgeon should consider and feel confident asking such questions when treating a patient who has suffered life changing injuries following a road traffic accident.

 Individuals who are identified as having PTSD should be provided with appropriate guidance about the condition (e.g. the Royal College of Psychiatrist PTSD information leaflet) and advised to attend a formal mental health assessment, particularly where there are concerns about the chronicity or severity of symptoms. Information should also be provided to the family members or caregivers about supporting their loved one following a traumatic event. Families/caregivers may also help encourage individuals to attend formal assessments which is important as avoidance is a key PTSD symptom and unfortunately most people in the UK who have PTSD do not receive any professional intervention [1].

Particularly following workplace trauma, there is good evidence that peer-support programmes can be especially effective in facilitating recovery [11]. In a UK military context, investing in efforts to improve informal and formal support for trauma-exposed troops has been found to be successful, both in protecting the mental health of personnel and in reducing the stigma around mental health problems within the military [6]. Thus, it may be beneficial for healthcare professionals to be provided with information regarding local organisations and peer-support groups, such as MIND, Big White Wall or the Veterans Gateway for military veterans.

It should be noted that while the media often portrays certain groups, such as emergency service personnel or military veterans, as being particularly reluctant to seek help for mental health difficulties, a failure to seek formal support for trauma-related psychological problems reflects a societal issue rather than the mindset of specific professions [1]. Therefore, it is recommended that healthcare professionals encourage patients and colleagues with chronic and impairing trauma-related symptoms to access social support or formal treatment. A further consideration is that treatment options for more complex presentations of PTSD, while available on the NHS can be challenging to access depending on where someone lives.

As with any mental health problem, the family members of an individual suffering with PTSD can also be vicariously affected. Research has shown that spouses and children of individuals with PTSD can experience significant mental health difficulties themselves, including secondary PTSD symptoms and emotional dysregulation problems [12, 14]. The provision of psychoeducation to families, an assessment of family member’s needs, as well as emotional support may be beneficial to augment familial coping.

Summary

In summary, while most people who experience traumatic events may have short-term distress, only a minority will develop PTSD. PTSD can have a debilitating effect on not only their lives, but the lives of their families, colleagues and friends. In the initial period after a traumatic event, the majority of people benefit from access to social support and a temporary reduction in stress. For the minority who do develop PTSD, there are evidence-based talking trauma-therapies which can improve functioning and psychological wellbeing. While it is ideal to access such treatments within months of a trauma, so that the negative impact on one’s life is kept to a minimum, treatment can be effective even after a delay – allowing those with PTSD to continue to lead fulfilling lives once again, even if the full resolution of symptoms is not possible in some cases.

References

  1. Fear NT, Bridges S, Hatch S, Hawkins V, Wessely S (2016) Posttraumatic stress disorder. In: McManus S, Bebbington P, Jenkins R BT (eds), editor. Mental health and wellbeing in England: Adult Psychiatric Morbidity Survey.  Leeds: NHS Digital, Leeds, England Pg No: 991.
  2. Perkonigg A, Kessler RC, Storz S, Wittchen H-U (2016) Traumatic events and post-traumatic stress disorder in the community: prevalence,risk factors and comorbidity. Acta Psychiatr Scand 101: 46–59.
  3. Pacella ML, Hruska B, Delahanty DL (2013) The physical health consequences of PTSD and PTSD symptoms: A meta-analytic review. J Anxiety Disord 27: 33–46.
  4. American Psychiatric A. (2013) Diagnostic and Statistical Manual of Mental Disorders (DSM-5®) [Internet]. American Psychiatric Pub Pg No: 991.
  5. World Health Organisation. (2018) ICD-11 – Mortality and Morbidity Statistics.
  6. Greenberg N, Jones E, Jones N, Fear NT, Wessely S (2010) The injured mind in the UK Armed Forces. Philos Trans R Soc B Biol Sci 366: 1562.
  7. McFarlane AC, Williamson P, Barton CA (2009) The impact of traumatic stressors in civilian occupational settings. J Public Health Policy 30: 311–27.
  8. Bisson J, Ehlers A, Matthews R, Pilling S, Richards D, et al. (2007) Psychological treatments for chronic post-traumatic stress disorder. Br J Psychiatry 198: 97–104.
  9. Iversen AC, Greenberg N (2009) Mental health of regular and reserve military veterans. Adv Psychiatr Treat 15: 2.
  10. National Institute for Health and Care Excellence N. Post-traumatic stress disorder: management (2018).
  11. Brooks S, Amlôt R, Rubin GJ, Greenberg N (2018) Psychological resilience and post-traumatic growth in disaster-exposed organisations: overview of the literature. J R Army Med Corps Pg No: 1–5.
  12. Leen-Feldner EW, Feldner MT, Knapp A, Bunaciu L, Blumenthal H (2013) Offspring psychological and biological correlates of parental posttraumatic stress: Review of the literature and research agenda. Clin Psychol Rev 33: 1106–33.
  13. Diehle J, Brooks SK, Greenberg N (2016) Veterans are not the only ones suffering from posttraumatic stress symptoms: what do we know about dependents’ secondary traumatic stress? Soc Psychiatry Psychiatr Epidemiol  Pg No: 1–10.
  14. Williamson V, Stevelink SAM, Da Silva E, Fear NT (2018) A systematic review of wellbeing in children: a comparison of military and civilian families. Child Adolesc Psychiatry Ment Health Pg No: 12: 46.

Hemiarthroplasty or Total Hip Replacement for intracapsular Hip Fractures? A Dilemma in Trauma Surgery

DOI: 10.31038/IJOT.2019252


Hip fractures in the elderly are a common and devastating injury, placing a considerable burden on healthcare systems around the world. In the UK there are over 70,000 hip fractures annually, costing around £2billion [1].Given the ever-ageing population, future estimates suggest that that over 6 million hip fractures/year will occur worldwide by 2050 [2].Mortality and morbidity following these injuries remains high, in England with a 30-day mortality of 8.5% [3].

Displaced intracapsular fractures are at risk of non-union and avascular necrosis, and treatment in the form of a hemiarthroplasty or Total Hip Replacement (THR) is recommended [4]. The choice between these remains controversial [5], with potential benefits and risks associated with each. Traditionally, hemiarthroplasty has been the mainstay of treatment as it is less complex and thus quicker surgery, with reduced bleeding and complications [6]. However, some studies suggest improved function following a THR [7], and surgeons worry about long-term acetabular wear from hemiarthroplasties, and the subsequent need for conversion to a THR [8].

Population studies in the USA [9], Finland [10] and South Korea [11] have shown trends demonstrating increasing utilisation of THR in these patients for this fracture. In the UK, in 2011, the National Institute of Health and Clinical Excellence (NICE) produced guidance on when a THR should be offered to hip fracture patients [12]. They recommended offering a THR to patients who: (a) could walk independently, (b) were not cognitively impaired, and (c) were medically fit for anaesthesia and the procedure [12]. By 2017 the first of these criteria was revised to patients who are able to walk independently outdoors with no more than the use of a stick [13]. Despite this, in the UK compliance to NICE guidelines remains poor, with one study, published in 2016, of over 100,000 patients showing less than a third of eligible patients received a THR [4].

Several potential reasons exist regarding this low compliance. First, these cases require an experienced arthroplasty surgeon [4], not always feasible especially in smaller centres, contributing to a delay in treatment, and increased morbidity and mortality. In our unit, we have shown in an as of yet unpublished retrospective study of patients who all met the NICE criteria that those receiving a THR waited considerably longer than hemiarthroplasty patients (3.7 days versus 1 day respectively, P < 0.05). Second, it has been acknowledged the precise indications for THRs in hip fractures are not well defined [4] with some authors feeling the current NICE criteria are too inclusive [14], particularly in patients with significant co-morbidities (the most common reason hemiarthroplasties were chosen over THRs) [14]. This was supported as hemiarthroplasty patients were older, and had significantly increased 1 year mortality, suggesting greater frailty in these patients, despite all being eligible for THRs [14]. In our local study we too found those undergoing a hemiarthroplasty were older (mean age 83 vs 73 years) and had an increased 1 year mortality (18.2% vs 8.3%), despite all patients meeting NICE criteria.Indeed, one population-based study on THR usage in hip fractures showed NICE guidance was less likely to be followed in older patients, and those with worse cognition, ASA grade and ambulatory status [4].

The literature on the outcome of THRs compared to hemiarthroplasties is also equivocal, with a variety of studies supporting each approach. One recent meta-analysis of prospective studies supported THR [15], demonstrating improvements in function as measured by the Harris Hip Score (HHS) and Quality of Life (SF-36), reduced re-operation rates [15]and beyond 4 years no difference in dislocation rates [15].However, the authors acknowledge inconsistencies in trial design [15], and it is worth noting the implants and selection criteria varied widely between studies. Interestingly, the authors also conclude those patients older than 80 years, or those with a short life expectancy, both THR and hemiarthroplasty are both reasonable interventions [15].

Another retrospective UK study using over 7,000 matched patients, on a national database, showed no difference in revision rates between implants [16]. This finding was reinforced by another study showing the conversion rate of hemiarthroplasties to THRs for acetabular wear was low, particularly in older patients (1.4% in patients older than 75 years) [8].

The short to medium term dislocation rate in THR patients has been shown to be significantly higher than for hemiarthroplasty patients [16,17]. A randomised prospective study assessing long-term outcomes at 12 years found no difference in complication or re-operation rates between groups, and actually demonstrated equivalent function as measured using the modified HHS [5]. This study concluded by advising cemented hemiarthroplasty in hip fracture patients aged greater than 70 years, in the absence of radiological evidence of joint degeneration [5].

In conclusion, THR surgery was once famously described as the ‘operation of the century [18], helping to revolutionise the management of patients crippled with osteoarthritis [18]. Its role in these patients is not disputed. However its role in trauma remains controversial [5]. We feel THR can also achieve excellent results in hip fracture patients, but at present the ideal patient, and precise indications are not well defined [4]. Furthermore emergency surgery is usually defined ‘as life or limb saving’ which should be as simple and expeditious as possible, particularly in the elderly and infirm. The decision for THR or hemiarthroplasty is multi-factorial and includes surgical experience, facilities and importantly patient morbidity/ASA, frailty and age. It is our opinion that current NICE guidelines are too inclusive. Until more conclusive data shows otherwise, surgical decision-making should remain at the discretion of the attending surgical team and local circumstances.

References

  1. Royal College of Physicians (2014)  National Hip Fracture Database annual report London
  2. Dhanwal DK, Dennison EM, Harvey NC (2011) Epidemiology of hip fracture: worldwide geographic variation. Indian J Orthop 15–22.
  3. Neuburger J, Currie C, Wakeman R (2015) The impact of a national clinician-led audit initiative on care and mortality after hip fracture in England: an external evaluation using time trends in non-audit data. Med Care 686–91.
  4. Perry DC, Metcalfe D, Griffin XL (2016) Inequalities in use of total hip arthroplasty for hip fracture: population based study. BMJ
  5. Tol CJM, van den Bekerom MPJ, Sieneveldt (2017) Hemiarthroplasty or total hip arthroplasty for the treatment of a displaced intracapsular fracture in active elderly patients. 12-year follows up of randomised trial. Bone Joint J 250–54
  6. Keating J, Grant A, Masson M (2005) Displaced intracapsular hip fractures in fir, older people: a randomised comparison of reduction and fixation, bipolar hemiarthroplasty and total hip arthroplasty. Health Technol Assess1–65.
  7. Avery PP, Baker RP, Walton MJ (2011) Total hip replacement and hemiarthroplasty in mobile, independent patients with a displaced intracapsular fracture of the femoral neck: a seven-to ten-year follow-up report of a prospective randomised controlled trial. J Bone Joint Surg Br 93: 1045–8.
  8. Grosso MJ, Danoff JR, Murtagh JS (2017) Hemiarthroplasty for displaced femoral neck fractures in the elderly has a low conversion rate. J Arthroplasty 32: 150–54.
  9. Bishop J, Yang A, Githens M (2016) Evaluation of contemporary trends in femoral neck fracture management reveals discrepancies in treatment. Geriatr Orthop Surg Rehabil 7:135–41.
  10. Hongisto MT, Pihlajamaki H, Niemi S (2014) Surgical procedures in femoral neck fractures in Finland: a nationwide study between1998 and 2011. Int Orthop 38: 1685–1690.
  11. Lee YK, Ha YC, Park C (2013). Trends of surgical treatment in femoral neck fracture: a nationwide study based on claim registry. J Arthroplasty 28: 1839–1841.
  12. National Institute for Health and Clinical Excellence (2011). NICE clinical guideline 124. Hip fracture: the management of hip fracture in adults. NICE
  13. National Institute for Health and Clinical Excellence (2017) NICE clinical guideline 124 (addendum).  Hip fracture: the management of hip fracture in adults. NICE
  14. Walker LC, Lee LH, Webb M (2016) Provision of total hip replacement for displaced intracapsular hip fracture and the outcomes: an audit of local practice based on NICE guidelines. Hip Int 26: 153–7.
  15. Lewis DP, Waever D, Thorninger R (2019) Hemiarthroplasty vs Total hip arthroplasty for the management of displaced neck of femur fractures: a systematic review and meta-analysis. J Arthroplasty; 34:1837–1843.
  16. Jameson SS, Lees D, James P (2013) Cemented hemiarthroplasty or hip replacement for intracapsular neck of femur fracture? A comparison of 7732 matched patients using national data. Injury 44: 1940–44.
  17. Van den Bekerom MP, Hilverdink EF, Sierevelt IN (2010) A comparison of hemiarthroplasty with total hip replacement for displaced intracapsular fracture of the femoral neck: a randomised controlled multicentre trial in patients aged 70 years and over. J Bone Joint Surg Br 92B: 1422–8.
  18. Learmonth ID, Young C, Rorabeck C (2007) The operation of the century: total hip replacement. Lancet 370: 1508–1519.