Abstract
The nature of the doctor-patient interaction significantly affects the trust in their relationship. Barriers in communication which ignore the emotional needs of patients reduce patient trust in the doctor, as well as challenge the delivery of patient-centered-care, the preferred approach of care. Based on previously acknowledged determinants of patient trust in the patient-doctor relationship, we identified two patient mind-set segments which supersede age and gender. Patients in one mindset expect their doctor to greet them respectfully, to be empathic, to listen carefully without interrupting, and in the end feel that their doctor understands them. Patients in the second mind-set segment expect the doctor to enhance their internal locus of control. This second mind-set wants the doctor to educate them, providing clear, relevant, tailored, information and ensuring that they understand the information. This second mind-set wants the doctor to let them feel comfortable asking questions about what they didn’t understand, and walk them through a change process, by steps, towards self-management of their disease.
Introduction
Patient-Centered Care (PCC) has been demonstrated to improve clinical outcomes (IOM, 2001). The IOM defines patient centered care as “care that is respectful of and responsive to individual patient preferences, needs, and values” and that ensures “that patient values guide all clinical decisions” (IOM, 2001). From the perspective of the patient, the eight characteristics of care which indicate high quality and safe care are, respectively, respect for patient’s values; preferences and needs; coordinated and integrated care; clear, high-quality information; education for the patient and family; physical comfort; emotional support; involvement of family members; continuity in care-transitions; and access to care [1,2]. PCC leads to improved clinical outcomes. The pinnacle of PCC is the active engagement the patient when fateful health care decisions must be made; when the patient is at crossroads of medical options, and the divergent paths have meaningful consequences for the patient and family [3]. Patients at crossroads of medical action are vulnerable, have needs they cannot fulfill on their own, and rely on and have positive expectations from a doctor [4]. To address dimensions of PCC, the doctor is called upon to implement and evaluate care systems and work together with patients to produce optimal clinical outcomes. In these situations the patient-doctor interaction can strongly drive cooperation and ultimate outcome [5].
Trust is an attitude by which, in the absence of the ability to predict what will happen in the future, the patient believes that in the moment of truth, the doctor will behave according to expectations [4, 6, 7]. Trust by the patient in the doctor entails the acceptance by patient of her or his vulnerability [8]. The interaction with physicians may create this patient-trust or perhaps patient-distrust in a doctor. The importance of patient-trust in a doctor emerges from evidence indicating that patient trust is related to patient adherence to medication and to guidelines. Patient trust in a doctor is associated with fewer readmissions, better health outcomes better long-term health and higher quality of life [9–12]. In psycho-social discourse between doctor-patient the doctor can clarify patient’s expectations, whether clear or ambiguous, making the expectations concrete, and shaping the precise nature of these expectations. Lack of such discourse, i.e., treating the patient but not really interacting with the patient as a person, may be negatively affect the ultimate outcome, despite the doctor’s efforts to provide optimal care, and despite the sophistication of the medical treatment itself.
A model of an improved way to interact with patients comes from the world of psychotherapy. Research continues to demonstrate that high quality relationships between therapists and their clients result in more positive outcomes, Medicine continues to borrow characteristics of positive relationships from the field of Psychotherapy to doctor-patient relationships [13, 14]. Positive relationships entail attitudes and behaviors; acceptance, empathy, concern, support, flexibility, honesty, confidence, human warmth, openness and respect for the patient, and so forth. These characteristics nurture patient trust in the doctor and patients’ ability to assume responsibility for their health [15, 16]. The quality of the relationship depends on active listening, maintaining patient focus, on creating a calm and warm atmosphere, enhancing patient’s information and knowledge; n legitimizing expressions, avoiding directives, or too much information, and finally using language which expresses closeness [17,18].
When interacting with doctors, the patient relies on the knowledge, abilities, and skills of the doctor, especially when the interaction is done when the patient is suffering. In turn, the doctor depends on the patient who can provide accurate and comprehensive information about the specific symptoms of the disease in his body, information which lead to the accurate diagnosis, and in turn the accurate and appropriate treatment [19, 20]. This mutual dependence for the best outcome demands that the patient feel comfortable with the doctor, allowing the patient to expose weaknesses and limitations. The relation becomes a two-way street. In turn, good doctor-patient communication may build trust, a necessity for a beneficial and effective doctor-patient relationship [21–26].
According to studies, the more the doctor is empathic, technically competent, listening, reliable, honest and concerned for the patient’s well-being, compassionate, the greater appears to be the patient trust in the doctors. Patients who rated their doctors’ inter-personal abilities as high reported greater trust [27]. The higher the reputation of the doctor, the more the patient trusted the doctor. Finally, research shows that the more the doctor meets the patient’s expectations, the higher is the patient’s satisfaction, and the highest is the trust [28–30]. The patient’s ‘perceived locus of control’ has been report to be important for the trust that the patient puts in the doctor [18]. Perceived control, a psychological construct, is grounded in social learning theory. Perceived control moves along the continuum from perceived external locus of control to perceive internal of control focus [31]. Patients with internal locus of control perceive everything in their world as their responsibility. Patients with external locus of control attribute events in their lives to external factors, e.g., luck, boss, weather, and so forth [18, 31–33].
Patients with internal locus of control are directed to action [33, 34]. They look for relevant information on their illness and are more involved in decision-making. These patients with internal locus of control take responsibility for improving their health behaviors, reducing harmful health behaviors and accelerating recovery from illness [35–39]. A retrospective study also found that using communication that targets patient’s perceived control reduced the number of readmissions [9]. These findings suggest that one opportunity to improve outcomes is the adoption of communication style and content which enhance the patient’s internal locus of control. The actual behavior may be to guide patients to think about resources, both those in themselves, and those external to themselves, in order to improve health. These external resources may be forums, mobile phone reminders for taking one’s drugs, and so forth [40, 41]. The world of the doctor-patient interaction is shifting quickly, morphing into a less personal relationship. The increasing complexity of medical science, along with technology and business consideration prevent doctors from establishing a close bond with the patient. In the interest of efficiency, technology and business appear to be reducing the opportunity to create a beneficial bond between doctor and patient. The ‘patient intake’ may occur through portals at home; computer facilitated intake at the office. The traditional psycho-social model of patient-doctor interaction, whether true or simply somewhat romanticized, has given way to capitation, to short, tightly scheduled visits with the patient, in order to deliver optimal outcomes. The amount of communication is limited, the type of communication is reduced and so is the span of attention of the doctor [42]. This study examines patient preferences as to what to strengthen in doctor-patient communication by mind-set segmentation and what to avoid in communicating with patients in each mindset.
Methods
The Mind Genomics approach
Mind Genomics is an emerging psychological science which studies decision processes of the ‘every day.’ People live in the ordinary world, confronted by what is by now ‘standard problems,’ such as what to wear, what to buy, and of course when to go to their physician, and what truly private information can they feel comfortable when they share with their physician. Much of what we know about the psychology of the everyday comes from large-scale attitude and usage studies, usually done with the focus of selling a product or a service. These studies, also called habits and practices, are commissioned by corporations with the objective to understand possible opportunities with consumers, opportunities which emerge from the everyday. These studies do not look at the aspects of everyday life as the basis to understand the ‘algebra of the mind,’ the rules of decision making, except in isolated cases, and disconnected experiments.
Mind Genomics was developed in the 1980’s by author [43, 44, 45] to create an archival base of knowledge showing how people react to the different facets of a common situation. Since 2015 Mind Genomics is used in the health context [44, 46, 47, 48, 49, 50, 51, 52]. Rather than looking at isolated situations, and disconnected experiments, the ingoing vision was to take a specific ‘vertical’ of related experiences, and for each experience or ‘topic,’ identify the features of the experience and then list alternatives possible with each feature. Explained another way, Mind Genomics takes a topic, such as the patient’s experience when the visiting the doctor, divides the topic into questions defining the different aspects of the visit, and then provides a set of answers to each question. These answers represent alternatives which could happen. The final step combines these ‘answer’s (alternative events in visiting one’s doctor), creating many ‘vignettes,’ presents these vignettes to people, and gets their reactions to the different vignettes. The result is a portrait of how people react to these different answers, different aspects of visiting a doctor.
Sample
A sample of 25 patients who were asked to relate to their primary physician and define themselves as choosing to be healthy. This sample is a preliminary step in creating a baseline dataset, showing major trends. The small number of respondents is satisfactory for these early stage studies, where the objective is to get a sense of the topic areas which are very important to respondents. Each respondent participates in what is best considered to be an individual-level experiment. The pattern of the data from one individual suffices to show the mind-set of the individual toward the topic, i.e., what is important and what is not. Increasing the number of respondents does not add more precision, but rather allows different mind-sets to emerge. Early stage research, where the topic is not well researched and the key variables not yet known, benefits from a series of such small, exploratory studies, probing different facets of the topic. This first study falls into the class of the small, easily done, affordable explorations, the larger set of which can be woven into a detailed tapestry. Such research is usually not done when the effort is expended against one part of a topic, ignoring most others.
Procedure
Mind Genomics is an experiment, rather than a survey. The objective is to trace a path of causation, between what is described in the doctor-patient interaction and the patient’s response. The approach combines Socratic question/answer with experimental design, to create the inputs necessary for the experiment. The process follows these straightforward steps, forcing the researcher to think in a structured fashion, and in so doing produce the requisite input for the experiment.
Step 1: Define The Topic: The topic here is the patient’s description of how she or he was treated, and felt, after a consult with the physician
Step 2: Ask Four Questions Pertaining to the Consult with the Physician: The four questions must tell a story. Asking the four questions requires the critical thinking by the researcher. The exercise becomes the foundation for either a good experiment or a poor experiment. (Table 1) presents the specific set of four questions focusing on the doctor-patient trust building interaction. We limited the amount of questions to avoid the research being onerous for respondents and for creating the science through straightforward insights, the ultimate goal.
Table 1. The four questions and the four answers for each question.
|
|
Question A: What is internal locus of control? |
|
A1 |
Doctor encouraged to ask about what I didn’t understand |
|
A2 |
Involved as much as I want to be with this doctor |
|
A3 |
Doctor discussed the next step appropriate for me |
|
A4 |
Doctor set up a clear follow up plan with me |
|
|
Question B: How did the doctor educate the patient? |
|
B1 |
Doctor gave me information about my condition |
|
B2 |
Doctor referred me to where I can learn more about my condition |
|
B3 |
Doctor made sure I understood the information |
|
B4 |
Doctor validated and ensured my relevant information |
|
|
Question C: How was the time spent in the consult? |
|
C1 |
Doctor let me talk without interruption |
|
C2 |
Doctor spent as much time as I needed |
|
C3 |
Doctor interested in what I thought about the situation |
|
C4 |
I felt the doctor understood me |
|
|
Question D: What nonverbal language was used by the doctor? |
|
D1 |
Doctor kept the contact with me |
|
D2 |
Doctor listened carefully |
|
D3 |
Doctor greeted me respectfully |
|
D4 |
Doctor focused on me and not on the computer |
Step 3: Provide Four Answers to Each Question: The four answers present different facets of the question, different alternatives. It will be the answers that will be seen by the respondent, in various combinations, the vignettes described below. The respondent will never see the questions. The only purpose of the question is to motivate the answers. (Table 1) shows the answers. They are presented in simple format, usually a declarative sentence, occasionally with a short reprise of the question in one/two words, a colon, and then the answer. (Table 1) shows the format of the answer, generally begun with the word ‘doctor’ in the starting part of the answer, unless the meaning of the answer would be distorted (A2, C4).
Materials
Step 4: Create Vignettes Using the Principles of Experimental Design: The standard approach to understand the patient’s feeling about the consult with the doctor uses a survey, a set of questions that are to be answered with a scale. Mind Genomics works differently because it is an experiment. Mind Genomics creates test descriptions, combinations of answers, and the vignettes, presents them to the respondent, and obtained an answer. The ratings of the vignettes are then deconstructed to provide a sense of how each element ‘drives’ the rating. Vignettes rather than single phrases provide three distinct benefits for the research.
- It is impossible to ‘game the system,’ to provide answers which tell a specific story. Virtually all respondents who begin with the attempt to provide a specific pattern of answers ‘give up’ because the combination is simply too difficult to deconstruct. The respondent soon adopts a strategy of assigning ratings by intuition, by ‘gut reaction,’ the precise criterion necessary for valid information.
- Respondents are more accustomed to stories than to single facts. The combination by vignettes presents a story.
- The experimental design allows the researcher to measure interactions among different answers, specifically whether the combination of two answers together is more powerful than one might expect, or engage the respondent’s attention longer (see response time below.)
The actual experimental design requires that the 16 answers be combined into 24 combinations, vignettes, with the vignettes comprising no more than one answer from each question, but sometimes absent answers from one or two questions. That is, the vignettes comprise 2–4 answers. The vignettes are incomplete, allowing the 16 answers, now elements in the vignette, to be statistically independent of each other. That statistical independence will allow the use of OLS (ordinary least-squares) regression to relate the presence/absence of the elements to the response.
The vignette is rated as a totality, using the rating scale below:
How likely are you to revisit this doctor and/or recommend to friends?
(1= don’t want to revisit, 9 = want to revisit).
Figure 1 (left panel) shows the four questions as they are entered into the BimiLeap program (www.BimiLeap.com), whether on an android device or on the web. Figure 1 (middle panel) shows the four answers to each question, as they are entered into the program. The BimiLeap program, the technology underlying the Mind Genomics science, enables the researcher to structure her or his thinking,
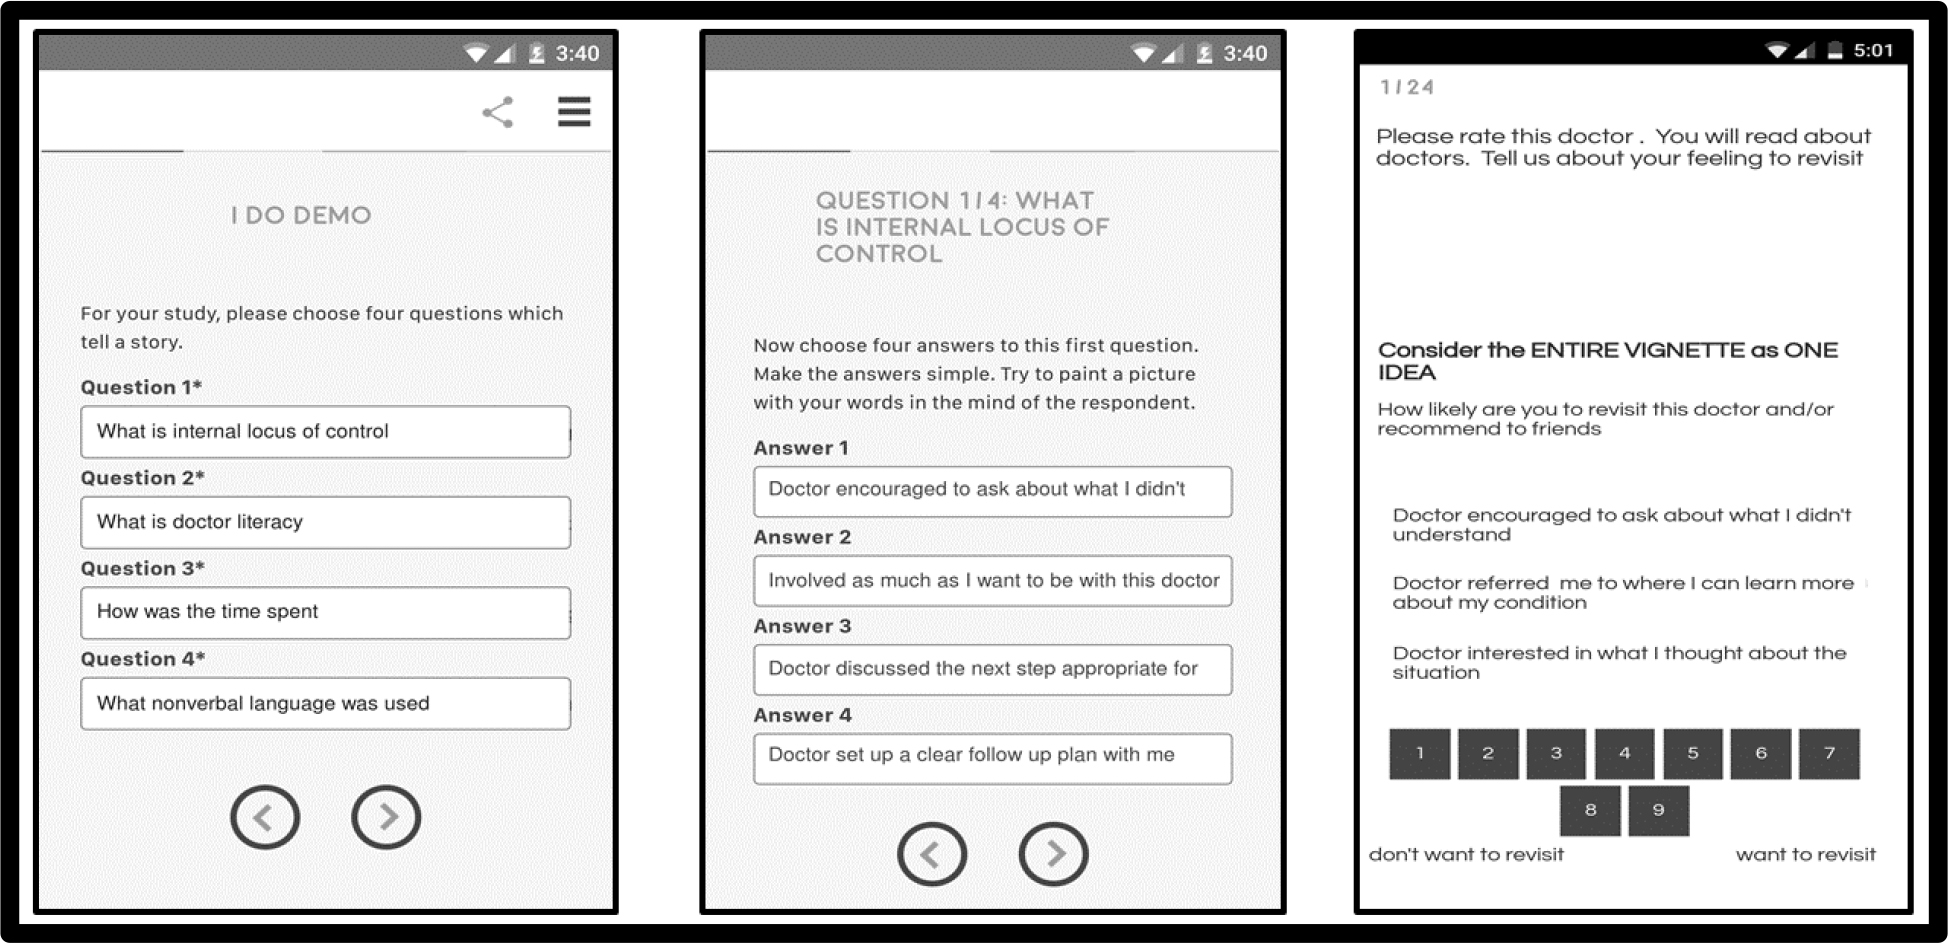
Figure 1. The left panel shows the four questions, ready to be entered. The middle panel shows the four answers to the first question, ready to be answered. The right panel shows a vignette, ready to be rated.
Recent developments in experimental design by [53] have created what is called ‘systematic permuted design.’ This advance generates several hundred permutations of the one basic design underlying the 4×4 structure (four questions, four answers.) The combinations in the permuted designs are different from each other, but each design is isomorphic to every other design. Thus, one need not be worried that the 24 combinations chosen for the experiment are the ‘correct combinations.’ Each respondent will see a different set of combinations, similar to the way the MRI (Magnetic Resonance Image) in medicine takes many pictures of the same tissue, from different angles, and puts them together. Each picture in the MRI is incomplete, but the combination reproduces the view of the underlying organ. In the same way, each set of 24 vignettes is a picture, but not the whole picture. It is the combination of the different vignettes in one large regression analysis which will provide the full picture.
Step 5: Invite the respondents to participate, using an e-panel (online) sample provider. For many studies it is tempting to source the respondents for the study using friends and others, such as people one knows on social media. The sourcing of respondents that way may work, but the time to do the research stretches into the days and weeks. A more efficient way works with a sample provider, who charges a small fee to recruit the panelists from a large pool of individuals, according to specific recruitment criteria. The panel provider for this study was Luc.id, Inc. The respondents were invited to participate. Within two hours the study was completed.
Step 6: Present the respondents with the systematically varied combinations, the vignettes, whether on a smartphone of any type, on a tablet, or on a personal computer. The Mind Genomics platform presents the vignettes on any platform, introduces the topic, presents the vignettes one at a time, records the rating and also records the response time, defined as the number of seconds between the presentation of the vignette and the response. When the rating is assigned, the vignette automatically disappears, and the next vignette appears. This process makes the experiment last 3–5 minutes, and does not frustrate the respondent. (Figure. 1) (Right panel) shows an example of one of the vignettes, along with the rating scale.
Results
The raw data from the Mind Genomics studies comprise the ratings and the response times. The users of the data are much more interested in no/yes answers. To make the data more useful, we divide the scale twice, first into the revisit/recommend ‘binary scale’ (ratings 8–9 transformed to 100, ratings 1–7 transformed to 0), and then into the not-revisit/not-recommend ‘binary scale (ratings 1–2 transformed to 100, ratings 3–9 transformed to 0.) The choice of the cut-point when bifurcating the scale is left to the researcher and may be altered depending upon the topic
The ratings are on a 9-point scale, are not very instructive to those who use the data. The standard approach in Mind Genomics is to transform the data, so that ratings of 1–6 are transformed to 0, and ratings of 7–9 are transformed to 100. In this study the majority of ratings are encompassed by the range 7–9. There would be very little to learn from the standard transformation. When we apply the more stringent criterion of ratings 8–9, we may learn more. Furthermore, there is something to be learned from ratings 1–2–3, the rejection range. To keep the analysis symmetric, we choose ratings 1–2 to analyze as well.
Creating a Model
The experimental design allows the researcher to relate the presence/absence of the elements to the ratings, by ensuring that the 16 elements are presented in combinations, so that the 16 elements are statistically independent of each other. Statistical independence enables the researcher to use OLS (ordinary least-squares) regression to relate the presence/absence of the elements to the binary ratings, and to the response time, respectively. The regressions are run first at the level of the individual respondent, the regression coefficients which will be stored, and used for clustering, discussed below. The regressions are then run with ALL the data from a particular subgroup included in the data (e.g., responses from all individuals declaring them females, or of a certain age range, etc.)
The data enable us to create three different models:
- Models relating the presence/absence of the elements to the Top2 Rating (Revisit/Recommend)
- Models relating the presence/absence of the elements to the Bottom2 Rating (Not Revisit/Not Recommend)
- Models relating the presence/absence of the element to the response time.
For the self-defined sub-groups. We will look at five groups, comprising Total Panel, two genders, and two age ranges, respectively.
Recommend/Revisit (Top 2)
The additive constant shows the estimate percent of the times that a rating would achieve the rating of 8–9 in the absence of elements. The additive constant refers to a hypothetical case, since all the vignettes comprises 2–4 elements as dictated by the underlying experimental design. Nonetheless, the additive constant is a good baseline.
(Table 2) shows an additive constant of 49 for the total panel, and similar values hovering around 50 for the genders. We concluded that in the absence of elements, about half the respondents will say they would revisit/recommend. Age makes a difference, with respondents under 40 less likely to revisit/recommend, versus respondents older than 40 more likely to revisit/recommend.(Table 2) shows the strong performing elements, with an element appearing in (Table 2) only when the element scores highly in at least one subgroup:
Table 2. Performance of the elements in terms of driving positive responses (Top2, Revisit/Recommend). Only strong performing elements in at least on key subgroup are shown (coefficient >9).
|
|
Top 2 (Revisit/Recommend) |
Total |
Male |
Female |
Age < 40 |
Age 40+ |
|
|
Additive constant |
49 |
51 |
47 |
33 |
60 |
|
D2 |
Doctor spent as much time as I needed |
9 |
16 |
4 |
9 |
8 |
|
D3 |
Doctor interested in what I thought about the situation |
8 |
16 |
1 |
4 |
8 |
|
B1 |
Doctor gave me information about my condition |
4 |
9 |
1 |
-4 |
8 |
|
C4 |
I felt the doctor understood me |
3 |
-6 |
10 |
-1 |
5 |
|
D1 |
Doctor let me talk without interruption |
2 |
7 |
-2 |
9 |
-4 |
Not-Recommend/Not-Revisit (Bot2)
The additive constant shows the estimate percent of the times that a rating would achieve the rating of 1–2 in the absence of elements. As stated above, the additive constant refers to a hypothetical case, since all the vignettes comprises 2–4 elements as dictated by the underlying experimental design. Nonetheless, the additive constant is a good baseline. (Table 3) shows an additive constant of 3 for the total panel, and similar values hovering around -5 to +5 except for males (additive constant = 10) and for younger responses, age < 40 (additive constant = 13). We conclude that the respondents most likely to be dissatisfied are probably the younger males. Across the five groups the elements driving dissatisfaction tend to be those wherein the patient took control of the interaction, not the doctor. It may well be patients divide on the degree to which they want the doctor to seize control of the interaction. (Table 3) shows the strong performing elements, this time ‘strong performing’ operationally defined as a coefficient > 7.
Table 3. Performance of the elements in terms of driving negative responses (Bot2, Not-Revisit/Not-Recommend). Only strong performing elements (coefficient > 7) are shown.
|
|
Bot 2 (Not-Revisit/Not-Recommend) |
Total |
Male |
Female |
Age < 40 |
Age 40+ |
|
|
Additive constant |
3 |
9 |
-3 |
13 |
-2 |
|
C1 |
Doctor let me talk without interruption |
6 |
7 |
5 |
2 |
8 |
|
C2 |
Doctor spent as much time as I needed |
5 |
8 |
3 |
3 |
7 |
|
C3 |
Doctor interested in what I thought about the situation |
5 |
4 |
6 |
1 |
7 |
Response Time (>1.3 seconds for an element)
The experimental design allows us to look at the response time to the 16 different elements by key subgroup There are only a few elements which demand our attention, operationally defined as an estimated response time for the element of 1.3 seconds or great. There is no clear pattern of response times across groups. (Table 4) shows the longest response times.
Table 4. Performance of the elements in terms of driving response times. Only response times > 1.4 seconds for at least one subgroup are shown.
|
|
Response Time |
Total |
Male |
Female |
Age < 40 |
Age 40+ |
|
B3 |
Doctor made sure I understood the information |
1.7 |
1.2 |
2.1 |
0.9 |
2.1 |
|
B4 |
Doctor validated and ensured my relevant information |
1.3 |
1.0 |
1.4 |
0.7 |
1.6 |
|
B1 |
Doctor gave me information about my condition |
1.3 |
0.6 |
1.8 |
0.9 |
1.5 |
|
B2 |
Doctor referred me to where I can learn more about my condition |
1.2 |
0.2 |
1.9 |
0.5 |
1.5 |
|
A3 |
Doctor discussed the next step appropriate for me |
1.0 |
0.6 |
1.3 |
0.2 |
1.5 |
|
A2 |
Involved as much as I want to be with this doctor |
1.2 |
0.5 |
1.8 |
0.8 |
1.4 |
|
C1 |
Doctor let me talk without interruption |
1.1 |
1.1 |
1.1 |
0.5 |
1.4 |
|
A1 |
Doctor encouraged to ask about what I didn’t understand |
1.0 |
0.6 |
1.6 |
1.0 |
1.3 |
Interactions among Elements
The permutation strategy produces many different combinations, not just one limited set. One beneficial outcome is that it is possible to measure how elements or answers to one question affect the coefficients of other elements. This approach is called scenario analysis, and is only possible when the underlying experimental design is systematically permuted to create the many combinations. The more conventional approach, testing a limited number of combinations but with many people, ends up forcing the research to choose a limited number of combinations, and in turn, forever forego the opportunity to discover interactions. The strategy used here is known as scenario analysis. We will hold the elements or answers to one question constant (e.g., D, non-verbal communication). There are five different elements in question D, answers or elements D1, D2, D3, and D4. There is also one other element, the fifth, when D does not appear.
The question thus becomes simply ‘How does each of the non-verbal communications, D0-D4, affect the response to the other elements? We follow these three simple, straightforward steps:
- Create Strata: Sort the raw data set into five strata, based upon the specific answer provided by Question D (non-verbal action of the doctor). The design offers us four different answers (see Table 1), as well as those vignettes where, deliberately, an answer from Question D is omitted.
- Regression: Run a simple regression, using as predictors A1-C4, for Top2 and for Bot2, respectively, with an additive constant.
- Lay out the coefficients in the form shown in Table 5 (Top2).
We begin with the dependent variable being Top2 (Revisit/Recommend). (Table 5) shows the five different sets of coefficients for the 12 elements A1-C4. The four Elements D1-D4, do not appear in the coefficients for the simple reason that they are constant within a stratum. (Table 5) shows five columns of data, one for each stratum, defined by D=0 (no answer from Question D appears in the vignette), and then one column for each stratum (D=1, D=2, D=3, D=4). The coefficients appeared in shaded format and in bold type when the value is +9 or above, a value for the coefficient meaning that when the element is added to the vignette, the percent of respondent sayings ‘I’ll recommend / revisit’ jumps an additional 9%. Finally, the elements A1-C4 are sorted by their value when D=0, i.e., they are sorted by their performance in those vignettes which do not have any element from Question D.
(Table 5) shows a remarkable number of strong-performing elements. What is more interesting is that some elements interact dramatically with certain elements from a different question, but not with other elements from the same question. For example, consider elements C3 and C4: Doctor interested in what I thought about the situation, and I felt the doctor understood me. These are two strong performing elements, remaining so when combined with Element D1 (doctor listened carefully). Yet with any other element or answer from question D, these two elements, C3 and C4, performed poorly.
Table 5. Scenario analysis showing how elements (answers) from Question D synergize the rating of Revisit/Recommend when combined with other elements from other questions.
|
|
Top 2: Revisit/Recommend |
None |
Doctor kept the contact with me |
Doctor listened carefully |
Doctor greeted me respectfully |
Doctor focused on me and not on the computer |
|
|
|
D=0 |
D=1 |
D=2 |
D=3 |
D=4 |
|
|
Additive constant |
24 |
73 |
40 |
64 |
52 |
|
C1 |
Doctor let me talk without interruption |
56 |
-22 |
-1 |
-12 |
-10 |
|
C3 |
Doctor interested in what I thought about the situation |
36 |
-6 |
13 |
-20 |
-22 |
|
C4 |
I felt the doctor understood me |
31 |
-2 |
17 |
-6 |
-1 |
|
B1 |
Doctor gave me information about my condition |
20 |
-21 |
15 |
19 |
-2 |
|
B4 |
Doctor validated and ensured my relevant information |
16 |
-9 |
-1 |
12 |
-18 |
|
C2 |
Doctor spent as much time as I needed |
15 |
5 |
20 |
-16 |
-19 |
|
B2 |
Doctor referred me to where I can learn more about my condition |
4 |
9 |
12 |
6 |
-9 |
|
B3 |
Doctor made sure I understood the information |
1 |
-4 |
13 |
7 |
-2 |
|
A3 |
Doctor discussed the next step appropriate for me |
-1 |
-6 |
0 |
-9 |
13 |
|
A2 |
Involved as much as I want to be with this doctor |
-9 |
-11 |
4 |
-11 |
17 |
|
A4 |
Doctor set up a clear follow up plan with me |
-13 |
-24 |
-8 |
-7 |
28 |
|
A1 |
Doctor encouraged to ask about what I didn’t understand |
-38 |
-28 |
7 |
9 |
29 |
We do not yet know the reason for the strong performance of pairs of elements, and why some elements suppress each other, whereas other elements synergize with each other to create far stronger performances (e.g., B3 + D2; Doctor made sure I understood the information + Doctor listened carefully.) Fortunately, these Mind Genomics studies are straightforward experiments, easy and affordable to do, allowing the enterprising research to investigate these interactions in a systematic, structured way.
Mind-Sets in the Population
A key tenet of Mind Genomics is that for a topic area, no matter how granular, there may exist two or more alternative groups of ideas, mind-sets, representing alternative ways of thinking about what is important. The key here is that the mind-sets are combinations of ideas. At any one time an individual may be assigned to membership in one mind-set. There is no clear information about the lability of membership in mind-sets, i.e., whether over a lifetime a person may shift from membership in one mind-set to membership in another mind-set.
The mind-sets are hypothesized to exist and extracted from the raw data by a simple set of statistical processes coupled with interpretation.
- Individual Model: Each respondent generates a model relating the presence/absence of the elements to the ratings. The dependent variable is the rating, or now a binary transformation of the rating. The convention has been to divide the scale into two halves, with ratings of 1–6 becoming 0, and 7–9 becoming 100. This is similar to our division of the scale into 1–7 versus 8–9. For the preparation of data for clustering (the basis of mind-sets) we follow the convention, not the more stringent 1–7 and 8–9 bifurcation.
- Use All Coefficients: The 16 coefficients from the individuals’ model are used as inputs for the clustering.
- Clustering: A k-means clustering [54] first divides the respondents into two complementary and exhaustive sets and then afterwards repeats the task, dividing the respondents into three complementary and exhaustive sets. The separation into groups or clusters uses a ‘distance’ measure between each pair of respondents. The clustering places respondents into two or three groups so that the set of person-to-person distances within a cluster is small, but the distance between the different clusters is large. This process is purely mathematical and does not involve interpretation.
- Interpretation: The pattern of average coefficients across the 16 elements, tell us the ‘interpretability’ of the cluster. The clustering must ‘tell a story’ (interpretable) and be parsimonious. The fewer the number of clusters the better.
- Table 6 shows the summary data for the two mind-sets, for Top2 (Revisit/Recommend) and for Bot2 (Not Revisit/Not Recommend). We will look at the two mind-sets in reverse order of mind-set.
Table 6. The models for Top2, Bot2, and Response Time for the two mind-sets. Shown are only the strong performing elements for Top2 (coefficient > 9) and for Bot2 (coefficient > 7).
|
|
|
MS1 |
MS2 |
MS1 |
MS2 |
MS1 |
MS2 |
|
|
|
Top2: Revisit / Recommend |
Bot2: Not-Revisit / Not-Recommend |
Response Time |
|||
|
|
Additive constant |
65 |
37 |
-2 |
6 |
NA |
NA |
|
|
Mind-Set 2 – Focused on empathy |
|
|
|
|
|
|
|
D3 |
Doctor greeted me respectfully |
-1 |
14 |
4 |
-1 |
0.9 |
0.9 |
|
C4 |
I felt the doctor understood me |
-11 |
13 |
4 |
-2 |
0.9 |
1.1 |
|
D2 |
Doctor listened carefully |
5 |
12 |
-2 |
5 |
0.4 |
1.5 |
|
C1 |
Doctor let me talk without interruption |
-14 |
9 |
6 |
6 |
1.1 |
1.1 |
|
D4 |
Doctor focused on me and not on the computer |
-5 |
9 |
2 |
2 |
0.6 |
0.7 |
|
Mind-Set 1 – Focused on Doctor providing information (it’s about authority) |
|||||||
|
A2 |
Involved as much as I want to be with this doctor |
4 |
-4 |
-2 |
7 |
0.9 |
1.4 |
|
C3 |
Doctor interested in what I thought about the situation |
-3 |
-4 |
0 |
8 |
0.6 |
0.6 |
Mind-Set 2 focuses on empathy. The additive constant is moderate [37]. It is the elements which do the work. These elements pertain to the emotional response to the situation, and the feeling that the doctor was focusing on the patient as a human being. At the same time, it is the doctor who listens but does not let the patient take control in terms of driving the diagnosis. Here are the strong elements which drive revisit/recommend. Mind-Set 1 at first appears to be generally ready to revisit/recommend, with an additive constant of 65. Nothing really seems to drive respondents in Mind-Set 1 to either to revisit/recommend or not. The coefficients are low. The key to Mind-Set 1 lies in the elements to which they attend, as revealed by the estimated response times. The response times for the elements below are the longest for Mind-Set 1.
Finding these Mind-Sets in the Population
Most studies in the emerging science of Mind Genomics do not find a simple co-variation of mind-sets and the straightforward measures of a person, such as age, gender, and even education or residence. There is no such thing as the mind-set of a so-called Millennial or GenX with respect to how they want the doctor to treat them. The popular press may give the impression that the different groups in the population, such as the aging Baby Boomers, the Echo Boomers, The Millennials, and the GenX can be identified by homogeneous but changing values. Some larger-scale studies with Mind Genomics on various topics for clients suggest that this is not the case. We cannot simply ‘know’ the mind-set to which a person belongs simply by knowing the age group to which the person belongs.
Recently, author Gere has created a technique using the average coefficients from the subgroups to assign new people to the mind-sets. The approach uses a Monte-Carlo simulation of alternative patterns of coefficients, based upon adding slight f ‘noise’ (random variation), and then determining which coefficients still best differentiate between two mind-sets or among three mind-sets. The results of the simulation create six questions based upon the elements, and two responses, or a total of 64 patterns. Each pattern ‘maps’ to one of either two mind-sets, or to one of three mind-sets, respectively.
Figure 2 shows the PVI. The respondent fills out the form and receives the information mind-set membership in a return email.
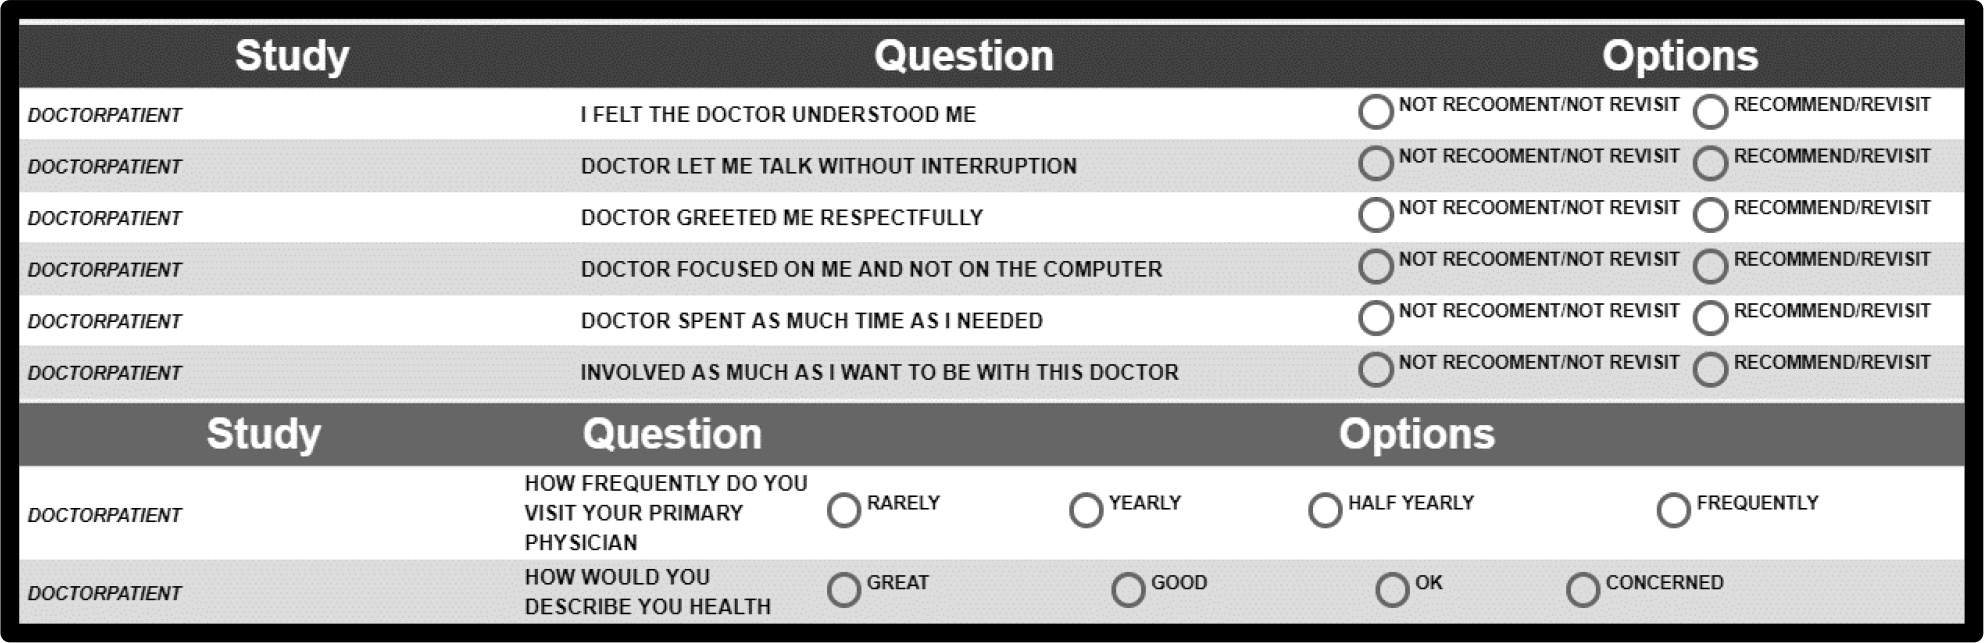
Figure 2. The PVI (personal viewpoint identifier) for this study.
Discussion
This study tested patient preferences while interacting with doctors. Findings stress patient’s expectations to be involved and to feel understood and being valued by the doctor.
- Respondents in Mind-Set 1 – patients expect the doctor to enhance their internal locus of control by providing them relevant, tailored, information clearly and making sure they understand the information the doctor provided. Mind-Set 1 expects the doctor to enable them to comfortably ask questions about what they didn’t understand.
- Respondents in Mind-Set 2 expect to feel that the doctor views them as equal, as a person, being sensitive to their feelings. Mind-Set 2 expects expect the doctor to greet them respectfully, to be empathic, to carefully listen to them and to understand them. They expect the doctor to listen to them without interrupting them.
Barriers to doctor-patient communication exist [55, 56]. Doctors, however, can improve their communication skills [57]. Findings call upon doctors to make a difference for patients by creating inspiration and trust through communication according to patient expectations by mind-sets, regardless of patient age, and gender. Although patients may understand their illness and health in general, they expect their doctors, as a medical authority, to inspire them to take greater responsibility for their health [58, 59]. Encouraging patients to be active in communication with their doctors will increase responsiveness, maintain patient trust and promote adherence and healthy behaviors. Doctor’s awareness to the communication a patient prefers will enable the doctor to choose between alternatives by mind-set segment to build trust and promote patients’ self-management of illness [60]. Focusing on communication skills which enhance patient’s internal locus of control greatly increases patients’ readiness to adopt behavioral changes [61]. These skills focus on process communication which deals with what patients believe will help them to take responsibility for their health rather than focus on the disease and explanations on what it is and ways of treating it.
Acknowledgement
Attila Gere thanks the support of Premium Postdoctoral Research Program of the Hungarian Academy of Sciences.
References
- Coulter A and Ellins J (2007) Effectiveness of strategies for informing, educating, and involving patients. Bmj 7609, Pg No. 24–27.
- Jenkinson C, Coulter A and Bruster S (2002) The Picker Patient Experience Questionnaire: development and validation using data from in-patient surveys in five countries. International Journal for Quality in Health Care 5: 353–358.
- Stacey D, Bennett CL and Barry MJ (2011) Decision aids for people facing health treatment or screening decisions. Cochrane Database Syst Rev 10, CD001431.
- Hupcey JE, Penrod J, Morse JM and Mitcham C (2001) An exploration and advancement of the concept of trust. Journal of advanced nursing 2: 282–293.
- Barry MJ and Edgman-Levitan S (2012) Shared decision making—the pinnacle of patient-centered care. New England Journal of Medicine 366: 780–781.
- Goudge J and Gilson L (2005) How can trust be investigated? Drawing lessons from past experience. Social Science and Medicine 61: 1439–1451.
- Hupcey JE, Penrod J and Morse JM (2000) Establishing and maintaining trust during acute care hospitalizations. Scholarly Inquiry for Nursing Practice, 14(3), pp.227–242.
- Gabay G, Gere A, Stanley J, Habsburg-Lothringen C, Moskowitz HR (2019) (a). Health threats awareness- Responses to warning messages about cancer and smartphone Usage. Cancer Studies Therapy Journal 1: 1–10.
- Gabay G (2016) Exploring perceived control and self-rated health in re-admissions among younger adults: A retrospective Study. Patient Education and Counseling 99: 800–806.
- Gabay G (2019) a. Patient Self-worth and Communication Barriers to Trust of Israeli Patients in Acute-Care Physicians at Public General Hospitals. Qualitative health research Pg No. 1049732319844999.
- Gabay G (2019) b. A Nonheroic Cancer Narrative: Body Deterioration, Grief, Disenfranchised Grief, and Growth. OMEGA-Journal of Death and Dying Pg No. 0030222819852836
- Haskard KB, DiMatteo M R, Heritage J (2009) Affective and instrumental communication in primary care interactions: Predicting the satisfaction of nursing staff and patients. Health Communication 24: 21–32.
- Lee Y and Lin JL (2012) The effects of trust in physician on self-efficacy, adherence and diabetes. Outcomes, Social Science and Medicine 68: 1060–1068.
- Sharf J, Primavera LH, Diener MJ (2010) Dropout and therapeutic alliance: A meta-analysis of adult individual psychotherapy. Psychotherapy: Theory, Research, Practice, Training 4: 637.
- Ackerman SJ and Hilsenroth MJ (2003) A review of therapist characteristics and techniques positively impacting the therapeutic alliance. Clinical Psychology Review 23: 1–33.
- Flückiger C, Del Re AC, Wampold BE, Symonds D, Horvath AO (2012). How central is the alliance in psychotherapy? A multilevel longitudinal meta-analysis. Journal of Counseling Psychology 59: 1–10.
- Fife ST, Whiting JB, Bradford K, Davis S (2014). The therapeutic pyramid: A common factors synthesis of techniques, alliance, and way of being. Journal of Marital and Family Therapy 1: 20–33.
- Gabay G (2015) Perceived control over health, communication and patient–physician trust. Patient Education and Counseling 98: 1550–1557.
- Thompson L, McCabe R (2012). The effect of clinician-patient alliance and communication on treatment adherence in mental health care: a systematic review. BMC Psychiatry 1: 1.
- Miller W R and Rollnick S (2012) Motivational interviewing: Helping people change. Guilford press.
- Hawkins P, Shohet R, Ryde J Wilmot J (2012) Supervision in the Helping Professions. McGraw-Hill Education (UK).
- De Haan E, Duckworth A Birch D, Jones C (2013) Executive coaching outcome research: The contribution of common factors such as relationship, personality match, and self-efficacy. Consulting Psychology Journal: Practice and Research, 65, 40–46.
- Theeboom T, Beersma B, van Vianen AE (2014) Does coaching work? A meta-analysis on the effects of coaching on individual level outcomes in an organizational context. The Journal of Positive Psychology 9: 1–18.
- Gilson L (2003) Trust and the development of health care as a social institution. Social science & Medicine 7: 1453–1468.
- Pearson SD and Raeke LH (2000) Patients’ trust in physicians: many theories, few measures, and little data. Journal of General Internal Medicine 15: 509–513.
- Sheppard VB, Zambrana RE, Malley AS (2004) Providing health care to low income women: A matter of trust. Family Practice 21: 484–491.
- Ganesan S, Brown SP, Mariadoss BJ, Ho H. (2010) Buffering and amplifying effects of relationship commitment in business-to-business relationships. Journal of Marketing Research 47: 361–373.
- Schneider J, Kaplan SH, Greenfield S, Wenjun L, Wilson I (2004) Better physician patient relationships are associated with higher reported adherence to antiretroviral therapy in patients with HIV infection, Journal of General Internal Medicine 19: 1096–1103.
- Brown, M T and Bussell J K (2011) Medication adherence: WHO cares? In Mayo Clinic Proceedings. Elsevier 86: 304–314.
- Phillips A L, Leventhal H, Leventhal E A (2013) Assessing theoretical predictors of long-term medication adherence: Patients’ treatment-related beliefs, experiential feedback and habit Development. Psychology & Health 28: 1135–1151.
- Rotter J B (1975) Some problems and misconceptions related to the construct of internal versus external control of reinforcement. Journal of Consulting & Clinical Psychology 43: 56–67.
- Liang CY, Wang KY, Hwang SJ, Lin KC, Pan HH (2013) Factors affecting the physician-patient relationship of older veterans with inadequate health literacy: an observational study. The British Journal of General Practice 63: 354–360.
- Mearns J (2009) Social learning theory. Encyclopedia of human relationships 3: 1537–1540.
- Del Re AC, Flückiger C, Horvath AO, Symonds D, Wampold BE (2012) Therapist effects in the therapeutic alliance–outcome relationship: A restricted-maximum likelihood meta-analysis. Clinical Psychology Review 7: 642–649.
- Bergvik S, Sørlie T, Wynn R (2012) Coronary patients who returned to work had stronger internal locus of control beliefs than those who did not return to work. British Journal of Health Psychology 17: 596–608.
- Cross MJ, March LM, Lapsley HM, Byrne E, Brooks PM (2006) Patient self-efficacy and health locus of control: relationships with health status and arthritis related expenditure. Rheumatology 45: 92–96.
- Lefcourt HM (2014) Locus of control: Current trends in theory & research, Psychology Press.
- Patterson RE, Neuhouser ML, Hedderson MM, Schwartz SM, Standish L (2003) Changes in diet, physical activity, and supplement use among adults diagnosed with cancer. Journal of the American Dietetic Association 103: 323–328.
- Thøgersen-Ntoumani C, Ntoumanis N (2006) The role of self-determined motivation in the understanding of exercise-related behaviors, cognitions and physical selfevaluations. Journal of Sports Sciences 24: 393–404.
- Rotter JB (1979) Individual differences and perceived control, Choice and Perceived Control, Hillsdale, NJ, Lawrence Erlbaum Associates.
- Gabay G, Moskowitz RH (2015) Mind Genomics: What professional conduct enhances the emotional wellbeing of teens at the hospital. Journal of Psychological Abnormalities In Children 3: 147–162.
- Ariely D and Lanier WL (2015) Disturbing trends in physician burnout and satisfaction with work-life balance: dealing with malady among the nation’s healers. In Mayo Clinic Proceedings 90: 1593–1596.
- Moskowitz HR, Gofman A, Beckley J and Ashman H (2006) Founding a new science: Mind genomics. Journal of sensory studies 21: 266–307.
- Moskowitz HR and Gofman A (2007) Selling blue elephants: How to make great products that people want before they even know they want them. Pearson Education.
- Moskowitz HR (2012) ‘Mind genomics’: The experimental, inductive science of the ordinary, and its application to aspects of food and feeding. Physiology & behavior 4: 606–613.
- Gabay G, Kochman M, Moskowitz HR (2015) Market sensing Mind-Genomics and Health Promotion in Prince, M. and Priporas, C. V. (Eds) Market Sensing Today. Business Expert, Academic Publisher. Ch. 7 Pg No. 124–141. Boston.
- Gabay G, Moskowitz HR, Silcher M, Galanter E (2017) Mind Genomics: The New Novum Organum: Policy, Perceptions and Emotions in Health. Pardes Academic Publishing.
- Gabay G, Zemel G, Gere A, Zemel R, Papajorgji P, Moskowitz HR (2018) On the threshold: What concerns healthy people about the prospect of cancer? Cancer Studies and Therapeutics Journal 3: 1–10.
- Gabay G, Gere A, Zemel G, Moskowitz D, Shifron R, Moskowitz HR (2019) (b). Expectations and attitudes regarding chronic pain control: An exploration using Mind Genomics. Internal Medicine Research Open Journal 4: 1–10.
- Gabay G, Gere A, Moskowitz HR (2019) (c). Uncovering communication messages for health promotion: The case of arthritis. Integrated Journal of Orthopedic Traumatology 2: 1–13.
- Gabay G, Gere A, Moskowitz HR (2019) (d). Understanding effective web messaging-The Case of Menopause. Integrated Gynecology & Obstetrics Journal 2:1–16.
- Gabay G, Gere A, Stanley J, Habsburg-Lothringen C, Moskowitz HR (2019) (e). Health threats awareness – Responses to warning messages about Cancer and smartphone usage. Cancer Studies Therapeutics Journal 4: 1–10.
- Gofman A, Moskowitz H (2010) Isomorphic permuted experimental designs and their application in conjoint analysis. Journal of Sensory Studies 25: 127–145.
- Dubes RC and Jain AK (1988) Algorithms for clustering data. Prentice Hall.
- Sun N and Rau PLP (2017) Barriers to improve physician–patient communication in a primary care setting: Perspectives of Chinese physicians. Health Psychology and Behavioral Medicine 1: 166–176.
- Street Jr RL and Mazor KM (2017) Clinician–patient communication measures: Drilling down into assumptions, approaches, and analyses. Patient education and counseling 8: 1612–1618.
- Gabay G and Moskowitz HR (2012) The algebra of health concerns: implications of consumer perception of health loss, illness and the breakdown of the health system on anxiety. International Journal of Consumer Studies 36: 635–646.
- Helmes AW, Bowen DJ, Bengel J (2012) Patient preferences of decision-making in the context of genetic testing for breast cancer risk Genetics in Medicine 4: 150–157.
- Gabay G and Moskowitz HR (2012) The algebra of health concerns: implications of consumer perception of health loss, illness and the breakdown of the health system on anxiety. International Journal of Consumer Studies 6: 635–646.
- Hawley K (2015) Trust and distrust between patient and doctor. Journal of evaluation in clinical practice 5: 798–801.
- Roseman D, Osborn-Stafsnes J, Helwig A, Boslaugh S, Slate-Miller K (2013) lessons from four ‘aligning forces for quality communities bolster the case for patient-centered care. Health Affairs 32: 232–241.